a short-term effect of a better work programme on firms
TRANSCRIPT

Munich Personal RePEc Archive
A Short-Term Effect of a Better Work
Programme on Firms’ Performance:
Evidence from Vietnam
Arias-Vazquez, Javier and Gamberoni, Elisa and Nguyen,
Cuong
June 2013
Online at https://mpra.ub.uni-muenchen.de/67475/
MPRA Paper No. 67475, posted 28 Oct 2015 16:16 UTC

1
A Short-Term Effect of a Better Work Programme on
Firms’ Performance: Evidence from Vietnam
Javier Arias-Vazquez
Elisa Gamberoni
Cuong Nguyen1
Abstract
This paper provides preliminary evidence on the impact of the Better Work programme on
firm performance in Vietnam. We construct a panel data using the Vietnam Enterprise
Censuses for the years 2009 and 2011. Using firm fixed-effect regressions, we find that
the factories enrolled in the Better Work programme tend to be larger, pay higher wages
for workers, and employ more capital compared to other factories. However, we do not
find that significant effects of the Better Work programme on factories’ sale and profit.
JEL Classification: J31; L25; P42
Keywords: support programs, firms, impact evaluation, panel data, Vietnam.
1 Contact author: Nguyen Viet Cuong, National Economics University, and Mekong Development Research
Institute, Hanoi, Vietnam. Email: [email protected]

2
1. Introduction
In the past two decades, Vietnam has witnessed high economic growth: During this
period, the average annual growth rate of GDP was about 7 percent. Together with
economic growth, the industrial sector has been expanding. The share of the industrial
sector in total GDP increased from 25 percent in 1991 to 42 percent in 2011(GSO, 2012).
During the 2005-2011 period, the number of registered firms increased from 112,950
to339,287 (GSO, 2012). In 2011, the labor force participation rate was about 80 percent
and the total employment level was about 51.4 million. This represents an increase
compared to 2001, when total employment was about 38.5 million.
Although there is a rapid process of urbanization and industrialization, Vietnam is
still an agricultural and rural country. Around 70 percent of the population is living in
rural areas, and nearly 50 percent of labor force works in the agricultural sector. Similarly,
while the share of formal workers is increasing, informal workers still account for a large
proportion of the labor force. For example, according the 2011 Labor Force Survey, about
52 percent of workers were employed in the formal sector – that is by registered firms and
organizations. Among these workers, about80 percent had health and social insurance.
Garment and textile represents a vital sector of the economy. In 2012, garment and
textile exports accounted for 15 percent of total exports. Garment and textile also play a
large role in the generation of employment. The sectors employ about two millions of
workers.2 Compared to the average of the economy, the garment sector is characterized by
a larger share workers covered by health and social insurance. However, garment workers
appear to be more likely to receive short term contracts and to be paid at piece rate.
In an attempt to increase the competitiveness and working conditions of the
garment sector, in 2009, the government together with ILO and IFC introduced the Better
Work (BW) Vietnam programme. The program aims at improving the competitiveness in
the apparel industry by enhancing economic performance at the enterprise level and by
2 This figure is estimate from the 2011 Vietnam Enterprise Census. Other documents also report a similar
estimate.

3
improving the compliance of apparel factories with the Vietnamese labour laws. The latter
objective is also achieved by a capacity building component. For example, Better Work
Vietnam has been introducing Learning Seminars that focus on issues prominent across
the garment industry and that include technical inputs as well as an opportunity for
factories to share both challenges and best practices.
Although initial assessments suggest a positive impact of the BW in Vietnam, (see
http://betterwork.org/vietnam/), there has not been a quantitative impact assessment yet.
Using a baseline survey, ILO and IFC (2012) examines demographic characteristics and
working conditions of workers in participating Better Work Vietnam factories. In other
countries with Better Work Programme, quantitative evaluations of the programme are
also limited and mainly focus on the stage of collecting and analyzing the baseline survey.
To our knowledge, Robertson (2011) is the only exception. Robertson (2011)investigates
the Better Factories Cambodia program in the apparel sector and finds that the Better
Factories Cambodia helps improve working conditions of workers.
There is a large literature on the effect of programs on firms’ level outcomes,
especially in the context of small and medium enterprises (SME).Impact evaluations and
programs that target firms are vary, ranging from training and technology assistance to
loans and grants (for a review, see Lopez-Acevedo and Tan, 2010). Their effect is
however ambiguous. A large number of studies find a positive effect of these programs on
wages and employment. For example, Bruhn et al. (2012) measures the effect of a
randomized subsidized consulting program for SMEs in Mexico and find that the program
increases the number of workers and total wages. Criscuolo et al. (2007) find a business
support scheme in the UK helps firms increase employment and investment. Mole et al.
(2009) also find a positive effect on employment of consulting services for SMEs in the
UK. Regarding the firm performance, fewer studies find positive effects of MSEs
program. Benavente et al. (2007) examine the effect of the Technology Development
Funds program in Chile and finds the program increases the sales, employment and
export. On the contrary, many studies do not find significant effects of the SMEs
programs on firms’ performances, e.g., Tan and Lopez-Acevedo (2005); De Negri et al.
(2006); Mole et al. (2009); Bruhn and Zia (2011); Karlan and Valdivia(2011) (for a
review, see Lopez-Acevedo and Tan, 2010).

4
Regarding the BW programme, although there are a large number of descriptive
studies of the BW programme, there is little research on the quantitative impact evaluation
due to unavailability of data. This study aims at filling in part this void. Specifically, we
will examine the effect of the BW programme on labor and business performances
outcomesat the plant level using the Vietnam Enterprise Censuses (VEC). The VECs
contains data on performances for the majority of the Vietnamese firms and has a panel
data dimension, which allows us to observe firm outcomes not only in the years after but
also the years before the BW programs. After matching the data with the better work data,
we look at the impact of better work using firm fixed-effects regressions and difference-
in-differences with propensity score matching.
This report is structured in six sections. In section two, we present an overview of
labor market in Vietnam. In section three, we describe the data and compare key outcome
variables among firms enrolled in the BW programme versus the rest of the economy. In
sections four and five, we present the estimation method and results on the impact of the
BW programme, respectively. Finally, section six concludes.
2. Labor markets in Vietnam
Vietnam is a developing country with high population and labor force. During the past
two decade, the population has been constantly increasing by around one million annually.
We observe an increase in employment level during the decade 2001-2011: In this period,
the average growth of employment was about two percent. As a result total employment
level increased to 51.4 million in 2011 from 38.6 million in 2001 (Table 1).
Table 1. Labor force at 15 years of age and above
Year Total
(Thousand persons)
Thousand persons Total
Structure (%)
Male Female Urban Rural
2000 38545.4 19548.7 18996.7 100 50.7 49.3
2001 39615.8 20207.9 19407.9 100 51.0 49.0
2002 40716.0 20718.9 19997.1 100 50.9 49.1
2003 41846.7 21449.7 20397.0 100 51.3 48.7
2004 43008.9 21948.3 21060.6 100 51.0 49.0

5
Year Total
(Thousand persons)
Thousand persons Total
Structure (%)
Male Female Urban Rural
2005 44904.5 23493.1 21411.4 100 52.3 47.7
2006 46238.7 24613.9 21624.8 100 53.2 46.8
2007 47160.3 23945.7 23214.6 100 50.8 49.2
2008 48209.6 24709.0 23500.6 100 51.3 48.7
2009 49322.0 25655.6 23666.4 100 52.0 48.0
2010 50392.9 25897.0 24495.9 100 51.4 48.6
2011 51398.4 26468.2 24930.2 100 51.5 48.5
Source: GSO (2012)
The share of agriculture workers in total employment decreased from 55.1 percent
in 2005 to 48.4 percent in 2011. The share of labor employed in industry and services has
risen over time. Manufacturing and construction are two industrial sectors which account
for 13.8 percent and 6.4 percent of employment in 2011, respectively (Table 2). Increasing
share of manufacturing sector reflects structural changes in economy in recent years, albeit
at slow speed.
Table 2.Share of employment by sector, 2005-2011
Sector 2005 2007 2008 2009 2010 2011
Agriculture, forestry and fishing 55.1 52.9 52.3 51.5 49.5 48.4
Manufacturing 11.8 12.5 12.9 13.5 13.5 13.8
Mining, water, and energy 1.2 1.2 1.1 1.1 1.1 1.1
Construction 4.6 5.2 5.3 5.4 6.3 6.4
Wholesale and retail trade 10.7 10.9 11.0 10.8 11.3 11.6
Transportation and storage 3.0 3.0 3.1 3.0 2.9 2.8
Accommodation and food service activities 1.9 2.4 2.8 3.3 3.5 4.0
Communication, finance, banking services 1.5 1.6 1.6 2.0 2.0 2.1
Socio-political organizations and defense 3.9 3.7 3.6 3.3 3.2 3.1
Education, health services 3.7 4.2 4.0 4.1 4.3 4.4
Other sectors 2.4 2.3 2.3 2.0 2.3 2.4
Total 100 100 100 100 100 100
Source: GSO (2012), http://www.gso.gov.vn
Since the BW programme currently covers firms in garment and textile, we use the
Labor Force Survey in 2011 to examine the distribution and characteristics of workers in
this industry compared with workers in other industries. Table 3 look at the distribution of
workers by type of firm: Among all industries, 68 percent of wage earners work in the

6
formal sector3. Compared to the rest of the economy (labeled as ‘others’ in the following
tables), the textile and garment sector is however characterized by a larger proportion of
formal workers (about 76 and 86 percent respectively).
Table 3: Distribution of wage workers by employment sectors
Sectors Workers by industry
Total Textile Garment Others
Households 23.95 16.63 32.73 31.96
Private firms and organizations 33.08 38.53 19.37 20.30
Public firms and organizations 14.70 7.97 42.20 40.50
Foreign firms and organizations 28.27 36.87 5.71 7.23
Total 100 100 100 100
Number of observations 1,601 9,936 215,948 227,485
Source: Authors’ estimation from Labor Force Survey 2011
Informal workers are less likely to have a contract. Their work is generally
seasonal and lasts less than one year. Table 4 presents the characteristics of employment.
Workers employed in the garment sector are more likely to have short-term contracts and
to receive payment by piece rate compared to workers employed in other industries.
Table 4: Wage laborers by economic industries
Groups Workers by industry
Total Textile Garment Others
Type of contracts
Long-term contract 42.96 29.95 45.26 44.57
Contract 1-3 years 28.15 43.94 14.59 15.98
Contract less than 1 year 2.96 9.65 4.02 4.26
Oral contract 17.04 10.15 24.45 23.76
No contract 8.89 6.31 11.69 11.43
Total 100 100 100 100
Payment methods
Month wages 48.89 35.15 61.50 60.25
Daily wages 17.78 10.64 24.84 24.17
Wages by piece of product 33.33 54.21 12.67 14.64
Others 0.00 0.00 0.99 0.93
Total 100 100 100 100
Duration of the current jobs
Less than 1 year 10.73 13.05 9.23 9.41
3We identify the informal sector with household enterprises

7
Groups Workers by industry
Total Textile Garment Others
1-5 years 47.86 56.31 39.77 40.55
5-10 years 22.81 21.54 24.58 24.43
More than 10 years 18.59 9.09 26.42 25.61
Total 100 100 100 100
Source: Authors’ estimation from Labor Force Survey 2011
Health and safety management systems are less paid attention in Vietnam. Level
Work (2013) reports that around 97 percent of the factories visited them violated health
and safety working conditions. Using the 2011 LFS, we can examine the social and health
insurance of workers in Vietnam. Table 5 shows that nearly 60 percent of workers have
health insurance and social insurance. Workers of garment and textile firms are more
likely to have health and social insurance compared to workers employed in other sectors.
However, the average monthly wages of garment and textile workers is lower than the
average of the rest of the economy. Detailed statistics on the demography and living
conditions of workers in apparel and BW programme firms can be found in ILO and IFC
(2012).
Table 5: Employment of wage laborers
Variables Workers by industry
Total Textile Garment Others
% receiving salary during national holidays and weekend (yes=1)
62.22 70.54 60.03 60.51
% having health insurance (yes=1) 64.44 73.00 57.36 58.10
% having social insurance (yes=1) 61.48 69.88 56.56 57.19
Monthly wages 2555.6 2354.5 2957.7 2928.5
Monthly bonus 362.1 396.9 278.2 284.0
Number of working hours per week 49.30 50.79 46.90 47.09
% receiving payment for additional work 21.70 34.33 9.69 10.85
% receiving bonus 13.09 17.79 11.37 11.67
% receiving supports such as accommodation, travelling, clothes, etc.
34.21 35.45 17.92 18.80
Source: Authors’ estimation from Labor Force Survey 2011
3. Data
For evaluating the impact of the Better Work programme, we use the2009 and 2011
Vietnam Enterprise Censuses. The Vietnam Enterprise Censuses (VECs) are conducted

8
annually by General Statistical Office of Vietnam (GSO). The censuses cover all
registered enterprises throughout the country. The number of observations in VEC 2009
and VEC 2011 is 233,235 and 339,287, respectively. The two data sets contain a panel
dimension for 176,178 firms (Nguyen, 2012).
The VECs contain data on firms’ business activities including the type of firm
ownership, the main business activity, number of workers (also by gender), number of
workers with social insurance, labor cost, assets, turnover, and profits. Between 2009 and
2011, the number of firms increased remarkably1.
Table 6 presents the percentage of enterprises by geographic areas, ownership
types, main industry, and size (measured by number of employees). Most enterprises are
located in urban areas, big cities, and provinces of the delta regions. Half of the enterprises
are found in the two largest cities, Hanoi, the capital, and Ho Chi Minh city. Other
provinces and cities with high concentration of firms, especially foreign owned firms are
HaiPhong, Dong Nai and Binh Duong. By ownership type, the (private) limited
companies account for the largest proportion of firms, followed by private firms, and
joint-venture firms. Foreign owned and state owned firms account for a lower share of
firms. Looking at the distribution of firm size, around 60 percent of firms have less than
10 workers while firms with more than 300 workers account for around 2 percent.
Table 6: Distribution of firms by basic characteristics
2009 2010 2011
Rural/Urban
Rural 25.73 24.49 24.45
Urban 74.27 75.51 75.55
Regions
Northern Mountains 5.38 5.02 4.83
Red River Delta 27.28 28.98 32.34
Central Coast 15.84 15.38 13.55
Highland 3.25 2.85 2.59
South East 37.91 38.67 38.38
Mekong River Delta 10.34 9.10 8.31
Provinces
Ha Noi 16.65 18.59 21.93
HaiPhong 2.55 2.33 2.33
Binh Duong 2.86 2.83 2.56
Dong Nai 3.19 2.73 2.39
Ho Chi Minh city 29.30 30.65 31.02
Other provinces 45.44 42.87 39.76
Firm type
State 1.48 1.20 0.99
Collective 5.53 4.50 3.93
Private 20.53 17.45 14.47

9
2009 2010 2011
Limited company 53.17 55.93 56.96
Joint-venture 16.48 18.40 20.64
Foreign 2.81 2.53 3.00
Business industry
Agriculture 3.86 3.33 3.02
Food manufacturing and Processing 2.86 2.44 2.26
Garment and textile 2.63 2.51 2.42
Wood and papers 2.21 1.93 1.81
Manufacture and mining 13.04 11.73 11.2
Construction 14.20 14.77 13.16
Trade 38.71 39.14 38.32
Services 22.48 24.14 27.81
Firm size 1-5 30.18 33.72 41.58
6-10 32.20 30.00 24.86
11-30 22.37 21.70 20.07
31-100 9.65 9.33 8.87
101-300 3.75 3.52 3.14
Above 300 1.85 1.73 1.48
All firms 100% 100% 100%
Source: Estimation from EC 2009, EC 2010 and EC 2011.
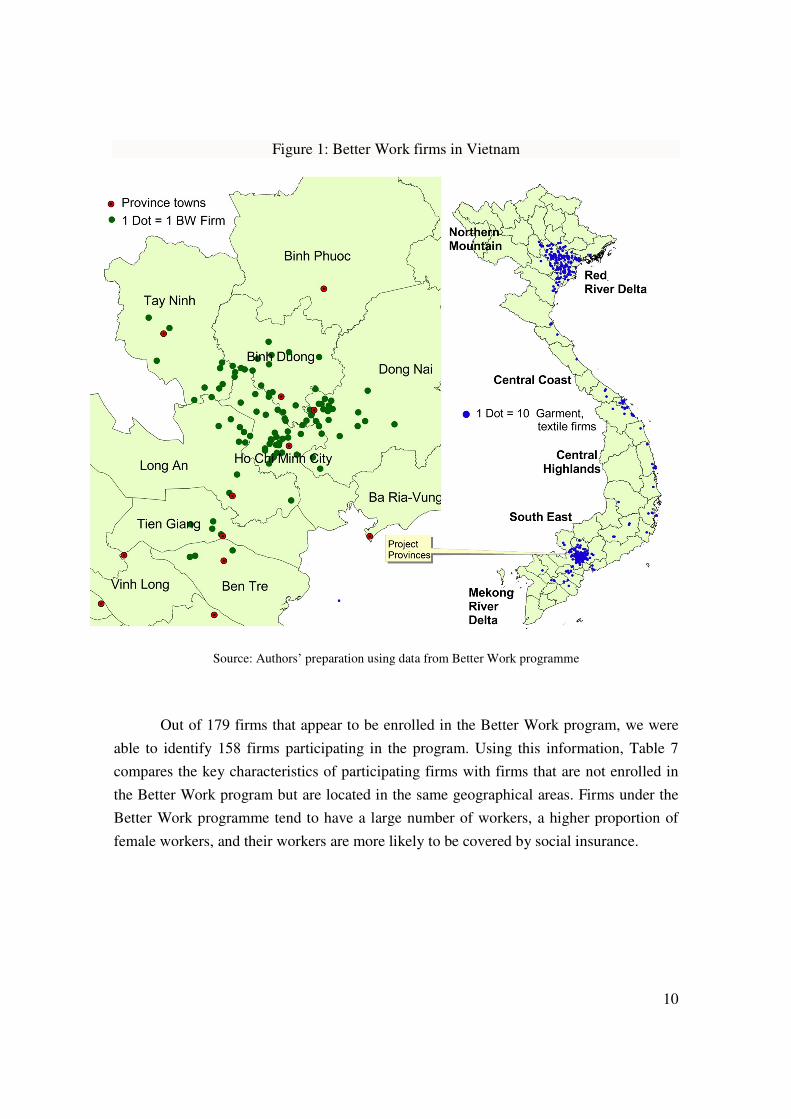
Firms covered by the programme located mainly in the South East of Vietnam.
This area is the richest part of the country and presents a high density of firms from
various sectors. A large proportion of firms covered by the BW program are indeed
located in Ho Chi Minh City, Binh Duong and Dong Nai (See Figure 1, which presents the
geographic location of Better Work firms)
10
Figure 1: Better Work firms in Vietnam
Source: Authors’ preparation using data from Better Work programme
Out of 179 firms that appear to be enrolled in the Better Work program, we were
able to identify 158 firms participating in the program. Using this information, Table 7
compares the key characteristics of participating firms with firms that are not enrolled in
the Better Work program but are located in the same geographical areas. Firms under the
Better Work programme tend to have a large number of workers, a higher proportion of
female workers, and their workers are more likely to be covered by social insurance.

11
Table 7: Basic characteristics of firms with and firms without the Better Work program
Outcome variables Better Work Firms Non Better Work Firms
2009 2011 2009 2011
Total asset (Bil. VND) 199.42 280.85 78.25 112.91
Revenue (Bil. VND) 159.58 262.79 48.87 79.55
Profit before tax (Bil. VND) 4.267 5.174 2.654 2.577
Proportion in garment 0.895 0.898 0.103 0.113
Proportion of foreign firms 0.774 0.796 0.187 0.193
The number of workers 1267.5 1374.4 92.7 107.0
Proportion of female workers 0.783 0.746 0.392 0.379
Proportion of workers with insurance 0.892 0.897 0.474 0.428
Proportion of female workers with insurance 0.898 0.897 0.469 0.463
Wage per worker (Mil. VND/year) 31.20 49.25 42.58 47.54
Source: Estimation from EC 2009 and EC 2011.
4. Estimation method
Firm fixed-effects regression
Impact evaluation of a policy or a program is always challenging. Firms are enrolled in the
Better Work program based on several selection criteria and voluntariness. When the
program is not randomly assigned to the treatment group, there is always a problem of
possible selection bias in estimating the effect of the program. The traditional econometric
method to deal with selection or endogeneity bias is instrumental variable regression.
Finding a valid instrument for a self-selected program is difficult. When convincing
variables are not found, most studies on the impact evaluation of SMEs support program
rely on the features of panel data to remove time-invariant unobserved heterogeneity
(Lopez-Acevedo and Tan, 2010). Based on firm-level panel data, fixed-effects regression
and difference-in-difference estimation are widely used (see Lopez-Acevedo and Tan,
2010 for a review of estimation methods in empirical studies of the impact evaluation of
SMEs support program).
In this study, we are not able to find such an instrument for the Better Work
program in Vietnam. Thus, we will use firm fixed-effects regression to measure the effect
of Better Work programin Vietnam. Although there is no an endline survey of the Better
Work program for impact evaluation, we use the data from the 2009 VEC and 2011 VEC

12
as the before-program and after-program data, respectively. The outcomes of firms are
expressed as follows:
,ititititit uvTXDY +++++= δγβα (1)
where, itY is a performance indicator of firm i at the time t. tT is the dummy variable for
theyear 2011. itD is a dummy variable which equals one for firms that are part of the
Better Work program as on 2011. itX is the control variables.
We use similar specifications as equation (1) to measure the effect of the Better
Work program on various firm related outcome variables including size (as measured by
the number of employee), labor cost, assets, etc.
We do not include any additional explanatory firm-level variables in model (1).
Variables such as firm size and assets can be affected by the Better Work program and
should not be controlled in the model (Heckman et al., 1999; Angrist and Pischke, 2008).
However, we control for few provincial level variables to examine whether the estimates
are sensitive to control variables. Exogenous variables such as ownership and geography
of firms are time-invariant and included in the firm fixed effectsiv .
We then further analyze whether the impact of Better Work Programs can spill
over other firms. To conduct this analysis,we adopt a specification similar to equation 1
and estimate the following firm fixed-effects regression:
,3210 ijtijtijtjtijt uvTXCY +++++= ββββ (2)
Where Yitj is a performance indicator of a not participatory BW firm i (for example size or
turnover) in commune j in the year t. Cjt is a dummy variable that equals one if BW firms
are located in thecommune. In sum, we use a similar model as (1), but replace the BW
programme by the variable indicating the communes with the BW programs. We assume
spill-over effect at the commune level. Additionally, we exclude BW factories from the
sample.
Difference-in-differences with propensity score matching
In addition to fixed-effects regression, we also use difference-in-differences with
propensity score matching to measure the effects of the BW programme. Although the

13
difference-in-differences with propensity score matching relies on a similar identification
assumption in the selection of time-invariant unobservables as the fixed-effects regression,
the matching method has the main advantage that it does not rely on functional form
assumptions on outcome.
The ideas of thedifference-in-differences with propensity score matching is to
compare the outcome of the treatment group (firms participating in the BW programme)
with a similar control group (firms not participating in the BW programme but have
similar characteristics as the BW firms) before and after the BW programme. Simply
comparing the outcomes between the treatment and control groups after the treatment can
include unobserved selection bias. If we assume this selection bias is time-invariant, we
can remove this bias by subtracting the difference in pre-treatment outcomes between the
treatment and control group from the difference in post-treatment outcomes between the
treatment and control group.
To select the control group which has similar characteristics as the treatment
group, we use the method of propensity score matching (Rosenbaum and Rubin, 1983).4
We start by estimating the probability of being a household with migrants at time t by
using a logit or probit model, 1( 1) ( )it it
P D F X −= = , where X is a vector of observed
variables before migration.
More specifically, let iy∆ be the difference between outcome of a BW firmbefore
and after the BW program. jy∆ is the difference between outcome of a non-BW firm
before and after the BW program. Then the difference-in-differences estimator is
expressed as follows:
( )∑ ∑∈ ∈
∆−∆=
BWi Cj
jjii yppgy ,δ . (3)
wherep is the probability of firms participating in the BW programme. g(.) is a function
assigning the weights on control firmj in forming a comparison with the BW firmi. The
4 For detailed discussion of the matching method, see e.g., Rosenbaum and Rubin, 1985; Heckman et al.,
1997; Augurzky and Schmidt, 2001; Imbens and Wooldridge, 2009; Smith and Todd, 2005.
14
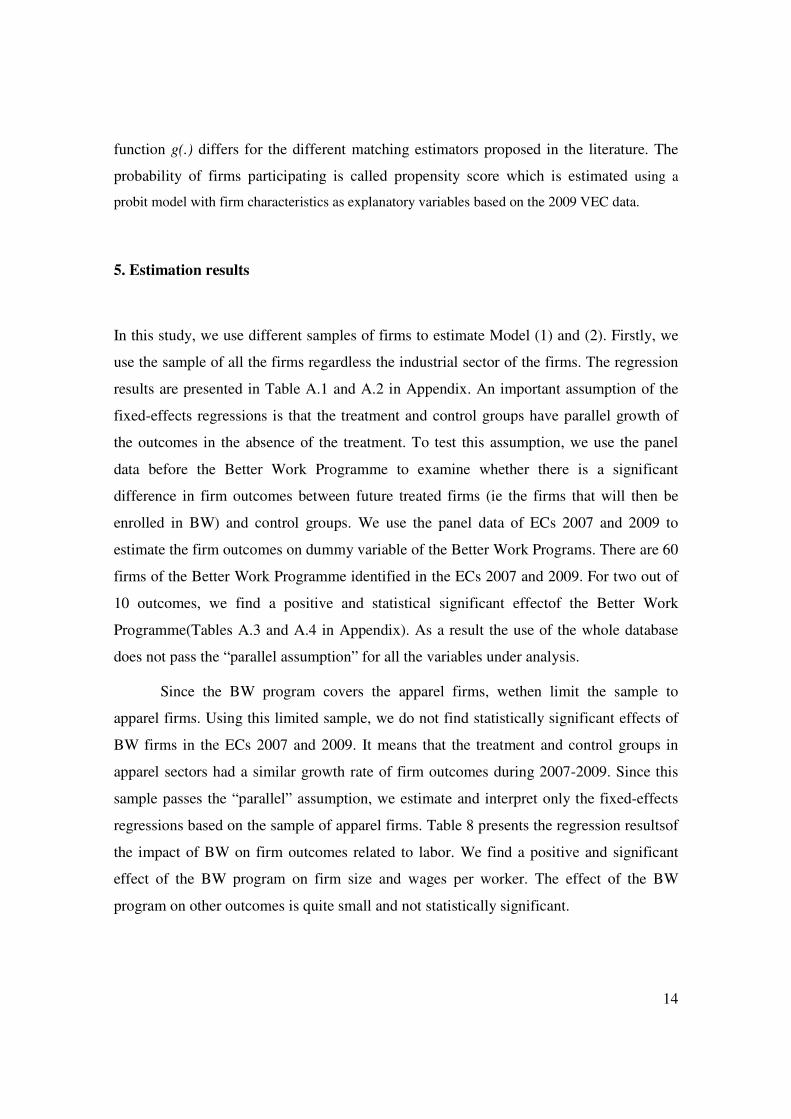
function g(.) differs for the different matching estimators proposed in the literature. The
probability of firms participating is called propensity score which is estimated using a
probit model with firm characteristics as explanatory variables based on the 2009 VEC data.
5. Estimation results
In this study, we use different samples of firms to estimate Model (1) and (2). Firstly, we
use the sample of all the firms regardless the industrial sector of the firms. The regression
results are presented in Table A.1 and A.2 in Appendix. An important assumption of the
fixed-effects regressions is that the treatment and control groups have parallel growth of
the outcomes in the absence of the treatment. To test this assumption, we use the panel
data before the Better Work Programme to examine whether there is a significant
difference in firm outcomes between future treated firms (ie the firms that will then be
enrolled in BW) and control groups. We use the panel data of ECs 2007 and 2009 to
estimate the firm outcomes on dummy variable of the Better Work Programs. There are 60
firms of the Better Work Programme identified in the ECs 2007 and 2009. For two out of
10 outcomes, we find a positive and statistical significant effectof the Better Work
Programme(Tables A.3 and A.4 in Appendix). As a result the use of the whole database
does not pass the “parallel assumption” for all the variables under analysis.
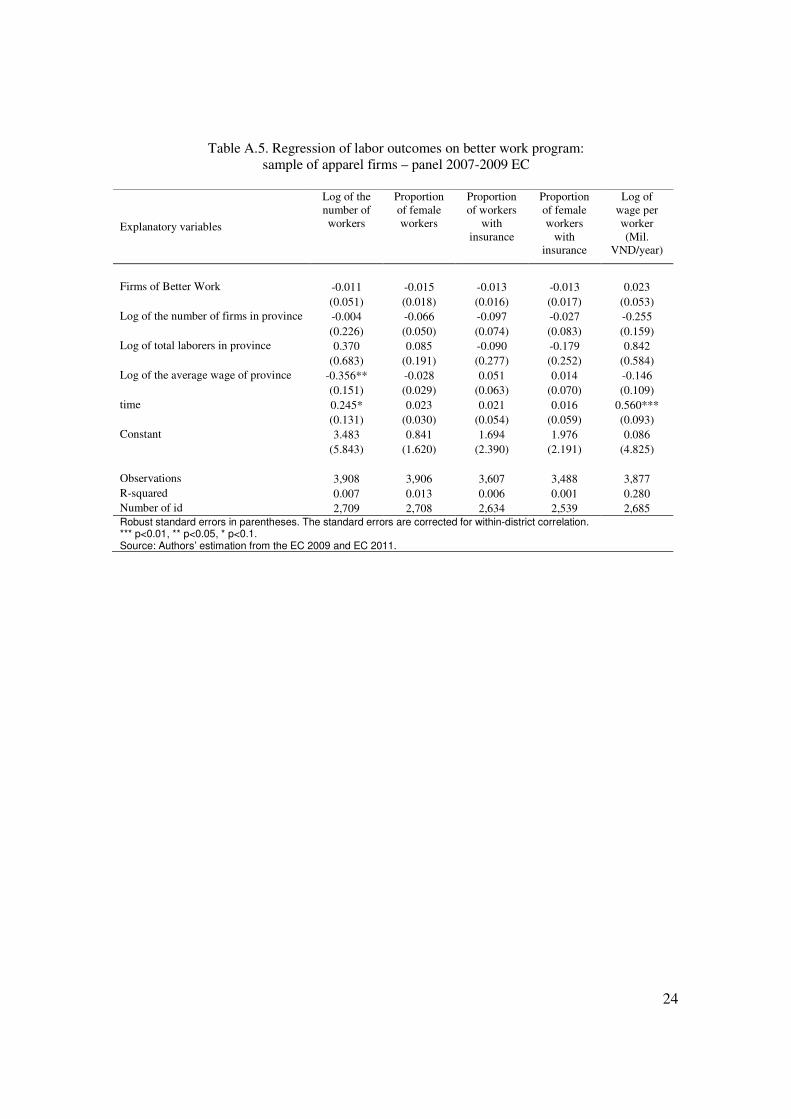
Since the BW program covers the apparel firms, wethen limit the sample to
apparel firms. Using this limited sample, we do not find statistically significant effects of
BW firms in the ECs 2007 and 2009. It means that the treatment and control groups in
apparel sectors had a similar growth rate of firm outcomes during 2007-2009. Since this
sample passes the “parallel” assumption, we estimate and interpret only the fixed-effects
regressions based on the sample of apparel firms. Table 8 presents the regression resultsof
the impact of BW on firm outcomes related to labor. We find a positive and significant
effect of the BW program on firm size and wages per worker. The effect of the BW
program on other outcomes is quite small and not statistically significant.
15
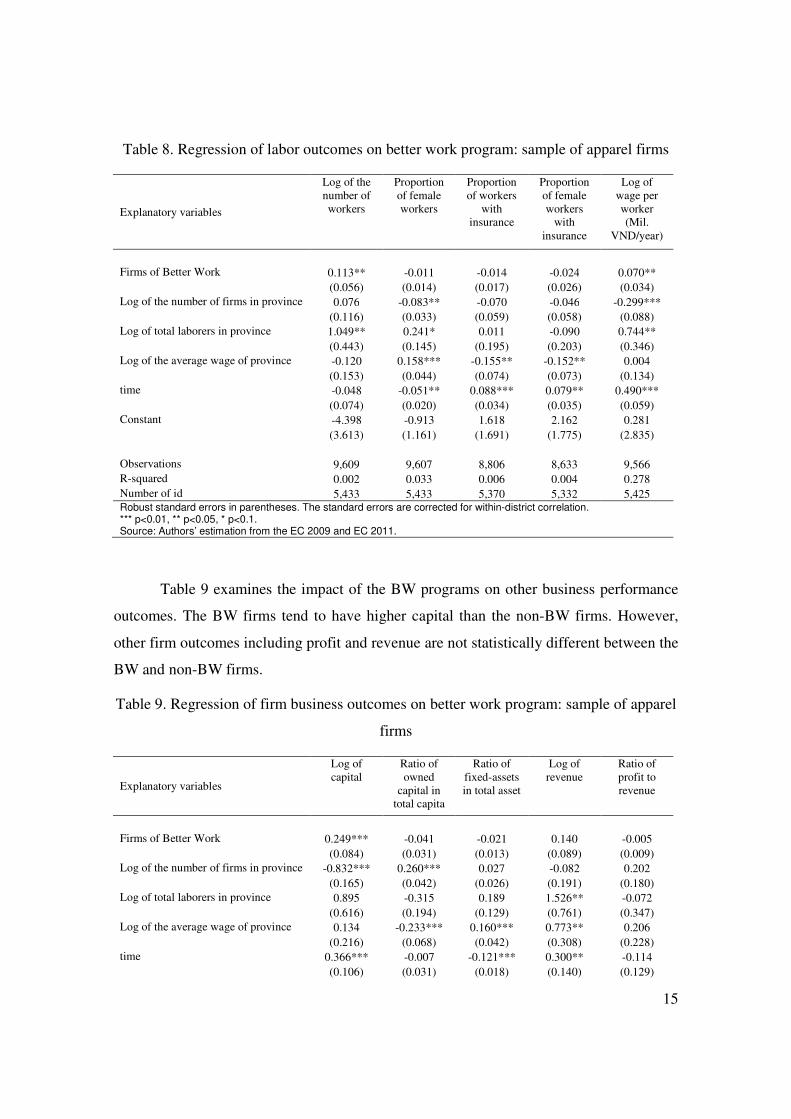
Table 8. Regression of labor outcomes on better work program: sample of apparel firms
Explanatory variables
Log of the
number of
workers
Proportion
of female
workers
Proportion
of workers
with
insurance
Proportion
of female
workers
with
insurance
Log of
wage per
worker
(Mil.
VND/year)
Firms of Better Work 0.113** -0.011 -0.014 -0.024 0.070**
(0.056) (0.014) (0.017) (0.026) (0.034)
Log of the number of firms in province 0.076 -0.083** -0.070 -0.046 -0.299***
(0.116) (0.033) (0.059) (0.058) (0.088)
Log of total laborers in province 1.049** 0.241* 0.011 -0.090 0.744**
(0.443) (0.145) (0.195) (0.203) (0.346)
Log of the average wage of province -0.120 0.158*** -0.155** -0.152** 0.004
(0.153) (0.044) (0.074) (0.073) (0.134)
time -0.048 -0.051** 0.088*** 0.079** 0.490***
(0.074) (0.020) (0.034) (0.035) (0.059)
Constant -4.398 -0.913 1.618 2.162 0.281
(3.613) (1.161) (1.691) (1.775) (2.835)
Observations 9,609 9,607 8,806 8,633 9,566
R-squared 0.002 0.033 0.006 0.004 0.278
Number of id 5,433 5,433 5,370 5,332 5,425 Robust standard errors in parentheses. The standard errors are corrected for within-district correlation. *** p<0.01, ** p<0.05, * p<0.1. Source: Authors’ estimation from the EC 2009 and EC 2011.
Table 9 examines the impact of the BW programs on other business performance
outcomes. The BW firms tend to have higher capital than the non-BW firms. However,
other firm outcomes including profit and revenue are not statistically different between the
BW and non-BW firms.
Table 9. Regression of firm business outcomes on better work program: sample of apparel
firms
Explanatory variables
Log of
capital
Ratio of
owned
capital in
total capita
Ratio of
fixed-assets
in total asset
Log of
revenue
Ratio of
profit to
revenue
Firms of Better Work 0.249*** -0.041 -0.021 0.140 -0.005
(0.084) (0.031) (0.013) (0.089) (0.009)
Log of the number of firms in province -0.832*** 0.260*** 0.027 -0.082 0.202
(0.165) (0.042) (0.026) (0.191) (0.180)
Log of total laborers in province 0.895 -0.315 0.189 1.526** -0.072
(0.616) (0.194) (0.129) (0.761) (0.347)
Log of the average wage of province 0.134 -0.233*** 0.160*** 0.773** 0.206
(0.216) (0.068) (0.042) (0.308) (0.228)
time 0.366*** -0.007 -0.121*** 0.300** -0.114
(0.106) (0.031) (0.018) (0.140) (0.129)

16
Explanatory variables
Log of
capital
Ratio of
owned
capital in
total capita
Ratio of
fixed-assets
in total asset
Log of
revenue
Ratio of
profit to
revenue
Constant 9.476* 1.182 -1.930* -5.168 -2.075
(5.452) (1.692) (1.071) (6.900) (4.662)
Observations 9,588 9,609 9,609 9,414 9,380
R-squared 0.038 0.033 0.092 0.152 0.004
Number of id 5,432 5,433 5,433 5,387 5,380
Robust standard errors in parentheses. The standard errors are corrected for within-district correlation.
*** p<0.01, ** p<0.05, * p<0.1.
Source: Authors’ estimation from the EC 2009 and EC 2011.
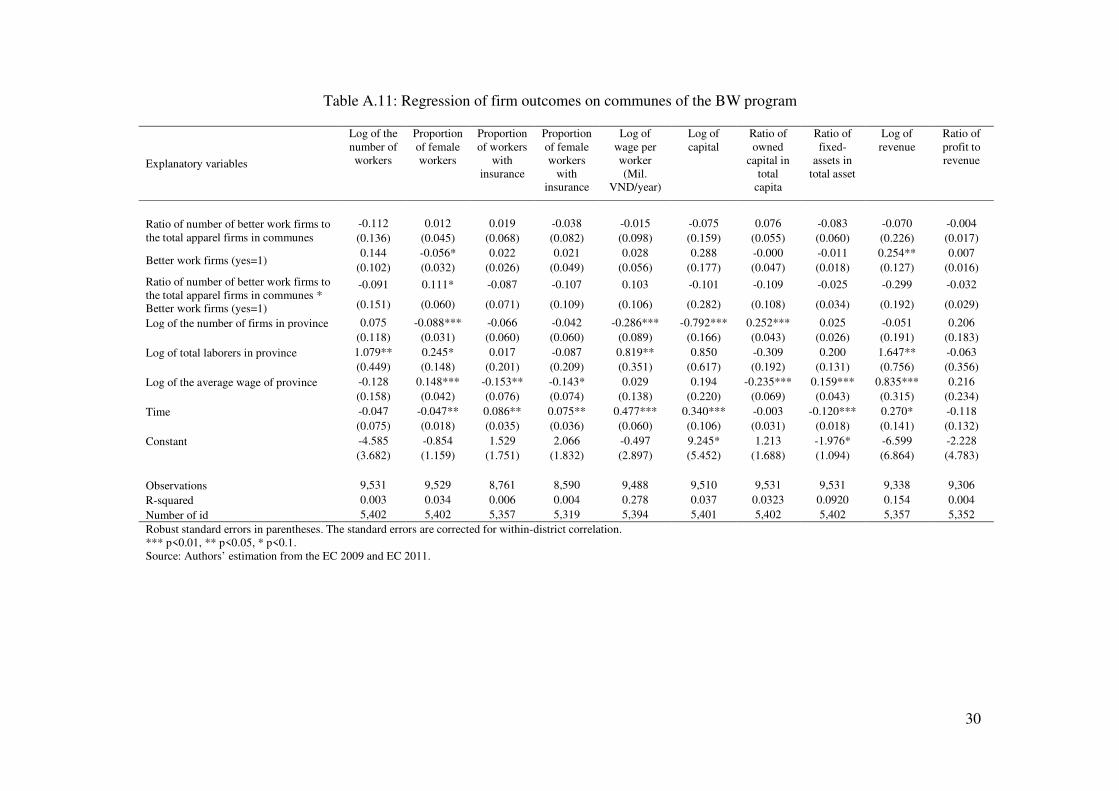
Next, we estimate spill-over effects of the BW program (Equation 2). We proxy
the spillover effects of the BW program with either a dummy variable that equals one if a
firm is located in a communes with Better Work firms or with the proportion of the BW
firms to the total number of apparel firms in the communes. We use three models. In the
first model BW firms are dropped from the sample. The second model includes BW firms
and a dummy variable that equals one if the firm is part of the BW program. The third
model includes the dummy variable that reflect participation in the BW program and
interact this variable with the variables that proxy for spill-over effects. The regression
results are presented in Table A.7 to A.11 in Appendix. We do not find any spillover
effects, except for the ratio of female works: Plant in the communes where BW factories
are located also experienced a decrease in the share of female workers.
Finally, we use the difference-in-differences with propensity score matching
estimator. The propensity score is estimated using a probit model with explanatory
variables of firm characteristics in the 2009. In this paper, we use kernel matching with
bandwidth of 0.01 and 0.05. We calculate standard errors using bootstrap techniques. We
do not use the nearest neighbor matching estimator, since Abadie and Imbens (2006) find
that bootstrap can give invalid standard errors for the nearest neighbor matching estimator.
We find a positive and statistically significant effect of the BW program on log of wages
of firms. The effect on labor size and capital is positive as the fixed-effects regression
founds, but not statistically significant. Propensity score matching often gives large
standard errors than parametric regressions.

17
6. Conclusions
Vietnam is a dynamic economy that is witnessing a rapid expansion of the industrial
sector. The number of registered firms increased from 112,950 in 2005 to339,287in 2011.
Working conditions appear poor in many firms: For example, more than 40% of workers
employed in firms and organizations do not have health and social insurance.
In an attempt to increase the competitiveness and working conditions of the
garment sector, the Better Work (BW) Vietnam programme has been launched by ILO
and IFC. Using Vietnam Enterprise Censuses, this paper provides a first quantitative
evaluation of the program. Specifically, we examine the effect of the BW program on
labor and business performance of firms using fixed-effects regressions and difference-in-
differences with propensity score matching. We find that the BW firms are more likely to
have a larger number of workers and provide higher wages to workers compared to non-
BW apparel firms. BW firms also have high capital than other firms. However, there are
statistically significant effects on sales and profit of the BW firms. The absence of the
effect of the program on sale and profits might be due to the short time span available for
conducting this analysis. Future work in this area will further analyze this dimension.

18
References
Abadie, A. and G. W. Imbens, 2006.On the failure of the bootstrap for matching
estimators. NBER Technical Working Paper No. 325.
Angrist JD., Pischke JS. (2008), Mostly Harmless Econometrics: An Empiricist's
Companion. Princeton University Press.
Augurzky, B. and Schmidt, C.M. (2001), The propensity score: a means to an end, IZA
Discussion Paper Series No. 271.
Benavente, Jose Miguel, Gustavo Crespi and Alessandro Maffioli (2007), “Public Support
to Firm Level Innovation: AnEvaluation of the FONTEC Program”, OVE/WO-05/07,
Inter-American Development Bank.
Bruhn, Miriam, and Bilal Zia. 2011. “Stimulating Managerial Capital in Emerging
Markets: The Impact of Business and Financial Literacy for Young Entrepreneurs.” World
Bank Policy Research WorkingPaper No. 5642.
Bruhn, Miriam, Karlan, Dean S. and Schoar, Antoinette (2012), The Impact of Consulting
Services on Small and Medium Enterprises: Evidence from a Randomized Trial in Mexico
(February 24, 2012). Yale Economics Department Working Paper No. 100; Yale
University Economic Growth Center Discussion Paper No. 1010. Available at SSRN:
http://ssrn.com/abstract=2010710 or http://dx.doi.org/10.2139/ssrn.2010710
Criscuolo, Chiara, Ralf Martin, Henry Overman and John Van Reenen (2007), “The
Effects of Industrial Policy on Corporate Performance: Evidence from Panel Data”, Center
for Economic Performance, London School of Economics.
De Negri, João Alberto, Mauro Borges Lemos and Fernanda De Negri (2006), “Impact of
R&D Incentive Program on the Performance and Technological Efforts of Brazilian
Industrial Firms”, OVE/WP-14/06, Inter-American Development Bank, Washington DC.
Heckman J, R Lalonde, Smith J. (1999), The economics and econometrics of active labor
market programs. Handbook of Labor Economics 1999; Volume 3, Ashenfelter, A. and D.
Card, eds., Elsevier Science.
ILO and IFC (2012), “Vietnam Baseline Report: Worker Perspectives from the Factory
and Beyond”, Report.
ILO and IFC (2013), “JordanBaseline Report: Worker Perspectives from the Factory and
Beyond”, Report.

19
Imbens, G., and Wooldridge, J. (2009), Recent developments in the econometrics of
program evaluation, Journal of Economic Literature 47(1), 5-86.
Karlan, Dean, and Martin Valdivia. 2011. “Teaching Entrepreneurship: Impact of
Business Training on Microfinance Clients and Institutions.” Review of Economics and
Statistics 93 (2): 510–527.
Level Works (2013), “Labor Compliance Country Issues Summary Vietnam”, Level
Works Ltd.
Lopez-Acevedo, G. and Tan, H. (2010), “Impact Evaluation of SME Programs in Latin
America and Caribbean”, The World Bank.
Mole, Kevin F.; Hart, Mark; Roper, Stephen and Saal, David S. (2008). Differential gains
from Business Link support and advice : a treatment effects approach. Environment and
planning C, 26 (2), pp. 315-334.
Nguyen, Cuong, 2009. "Do Minimum Wage Increases Matter to Profitability of Private
Firm? The Case of Vietnam," MPRA Paper 48655, University Library of Munich,
Germany.
Nguyen, Cuong, 2012. "Do Minimum Wages Affect Firms’ Labor and Capital? Evidence
from Vietnam," MPRA Paper 48656, University Library of Munich, Germany.
Robertson, R. (2011), “Apparel wages before and after better factories Cambodia”, Better
Work Discussion Paper NO. 3., International Labour Organization (ILO) and International
Finance Corporation (IFC).
Rosenbaum, P. and R. Rubin (1985), Constructing a control group using multivariate
matched sampling methods that incorporate the propensity score, American Statistician
39(1), 33-38.
Rosenbaum, P. and R. Rubin, 1983. The Central role of the propensity score in
observational studies for causal effects. Biometrika 70(1), 41-55.
Smith, J. and P. Todd. (2005), Does matching overcome LaLonde’s critique of
nonexperimental estimators?, Journal of Econometrics 125(1–2), 305–353.
Tan, Hong and Gladys Lopez-Acevedo (2005), “Evaluating Training Programs for Small
and Medium Enterprises: Lessons from Mexico”, World Bank Policy Research Working
Paper 3760, Washington DC.

20
Appendix
Table A.1. Regression of labor outcomes on better work program: sample of all the firms
Explanatory variables
Log of the
number of
workers
Proportion
of female
workers
Proportion
of workers
with
insurance
Proportion
of female
workers
with
insurance
Log of
wage per
worker
(Mil.
VND/year)
Firms of Better Work 0.142*** -0.055*** 0.049*** 0.019 0.380***
(0.047) (0.017) (0.015) (0.025) (0.037)
Log of the number of firms in province 0.050 -0.010 -0.078*** 0.013 -0.401***
(0.036) (0.008) (0.025) (0.026) (0.068)
Log of total laborers in province 0.565*** -0.027 0.081 -0.062 0.738***
(0.206) (0.038) (0.118) (0.134) (0.265)
Log of the average wage of province 0.066 0.026** -0.092** -0.211*** 0.525***
(0.052) (0.012) (0.041) (0.047) (0.098)
time -0.082*** 0.012*** 0.011 0.027 0.098**
(0.023) (0.004) (0.016) (0.017) (0.042)
Constant -2.416 0.547* 0.766 1.428 -0.316
(1.627) (0.282) (0.928) (1.037) (2.159)
Observations 352,347 347,730 306,088 287,118 349,468
R-squared 0.001 0.0047 0.011 0.0069 0.040
Number of id 176,178 176,178 176,178 170,674 176,148
Robust standard errors in parentheses. The standard errors are corrected for within-district correlation. *** p<0.01, ** p<0.05, * p<0.1. Source: Authors’ estimation from the EC 2009 and EC 2011.

21
Table A.2. Regression of firm business outcomes on better work program: sample of all the firms
Explanatory variables
Log of
capital
Ratio of
owned
capital in
total capita
Ratio of
fixed-assets
in total asset
Log of
revenue
Ratio of
profit to
revenue
Firms of Better Work 0.488*** -0.052* -0.064*** 0.203** -3.447
(0.103) (0.030) (0.012) (0.081) (3.385)
Log of the number of firms in province -1.295*** 0.169*** -0.008 0.358*** 17.638
(0.109) (0.021) (0.009) (0.086) (17.286)
Log of total laborers in province 2.353*** -0.398*** 0.044 1.030** 3.873
(0.446) (0.085) (0.061) (0.439) (15.021)
Log of the average wage of province 0.878*** -0.131*** -0.005 0.494*** 31.467
(0.136) (0.027) (0.013) (0.153) (31.068)
time 0.041 0.019 -0.020*** 0.171*** -10.211
(0.064) (0.012) (0.006) (0.056) (10.154)
Constant -0.174 2.402*** -0.002 -5.029 -297.103
(3.562) (0.672) (0.449) (3.114) (311.803)
Observations 351,384 352,356 352,356 340,366 337,584
R-squared 0.040 0.016 0.010 0.084 0.000
Number of id 176,166 176,178 176,178 175,653 175,198
Robust standard errors in parentheses. The standard errors are corrected for within-district correlation.
*** p<0.01, ** p<0.05, * p<0.1.
Source: Authors’ estimation from the EC 2009 and EC 2011.

22
Table A.3. Regression of labor outcomes on better work program:
sample of all the firms – panel 2007-2009 EC
Explanatory variables
Log of the
number of
workers
Proportion
of female
workers
Proportion
of workers
with
insurance
Proportion
of female
workers
with
insurance
Log of
wage per
worker
(Mil.
VND/year)
Firms of Better Work 0.010 -0.029* 0.015 0.010 0.095**
(0.039) (0.016) (0.015) (0.011) (0.044)
Log of the number of firms in province 0.079* -0.010 -0.004 0.083** -0.154**
(0.046) (0.009) (0.027) (0.035) (0.063)
Log of total laborers in province 0.250 -0.016 -0.161 -0.371* 0.479
(0.307) (0.041) (0.153) (0.197) (0.345)
Log of the average wage of province -0.284*** 0.053*** -0.053 -0.032 -0.768***
(0.054) (0.010) (0.042) (0.040) (0.062)
Time 0.161*** -0.023*** 0.028 -0.005 0.841***
(0.046) (0.009) (0.033) (0.033) (0.052)
Constant 1.680 0.206 1.862* 2.493* 6.104**
(2.357) (0.303) (1.110) (1.474) (2.609)
Observations 141,355 139,758 124,486 114,194 139,165
R-squared 0.004 0.007 0.003 0.004 0.056
Number of id 95,351 94,965 92,057 84,653 93,849
Robust standard errors in parentheses. The standard errors are corrected for within-district correlation. *** p<0.01, ** p<0.05, * p<0.1. Source: Authors’ estimation from the EC 2009 and EC 2011.

23
Table A.4. Regression of firm business outcomes on better work program:
sample of all the firms – panel 2007-2009 EC
Explanatory variables
Log of
capital
Ratio of
owned
capital in
total capita
Ratio of
fixed-assets
in total asset
Log of
revenue
Ratio of
profit to
revenue
Firms of Better Work -0.114 0.059 -0.019 0.143 -2.057
(0.125) (0.036) (0.015) (0.121) (2.162)
Log of the number of firms in province -0.715*** 0.065*** -0.015 0.099 2.841
(0.093) (0.016) (0.014) (0.117) (2.577)
Log of total laborers in province 1.568*** -0.248*** -0.007 0.928 -0.644
(0.459) (0.085) (0.086) (0.751) (2.103)
Log of the average wage of province -1.305*** 0.147*** 0.075*** -0.406** -6.654
(0.149) (0.025) (0.015) (0.194) (8.040)
Time 1.278*** -0.128*** -0.076*** 0.652*** 5.004
(0.116) (0.020) (0.012) (0.159) (6.094)
Constant 11.740*** 0.866 -0.088 2.392 23.184
(3.488) (0.636) (0.624) (5.899) (42.911)
Observations 140,685 141,534 141,534 132,925 131,882
R-squared 0.030 0.005 0.008 0.062 0.000
Number of id 94,934 95,529 95,529 89,676 89,190
Robust standard errors in parentheses. The standard errors are corrected for within-district correlation.
*** p<0.01, ** p<0.05, * p<0.1.
Source: Authors’ estimation from the EC 2009 and EC 2011.
24
Table A.5. Regression of labor outcomes on better work program:
sample of apparel firms – panel 2007-2009 EC
Explanatory variables
Log of the
number of
workers
Proportion
of female
workers
Proportion
of workers
with
insurance
Proportion
of female
workers
with
insurance
Log of
wage per
worker
(Mil.
VND/year)
Firms of Better Work -0.011 -0.015 -0.013 -0.013 0.023
(0.051) (0.018) (0.016) (0.017) (0.053)
Log of the number of firms in province -0.004 -0.066 -0.097 -0.027 -0.255
(0.226) (0.050) (0.074) (0.083) (0.159)
Log of total laborers in province 0.370 0.085 -0.090 -0.179 0.842
(0.683) (0.191) (0.277) (0.252) (0.584)
Log of the average wage of province -0.356** -0.028 0.051 0.014 -0.146
(0.151) (0.029) (0.063) (0.070) (0.109)
time 0.245* 0.023 0.021 0.016 0.560***
(0.131) (0.030) (0.054) (0.059) (0.093)
Constant 3.483 0.841 1.694 1.976 0.086
(5.843) (1.620) (2.390) (2.191) (4.825)
Observations 3,908 3,906 3,607 3,488 3,877
R-squared 0.007 0.013 0.006 0.001 0.280
Number of id 2,709 2,708 2,634 2,539 2,685
Robust standard errors in parentheses. The standard errors are corrected for within-district correlation. *** p<0.01, ** p<0.05, * p<0.1. Source: Authors’ estimation from the EC 2009 and EC 2011.

25
Table A.6. Regression of firm business outcomes on better work program:
sample of apparel firms – panel 2007-2009 EC
Explanatory variables
Log of
capital
Ratio of
owned
capital in
total capita
Ratio of
fixed-assets
in total asset
Log of
revenue
Ratio of
profit to
revenue
Firms of Better Work 0.032 0.039 0.015 0.102 -0.030
(0.119) (0.035) (0.015) (0.126) (0.031)
Log of the number of firms in province -0.440 0.206*** -0.075* -0.120 0.466
(0.331) (0.053) (0.044) (0.399) (0.454)
Log of total laborers in province -1.215** 0.194 0.263 0.068 0.572
(0.591) (0.215) (0.161) (1.179) (0.621)
Log of the average wage of province -0.533*** 0.081* 0.114*** -0.284 0.012
(0.167) (0.048) (0.035) (0.327) (0.035)
time 0.769*** -0.147*** -0.129*** 0.754*** -0.178
(0.132) (0.041) (0.032) (0.239) (0.177)
Constant 25.331*** -3.381* -1.715 10.598 -8.693
(6.020) (1.866) (1.381) (10.300) (8.768)
Observations 3,893 3,914 3,914 3,763 3,741
R-squared 0.046 0.017 0.084 0.140 0.011
Number of id 2,698 2,715 2,715 2,590 2,577
Robust standard errors in parentheses. The standard errors are corrected for within-district correlation.
*** p<0.01, ** p<0.05, * p<0.1.
Source: Authors’ estimation from the EC 2009 and EC 2011.

26
Table A.7: Regression of firm outcomes on communes of the BW program
Explanatory variables
Log of the
number of
workers
Proportion
of female
workers
Proportion
of workers
with
insurance
Proportion
of female
workers
with
insurance
Log of
wage per
worker
(Mil.
VND/year)
Log of
capital
Ratio of
owned
capital in
total
capita
Ratio of
fixed-
assets in
total asset
Log of
revenue
Ratio of
profit to
revenue
Commune having etter work firms
(yes=1)
-0.004 -0.002 0.012 -0.001 -0.006 0.012 -0.009 -0.015 -0.025 -0.028
(0.043) (0.010) (0.017) (0.017) (0.022) (0.052) (0.013) (0.010) (0.062) (0.020)
Log of the number of firms in province 0.060 -0.083** -0.067 -0.050 -0.292*** -0.889*** 0.270*** 0.032 -0.100 0.210
(0.122) (0.033) (0.062) (0.061) (0.090) (0.170) (0.042) (0.026) (0.197) (0.185)
Log of total laborers in province 1.133** 0.231 -0.014 -0.055 0.690* 1.048 -0.375* 0.220* 1.705** 0.023
(0.527) (0.148) (0.216) (0.219) (0.384) (0.689) (0.212) (0.131) (0.840) (0.339)
Log of the average wage of province -0.130 0.157*** -0.146* -0.159** 0.014 0.127 -0.241*** 0.150*** 0.756** 0.188
(0.156) (0.045) (0.080) (0.078) (0.138) (0.214) (0.070) (0.042) (0.305) (0.227)
Time -0.042 -0.050** 0.083** 0.081** 0.488*** 0.380*** -0.004 -0.118*** 0.309** -0.110
(0.076) (0.021) (0.036) (0.036) (0.061) (0.108) (0.032) (0.018) (0.142) (0.130)
Constant -4.931 -0.839 1.735 1.950 0.578 8.824 1.579 -2.172** -6.380 -2.812
(4.101) (1.199) (1.822) (1.877) (3.062) (5.903) (1.826) (1.091) (7.488) (4.802)
Observations 9,344 9,342 8,542 8,372 9,301 9,324 9,344 9,344 9,149 9,115
R-squared 0.002 0.032 0.006 0.004 0.270 0.036 0.035 0.089 0.148 0.005
Number of id 5,301 5,301 5,238 5,200 5,293 5,300 5,301 5,301 5,255 5,248
Robust standard errors in parentheses. The standard errors are corrected for within-district correlation.
*** p<0.01, ** p<0.05, * p<0.1.
Source: Authors’ estimation from the EC 2009 and EC 2011.

27
Table A.8: Regression of firm outcomes on communes of the BW program
Explanatory variables
Log of the
number of
workers
Proportion
of female
workers
Proportion
of workers
with
insurance
Proportion
of female
workers
with
insurance
Log of
wage per
worker
(Mil.
VND/year)
Log of
capital
Ratio of
owned
capital in
total
capita
Ratio of
fixed-
assets in
total asset
Log of
revenue
Ratio of
profit to
revenue
Ratio of number of better work firms to
all commune firms
-0.144 0.014 0.022 -0.037 -0.039 -0.122 0.092* -0.074 -0.109 -0.000
(0.148) (0.047) (0.071) (0.085) (0.096) (0.163) (0.047) (0.057) (0.206) (0.018)
Log of the number of firms in province 0.056 -0.090*** -0.061 -0.044 -0.280*** -0.849*** 0.261*** 0.028 -0.072 0.212
(0.124) (0.031) (0.063) (0.063) (0.091) (0.171) (0.042) (0.027) (0.197) (0.188)
Log of total laborers in province 1.165** 0.224 0.046 -0.048 0.756** 1.041 -0.390* 0.181 1.800** -0.052
(0.484) (0.151) (0.206) (0.217) (0.371) (0.643) (0.203) (0.136) (0.784) (0.368)
Log of the average wage of province -0.131 0.150*** -0.155** -0.150** 0.045 0.179 -0.235*** 0.162*** 0.844*** 0.222
(0.161) (0.042) (0.077) (0.075) (0.141) (0.223) (0.070) (0.044) (0.320) (0.239)
Time -0.043 -0.046** 0.083** 0.076** 0.473*** 0.357*** -0.003 -0.121*** 0.269* -0.123
(0.077) (0.019) (0.036) (0.036) (0.062) (0.110) (0.032) (0.019) (0.145) (0.135)
Constant -5.129 -0.695 1.257 1.807 -0.136 8.341 1.739 -1.879* -7.676 -2.395
(3.882) (1.192) (1.792) (1.886) (3.037) (5.678) (1.781) (1.135) (7.086) (4.916)
Observations 9,270 9,268 8,501 8,333 9,227 9,250 9,270 9,270 9,077 9,045
R-squared 0.002 0.032 0.006 0.004 0.270 0.035 0.034 0.089 0.150 0.004
Number of id 5,271 5,271 5,226 5,188 5,263 5,270 5,271 5,271 5,226 5,221
Robust standard errors in parentheses. The standard errors are corrected for within-district correlation.
*** p<0.01, ** p<0.05, * p<0.1.
Source: Authors’ estimation from the EC 2009 and EC 2011.

28
Table A.9: Regression of firm outcomes on communes of the BW program
Explanatory variables
Log of the
number of
workers
Proportion
of female
workers
Proportion
of workers
with
insurance
Proportion
of female
workers
with
insurance
Log of
wage per
worker
(Mil.
VND/year)
Log of
capital
Ratio of
owned
capital in
total
capita
Ratio of
fixed-
assets in
total asset
Log of
revenue
Ratio of
profit to
revenue
Ratio of number of better work firms to
all commune firms
-0.112 0.012 0.019 -0.038 -0.015 -0.075 0.076 -0.082 -0.069 -0.004
(0.136) (0.045) (0.068) (0.082) (0.098) (0.159) (0.056) (0.060) (0.226) (0.017)
Better work firms (yes=1) 0.108* -0.012 -0.013 -0.023 0.069** 0.249*** -0.043 -0.022* 0.135 -0.005
(0.056) (0.014) (0.017) (0.027) (0.034) (0.085) (0.031) (0.013) (0.089) (0.010)
Log of the number of firms in province 0.075 -0.089*** -0.066 -0.041 -0.286*** -0.792*** 0.253*** 0.025 -0.050 0.206
(0.118) (0.031) (0.060) (0.060) (0.089) (0.166) (0.043) (0.026) (0.190) (0.183)
Log of total laborers in province 1.084** 0.238 0.026 -0.075 0.813** 0.855 -0.303 0.201 1.665** -0.061
(0.448) (0.146) (0.198) (0.206) (0.351) (0.613) (0.193) (0.131) (0.755) (0.355)
Log of the average wage of province -0.128 0.148*** -0.153** -0.144* 0.029 0.194 -0.235*** 0.159*** 0.835*** 0.216
(0.158) (0.042) (0.076) (0.074) (0.138) (0.220) (0.069) (0.043) (0.315) (0.234)
Time -0.047 -0.046** 0.085** 0.074** 0.477*** 0.339*** -0.004 -0.120*** 0.269* -0.118
(0.075) (0.018) (0.035) (0.036) (0.060) (0.106) (0.031) (0.018) (0.141) (0.132)
Constant -4.629 -0.800 1.455 1.969 -0.447 9.198* 1.161 -1.988* -6.744 -2.244
(3.675) (1.145) (1.734) (1.820) (2.894) (5.427) (1.689) (1.093) (6.851) (4.778)
Observations 9,531 9,529 8,761 8,590 9,488 9,510 9,531 9,531 9,338 9,306
R-squared 0.00249 0.033 0.006 0.004 0.278 0.0373 0.032 0.0919 0.154 0.004
Number of id 5,402 5,402 5,357 5,319 5,394 5,401 5,402 5,402 5,357 5,352
Robust standard errors in parentheses. The standard errors are corrected for within-district correlation.
*** p<0.01, ** p<0.05, * p<0.1.
Source: Authors’ estimation from the EC 2009 and EC 2011.

29
Table A.10: Regression of firm outcomes on communes of the BW program
Explanatory variables
Log of the
number of
workers
Proportion
of female
workers
Proportion
of workers
with
insurance
Proportion
of female
workers
with
insurance
Log of
wage per
worker
(Mil.
VND/year)
Log of
capital
Ratio of
owned
capital in
total
capita
Ratio of
fixed-
assets in
total asset
Log of
revenue
Ratio of
profit to
revenue
Ratio of number of better work firms to
the total apparel firms in communes
0.262 0.088 -0.101 -0.140 0.068 0.129 0.108 -0.236* 0.147 0.006
(0.403) (0.135) (0.139) (0.175) (0.250) (0.365) (0.105) (0.123) (0.532) (0.036)
Better work firms (yes=1) 0.112** -0.012 -0.013 -0.023 0.070** 0.248*** -0.041 -0.019 0.140 -0.005
(0.056) (0.014) (0.017) (0.027) (0.034) (0.085) (0.031) (0.012) (0.089) (0.009)
Log of the number of firms in province 0.077 -0.082** -0.071 -0.047 -0.298*** -0.832*** 0.261*** 0.026 -0.081 0.202
(0.116) (0.033) (0.059) (0.059) (0.088) (0.165) (0.042) (0.026) (0.191) (0.180)
Log of total laborers in province 1.034** 0.238 0.013 -0.085 0.735** 0.895 -0.317 0.193 1.500* -0.072
(0.446) (0.146) (0.195) (0.203) (0.346) (0.617) (0.195) (0.130) (0.763) (0.347)
Log of the average wage of province -0.121 0.157*** -0.154** -0.151** 0.003 0.134 -0.233*** 0.161*** 0.771** 0.206
(0.153) (0.044) (0.074) (0.073) (0.134) (0.216) (0.068) (0.042) (0.308) (0.228)
Time -0.048 -0.051** 0.088*** 0.079** 0.490*** 0.366*** -0.007 -0.121*** 0.301** -0.114
(0.074) (0.020) (0.034) (0.035) (0.059) (0.106) (0.031) (0.018) (0.140) (0.129)
Constant -4.302 -0.897 1.610 2.133 0.345 9.462* 1.185 -1.943* -4.983 -2.075
(3.637) (1.170) (1.693) (1.777) (2.836) (5.456) (1.697) (1.077) (6.913) (4.670)
Observations 9,606 9,604 8,803 8,630 9,563 9,585 9,606 9,606 9,411 9,377
R-squared 0.002 0.033 0.006 0.004 0.277 0.038 0.033 0.092 0.152 0.004
Number of id 5,432 5,432 5,369 5,331 5,424 5,431 5,432 5,432 5,386 5,379
Robust standard errors in parentheses. The standard errors are corrected for within-district correlation.
*** p<0.01, ** p<0.05, * p<0.1.
Source: Authors’ estimation from the EC 2009 and EC 2011.
30
Table A.11: Regression of firm outcomes on communes of the BW program
Explanatory variables
Log of the
number of
workers
Proportion
of female
workers
Proportion
of workers
with
insurance
Proportion
of female
workers
with
insurance
Log of
wage per
worker
(Mil.
VND/year)
Log of
capital
Ratio of
owned
capital in
total
capita
Ratio of
fixed-
assets in
total asset
Log of
revenue
Ratio of
profit to
revenue
Ratio of number of better work firms to
the total apparel firms in communes
-0.112 0.012 0.019 -0.038 -0.015 -0.075 0.076 -0.083 -0.070 -0.004
(0.136) (0.045) (0.068) (0.082) (0.098) (0.159) (0.055) (0.060) (0.226) (0.017)
Better work firms (yes=1) 0.144 -0.056* 0.022 0.021 0.028 0.288 -0.000 -0.011 0.254** 0.007
(0.102) (0.032) (0.026) (0.049) (0.056) (0.177) (0.047) (0.018) (0.127) (0.016)
Ratio of number of better work firms to
the total apparel firms in communes *
Better work firms (yes=1)
-0.091 0.111* -0.087 -0.107 0.103 -0.101 -0.109 -0.025 -0.299 -0.032
(0.151) (0.060) (0.071) (0.109) (0.106) (0.282) (0.108) (0.034) (0.192) (0.029)
Log of the number of firms in province 0.075 -0.088*** -0.066 -0.042 -0.286*** -0.792*** 0.252*** 0.025 -0.051 0.206
(0.118) (0.031) (0.060) (0.060) (0.089) (0.166) (0.043) (0.026) (0.191) (0.183)
Log of total laborers in province 1.079** 0.245* 0.017 -0.087 0.819** 0.850 -0.309 0.200 1.647** -0.063
(0.449) (0.148) (0.201) (0.209) (0.351) (0.617) (0.192) (0.131) (0.756) (0.356)
Log of the average wage of province -0.128 0.148*** -0.153** -0.143* 0.029 0.194 -0.235*** 0.159*** 0.835*** 0.216
(0.158) (0.042) (0.076) (0.074) (0.138) (0.220) (0.069) (0.043) (0.315) (0.234)
Time -0.047 -0.047** 0.086** 0.075** 0.477*** 0.340*** -0.003 -0.120*** 0.270* -0.118
(0.075) (0.018) (0.035) (0.036) (0.060) (0.106) (0.031) (0.018) (0.141) (0.132)
Constant -4.585 -0.854 1.529 2.066 -0.497 9.245* 1.213 -1.976* -6.599 -2.228
(3.682) (1.159) (1.751) (1.832) (2.897) (5.452) (1.688) (1.094) (6.864) (4.783)
Observations 9,531 9,529 8,761 8,590 9,488 9,510 9,531 9,531 9,338 9,306
R-squared 0.003 0.034 0.006 0.004 0.278 0.037 0.0323 0.0920 0.154 0.004
Number of id 5,402 5,402 5,357 5,319 5,394 5,401 5,402 5,402 5,357 5,352
Robust standard errors in parentheses. The standard errors are corrected for within-district correlation.
*** p<0.01, ** p<0.05, * p<0.1.
Source: Authors’ estimation from the EC 2009 and EC 2011.

31
Table A.12.Estimation of propensity score
treatment Coef. Std. Err. z P>z
Log of the number of workers 0.267 0.063 4.24 0.000
Proportion of female workers 1.549 0.418 3.71 0.000
Proportion of workers with insurance 0.607 0.217 2.80 0.005
Log of wage per worker (Mil. VND/year) 0.061 0.126 0.48 0.629
Log of capital -0.099 0.061 -1.62 0.106
Log of revenue 0.105 0.063 1.67 0.095
Binh Duong province 0.946 0.150 6.29 0.000
DongNai province 0.754 0.188 4.01 0.000
Ho Chi Minh city 0.691 0.134 5.17 0.000
_cons -5.616 0.598 -9.40 0.000
Pseudo R2 0.3026
Number of observations 3905
Source: Authors’ estimation from the EC 2009 and EC 2011.

32
Table A.13. Difference-in-difference with propensity score matching
Outcome variables 2009 2011 Diff-in-diff
Treated Controls Difference Treated Controls Difference Estimates Std. Err.
Kernel propensity score matching with
bandwidth of 0.01
Log of the number of workers 6.633 6.518 0.115 6.816 6.595 0.221 0.106 0.073
Proportion of female workers 0.808 0.802 0.006 0.784 0.784 0.000 -0.005 0.012
Proportion of workers with insurance 0.893 0.876 0.017 0.918 0.873 0.045 0.028 0.016
Proportion of female workers with insurance 0.895 0.878 0.017 0.905 0.875 0.031 0.014 0.022
Log of wage per worker (Mil. VND/year) 3.349 3.344 0.005 3.850 3.741 0.109 0.104** 0.041
Log of capital 10.747 10.729 0.017 11.169 11.025 0.144 0.127 0.119
Ratio of owned capital in total capita 0.383 0.432 -0.048 0.357 0.427 -0.070 -0.022 0.042
Ratio of fixed-assets in total asset 0.424 0.392 0.032 0.349 0.323 0.027 -0.005 0.036
Log of revenue 11.061 10.922 0.139 11.761 11.439 0.322 0.183 0.145
Ratio of profit to revenue 0.044 0.080 -0.036 0.039 0.052 -0.012 0.024 0.051
Kernel propensity score matching with
bandwidth of 0.05
2009 2011 Diff-in-diff
Outcome variables Treated Controls Difference Treated Controls Difference Estimates Std. Err.
Log of the number of workers 6.633 6.346 0.288 6.816 6.420 0.396 0.108 0.092
Proportion of female workers 0.808 0.789 0.019 0.784 0.772 0.012 -0.007 0.012
Proportion of workers with insurance 0.893 0.839 0.054 0.918 0.839 0.079 0.025 0.020
Proportion of female workers with insurance 0.895 0.842 0.053 0.905 0.841 0.064 0.011 0.024
Log of wage per worker (Mil. VND/year) 3.349 3.328 0.021 3.850 3.719 0.131 0.111** 0.043
Log of capital 10.747 10.626 0.121 11.169 10.902 0.267 0.146 0.113
Ratio of owned capital in total capita 0.383 0.426 -0.043 0.357 0.422 -0.065 -0.023 0.042
Ratio of fixed-assets in total asset 0.424 0.387 0.037 0.349 0.316 0.033 -0.004 0.031
Log of revenue 11.061 10.826 0.234 11.761 11.349 0.412 0.177 0.124
Ratio of profit to revenue 0.044 0.114 -0.070 0.039 0.040 -0.001 0.070 0.080
Source: Authors’ estimation from the EC 2009 and EC 2011.