a signal processing model for arterial spin labeling perfusion fmri thomas liu and eric wong center...
Post on 20-Dec-2015
224 views
TRANSCRIPT

A Signal Processing Model for
Arterial Spin Labeling
Perfusion fMRI
Thomas Liu and Eric Wong
Center for Functional Magnetic Resonance Imaging
University of California, San Diego
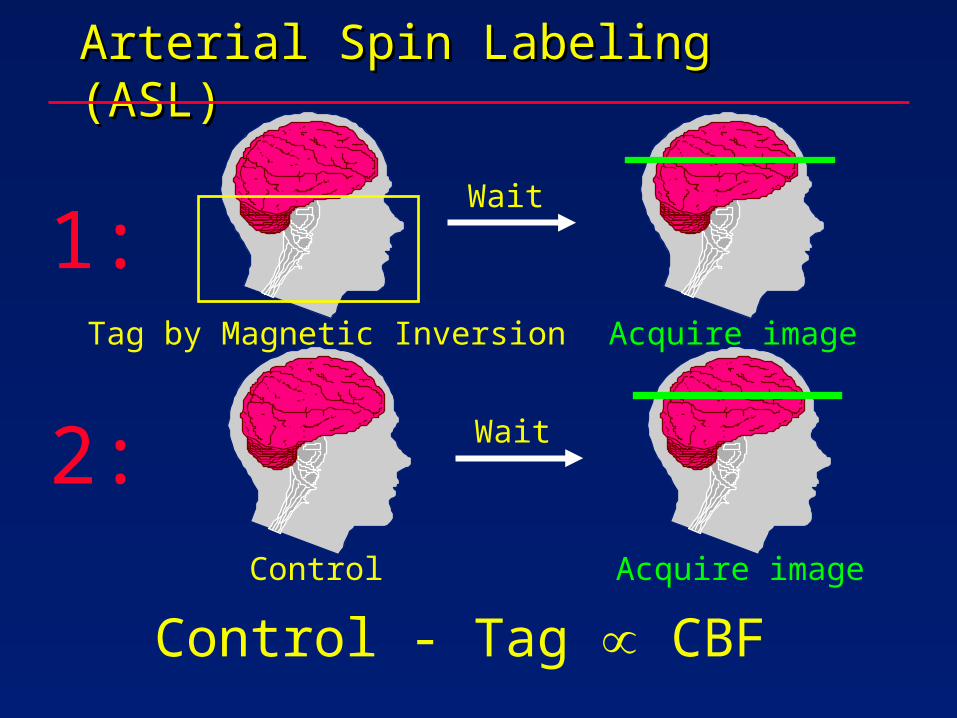
Arterial Spin Labeling (ASL)Arterial Spin Labeling (ASL)
Tag by Magnetic Inversion
Wait
Acquire image
Control
Wait
Acquire image
1:
2:
Control - Tag CBF

QuickTime™ and aTIFF (Uncompressed) decompressor
are needed to see this picture.
From C. Iadecola 2004
Goal: Accurately measure dynamic CBF response to neural activity
QuickTime™ and aTIFF (Uncompressed) decompressor
are needed to see this picture.
Example:Perfusion and BOLD in primary and supplementary motor cortex. Measured with PICORE QII with dual-echo spiral readout.
Obata et al. 2004

ASL Data Processing
• CBF = Control - Tag• An estimate of the CBF time series is formed
from a filtered subtraction of Control and Tag images.
• Use of subtraction makes CBF signal more insensitive to low-frequency drifts and 1/f noise.

Pairwise subtraction example
Control Tag
+1 -1 +1

Surround subtraction
Control Tag ControlTag
ControlTagControl
+1/2 -1
Perfusion Time Series
TA = 1 to 4 seconds
+1/2 -1/2 1 -1/2
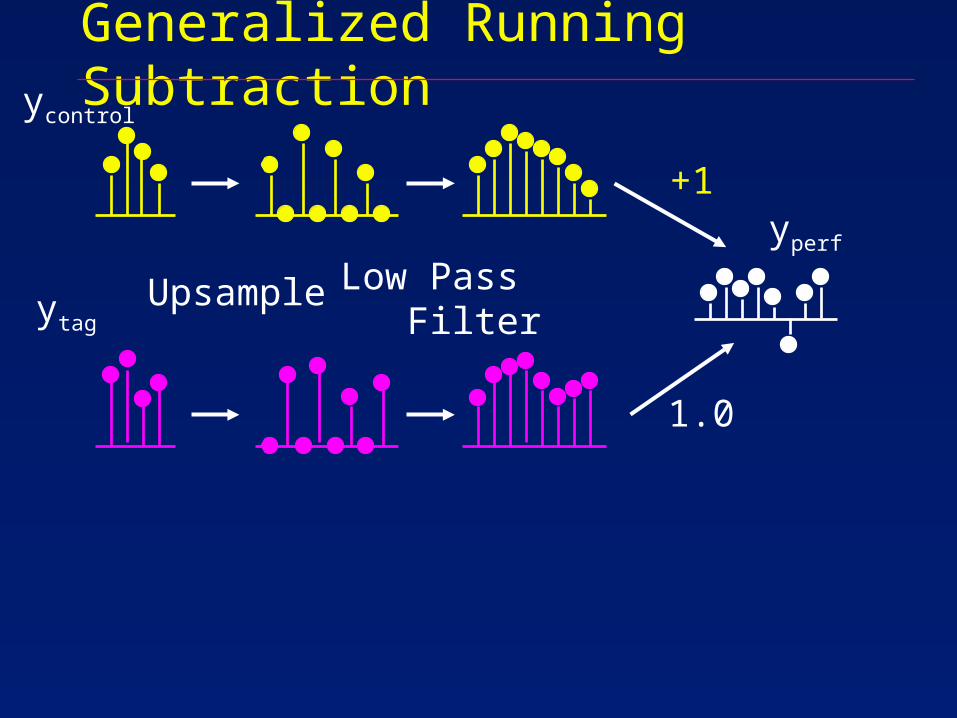
Generalized Running Subtraction
ytag
+1
1.0
Upsample Low Pass Filter
yperf
ycontrol

Questions
• What is the difference between the various processing schemes?
• How do they effect the estimate of CBF? • What are the noise properties of the estimate?
€
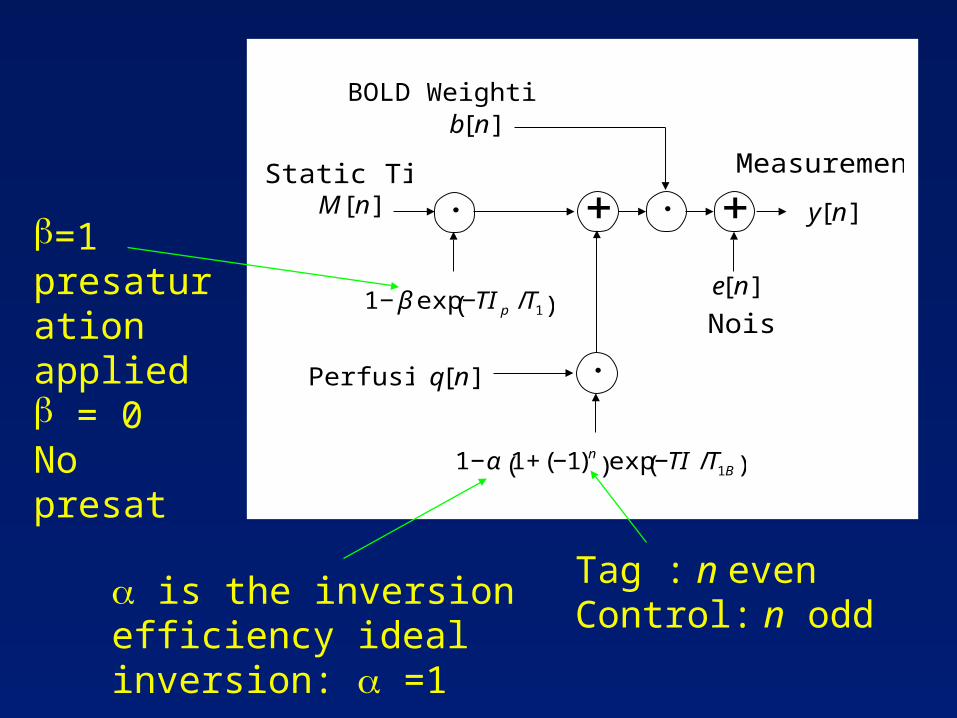
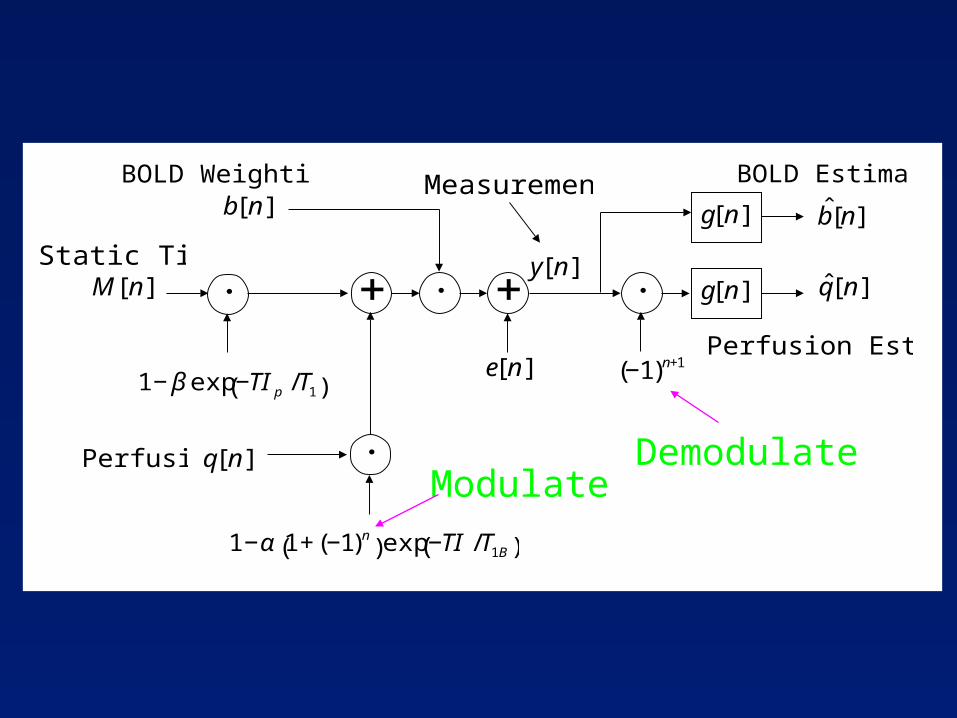
1−α 1+(−1)n( )exp −TI /T1B( )
€
q[ n]
€
M[ n]€
b[ n]
€
e[ n]
€
y[ n]
€
Perfusion
€
1− β exp −TI p /T1( )
€
×
€
+
€
×
€
×€
+
€
Static Tissue€
BOLD Weighting
€
Measurements
€
Noise
is the inversion efficiency ideal inversion: =1
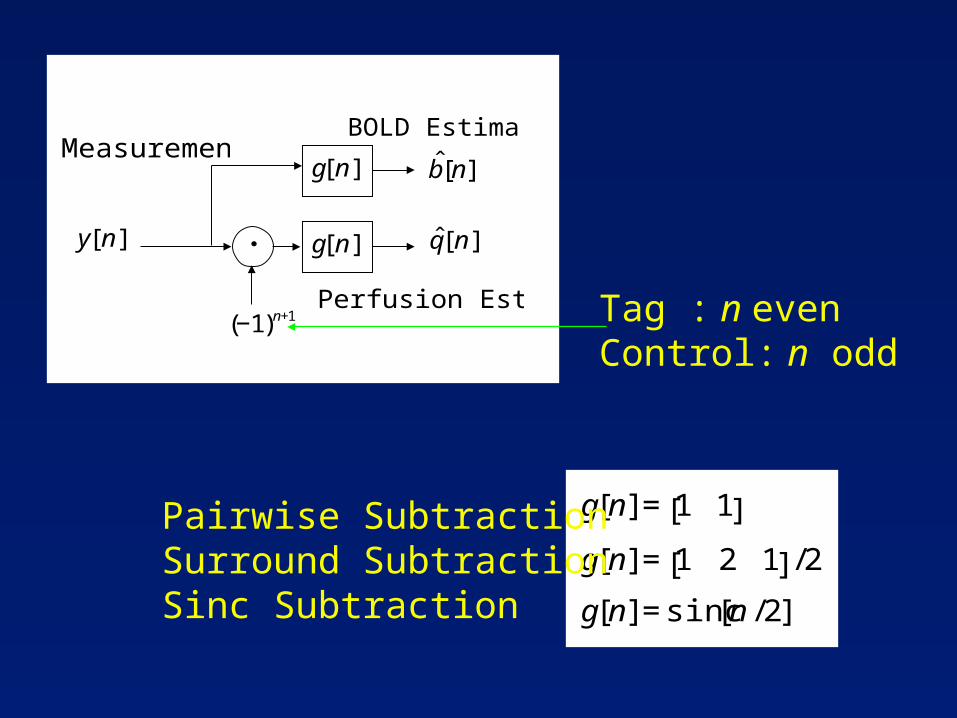
Tag : n evenControl: n odd
=1 presaturation applied = 0No presat
€
(−1)n+1
€
g[ n]
€
ˆ q [ n]
€
y[ n]
€
×€
g[ n]
€
ˆ b [n]
€
Measurements
€
Perfusion Estimate
€
BOLD Estimate
€
g[n] = 1 1[ ]
g[n] = 1 2 1[ ] /2
g[n] = sinc[n /2]
Tag : n evenControl: n odd
Pairwise SubtractionSurround SubtractionSinc Subtraction
€
1−α 1+(−1)n( )exp −TI /T1B( )
€
(−1)n+1
€
q[ n]
€
M[ n]€
b[ n]
€
e[ n]€
g[ n]
€
ˆ q [ n]
€
y[ n]
€
Perfusion
€
1− β exp −TI p /T1( )
€
×
€
+
€
×
€
×€
+
€
×€
g[ n]
€
ˆ b [n]
€
Static Tissue€
BOLD Weighting
€
Measurements
€
Perfusion Estimate
€
BOLD Estimate
DemodulateModulate

€
ˆ q [n ] = qq[n ]+ qb[n ]+ qe[n ]Perfusion Estimate
€
qq[n ] = αb[n ]q[n ]e−TI /T1B( ) ∗g[n ]
Demodulated and filtered perfusion component
Modulated and filtered BOLD component
€
qb[n ] = b[n ] sMM[n ]+ sqq[n ]( )[ ] −1( )n +1∗g[n ]
Modulated and filtered noise component
€
qe[n ] = (−1)n +1e[n ][ ] ∗g[n ]
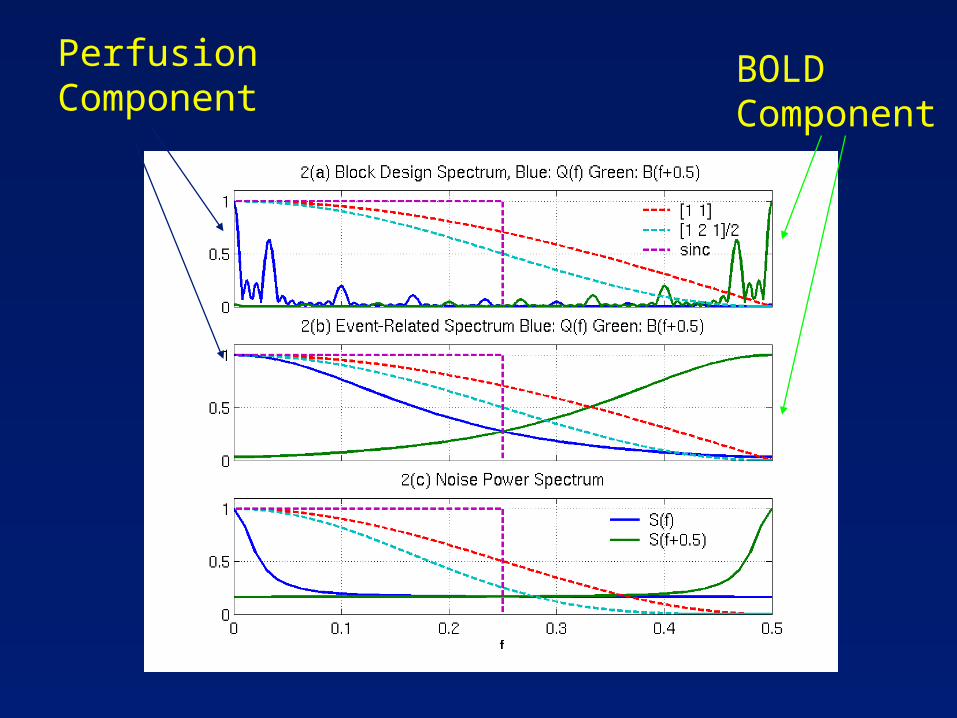
Perfusion Component
BOLD Component


Summary
• For block designs with narrow spectrum, use surround subtraction or sinc subtraction
• For randomized designs with broad spectrum, use pair-wise subtraction.
• To minimize noise autocorrelation use pair-wise or surround subtraction.
• General framework can be used to design other optimal filters.