a simple method for estimating the parameter of ...zhanglab/publications/1996-2001/gu_1997...a...
TRANSCRIPT

A Simple Method for Estimating the Variation Among Sites
Parameter of Substitution Rate
Xun Gu and Jianzhi Zhang Institute of Molecular Evolutionary Genetics and Department of Biology, The Pennsylvania State University
When the rate variation among sites is described by a gamma distribution, an important problem is how to estimate the shape parameter 01, which is an index of the degree of among-site rate variation. The parsimony-based methods for estimating (Y are simple but biased, i.e., (Y tends to be overestimated. On the other hand, the likelihood-based methods are asymptotically unbiased but take a huge amount of computational time. In this paper, we have developed a new method to solve this problem: we first estimate the expected number of substitutions at each site, which is corrected for multiple hits, and then estimate the parameter (Y. Our method is computationally as fast as the parsi- mony method, and the estimation accuracy is much higehr than that of parsimony and similar to that of the likelihood method.
Introduction
It is well known that different amino acid residues of a protein may have different functional constraints such that the substitution rate varies among the sites. Although this phenomenon was first described over 20 years ago (Uzzel and Corbin 1971), its importance for molecular evolutionary study has not been recognized until recently. The effect of rate variation among sites on phylogenetic reconstruction and divergence time es- timation has also been discussed extensively (e.g., Jin and Nei 1990; Huelsenbeck and Hillis 1993; Tateno, Takezaki, and Nei 1994; Yang 1994, 1996; Miyamoto and Fitch 1996; Gu 1997).
The gamma distribution has been widely used for modeling the rate variation among sites (Uzzel and Cor- bin 197 1; Holmquist et al. 1983; Tamura and Nei 1993; Yang 1993; Gu, Fu, and Li 1995). Under this model, the variation of substitution rate (A) among sites can be described as follows:
4(h) = &we-y
where the shape parameter (x is important because it describes the degree of rate variation, and p is a scalar. Since l/G is the coefficient of variation of h, the larger cx is, the weaker the rate variation is, and (x = m means a uniform rate among sites.
Several methods have been developed for estimat- ing (x from sequence data, these methods can be clas- sified into two groups. The first group is the maximim- likelihood (ML) approach, which was constructed under the framework of Felsenstein (1981) (e.g., Yang 1993; Gu, Fu, and Li 1995; Kelly and Rice 1996). However, the algorithms developed by these authors for maximiz- ing the likelihood function are so time-consuming that they are difficult to apply for more than five sequences. Although an approximate method (the discrete-gamma
Key words: rate variation among sites, gamma distribution, num- ber of substitutions.
Address for correspondence and reprints: Xun Gu, Institute of Molecular Evolutionary Genetics, 328 Mueller Laboratory, The Penn- sylvania State University, University Park, Pennsylvania 16802. E-mail: [email protected].
Mol. Biol. Evol. 14( 11):1106-l 113. 1997 0 1997 by the Society for Molecular Biology and Evolution. ISSN: 0737-4038
1106
distribution) has been developed (Yang 1994), it is stil time-consuming and cannot handle a large amount oj sequence data in a short period of time. The seconc group of methods for estimating (x is usually called the parsimony method, which has been widely used because it is computationally fast (e.g., Uzzel and Corbin 1971, Holmquist et al. 1983; Larson 1991; Tamura and Nej 1993; Sullivan, Holsinger, and Simon 1995; Tourasse and Gouy 1997). In these methods, the principle of par- simony (Fitch 197 1) was used to infer the (minimum required) number of substitutions. Since the parsimony method tends to underestimate the number of substitu- tions, it is known that (Y can be seriously overestimated: in other words, the degree of rate variation among sites can be underestimated (Wakeley 1993). An approach with a combination of likelihood and parsimony meth- ods was proposed by Yang and Kumar (1996). Since their method assumes that all branch lengths are equal in the phylogeny, it may be problematic when branch lengths along the tree are very different.
Large-scale sequence analysis calls for methods that can deal with many sequences or many genes at the same time. To complement recent improvement in our computational capacity for DNA sequence analysis, it is also important to study alternative models for develop- ing a statistically unbiased and computationally fast method. In this paper, a simple ML method is proposed which has two steps: (1) at each site, the expected num- ber of substitutions corrected for multiple hits is esti- mated by a likelihood approach, based on phylogeny and inferred ancestral sequences; and (2) the ML esti- mate of (Y is obtained under a negative binomial distri- bution (Uzzel and Corbin 1971) using the expected number of substitutions. Computer simulation has been conducted to examine the performance of the new meth- od.
Method Number of Substitutions at a Site
The number of substitutions at a site cannot be ob- served from the present-day sequences, so it has to be “inferred.” The traditional method of inference invokes the parsimony principle (Fitch 1971), which tends to underestimate the true number of substitutions (see Nei

1996). To understand the bias caused by parsimony, it is important to distinguish between the number of sub- stitutions (k) and the number of branches on which the amino acids (or nucleotides) at the two ends of a branch are different (m); in the following, m is also concisely called the number of changes. For given sequence data with a known tree, the difference between m and k is due to multiple substitutions that may occur when the branch is long, resulting in m I k. It should be noted that the minimum required number of substitutions is actually an “estimate” of m rather than k, because the possibility of multiple hits is completely neglected. Note that recently developed methods for ancestral sequence inference, which are based on likelihood or the Bayesian principle (e.g., Schluter 1995; Yang, Kumar, and Nei 1995; Koshi and Goldstein 1996; Zhang and Nei 1997), provide a more efficient approach for estimating m than does the parsimony method.
In the following, we will develop a new method to infer k. For simplicity, we only discuss amino acid se- quences; it is virtually the same for nucleotide sequenc- es. Suppose we have a protein data set with n homolo- gous sequences, whose phylogenetic tree (topology) is known or can be inferred. It is known that the total number of branches for an unrooted tree is A4 = 2n - 3, or M = 2n - 2 for a rooted tree. At a given site, we assume that k along the tree follows a Poisson distri- bution, whose expectation is designated by k = uB, where B is the total branch length of the tree and u is the evolutionary rate at this site. To avoid confusion, it is noteworthy that k under the Poisson model is a ran- dom variable, so it is not statistically meaningful to “es- timate” k. Instead, our purpose is to estimate the ex- pected number of substitutions (k), which will be used for estimating cx.
The number of substitutions at the same site that occur on branch i also follows a Poisson distribution with the expectation ubi, where bi is the length of branch i; obviously, we have ubi = kb,/B. Thus, the probability of no change on branch i (i.e., the amino acids at the two ends of this branch are the same) is given by
pi = &WB, (2) and the probability of a change (i.e., the amino acids are different at the two ends of the branch) is
4i = 1 - pi = 1 - &WB_ (3) For a given site, the branches along the tree can be
divided into two groups. The first group, denoted by G,, includes the branches on which (amino acid) changes occur, and the second group, denoted by Go, includes the branches on which no changes occur. Obviously, the total number of branches in Gr is equal to m at the site, and the total number of branches on Go is therefore giv- en by M - m. Then, when the information about groups Gr and Go at a site is known, the (conditional) likelihood function can be written as
-
A Method for Estimating Substitution Rate Variation Among Sites
lEti JE GO
= I-I< 1 _ e -kb,lB) n e -Lb,IB.
kGj jc Go (4)
1107
The subscripts under the product signs mean that branch i belongs to group Gr and branch j belongs to group Go, respectively. It is easy to show that the logarithm of L is given by
In L = C ln( 1 - e-Lbl’B) - EB,/B, (5) icG1
where B. = ZjEGobi is the total of branch lengths in group Go. The ML estimate of k, denoted by k, can be obtained when the derivative of In L is 0, i.e.,
a In L c
bie -hlB - =
al? iEG, 1 - ,+&B - B. = 0. (6)
By numbering branches in group Gr from 1 to m and branches in group Go from m + can be concisely expressed by
1 to M, equation
m
c bilB i=l 1 _ e-kb,/B = ‘*
(6)
(7)
The KL estimate of the expected number of sub- stitutions (k), which is the positive solution of equation (7), depends on m and the branch lengths. If*for every branch, hi/B is so small that 1 - epkbllB =r kbi/Bp then i = m. This result is consistent with the intuition that the expected number of substitutions estimated by equa- tion (7) approaches the number of changes when all branch lengths in the tree are short. On the other hand, if all branch lengths are the same, i.e., bi = b and so B = Mb (M is the number of branches), equation (7) can be simplified as follows
i=-Mln 1-m i 1 M’
From equation (8), it is easy to show that i is generally larger than m. Actually, equation (8) can also be simply derived by_ equating the probability of no change in a branch (epkblB) with-the observed frequency among the M branches, i.e., epkblB = 1 - m/M.
Our estimation can be extended to a more general model, where the probability of no change on branch i is given by
pi = 1 - C + ceekbl (9)
where hi = b,l(B . c), and the probability of a change 1s
qi = 1 - pi = ~(1 - e-Lb,) (10) This model was also used by Yang and Kumar (1996). For amino acid sequences, when c = 1, this model is reduced to the Poisson model (see eqs. 2 and 3), and when c = 0.95 it is Jukes and Cantor’s (1969) model for protein sequences. Gu (1997) suggested c = 0.83 to take the pattern of amino acid replacements into ac- count, which can be interpreted as an approximation for Dayhoff’s model; it could be slightly different (c = 0.84) for the Jones, Taylor, and Thornton (1992) model. For nucleotide sequences, when c = 0.75 it is Jukes and

1108 Gu and Zhang
Cantor’s (1969) model; and when c = 1 - cf_, ff, it is Tajima and Nei’s (1984) model, wherei is the frequency of nucleotide i. For a given site, the likelihood function in equation (4) can be now modified as follows:
L = fi c(1 - e-kh) fi (1 - c + c&h) (11) i=l i=m+ 1
Similar to equation (7), k at this site can be estimated by letting a In Lldk = 0, which yields:
m
c bilB i=l 1 - ,-~h,
+ (l - c, i=g+l 1 - hi/B
c + ,&h, = ” (12)
Clearly, equation (12) will be reduced to equation (7) when c = 1.
In the above formulation, we assume that ancestral sequences are known. Thus, under a given phylogenetic tree with estimated branch lengths, it is straightforward to classify a branch into Gi or Go by simply comparing the amino acids at the two ends of the branch at each site. The number of changes along the tree (m) is there- fore easily counted. Note that in Felsenstein (198 l), an- cestral sequences are integrated out since they are con- sidered unobservable. The methods for the phylogenetic reconstruction and branch length estimation have been well developed (for a recent review, see Nei 1996). The ancestral sequences can be inferred by either parsimony- or likelihood-based methods (e.g., Eck and Dayhoff 1966; Libertini and Di Donato 1994; Schluter 1995; Yang, Kumar, and Nei 1995; Koshi and Goldstein 1996; Zhang and Nei 1997). In the current study, Zhang and Nei’s (1997) algorithm is used. In this method, the ami- no acid assignment that has the highest (posterior) prob- ability is chosen to represent the inferred ancestral ami- no acids at this site.
Note that when a particular branch is very short, the least-squares estimate of the branch length can be negative because of the sampling error. In this case, the branch length is assigned to be zero in our algorithm. Since (bi/B)l( 1 - e- kbl’B) = l/k as bi = 0, the bias caused by our treatment in the zero-boundary seems trivial.
Estimation of o
If amino acid (or nucleotide) substitutions at each site follow a Poisson process, and the substitution rate A varies among sites according to the gamma distribu- tion described by equation (I), the number of sites with the occurrence of k substitutions nomial distribu tion, i.e..
follows a negative bi-
k=O,l,... (13)
(Johnson and Kotz 1969), where D is the average ber of substitutions per site along the tree.
num-
The ML approach for estimating the parameter cx from a negative binomial distribution was clearly dis- cussed by Johnson and Kotz (1969); it was also used by Sullivan, Holsinger, and Simon (1995) and Tourasse and Gouy (1997) for the rate variation among sites. In our case, the difference from the standard algorithm is that the number of substitutions at a site is replaced by its expectation, which can be estimated by equation (7) or equation (12). Therefore, the log-likelihood function can be written as
In L = 5 In I, i=l
(14)
where N is the total number of sites and iti is the estimate of the expected number of substitutions at site i, which is not necessarily an integer. One can easily show that the ML estimate of D is the same as that for the normal case, which is given by B = ~~lki/N. There is no simple solution for the estimate of (Y, but it can be numerically obtained, and the sampling variance of & can also be approximately obtained.
Implementation and Data Analysis
For aligned amino acid sequences, sites containing gaps will be excluded from further study. The current version of our algorithm assumes that the phylogenetic tree is known or can be appropriately inferred. The branch lengths for the given tree are estimated by the ordinary least-squares method using the Poisson correc- tion or the method of Ota and Nei (1994), and the an- cestral sequences can be inferred by a fast algorithm developed by Zhang and Nei (1997), in which Jones, Taylor, and Thornton’s (1992) empirical model is used for computing the (posterior) probability of each amino acid assignment at ancestral nodes for a given site. Then we can estimate the expected number of substitutions for each site by equation (7) or equation (12), and we can estimate CY by numerically maximizing the likeli- hood function of equation (14). We have also developed a similar algorithm for DNA sequences.
When the gamma parameter (x is estimated, the evolutionary distance corrected for the rate variation among sites can be estimated (e.g., Jin and Nei 1990; Tamura and Nei 1993; Gu and Li 1996; Tourasse and Gouy 1997; Gu 1997). Some useful distance measures for both amino acid and DNA sequences are summa- rized in table 1. These distance measures can be used for phylogenetic reconstruction, constant-rate testing, and divergence time estimation. For example, the effect of among-site rate variation on the phylogenetic infer- ence can be examined by using an iterative algorithm: (1) the first tree is inferred assuming a uniform rate among sites; and (2) the parameter (Y is estimated by the current method based on the first tree, and then the phy- logeny is inferred by using these improved distances. The effect of among-site rate variation is nontrivial if these two trees are significantly different. Additional it- erations may be needed to reach the convergence.
Table 2 shows the estimates of 01 of 13 proteins encoded by mammalian mitochondrial genomes by the
A Method for Estimating Substitution Rate Variation Among Sites 1109
Table 1 Table 2 Evolutionary Distances When the Rate Varies Among Estimates of the Gamma Shape Parameter (a) of 13 Sites According to a Gamma Distribution Proteins Encoded by Mammalian Mitochondrial Genomes
Methods”
DNA
Distances” METHODS"
GENES Moments Sullivan YK New Likelihood
JC . . . . . . . . . . . d = %a[(1 - 4,/3))“, - 1) K2P . . . . . . . . . d = %a[2(1 - 2P - Q)-“” + (1 - 2Q)-“” - 31 TN . . . . . . . . . . d = ha[(l - p/h)-“” - l] SRV . . . . . . . . . d = c:= ,Ck(Zk”a - 1)
Protein
Poisson . . . . . . d = a[(1 - p)-“0 - l] JC-protein . . . . d = 0.95o[(l - p/0.95)-“” - I] Gu97 . . . . . . . . d = 0.83a[(l - ~/0.83))“~ - l]
d Methods: For DNA sequences, JC (Jukes and Cantor 1969); K2P (Kimura 1980) TN (Tajima and Nei 1984), and SRV (Gu and Li 1996). For protein sequences, see Ota and Nei (1994) for Poisson and JC-protein models; Gu97 refers to Gu (1997), which approximates Dayhoff’s model.
Atp6. Atp8. Cal.. co2.. co3.. Cytb . Ndl . Nd2 . Nd3 . Nd4 . Nd41. Nd5 . Nd6 .
. . 2.58
. . 51.02
. . 0.78
. . 1.89
. . 0.57
. . 1.35
. . 3.82
. . 22.41
. . 2.13
. . 2.50
. . 7.05
. . 3.15
. . 13.50
2.02 1.06 0.64 0.55 5 1.02 43.60 1.48 0.92
0.65 0.39 0.21 0.27 1.76 0.99 0.22 0.49 0.5 1 0.32 0.20 0.19 0.94 0.55 0.43 0.36 2.77 1.27 0.61 0.57
20.75 3.35 1.31 0.90 1.86 1.03 0.45 0.34 2.06 1.11 0.62 0.57 5.31 1.77 0.85 0.79 2.37 1.18 0.78 0.61
12.76 2.86 1.06 0.90
h Parameters: cx is the gamma distribution parameter defined by equation (1); p is the proportion of nucleotide or amino acid differences between two sequenc- es; P and Q are the proportions of transitions and transversions, respectively; h = 1 - c;=, ff, where A is the frequency of nucleotide i. In the SRV (nine- parameter) model, the constants ck and the eigenvalues z,~ are related to the transition probability matrix of nucleotide substitutions (for details, see Gu and Li 1996).
NOTE.-The protein sequences of the rat, mouse, cow, fin whale, and blue whale were used in the estimation; the (unrooted) phylogenetic tree was ((rat, mouse), cow, (fin whale, blue whale)).
d Methods: moments (e.g., Tamura and Nei 1993) and Sullivan (Sullivan, Holsinger, and Simon 1995) are parsimony-based; YK is Yang and Kumar’s (1996) method; and likelihood is Yang’s (1994) algorithm based on the discrete- gamma distribution.
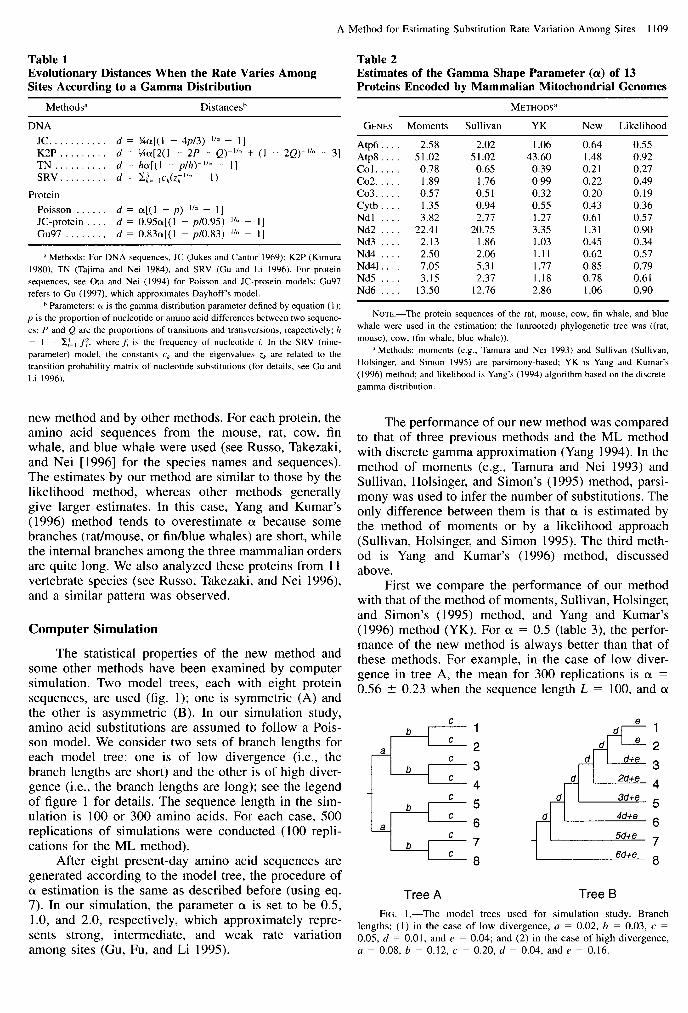
new method and by other methods. For each protein, the amino acid sequences from the mouse, rat, cow, fin whale, and blue whale were used (see Russo, Takezaki, and Nei [ 19961 for the species names and sequences). The estimates by our method are similar to those by the likelihood method, whereas other methods generally give larger estimates. In this case, Yang and Kumar’s (1996) method tends to overestimate cx because some branches (rat/mouse, or fin/blue whales) are short, while the internal branches among the three mammalian orders are quite long. We also analyzed these proteins from 11 vertebrate species (see Russo, Takezaki, and Nei 1996), and a similar pattern was observed.
The performance of our new method was compared to that of three previous methods and the ML method with discrete gamma approximation (Yang 1994). In the method of moments (e.g., Tamura and Nei 1993) and Sullivan, Holsinger, and Simon’s (1995) method, parsi- mony was used to infer the number of substitutions. The only difference between them is that (x is estimated by the method of moments or by a likelihood approach (Sullivan, Holsinger, and Simon 1995). The third meth- od is Yang and Kumar’s (1996) method, discussed above.
Computer Simulation
The statistical properties of the new method and some other methods have been examined by computer simulation. Two model trees, each with eight protein sequences, are used (fig. 1); one is symmetric (A) and the other is asymmetric (B). In our simulation study, amino acid substitutions are assumed to follow a Pois- son model. We consider two sets of branch lengths for each model tree: one is of low divergence (i.e., the branch lengths are short) and the other is of high diver- gence (i.e., the branch lengths are long); see the legend of figure 1 for details. The sequence length in the sim- ulation is 100 or 300 amino acids. For each case, 500 replications of simulations were conducted (100 repli- cations for the ML method).
First we compare the performance of our method with that of the method of moments, Sullivan, Holsinger, and Simon’s (1995) method, and Yang and Kumar’s (1996) method (YK). For CY = 0.5 (table 3), the perfor- mance of the new method is always better than that of these methods. For example, in the case of low diver- gence in tree A, the mean for 300 replications is 01 = 0.56 _+ 0.23 when the sequence length L = 100, and (x
After eight present-day amino acid sequences are generated according to the model tree, the procedure of cx estimation is the same as described before (using eq. 7). In our simulation, the parameter 01 is set to be 0.5, 1.0, and 2.0, respectively, which approximately repre- sents strong, intermediate, and weak rate variation among sites (Gu, Fu, and Li 1995).
C b 1 _
C 2 2
c b 3
C 4
C b 5 _
c a 6
C b 7
C 8
e
6d+e
Tree A Tree B FIG. l.-The model trees used for simulation study. Branch
lengths: (1) in the case of low divergence, a = 0.02, b = 0.03, c = 0.05, d = 0.01, and e = 0.04; and (2) in the case of high divergence, a = 0.08, b = 0.12, c = 0.20, d = 0.04, and e = 0.16.

1110 Gu and Zhang
Table 3 Simulation Results in the Case of (Y = 0.5
Low DIVERGENCE HIGH DIVERGENCE
METHOD 100 a.a 300 a.a 100 a.a 300 a.a
Tree A
Moments . . . . . . . . . . . . . 0.92 ? 0.67 0.79 + 0.20 1.37 + 0.32 1.34 -’ 0.17 Sullivan. . . . . . . . . . . . . . 0.83 * 0.70 0.71 2 0.20 0.98 + 0.26 0.83 2 0.13 YK.................. 0.60 + 0.40 0.53 ? 0.14 0.70 2 0.16 0.67 Ifr 0.08 Maximum likelihood . . . 0.52 + 0.34 0.51 + 0.14 0.52 + 0.12 0.54 + 0.07 New. . . . . . . . . . . . . . . . . 0.56 2 0.23 0.51 + 0.12 0.67 ‘-’ 0.15 0.66 2 0.08
Tree B
Moments . . . . . . . . . . . . . 0.98 + 0.70 0.86 ? 0.22 1.45 t 0.32 1.40 + 0.18 Sullivan. . . . . . . . . . . . . . 0.89 2 0.68 0.76 + 0.22 1.05 ? 0.26 0.99 2 0.14 YK.................. 0.64 ? 0.40 0.57 _+ 0.16 0.74 ? 0.16 0.71 _’ 0.09 Maximum likelihood . . . 0.53 -+ 0.31 0.50 + 0.15 0.52 + 0.11 0.53 -+ 0.07 New. . . . . . . . . . . . . . . . . 0.51 t 0.23 0.48 + 0.11 0.62 ? 0.15 0.60 -’ 0.07
NOTE.--see table 2 footnote for abbreviations of methods.
= 0.5 1 + 0.12 when L = 300; the number after + is the sequare root of the sampling variance of the esti- mate. When the divergence is high, our method is also better than other methods, although the estimation bias is generally larger than that in the case of low diver- gence. Indeed, when the branch lengths are long,_ the estimate of the expected number of substitutions (k) is subject not only to large sampling variance but also to the error of ancestral sequence inference (Zhang and Nei 1997). A similar pattern has been observed in the case of 01 = 1.0 and (x = 2.0 (see tables 4 and 5, respec- tively).
Two parsimony methods, the method of moments (Tamura and Nei 1993) and Sullivan, Holsinger, and Simon’s (1995) method, tend to overestimate (x in all cases. Wakeley (1993) obtained a similar result in the case of short-term (within-population) evolution. As ex- pected, the bias of these methods increases with increas- ing (Y, increasing divergence, or decreasing sequence length. Generally, the estimation bias is more serious in the case of tree B than in that of tree A, indicating that the number of substitutions in a long branch can be se- riously underestimated by the parsimony method.
Table 4 Simulation Results in the Case of (Y = 1.0
The performance of YK is much better than that of the two parsimony methods. However, as shown in ta- bles 3-5, the estimation bias of YK is generally larger than that of our method. The performance difference between our method and YK is more significant in the case of tree B than in that of tree A. This result is not surprising, because in YK, equal branch length is as- sumed.
Remarkably, for all cases we have examined, the performance of our method is very close to that of the ML method (Yang 1994). When 01 is small (e.g., 0.5), the estimation bias of the ML method is slightly smaller than that of our method. However, this is not always the case when (Y is larger (1 .O or 2.0); indeed, in some cases, our method is slightly better than the ML method. Over- all, the sampling variances of the estimate are quite sim- ilar between the two methods. Therefore, since our method requires much less computational time than the ML method, it is useful in large-sequence data analysis.
The total computational time required for our meth- od includes that for least-squares estimation of branch length, ancestral sequence inference, and estimation of m, k, and (x, among which ancestral sequence inference
Low DIVERGENCE HIGH DIVERGENCE
METHOD 100 a.a 300 a.a 100 a.a 300 a.a
Tree A
Moments . . . . . . . . . . . . . 2.69 5 4.59 1.76 + 1.36 2.85 2 1.06 2.68 ? 0.50 Sullivan. . . . . . . . . . . . . . 3.01 ? 8.22 1.65 t 1.37 2.27 ? 0.93 2.10 + 0.42 YK.................. 2.05 2 7.74 1.14 + 0.54 1.39 IT 0.41 1.33 2 0.21 Maximum likelihood . . . 1.32 ? 1.20 1.09 + 0.55 1.06 ? 0.28 1.01 + 0.17 New. . . . . . . . , . . . . . . . . 1.13 ? 0.77 0.98 +- 0.33 1.28 2 0.34 1.26 + 0.19
Tree B
Moments . . . . . . . . . . . . . 3.13 5 5.83 1.92 + 0.98 3.17 + 1.44 2.92 -+ 0.54 Sullivan. . . . . . . . . . . . . . 3.61 ? 9.75 1.80 2 0.98 2.57 + 1.28 2.32 ? 0.47 YK.................. 2.31 !I 7.33 1.24 5 0.54 1.52 2 0.48 1.44 2 0.23 Maximum likelihood . . . 1.32 ” 1.16 1.04 ? 0.38 1.04 2 0.30 1.02 + 0.16 New. . . . . . . . . . . . . . . . . 1.13 2 1.64 0.88 ? 0.25 1.14 + 0.28 1.11 ? 0.14

A Method for Estimating Substitution Rate Variation Among Sites 1111
Table 5 Simulation Results in the Case of (Y = 2.0
METHOD
Low DIVERGENCE HIGH DIVERGENCE
100 a.a 300 a.a 100 a.a 300 a.a
Tree A
Moments. ......... Sullivan. .......... YK ............... Maximum likelihood New. .............
Tree B
Moments .......... Sullivan. .......... YK ............... Maximum likelihood New. .............
. . 4.87 ? 7.86
. . 5.88 t 8.22
. . 3.28 ? 7.74
. . 2.20 ? 1.10
. . 2.53 -+ 0.77
. . 6.75 + 10.5
. . 8.92 2 18.4
. . 6.03 2 16.1
. . 2.32 t 3.17
. . 2.16 ? 3.67
5.13 + 6.43 5.22 + 7.22 2.96 2 5.10 2.06 + 0.44 1.90 + 0.98
6.28 2 8.97 6.40 + 10.1 3.44 ? 7.04 2.34 + 1.54 1.64 2 0.82
8.92 t 8.95 8.45 ? 10.0 3.66 + 6.95 2.35 2 1.61 2.60 t 1.12
10.3 + 9.90 10.0 5 11.5 4.14 + 7.18 2.22 + 1.01 2.10 IT 0.71
7.19 ? 4.12 6.25 + 4.08 2.84 ” 0.70 2.22 2 1.13 2.46 % 0.50
8.71 2 4.45 7.72 -+ 4.38 3.22 -+ 0.82 2.05 -+ 0.44 1.99 ? 0.32
NOTE.-see table 2 footnote for abbreviations of methods.
is the speed-limiting factor. When Zhang and Nei’s (1997) algorithm is implemented, the CPU time required by all steps is only a few seconds, even for more than 20 sequences. We compared the (relative) CPU time of our method with that of Yang’s (1994) discrete gamma method. For the model trees used for simulation, our method is, on average for all cases, over 100 times faster than Yang’s (1994) method. When more sequences are used, the difference in speed between our method and the ML method is expected to be much greater.
Discussion
In this paper, we have developed an efficient meth- od for estimating rate variation among sites (the gamma distribution parameter a). There are several simple methods available for estimating (x (e.g., Uzzel and Cor- bin 197 1; Tamura and Nei 1993; Sullivan, Holsinger, and Simon 1995; Tourasse and Gouy 1997). The dis- tinction of the new method is that the parsimony prin- ciple, which tends to underestimate the number of sub- stitutions, is not used. Instead, a likelihood approach has been implemented in the new method for estimating the expected number of substitutions, which is used for es- timating (x. Use of an efficient algorithm for inferring the ancestral sequences (Zhang and Nei 1997) is also important in this procedure. Computer simulation has shown that our method is generally better than the par- simony-based methods.
Since it is less problematic to infer m by the par- simony method, Yang and Kumar (1996) suggested that the likelihood of the number of changes (m) be used to estimate (x. However, in their method, one has to assume that all the branches of the tree are of equal length; otherwise, the search for the ML estimate of (x is no longer fast. Therefore, as shown by the example and simulation results, Yang and Kumar’s (1996) method could be biased in some cases. In this sense, our method is better, because it does not have such a problem.
The ML methods developed by Yang (1993, 1994) and Gu, Fu, and Li (1995) for estimating cx have nice statistical properties but require much computational time. Indeed, failure to handle large data sets will limit
our understanding of molecular evolution at the genome level. Since our new method performs virtually as well as the ML method, and also as fast as parsimony meth- ods, it is particularly useful when one needs to estimate the parameter 01 from many homologous sequences, or study the genomic feature of rate variation among sites by analyzing many independent genes. On the other hand, we have also recognized that our computational ability in sequence analysis has recently been signifi- cantly improved so that some sophisticated algorithms can be implemented in practice.
Our method can be easily extended to the case of the invariant + gamma model (Gu, Fu, and Li 1995), which takes invariant sites into account. Tourasse and Gouy (1997) developed an algorithm for estimating 01 and the proportion of invariant sites 8 based on an “in- variant + truncated negative binomial” distribution. Ap- parently, the estimation bias in Tourasse and Gouy’s (1997) method caused by parsimony can be efficiently corrected by using our algorithm (e.g., eq. 7). Unfortu- nately, as shown by Gu, Fu, and Li (1995) and Tourasse and Gouy (1997), the estimates under the invariant + gamma model are subject to large sampling variance except for very large numbers of sequences. Because of the importance of invariant sites in molecular evolution (e.g., rDNA), further study seems necessary.
Our method relies on the accuracy of the ancestral sequence inference. In our implementation, we use Zhang and Nei’s (1997) algorithm rather than others (e.g., Eck and Dayhoff 1966; Libertini and Di Donato 1994; Schluter 1995; Yang, Kumar, and Nei 1995; Koshi and Goldstein 1996) because it is computationally fast and robust against many factors such as substitution model, the phylogenetic tree, and the rate variation among sites. Our study provides a good example of the importance of developing a fast algorithm from the viewpoint of practice (Nei 1996). For example, in prin- ciple, Zhang and Nei’s (1997) and Yang, Kumar, and Nei’s (1995) methods are the same, and their perfor- mances are almost identical. Although Yang, Kumar, and Nei’s (1995) method is statistically nice because the unknown parameters (e.g., branch lengths) are estimated

1112 Gu and Zhang
by the ML method, it is not suitable for our purposes because it requires too much computational time.
When equation (7) or equation (12) is used to es- timate the expected number of substitutions, the branch lengths along the tree should be estimated first. In our algorithm, the rate variation among sites is not consid- ered in this step, so the branch length could be under- estimated. However, our simulation study has shown that the estimation bias caused by this problem is non- trivial only when some very divergent sequences are involved and (x is very small (data not shown). If this is the case, the bias can be corrected by using one or two iterations, which is an option in our program.
In our meth_od, we estimate the expected number of substitutions (k) for each site when ancestral sequenc- es are inferred. Nielsen (1997) studied how to estimate the substitution rate site-by-site under the framework of Felsenstein (198 1). However, Nielsen’s estimation seems to be subject to large sampling variance and bias; at some sites, the rate can be estimated to be as large as 03. Our approach has no such problem. A modified like- lihood approach was proposed by Nielsen (1997) by in- troducing a prior distribution of rate, but it needs to “empirically” estimate the prior distribution first.
Although a great effort has been made to determine how to estimate the gamma parameter (x, the biological meaning of the model for rate variation among sites has not been well investigated. Indeed, gamma distribution has been suggested to model the among-site rate varia- tion mainly because it seems to fit the pattern of rate variation well and is also mathematically simple. There- fore, the gamma distribution model is designed for sta- tistical approximation rather than for a biological entity. In addition, current models always assume that the sub- stitution rate, although it varies among sites, is the same among various evolutionary lineages at a given site. This implies that the functional role of each amino acid residue should not be changed in evolution, i.e., there is no functional divergence. Thus, it may be problematic to apply this model for gene family evolution because of the possible functional divergence among paralogous genes. Another problem concerns the biological mean- ing of CX. Since (x is usually interpreted as an index of the rate variation among sites, it is expected that, for a particular gene, (x should be a constant during evolution. The methodology we have developed in this paper pro- vides an efficient tool for investigating these important issues.
Program Availability
A computer program for estimating the gamma shape parameter 01 and evolutionary distances from ami- no acid or DNA sequences is available on request.
Acknowledgments
We are grateful to Masatoshi Nei and Sudhir Ku- mar for helpful comments. This work was supported by research grants from the NIH and NSF to M. Nei.
LITERATURE CITED
ECK, R. V., and M. 0. DAYHOFF. 1966. Atlas of protein se- quences and structure. National Biomedical Research Foun- dation, Washington, D.C.
FELSENSTEIN, J. 198 1. Evolutionary trees from DNA sequenc- es: a maximum likelihood approach. J. Mol. Evol. 17:368- 376.
FITCH, W. M. 1971. Toward defining the course of evolution: minimum change for a specific tree topology. Syst. Zool. 20:406-4 16.
Gu, X. 1997. The age of common ancestor of eukaryotes and prokaryotes: statistical inferences. Mol. Biol. Evol. 14:861- 866.
Gu, X., Y. X. Fu, and W. H. LI. 1995. Maximum likelihood estimation of the heterogeneity of substitution rate among nucleotide sites. Mol. Biol. Evol. 12546-557.
Gu, X., and W. H. LI. 1996. A general additive distance with time-reversibility and rate variation among nucleotide sites. Proc. Natl. Acad. Sci. USA 93:4671-4676.
HOLMQUIST, R., M. GOODMAN, T. CONROY, and J. CZELUS- NIAK. 1983. The spatial distribution of fixed mutations with- in genes coding for proteins. J. Mol. Evol. 19:437-448.
HUELSENBECK, J., and D. M. HILLIS. 1993. Success of phylo- genetic methods in the four-taxon case. Syst. Biol. 42:247- 264.
JIN, L., and M. NEI. 1990. Limitations of the evolutionary par- simony method of phylogenetic analysis. Mol. Biol. Evol. 7:82-102.
JOHNSON, N. L., and S. KOTZ. 1969. Discrete distributions. Houghton Mifflin, Boston.
JONES, D. T., W. R. TAYLOR, and J. M. THORNTON. 1992. The rapid generation of mutation data matrices from protein se- quences. Comput. Appl. Biosci. 8:275-282.
JUKES, T. H., and C. R. CANTOR. 1969. Evolution of protein molecules. Pp. 21-32 in H. R. MUNRO, ed. Mammalian pro- tein metabolism. Vol. 3. Academic Press, New York.
KELLY, C., and J. RICE. 1996. Modeling nucleotide evolution: a heterogeneous rate analysis. Math. Biosci. 133:85-109.
KIMURA, M. 1980. A simple method for estimating evolution- ary rate of base substitutions through comparative studies of nucleotide sequences. J. Mol. Evol. 16: 11 l-120.
KOSHI, M., and R. A. GOLDSTEIN. 1996. Probabilistic recon- struction of ancestral protein sequences. J. Mol. Evol. 42: 313-320.
LARSON, A. 199 1. Evolutionary analysis of length-variable se- quences: divergent domains of ribosomal RNA. Pp. 221- 248 in M. M. MIYAMOTO and J. CRACRAFT, eds. Phyloge- netic analysis of DNA sequences. Oxford University Press, Oxford.
LIBERTINI, G., and A. Dr DONATO. 1994. Reconstruction of ancestral sequences by the inferred method, a tool for pro- tein engineering studies. J. Mol. Evol. 39:219-229.
MIYAMOTO, M. M., and W. M. FITCH. 1996. Constraints on protein evolution and the age of the eubacteria/eukaryote split. Syst. Biol. 45:568-575.
NEI, M. 1996. Phylogenetic analysis in molecular evolutionary genetics. Annu. Rev. Genet. 30:371-403.
NIELSEN, R. 1997. Site-by-site estimation of the rate of substi- tution and the correlation of rates in mitochondrial DNA. Syst. Biol. 461346-357.
OTA, T., and M. NEI. 1994. Estimation of the number of amino acid substitutions per site when the substitution rate varies among sites. J. Mol. Evol. 38:642-643.
Russo, A. M., N. TAKEZAKI, and M. NEI. 1996. Efficiencies of different genes and different tree-building methods in

A Method for Estimating Substitution Rate Variation Among Sites 1113
recovering a known vertebrate phylogeny. Mol. Biol. Evol. 13525-536.
SCHLUTER, D. 1995. Uncertainty in ancient phylogenies. Na- ture 377: 108-109.
SULLIVAN, J., K. E. HOLSINGER, and C. SIMON. 1995. Among- site rate variation and phylogenetic analysis of 12s rRNA in Sigmontine rodents. Mol. Biol. Evol. 12:988-1001.
TAJIMA, E, and M. NEI. 1984. Estimation of evolutionary dis- tances between nucleotide sequences. Mol. Biol. Evol. 1: 269-285.
TAMURA, K., and M. NEI. 1993. Estimating of the number of nucleotide substitutions in the control region of mitochon- drial DNA in humans and chimpanzees. Mol. Biol. Evol. 10:5 12-526.
TATENO, Y., N. TAKEZAKI, and M. NEI. 1994. Relative effi- ciencies of the maximum-likelihood, neighbor-jointing, and maximum-parsimory methods when substitution rate varies with sites. Mol. Biol. Evol. 11:261-277.
TOURASSE, N., and M. GOUY. 1997. Evolutionary distances between nucleotide sequences based on the distribution of substitution rates among sites as estimated by parsimony. Mol. Biol. Evol. 14:287-298.
UZZEL, T., and K. W. CORBIN. 1971. Fitting discrete probability distributions to evolutionary events. Science 172: 1089- 1096.
WAKELEY, J. 1993. Substitution rate variation among sites in hypervariable region 1 of human mitochondrial DNA. J. Mol. Evol. 37:613-623.
YANG, Z. 1993. Maximum-likelihood estimation of phylogeny from DNA sequences when substitution rates differ over sites. Mol. Biol. Evol. 10:1396-1401.
. 1994. Maximum likelihood estimation of phylogeny from DNA sequences when substitute rates differ over sites: approximate methods. J. Mol. Evol. 39:306-314.
- 1996. Among-site rate variation and its impact on phy- logenetic analysis. Trends Ecol. Evol. 11:367-372.
YANG, Z., and S. KUMAR. 1996. Approximate methods for es- timating the pattern of nucleotide substitution and the vari- ation of substitution rates among sites. Mol. Biol. Evol. 13: 650-659.
YANG, Z., S. KUMAR, and M. NEI. 1995. A new method of inference of ancestral nucleotide and amino acid sequences. Genetics 141:1641-1650.
ZHANG, J., and M. NEI. 1997. Accuracies of ancestral amino acid sequences inferred by the parsimony, likelihood, and distance methods. J. Mol. Evol. 44(Suppl. l):S139-S146.
MARCY K. UYENOYAMA, reviewing editor
Accepted August 5, 1997