a simple self-rating assessment method of residual work capability for occupational permanent...
TRANSCRIPT

AMERICAN JOURNAL OF INDUSTRIAL MEDICINE 38:539±547 (2000)
A Simple Self-Rating Assessment Method ofResidual Work Capability for Occupational
Permanent Disabilities
Yu-Chen Chang, MD,1 Mei-Jin ChenSea, ScD,2 Yuh Jang, OTR, MHE,3
and Jung-Der Wang, MD, ScD1,4�
Background To explore the validity, reliability, and determinants of a simple self-rating assessment method of residual work capability (RWC) after occupationalpermanent disabilities.Methods Five hundred and thirty-nine compensated permanent disability workersanswered three consecutive visual analogue questionnaires wherein they self-rated theirresidual work capability in terms of speed (RWCS), quality (RWCQ) and a combinationof speed and quality (RWCC). At two major hospitals in Taiwan, 169 of these subjectswere evaluated with physical capacity assessment (PCA), cognition and sensationassessment (CSA), the work ability index (WAI), and the 12-item Chinese healthquestionnaire (CHQ-12).Results High test±retest reliability (Pearson's correlation coef®cient 0.77) andsatisfactory concurrent validity were shown for RWCS and RWCC. All PCA, CSA andWAI showed signi®cant correlation with RWCs, while CHQ-12 displayed borderlinecorrelation. Employment status after injury and status of the victim's salary as the mainsource of income for his/her family before injury, were the major determinants of RWCs,in addition to the scales of PCA, CSA and WAI.Conclusions The RWCC resulting from the self-rating method may be used as a simpleassessment of a victim's residual work capability after occupational permanentdisabilities. Am. J. Ind. Med. 38:539±547, 2000. ß 2000 Wiley-Liss, Inc.
KEY WORDS: work capability; occupational injury; occupational rehabilitation
1Center for Research of Environmental and Occupational Diseases, Institute ofOccupational Medicine and Industrial Hygiene, National Taiwan University College of PublicHealth,Taipei,Taiwan
2School of Occupational Therapy, College of Medicine, National Cheng Kung University,Tainan,Taiwan
3School of Occupational Therapy, College of Medicine, National Taiwan University, Taipei,Taiwan
4Department of Internal Medicine, National Taiwan University HospitalAbbreviations: RWCS, Residual work capability (in percentage points) of work-
productivity in terms of speed compared with that before the injury by respondent's self-rating on a visual analogue rating scale; RWCQ, Residual work capability (in percentagepoints) of work productivity in terms of quality compared with that before the injury byrespondent's self-rating on a visual analogue rating scale; RWCC, Residual work capability(in percentage points) of work productivity in terms of a combination of speed and quality
compared with that before the injury by respondent's self-rating on a visual analogue ratingscale; PCA: Physical capacity assessment of subjects by occupational therapists; WAI,Finnish work ability index, CSA: Cognition and sensation assessment, CHQ-12; Chinesehealth questionnaire, 12-items version, ERWC; Estimation of residual work capability fromworkmen's compensation scheme as enforced by the Taiwan Labor Law (1,800 lostworkdays, assuming100% loss of work capability, serves as the baseline for ERWC)
Contract grant sponsor: The Council of LaborAffairs, ExecutiveYuan, ROC; Contract grantnumber: IOSH-84-M203
*Correspondence to: Dr. Jung-Der Wang, Center for Research of Environmental andOccupational Diseases, Institute of Occupational Medicine and Industrial Hygiene, NationalTaiwan University College of Public Health, No. 1, Section1, Jen-Ai Road,Taipei,Taiwan, ROC.10016. E-mail: [email protected]
Accepted 7 January 2000
ß 2000Wiley-Liss, Inc.

INTRODUCTION
Measuring the impact of severe occupational injuries
solely with mortality rates is an inadequate indicator. In the
past decade in Taiwan, the average ratio of deaths-to-
permanent disabilities from occupational injury was about
1:3.5 [Bureau of Labor Insurance for Taiwan-Fukein Area,
1984±1994]. Presently, due to the complex combinations of
various impairments of a victim's physical, mental and/or
other health conditions after permanent injury, there is still a
lack of consensus on a single index to represent the severity
of permanent disability [Tuomi et al., 1994]. Although the
disabling severity rate has been widely adopted as an
indicator for quantifying work disability from occupational
injury [American National Standards Institute, 1967], the
arbitrary weighting factors applied to conditions of
permanent disability indicate the need for further studies
to develop alternative quanti®cation methods [Chang and
Wang, 1995]. Furthermore, the indices of residual work
capability from different occupational permanent disabil-
ities would assist in estimating the cost of occupational
injuries to human resources and accounting [Gojer and
Johanson, 1991].
Determining a healthy worker's real work capability is
a dif®cult task and probably cannot be measured by a single
®gure [Tuomi et al., 1994; Chang and Wang, 1995]. Several
authors have pointed out that work capability usually
involves activities related to personal care, mobility, sensory
perception, communication, recreation, socializing, and
intimacy, according to the de®nition of work capability
[Gulick, 1992]. It is also related to mental and intellectual
status, psychological distress, individual work environment,
various industrial and occupational requirements, and even
personal demographic characteristics [Abdel-Moty et al.,
1993; Velozo, 1993]. Methods that measure certain dimen-
sions of work capability, such as functional capacity [Abdel-
Moty et al., 1993], physical performance components,
[Mathiowetz, 1993] or physical work performance [Lechner
et al., 1994], are generally considered to be insuf®cient
measurements of real work capability [Velozo, 1993; Tuomi
et al., 1994].
The work ability index (WAI), developed by the Finnish
Institute of Occupational Health [Tuomi et al., 1994], may
be the only instrument with high validity which can evaluate
the subjective work ability of a worker with an integrated
number during longitudinal follow-up. However, as injuries
often result from unexpected accidents, the WAI may not be
directly used for the assessment of residual work capability
unless one has baseline data. It requires at least two
measurements of the individual WAI before and after the
injury event. In addition, we must assume that WAI is a
linear scale to obtain the residual percentage of work ability.
To confront the above dif®culties, we chose to examine
the concept of self-comparison and bypass multi-dimen-
sional measurements by directly asking subjects to self-rate
his/her own RWC on speed and quality. The aim of this
study was to introduce and to validate a simple subjective
rating method for determining RWC after permanent
occupational disability. To validate the new method, we
simultaneously applied the measurements of WAI (an
overall index), physical capacity assessment (PCA), and
cognition and sensation assessment (CSA) for comparison.
MATERIALS AND METHODS
Subjects
There were 14,084 compensated cases of traumatic
occupational permanent disability (11,050 men and 3,034
women) in Taiwan from January 1990 through December
1992, as shown in Table I. All disabilities were diagnosed
and classi®ed by certi®cate based on 160 well-de®ned
conditions listed in the Workmen's Compensation Scheme
of Taiwan. These were then categorized into 15 severity
grades of permanent disability for the convenience of
compensation payment [Regulation of Labor Insurance,
1992]. The ®rst grade of permanent disability corresponds to
the permanent total disability of the American National
Standards Institute (ANSI) system, and the other 14 grades
of permanent disability correspond to ANSI's permanent
partial disability. Strati®ed random sampling was performed
according to gender, the calendar year in which occupa-
tional injuries occurred and the 15 severity grades of
permanent disability. A total of 2,145 (1,299 men and 846
women) permanent disability workers from nine industrial
sectors were drawn from the archives of the compensation
registry of the Taiwan Labor Insurance Bureau from January
1990 through December 1992.
Instrumentation
A questionnaire on residualwork capability
A questionnaire was constructed and mailed to the
selected subjects about their residual work capability after
occupational injury. By dividing work capability into two
major domains, the speed of completing a task and the
quality of execution, the questionnaire was designed to draw
a percentage pro®le of the RWC for injured and compen-
sated workers. The questions, as literally translated from
Chinese, are as follows: First question, `̀ Please mark the
appropriate percentage on the following rating scales which
represents your residual work capability relating to
productivity in terms of your current speed compared with
that before the injury'' (RWCS). The second question:
`̀ Please mark the appropriate percentage on the following
rating scales which represents your residual work capability
540 Chang et al.

relating to productivity in terms of the quality of your work
compared with that before the injury'' (RWCQ). The third
question: `̀ Please mark the appropriate percentage on the
following rating scales which represents your residual work
capability relating to productivity in terms of a combination
of both speed and quality compared with that before the
injury'' (RWCC). Each question was presented with a visual
analogue rating scale in the form of a thermometer, where
100% represented `̀ no work capability loss compared with
that before the injury'' and 0% represented `̀ total loss of
work capability'' (such as quadriplegia or complete
blindness in both eyes). The three questions were arranged
in consecutive sequences for RWCS, RWCQ and RWCC.
Additionally, it was asked whether the salary of the injured
worker was the main source income of his/her family before
the injury (IS), and whether the victim returned to work after
the injury (to either the same or a different job) (RTW). (The
full text of the questionnaires is available upon request from
the corresponding author.)
The physical capacity assessment (PCA)
The physical capacity assessment was developed for the
®eld of occupational therapy based on the physical capacity
requirements of the Dictionary of Occupational Titles, U.S.
Department of Labor [Smith, 1988]. PCA involves the
following six domains of measurements: weight capacity
assessment with four items, ¯exibility assessment with three
items, ambulatory skills with three items, static positioning
assessment with two items, hand grip and ®nger pinch of
both hands with one item each, and handling capacity with
two items each. Hand strength was measured by gripping a
dynamometer, and ®nger pinch strength was measured with
a pinch gauge. The recommendations for standardized
positioning and established procedures and instructions
were followed for each test of strength [Mathiowetz, 1990].
These tests have been reported to achieve high inter-rater
and test±retest reliability [Mathiowetz et al., 1984].
Handling capacity was assessed by both the Purdue
pegboard [Tif®n and Asher, 1948] and the Minnesota Rate
of Manipulation Test [Parry, 1972], according to standard
procedures. This scoring system yielded six raw scores for
each physical domain of capability, which were then
summed up to obtain a total score. The ranges of scores
were as follows: 0±21 for weight capacity, 0±16 for ¯exi-
bility, 0±16 for ambulatory skills, 0±6 for static positioning,
0±12 for grip and pinch, and 0±21 for handling capability.
The cognition and sensationassessment (CSA)
This assessment included two dimensions, cognition
and sensation. These were extracted and modi®ed from the
Position Analysis Questionnaire [McCormick et al., 1989].
Cognition measurement involves the ability to understand a
command, to express an idea, and to recall and perform a
command, which is scored from 4 (worst) to 16 (best).
Sensation measurement involves visual, auditory, and tactile
functions and is scored from the worst condition to the best
condition (3±12). The results of these two assessments were
all recorded by occupational therapists during the tests for
physical capacity.
The work ability index (WAI)
The WAI questionnaire developed by the Finnish
Institute of Occupational Health is composed of seven
items with 10 questions inquiring about work ability [Tuomi
et al., 1991]. The conceptual de®nition of WAI comes from
the question: `̀ How good is the worker at present, in the near
future, and how able is he or she to do his or her work with
respect to work demands, health and mental resources?''
The Chinese version that was used is a direct translation
from the English version with minimal modi®cation of
culturally relevant terms. The WAI is derived as the sum of
the seven items. The range of the WAI is 7±49. A low score
of WAI represents poorer work ability, while a high score
represents the converse. Previously, the WAI was demon-
strated to be a good predictor of the possibility of workers
receiving disability pension during a 5-year follow-up study
of 2,693 workers [Tuomi et al., 1994].
The 12-item Chinese healthquestionnaire (CHQ-12)
This questionnaire was developed from a Chinese
translation of the General Health Questionnaire [Goldberg,
1972] with the modi®cation and addition of several
specially designed, culturally relevant items [Cheng and
Williams, 1986] to improve physicians' identi®cation of
minor psychiatric disorders in Chinese patients. The four
categories of questions in the CHQ-12 cover the assessment
of (1) anxiety and depression, (2) the respondent's concern
over sleep disturbance, (3) somatic symptoms/concern, (4)
interpersonal dif®culties [Cheng and Williams, 1986; Chong
and Wilkinson, 1989; Cheng et al., 1990], with the
validation of sensitivity rate of 78% and speci®city rate of
77% [Chong and Wilkinson, 1989]. We used the CHQ-12 as
a screening questionnaire to detect the emotional distress of
the injured workers. A CHQ-12 score ranges from 0 to 36. A
low score represents less emotional distress, and a high
score represents more emotional distress.
The estimation of residualwork capability (ERWC)
The ERWC is a product of the current Workmen's
Compensation Scheme enforced in Taiwan [Regulation of
Self-Rating Residual Work Capability 541

Labor Insurance, 1992], in which the grade of permanent
disability is based on preexisting tables of lost workdays.
There are 15 grades of permanent disabilities, and the higher
the grade, the less severe the disability. For example, the ®rst
grade of permanent total disability is a complete loss of
work capability (i.e. equal to 100% loss), and the workmen's
compensation system of Taiwan pays up to 1800 lost
workdays as a baseline. We divided the corresponding
number of paid workdays lost by the same compensation
system by 1800 workdays to obtain the percentage of work
capability lost permanently. This was then subtracted from
100% to get the ERWC. For example, occupational
permanent disability resulting in above the knee amputation
of one extremity was paid up to 960 workdays for compen-
sation, which was categorized as the ®fth grade of permanent
disability. The ERWC is calculated to be 100%ÿ(960/
1800)� 46.7%. All the other 14 grades of permanent
disability were calculated in the same way to obtain the
ERWCs [Chang and Wang, 1995].
Statistical Analysis
The SAS program (version 6.08) was used for statistical
analysis [SAS, 1990]. The test±retest reliability was
evaluated by the Pearson correlation coef®cient for
consistency between responses, (3 months apart) to the
same questionnaires on residual work capability after
permanent disability. To determine concurrent criterion-
related validity, the Pearson correlation coef®cient was also
calculated to show the correlation between the RWC scores
and the scores from PCA, CSA, WAI and CHQ-12. Multiple
regression analysis was used to ®t the best-predicted models
for the RWCs as dependent variables, and the backward
selection method was used to ®nd out the major determi-
nants of the RWCs. In addition to PCA, CSA, WAI, and
CHQ-12, we also included the demographic variables (age,
gender, marital status, education) in the multiple regression
analysis to ®t the models.
Procedures
Subjects were asked and provided with instructions to
®ll out the pre-tested self-administered questionnaire
inquiring about their residual work capability after perma-
nent disability. Efforts to recruit non-responding subjects for
the questionnaire, by re-mailing and telephone follow up,
were repeated twice at 1-month intervals after mailing the
®rst questionnaire in November 1994. Among the respon-
dents who returned the questionnaire, we invited everyone
to participate in a further physical examination to be
conducted in a hospital. Similarly, two more rounds of
telephone and mail invitations were sent, at 1-month
intervals.
Subjects were asked to answer several demographic
questions and provide information on their residual work
capability due to permanently disabling injuries. The total
time needed to ®ll out the mailed questionnaire was about
15 min according to pretests. The National Taiwan Uni-
versity Hospital located in Taipei, northern Taiwan, and the
Tainan Municipal Hospital located in southern Taiwan
served as the two sites for physical examination. All
participants who attended the physical examination were
required to answer a brief version of the mailed ques-
tionnaire again, in addition to completing the tests and
questionnaires for PCA, CSA, WAI and CHQ-12. The total
time to complete the physical examination required about
1±1.5 h for each participant on average. Physical examina-
tions were performed by doctors, while the physical
capacity assessment and cognition and sensation assess-
ments were performed by occupational therapists. Labora-
tory tests included serum biochemistry, complete blood
count, and urine tests.
RESULTS
Table I summarizes the distribution of different grades
of permanent disability for frequencies of random samples,
TABLE I. Total NumberofCaseswith Permanent Disability (T),Frequencies ofRandomSamples (RS),Respondentsof Questionnaire (Q), and Participants of Physical Examination (PE) Stratified by Grade of Permanent Disability fromJanuary1990 through December1992,Taiwan
Grade of permanent disability�
1 2 3 4 5 6 7 8 9 10 11 12 13 14 15 Total
T 88 156 54 11 145 279 306 771 891 942 2,223 3,565 2,335 1,172 1,146 14,084RS 76 140 47 8 136 133 113 184 185 187 190 187 188 183 188 2,145Q 22 46 17 2 43 38 31 52 50 38 44 37 42 38 39 539PE 3 10 3 ö 14 10 8 14 15 19 11 19 16 13 14 169
*Thehigher the grade, the less severe the permanent disability.
542 Chang et al.

respondents to the mailed questionnaire, and participants of
the physical examination held at the two hospitals. There
were a total of 539 (25.1%) respondents to the mailed
questionnaire after two more cycles of re-mailing, 1 month
apart. One hundred and sixty-nine subjects out of the 539
respondents (31.2%) participated in the physical examina-
tion at the two hospitals 2 months later. Severe disabilities
included grades 1±5, e.g., mental impairment, quadriplegia,
loss of both hands, amputation at the elbow or above of at
least one upper extremity, amputation at the knee joint or
above of at least one lower extremity, etc. In general, every
year, there were less than 50 cases of each grade of severe
disability. Very few cases had been categorized as grade 4,
possibly due to dif®culty in classi®cation and/or because
few suitable conditions match grade 4 criteria, e.g., obvious
motion impairment of both upper extremities or both lower
extremities. The duration since onset of occupational injury
to date of answering the questionnaire, ranged from 2.0 to
4.9 years (mean� 3.4, SD� 0.9). 539 injured workers (330
men, 209 women, mean age 42.2, SD 12.5) responded to the
TABLE II. Comparisons of Demographic Characteristics Between Responding Workers Who Came and did notCome in for Further Physical Examination
Physical examination
Yes No P value�
No. of workers 169 370Age Mean (S.D.) 43.1 (11.9) 41.8 (12.8) 0.27
Range 22^74 19^68
Gender Male/Female 100/69 230/140 0.51
Education Illiteracy 20 48 0.90Primary school 54 126Junior high 41 75Senior high 42 87College/above 11 26
Marital status Single 25 69 0.64Married 134 265Loss of spouse 6 17Divorced 4 6Remarried 0 2
Current employment status Employed 46 87 0.78Unemployed 106 213
Grades of permanent disabilitya 1 3 19 0.242 13 333 8 94 1 15 10 336 10 287 7 248 15 379 17 3310 12 2611 21 2312 15 2213 16 2614 11 2715 10 29
*w2 t-test or test for trend.aThehigher the grade,the less severe the disability, for example,grade 1is themost severe disability.
Self-Rating Residual Work Capability 543
questionnaire and 169 (100 men, 69 women, mean age 43.1,
SD 11.9) agreed to participate in the physical examination.
A comparison of several variables between the groups who
took and those who did not take the physical examination
showed no signi®cant differences in terms of demographic
items, employment status after injury and distribution of
permanent disability grade (Table II).
The test±retest reliability (conducted 3 months later)
for a respondent's rating of his/her residual work capability,
in terms of speed (RWCS), quality (RWCQ), and combina-
tion of speed and quality (RWCC), were found to be 0.77,
0.58 and 0.77 (all P < 0:0001), respectively. The test±retest
reliability of the RWCS, RECQ and RWCC questions was
high. The internal consistency reliability of the RWCS,
RWCQ and RWCC questions with each other was high
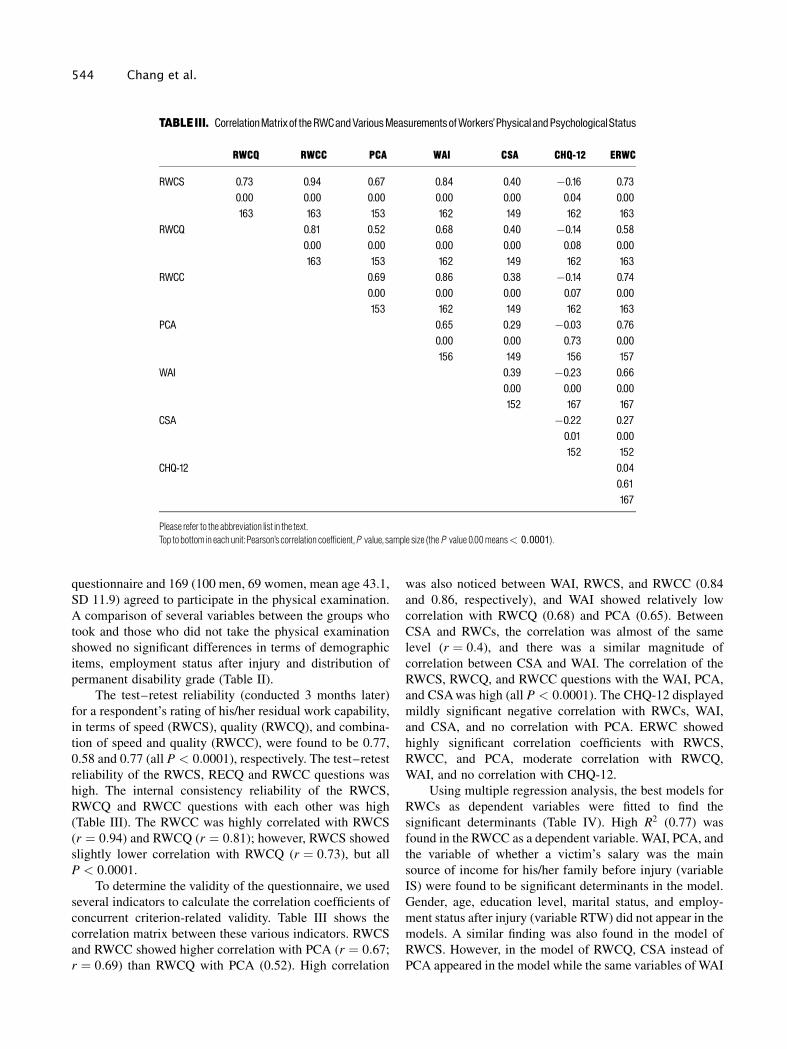
(Table III). The RWCC was highly correlated with RWCS
(r � 0:94) and RWCQ (r � 0:81); however, RWCS showed
slightly lower correlation with RWCQ (r � 0:73), but all
P < 0:0001.
To determine the validity of the questionnaire, we used
several indicators to calculate the correlation coef®cients of
concurrent criterion-related validity. Table III shows the
correlation matrix between these various indicators. RWCS
and RWCC showed higher correlation with PCA (r � 0:67;
r � 0:69) than RWCQ with PCA (0.52). High correlation
was also noticed between WAI, RWCS, and RWCC (0.84
and 0.86, respectively), and WAI showed relatively low
correlation with RWCQ (0.68) and PCA (0.65). Between
CSA and RWCs, the correlation was almost of the same
level (r � 0:4), and there was a similar magnitude of
correlation between CSA and WAI. The correlation of the
RWCS, RWCQ, and RWCC questions with the WAI, PCA,
and CSA was high (all P < 0:0001). The CHQ-12 displayed
mildly signi®cant negative correlation with RWCs, WAI,
and CSA, and no correlation with PCA. ERWC showed
highly signi®cant correlation coef®cients with RWCS,
RWCC, and PCA, moderate correlation with RWCQ,
WAI, and no correlation with CHQ-12.
Using multiple regression analysis, the best models for
RWCs as dependent variables were ®tted to ®nd the
signi®cant determinants (Table IV). High R2 (0.77) was
found in the RWCC as a dependent variable. WAI, PCA, and
the variable of whether a victim's salary was the main
source of income for his/her family before injury (variable
IS) were found to be signi®cant determinants in the model.
Gender, age, education level, marital status, and employ-
ment status after injury (variable RTW) did not appear in the
models. A similar ®nding was also found in the model of
RWCS. However, in the model of RWCQ, CSA instead of
PCA appeared in the model while the same variables of WAI
TABLEIII. CorrelationMatrixof theRWCandVariousMeasurementsofWorkers'Physical andPsychologicalStatus
RWCQ RWCC PCA WAI CSA CHQ-12 ERWC
RWCS 0.73 0.94 0.67 0.84 0.40 ÿ0.16 0.730.00 0.00 0.00 0.00 0.00 0.04 0.00163 163 153 162 149 162 163
RWCQ 0.81 0.52 0.68 0.40 ÿ0.14 0.580.00 0.00 0.00 0.00 0.08 0.00163 153 162 149 162 163
RWCC 0.69 0.86 0.38 ÿ0.14 0.740.00 0.00 0.00 0.07 0.00153 162 149 162 163
PCA 0.65 0.29 ÿ0.03 0.760.00 0.00 0.73 0.00156 149 156 157
WAI 0.39 ÿ0.23 0.660.00 0.00 0.00152 167 167
CSA ÿ0.22 0.270.01 0.00152 152
CHQ-12 0.040.61167
Please refer to the abbreviation list in the text.Top tobottom in eachunit:Pearson's correlation coefficient,P value, sample size (theP value 0.00means< 0:0001).
544 Chang et al.

and IS were retained. Although CSA and CHQ-12 were
partially correlated with all RWCs, they were replaced by
WAI in the best-®tted model. The partial R2 of each
independent variable are also displayed in Table IV. The
three models of RWCs, ®tted with independent variables
including WAI, showed a high partial R2 for WAI in each
model. Since WAI is a combined indicator including several
aspects of measurement, it is worthwhile to try to ®t the
models of the same dependent variables and the same
independent variables, with the exception of WAI. In the
models ®tted with the mentioned possible determinants
excluding WAI, we found that in addition to the PCA and IS,
the CSA and RTW entered the models with an R2 slightly
less than that of the models, including WAI with all RWCs
as dependent variables. The partial R2 of PCA and RTW
were larger than the partial R2 of IS and CSA with the
dependent variables of RWCS and RWCC. However, the
partial R2 of RTW in the RWCQ model was larger in other
models. If we took the WAI as a dependent variable and the
RWCs as independent variables, the ®tted results showed
that each RWC had a very high sum of partial R2 in each
model ®tted (� 0:93), as shown in Table V.
TABLE IV. Determinants for the Self-RatingMethod of ResidualWork Capability
Dependent Independent Parameter Standard Partialvariable variables estimate error P value R 2 R 2
Models fittedwith independent variables including theWAIRWCS Intercept ÿ26.40 5.66 0.00 0.73
WAI 2.00 0.19 0.00 0.47PCA 0.31 0.09 0.00 0.09IS 6.88 2.83 0.02 0.05
RWCQ Intercept ÿ83.97 36.67 0.02 0.49WAI 1.91 0.24 0.00 0.34CSA 3.29 1.35 0.02 0.05IS 7.19 4.26 0.09 0.02
RWCC Intercept ÿ30.83 5.36 0.00 0.77WAI 2.14 0.18 0.00 0.52PCA 0.31 0.09 0.00 0.10IS 6.91 2.68 0.01 0.05
Models fittedwith independent variables excluding theWAIRWCS Intercept ÿ96.38 28.81 0.00 0.62
PCA 0.60 0.10 0.00 0.23RTW 21.18 4.29 0.00 0.17IS 8.50 3.39 0.01 0.05CSA 2.50 1.07 0.02 0.04
RWCQ Intercept ÿ111.19 38.61 0.01 0.43PCA 0.32 0.14 0.02 0.04RTW 23.38 5.75 0.00 0.12IS 8.67 4.54 0.06 0.03CSA 4.00 1.43 0.01 0.06
RWCC Intercept ÿ87.94 28.91 0.00 0.63PCA 0.63 0.10 0.00 0.25RTW 22.96 4.31 0.00 0.19IS 8.87 3.40 0.01 0.05CSA 2.00 1.07 0.07 0.03
IS:Whether the victim's salary was themain source ofhis/her family before injury (1�yes,0� no).RTW:Whether the victimreturned towork after injury (1�yes,0� no).For other abbreviations,please refer to the abbreviation list in the text.Thedemographic variables (age,gender,maritalstatus, andeducation)wereconsideredin theseanalysesbutwerenotsignificant.Only significantpredictors are shownhere.
Self-Rating Residual Work Capability 545

DISCUSSION
Since the response rates for the questionnaire and
physical examination were 25.1 and 32.1%, respectively,
there was concern about sample representation. However,
by performing strati®ed random sampling according to
variables of grade of permanent disability and gender, we
eliminated any skewed distributions of disabilities for these
two factors. The numbers of respondents to the question-
naire at different grades of disabilities exceeded 30 except in
three strata, (i.e., grades 1, 3, and 4) which were probably
adequate to show the variance for each stratum. Moreover,
in terms of severity grades of occupational permanent
disability and various demographic factors, there was no
signi®cant difference between the respondents who came
and who did not come in for physical examination, as
summarized in Table II. Thus, although we must be
conservative in the generalization of the survey results, it
might not affect the validation of the newly developed
method, as the frequencies for different grades of permanent
disabilities were large enough.
In this study, we tried to use the subjective rating
method to measure an individual's residual work capability
after occupational permanent disabilities. Instead of objec-
tively assessing the multidimensional aspects of human
work capability, we tried to ask the subject to compare his
current work capability with that before the injury. Although
our method could not be used to directly measure a healthy
worker's work capability, it did show the subjective rating
score of the residual work capability of a victim after injury.
We asked victims to self-rate their residual work
capability in terms of speed, quality, and overall (combina-
tion of speed and quality) work capability (in that order).
This self-rating method seemed to quantify their perfor-
mance effectively as shown in Tables III and IV. Measure-
ments of residual work capability were found to have high
correlation coef®cients not only with the similarly sub-
jective WAI, but also with the more objective PCA and
CSA, as performed by occupational therapists. The correla-
tion of the RWCS, RWCQ, and RWCC questions with the
WAI, PCA, and CSA was high (all P < 0:0001). We believe
we have demonstrated satisfactory convergent validity for
this self-rating assessment method of residual work
capability with WAI, PCA, and CSA. The divergent validity
with CHQ-12 also corroborated the self-rating method, as
the CHQ-12 only measured the emotional aspect of Chinese
people. The results of model ®tting in Table IV further
indicated that the perceived RWCs among workers with
permanent disabilities are composite indices of physical or
functional capacity, the victim's employment status after the
occupational injury, the status of the victim's salary as the
main source of his/her family income before injury, and the
CSA. All these ®ndings were consistently found in RWCS,
RWCQ, and RWCC, with the RWCC being the most
quali®ed single indicator for perceived residual work
capability (Table IV).
The test±retest reliability of RWCQ was only 0.58,
which was lower than those of RWCS and RWCC. Because
71% (Table II) of respondents were unemployed at the time
of our study, it was probably somewhat dif®cult for them to
make consistent subjective judgments regarding their
residual work capability in terms of quality. Since the
reliability of RWCC was 0.77 (Pearson's correlation
coef®cient), we concluded that RWCC obtained from the
three consecutive questions was valid and reliable, and may
be considered as a simple self-rating assessment method for
evaluating an injured worker's residual work capability.
WAI also had a high correlation with the more objective
PCA and CSA (Table III), which indicated that WAI is a
good indicator related to both physical and cognitive
capability among Taiwanese people. Moreover, the model
®ttings shown in Table IV demonstrated that RWCC is
explained by WAI with up to 52% of variance. Whether the
victim's salary was the main source of income for his/her
family before the injury was also a major predictor of an
increase in his/her perception of RWCs. It seems that family
demands or requirements improved a victim's subjective
self-rating of residual work capability or facilitated such an
improvement. However, the RWCC was explained by IS
with only 5% of variance whether WAI is included in the
TABLE V. Partial R2 BetweenWAI and the Self-RatingMethod of RWC
Dependent Independent Parameter Standard Partialvariable variables estimate error P value R 2 R 2
WAI Intercept 12.13 0.92 0.00 0.75RWCS 0.10 0.04 0.01 0.04RWCC 0.18 0.04 0.00 0.13
WAI RWCS 0.44 0.01 0.00 0.95 0.95WAI RWCQ 0.36 0.01 0.00 0.93 0.93WAI RWCC 0.44 0.01 0.00 0.95 0.95
546 Chang et al.
analysis or not. Although the magnitude was relatively small
in comparison with other physical attributes, one must be
aware of such a possible in¯ating effect while using the self-
rating assessment method.
Sociodemographic factors have been reported to be
associated with musculoskeletal disability, including
increasing age, single status, fewer years of schooling,
lower income, and not being employed [Badley and Ibanez,
1994]. The age factor has also been found to especially
in¯uence work capability [Shephard, 1987]. However, in
our study, we only recruited subjects with disabilities and
asked them to compare conditions before and after injury,
which may contribute to the null effect of these factors in the
predictive models in Table IV.
ACKNOWLEDGMENTS
The authors thank the Bureau of Labor Insurance of
Taiwan for kindly offering their computer ®les on work-
men's compensation for permanent disability from occupa-
tional injury from 1/90 through 12/92.
REFERENCES
Abdel-Moty E, Fishbain DA. 1993. Functional capacity and residualfunctional capacity and their utility in measuring work capacity. TheClin J Pain 9:168±173.
American National Standards Institute. 1967. Method of recording andmeasuring work injury experience. New York: American NationalStandards Institute, American National Standard Z16.1.
Badley EM, Ibanez D. 1994. Socioeconomic risk factors andmusculoskeletal disability. J Rheumatol 21:515±522.
Bureau of Labor Insurance for Taiwan-Fukein Area, Republic ofChina: Statistical data for Taiwan-Fukien labor insurance. 1984±1994.
Chang YC, Wang JD. 1995. Cumulative injury rate and potentialworkdays and salary lost. Scand J Work Environ Health 21:494±503.
Cheng TA, Williams P. 1986. The design and development of ascreening questionnaire (CHQ) for use in community studies of mentaldisorders in Taiwan. Psychol Med 16:415±422.
Cheng TA, Wu JT, Chong MY, Williams P. 1990. Internal consistencyand factor structure of the Chinese health questionnaire. Acta PsychiatrScand 82:304±308.
Chong MY, Wilkinson G. 1989. Validation of 30- and 12-item versionsof the Chinese Health Questionnaire (CHQ) in patients admitted forgeneral health screening. Psycholo Med 19:495±505.
Gojer JE, Johanson U. 1991. Human resource costing and accounting.Stockholm, Sweden: Joint Industrial Safety Council, p 17±33.
Goldberg DP. 1972. The detection of psychiatric illness by ques-tionnaire. Oxford University Press, London.
Gulick E. 1992. Model for predicting work performance amongpersons with multiple sclerosis. Nurs Res 41:266±272.
Laman H, Lankhorst GJ. 1994. Subjective weighting of disability: anapproach to quality of life assessment in rehabilitation. Disabil Rehab16(4):198±204.
Lechner DE, Jackson JR, Roth DL, Straaton KV. 1994. Reliability andvalidity of a newly developed test of physical work performance. JOccup Med 36:997±1004.
Mathiowetz V. 1990. Grip and pinch strength measurements. In:Amundsen LR, editor. Muscle strength testing. New York: ChurchillLivingston, p 163±177.
Mathiowetz V. 1993. Role of physical performance componentevaluations in occupational therapy functional assessment. Am JOccup Ther 47:225±230.
Mathiowetz V, Weber K, Volland G, Kashman N. 1984. Reliability andvalidity of grip and pinch strength evaluations. J Hand Surg 9:222.
McCormick EJ, Jeanneret PR, Mecham RC. 1989. Position analysisquestionnaire. Palo Alto, CA: Consulting Psychologists Press, Inc.,p 2±10.
Parry CBW. 1973. Minnesota rate of manipulation test. In: Rehabilita-tion of the hand (3rd ed.) Washington DC: Butterworth Inc.
Regulation of Labor Insurance. 1992. Taipei: Bureau of LaborInsurance For Taiwan-Fukein Area, ROC, p 92±130.
SAS Institute. 1990. SAS/STAT Guide for Personal Computers,Version 6 and Technical Report P-200, SAS/STAT Software: CALISand LOGISTIC Procedures. Cary, NC: SAS Institute.
Shephard RJ. 1987. Human rights and the older worker: changes inwork capacity with age. Med Sci Sports Exercise 19:168±173.
Smith HD. 1988. Assessment and evaluationÐSpeci®c evaluationprocedures. In: Hopkins HL, Smith HD, editors. Willard andSpackman's occupational therapy, 7th ed. Philadelphia: J.B.Lippincott.
Tif®n J, Asher EJ. 1948. The Purdue pegboard: norms and studies ofreliability and validity. J Appl Psych 32:234±247.
Tuomi K, Ilmarinen J, Eskelinen L, Jarvinen E, Toikkanen J, KlockarsM. 1991. Prevalence and incidence rates of disease and work capabilityin different work categories of municipal occupations. Scand J WorkEnviron Health 17(Suppl 1):67±74.
Tuomi K, Ilmarinen J, Jahkola A, Katajarinne L, Tulkki A. 1994. Workcapability index. Occupational Health Care 19. Helsinki: Institute ofOccupational Health.
Velozo CA. 1993. Work evaluations: critique of the state of the art offunctional assessment of work. Amer J Occup Therapy 47:203±209.
Self-Rating Residual Work Capability 547