a simplified gas chromatographic fatty-acid analysis by
TRANSCRIPT

Instructions for use
Title A Simplified Gas Chromatographic Fatty-Acid Analysis by the Direct Saponification/Methylation Procedure and ItsApplication on Wild Tuna Larvae
Author(s) Matsumoto, Yuko; Ando, Yasuhiro; Hiraoka, Yuko; Tawa, Atsushi; Ohshimo, Seiji
Citation Lipids, 53(9), 919-929https://doi.org/10.1002/lipd.12098
Issue Date 2018-09
Doc URL http://hdl.handle.net/2115/75787
Rights
This is the peer reviewed version of the following article: Matsumoto, Y. , Ando, Y. , Hiraoka, Y. , Tawa, A. andOhshimo, S. (2018), A Simplified Gas Chromatographic Fatty‐Acid Analysis by the DirectSaponification/Methylation Procedure and Its Application on Wild Tuna Larvae. Lipids, 53: 919-929.doi:10.1002/lipd.12098, which has been published in final form at https://doi.org/10.1002/lipd.12098. This article maybe used for non-commercial purposes in accordance with Wiley Terms and Conditions for Use of Self-ArchivedVersions.
Type article (author version)
File Information LIPIDS_53(9)_919-929.pdf
Hokkaido University Collection of Scholarly and Academic Papers : HUSCAP

1
A simplified gas chromatographic fatty acid analysis by the direct saponification/methylation 1
procedure and its application on wild tuna larvae 2
3
4
Yuko Matsumoto1, Yasuhiro Ando1, Yuko Hiraoka2, Atsushi Tawa2, and Seiji Ohshimo2,3 5
6
7
1 Laboratory of Marine Bioresources Chemistry, Division of Marine Life Sciences, Faculty of 8
Fisheries Sciences, Hokkaido University, 3-1-1, Minato-cho, Hakodate 041-8611, Japan 9
2 Pacific Bluefin Tuna Biology Group, Bluefin Tuna Resources Division, National Research 10
Institute of Far Seas Fisheries, 5-7-1, Orido, Shimizu, Shizuoka 424-8633, Japan 11
3 Fisheries Management and Oceanography Division, Seikai National Fisheries Research 12
Institute, 1551-8 Taira-machi, Nagasaki, 851-2213, Japan 13
14
15
Corresponding author: 16
Yasuhiro Ando 17
E-mail: [email protected] 18
TEL: +81-138-40-8803 19
20
21
Key words: fatty acid, gas chromatography, larval fish, methyl ester, methylation, 22
saponification 23
24
2
Abstract A method for the direct preparation of fatty acid methyl esters was simplified for 25
fatty acid analysis of a single fish larva using gas chromatography (GC). The method included 26
the isolation of a larval trunk and drying in a glass vial, followed by saponification of all the 27
contents without prior lipid extraction. Thereafter, the fatty acids released were methylated by 28
trimethylsilyldiazomethane. This method has advantages over another method, direct acid-29
catalyzed transesterification, because both the saponification and methylation at room 30
temperature can reduce loss of unsaturated fatty acids and formation of artifacts unavoidable in 31
acidic reaction at high temperature. GC of the products showed that the simplified method can 32
yield methyl esters without artifacts interfering analysis. More than 50 fatty acids were 33
determined, which is twice as many as that previously analyzed by high-performance liquid 34
chromatography. Observation of consistent small impurities in GC of blank tests allowed the 35
accurate determination of fatty acids by correcting the peak areas. Dry matter weights (<3 mg) 36
and the total fatty acid contents displayed a linear relationship. Fatty acid analysis of wild larvae 37
of bluefin tuna, yellowfin tuna, and skipjack tuna collected from the waters around Japan (n = 38
100) revealed that the EPA level in bluefin tuna collected from the Japan Sea was significantly 39
higher than that in the three species collected from Nansei Islands. The simplified direct 40
saponification/methylation method will be a powerful tool to investigate growth and survival of 41
individual larval tuna and other fish species. 42
43
3
Abbreviations 44
ARA arachidonic acid 45
DHA docosahexaenoic acid 46
EPA eicosapentaenoic acid 47
GC gas chromatography 48
HPLC high-performance liquid chromatography 49
HUFA highly unsaturated fatty acid 50
51
4
Introduction 52
Fatty acids play important roles in marine fish larvae. Long-chain highly unsaturated fatty acids 53
(HUFA), such as docosahexaenoic acid (DHA), eicosapentaenoic acid (EPA), and arachidonic 54
acid (ARA), mediate the regulation of membrane fluidity, neural tissue development and 55
sensory behavior, eicosanoid synthesis, flatfish pigmentation, stress modulation, gene regulation, 56
and immune system regulation (Izquierdo & Koven, 2011). Low supply of HUFA causes 57
abnormal development of marine fish larvae and leads to high mortality during larviculture 58
(National Research Council, 2011). Furthermore, deficiency of DHA results in poor 59
development of the central nervous system in larval fish (Masuda, Takeuchi, Tsukamoto, Sato, 60
Shimizu, & Imaizumi, 1999), which induces late ontogeny of schooling behavior, i.e., an 61
essential antipredator behavior for wild fish at larval and early juvenile stages (Nakayama, 62
Masuda, Shoji, Takeuchi, & Tanaka, 2003). Fatty acids also function as a source of metabolic 63
energy. Marine fish use saturated and monounsaturated fatty acids, such as palmitic acid (16:0) 64
and oleic acids (18:1n-9), as energy sources (Sargent, Tocher, & Bell, 2003). Therefore, fatty 65
acid composition and content are useful indicators for revealing qualitative and quantitative 66
information on the nutritional status and survival potential of fish larvae. 67
In the last decade, more than 125 papers have been published that describe the fatty acid 68
profiles of fish larvae. Most of the studies dealt with laboratory-reared larvae, and fatty acid 69
analysis was usually performed for pooled larvae obtained from rearing tanks (Boglino, Gisbert, 70
Darias, Estévez, Andree, Sarasquete, & Ortiz-Delgado, 2012; Matsunari, Hashimoto, Oda, 71
Masuda, Imaizumi, Teruya, Furuita, Yamamoto, Hamada, & Mushiake, 2013; Izquierdo, 72
Scolamacchia, Betancor, Roo, Caballero, Terova, & Witten, 2013; Hachero-Cruzado, 73
Rodríguez-Rua, Román-Padilla, Ponce, Fernández-Díaz, & Manchado, 2014; Turkmen, Castro, 74
Caballero, Hernandez-Cruz, Saleh, Zamorano, Regidor, & Izquierdo, 2017). However, such 75
analysis cannot provide information on the individual variance of the larval population, because 76

5
body weight of the larvae was lower than the minimum detection limit if higher resolution of 77
fatty acid components is necessary. To overcome this problem, development of a modified 78
technique is needed. 79
Previously, we accomplished the fatty acid analysis of a single larva using reversed-phase 80
high-performance liquid chromatography (HPLC) (Ando, Haba, Soma, Hiraoka, & Takatsu, 81
2007; Hiraoka, Takatsu, & Ando, 2014). Highly sensitive fluorescent detection and convenient 82
derivatization procedure allowed the analysis of the isolated tissue such as eyes, head, and body 83
trunk of the wild point-head flounder larva (Hiraoka, Takatsu, & Ando, 2014). On the other 84
hand, gas chromatography (GC) of fatty acid methyl esters is also effective because of much 85
higher resolution of fatty acid peaks. Several species of fish larvae were individually subjected 86
to fatty acid analysis using GC with flame ionization detection coinciding with the HPLC 87
analysis (Perga, Bec, & Anneville, 2009; Grote, Hagen, Lipinski, Verheye, Stenevik, & Ekau, 88
2011; Diebel, Parrish, Grønkjær, Munk, & Nielsen, 2012; Paulsen, Clemmensen, & Malzahn, 89
2014; Peters, Diekmann, Clemmensen, & Hagen, 2015; Teodósio, Garrido, Peters, Leitão, Ré, 90
Peliz, & Santos, 2017). This fact indicates sufficient sensitivity of GC for fatty acid analysis of a 91
single larva. The key to successful analysis of a single larva apparently depends on how to 92
minimize fatty acid losses, contaminations, and artifacts during the preparation of methyl esters. 93
The routine method that involves the cumbersome solvent extraction of total lipids and their 94
purification from tissues, is not suitable for the analysis of a single larva. A more convenient 95
method (Meier, Mjøs, Joensen, & Grahl-Nielsen, 2006) was applied for the analysis of a single 96
larva of reared cod (Folkvord, Koedijk, Grahl-Nielsen, Meier, Olsen, Blom, Otterlei, & Imsland, 97
2017), wherein each larva was directly treated with HCl-methanol at 90°C for 2 h without prior 98
lipid extraction and purification. 99
In the present study, we introduce another method for the preparation of methyl esters. 100
Direct saponification/methylation method developed by Aldai et al. (Aldai, Murray, Nájera Troy, 101
6
& Osoro, 2005; Aldai, Osoro, Barron, & Nájera, 2006) and validated by Juárez et al. (Juárez, 102
Juárez, Aldai, Avilés, & Polvillo, 2010) was reported to be more beneficial than the acid-103
catalyzed transmethylation, because this method does not require high temperature that is used 104
in the HCl-catalyzed method, does not produce methoxy artifacts nor decomposition products 105
from cholesterol, and does not alter olefinic bond position nor geometric configuration. 106
Additionally, this method is not sensitive to the moisture present in the tissue samples (Juárez, 107
Povillo, Contò, Ficco, Ballico, & Failla, 2008). Because the original method, which was 108
previously applied to seafood required 1 g of tissue as a single sample, we modified and 109
simplified the method for the analysis of a single larva. The modified method was applied for 110
the analysis of three species of wild tuna larvae caught around Japan after checking its reliability. 111
Although Pacific bluefin tuna (Thunnus orientalis), yellowfin tuna (T. albacares) and 112
skipjack tuna (Katsuwonus pelamis) are important species in aquaculture for marine foods 113
(Mourente & Tocher, 2009), complete knowledge on the biochemical components of wild tuna 114
larvae is not understood to date. Morais et al. (Morais, Mourente, Ortega, Tocher, & Tocher, 115
2011) suggested adequate provision of DHA is essential for normal development of farmed 116
Atlantic bluefin tuna larvae (T. thynnus). We conducted field surveys in the two different 117
spawning grounds for Pacific bluefin tuna around Nansei Islands (Ashida, Suzuki, Tanabe, 118
Suzuki, & Aomura, 2015; Ohshimo, Tawa, Ota, Nishimoto, Ishihara, Watai, Satoh, Tanabe, & 119
Abe, 2017) and Japan Sea (Okochi, Abe, Tanaka, Ishihara, & Shimizu, 2016), and collected 120
larvae of Pacific bluefin tuna in both areas, yellowfin tuna and skipjack tuna around Nansei 121
Islands in 2016. To the best of our knowledge, the present study is the first to reveal the 122
individual variances of fatty acid profile for the wild caught Scombridae larvae. This paper 123
reports and discusses the modified procedure of fatty acid analysis, its performance, and the 124
analytical results in the tuna larvae. 125
126

7
Materials and Methods 127
Materials 128
Methyl myristate, methyl palmitate, methyl oleate, methyl cis-11-eicosenoate, methyl cis-13-129
docosenoate, and methyl tricosanoate (each >99%) were obtained from Sigma-Aldrich (St. 130
Louis, USA). Trimethylsilyldiazomethane (10% solution in hexane) was obtained from Tokyo 131
Chemical Industry (Tokyo, Japan). Other reagents and solvents were obtained from Wako Pure 132
Chemical Industries (Osaka, Japan). All the reagents and solvents were of analytical grade, 133
except for hexane, diethyl ether, and methanol, which were used after distillation in the 134
laboratory. 135
Larvae of Pacific bluefin tuna (n = 41), yellowfin tuna (n = 14), and skipjack tuna (n = 136
14) were collected using a ring net (2 m diameter and 0.34 mm mesh size) or tucker trawl net (1 137
m square and 0.5 mm mesh size) in the waters around Nansei Islands during June 19–28, 2016. 138
Pacific bluefin tuna larvae (n = 31) were also collected using the ring net from the Japan Sea off 139
Tottori Prefecture during June 28–August 4, 2016. In both of the samplings, the net was towed 140
at the sea surface and the tucker trawl net was towed 10–30 m depth for 10 min each time 141
aboard Research Vessel ‘Shunyo-Maru’. Larvae were sorted on board as soon as possible, and 142
stored individually in plastic cases at - 25°C. The larvae were photographed individually using a 143
digital camera mounted on a dissecting microscope in the laboratory. Standard length and body 144
height were measured on the digital images imported to a computer using ImageJ software 145
(https://imagej.nih.gov/ij/). Each larva was dissected for removing head and digestive tract from 146
body (Hiraoka, Takatsu, & Ando; 2014), and stored at - 25°C along with glazing water. DNA 147
and morphological analyses confirmed the tuna species. Standard length, body height, and dry 148
weight of the trunk are shown in Table 1, along with the analytical results. 149
150
Determination of dry matter weight 151
8
The body without the head and digestive tract, isolated from a single larva, was transferred to a 152
pre-weighed screw-capped glass vial (1.5-mL volume). The trunk was dehydrated in 99.5% 153
ethanol (50 µL), followed by blowing through a stream of nitrogen. The muscle was further 154
dried in vacuo in the same vial until a constant weight was reached. 155
156
Direct saponification/methylation of a single larva 157
Methyl tricosanoate in toluene (5.425 μmol/mL corresponding to 2 mg/mL, 1 μL) and 1 M 158
KOH in 95% ethanol (50 μL) were added into the vial containing the dried trunk. The trunk was 159
directly saponified overnight in the dark at 23°C after being chopped with a needle. The trunk 160
became pulpy during the reaction. The reaction was stopped by adding 2 M HCl (50 µL) to 161
acidify the saponification products. Solvents and excess HCl were evaporated by passing 162
through a stream of nitrogen at 23°C until KCl was crystalized. 163
Fatty acids released in the vial were methylated in a mixture of toluene (80 μL), methanol 164
(20 µL), and a 10% solution of trimethylsilyldiazomethane in hexane (50 μL) at 23°C for 15 165
min. The reaction was stopped by adding acetic acid (5 µL), and all solvents were again 166
removed by passing through a stream of nitrogen. 167
168
Purification of methyl esters 169
Fatty acid methyl esters were purified by column chromatography using the silica gel 60 (Merck, 170
Darmstadt, Germany) with hexane/diethyl ether (90:10, v/v) for elution. The silica gel (50 g) 171
taken into a glass beaker was preliminarily washed in methanol and diethyl ether (each 150 mL 172
× 3 times), dried in air, activated at 110 °C, and stored in a desiccator. The column made from a 173
Pasteur pipette with a cotton plug was cleaned by eluting in 0.1 M KOH-ethanol, ethanol, and 174
diethyl ether in the respective order (each 3 mL) and dried in air just before packing the silica 175
gel in 1-cm height. The methyl esters dissolved in 100 μL of hexane/diethyl ether (90:10, v/v) 176

9
were applied on the silica gel column and eluted with 1.5 mL of the same solvent. 177
178
GC 179
GC was carried out using a GC-4000 gas chromatograph (GL Sciences, Tokyo, Japan), equipped 180
with a flame ionization detector and a capillary column of FAMEWAX (30 m × 0.32 mm i.d., 181
0.25 µm film thickness; Restek, Bellefonte, USA). Column temperature was programmed from 182
90°C (0 min) to 170°C at 20°C/min, then to 240°C at 4°C/min, and finally maintained at 240°C 183
for 25 min. The injector and detector temperatures were maintained at 240°C. The carrier gas 184
was helium, used at a linear velocity of 33.5 cm/s at 170°C (85 kPa); and the split ratio was 25:1. 185
The purified methyl esters were re-suspended in 50–200 μL of hexane, which depended on 186
larval size. In blank analysis with no larva, samples were dissolved in 20 μL of hexane. One μL 187
of the solutions were injected in the splitless injection mode held for 1 min. The peak areas were 188
measured in a Shimadzu C-R3A integrator (Shimadzu, Kyoto, Japan). 189
Quantification of fatty acids 190
Quantities of fatty acids were calculated from the GC results without gravimetry. The following 191
formula was used to quantify each fatty acid (MFA) in a sample: 192
MFA (nmol) = [(AFA/A23:0) – (AFA,blank/A23:0,blank)] × M23 0 × FFA [Eq. 1] 193
where AFA indicates peak area counts for the fatty acid, A23:0 indicates peak area counts for 194
internal standard (23:0), AFA,blank and A23 0,blank indicate the corresponding values observed in the 195
blank analysis with no larva, M23:0 indicates the number of moles of the internal standard 196
(5.425 nmol), and FFA indicates response correction factor experimentally determined for 197
different chain-length fatty acids with the above GC system. Plots of peak area ratios in relation 198
to molar ratios of standard fatty acid methyl esters (0.25–15 nmol, n = 10) mixed to 23:0 methyl 199
ester (5 nmol in 100 μL of hexane) gave the following slope (mFA) of the regression line through 200
the origin, coefficient of determination (R2), and FFA (= 1/mFA) for the fatty acid quantifications: 201
10
m14 0 = 0.7362 R2 = 0.9927 F14:0 = 1.358 for C14-15 fatty acids, 202
m16 0 = 0.8408 R2 = 0.9957 F16:0 = 1.189 for C16-17 fatty acids, 203
m18:1n-9 = 0.9187 R2 = 0.9974 F18:1n-9 = 1.088 for C18-19 fatty acids, 204
m20:1n-9 = 0.9899 R2 = 0.9984 F20:1n-9 = 1.010 for C20 fatty acids, 205
m22:1n-9 = 1.0007 R2 = 0.9985 F22:1n-9 = 0.999 for C21-22 fatty acids, 206
m23 0 = 1.0000 R2 = 1.0000 F23:0 = 1.000 for C23-24 fatty acids. 207
The amount of total fatty acids (nmol) and total fatty acid content (nmol/mg) were calculated by 208
summarizing MFA and dividing it by dry weight of the sample, respectively. Fatty acid 209
composition was expressed as mol% of each fatty acid in the total fatty acids. 210
211
Statistical analysis 212
The results obtained were presented as means ± standard deviations (SD). Differences between 213
mean values were analyzed by one-way analysis of variance (ANOVA), followed by a multiple 214
comparison test (Tukey-Kramer), where appropriate. Differences were reported as statistically 215
significant at P < 0.05. 216
Bray-Curtis similarity matrix and permutational multi-variable ANOVA (PERMANOVA) 217
(Anderson, 2001; McArdle & Anderson, 2001) were used to investigate how fatty acid profiles 218
varied between species (pacific bluefin, yellowfin and skipjack tuna) and area (around Nansei 219
Islands and Japan Sea). Non-metric multidimensional scaling (MDS) analysis was performed to 220
visualize differences of fatty acid composition among species and sampling area. For these 221
analysis, statistical software R version 3.3.1 (R Core Team, 2016) with the “vegan” packages 222
were used with data of 44 fatty acids present in proportions >0.1 mol%. 223
224
Results 225
Performance of the preparation method 226

11
In this study, we minimized the concentrations and volumes of the reagents and solvents 227
accordingly for a single larva, which has around 0.1–0.3 mg of dry weight. We also simplified 228
the method by omitting the extraction steps involving the non-saponifiable matters and fatty 229
acid products inserted between the saponification and methylation in the original procedure 230
(Aldai, Murray, Nájera Troy, & Osoro, 2005; Aldai, Osoro, Barron, & Nájera, 2006). Hence, 231
drying of muscle sample, saponification, and methylation could be carried out in a single vial. 232
GC analysis showed the occurrence of more than 50 fatty acid components, confirming 233
that the modified method can yield methyl esters (Fig. 1a). Detection limit of the fatty acid 234
methyl ester was 50 fmol under the GC conditions (S/N = 3). Artifacts of trimethylsilyl esters of 235
fatty acid can be formed during methylation with trimethylsilyldiazomethane in the absence of 236
benzene and methanol (Park, Albright, Cai, & Pariza, 2001). Toluene and methanol were added 237
for initiating methylation to prevent artifacts in the modified method. GC of tuna larva showed 238
no fatty acid-like unusual peaks. 239
Several minor peaks appeared in the chromatogram obtained in the blank test, wherein all 240
processes were conducted without any larva (Fig. 1b). Some of them overlapped with the 241
shorter-chain saturated fatty acid peaks. However, the peak areas maintained constant values in 242
repeated blank tests using common reagents and solvents. This result indicated that these peaks 243
were not caused from inconsistent contaminations, but from consistent impurities in the reagents 244
and solvents. Commercial trimethylsilyldiazomethane was reported to contain impurities with 245
trimethylsilyl that would interfere with the fatty acid analysis by GC (Park, Albright, Cai, & 246
Pariza, 2001). The peaks found in Fig. 1b probably included these impurities. However, each 247
peak area was less than 2% in comparison to the internal standard 23:0 (5.425 nmol). 248
Repeatability was checked by replicated analyses (n = 6) in the muscles of a juvenile tuna 249
(4.16 ± 0.17 mg of dry muscle). Coefficient of variation was less than 5.57% for the fatty acid 250
composition (Fig. 2a). These values were comparable to previous findings observed in the 251

12
internal validation of the original method (Juárez, Juárez, Aldai, Avilés, & Polvillo, 2010). 252
Plotting the observed fatty acid contents vs. dry weights of developing muscle (n = 11) 253
taken out from a tuna individual showed a linear relationship in the range up to 3 mg of dry 254
muscle (Fig. 2b); correlation coefficient (R) was 0.991. 255
256
Fatty acid composition of wild tunas larvae 257
The fatty acid contents in the dry weight of the larval trunk ranged from 147.4–219.7 nmol/mg 258
(Table 1). No significant difference in fatty acid content was observed among the tuna larvae. 259
The most abundant fatty acids were 16:0 and DHA, accounting for approximately 25 mol% and 260
22 mol% of total fatty acids, respectively. Other major fatty acids (>5 mol%) were 18:0, 18:1n-9, 261
and EPA. ARA was found at the proportions of 1.48–1.86 mol% of total fatty acids. 262
The MDS plot of fatty acid profiles showed clear separation of Pacific bluefin tuna 263
caught in Japan Sea from others caught in around Nansei Islands (Fig. 3). Skipjack tuna showed 264
wide variation while yellowfin tuna relatively aggregated. These fatty acid profiles were 265
significantly different between species and sampling area (Fig. 3; PERMANOVA, P = 0.001). 266
Five major fatty acids (except 16:0) showed significant differences in the proportions 267
among the species and/or locations (Table 1; Fig. 4). It is remarkable that 18:1n-9 and EPA were 268
significantly higher in bluefin tuna of the Japan Sea than in all the species of Nansei Islands. 269
EPA remarkably increased with the increase in standard length; which was contrary to 18:1n-9 270
that decreased with the increase in length (Fig. 4). ARA and DHA in all species were almost 271
stable throughout the larval stage. The molar ratios of DHA/EPA ranged from 2.40–3.29 in the 272
four tuna varieties (Table 1), and the ratio of Pacific bluefin tuna in the Sea of Japan was 273
significantly lower than the other specimens. The DHA/EPA ratios of Pacific bluefin tuna in the 274
Nansei Islands waters were almost stable, however the ratios of Pacific bluefin tuna in the Sea 275
of Japan, yellowfin tuna and skipjack tuna decreased with size. 276
13
277
Discussion 278
Validation of GC analysis 279
Previously we used reversed-phase HPLC for fatty acid analysis of a single fish larva (Hiraoka, 280
Takatsu, & Ando; 2014). The analysis of fluorescent 9-anthrylmethyl ester derivatives could 281
give fatty acid peaks with detection limit of 65 fmol (S/N = 3) (Ando, Haba, Soma, Hiraoka, & 282
Takatsu, 2007). GC under the present conditions showed a similar detection limit (50 fmol, S/N 283
= 3). This result confirmed a view that conventional GC equipped with flame ionization detector 284
is usable for fatty acid analysis of a single fish larva. 285
The most disadvantageous point of the HPLC method was low resolution of fatty acids. 286
Although EPA and DHA could be separated from other fatty acids (Ando, Haba, Soma, Hiraoka, 287
& Takatsu, 2007), peak resolutions (Rs) among ARA, 20:4n-3, 22:5n-6 and 22:5n-3 were no 288
more than 0.6–0.7, which are about one half of complete resolution (Rs = 1.5). Peaks of 18:3n-3 289
and 18:2n-6 overlapped 18:3n-6 and 16:1, respectively. Positional isomers of monounsaturated 290
fatty acids were also inseparable. The HPLC analysis gave only 22 peaks for fish oil fatty acids. 291
In this study, GC analysis gave more than 50 peaks including the above biologically important 292
fatty acids and their isomers (Fig. 1a; Table 1). This analysis enables comparison of fatty acid 293
profiles of fish larvae with those reported for other life stages and other species of fish. 294
Direct preparation of methyl esters without lipid extraction is suitable in case of small 295
biological tissues, such as those from a single larva. There are two types of direct methods 296
(Juárez, Povillo, Contò, Ficco, Ballico, & Failla, 2008): 1) acid-catalyzed transmethylation; and 297
2) base-catalyzed saponification, followed by methylation. The former method was employed in 298
the most recent analyses of reared cod larvae individuals (0.07–9 mg, dry weight) (Folkvord, 299
Koedijk, Grahl-Nielsen, Meier, Olsen, Blom, Otterlei, & Imsland, 2017) and pooled Baltic 300
herring samples (0.4–0.5 g, wet weght) (Lind, Huovila, & Käkelä, 2018). However, the acid-301

14
catalyzed method forms artifacts from tissue components during long-time reaction at high 302
temperature (Carrapiso & Garcia, 2000; Aldai, Murray, Nájera Troy, & Osoro, 2005; Aldai, 303
Osoro, Barron, & Nájera, 2006; Juárez, Juárez, Aldai, Avilés, & Polvillo, 2010). In fact, we 304
observed many GC peaks interfering with C22-C24 fatty acids, when methyl esters were 305
prepared from juvenile tuna muscle by heating it in 2M HCl-methanol at 90°C for 2 h 306
(chromatogram not shown). These peaks were not removed by column chromatography. 307
Formation of artifacts is an essentially inevitable disadvantage of direct acid-catalyzed method. 308
In contrast, the present saponification/methylation method did not show such artifact 309
peaks (Fig. 1a). Alkaline KOH-ethanol can react with tissue components under conditions 310
different from those of acidic methanol. Saponification does not require high temperature. 311
While the reaction was carried out at 60°C for 1 h in the original method (Aldai, Murray, Nájera 312
Troy, & Osoro, 2005; Aldai, Osoro, Barron, & Nájera, 2006), our method employed cold 313
saponification at 23°C for 18 h. This cold saponification probably lowered formation of artifacts 314
from tissue components and loss of polyunsaturated fatty acids caused by isomerization and 315
oxidation. Minor peaks found in blank test were not artifacts but impurities independent of 316
tissue components (Fig. 1b). The improvements for minimizing the use of reagents, solvents, 317
and glass apparatuses and for simplifying the process seem to result in low levels of impurity 318
peaks in GC analysis. In this study, fatty acid analysis was achieved for 0.04 mg of dry muscle 319
isolated from a 3.320 mm-standard length larva. This level is a half of the minimum weight 320
previously analyzed for cod larvae by the acid-catalyzed method. The improved direct 321
saponification/methylation method is superior to acid-catalyzed method for accurate GC 322
analysis of fatty acids in samples with low mass, such as individual larval fish. 323
This is the first report that the direct saponification/methylation method can be used for 324
preparation of fatty acid methyl esters from fish larvae. Fish larvae vary in weight according to 325
the species and days posthatch, which differ from the analysis of seafood specifying a quantity 326
15
of starting material. However, good repeatability of the seafood analysis (Juárez, Juárez, Aldai, 327
Avilés, & Polvillo, 2010) held for the analysis of much smaller muscle from tuna (Fig. 2a). A 328
linear relationship (Fig. 2b) indicated efficient applicability of the modified method to a wide 329
variety of fish larvae. In this respect, the saponification/methylation method is again superior to 330
acid-catalyzed method, where an increase sample size led to a decrease in recovery of fatty 331
acids (Abdulkadir, & Tsuchiya, 2008). The procedure of the present study is accurate and 332
suitable for fatty acid analysis of a single larva. 333
334
Fatty acid composition 335
The method modified and simplified in this study successfully indicated the 336
characteristics of fatty acid contents for wild caught pacific bluefin, yellowfin and skipjack tuna, 337
especially two different spawning areas for Pacific bluefin tuna. In the present study, fatty acid 338
components of three tuna species in the Nansei area and two nursery areas of bluefin tuna were 339
significantly different. The polyunsaturated fatty acid composition of reared Atlantic bluefin 340
tuna larvae tended to reflect their dietary composition (Ortega & Mourente, 2010; Betancor, 341
Ortega, de la Gándara, Tocher, & Mourente, 2017). In the field, previous studies reported the 342
different feeding habits among two tunas and skipjack tuna (Uotani, Matsuzaki, Makino, Noda, 343
Inamura, & Horikawa, 1981; Uotani, Saito, Hiranuma, & Nishikawa, 1990; Kodama, Hirai, 344
Tamura, Takahashi, Tanaka, Ishihara, Tawa, Morimoto, & Ohshimo, 2017). These previous 345
studies indicate that the differences among the three species in the Nansei area and bluefin tuna 346
in the Sea of Japan and Nansei area could be influenced by differences in prey fatty acid 347
composition. Further testing of particulate organic matter or zooplankton fatty acid components 348
should be evaluated in the future. 349
Tuna species are considered unique as they contain high levels of DHA and very high 350
DHA/EPA ratios (Mourente & Tocher, 2009). The muscles of the young or adult tunas living 351
16
around Japan showed DHA levels ranging from 25–36% (bluefin tuna) (Ishihara & Saito, 1996), 352
22–36% (yellowfin tuna) (Saito, Ishihara, & Murase, 1996), 24–30% (albacore Thunnus 353
alalunga) (Murase & Saito, 1996), and 28–34% (bonito Euthynnus pelamis) (Watanabe, Murase, 354
& Saito, 1995) of the total fatty acids. In the present study, the fraction of DHA among three 355
species was approximately 22 mol%, similar to previous studies. DHA/EPA ratios reported for 356
the above tunas ranged from 3.4–5.8 (bluefin tuna), 6.7–9.0 (yellowfin tuna), 3.1–8.1 (albacore), 357
and 3.1–5.4 (bonito). The juvenile and young skipjack tunas (0.194–62.840 g) have DHA levels 358
similar to those of adults (more than 29%); along with DHA/EPA ratios ranging from 2.6–3.7 359
(Tanabe, Suzuki, Ogura, & Watanabe, 1999). The DHA/EPA ranged from 2.40–3.29 in the 360
present study, furthermore the value of Pacific bluefin tuna in the Sea of Japan was lower than 361
other tunas, and the value decreased with size. The mouth of Pacific bluefin tuna larvae open at 362
three days after hatching, and thus the decreasing DHA/EPA with size could be affected by prey 363
capture behavior. The difference of DHA/EPA of Pacific bluefin tuna between Nansei area and 364
Sea of Japan could be caused by the difference of eggs and maternal organs, such as liver and 365
muscle. To evaluate this hypothesis, analyzing the egg (ovary), liver and muscle of spawning 366
bluefin tuna is needed in the near future. These facts indicate that accurate analysis of the fatty 367
acid components of a single larva could increase our understanding of the growth-survival 368
process in marine fish. 369
370
Conclusion 371
This study accomplished the fatty acid analysis of a single fish larva using GC. The direct 372
saponification/methylation method simplified in this study could yield fatty acid methyl esters 373
without loss of unsaturated fatty acids and formation of artifacts from larval muscle. This 374
method enabled fatty acid analysis by high-resolution GC with ordinary flame ionization 375
detection. There is no necessity to use HPLC low in peak resolution and specific detection 376

17
technique, such as mass spectrometry, requiring calibrations for all fatty acids. The simplified 377
direct saponification/methylation followed by GC is probably the most accurate method to 378
detail fatty acid profile of a single fish larva. At present, this method has the highest sensitivity 379
for fatty acid analysis of a single larva. While the gas chromatograph of this study equipped 380
only split/splitless injection system and used helium as the carrier gas, on-column injection and 381
hydrogen should further improve quantification and peak resolution of fatty acids. The analysis 382
of wild tunas larvae successfully indicated the characteristics of fatty acid contents for each 383
population and revealed that the concentrations of DHA and EPA during larval developmental 384
stage. The method used in the present study will be a powerful tool to investigate potential 385
capacity for survival of early life stages of wild tuna and other marine fish. 386
387
Acknowledgement 388
The authors are grateful to Dr. John Mohan, Texas A&M University at Galveston, for his help in 389
the preparation of this paper and the many suggestions for its improvements. The authors 390
sincerely appreciate the captain, officers and crew of the Syunyo-Maru and Drs. Taiki Ishihara, 391
Mikio Watai, Tetsuo Ono, Makoto Okazaki, Taketoshi Kodama, Hiroshi Morita and Ms. 392
Tomoko Kameda for collection of larvae samples. This study was supported by Fishery Agency, 393
Japan Government. 394
395
Conflict of Interest 396
The authors have no conflicts of interest directly relevant to the content of this article. 397
398
References 399
Abdulkadir, S, & Tsuchiya, M. (2008) One-step method for quantitative and qualitative analysis 400
of fatty acids in marine animal samples. Journal of Experimental Marine Biology and 401

18
Ecology, 354:1-8. https://doi.org/10.1016/j.jembe.2007.08.024 402
Aldai, N., Murray, B. E., Nájera, A. I., Troy, D. J., & Osoro, K. (2005) Derivatization of fatty 403
acids and its application for conjugated linoleic acid studies in ruminant meat lipids. 404
Journal of the Science of Food and Agriculture, 85:1073-1083. 405
https://doi.org/10.1002/jsfa.2110 406
Aldai, N., Osoro, K., Barrón, L. J. R., & Nájera, A. I. (2006) Gas-liquid chromatographic 407
method for analysing complex mixtures of fatty acids including conjugated linoleic acids 408
(cis9trans11 and trans10cis12 isomers) and long-chain (n-3 and n-6) polyunsaturated 409
fatty acids. Application to the intramuscular fat of beef meat. Journal of Chromatography 410
A, 1110:133-139. https://doi.org/10.1016/j.chroma.2006.01.049 411
Anderson, M. J. (2001) A new method for non-parametric multivariate analysis of variance. 412
Austral Ecology, 26:32-46. https://doi.org/10.1111/j.1442-9993.2001.01070.pp.x 413
Ando, Y., Haba, Y., Soma, K., Hiraoka, Y., & Takatsu, T. (2007) Rapid preparation of 414
fluorescent 9-anthrylmethyl esters for fatty acid analysis of small amount of 415
triacylglycerols. Lipids, 42:955-960. https://doi.org/10.1007/s11745-007-3100-2 416
Ashida, H., Suzuki, N., Tanabe, T., Suzuki, N., & Aonuma, Y. (2015) Reproductive condition, 417
batch fecundity, and spawning fraction of large Pacific bluefin tuna Thunnus orientalis 418
landed at Ishigaki Island, Okinawa, Japan. Environmental Biology of Fishes, 98:1173-419
1183. https://doi.org/10.1007/s10641-014-0350-8 420
Betancor, M. B., Ortega, A., de la Gándara, F., Tocher, D. R., & Mourente, G. (2017) Lipid 421
metabolism-related gene expression pattern of Atlantic bluefin tuna (Thunnus thynnus L.) 422
larvae fed on live prey. Fish Physiology and Biochemistry, 43:493-516. 423
https://doi.org/10.1007/s10695-016-0305-4 424
Boglino, A., Gisbert, E., Darias, M. J., Estévez, A., Andree, K.B., Sarasquete, C., & Ortiz-425
Delgado, J. B. (2012) Isolipidic diets differing in their essential fatty acid profiles affect 426
19
the deposition of unsaturated neutral lipids in the intestine, liver and vascular system of 427
Senegalese sole larvae and early juveniles. Comparative Biochemistry and Physiology A, 428
162:59-70. https://doi.org/10.1016/j.cbpa.2012.02.013 429
Carrapiso, A. I., & García, C. (2000) Development in lipid analysis: Some new extraction 430
techniques and in situ transesterification. Lipids, 35:1167-1177. 431
https://doi.org/10.1007/s11745-000-0633-8 432
Diebel, D., Parrish, C. C., Grønkjær, P., Munk, P., & Nielsen, T. G. (2012) Lipid class and fatty 433
acid content of the leptocephalus larva of tropical eels. Lipids, 47:623-634. 434
https://doi.org/10.1007/s11745-012-3670-5 435
Folkvord, A., Koedijk, R., Grahl-Nielsen, O., Meier, S., Olsen, B. R., Blom, G., Otterlei, E., & 436
Imsland, A. K. (2017) You are what you eat? Differences in lipid composition of cod 437
larvae reared on natural zooplankton and enriched rotifers. Aquaculture Nutrition, 438
2017:1-12. https://doi.org/10.1111/anu.12550 439
Grote, B., Hagen, W., Lipinski, M. R., Verheye, H. M., Stenevik, E. K., & Ekau, W. (2011) 440
Lipids and fatty acids as indicators of egg condition, larval feeding and material effects in 441
Cape hakes (Merluccius paradoxus and M. capensis). Marine Biology, 158:1005-1017. 442
https://doi.org/10.1007/s00227-011-1626-6 443
Hachero-Cruzado, I., Rodríguez-Rua, A., Román-Padilla, J., Ponce, M., Fernández-Díaz, C., & 444
Manchado, M. (2014) Characterization of the genomic responses in early Senegalese sole 445
larvae fed diets with different dietary triacylglycerol and total lipids levels. Comparative 446
Biochemistry and Physiology D, 12:61-73. https://doi.org/10.1016/j.cbd.2014.09.005 447
Hiraoka, Y., Takatsu, T., & Ando, Y. (2014) Individual variations in fatty acid composition and 448
concentration as indicators of the nutritional condition of wild pointhead flounder larvae. 449
Marine Biology, 161:1615-1625. https://doi.org/10.1007/s00227-014-2445-3 450
Ishihara, K., & Saito, H. (1996) The docosahexaenoic acid content of the lipid of juvenile 451
20
bluefin tuna Thunnus thynnus caught in the sea off Japanese coast. Fisheries Science, 452
62:840-841. https://doi.org/10.2331/fishsci.62.840 453
Izquierdo, M., & Koven, W. (2011) Lipids. In G. J. Holt (Ed.), Larval fish nutrition (pp. 47-81). 454
Chichester, UK: John Wiley & Sons. https://doi.org/10.1002/9780470959862.ch2 455
Izquierdo, M. S., Scolamacchia, M., Betancor, M., Roo, J., Caballero, M. J., Terova, G., & 456
Witten, P. E. (2013) Effects of dietary DHA and α-tocopherol on bone development, early 457
mineralisation and oxidative stress in Sparus aurata (Linnaes, 1758) larvae. British 458
Journal of Nutrition, 109:1796-1805. https://doi.org/10.1017/S0007114512003935 459
Juárez, M., Juárez, A., Aldai, N., Avilés, C., & Polvillo, O. (2010) Validation of a gas-liquid 460
chromatographic method for analysing samples rich in long chain n-3 polyunsaturated 461
fatty acids: Application to seafood. Journal of Food Composition and Analysis, 23:665-462
670. https://doi.org/10.1016/j.jfca.2010.03.011 463
Juárez, M., Povillo, O., Contò, M., Ficco, A., Ballico, S., & Failla, S. (2008) Comparison of 464
four extraction/methylation analytical methods to measure fatty acid composition by gas 465
chromatography in meat. Journal of Chromatography A, 1190:327-332. 466
https://doi.org/10.1016/j.chroma.2008.03.004 467
Kodama, T., Hirai, J., Tamura, S., Takahashi, T., Tanaka, Y., Ishihara, T., Tawa, A., Morimoto, 468
H., & Ohshimo, S. (2017) Diet composition and feeding habit of larval Pacific bluefin 469
tuna, Thunnus orientalis, in the Sea of Japan: Integrated approach of morphological and 470
metagenetic techniques. Marine Ecology Progress Series, 583:211-226. 471
https://doi.org/10.3354/meps12341 472
Lind, Y., Huovila, T., & Käkelä, R. (2018) A retrospective study of fatty acid composition in 473
Baltic herring (Clupea harengus membras) caught at three locations in the Baltic Sea 474
(1973-2009). ICES Journal of Marine Science, 75:330-339. 475
https://doi.org/10.1093/icesjms/fsx127 476
21
Masuda, R., Takeuchi, T., Tsukamoto, K., Sato, H., Shimizu, K., & Imaizumi, K. (1999) 477
Incorporation of dietary docosahexaenoic acid into the central nervous system of the 478
yellowtail Seriola quinqueradiata. Brain, Behavior and Evolution, 53:173-179. 479
https://doi.org/10.1159/000006592 480
Matsunari, H., Hashimoto, H., Oda, K., Masuda, Y., Imaizumi, H., Teruya, K., Furuita, H., 481
Yamamoto, T., Hamada, K., & Mushiake, K. (2013) Effects of docosahexaenoic acid on 482
growth, survival and swim bladder inflation on larval amberjack (Seriola dumerili, Risso). 483
Aquuaculture Research, 44:1696-1705. https://doi.org/10.1111/j.1365-2109.2012.03174.x 484
McArdle, B. H., & Anderson, M. J. (2001) Fitting multivariate models to community data: A 485
comment on distance-based redundancy analysis. Ecology, 82:290-297. 486
https://doi.org/10.1890/0012-9658(2001)082[0290:FMMTCD]2.0.CO;2 487
Meier, S., Mjøs, S. A., Joensen, H., & Grahl-Nielsen, O. (2006) Validation of a one-step 488
extraction/methylation method for determination of fatty acids and cholesterol in marine 489
tissues. Journal of Chromatography A, 1104:291-298. 490
https://doi.org/10.1016/j.chroma.2005.11.045 491
Morais, S., Mourente, G., Ortega, A., Tocher, J. A., & Tocher, D. R. (2011) Expression of fatty 492
acyl desaturase and elongase genes, and evolution of DHA:EPA ratio during development 493
of unfed larvae of Atlantic bluefin tuna (Thunnus thynnus L.). Aquaculture, 313:129-139. 494
https://doi.org/10.1016/j.aquaculture.2011.01.031 495
Mourente, G., & Tocher, D. R. (2009) Tuna nutrition and feeds: Current status and future 496
perspectives. Reviews in Fisheries Science, 17:373-390. 497
https://doi.org/10.1080/10641260902752207 498
Murase, T., & Saito, H. (1996) The docosahexaenoic acid content in the lipids of albacore 499
Thunnus alalunga caught in two separate localities. Fisheries Science, 62:634-638. 500
https://doi.org/10.2331/fishsci.62.634 501
22
Nakayama, S., Masuda, R., Shoji, J., Takeuchi, T., & Tanaka, M. (2003) Effect of prey items on 502
the development of schooling behavior in chub mackerel Scomber japonicus in the 503
laboratory. Fisheries Science, 69:670-676. https://doi.org/10.1046/j.1444-504
2906.2003.00673.x 505
National Research Council (2011) Nutrient requirements of fish and shrimp (pp. 102-134, 286-506
298). Washington, DC: The National Academies Press. https://doi.org/10.17226/13039 507
Ohshimo, S., Tawa, A., Ota, T., Nishimoto, S., Ishihara, T., Watai, M., Satoh, K., Tanabe, T., & 508
Abe, O. (2017) Horizontal distribution and habitat of Pacific Bluefin tuna, Thunnus 509
orientalis, larvae in the waters around Japan. Bulletin of Marine Science, 93:769-787. 510
https://doi.org/10.5343/bms.2016.1094 511
Okochi, Y., Abe, O., Tanaka, S., Ishihara, Y., & Shimizu, A. (2016) Reproductive biology of 512
female Pacific bluefin tuna, Thunnus orientalis, in the Sea of Japan. Fisheries Research, 513
174:30-39. https://doi.org/10.1016/j.fishres.2015.08.020 514
Ortega, A., & Mourente, G. (2010) Comparison of the lipid profiles from wild caught eggs and 515
unfed larvae of two scombroid fish: northern bluefin tuna (Thunnus thynnus L., 1758) and 516
Atlantic bonito (Sarda sarda Bloch, 1793). Fish Physiology and Biochemistry, 36:461-517
471. https://doi.org/10.1007/s10695-009-9316-8 518
Park, Y., Albright, K. J., Cai, Z. Y., & Pariza, M. W. (2001) Comparison of methylation 519
procedures for conjugated linoleic acid and artifact formation by commercial 520
(trimethylsilyl)diazomethane. Journal of Agricultural and Food Chemistry, 49:1158-1164. 521
https://doi.org/10.1021/jf001209z 522
Paulsen, M., Clemmensen, C., & Malzahn, A. (2014) Essential fatty acid (docosahexaenoic acid, 523
DHA) availability affects growth of larval herring in the field. Marine Biology, 161:239-524
244. https://doi.org/10.1007/s00227-013-2313-6 525
Perga, M.-E., Bec, A., & Anneville, O. (2009) Origins of carbon sustaining the growth of 526

23
whitefish Coregonus lavaretus early larval stages in Lake Annecy: insights from fatty-527
acid biomarkers. Journal of Fish Biology, 74:2-17. https://doi.org/10.1111/j.1095-528
8649.2008.02105.x 529
Peters, J., Diekmann, R., Clemmesen, C., & Hagen, W. (2015) Lipids as a proxy for larval 530
starvation and feeding condition in small pelagic fish: a field approach on match-531
mismatch effects on Baltic sprat. Marine Ecology Progress Series, 531:277-292. 532
https://doi.org/10.3354/meps11292 533
Saito, H., Ishihara, K., & Murase, T. (1996) Effect of prey lipids on the docosahexaenoic acid 534
content of total fatty acids in the lipids of Thunnus albacares yellowfin tuna. Bioscience, 535
Biotechnology, and Biochemistry, 60:962-965. https://doi.org/10.1271/bbb.60.962 536
Sargent, J. R., Tocher, D. R., & Bell, J. G. (2003) The lipids. In J. E. Halver, & R. W. Hardy 537
(Eds.), Fish nutrition (3rd ed.) (pp. 181-257). San Diego, CA: Academic Press. 538
https://doi.org/10.1016/B978-012319652-1/50005-7 539
Tanabe, T., Suzuki, T., Ogura, M., & Watanabe, Y. (1999) High proportion of docosahexaenoic 540
acid in the lipid of juvenile and young skipjack tuna, Katsuwonus pelamis from the 541
tropical western Pacific. Fisheries Science, 65:806-807. 542
https://doi.org/10.2331/fishsci.65.806 543
Teodósio, M. A., Garrido, S., Peters, J., Leitão, F., Ré, P., Peliz, A., & Santos, A. M. P. (2017) 544
Assessing the impact of environmental forcing on the condition of anchovy larvae in the 545
Cadiz Gulf using nucleic acid and fatty acid-derived indices. Estuarine, Coastal and Shelf 546
Science, 185:94-106. https://doi.org/10.1016/j.ecss.2016.10.023 547
Turkmen, S., Castro, P. L., Caballero, M. J., Hernández-Cruz, C. M., Saleh, R., Zamorano, M. J., 548
Regidor, J., & Izquierdo, M. (2017) Nutritional stimuli of gilthead seabream (Sparus 549
aurata) larvae by dietary fatty acids: effects on larval performance, gene expression and 550
neurogenesis. Aquaculture Research, 48:202-213. https://doi.org/10.1111/are.12874 551

24
Uotani, I., Matsuzaki, K., Makino, Y., Noda, K., Inamura, O., & Horikawa, M. (1981) Food 552
habits of larvae of tunas and their related species in the area northwest of Australia. 553
Bulletin of the Japanese Society of Scientific Fisheries, 47:1165-1172. 554
https://doi.org/10.2331/suisan.47.1165 555
Uotani, I., Saito, T., Hiranuma, K., & Nishikawa, Y. (1990) Feeding habit of Bluefin Tuna 556
Thunnus thynnus larvae in the western North Pacific Ocean. Nippon Suisan Gakkaishi, 557
56:713-717. https://doi.org/10.2331/suisan.56.713 558
Watanabe, T., Murase, T., & Saito, H. (1995) Specificity of fatty acid composition of highly 559
migratory fish. A comparison of docosahexaenoic acid content in total lipids extracted in 560
various organs of bonito (Euthynnus pelamis). Comparative Biochemistry and Physiology 561
B, 111:691-695. https://doi.org/10.1016/0305-0491(95)00040-F 562
563
25
Figure Legends 564
Fig. 1 Typical gas chromatograms of fatty acid methyl esters prepared by direct 565
saponification/methylation method. (a) Products of a single wild Pacific bluefin tuna larva, 566
and (b) products in a blank test using no larva. *Phthalic acid di-ester identified in other 567
tuna samples by mass spectrometry (m/z = 149). 568
569
Fig. 2 Reproducibility and applicability of the direct saponification/methylation method for the 570
preparation of fatty acid methyl esters. (a) Mean proportions, standard deviations, and 571
coefficient of variations (numbers above bars) of major fatty acids obtained from replicated 572
preparations (n = 6) of methyl esters from a tuna muscle sample, and (b) content of total 573
fatty acids as a function of the dry weight of developing tuna muscle (n = 11 muscle 574
samples from a tuna individual). 575
576
Fig.3 Non-metric multidimensional scaling (MDS) plot of Pacific bluefin tuna caught in Japan 577
sea (crosses), in around Nansei Islands (shaded circles), yellowfin tuna (open squares) and 578
skipjack (open triangles) using 44 fatty acids present in proportions >0.1 mol% (two-579
dimensional stress = 0.18). 580
581
Fig. 4 Plots of six major fatty acid proportions (mol% of total fatty acids) (a-f) and DHA/EPA 582
ratios (g) vs. standard lengths of wild tuna larvae. 583
584


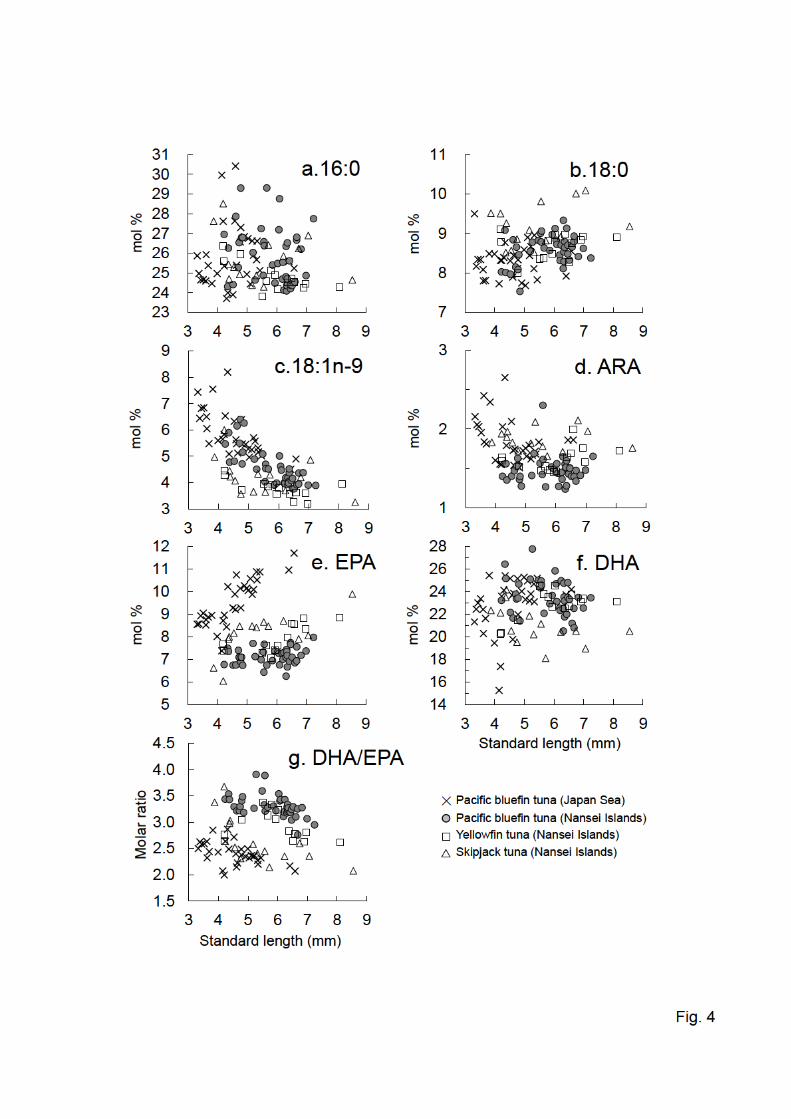

Table 1. Fatty acid content and fatty acid composition of wild tuna larvae collected from the waters around Japan
Common name Pacific bluefin tuna Pacific bluefin tuna Yellowfin tuna Skipjack tuna
Scientific name Thunnus orientalis Thunnus orientalis Thunnus albacares Katsuwonus palamis
Location Japan Sea Nansei Islands Nansei Islands Nansei Islands
Number n = 31 n = 41 n = 14 n = 14
Standard length (mm) 4.55 ± 0.81 5.80 ± 0.81 5.97 ± 1.04 5.47 ± 1.26
Body height (mm) 0.63 ± 0.26 1.14 ± 0.22 1.42 ± 0.37 0.96 ± 0.52
Dry weight of trunk (mg) 0.12 ± 0.08 0.22 ± 0.11 0.27 ± 0.19 0.16 ± 0.19
Total fatty acids (nmol/trunk)1 18.11 ± 12.76 34.13 ± 14.08 44.47 ± 27.98 27.15 ± 28.42
Fatty acid content (nmol/mg)2 147.4 ± 63.2 a 168.9 ± 61.2 a 197.3 ± 94.4 a 219.7 ± 120.1 a
Fatty acid composition (mol%)3
14:0 3.43 ± 0.79 a 3.50 ± 0.47 a 2.94 ± 0.31 a 2.93 ± 0.50 a
14:1n-5 0.12 ± 0.06 a 0.19 ± 0.11 b 0.09 ± 0.04 a 0.14 ± 0.07 ab
iso-15:0 0.22 ± 0.05 a 0.19 ± 0.03 ab 0.15 ± 0.04 b 0.15 ± 0.04 b
15:0 1.16 ± 0.22 a 1.52 ± 0.14 b 1.50 ± 0.10 b 1.51 ± 0.13 b
iso-16:0 0.14 ± 0.06 a 0.21 ± 0.20 a 0.15 ± 0.05 a 0.18 ± 0.08 a
16:0 25.84 ± 1.54 a 25.88 ± 1.41 a 24.80 ± 0.69 a 25.72 ± 1.23 a
16:1n-7+16:1n-9 3.54 ± 0.95 a 4.38 ± 1.13 b 5.33 ± 0.46 b 5.12 ± 0.77 b
16:1n-5 0.45 ± 0.23 a 0.63 ± 0.36 a 0.61 ± 0.23 a 0.36 ± 0.28 a
iso-17:0 0.25 ± 0.07 a 0.34 ± 0.12 b 0.29 ± 0.06 ab 0.24 ± 0.04 a
anteiso-17:0 0.21 ± 0.04 a 0.22 ± 0.05 a 0.23 ± 0.04 a 0.19 ± 0.03 a
16:2n-4 0.33 ± 0.20 a 0.37 ± 0.15 a 0.50 ± 0.08 a 0.40 ± 0.12 a
7-Me-16:1 0.90 ± 0.14 ab 1.04 ± 0.14 b 0.98 ± 0.11 ab 0.79 ± 0.21 a
17:0 1.93 ± 0.17 a 2.55 ± 0.17 b 2.51 ± 0.23 b 2.34 ± 0.24 b
17:1n-7+17:1n-8 0.16 ± 0.07 a 0.28 ± 0.09 b 0.33 ± 0.09 b 0.33 ± 0.05 b
iso-18:0 0.49 ± 0.18 a 0.36 ± 0.07 b 0.29 ± 0.04 b 0.25 ± 0.07 b
16:4n-1 0.30 ± 0.13 a 0.40 ± 0.07 b 0.44 ± 0.04 b 0.44 ± 0.10 b
18:0 8.29 ± 0.41 a 8.59 ± 0.37 a 8.68 ± 0.32 ab 9.19 ± 0.51 b
18:1n-13 0.11 ± 0.06 a 0.11 ± 0.03 a 0.09 ± 0.03 a 0.08 ± 0.03 a
18:1n-9 5.85 ± 0.85 a 4.55 ± 0.70 b 3.77 ± 0.33 c 4.23 ± 0.68 bc
18:1n-7 2.27 ± 0.28 ab 2.23 ± 0.52 a 2.65 ± 0.21 bc 2.85 ± 0.33 c
18:1n-5 0.26 ± 0.12 a 0.31 ± 0.11 a 0.31 ± 0.11 a 0.20 ± 0.14 a
18:2n-6 1.64 ± 0.10 ab 1.54 ± 0.13 b 1.58 ± 0.15 ab 1.83 ± 0.32 a
18:2n-4 0.10 ± 0.04 a 0.20 ± 0.10 b 0.29 ± 0.06 c 0.30 ± 0.09 c
18:3n-6 0.20 ± 0.24 a 0.13 ± 0.06 a 0.11 ± 0.05 a 0.14 ± 0.08 a
19:0 0.33 ± 0.06 a 0.50 ± 0.05 b 0.44 ± 0.07 bc 0.41 ± 0.10 ac
18:3n-3 0.57 ± 0.08 a 0.53 ± 0.13 a 0.76 ± 0.17 b 0.78 ± 0.21 b
18:4n-3 1.54 ± 0.40 a 1.15 ± 0.16 b 1.36 ± 0.17 ab 1.36 ± 0.21 ab
18:4n-1 0.01 ± 0.03 a 0.01 ± 0.06 a 0.14 ± 0.43 a 0.00 ± 0.00 a
20:0 0.41 ± 0.09 a 0.33 ± 0.02 b 0.32 ± 0.03 b 0.33 ± 0.06 b
20:1n-11+20:1n-9 0.21 ± 0.15 a 0.14 ± 0.08 a 0.17 ± 0.45 a 0.15 ± 0.14 a
20:1n-7 0.13 ± 0.39 a 0.06 ± 0.02 a 0.05 ± 0.02 a 0.07 ± 0.01 a
20:2n-6 0.10 ± 0.04 a 0.11 ± 0.02 a 0.09 ± 0.01 a 0.10 ± 0.04 a
20:3n-6 0.16 ± 0.09 a 0.14 ± 0.04 a 0.14 ± 0.02 a 0.16 ± 0.03 a
20:4n-6 (ARA) 1.84 ± 0.27 a 1.48 ± 0.17 b 1.61 ± 0.14 bc 1.86 ± 0.13 ac
20:4n-3 0.52 ± 0.12 a 0.53 ± 0.11 a 0.73 ± 0.20 b 0.66 ± 0.15 ab
20:5n-3 (EPA) 9.56 ± 1.00 a 7.13 ± 0.37 b 7.87 ± 0.62 bc 8.12 ± 0.88 c
22:0 0.20 ± 0.09 a 0.25 ± 0.08 a 0.26 ± 0.05 a 0.25 ± 0.21 a
21:5n-3 0.18 ± 0.05 a 0.15 ± 0.04 a 0.14 ± 0.02 a 0.18 ± 0.04 a
22:4n-6 0.72 ± 0.19 a 0.89 ± 0.12 b 0.94 ± 0.10 ab 0.85 ± 0.27 ab
22:5n-6 1.21 ± 0.20 a 1.90 ± 0.20 b 1.91 ± 0.13 b 2.10 ± 0.24 b
22:5n-3 0.63 ± 0.26 a 0.57 ± 0.09 a 0.70 ± 0.16 ab 0.92 ± 0.25 b
24:0 0.01 ± 0.04 a 0.08 ± 0.10 ab 0.18 ± 0.07 b 0.10 ± 0.15 ab
22:6n-3 (DHA) 22.90 ± 2.36 ab 23.48 ± 1.54 b 22.82 ± 1.28 ab 20.98 ± 1.62 a
24:1n-9 0.37 ± 0.21 a 0.49 ± 0.30 a 0.37 ± 0.09 a 0.38 ± 0.16 a
Others 0.22 0.36 0.36 0.32
DHA/EPA ratio 2.40 ± 0.21 a 3.29 ± 0.21 b 2.92 ± 0.26 c 2.63 ± 0.45 ac
Results are means ± SD of individual larvae. Values bearing different superscript letters are significantly different (P < 0.05).1 Absolute amount of total fatty acids determined for trunk samples.
2 Content of total fatty acids based on dry weight of trunk.
3 Mole % of total fatty acids.