a simplified method for computing vsl - bottleneckocw.nctu.edu.tw/course/itca032/lect3b.pdf ·...
TRANSCRIPT

Shangwuppt.com
A Simplified Method for Computing VSL-Bottleneck

Shangwuppt.com
Control Parameters
A Simplified Method for Computing VSL-Bottleneck
TL qL
Control Boundaries
Target VSL speed
Number of VSL signs
a
a
a
qvk
c
c
qv
Step 1
Identify the bottleneck capacity: ; and key parameters:
,c cq vck
Shangwuppt.com
Identify the Maximum queue length under no control scenario .
Compute the approaching traffic flow characteristics
Estimate the target control density:
A Simplified Method for Computing VSL-Bottleneck
Step 2
qL
Step 3
, , .a a aq v k
Step 4
(1 )VSL a ck k kα α= + −

Shangwuppt.com
Compute the target VSL speed :
Compute the transition length :
Compute the NO. of VSL signs:
A Simplified Method for Computing VSL-Bottleneck
Step 5
v∗
Step 6
TL
Step 7
10
a
mph
v v∗−
c
VSL
qvk
∗ =
( , )a aTL f v v v∗= −


Shangwuppt.com
Basic Ramp Metering Concept
• Pre-timed local ramp control: Required Information - Offline flow rate on the upstream and downstream segments of
the target ramp. - Capacity on the upstream and downstream freeway segments of
the target ramp. - Maximum merging rate from the on-ramp. - Maximum allowable queue length.
Shangwuppt.com
• Basic concept Metering rate for time interval k (5-15 mins)
• Deficiencies - Uncertainty in demand - Capacity ? - Maximum queue length factor (waiting time) - Unknown lane distribution - Flow rate does not represent the congestion level
Metering Rate
Equivalent rate
Downstream flow rate+ ≤
Capacity at the merging
point
From mainline flow
(For any preselected time interval)
Shangwuppt.com
F1VOL MCAP
FVOL FCAP
MR
O
O
Q
Q
I
I
Stop line
Ramp Metering Signal
Advance Ramp Control Warning Sign
Demand Detector
Passage Detector
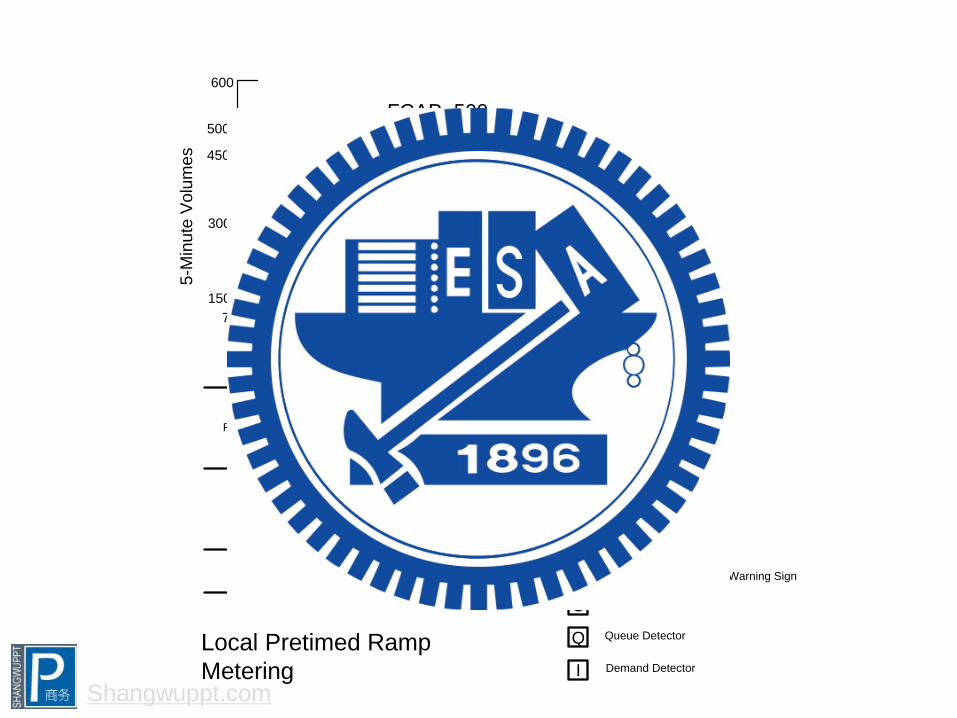
Queue DetectorLocal Pretimed Ramp Metering
MR+FVOL ≤FCAPFVOL≤DF MR≤DR
600
500
450
300
1507:00 AM 7:10 7:20 7:30 7:40 7:50 8:00
Time
5-M
inut
e V
olum
es
FCAP=500
Shangwuppt.com
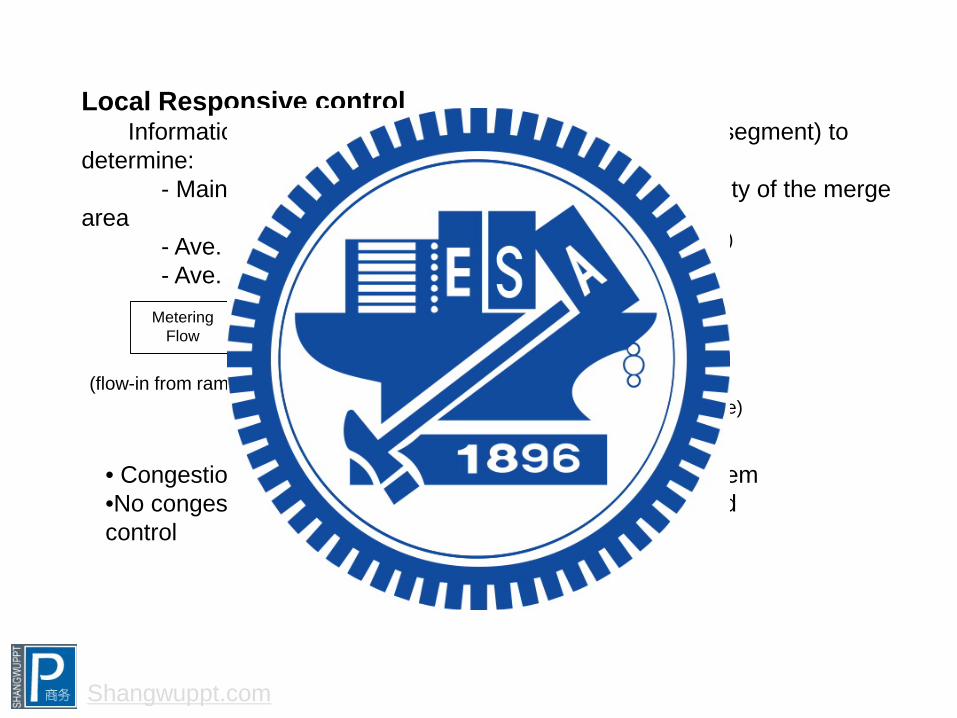
Metering Flow
Conversion Factor
Mainline flow rate+ ≤ Merging
capacity
Local Responsive control Information: Use the detectors (on the freeway mainline segment) to determine: - Mainline flow rate, occupancy in the immediate vicinity of the merge area - Ave. ramp demand - Ave. ramp queue and max. queue
(flow-in from ramp)
(Convert from occupancy/detected)
(One can set control objective here)
• Congestion in the downstream segment → feedback system •No congestion in the downstream segment → feed forward control

Shangwuppt.com
Local Traffic Responsive Ramp Metering
P
D
Q
Q
D
M
Stop line
Ramp Metering Signal
Advance Ramp Control Warning Sign With Flashing Beacons
Merge Detector (Optional)
Demand Detector (Required)
Queue Detector (Optional)
VF
Freeway
M
Frontage road or surface street
Passage Detector (Optional)P
Freeway merge flowFFreeway mainline flowV
Shangwuppt.com
Adaptive Local Responsive Ramp Metering Information: - Volume and occupancy data on both the freeway upstream and downstream segments - Ramp demand and ramp queue Core concept: • Compare the upstream and downstream congestion level to determine the metering rate • The congestion level is monitored by freeway detectors • The downstream detectors can also be used to monitor the max flow rate and merging flow rate • One can set control objectives on the target level of operations
Deficiencies: • Demand uncertainties and queue time • Local optimum → vs. system optimum → at the cost of waiting time for drivers at other ramps. • Point detectors → point congestion • Mainline flow variation • Same deficiencies as local signal control

Shangwuppt.com
Adaptive Local Traffic Responsive Ramp Metering
½ MILE
P
D
Q
Q
D
M
Stop line
Ramp Metering Signal
Advance Ramp Control Warning Sign With Flashing Beacons
Merge Detector (Optional)
Demand Detector (Required)
Queue Detector (Optional)
VF
Freeway
M
Frontage road or surface street
Passage Detector (Optional)P
Freeway merge flowFFreeway mainline flowV
V
V VV V
FV
V VV
Shangwuppt.com
Outline • Basic ALINEA (Traffic Modeling &
Control Algorithm)
• “use density or occupancy, but not speed or flow rate for control.

Shangwuppt.com
Related Literature • ALINEA: A Local Feedback Control Law For On-
Ramp Metering. Markos Papageorgiou, Habib Hadj-Salem, Jean-Marc Blossville. Transportation Research Record, 1320 (1991), pp. 58-64
• ALINEA Local Ramp Metering-Summary of Field Results. M. Papageorgiou, H. Hadj-Salem, F. Middelham. Transportation Research Record, 1603 (1997), pp. 90-98
• A flow-maximizing adaptive local ramp metering strategy. Emmanouil Smaragdis, Markos Papageorgiou, Elias Kosmatopoulos. Transportation Research Part B, 38 (2004), pp. 251-270
Shangwuppt.com
Traffic Modeling (1)
[ ( ) ( ) ( )]( ) (1)in outq t r t q ttρ δ+ −=
1) Flow-Density Relationship
Location Site
upstream traffic volume
on-ramp traffic volume
downstream traffic volume
stretch length
traffic density
( )tρ
inrEq-1 shows the density change over time
Shangwuppt.com
Responsive ramp metering control
ˆ( ) ( 1) ( ( ))R outr k r k K o o k= − + −
2) Replace density with Occupancy
100
outoρ αµα λ
=
=
number of lanes of the mainstream
mean effective vehicle length
Shangwuppt.com
3) Assume as a nonlinear function of ( )outq t ( )outo t
( ) [ ( )]out outq t Q o t=
downstream traffic volume downstream occupancy
( ) [ ( ) ( ) ( ( ))] / (2)out in outo t q t r t Q o t δα= + −

Shangwuppt.com
One can also use downstream speed as a supplement
control indicator
