a simplified pavement design tool - county...
TRANSCRIPT

A Simplified Pavement Design Tool
www.PaveXpressDesign.com
Marshall Klinefelter Maryland Asphalt Association September 25, 2015

Brief Overview • Why PaveXpress? • What Is PaveXpress? • An Introduction • Overview of the System • Design Scenarios Using
PaveXpress
www.PaveXpressDesign.com 2

AASHTO has been developing MEPDG for high volume roads, but a gap has developed for local roads and lower volume roads.
www.PaveXpressDesign.com 3

What Is PaveXpress? A free, online tool to help you create simplified pavement designs using key engineering inputs, based on the AASHTO 1993 and 1998 supplement pavement design process.
• Accessible via the web and mobile devices • Free — no cost to use • Based on AASHTO pavement design equations • User-friendly • Share, save, and print project designs • Interactive help and resource links
www.PaveXpressDesign.com 4

The equation was derived from empirical information obtained at the AASHO Road Test.
The solution represents the average amount of traffic that can be sustained by a roadway before deteriorating to some terminal level of serviceability, according to the supplied inputs.
www.PaveXpressDesign.com 5
1993 AASHTO Design Guide Equation — Basic Overview

www.PaveXpressDesign.com 6
Where: W18 = the predicted number of 18-kip equivalent single axle load (ESAL) applications ZR = standard normal deviate S0 = combined standard error of the traffic prediction and performance prediction ΔPSI = difference between the initial design serviceability index (pi) and the design
terminal serviceability index (pt) MR = resilient modulus of the subgrade (psi)
log10 𝑊18 = 𝑍𝑅 × 𝑆0 +9.36 × log10 𝑆𝑆 + 1 − 0.20 +log10
∆𝑃𝑆𝑃4.2 − 1.5
0.4 + 1094𝑆𝑆 + 1 5.19
+ 2.32 × log10 𝑀𝑅 − 8.07
1993 AASHTO Design Guide Equation — Basic Overview

1993 AASHTO Design Guide Equation — Basic Overview The designer inputs data for all of the variables except for the structural number (SN), which is indicative of the total pavement thickness required.
Once the total pavement SN is calculated, the thickness of each layer within the pavement structure is calculated
Where: ai = ith layer coefficient Di = ith layer thickness (inches) mi = ith layer drainage coefficient
www.PaveXpressDesign.com 7
𝑆𝑆 = 𝑎1𝐷1 + 𝑎2𝐷2𝑚2 + 𝑎3𝐷3𝑚3 + … +aiDimi 𝑆𝑆 = 𝑎1𝐷1 + ∑ aiDimi 𝑛2
General Guidance • The solution represents the pavement thickness for which the
mean value of traffic which can be carried given the specific inputs. That means there is a 50% chance that the terminal serviceability level could be reached in less time than the period for which the pavement was designed.
• As engineers, we tend to want to be conservative in our work. Understand that as we use values that are more and more conservative, the pavement thickness increases and the overall cost also increases.
www.PaveXpressDesign.com 8

General Guidance • A reliability factor is included to decrease the risk of premature
deterioration below acceptable levels of serviceability.
• In order to properly apply the reliability factor, the inputs to the design equation should be the mean value, without any adjustment designed to make the input “conservative.”
• The pavement structure most likely to live to its design life will be the one with the most accurate design inputs. Whenever possible, perform materials testing and use actual traffic counts rather than relying on default values or guessing (too much!) regarding anticipated traffic levels.
www.PaveXpressDesign.com 9

Screen 1
www.PaveXpressDesign.com 10

1) Project Name is an open field, allowing the user to input any desired information.
2) Description is an open field, allowing the user to input any desired information.
3) Estimated Completion Year field is used to extrapolate the growth in traffic that may occur while the project is being constructed. Traffic data inputs use data beginning in completion year.
4) State uses a drop-down box that allows the user to select the state.
www.PaveXpressDesign.com 11
Screen 1

5) Roadway Classification drop-down box allows the user to indicate the functional classification that best describes how the pavement will be used. In PaveXpress, the selection affects default values for design period, reliability, and initial & terminal serviceability index. These default values can be overridden by the user.
Access control is a key factor in the realm of functional classification. For example, all Interstates are “limited access” or “controlled access” roadways. “Access” refers to the ability to access the roadway and not the abutting land. It is difficult to find hard-and-fast rules defining classifications, so some degree of judgment must be exercised here.
www.PaveXpressDesign.com 12
Screen 1

Roadway Classifications Interstate: All routes that comprise the Dwight D. Eisenhower National System of Interstate and Defense Highways belong to the “Interstate” functional classification category and are considered Principal Arterials.
Arterials/Highways: The roads in this classification have directional travel lanes are usually separated by some type of physical barrier, and their access and egress points are limited to on- and off-ramp locations or a very limited number of at-grade intersections. These roadways serve major centers of metropolitan areas, provide a high degree of mobility. They can also provide mobility through rural areas. Unlike their access-controlled counterparts, abutting land uses can be served directly.
Local: Local roads are not intended for use in long distance travel, due to their provision of direct access to abutting land. Bus routes generally do not run on Local Roads. They are often designed to discourage through traffic. Collectors serve a critical role in the roadway network by gathering traffic from Local Roads and funneling them to the Arterial network.
Residential/Collector: The roads in this classification have the lowest traffic loadings and are basically comprised of automobiles and periodic truck service traffic, such as garbage trucks, etc. The “Collector” name appended to this classification fits more with the “Local” classification above, i.e., “Collector/Local.”
www.PaveXpressDesign.com 13

6) Project Type drop-down box allows the user to indicate the type of pavement being designed:
• New Asphalt, 1993 AASHTO Design Guide • New Concrete, 1998 Supplement • AC Overlay on Asphalt, 1993 Guide • AC Overlay on Concrete or Composite
(No Design Performed)
This presentation will focus on New Asphalt designs and AC Overlay on Asphalt designs
www.PaveXpressDesign.com 14
Screen 1

www.PaveXpressDesign.com 15
Screen 2

1) Design Period is the length of time the design is intended to last before the pavement reaches the end of its serviceable life and requires rehabilitation.
2) Reliability Level (R) is the probability that a pavement section designed using the process will perform satisfactorily over the traffic and environmental conditions for the design period. This is then used to determine the corresponding ZR.
www.PaveXpressDesign.com 16
Screen 2
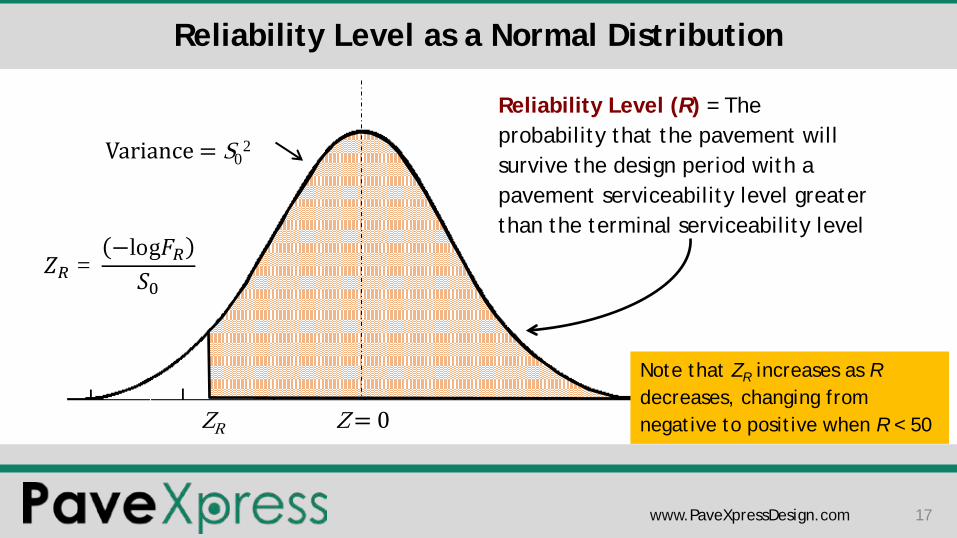
Reliability Level (R) = The probability that the pavement will survive the design period with a pavement serviceability level greater than the terminal serviceability level
Z = 0 ZR
𝑍𝑅 =−log𝐹𝑅
𝑆0
Variance = S02
Reliability Level as a Normal Distribution
Note that ZR increases as R decreases, changing from negative to positive when R < 50
www.PaveXpressDesign.com 17
AASHTO Suggested Reliability Levels For Various Functional Classifications
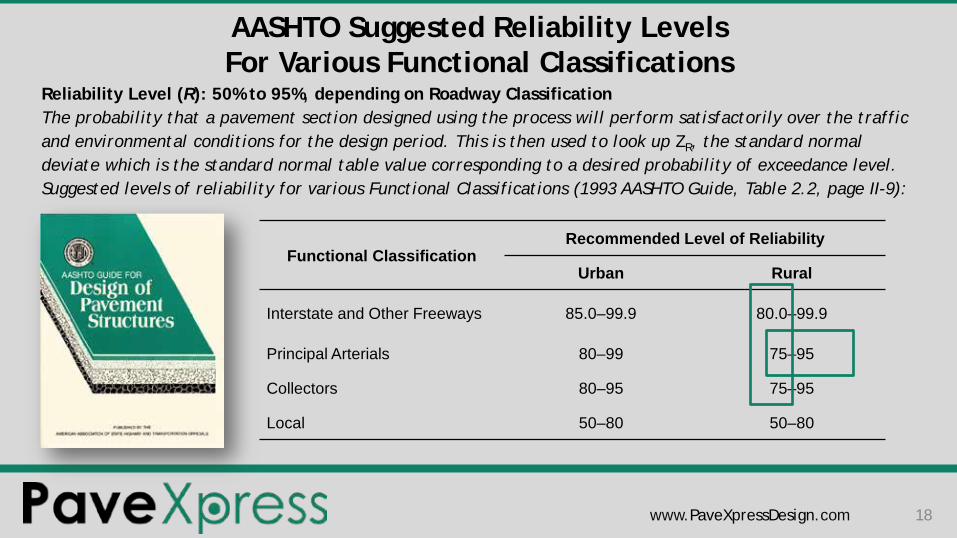
Reliability Level (R): 50% to 95%, depending on Roadway Classification The probability that a pavement section designed using the process will perform satisfactorily over the traffic and environmental conditions for the design period. This is then used to look up ZR, the standard normal deviate which is the standard normal table value corresponding to a desired probability of exceedance level. Suggested levels of reliability for various Functional Classifications (1993 AASHTO Guide, Table 2.2, page II-9):
Functional Classification Recommended Level of Reliability
Urban Rural
Interstate and Other Freeways 85.0–99.9 80.0–99.9
Principal Arterials 80–99 75–95
Collectors 80–95 75–95
Local 50–80 50–80
www.PaveXpressDesign.com 18

3) Combined Standard Error (S0) A variable that defines the overall design uncertainty involved in the traffic and performance design inputs (the likelihood that actual observed values during the pavement’s serviceable life will deviate from these inputs). It is not recommended to change this from 0.5 for flexible pavements.
www.PaveXpressDesign.com 19
Screen 2
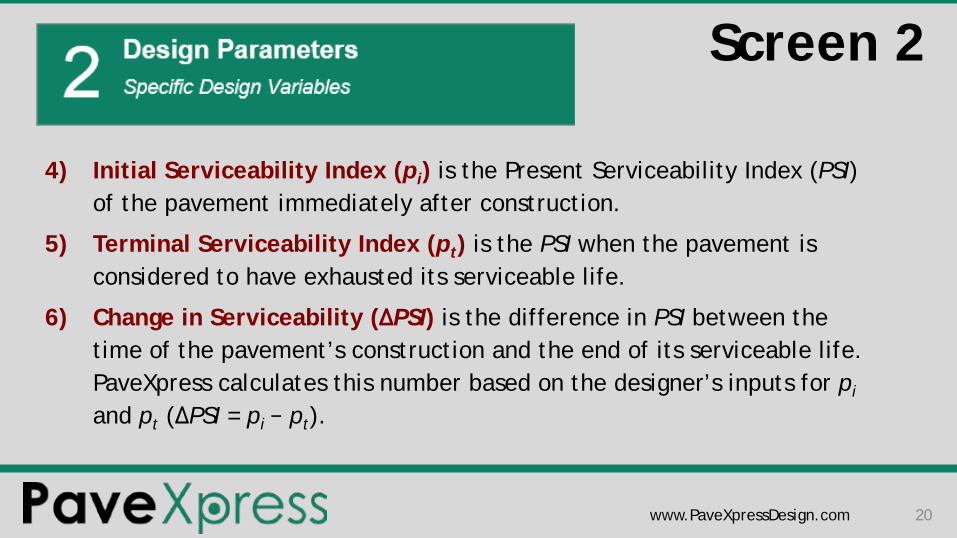
4) Initial Serviceability Index (pi) is the Present Serviceability Index (PSI) of the pavement immediately after construction.
5) Terminal Serviceability Index (pt) is the PSI when the pavement is considered to have exhausted its serviceable life.
6) Change in Serviceability (ΔPSI) is the difference in PSI between the time of the pavement’s construction and the end of its serviceable life. PaveXpress calculates this number based on the designer’s inputs for pi and pt (ΔPSI = pi − pt).
www.PaveXpressDesign.com 20
Screen 2

Present Serviceability Index Concept PS
I
Traffic 0
4
3
2
1
5
PaveXpress default range for terminal serviceability (pt)
PaveXpress default initial serviceability (pi)
www.PaveXpressDesign.com 21

Roadway Classification Effect On PaveXpress Default Values
Interstate Arterials/ Highway Local Residential/
Collector
Design Period 40 years 30 years 20 years 20 years
Reliability Level 95 85 75 50
Combined Standard Error (S0) 0.5 0.5 0.5 0.5
Initial Serviceability Index (pi) 4.5 4.5 4.5 4.5
Terminal Serviceability Index (pt) 3.0 3.0 2.0 2.0
Change in Serviceability (ΔPSI) 1.5 1.5 2.5 2.5
www.PaveXpressDesign.com 22
www.PaveXpressDesign.com 23
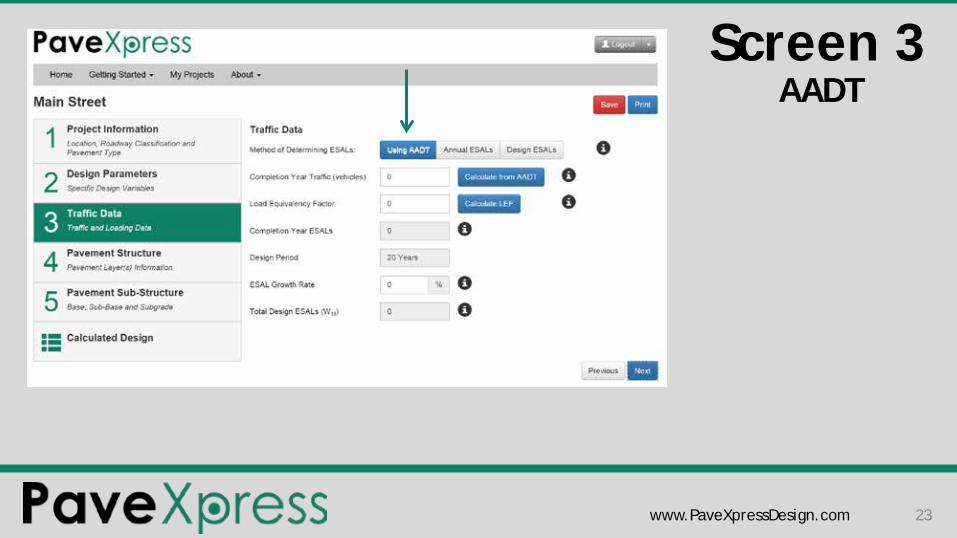
AADT Screen 3

1) Method of Determining ESALS by Average Annual Daily Traffic
www.PaveXpressDesign.com 24
Screen 3
www.PaveXpressDesign.com 25
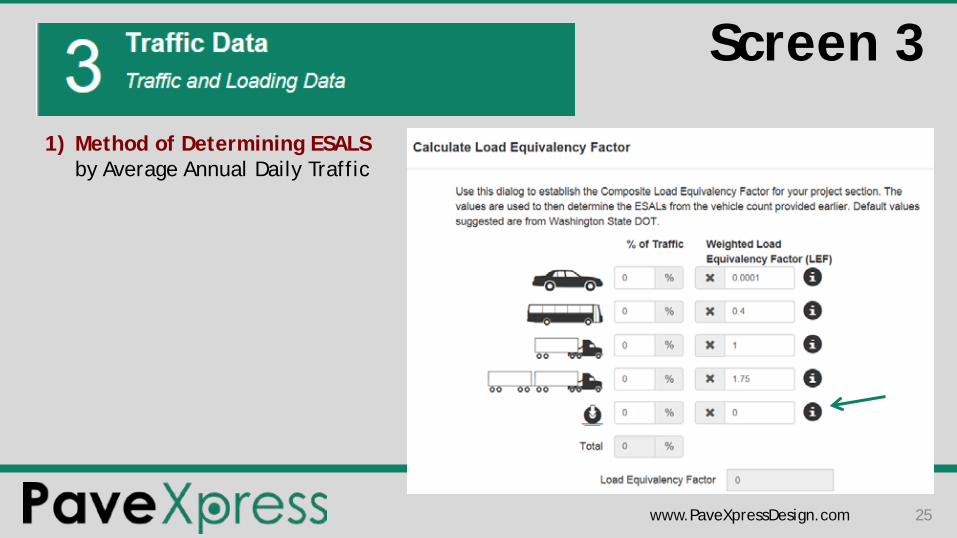
1) Method of Determining ESALS by Average Annual Daily Traffic
Screen 3

www.PaveXpressDesign.com 26
Annual ESALs Screen 3
www.PaveXpressDesign.com 27
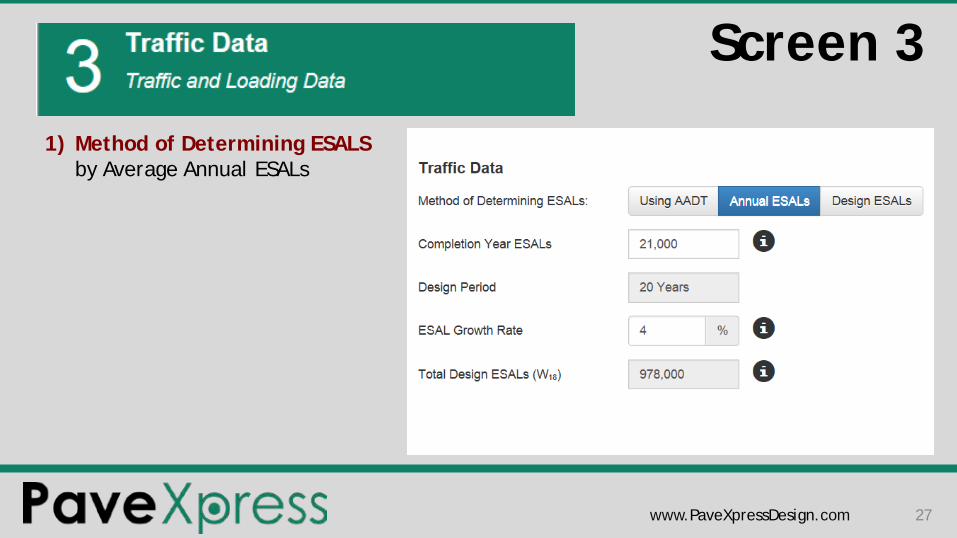
1) Method of Determining ESALS by Average Annual ESALs
Screen 3

www.PaveXpressDesign.com 28
Design ESALs Screen 3

Where Can I Find Traffic Data? • Many DOTs post their traffic count data online
• Contact the Traffic Division of the DOT
• Contact the Traffic Division of the city, if available
• If no official traffic count is available, conduct a short-term count
• Interview local people and businesses
The bottom line is, try to document in some way why you selected the number for input into the design software.
www.PaveXpressDesign.com 29

Examples of traffic data available online
www.PaveXpressDesign.com 30
Where Can I Find Traffic Data?

www.PaveXpressDesign.com 31
Multiple Asphalt Lifts
Screen 4
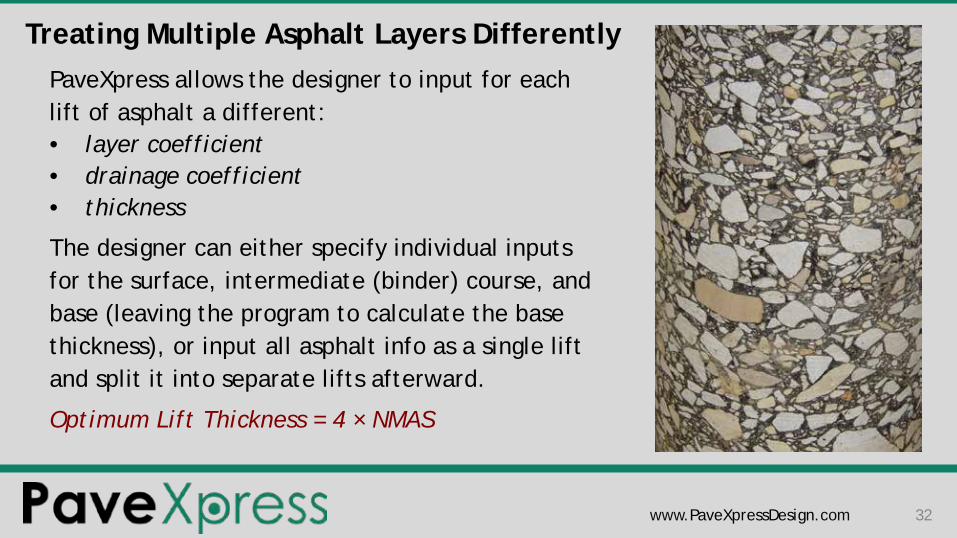
Treating Multiple Asphalt Layers Differently PaveXpress allows the designer to input for each lift of asphalt a different: • layer coefficient • drainage coefficient • thickness
The designer can either specify individual inputs for the surface, intermediate (binder) course, and base (leaving the program to calculate the base thickness), or input all asphalt info as a single lift and split it into separate lifts afterward.
Optimum Lift Thickness = 4 × NMAS
www.PaveXpressDesign.com 32

www.PaveXpressDesign.com 33
Single Asphalt Lifts
Screen 4

1) Layer Coefficient is a measure of the relative ability of the material to function as a structural component of the pavement. It is used with layer thickness to determine the structural number (SN).
2) Drainage Coefficient represents the relative loss of strength in a layer due to its drainage characteristics and the total time it is exposed to near-saturation moisture conditions. The designer may increase the value from the default of 1 when drainage conditions are favorable, decrease when drainage conditions are poor.
3) Minimum Thickness is the minimum allowable layer thickness (either per specification, or based on practical construction limitations of the material).
www.PaveXpressDesign.com 34
Screen 4

Layer Coefficient Considerations Average values of layer coefficients for materials used in the AASHO Road Test were as follows:
Asphalt Surface Course 0.44 Crushed Stone Base Course 0.14 Sandy Gravel Subbase 0.11
Keep in mind that these values were empirically derived from a road test with one climate, one soil type, and one asphalt mix type.
The asphalt layer coefficient used for the Road Test was actually a weighted average of values ranging from 0.33 to 0.83.
More recent studies at the NCAT Test Track found that for Alabama, an asphalt layer coefficient of 0.54 better reflected actual performance.
www.PaveXpressDesign.com 35

Drainage Coefficient Considerations
1993 Design Guide Table 2.4 — Recommended mi Values for Modifying Structural Layer Coefficients of Untreated Base and Subbase Materials in Flexible Pavements
Quality of Drainage
Percentage of Time Pavement Structure is Exposed to Moisture Levels Approaching Saturation
< 1% 1–5% 5–25% > 25%
Excellent 1.40–1.35 1.35–1.30 1.30–1.20 1.20
Good 1.35–1.25 1.25–1.15 1.15–1.00 1.00
Fair 1.25–1.15 1.15–1.05 1.00–0.80 0.80
Poor 1.15–1.05 1.05–0.80 0.80–0.60 0.60
Very Poor 1.05–0.95 0.95–0.75 0.75–0.40 0.40
www.PaveXpressDesign.com 36

Screen 4
www.PaveXpressDesign.com 37
www.PaveXpressDesign.com 38
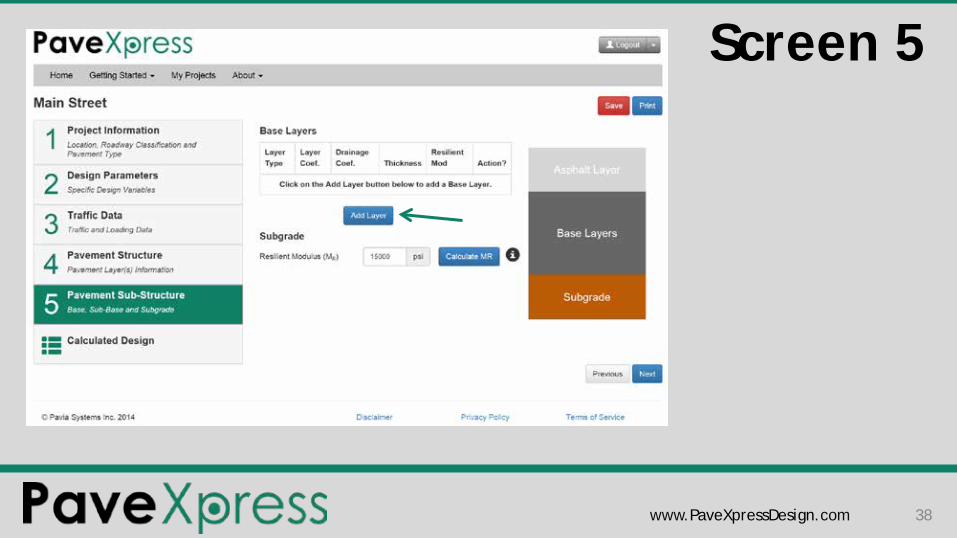
Screen 5

Adding an Aggregate Base Layer The designer can add an aggregate base layer (or any other type of base or subbase layer) here.
The default layer coefficients are reasonable, but can be overridden.
The default resilient modulus (MR) values came from SHRP2 research, and can also be overridden.
The AASHTO recommended minimum thickness values are:
4″ < 500 ESALs 6″ > 500 ESALs
www.PaveXpressDesign.com 39

Subgrade Considerations
The most common methods of classifying the subgrade for pavement design are:
• California Bearing Ratio (CBR)
• Resistance Value (R)
• Resilient Modulus (MR)
www.PaveXpressDesign.com 40

California Bearing Ratio (CBR) The CBR Test can be performed either in the lab(AASHTO T 193, ASTM D 1883) or in the field in situ (ASTM D4429).
The CBR is a simple test that compares the bearing capacity of a material with a standard well-graded crushed stone, which has a reference CBR value of 100%.
Fine-grained soils typically have values less than 20.
www.PaveXpressDesign.com 41

Using the Dynamic Cone Penetrometer to Estimate CBR
The Dynamic Cone Penetrometer (DCP) Test can be performed in the field in situ (ASTM D6951) and used to estimate CBR values.
The U.S. Army Engineers Waterways Experiment Station has developed the following relationship between Dynamic Penetration Index (DPI) and CBR:
DCP Testing at the NCAT Test Track
log10(CBR) = 2.46 − 1.12 log10 (DPI)
*Other correlations have been developed also.
www.PaveXpressDesign.com 42

Resistance Value (R) The Resistance Test is performed in the lab (AASHTO T 190, ASTM D 2844).
It tests both treated and untreated laboratory compacted soils or aggregates with a stabilometer and expansion pressure devices. It tests the ability of the material to resist lateral spreading due to an applied vertical load.
A range of values are established from 0 to 100, where 0 is the resistance of water and 100 is the resistance of steel.
www.PaveXpressDesign.com 43

Resilient Modulus (MR) The Resilient Modulus Test is performed in the lab (AASHTO T 307, ASTM D 2844).
It is a measure of the soil stiffness and tri-axially tests both treated and untreated laboratory compacted soils or aggregates under conditions that simulate the physical conditions and stress states of materials beneath flexible pavements subjected to moving wheel loads.
As a mechanistic test measuring fundamental material properties, it is often thought preferable to the empirical CBR and R-value tests.
www.PaveXpressDesign.com 44

Resilient Modulus (MR) PaveXpress uses some common empirical expressions used to estimate MR from CBR and R-values:
Although these equations may help the designer evaluate materials, it is usually best to determine MR directly through testing, if possible, rather than from the use of correlation equations.
MR = 2555 × CBR0.64
MR = 1000 + (555 × R)
www.PaveXpressDesign.com 45
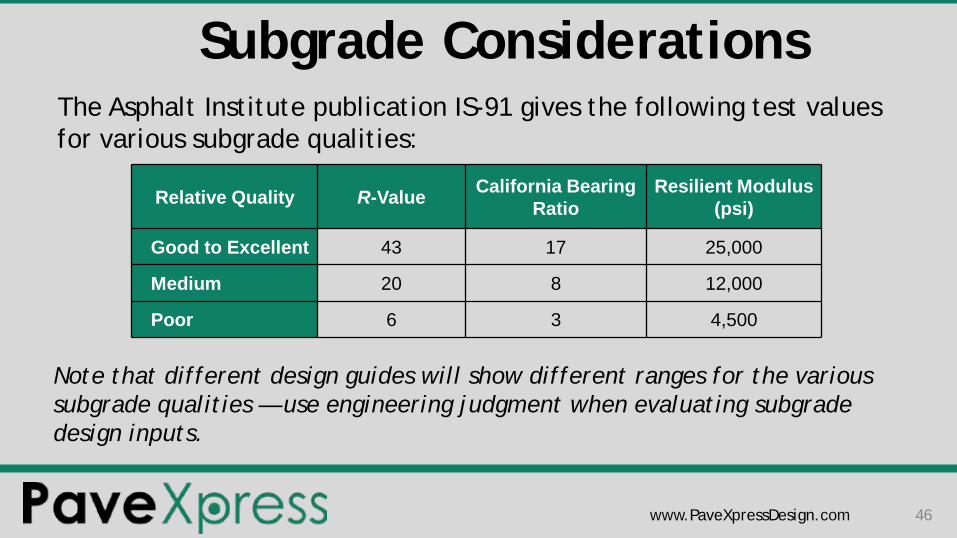
Subgrade Considerations The Asphalt Institute publication IS-91 gives the following test values for various subgrade qualities:
Relative Quality R-Value California Bearing Ratio
Resilient Modulus (psi)
Good to Excellent 43 17 25,000
Medium 20 8 12,000
Poor 6 3 4,500
Note that different design guides will show different ranges for the various subgrade qualities — use engineering judgment when evaluating subgrade design inputs.
www.PaveXpressDesign.com 46

www.PaveXpressDesign.com 47
Calculated Design
Screen 6

Recommendation:
Perform multiple iterations of the design with different plausible input values to get a sense of the range of pavement structures needed to carry the anticipated loads in various scenarios.
Use engineering judgment to select the optimum pavement structure.
www.PaveXpressDesign.com 48
Screen 6

PaveXpress for AC Overlay Design • AC Overlay Design for Flexible Pavement Rehabilitation Only
• Evaluation Methods for Existing AC Pavement – Condition Survey – Non-Destructive Deflection Testing
• Includes Questions on Coring and Milling – Delamination/Stripping – Top-Down or Bottom-Up Cracking
• Adjustment to Existing Pavement Layer Coefficients
www.PaveXpressDesign.com 49
www.PaveXpressDesign.com 50
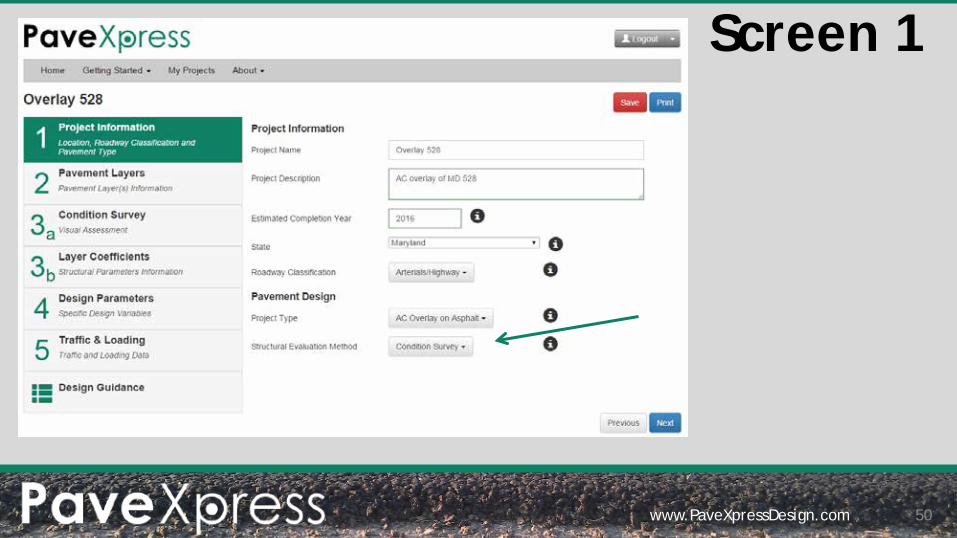
Screen 1

7) Structural Evaluation Method drop-down box allows the user to indicate the type of approach used to evaluate the existing pavement following one of two approaches in the 1993 Guide:
• Condition Survey • Nondestructive Testing (NDT)
www.PaveXpressDesign.com 51
Screen 1

www.PaveXpressDesign.com 52
Screen 2

1) Add Existing Layer: For the rehabilitation of an pavement, the existing pavement structure must be input. All like materials are grouped into a single layer. For example, all asphalt layers are combined. For each layer, the total thickness must be included. Layer types include:
• Asphalt — Dense Graded • Asphalt — Open Graded • Aggregate Base • Cement Treated Base • Bituminous Treated Base • Asphalt Stabilized Base • Subbase
www.PaveXpressDesign.com 53
Screen 2
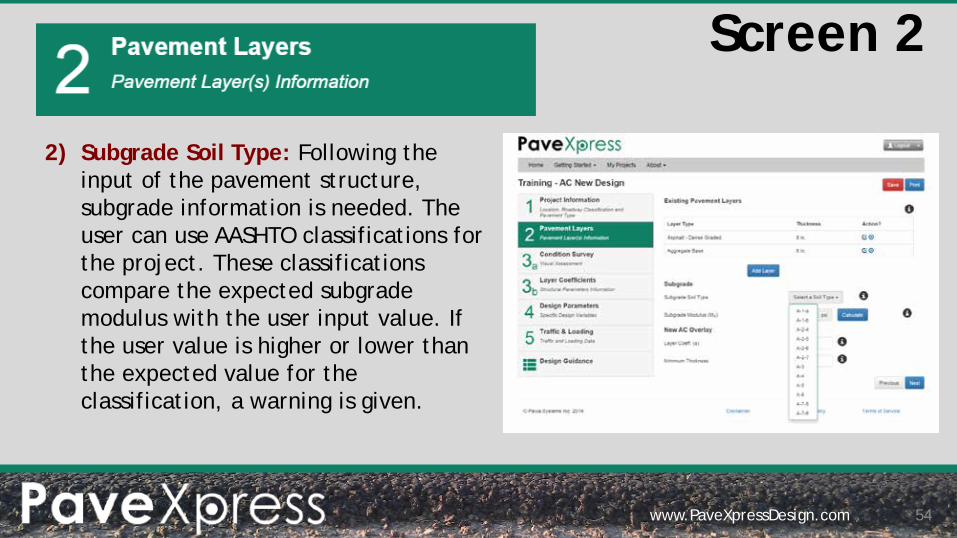
2) Subgrade Soil Type: Following the input of the pavement structure, subgrade information is needed. The user can use AASHTO classifications for the project. These classifications compare the expected subgrade modulus with the user input value. If the user value is higher or lower than the expected value for the classification, a warning is given.
www.PaveXpressDesign.com 54
Screen 2

3) Subgrade Modulus: As with the new design of an asphalt pavement, the overall structure needed to support the anticipated loading is highly dependent on subgrade strength. The user can enter a design modulus based on lab testing or a correlation with CBR or R-values
www.PaveXpressDesign.com 55
Screen 2

4) New AC Overlay: To calculate overlay thickness, two inputs regarding the asphalt material must be provided. First, what layer coefficient to use; a standard value is 0.44, but it can be altered by the designer. The second input is minimum lift thickness for the AC overlay. With most asphalt mixes, this depends on the NMAS. This value should reflect the common asphalt overlay material used.
www.PaveXpressDesign.com 56
Screen 2

Existing AC Pavement Evaluation: Two Options
www.PaveXpressDesign.com 57
Condition Survey Nondestructive Testing
www.PaveXpressDesign.com 58
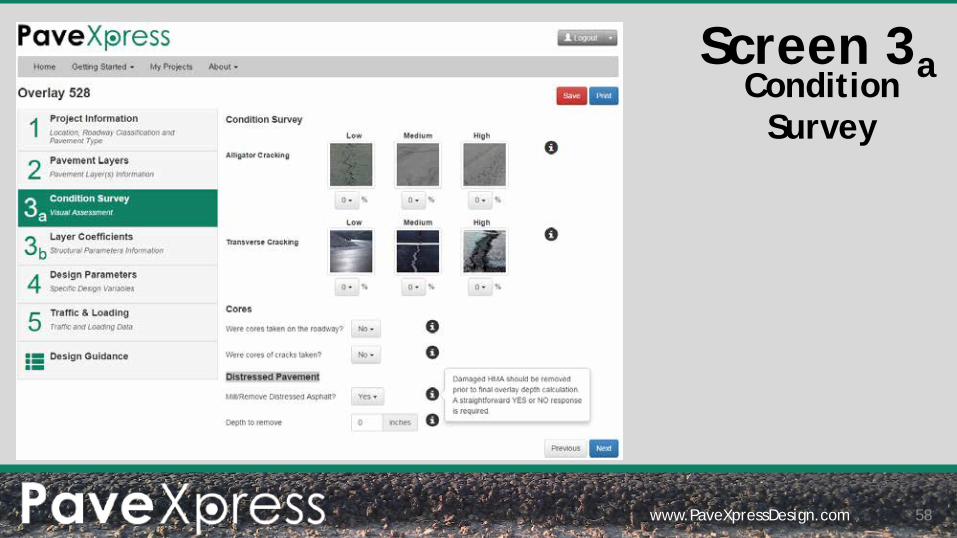
Condition Survey
Screen 3a

1) Condition Survey: This approach to assessing the existing pavement’s structural capacity relies on a visual condition survey. Two distress types —Alligator Cracking and Transverse Cracking — are evaluated and used in PaveXpress. For each distress type, a percentage by condition type (Low, Medium, or High) is recorded.
While rutting is considered in Chapter 5 of the 1993 Guide, it is highly recommended to mill surfaces that experience rutting.
www.PaveXpressDesign.com 59
Screen 3a

2) Cores: In addition to a visual assessment of the pavement, coring is critical. Coring will aid in confirming the existing pavement structure and retrieving material for lab testing. Just as importantly, cores can be used to determine the direction of cracking, along with the presence of delamination or stripping. The depth of cracks and location of delamination/stripping is used by PaveXpress to guide the user in determining depth of milling needed.
www.PaveXpressDesign.com 60
Screen 3a
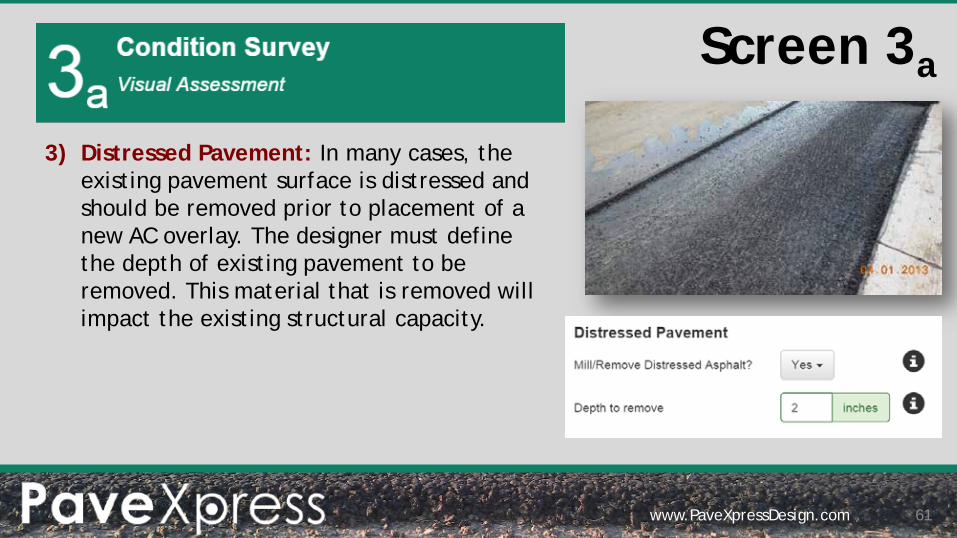
3) Distressed Pavement: In many cases, the existing pavement surface is distressed and should be removed prior to placement of a new AC overlay. The designer must define the depth of existing pavement to be removed. This material that is removed will impact the existing structural capacity.
www.PaveXpressDesign.com 61
Screen 3a
www.PaveXpressDesign.com 62
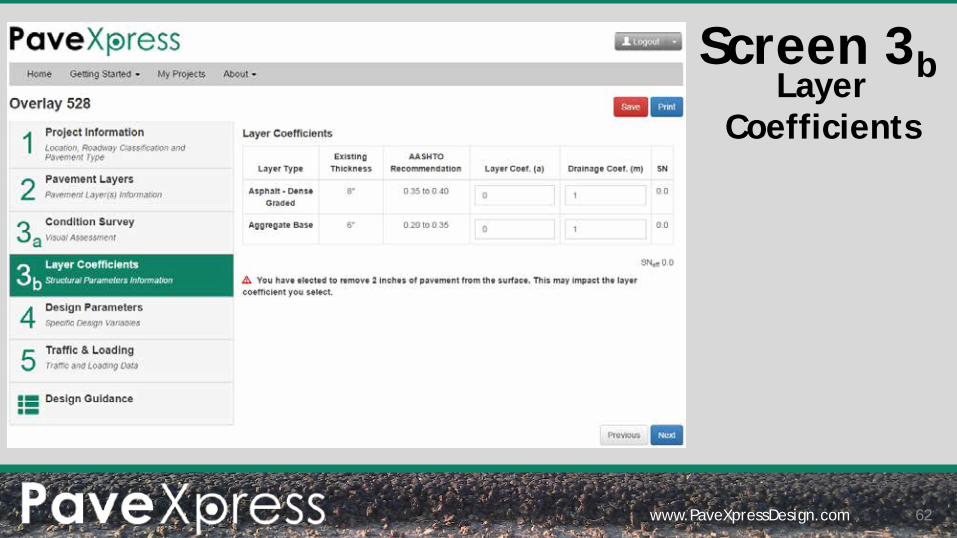
Layer Coefficients
Screen 3b

Layer Coefficients: Based on the condition of the existing pavement’s surface, AASHTO provides recommendations for adjusted layer coefficients. If the existing surface and the associated distresses will be removed, then “sound” or common layer coefficients from the remaining layers should be used. If the entire pavement structure is distressed, then a value from the AASHTO Recommendation range should be entered by the user.
www.PaveXpressDesign.com 63
Screen 3b

www.PaveXpressDesign.com 64
Nondestructive Testing
Screen 3
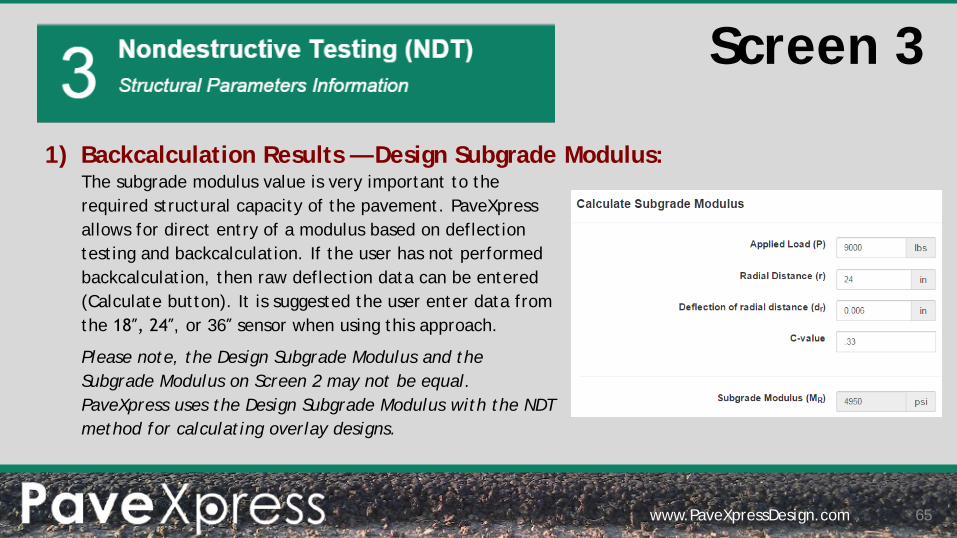
1) Backcalculation Results — Design Subgrade Modulus:
www.PaveXpressDesign.com 65
The subgrade modulus value is very important to the required structural capacity of the pavement. PaveXpress allows for direct entry of a modulus based on deflection testing and backcalculation. If the user has not performed backcalculation, then raw deflection data can be entered (Calculate button). It is suggested the user enter data from the 18″, 24″, or 36″ sensor when using this approach.
Please note, the Design Subgrade Modulus and the Subgrade Modulus on Screen 2 may not be equal. PaveXpress uses the Design Subgrade Modulus with the NDT method for calculating overlay designs.
Screen 3
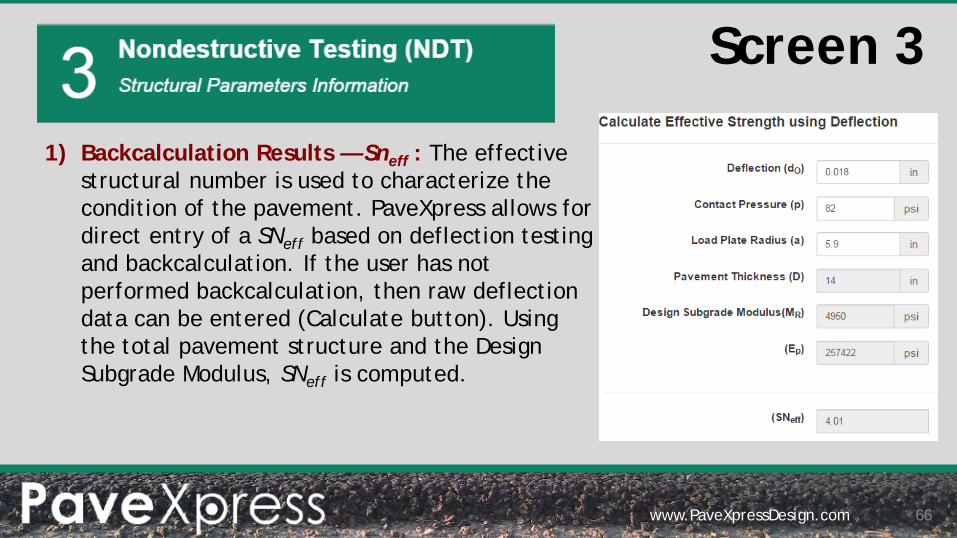
1) Backcalculation Results — Sneff : The effective structural number is used to characterize the condition of the pavement. PaveXpress allows for direct entry of a SNeff based on deflection testing and backcalculation. If the user has not performed backcalculation, then raw deflection data can be entered (Calculate button). Using the total pavement structure and the Design Subgrade Modulus, SNeff is computed.
www.PaveXpressDesign.com 66
Screen 3

The Maryland SHA Pavement Design Division under the guidance of Geoff Hall is a vast source of information.
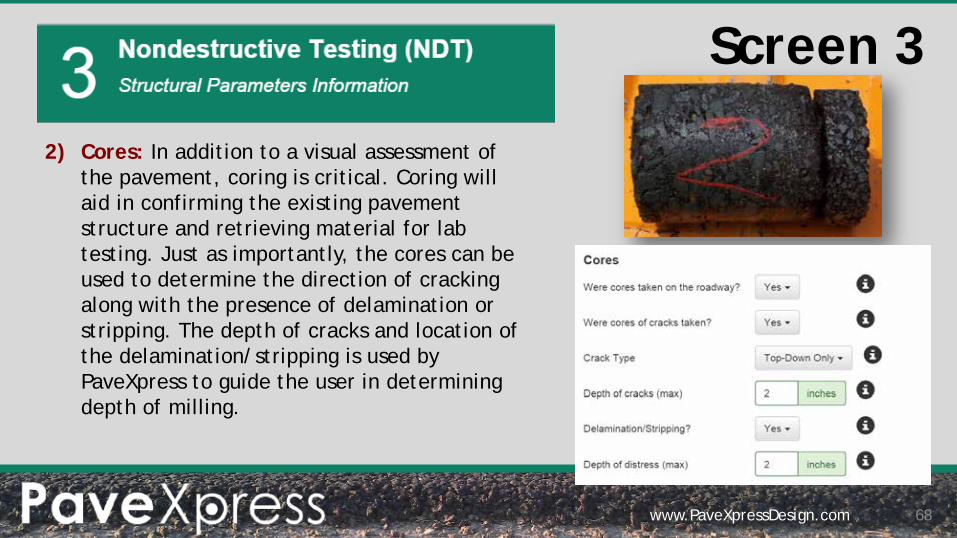
2) Cores: In addition to a visual assessment of the pavement, coring is critical. Coring will aid in confirming the existing pavement structure and retrieving material for lab testing. Just as importantly, the cores can be used to determine the direction of cracking along with the presence of delamination or stripping. The depth of cracks and location of the delamination/stripping is used by PaveXpress to guide the user in determining depth of milling.
www.PaveXpressDesign.com 68
Screen 3

www.PaveXpressDesign.com 69
3) Distressed Pavement: In many cases, the existing pavement surface is distressed and should be removed prior to placement of a new AC overlay. The designer must define the depth of existing pavement to be removed. This material that is removed will impact the existing structural capacity.
Unlike the condition survey method, with NDT the designer must assign a layer coefficient for the distressed material being removed. This value should correspond to the distress present following the AASHTO Condition Survey recommendations.
Screen 3

The information on this screens is the same as for new pavement designs.
One area for consideration, however, is the Design Period. For most AC overlays, a design life of 10 to 20 years is common.
The period is generally in line with the expected life of the asphalt surface mix.
www.PaveXpressDesign.com 70
Screens 4
Screens 5
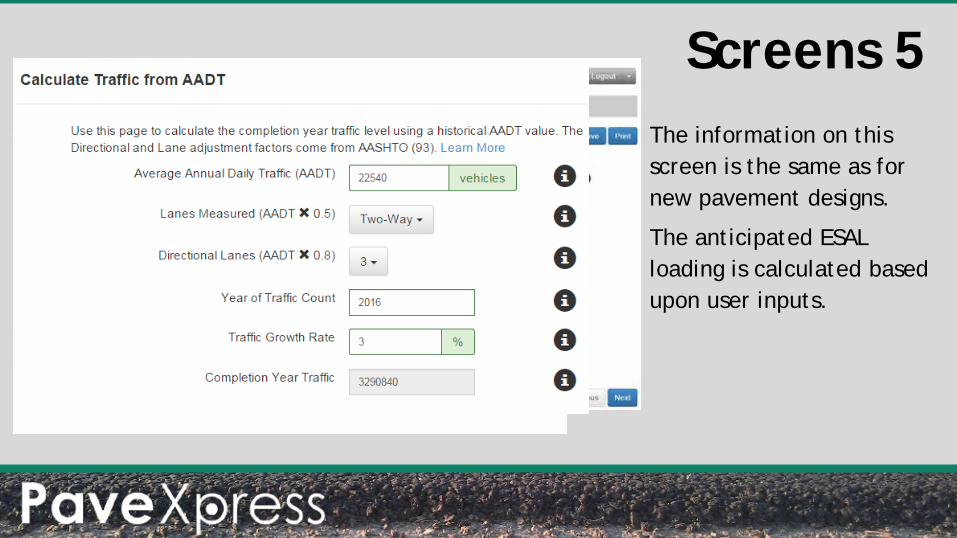
The information on this screen is the same as for new pavement designs.
The anticipated ESAL loading is calculated based upon user inputs.

www.PaveXpressDesign.com 72
Calculated Design
Screen 6

Overlay: Once the existing pavement information is input, PaveXpress uses the AASHTO equations to calculate the existing or effective structural number (SN) of the pavement. From the design and loading information, the required SN to support the loadings over the design life is calculated. The difference in the required SN and the existing SN is converted to an overlay thickness. If this thickness is less than minimum thickness input on Screen 2 or the required SN is less than the existing SN, then PaveXpress will report the minimum overlay thickness value.
www.PaveXpressDesign.com 73
Screen 6

Understanding the Effect of PaveXpress Default Values on Calculated Thickness
www.PaveXpressDesign.com 74
1) Design Period — if the designer uses the total design ESAL count as the traffic input, changing the design period on Screen 2 has no direct effect on calculated thickness. However, if the designer uses the program to calculate ESALs instead of inputting them directly, this design period is used in the calculation.
2) Reliability Level (R) — as the selected Reliability Level increases, the calculated pavement thickness increases.
3) Initial Serviceability Index (pi) — if an occasion arises that pi is lower than the default of 4.5 (the program only allows an input down to 4.0), the calculated pavement thickness would increase because the Change in Serviceability would, by definition, decrease.
4) Terminal Serviceability Index (pt) — if choosing a different pt than the default value, the calculated pavement thickness would increase as the Change in Serviceability decreases.

5) Change in Serviceability Index (ΔPSI) — as the allowable change in serviceability between initial construction and terminal serviceability decreases, the calculated pavement thickness increases.
6) Total Design ESALs — as the amount of expected traffic increases, the calculated pavement thickness increases.
7) Layer Coefficient — as any layer coefficient increases, the calculated pavement thickness decreases.
8) Drainage Coefficient — as any drainage coefficient decreases, the calculated pavement thickness increases. Because this factor has such a negative influence on calculated thickness and likely decrease in pavement longevity, the subgrade should be modified in some manner to improve drainability instead of increasing asphalt thickness in hopes of bridging the problem.
www.PaveXpressDesign.com 75
Understanding the Effect of PaveXpress Default Values on Calculated Thickness

www.PaveXpressDesign.com 76
Rigid Pavements PaveXpress can also be used to design rigid pavements, in accordance with the AASHTO Design Guide 1998 Supplement for Rigid Pavements.
The steps are similar, but geared toward the values and inputs important to concrete pavements.

www.PaveXpressDesign.com 77
Where: W18 = the predicted number of 18-kip equivalent single axle load (ESAL) applications ZR = standard normal deviate S0 = combined standard error of the traffic prediction and performance prediction D = slab depth (inches) ΔPSI = difference between the initial design serviceability index (pi) and the design terminal serviceability index (pt) S′c = modulus of rupture of PCC (flexural strength) Cd = drainage coefficient J = load transfer coefficient Ec = elastic modulus of PCC k = modulus of subgrade reaction
1998 AASHTO Design Guide Equation — Basic Overview
log10 𝑊18 = 𝑍𝑅 × 𝑆0 + 7.35 × log10 𝐷 + 1 − 0.06 +log10
∆𝑃𝑆𝑃4.5 − 1.5
1 + 1.624 × 10⁷
𝐷 + 1 8.46
+ 4.22 − 0.32𝑝𝑡 × log10𝑆𝑐
′ 𝐶𝑑 𝐷0.75 − 1.132
215.63 𝐽 𝐷0.75 − 18.42𝐸𝑐
𝑘�0.25

QUESTIONS?
www.PaveXpressDesign.com 78

A Simplified Pavement Design Tool
www.PaveXpressDesign.com
www.PaveXpressDesign.com 79
Marshall Klinefelter [email protected] www.MDAsphalt.org