a simulation based optimization approach for determining ... · a simulation based optimization...
TRANSCRIPT

A SIMULATION BASED OPTIMIZATION APPROACH FOR DETERMINING THE OPTIMUM ENERGY SAVING SOLUTIONS FOR BUILDINGS
Aslihan Senel Solmaz1, Fahriye Hilal Halicioglu1, and Suat Gunhan2
1Department of Architecture, Faculty of Architecture, Dokuz Eylul University, Izmir, Turkey 2 Department of Construction Science, College of Architecture, Construction and Planning,
The University of Texas at San Antonio, San Antonio, TX, USA
ABSTRACT In this study, a simulation based optimization approach that combines variance based sensitivity analysis (VBSA) with multi-objective optimization (MOO) is implemented to determine the optimum energy saving solutions while optimizing the building heating and cooling energy savings and, Net Present Value (NPV) criteria simultaneously. Sketch-up Open Studio plug-in is utilized for building energy modelling process. EnergyPlus dynamic simulation software, Matlab, Simlab and Microsoft Excel are all used together for the execution of VBSA. As for MOO process, GenOpt optimization package, EnergyPlus and Excel are used in an integrative way. The existing school building in the Western city of Izmir that represents a hot humid climate in Turkey is used as a case study to show the applicability of the approach. The case study results show that the proposed approach is capable of identifying the parts of the building to be primarily focused on and optimizing the building heating and cooling energy savings and NPV.
INTRODUCTION Improving building energy performance is a complex process in which there is a need for decision support. One of the main difficulties during decision-making process is that the decision maker is forced to determine the optimum solution out of many alternatives according to multiple criteria (e.g. energy, cost, environment etc.). In other words, the decision-maker faces a multi-objective optimization problem with trade-off relationships among conflicting criteria. Another prominent difficulty in this process is that the overall performance is determined by the concurrent interaction of multiple parameters rather than a single parameter. All the design parameters do not affect building energy performance on the same level. The importance level of the parameters will guide the decision-making process and extract priority solutions for improving building energy performance. Among a wide range of energy efficiency strategies including design parameters (geometry, form, orientation, window sizes, shading type etc.), building envelope materials, energy efficient equipment uses, advanced HVAC systems, renewable energy technologies and more,
the decision-support approaches are necessary to guide the architects and the other decision makers by identifying the most effective energy saving solutions. The decision support approaches on building energy efficiency have been categorized in detail (Diakaki et al., 2008; Kolokotsa et al., 2009). These approaches are, simulation based, multi-criteria decision-making (MCDM), sensitivity analysis (SA), and multi-objective optimization (MOO). Simulation-based approaches are based on developing building thermal model and carrying out energy analysis of the building via static or dynamic simulation methods, followed by generating and evaluating several alternative scenarios and selecting the best solution among them. This process is naturally time consuming, and may cause a partial improvement of the building energy performance. MCDM methods enable searching a finite set of alternatives and have been used in decision-making process for building energy efficiency (Roulet et al., 2002; Rey, 2004). SA methods are categorized into two groups as local and global, and aim to demonstrate the input-output relationships in a model and identify the most influential input parameters. Both local (Lam et al., 2008; Murray, et al., 2012) and global (De Wilde et al., 2009; Hopfe et al., 2011) SA methods have been widely used in building energy efficiency research. Regression based global SA methods are more commonly used in decision-making process for improving building energy performance than variance based and meta-modelling methods, even though these methods are not model-free and the parameter ranking is significantly affected by the sensitivity coefficient (SRC, SRRC, PEAR etc.) used (Helton et al., 2006). The ranking order is not affected by sampling in variance-based methods, which are computationally more expensive than regression based methods. Finally, MOO is helpful especially taking into account multiple objectives and doing search in a large set of alternatives to find the best solution. MOO engines are usually coupled to building performance simulations in order to identify the trade-off relations between objectives and optimize building energy performance (Verbeck et al., 2007; Chantrelle et al., 2011; Asadi et al., 2014). Though MOO works well for complicated problems, it requires experience and

knowledge from the decision-maker for the final decision. There is a need for further research that focuses on identifying the most effective energy saving solutions per multiple criteria and defining the priority actions within solution alternatives in the early design decision-making process. Thus, it is necessary to develop holistic decision-support approaches to guide architects in particular and for all other decision makers such as design and construction professionals, building experts, and users during the decision making process for building energy efficiency. In this study, an optimization based decision support approach is suggested by combining variance based sensitivity analysis (VBSA) with simulation based optimization methods to determine the optimum set of energy saving solutions while concurrently maximizing the building heating and cooling energy savings and, Net Present Value (NPV) criteria. Decision variables are generated among a wide range of energy efficiency strategies regarding building envelope from different window types, shading materials to external wall, roof, floor insulation materials. A case study is used to demonstrate the applicability of the proposed approach.
METHODOLOGY The proposed approach consists of the application of three main steps and their sub-steps: 1. Building energy modelling,
a) Generation of base-case building energy model (Sketch-up Open Studio)
b) Validation of the building energy model c) Definition of project’s objectives and
constraints 2. Application of variance based SA,
a) Definition of design (input) parameters and their value ranges, and generation of sampling matrix (Simlab)
b) Generation of input files (Matlab) c) Simulation input files and processing of the
output files (EnergyPlus/Matlab) d) Calculation of the sensitivity indices of input
parameters and ranking them per their importance on the output variable (Simlab/Excel)
3. Application of optimization method, a) Selection of the input parameters from the SA
results for optimization b) Generation of the material alternatives for
each selected input parameter c) Defining the objective function and assigning
weights to objective criteria d) Running the optimization and selection of the
optimum set of solutions (GenOpt).
In the first step, an energy model of the case building is first created in Sketch-up Open Studio plug-in according to the building data with multi-zone approach and the EnergyPlus input file (.IDF) is created. The output variables of the base-case model in EnergyPlus (heating energy consumption and cooling energy consumption) are extracted. The calibration of the model is done by comparing the calculated simulation data with obtained utility bill data, and the validation of the model is provided with acceptable error margins. The final sub-step is the definition of the project’s objectives and constraints to guide the future steps. The second step mainly aims to define the retrofit actions that have precedence for improving building energy efficiency, hence to guide and support the optimization process. A widely use variance based global SA method, Sobol Method (Sobol, 1993; Tian, 2013) is selected because it is model-free (Saltelli et al., 2008) and the parameter ranking order is more reliable (Nossent et al., 2011) and is not affected by sampling as other regression based SA methods (Helton et al., 2006). To that end, the design (input) parameters and their value ranges are first defined and Sobol’ input sampling is carried out by using Simlab SA software. After replacing the sampling data into the base-case template file (.IDF) and generating new IDF files via in-house Matlab script, all IDF files are simulated in EnergyPlus. Finally, the output values are collected again by in-house Matlab script and Sobol’ sensitivity indices of input parameters and their rankings are calculated in Simlab. In the third step, the aim is to determine the optimal set of energy saving solutions per multiple criteria: heating and cooling energy savings and NPV. Therefore a multi-objective optimization problem is used in this study. The GenOpt optimization engine (Wetter, 2011) that aims to minimize the cost function evaluated by external simulation program EnergyPlus is chosen. The three objective criteria are integrated into GenOpt by using a weighted-sum approach. Based on the importance ranking of input parameters from the second step, the most influential input parameters hence the retrofit actions are selected per project objectives and the material alternatives are generated for each of them. The optimization program is run and finally, the optimal set of solution is selected. The objective function with three objectives is defined in Eq. 1:
𝑓(𝑥) = 𝑎 ∙ 𝑓!(𝑥) + 𝑏 ∙ 𝑓!(𝑥) + 𝑐 ∙ 𝑓!(𝑥) (1) where, 𝑓! 𝑥 is the percentage of heating energy saving, 𝑓! 𝑥 is the percentage of cooling energy saving according to base-case values respectively. According to Eq. 1, a, b, and c are the weight factors of each criterion. 𝑓! 𝑥 is the percentage of NPV saving and the NPV formula is given in Eq. 2:

𝑁𝑃𝑉 = !!(!!!)!
!!!! − 𝐼𝑛𝑖𝐼𝑛𝑣 (2)
GenOpt is a kernel and many algorithms are embedded within. A Particle Swarm Optimization (PSO) is selected due to the ability to use discrete values.
CASE STUDY General Building Information An existing public school building located in Izmir, the biggest city in the west coast of Turkey, is selected the case building. Izmir has a hot-humid climate characteristics with usually humid summers and mild, rainy winters. The annual mean temperature is about 17.9°C and the annual mean relative humidity is nearly 65%.
Figure 1 Aerial view of the case building
Figure 2 View of southwest façade of the building
The school building was built in 1992 before the first Turkish mandatory standard for building energy performance, TS-825 (Turkish Standard Institution, 2008). The building is oriented in northeast-southwest (Figure 1) direction. The main entrance is from southwest façade (Figure 2) and the large part of the classrooms are located on northeast and southwest façades. The building comprises of three integrated blocks as A, B and C with different heights. The total building area and roof area are respectively 960.038m2 and 998.38m2 and the floor height is 3.4m. The structure of the building is reinforced concrete with brick filled walls. Window to wall ratio on south, north, east and west facades are 44.37%, 36.25%, 24.12% and 7.76%, respectively. There is no insulation application and no retrofit action has been applied to building so far. The current U-value of the
external wall is 1.355 W/m2K; roof has 3.04 W/m2K; ground floor has 2.17 W/m2K and the window has 5.2 W/m2K. There is no building envelope component in the building that meets the minimum requirements of TS-825. The building is heated with a standard non-condensing hot water boiler that uses natural gas. The cooling system consisting of split AC units is only available in the teachers’ lounge and offices, while in this study, it is assumed that all the classrooms have AC units. The heating and cooling systems are operated between 8 a.m. and 4 p.m. on weekdays. The heating thermostat set point is 22oC and the cooling thermostat set point is 26oC. The infiltration rate per zone is assumed 0.5 ACH.
Building Energy Modelling By using the building data (drawings, information of the building materials, mechanical and electrical systems, occupancy and schedules etc.) obtained through the on-site examinations, the whole building thermal model was created in Sketch-up OpenStudio (Figure 3).
Figure 3 The energy model of the base-case building
After thermal modelling, the model was exported as IDF file. The base-case model was analyzed in EnergyPlus and annual heating and cooling energy consumptions were calculated as 170156 and 36812 kWh, respectively. The validation of the building model was done per CV_RMSE and NMBE indicators defined in ASHRAE Guideline 14 (ASHRAE, 2002). By comparing the simulated heating energy consumption data with the natural gas utility data obtained for the year 2012, the acceptable error margins were attained, and the model was validated. After the validation of building simulation model, in order to define the project’s objectives and constraints, a user survey was conducted to students and teachers and, face-to-face meetings were made with the school administrators. The users were asked to evaluate their classrooms’ indoor thermal comfort both in summer and winter months. The evaluation choices were presented per 7 point thermal sensation scale in ASHRAE 55 standard (ASHRAE, 2004). The main finding from the user survey was that there are different discomfort problems in different zones of the building. While the main problem was insufficient heated of classrooms on the north side

during winter, it was the overheating of the classrooms on south side during summer. Therefore, it was decided to handle each facade separately while generating retrofit actions. The main finding from face-to-face meetings with school administrators was that the primary building energy performance improvement actions should have short payback and reasonable initial investment, hence the cost was the main constraint for the building retrofit project. Eventually, the main project objectives determined per such findings were to redesign the existing building envelope to improve building energy performance and to define the primary building energy retrofit actions with the aim of energy savings and cost.
Application of Variance Based SA The main findings from the first step that will guide the second step are: each façade should be handled separately and only passive systems should be focused on for building envelope while generating building energy saving solutions. A variance based SA method was applied to rank the building retrofit options according to their importance level on building heating and cooling energy consumptions. The input parameters related to five main building envelope components (exterior wall, window, shading, ground floor and roof) and their min-max values are presented in Table 1. Because of handling each façade seperately for SA, the total number of input parameters is 34. Sobol method was used for input sampling, and 576 samples were generated for each envelope parameter. The generated sampling matrix with size of 576x34 was recorded to Excel. 576 new IDF files generated from base-case IDF file by using Matlab. The generated IDF files were then simulated altogether in EnergyPlus and the output files (.csv) were obtained. After processing the output files by Matlab, the calculated building heating and cooling energy consumption data were gathered. Finally, all the input and output values were processed with Simlab and Sobol sensitivity indices of each input parameter for both heating and cooling energy consumption were calculated. The parameters were ranked per their influence on output variables. The results of SA are given in Figure 4 and Figure 5.
Figure 4 The ten most sensitive building envelope parameters based on heating energy consumption
Figure 5 The ten most sensitive building envelope parameters based on cooling energy consumption
In Figure 4 and Figure 5, the ten most sensitive parameters within 34 input parameters based on heating and cooling energy consumption are presented seperately. The effectiveness of parameters decrease with indice values. These rankings are to be used as an input for the optimization process. According to Figure 4, the first most important envelope parameter is south windows SHGC value while south windows shading depth, south windows U-value, north windows U-value and roof thermal insulation thickness follow. The first four important parameters based on heating energy consumption are related to windows. More importanly, there is no parameter related to external wall thermal insulation thickness. The application of thermal insulation on external walls of the building is not effective as windows for decreasing building heating energy consumption. This result may possibly be arising from the geometry of the building and the climatic conditions of Izmir. According to Figure 5, based on the cooling energy consumption, the first most important envelope parameter is south windows’ shading depth with the south windows SHGC value, the ground floor thermal insulation thickness, the south windows U value and the north windows U value following in rank. Similar to the SA results given in Figure 4, the highest ranked parameters are related to windows except for the ground floor thermal insulation thickness. The reason to why the thermal insulation thickness on ground floor is one of the most influencial parameters, may be the extensive heat change at the ground floor during summer in hot humid climates. As in Figure 4, there is no parameter related to external wall thermal insulation thickness within the first ten important envelope parameters on building cooling energy consumption. This may also be due to climatic characteristics of hot humid climates.
Application of Optimization Method By using the ranking of input parameters obtained from SA, a simulation based optimization method was applied to satisfy the project objectives. As mentioned before, the main objective in this project is to define the primary building energy retrofit
0 0.05 0.1 0.15 0.2 0.25 0.3 0.35 0.4
Window-SHGC-South Shading-Depth-South
Window-U-South Window-U-North
Roof-InsThick Wall-InsThick-West
Ground- InsThick Window-SHGC-East Wall-InsThick-North
Wall-InsThick-East
Sobol' Indices Values for Heating Energy Consumption
0 0.05 0.1 0.15 0.2 0.25 0.3 0.35 0.4 0.45 0.5
Shading-Depth-South Window-SHGC-South
Ground- InsThick Window-U-South Window-U-North
Window-SHGC-East Shading-Depth-East
Ground-Ins-λ Shading-Depth-North Shading-Angle-North
Sobol' Indices Values for Cooling Energy Consumption

actions to improve building energy performance with a reasonable cost. The first step is to select the building components to be used in optimization process. The first five most influential input parameters on both heating and cooling energy consumption from SA were selected and the related building components were ranked (Table 2).
Table 2 The first four ranked list of the building envelope components based on building heating and
cooling energy consumption separately
RANK HEATING ENERGY CONSUMPTION
COOLING ENERGY
CONSUMPTION
1. Window-South Direction
Shading-South Direction
2. Shading-South Direction
Window-South Direction
3. Window-North Direction Ground Floor
4. Roof Window-North Direction
In Table 2, the ranking of building envelope components on heating and cooling energy consumptions is different from each other. For example, while the importance ranking based on heating energy consumption includes “roof” component (4th rank), the ranking based on cooling energy consumption includes the “ground floor” (3rd rank) instead. At this point, it is necessary to decide which ranking to be used in the optimization process. Since the heating degree day value is larger than the cooling degree day value between the years of 2008-2014 in Izmir, the importance ranking of building components based on building heating energy consumption was selected for optimization process. Therefore, the decision variables to be used in optimization were window-south direction, shading-south direction; window-north direction; and roof (Table 2). After selecting the decision variables for optimization, the material alternatives for each of the four envelope components were generated. The generated material alternatives, their thermophysical properties and unit costs are presented in Table 3-4-5 seperately. As seen in Table 3-4-5, while 17 material alternatives including XPS and glass wool with different thickness were generated for roof insulation, 18 window alternatives with different U-value and SHGC and 9 overhang alternatives with different depths were generated for windows. After generating the material alternatives for building envelope components to be used as decision variables in the optimization process, the objective function with three objective criteria: heating energy consumption, cooling energy consumption and NPV were defined based on “weighted-sum” approach and the weights were assigned to each objective. Weighting coefficients assigned to each objectives
were chosen a=5, b=1, and c=-0.05 after some trial optimization runs in order to ensure similar contributions to the objective function during optimization run. The NPV calculations were done for 10 years with 4.5% nominal discount rate and 10% inflation rate.
RESULTS AND DISCUSSION GenOpt optimization program was run and the optimization algorithm made a search within a large solution space of 49572 solution alternatives. The each simulation run took approximately 2.5min using the parallel computation feature of Energyplus. The total optimization time was around 13.5 hours using a computer with Intel i7 Quad-Core CPU 2.4 GHz, 8 GB RAM. The optimization results are presented in Figure 6. Figure 6 shows the three individual objectives that are plotted against each other. While the results of NPV and cooling energy savings are shown on the y and x axes respectively, the results of heating energy savings are given on z-axis with colorbar.
Figure 6 Optimization results based on three
objective criteria The optimization results include positive and negative correlations between the objective criteria. For example, there is a positive relationship between cooling energy savings and NPV criteria. The heating energy savings, on the other hand, are negatively correlated to both cooling savings and NPV. The set of energy retrofit actions with the highest heating energy saving points mostly have the lowest cooling energy savings and NPV. There are 4 separate data points representing the maximum heating energy saving (triangle), maximum cooling energy saving (diamond), maximum NPV point (pentagon) and the proposed solution within this study (square) (Figure 6). At these points, the maximum heating saving is 6.23% with 5.68% in cooling savings and 4,693 TL NPV loss at the end of a 10-year period. The maximum cooling energy saving is 23.19% with 4.45% heating energy loss and 3,948 TL NPV gain. Lastly, the maximum NPV is 8,188 TL corresponding to a 1.84% heating energy consumption increase and 20.81% cooling energy consumption reduction. Because the main objective
5 10 15 20 25−25000
−20000
−15000
−10000
−5000
0
5000
10000
Cooling Savings (%)
NPV
(TL)
-10 -5 0 5 10 15 20 257
8
9
10
11
12
13
14
15
16
17
Sogutma Enerjisi Kazanci (%)
Ger
i Öde
me
Süre
si (Y
il)
-6.47
-5.2
-3.93
-2.66
-1.39
-0.119
1.15
2.42
3.69
4.96
6.23
Heating Savings
(%)
Maximum Heating Saving Point
Maximum Cooling Saving Point
Maximum NPV Saving Point
User Selection
HS: 6,23 CS: 5,68 NPV: -4693 HS: -4,45
CS: 23,19 NPV: 3948
HS: -1,84 CS: 20,81 NPV: 8188
HS: 5,06 CS: 8,20 NPV: 544
Fig. 4b

of this project is to define the primary building energy retrofit actions to ensure the positive energy savings and NPV, a further search was conducted to find a most feasible solution that ensures savings in each objective criterion simultaneously. The data point on Figure 6 marked with square and named as “user selection” was selected as the most feasible solution due to positive heating, cooling and NPV savings. At this point, heating saving is 5.06% corresponding to 8.20% in cooling saving and 544 TL NPV saving at the end of 10-year period. The details of each data point and material selections on Figure 6 are presented in Table 6. Looking at the set of envelope material alternatives for maximum heating energy saving, the window alternative with ID of C18 (see Table 4) having a low U-value (1 W/m2K) and high SHGC (0.73) was assigned to windows on both south and north directions. Conveniently, the shading material alternative were not assigned to windows on south directions (shading material alternative with ID of D9, see Table 5). The insulation material alternative with ID of B7 (see Table 3) having 200mm thickness was assigned to roof. All of these selection combinations are considered rational for optimizing the building heating energy savings. For maximum cooling energy saving point in Table 6, the assigned window alternatives to south and north direction windows are different from each other. While the window alternative with ID of C3 (Tinted single glazing, see Table 4) was assigned to south side windows, the window alternative with ID of C15 (Tinted low-e double glazing, see Table 4) was chosen for north side windows. The shading material alternative with ID of D8 having the maximum depth was assigned to windows in south side. Additionally, the insulation material alternative with ID of B7 having the highest material thickness was assigned to roof. These selected set of alternatives are proper to obtain maximum cooling energy savings. If we look at the set of material alternatives for maximum NPV in Table 6, thewindows with similar thermophysical properties with ID of C15 and C16 (see Table 4) were assigned to south and north side windows respectively. The shading material alternative with ID of D4 having 0.5m depth was assigned to windows on south direction. Moreover, the glass wool insulation material with ID of B2 (see
Table 3) having 100mm thickness was assigned to roof. Lastly, in the proposed optimal solution within this study in Table 6, the window alternative with ID of C18 (see Table 4) was assigned to windows on both south and north directions. The shading material alternative with ID of D1 (see Table 5) having 0.2m depth was assigned to windows in south side. Additionally, the insulation material with ID of B2 (see Table 3) having 100mm thickness and 0.040 W/mK conductivity value was assigned to roof.
CONCLUSION By integrating a variance based SA method with optimization method, a simulation based optimization approach was firstly used to identify the primary building applications, followed by determining the optimal set of energy saving solutions to maximize the building heating and cooling energy savings and, Net Present Value concurrently. The approach was applied to an existing school building in Izmir that represents a hot humid climate in Turkey in order to demonstrate its applicability. The approach consists of three main steps. After developing and validating the building energy model and defining the project objectives and constraints (1st Step), Sobol’ method was applied to rank the building retrofit options regarding building envelope components (windows, shading materials, external walls, roof, and floor) according to their influence on building heating and cooling energy consumption. SA clearly determined to which parts of the building to be focused on first to decrease building energy consumption. After selecting the most influential building envelope components from SA results, a wide range of material alternatives were generated and finally optimal set of energy saving solutions (material combinations) were identified. The deduction from SA results is that in such a hot-humid climates, glazing parameters were most influential in reducing both heating and cooling energy consumptions. The optimization results represented obvious trade-off relationships among the objective criteria. The advantages of both SA and computational optimization methods can be combined for building energy efficiency in practice. Finally, further inversigations to robustness of the optimization should be done by introducing
Table 6 Details of data points in terms of the values of the objectives and the assigned materials indicated in Figure 6 (For more information about ID of Materials please see Table 3-4-5)
DATA POINTS ON FIGURE 6
NPV (TL)
HEATING SAVING (%)
COOLING SAVING (%)
ID OF MATERIAL ROOF WINDOW
(South) WINDOW (North)
SHADING (South)
1 Maximum Heating -4693 6.23 5.68 B7 C18 C18 D9 2 Maximum Cooling 3948 -4.45 23.19 B7 C3 C15 D8 3 Maximum NPV 8188 -1.84 20.81 B2 C15 C16 D4 4 Selected Solution
(named as User Selection)
544 5.06 8.20 B2 C18 C18 D1

parametric perturbations to the optimized cases. The approach also can be adapted to different building parameters such as user behaviour parameters.
NOMENCLATURE i, nominal discount rate; t, duration of the cash flow; Rt, net cash flow at time t including inflation
rate for the energy prices hikes;
ACKNOWLEDGEMENT The authors would like to thank Prof. Dr. Halit Yazici (Department of Civil Engineering, Dokuz Eylul University) and Assoc. Prof. Dr. Mustafa Emre Ilal (Department of Architecture, Izmir Institute of Technology) for their valuable comments and suggestions in this study. The authors are also thankful to the survey participants from the Tegmen Ali Riza Akinci Anatolian High School.
REFERENCES Asadi, E., Silva, M.G.d, Antunes, C.H., Dias, L.s.,
Glicksman, L. 2014. Multi-objective optimization for building retrofit: A model using genetic algorithm and artificial neural network and an application. Energy and Buildings 81, 444-56.
ASHRAE. 2002. Guideline 14-2002-Measurement of energy and demand savings, American Society of Heating, Refrigerating and Air-conditioning Engineers.
ASHRAE. 2004. Standard 55-2004, Thermal environmental conditions for human occupancy, American society of heating, refrigerating and air-conditioning engineers.
CA-EPBD. 2014. Enegy Performance of Buildings Directive. Concerted Action (CA) EPBD.
Chantrelle, F.P., Lahmidi, H., Keilholz, W., Mankibi, M.E., Michel, P. 2011. Development of a multicriteria tool for optimizing the renovation of buildings. Applied Energy 88, 1386-94.
De Wilde, P., Tian, W. 2009. Identification of key factors for uncertainty in the prediction of the thermal performance of an office building under climate change. Build Simulation 2, 157 – 74.
Diakaki, C., Grigoroudis, E., Kolokotsa, D. 2008. Towards a multi-objective optimization approach for improving energy efficiency in buildings, Energy and Buildings 40 (9), 1747-1754.
Helton, J.C., Johnson, J.D., Sallaberry, C.J., Storlie, C.B. 2006. Survey of sampling-based methods for uncertainty and sensitivity analysis. Reliability Engineering & System Safety, 91(10-11), 1175-1209.
Hopfe, C.J., Hensen, J.L.M. 2011. Uncertainty analysis in building performance simulation for
design support. Energy and Buildings 43, 2798-805.
Kolokotsa, D., Diakaki, C., Grigoroudis, E., Stavrakakis, G., Kalaitzakis, K. 2009. Decision support methodologies on the energy efficiency and energy management in buildings. Advances in Building Energy Research 3(1), 121-146.
Lam, J.C., Wan, K.K.W., Yang, L. 2008. Sensitivity analysis and energy conservation measures implications. Energy Conversion and Management 49, 3170-7.
Murray, S.N., Sullivan, D.T.J. 2012. An Optimization Methodology and Sensitivity Analysis of Existing Building Retrofits. 1st Building Simulation and Optimization Conference, Loughborough, UK.
Nossent, J., Elsen, P., Bauwens, W. 2011. Sobol' sensitivity analysis of a complex environmental model. Environmental Modelling & Software 26, 1515-25.
Rey, E. 2004. Office building retrofitting strategies: multicriteria approach of an architectural and technical issue. Energy and Buildings 36, 367-72.
Roulet, C.A., Flourentzou F., Labben, H.H., et al. 2002. ORME: A multicriteria rating methodology for buildings. Building and Environment 37, 579-86.
Saltelli, A., Ratto, M., Andres, T., Campolongo, F., Cariboni, J., Gatelli, D. 2008. Global sensitivity analysis: the primer. Chichester, England, Wiley.
Senel Solmaz, A. 2015. A decision support model based on simulation and multi-objective optimization to determine optimum solutions for building energy performance. PhD. Thesis, Dokuz Eylul University, Izmir, Turkey.
Sobol, I. M. 1993. Sensitivity estimates for Non-linear Mathematical Models. Mathematical Modelling and Computational Experiment (MMCE) 1(4), 407-414.
Tian, W. 2013. A review of sensitivity analysis methods in building energy analysis. Renewable and Sustainable Energy Reviews 20, 411-9.
Turkish Standard Institution. 2008. TS 825—The Thermal Insulation Requirements for Buildings (revision) in Turkish Context. Ankara.
Verbeeck, G., Hens, H. 2007. Life Cycle Optimization of Extremely Low Energy Dwellings. Journal of Building Physics 31, 143-77.
Wetter, M. 2011. GenOpt – Generic optimization program-user manual version 3.1.0. Berkeley, CA, U.S. Lawrence Berkeley National Laboratory (LBNL)-Simulation Research Group.
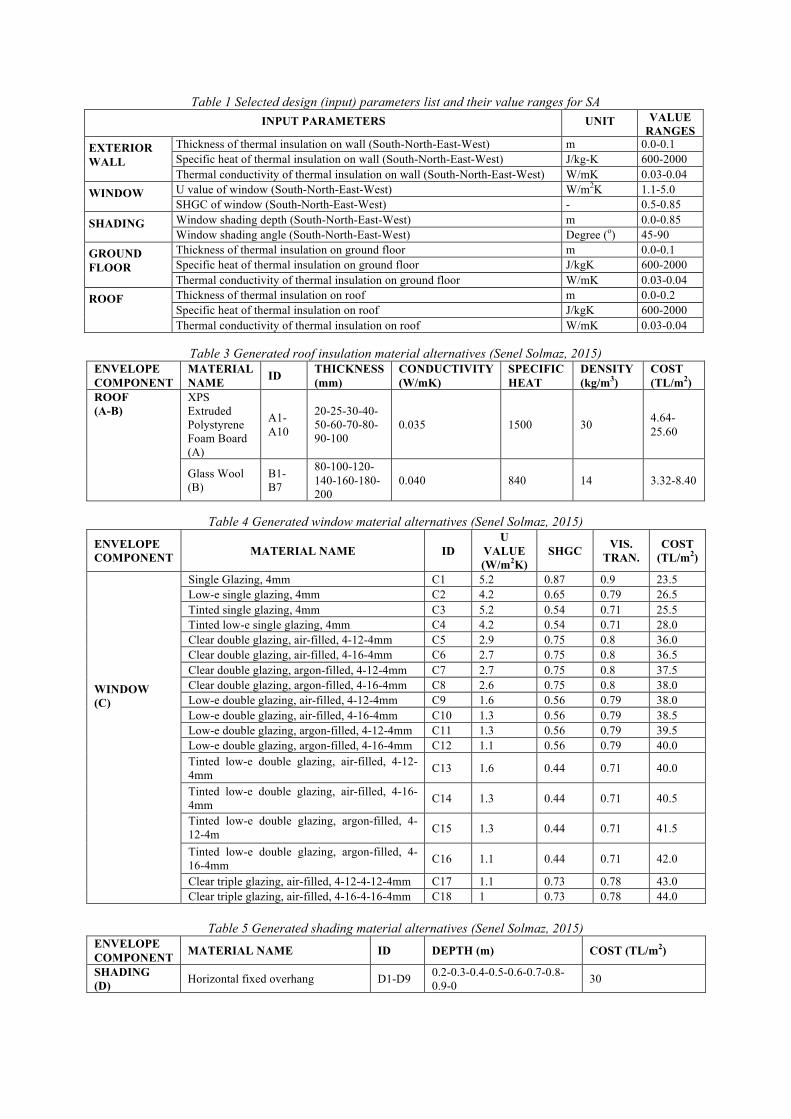
Table 1 Selected design (input) parameters list and their value ranges for SA INPUT PARAMETERS UNIT VALUE
RANGES EXTERIOR WALL
Thickness of thermal insulation on wall (South-North-East-West) m 0.0-0.1 Specific heat of thermal insulation on wall (South-North-East-West) J/kg-K 600-2000 Thermal conductivity of thermal insulation on wall (South-North-East-West) W/mK 0.03-0.04
WINDOW U value of window (South-North-East-West) W/m2K 1.1-5.0 SHGC of window (South-North-East-West) - 0.5-0.85
SHADING Window shading depth (South-North-East-West) m 0.0-0.85 Window shading angle (South-North-East-West) Degree (o) 45-90
GROUND FLOOR
Thickness of thermal insulation on ground floor m 0.0-0.1 Specific heat of thermal insulation on ground floor J/kgK 600-2000 Thermal conductivity of thermal insulation on ground floor W/mK 0.03-0.04
ROOF Thickness of thermal insulation on roof m 0.0-0.2 Specific heat of thermal insulation on roof J/kgK 600-2000 Thermal conductivity of thermal insulation on roof W/mK 0.03-0.04
Table 3 Generated roof insulation material alternatives (Senel Solmaz, 2015) ENVELOPE COMPONENT
MATERIAL NAME ID THICKNESS
(mm) CONDUCTIVITY (W/mK)
SPECIFIC HEAT
DENSITY (kg/m3)
COST (TL/m2)
ROOF (A-B)
XPS Extruded Polystyrene Foam Board (A)
A1-A10
20-25-30-40-50-60-70-80-90-100
0.035 1500 30 4.64-25.60
Glass Wool (B)
B1-B7
80-100-120-140-160-180-200
0.040 840 14 3.32-8.40
Table 4 Generated window material alternatives (Senel Solmaz, 2015)
ENVELOPE COMPONENT MATERIAL NAME ID
U VALUE (W/m2K)
SHGC VIS. TRAN.
COST (TL/m2)
WINDOW (C)
Single Glazing, 4mm C1 5.2 0.87 0.9 23.5 Low-e single glazing, 4mm C2 4.2 0.65 0.79 26.5 Tinted single glazing, 4mm C3 5.2 0.54 0.71 25.5 Tinted low-e single glazing, 4mm C4 4.2 0.54 0.71 28.0 Clear double glazing, air-filled, 4-12-4mm C5 2.9 0.75 0.8 36.0 Clear double glazing, air-filled, 4-16-4mm C6 2.7 0.75 0.8 36.5 Clear double glazing, argon-filled, 4-12-4mm C7 2.7 0.75 0.8 37.5 Clear double glazing, argon-filled, 4-16-4mm C8 2.6 0.75 0.8 38.0 Low-e double glazing, air-filled, 4-12-4mm C9 1.6 0.56 0.79 38.0 Low-e double glazing, air-filled, 4-16-4mm C10 1.3 0.56 0.79 38.5 Low-e double glazing, argon-filled, 4-12-4mm C11 1.3 0.56 0.79 39.5 Low-e double glazing, argon-filled, 4-16-4mm C12 1.1 0.56 0.79 40.0 Tinted low-e double glazing, air-filled, 4-12-4mm C13 1.6 0.44 0.71 40.0
Tinted low-e double glazing, air-filled, 4-16-4mm C14 1.3 0.44 0.71 40.5
Tinted low-e double glazing, argon-filled, 4-12-4m m
C15 1.3 0.44 0.71 41.5
Tinted low-e double glazing, argon-filled, 4-16-4mm C16 1.1 0.44 0.71 42.0
Clear triple glazing, air-filled, 4-12-4-12-4mm C17 1.1 0.73 0.78 43.0 Clear triple glazing, air-filled, 4-16-4-16-4mm C18 1 0.73 0.78 44.0
Table 5 Generated shading material alternatives (Senel Solmaz, 2015)
ENVELOPE COMPONENT MATERIAL NAME ID DEPTH (m) COST (TL/m2)
SHADING (D) Horizontal fixed overhang D1-D9 0.2-0.3-0.4-0.5-0.6-0.7-0.8-
0.9-0 30