a smart way to solve potential floods due to climate change
TRANSCRIPT

SchiedamPracticum
Asmartwaytosolvepotentialfloodsduetoclimatechange
Author:GerardGassolSchiedamTutor:RoyAbdoelkarimUniversitatdeGironaTutor:SergiNuss5thSeptember2016
2
Index
1.Introduction..............................................................................................................................32.Casestudy:DescriptionofthepotentialrisksforfloodinoldandeastSchiedam........................................................................................................................................42.1.Generaloverview:Netherlandscase.....................................................................................42.2.FutureofclimateinNetherlands............................................................................................52.3.LocalconsequencesinoldandEastSchiedam...................................................................9
3.Inundationvulnerability:Areastudy............................................................................123.1.Introduction.................................................................................................................................123.2.Dataused.......................................................................................................................................123.3.Results............................................................................................................................................16
4.ActionsProposal..................................................................................................................194.1.Watercollectionpoints:CollaborativeBasins.................................................................194.2.MobileApp....................................................................................................................................244.2.1.Beaware:Marketingonclimatechangeandfloods..............................................................254.2.2.Beinformed:ShortandLongterminformation.....................................................................274.2.3.Getinvolved:InteractionbetweenCouncilandCitizens....................................................29
4.3.Governance...................................................................................................................................344.3.1.AdaptationofBuildingLaw.............................................................................................................344.3.2.Taxes..........................................................................................................................................................35
4.4.Urbansensitiveadaptation.....................................................................................................355.Conclusions............................................................................................................................386.References..............................................................................................................................39
3
1.IntroductionThisworkwill focus inhowclimatechangewillaffect theCityofSchiedam.WewillstudythemainconsequencesofclimatechangeintheNetherlandsandwewillfocusin floods. How floods will affect the City at mid and long term. In order to do anaccurate approach, we will consult various studies but especially the last KNMI’14study,realizedbytheRoyalNetherlandsMeteorologicalInstitute.Afterwards we are going to analyze how vulnerable is Schiedam to floods.We aregoingtocreateavulnerabilitymaptakinginaccountdifferentvalues,liketopography,subsidenceorsewersystem,betweenothers.Wearegoingtocomparetheseresultsto flood models of Schiedam East realized by the Nelen & Schuurmansstudy. Theresultswillbealsocomparedtothereportsreceivedofthecitizens.Afterhaving analyzed the situationwewill proposevarious solutions to relieve theeffectsofthefloods.Allthissolutionswillhaveanapproachsmart.Smartunderstoodasamoresustainableway tounderstand thecities,notonlyabout fulfilling thecitywithsensors,althoughithastobeawaytopreparethecityforthenextcentury. Inthat sense, allmeasuresproposed in thisworkwill include inherentlya sustainableapproach.
4
2.Casestudy:DescriptionofthepotentialrisksforfloodinoldandeastSchiedam
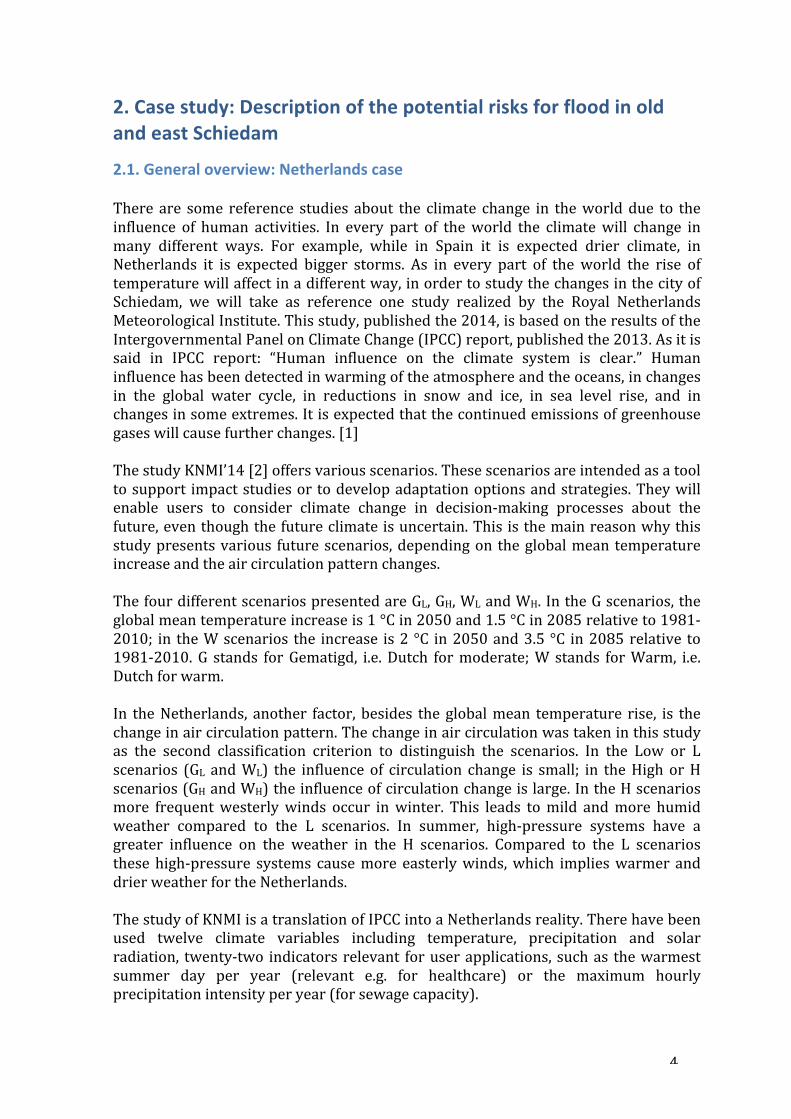
2.1.Generaloverview:NetherlandscaseThere are some reference studies about the climate change in theworlddue to theinfluence of human activities. In every part of theworld the climatewill change inmany different ways. For example, while in Spain it is expected drier climate, inNetherlands it is expected bigger storms. As in every part of the world the rise oftemperaturewillaffectinadifferentway,inordertostudythechangesinthecityofSchiedam, we will take as reference one study realized by the Royal NetherlandsMeteorologicalInstitute.Thisstudy,publishedthe2014,isbasedontheresultsoftheIntergovernmentalPanelonClimateChange(IPCC)report,publishedthe2013.Asitissaid in IPCC report: “Human influence on the climate system is clear.” Humaninfluencehasbeendetectedinwarmingoftheatmosphereandtheoceans,inchangesin the global water cycle, in reductions in snow and ice, in sea level rise, and inchangesinsomeextremes.Itisexpectedthatthecontinuedemissionsofgreenhousegaseswillcausefurtherchanges.[1]ThestudyKNMI’14[2]offersvariousscenarios.Thesescenariosareintendedasatooltosupport impactstudiesortodevelopadaptationoptionsandstrategies.Theywillenable users to consider climate change in decision-making processes about thefuture,eventhoughthefutureclimateisuncertain.Thisisthemainreasonwhythisstudypresentsvarious futurescenarios,dependingon theglobalmean temperatureincreaseandtheaircirculationpatternchanges.ThefourdifferentscenariospresentedareGL,GH,WLandWH.IntheGscenarios,theglobalmeantemperatureincreaseis1°Cin2050and1.5°Cin2085relativeto1981-2010; in theWscenarios the increase is2 °C in2050and3.5 °C in2085relative to1981-2010.G stands forGematigd, i.e.Dutch formoderate;W stands forWarm, i.e.Dutchforwarm.In theNetherlands, another factor, besides the globalmean temperature rise, is thechangeinaircirculationpattern.Thechangeinaircirculationwastakeninthisstudyas the second classification criterion to distinguish the scenarios. In the Low or Lscenarios (GL andWL) the influenceof circulation change is small; in theHighorHscenarios(GHandWH)theinfluenceofcirculationchangeislarge.IntheHscenariosmore frequentwesterlywinds occur inwinter. This leads tomild andmore humidweather compared to the L scenarios. In summer, high-pressure systems have agreater influence on the weather in the H scenarios. Compared to the L scenariosthesehigh-pressure systems causemore easterlywinds,which implieswarmer anddrierweatherfortheNetherlands.ThestudyofKNMIisatranslationofIPCCintoaNetherlandsreality.Therehavebeenused twelve climate variables including temperature, precipitation and solarradiation, twenty-two indicatorsrelevant foruserapplications, suchas thewarmestsummer day per year (relevant e.g. for healthcare) or the maximum hourlyprecipitationintensityperyear(forsewagecapacity).
5
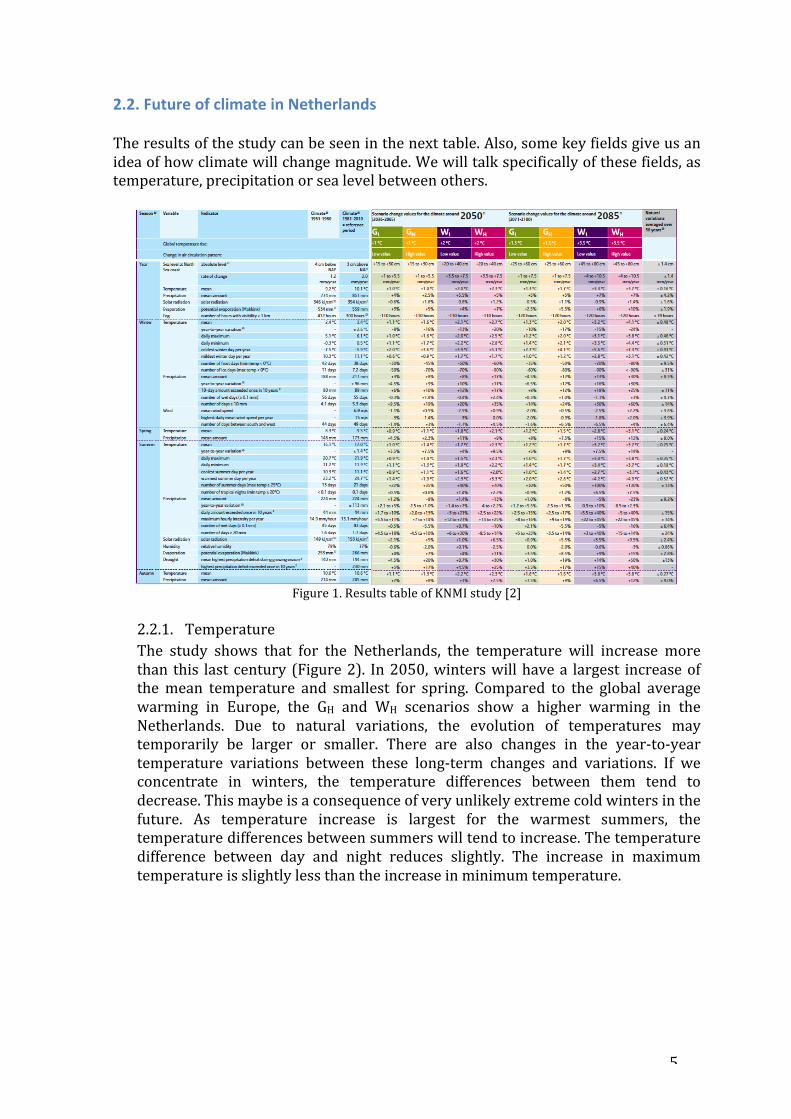
2.2.FutureofclimateinNetherlandsTheresultsofthestudycanbeseeninthenexttable.Also,somekeyfieldsgiveusanideaofhowclimatewillchangemagnitude.Wewilltalkspecificallyofthesefields,astemperature,precipitationorsealevelbetweenothers.
Figure1.ResultstableofKNMIstudy[2]
2.2.1. TemperatureThe study shows that for the Netherlands, the temperature will increase morethan this last century (Figure2). In2050,winterswillhavea largest increaseofthemean temperature and smallest for spring. Compared to the global averagewarming in Europe, the GH and WH scenarios show a higher warming in theNetherlands. Due to natural variations, the evolution of temperatures maytemporarily be larger or smaller. There are also changes in the year-to-yeartemperature variations between these long-term changes and variations. If weconcentrate in winters, the temperature differences between them tend todecrease.Thismaybeisaconsequenceofveryunlikelyextremecoldwintersinthefuture. As temperature increase is largest for the warmest summers, thetemperaturedifferencesbetweensummerswilltendtoincrease.Thetemperaturedifference between day and night reduces slightly. The increase in maximumtemperatureisslightlylessthantheincreaseinminimumtemperature.

6
Figure2.Winterand summer temperature inDeBilt (Netherlands):observations (three30-yearaverages, inblue),KNMI’14scenarios(2050and2085, infourcolours)andnaturalvariations(ingrey).Thesearenaturalvariationsfor30-yearaverages.[2]2.2.2. PrecipitationThe increase of themeanprecipitationwill be a common trend in all scenarios,unlessinsummer.Theincreaseinwatervaporintheairwillbethereasonofthischange.IfwetakeacloselooktoFigure3,wewillobservethatduringsummers,the mean precipitation estimation is different in the presented scenarios. Themodels donot agree in different things, for example onhowwill change the aircirculation,onthemeasureinhowthesoilwilldryandtheconsequencesthatthiscouldhaveintheformationofcloudsandtheconsequentprecipitation.WhileGLand WL predict a mean precipitation small increase in summer, the other twomodels,GHandWHpredictaconsiderablereduction.
Figure3.Precipitationclimate in theNetherlands:observationsandKNMI’14 scenarios for2050and2085.[2]
7
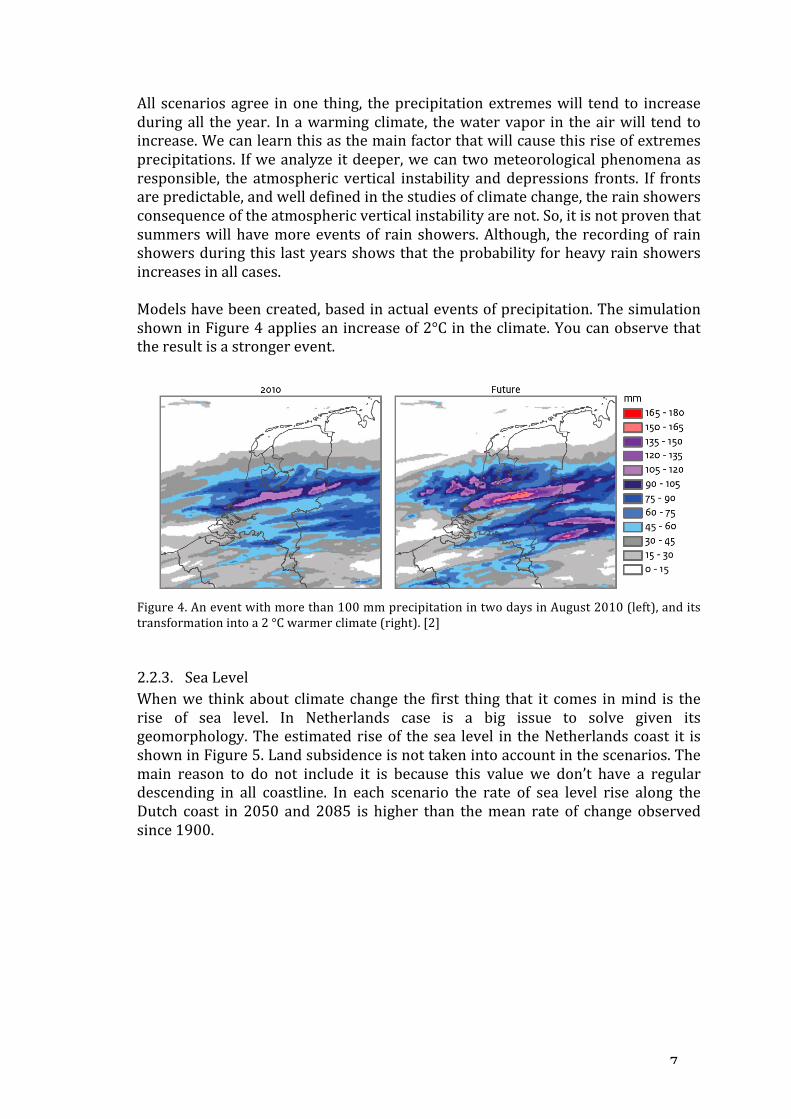
All scenariosagree inone thing, theprecipitationextremeswill tend to increaseduringall theyear. Inawarmingclimate, thewatervapor in theairwill tend toincrease.Wecanlearnthisasthemainfactorthatwillcausethisriseofextremesprecipitations. Ifweanalyzeitdeeper,wecantwometeorologicalphenomenaasresponsible, the atmospheric vertical instability anddepressions fronts. If frontsarepredictable,andwelldefinedinthestudiesofclimatechange,therainshowersconsequenceoftheatmosphericverticalinstabilityarenot.So,itisnotproventhatsummerswillhavemoreeventsof rainshowers.Although, the recordingof rainshowersduringthis lastyearsshowsthattheprobabilityforheavyrainshowersincreasesinallcases.Modelshavebeencreated,basedinactualeventsofprecipitation.ThesimulationshowninFigure4appliesanincreaseof2°Cintheclimate.Youcanobservethattheresultisastrongerevent.
Figure4.Aneventwithmorethan100mmprecipitationintwodaysinAugust2010(left),anditstransformationintoa2°Cwarmerclimate(right).[2]2.2.3. SeaLevelWhenwe thinkabout climate change the first thing that it comes inmind is therise of sea level. In Netherlands case is a big issue to solve given itsgeomorphology.Theestimatedriseof thesea level in theNetherlandscoast it isshowninFigure5.Landsubsidenceisnottakenintoaccountinthescenarios.Themain reason to do not include it is because this value we don’t have a regulardescending in all coastline. In each scenario the rate of sea level rise along theDutch coast in 2050 and2085 is higher than themean rate of change observedsince1900.

8
Figure 5. Observed sea level at the Dutch North Sea coast and the projections in the KNMI’14scenarios.[2]
2.2.4. WindandstormWindandstorm long-termprevision canbe studiedwithpressureobservations.Thescenariosindicatethatstrongwindsfromthisdirectionwillnotchangemuchin future.Thechangesarenot in thequantitybut in thedirection. Inwinter,GHandWHscenarios foreseean increaseof thenumberofdayswithsouth towestwinddirections,althoughGLandWLscenariospredictadecreaseofthisnumber.In all scenarios, the wind coming from the south and west will decrease insummer.2.2.5. Visibility,fog,hailandthunderstormsVisibilitywillfollowthepatternoflastyearsandwillgetbetter.Themainreasonof this success is thereductionofpollution.Thestudyalsoassures thathailandthunderstormswillbecomemoresevereinthefuture.Strongerverticalmotionsincloudswillbecausedbytheexistenceofmorewatervapor.Theywillbetraducedto the increase of hail and lightning frequencies, and larger hailstones. Somestudies show that the number of lightning strokes increases 10-15% for eachdegree of warming. There extreme hail occurs at least twice as often in 2050comparedtothereferenceperiod1981-2010.2.2.6. Clouds,solarradiation,evaporationanddroughtSolar radiationwill be slightly higher in summers due to the presence of fewerclouds. This will be caused because of east winds increase. The potentialevaporation increases linearly with solar radiation. It has been proved that foreach the potential evaporation increases around 2% per degree of temperaturerise.

9
2.3.LocalconsequencesinoldandEastSchiedamSincenowwehavetalkedaboutgeneralities,aswehavepresentedtheglobalimpactof the climate change in all Netherlands. From now on,wewill focus in the city ofSchiedam.Wewillzoomintotheconsequencesandparticularitiesoftheseentopicsinthis area. Schiedam is locatedwest of Rotterdam, east of Vlaardingen, and south ofDelft. It is locatedgeographicallywithin theRhine–Meuse–Scheldt riverdelta at theNorthSea.Locatednearthesea,theclimateisnotashardastheinlandterritories.The main problem of climate change in Schiedam will be produced by the rise innumberandintensityofstormevents,asseeninchapter2.2.2.IfwetakeacloselooktoFigure4showninthesamechapter,wewillrealizethatthehighestincreaseofthestorm impact is achieved in the area of Schiedam. The increase of the quantity ofwater in a short timeperiodwill result in a saturationof the sewerage systemandconsequentlyfloodswillaffectthecity.Thereareotherelements,apartfromthemoreseverestorms,thatwillhelptogetfloodsinthecity,consequenceofclimatechange.IntheMediterraneanarea,whenwetalkaboutthewatercycle,alwayswatergetstotheseabymeansofgravity.NotinSchiedamandmustofcoastalcitiesinNetherlands.InSchiedam,thewaterthatgetsintotheseweragesystemiscollectedinvariousbigbasins. In these basins, there are huge water pumps that boost the water to mainchannels.Thewaterinthechannelsarrivestothetreatmentplant,andanothertime,afterthewaterhasbeenpurified,itispumpedtotheriver.InOostSchiedam,duringanexceptionalstormevent,normallythetreatmentplantgetssaturated,andpumpsthrowthewaterdirectlytotheriver,whichisenvironmentallydangerous.WecanseeinFigure6awatercycleschemeinSchiedam.WealsocanseesomepicturesinFigure7ofthehugewaterpumpingplantinthemiddleofSchiedamOost.
Figure6.WatercycleschemeinSchiedam[3]

10
Figure7.Picturesofthewaterpumpingplant
AnotherkeyelementtounderstandthepotentiallyriskoffloodinginSchiedamduringthenextdecadesisthesubsidenceofthecity.AsitcanbeseeninFigure8,thecityofSchiedamissettledonathicklayerofchannelsdeposits,generallytransportedclays.
Figure8.Schiedamprospectsection[4]
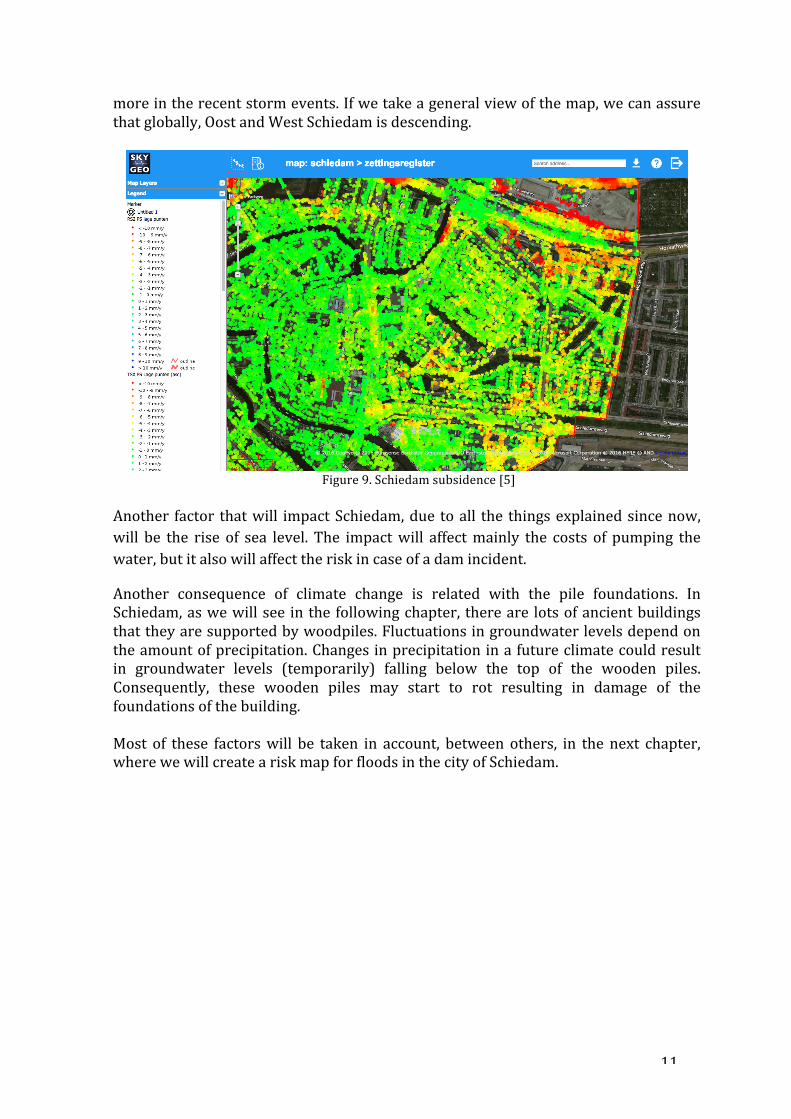
These last years, the company Skygeo has surveyed the subsidence of the city ofSchiedam. They have used a system called Satellite Radar Interferometry. Radarsatellitesmakeitpossibletoobservetheearth'ssurfacedayandnightandunderallweather conditions. Currently, multiple satellites are orbiting the earth and newlaunches are planned for the upcoming years. Together, these satellites provide agreatamountofradarimagesthatareusedbySkyGeofordeformationmeasurements.TheresultsofSkyGeostudyareprovidedwithadeformationmap.Thedeformationmapprovides informationaboutthedeformationbehaviorofthespecific locationofeach measurement point. The color scale indicates the average linear deformationspeed(inmm/year)duringthemeasuredtimeperiod.Thisspeedisderivedfromthedeformation time series. The time series is the primary result of the analysisperformedbySkyGeoandisavailableforeverymeasurementpoint.InFigure9youcanseetheresultsofSkyGeostudyforSchiedamOostandWest.Youcan see thatmost of theOost area is stable. Althoughwhenwe fix our view to thewest,must of this part is descending. At theNorthWest part, near the station, thedescendingof the floor isbigger. In fact, thisarea is thesameone thathassuffered
11
moreintherecentstormevents.Ifwetakeageneralviewofthemap,wecanassurethatglobally,OostandWestSchiedamisdescending.
Figure9.Schiedamsubsidence[5]
Another factor thatwill impactSchiedam,due toall the thingsexplainedsincenow,will be the rise of sea level. The impactwill affectmainly the costs of pumping thewater,butitalsowillaffecttheriskincaseofadamincident.
Another consequence of climate change is related with the pile foundations. InSchiedam,aswewillsee inthefollowingchapter, thereare lotsofancientbuildingsthattheyaresupportedbywoodpiles.Fluctuationsingroundwaterlevelsdependontheamountofprecipitation.Changesinprecipitationinafutureclimatecouldresultin groundwater levels (temporarily) falling below the top of the wooden piles.Consequently, these wooden piles may start to rot resulting in damage of thefoundationsofthebuilding.Most of these factorswill be taken in account, between others, in the next chapter,wherewewillcreateariskmapforfloodsinthecityofSchiedam.
12
3.Inundationvulnerability:Areastudy
3.1.IntroductionThebodyofourstudywillbetocreateavulnerabilitymap.Wewanttostudywhichareas are tomost exposed and vulnerable to floods. The aimof this study is not tocreateamapoftheareasthatwillsufferfloods,buttoshowinamapwhichareaswillbetheonestoelude.Wewillcreatethisvulnerabilitymapgivingdifferentweightstodifferentmaps,dependingon:
• Landuse(moresensible/riskyzonestakingflooding,schools,citycouncil,
mainroads,hospitals,electricinfrastructure)• Inundationpotentialrisk(Relatedtotopographiclevel,watermap,sewer
systemnet)• Zoneswithpotentialriskinmidterm(dependingonbuildingsfoundationsand
subsidence)Theresultingmapwillbecomparedwithtwoothergeo-locatedfiles:
• MapofComplains(socialdata)• N&Hfloodsmodels
Theobjectiveofthisworkistoobtainamapinwhichwecanunderstandthefutureeffectsoffloodsinthecity.TheideaistosharethismapwiththecitizensviaApp(seechapter4.2)andthatitcanbeusedaspreventionifafloodeventhappens.
3.2.Dataused
During our stay in Schiedam we had several meetings with employees of the citycouncil,wemetRiaLöschnerfromtheNelen&Schuurmans,inchargeofelaboratingthe models of inundation for the city of Schiedam and we hada briefing with JosMaccabiani,fromSkygeo.Everybodycontributedwithdifferentdatatothisstudy.Wehave used the programQgis to create the vulnerabilitymap. Qgis is a program forviewing, editing and analyzing data. It is cross-platform and open source software.Thedatausedinthisstudyaremanyandvaried.Inthefollowinglinesweexplainthedatausedinourvulnerabilitystudy:
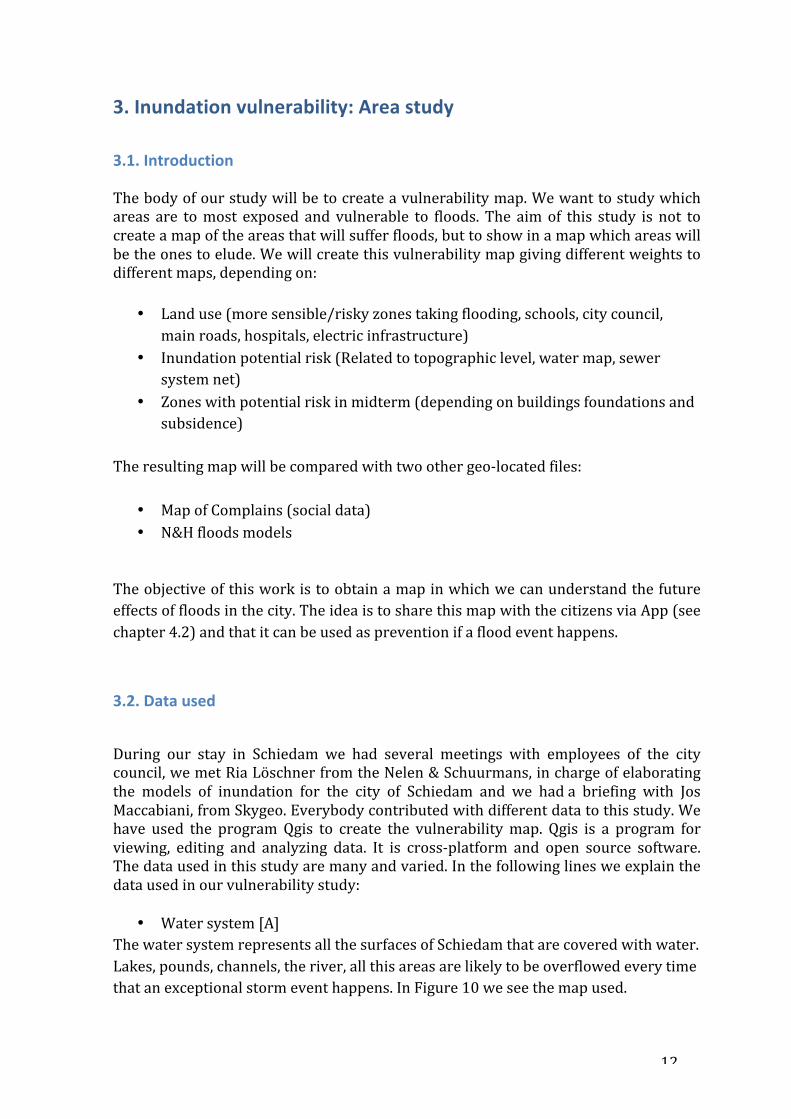
• Watersystem[A]ThewatersystemrepresentsallthesurfacesofSchiedamthatarecoveredwithwater.Lakes,pounds,channels,theriver,allthisareasarelikelytobeoverflowedeverytimethatanexceptionalstormeventhappens.InFigure10weseethemapused.
13
Figure10.Mapofwatersystem(incleargreen).
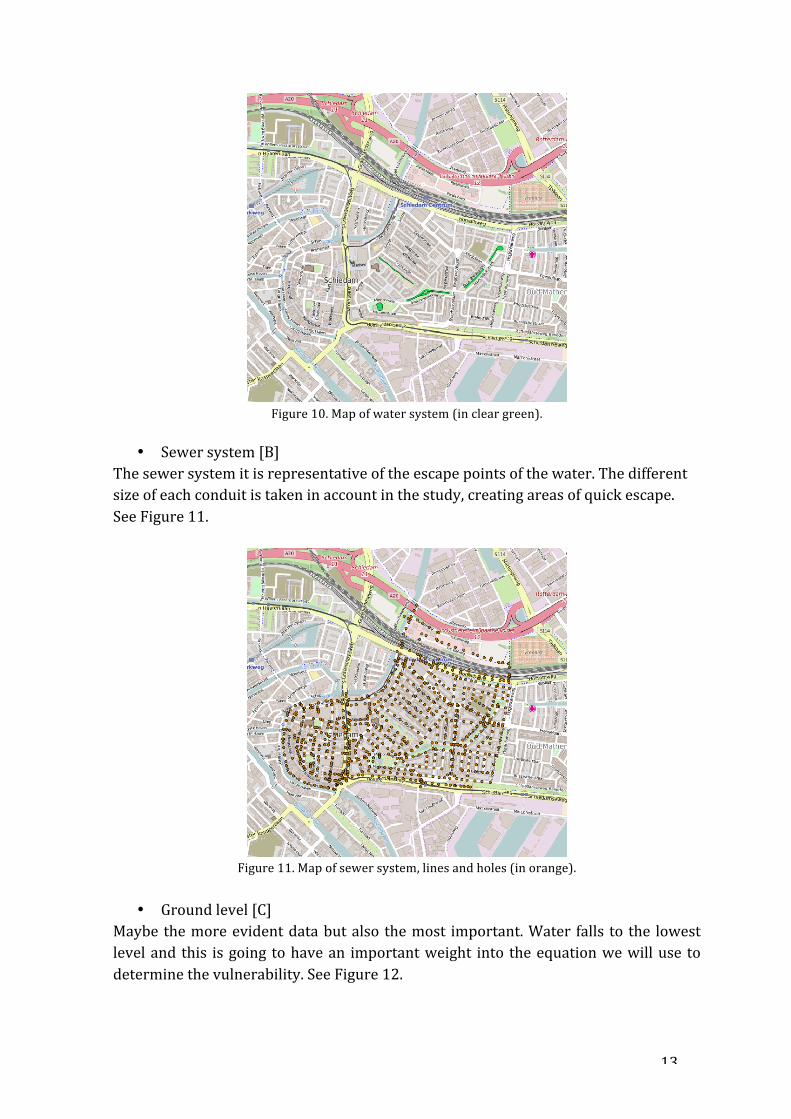
• Sewersystem[B]
Thesewersystemitisrepresentativeoftheescapepointsofthewater.Thedifferentsizeofeachconduitistakeninaccountinthestudy,creatingareasofquickescape.SeeFigure11.
Figure11.Mapofsewersystem,linesandholes(inorange).
• Groundlevel[C]
Maybe themoreevidentdatabutalso themost important.Water falls to the lowestleveland this isgoing tohavean importantweight into theequationwewilluse todeterminethevulnerability.SeeFigure12.
14
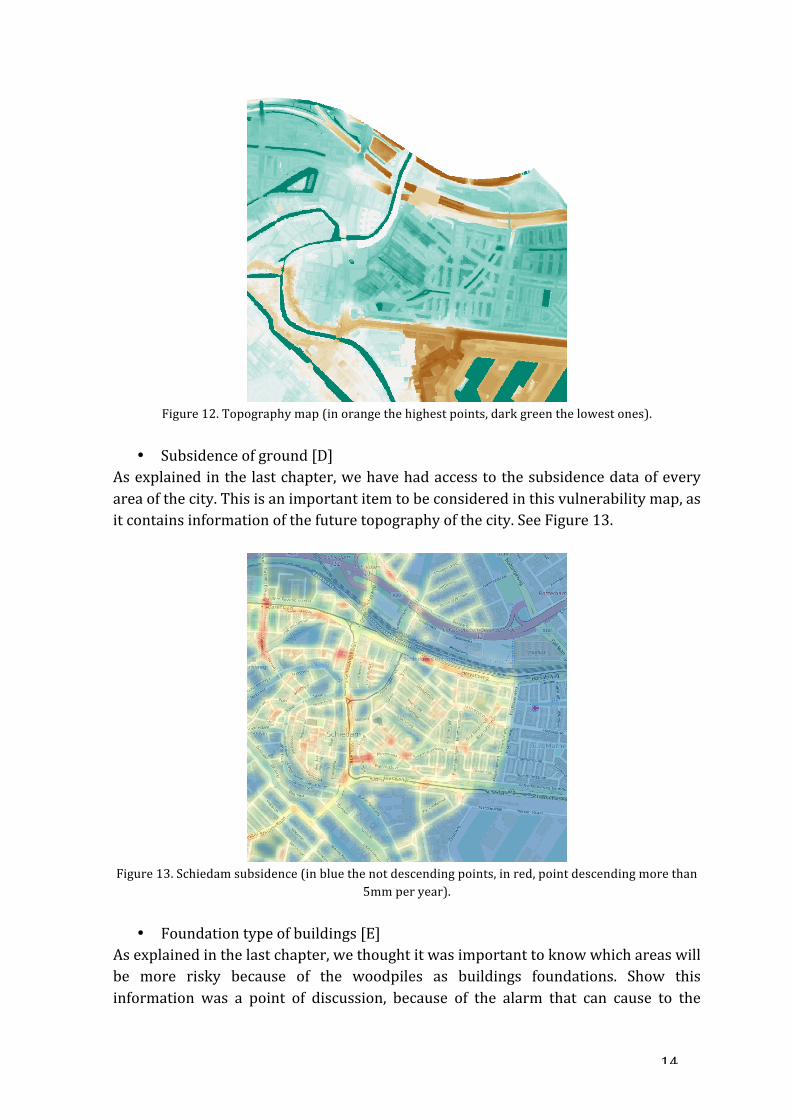
Figure12.Topographymap(inorangethehighestpoints,darkgreenthelowestones).
• Subsidenceofground[D]
Asexplainedinthelastchapter,wehavehadaccesstothesubsidencedataofeveryareaofthecity.Thisisanimportantitemtobeconsideredinthisvulnerabilitymap,asitcontainsinformationofthefuturetopographyofthecity.SeeFigure13.
Figure13.Schiedamsubsidence(inbluethenotdescendingpoints,inred,pointdescendingmorethan
5mmperyear).
• Foundationtypeofbuildings[E]Asexplainedinthelastchapter,wethoughtitwasimportanttoknowwhichareaswillbe more risky because of the woodpiles as buildings foundations. Show thisinformation was a point of discussion, because of the alarm that can cause to the

15
population. We think that for this study it is important to introduce this data.Afterwards,ifthismapitisshowntocitizens,thisinformationmustbeexcluded.SeeFigure14.
Figure14.Schiedamtypeoffoundations(inbluefoundationsmadeoftimber,inred,foundationsmade
inarmedconcrete)
• Landuse[F]Oneimportantthingtotakeintoaccountisthekindofareawehave.Thereareareasmore sensible because of their importance, for example, an area occupied by ahospitalwillbemoresensible toprotectand itwillbemorevulnerable.Even if theweight of thisdata is not importantwe think itwas essential to introduce it in ourstudy.SeeFigure15,whereitcanbeseenthemapwithalldifferentusesconsidered.
Figure15.LandusesinSchiedam(differentcolorspereverydifferentuse).
16
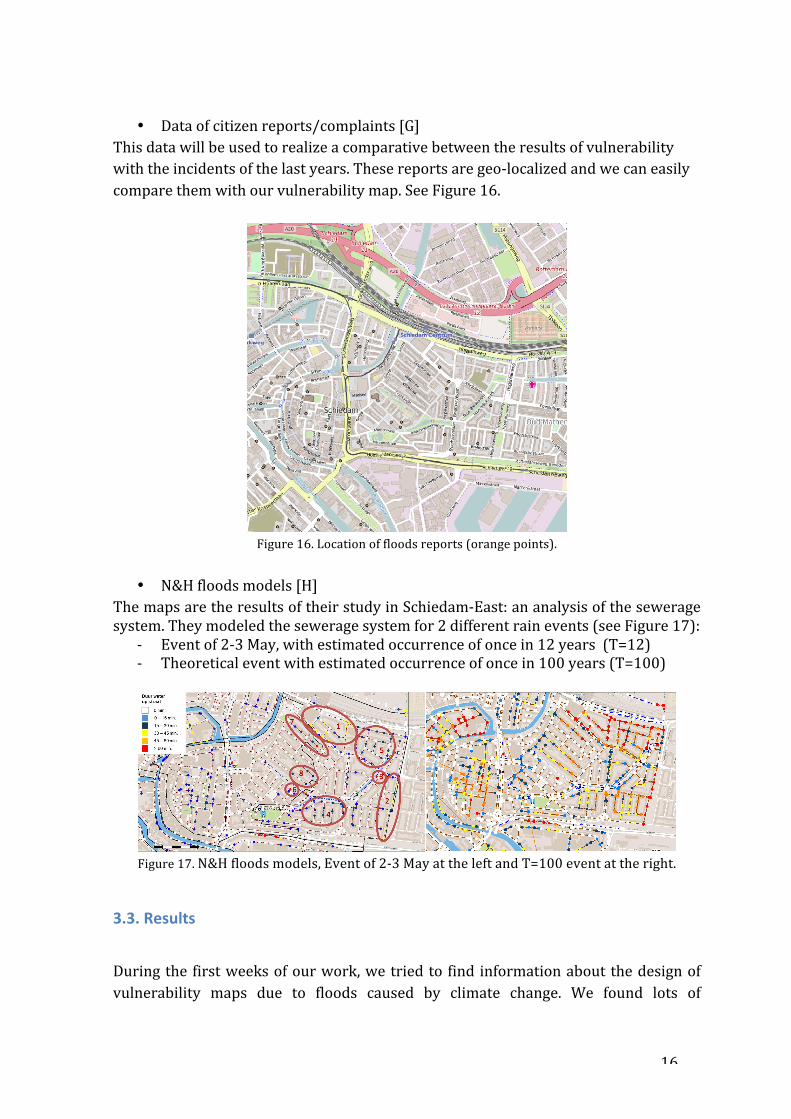
• Dataofcitizenreports/complaints[G]
Thisdatawillbeusedtorealizeacomparativebetweentheresultsofvulnerabilitywiththeincidentsofthelastyears.Thesereportsaregeo-localizedandwecaneasilycomparethemwithourvulnerabilitymap.SeeFigure16.
Figure16.Locationoffloodsreports(orangepoints).
• N&Hfloodsmodels[H]
ThemapsaretheresultsoftheirstudyinSchiedam-East:ananalysisoftheseweragesystem.Theymodeledtheseweragesystemfor2differentrainevents(seeFigure17):
- Eventof2-3May,withestimatedoccurrenceofoncein12years(T=12)- Theoreticaleventwithestimatedoccurrenceofoncein100years(T=100)
Figure17.N&Hfloodsmodels,Eventof2-3MayattheleftandT=100eventattheright.
3.3.Results
Duringthe firstweeksofourwork,wetriedto find informationaboutthedesignofvulnerability maps due to floods caused by climate change. We found lots of

17
information and studies about floodsmodels, butwe didn’t find any study realizedwithsocialdata.Ourstudyisunfortunatelynotsupportedbyanypreviousstudy.
The main idea is to create an equation for the vulnerability. The equation will becreatedgivingacertainweighttoeachofthemapsseen.Somevectormapshavebeentransformed to raster, in order to apply this equation.We have used the SAGA geoalgorithmfromQGISinordertodoanorderedweightingaverage.
Consideringthereferencelettersthatwehavedefinedwhenwehavedescribedthedata,theequationusedinordertocreateourvulnerabilitymapisthefollowing:
VULNERABILITY=10*[A]–10*[B]+60*[C]+15*[D]+10*[E]+15*[F]
As you can seewehave given the same importance to the riskof floodsdue to thepresence of water system than the evacuation of it due to sewerage system.Topographiclevelisaveryimportantpartofthevulnerabilityvalue,sowehavegiventhe60%ofthevaluetoit.Wehavegiventhesameweighttothesubsidenceandtothelanduse,thattogethersuma30%andatlast,thefoundationstypeofhousewehavegivena10%.TheresultsareshowninFigure18.
Figure18.Resultingmapofsumthedifferentmaps,givingavulnerabilityideatofloods.
In theresultingmapweclearlysee the influenceof the topography,butalsohasanimportant impact the subsidence. The areas that are more vulnerable are locatedclearlynearthestationandthesouthwesternpartofOostarea.Theinfluenceofthetimberfoundationscanalsobeobserved.Itisimportanttocomparetheseresultswiththelocationoffloodscomplainsandtheareasthatwillbepotentiallyaffected ina futureevent.So,wehavecomparedtheseresultswiththeN&Hfloodsmodelsandtheneighborsreportedincidents.ResultscanbeseeninFigure19and20respectively.
18
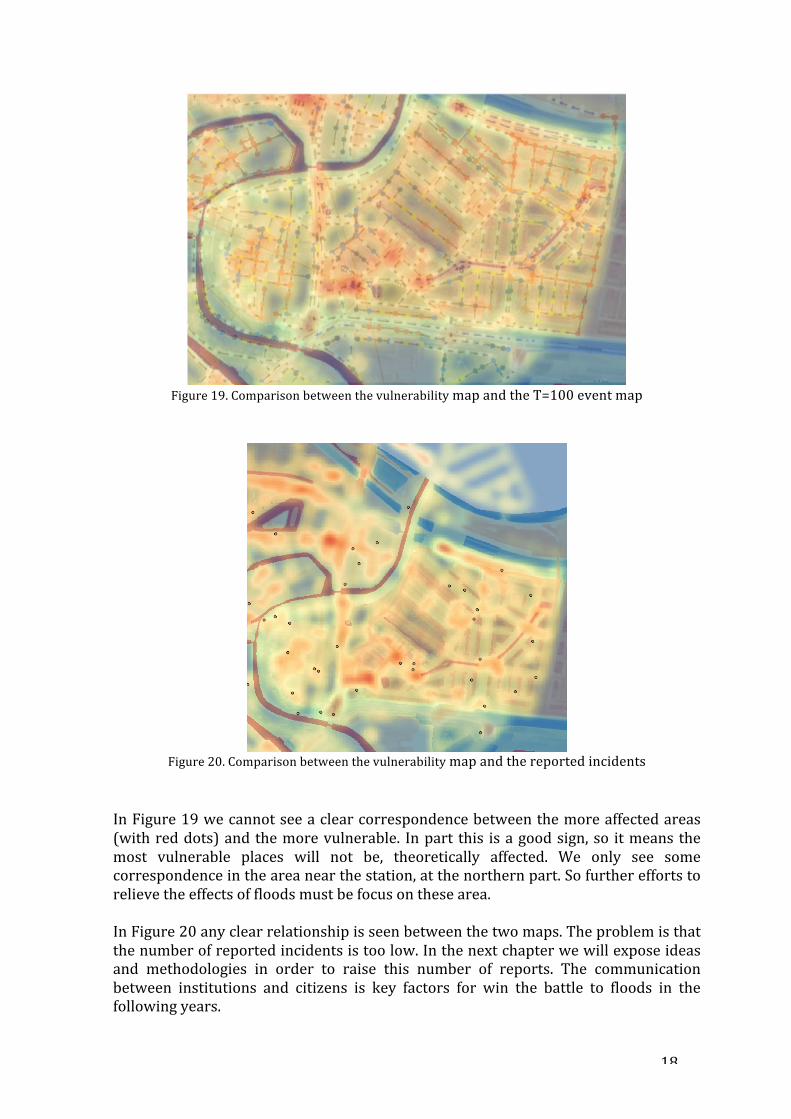
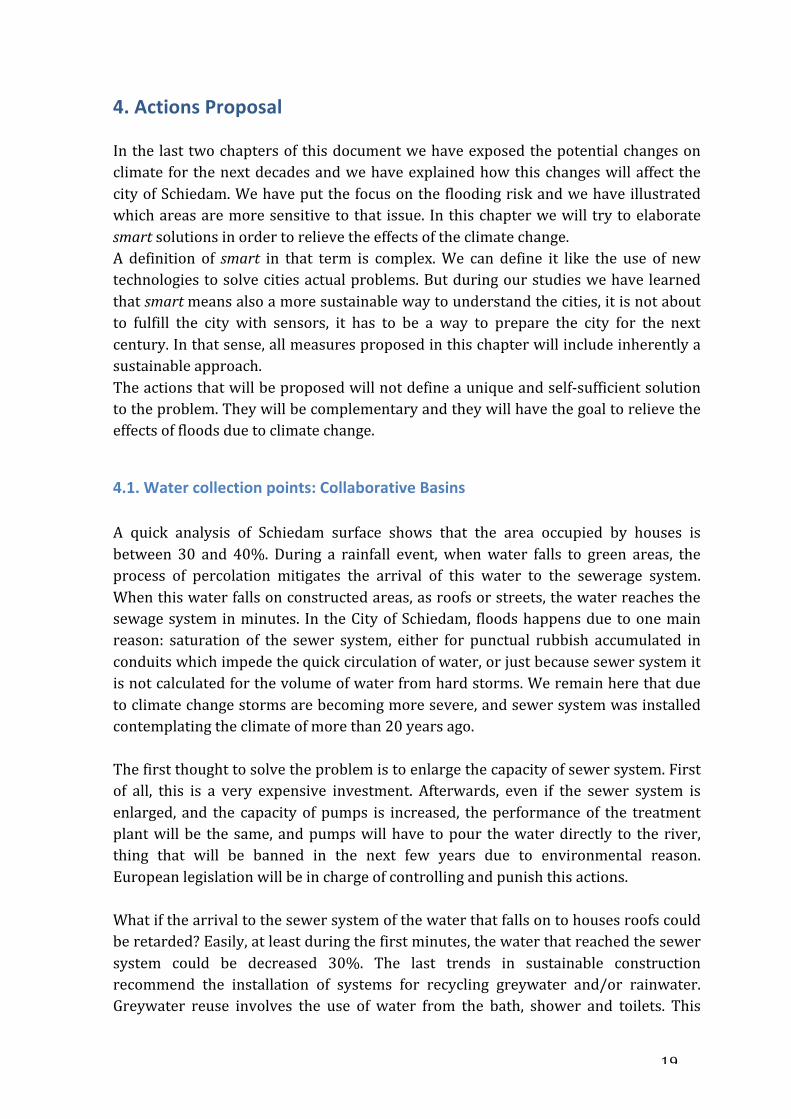
Figure19.ComparisonbetweenthevulnerabilitymapandtheT=100eventmap
Figure20.Comparisonbetweenthevulnerabilitymapandthereportedincidents
InFigure19wecannotseeaclearcorrespondencebetweenthemoreaffectedareas(withreddots)andthemorevulnerable. Inpart this isagoodsign,so itmeansthemost vulnerable places will not be, theoretically affected. We only see somecorrespondenceintheareanearthestation,atthenorthernpart.Sofurthereffortstorelievetheeffectsoffloodsmustbefocusonthesearea.InFigure20anyclearrelationshipisseenbetweenthetwomaps.Theproblemisthatthenumberofreportedincidentsistoolow.Inthenextchapterwewillexposeideasand methodologies in order to raise this number of reports. The communicationbetween institutions and citizens is key factors for win the battle to floods in thefollowingyears.
19
4.ActionsProposalInthe lasttwochaptersofthisdocumentwehaveexposedthepotentialchangesonclimate forthenextdecadesandwehaveexplainedhowthischangeswillaffect thecityofSchiedam.Wehaveputthefocusonthefloodingriskandwehaveillustratedwhichareasaremoresensitivetothat issue. Inthischapterwewill trytoelaboratesmartsolutionsinordertorelievetheeffectsoftheclimatechange.A definition of smart in that term is complex.We can define it like the use of newtechnologiestosolvecitiesactualproblems.Butduringourstudieswehavelearnedthatsmartmeansalsoamoresustainablewaytounderstandthecities,itisnotaboutto fulfill the city with sensors, it has to be a way to prepare the city for the nextcentury.Inthatsense,allmeasuresproposedinthischapterwillincludeinherentlyasustainableapproach.Theactionsthatwillbeproposedwillnotdefineauniqueandself-sufficientsolutiontotheproblem.Theywillbecomplementaryandtheywillhavethegoaltorelievetheeffectsoffloodsduetoclimatechange.
4.1.Watercollectionpoints:CollaborativeBasinsA quick analysis of Schiedam surface shows that the area occupied by houses isbetween 30 and 40%. During a rainfall event, whenwater falls to green areas, theprocess of percolation mitigates the arrival of this water to the sewerage system.Whenthiswaterfallsonconstructedareas,asroofsorstreets,thewaterreachesthesewagesystem inminutes. In theCityofSchiedam, floodshappensdue toonemainreason: saturation of the sewer system, either for punctual rubbish accumulated inconduitswhichimpedethequickcirculationofwater,orjustbecausesewersystemitisnotcalculatedforthevolumeofwaterfromhardstorms.Weremainherethatduetoclimatechangestormsarebecomingmoresevere,andsewersystemwasinstalledcontemplatingtheclimateofmorethan20yearsago.Thefirstthoughttosolvetheproblemistoenlargethecapacityofsewersystem.Firstof all, this is a very expensive investment. Afterwards, even if the sewer system isenlarged, and the capacityofpumps is increased, theperformanceof the treatmentplantwillbe thesame,andpumpswillhave topour thewaterdirectly to the river,thing that will be banned in the next few years due to environmental reason.Europeanlegislationwillbeinchargeofcontrollingandpunishthisactions.Whatifthearrivaltothesewersystemofthewaterthatfallsontohousesroofscouldberetarded?Easily,atleastduringthefirstminutes,thewaterthatreachedthesewersystem could be decreased 30%. The last trends in sustainable constructionrecommend the installation of systems for recycling greywater and/or rainwater.Greywater reuse involves the use of water from the bath, shower and toilets. This

20
waterisfilteredandstoredinatankfordomesticpurposeslateruse.Itcanbeusedintoilets,washingmachines,wateringorchardsandgardens.Rainwater is collected inanarea,usually theroofor terracesand it isconductedthroughpipesandchannelsanditisstoredintanks.Thesetanksarefittedwithapumpcircuitindependentofthemains. The uses of this water can be the same than for recycled greywater. Bothsystemsarecomplementary. InFigure20wecanseeaschemeofrecyclegreywaterandrainwater.
Figure20.Useofgreywatersscheme[6]
Theadvantagesinusingthesesystemsarethefollowing:● Savingthousandsoflitersofdrinkingwaterperyear.● Consequentsavingofwatercosts.● Availabilityoffreshwatereveniftherearerestrictionsonthepublicsystem.● Highindependenceofpublicsupply.● Clearbenefit for theenvironmentand forsociety,given thatweareavoiding
wastewaterwhereitisnotnecessary.Theinstallationofthissysteminhouseswouldhelpustostorethewaterinthefirstminutes of a rainfall event, eluding it to reach immediately the sewer system. Thequestion is, why people would like to install that system in their houses? Theprofitabilityofthissystemislongterm.Thesolutionwouldbetousepublicfinancesinorder to install thosebasins.Duringourweekofworkwith theCityofSchiedam,theyseemedinterestedinrealizethatinvestment.Theinvestmentinbasinswouldbelowerthantheonetoenlargethesewersystem.Thebasinswillhavetoincludeasensoroflevel.Asitwillbeexplainedafterwardsinchapter 4.2.3, itwill be important to know the quantity ofwater that every citizencollects. We have made a research of water basins including level sensors, butnowadays we haven’t found that product. Even though we have found a product
21
designedforwastemanagementthatcouldworkinourcase.TheproductbelongstoUrbiotica, a Spanish company based in Barcelona. They have designed a wirelesssensor that is installed in waste containers or other containers to measure thepercentageoffilling.Dataistransmittedviathemobiletelephonenetworkdirectlytotheplatformtheyinstall.[7]Thissensorcanworkintwodifferentways,afixedmode,whichhasatimebetweenmeasurements and shipping time configurable, or a smart mode, which measuredevery20minutesbuttransmittedonlywhenanemptyingofthecontainerisdetectedorfilling levelsdeterminedbytheuser isreached.Theonethat is interesting inourcaseisthesecondone.The sensor carries a SIM card on Chip embedded operating worldwide and a SIMholderforuseincaseofpreferringtransmittedthroughaparticularmobilenetwork.The intelligence of the system is divided between the sensor and the cloud. In thesensordistance is calculated from theechoes receivedby theultrasonic transducer.Thesubjectofthesensorisperformedusingrivetsonfourpointsofthecircumferenceofthesensorgettingastrongattachmenttothecontainerstructureminimizingriskofvandalism.Let’scalculatetheidealdimensionsforthebasinstoinstall.Intheselastyears,ithasbeenproved that stormeventswithmore than50mm/m2perhalf anhourare themostcommonlyeventsthathavecausedfloods. InSchiedam, lately, ithashappenedtwice or three times a year. If we calculate a house with an average of 60m2, thedimensionsofthebasinshouldbeof3m3,withtheequivalencemm=l.Abasinof3m3isahugebasintohaveit inthegardenofahouse.Notallhouseswillbeabletoputonebigtanklikethisone.Butourinterestistorelievetheeffectsofthestormevent.Onetankof1,5m2ismoreadaptableandcanbeeasyinstalledinagarden.Ifhouseswouldinstallthattypeofbasin,atleast,thefirst15minutesofthestormevent,halfofthewaterthatfallsonthecitywouldbekeptandnotpouredintothesewersystem,astorm event of 50mm in half an hour, with basins of 1,5m2 installed would betransformedtheoreticallyinaneventof35mm,whichnormallycanbesupportedbytheactualsewersystem.Therearegoingtobesomecaseswheretheinstallationofabasinwillbenotpossibleduetoareducedspace.Inthehouseswhereabasinwouldnotfit,westronglywouldrecommendtoinstallagreenroof.Green roofs are a true and logical choice when considering the design of greenbuildingsinurbanareas.Greenroofsarealayersystemthatincorporatestheuseofvegetationonroofcoverings,providingsocial,economicandenvironmentalbenefits,especially in urban areas. It can also incorporate new technologies, such as urbanagricultureorfoodproduction,waterrecyclingsystemsorinstallingsolarpanels.[8]
22
Existing in Europe for decades, it was developed from themid-1800s for aestheticeffects.Itwasimplementedinmassivelysincethe60softhelastcentury,inGermany,where its ecological and environmental benefits were recognized. Germany, whichremainsaleaderonthisissue,sofarhasabout15percentoftheirflatroofsandgreenroofs (13.5millionm2 approx.). North America, since the 90s, has been increasingresearchon the subject and its use, particularly in schools,municipal buildings andoffices. This trend helps contribute to the ecological maintenance in the urbanenvironment, which has prompted cities such as Vancouver, Chicago, Stuttgart,Singapore and Tokyo, to generate laws requiring cover 20% of the terraces ofbuildingswithplants.The idea is to place gardens through the use of terraces and roofs. The systemcomprises at least three layers. The first layer is insulating, the second is for plantgrowthandthethirdisirrigation.Themainfeaturesofagreenroofare:● TheymanagetoreduceCO2fromtheairandreleaseoxygen.● Reduce theamountofheatabsorbed fromthesun that is thenreleased from
thebuildingstotheenvironment.(“Effectofurbanheatisland").● Insulatebuildings,keepingwarmduringwinterandcoolduring thesummer,
allowingenergysavings.● Regulatewaterrunoffandretainingrainwater.● Improvesthelandscape.● Promotebiodiversityintheurbanenvironment.● Isolateoutsidenoise.
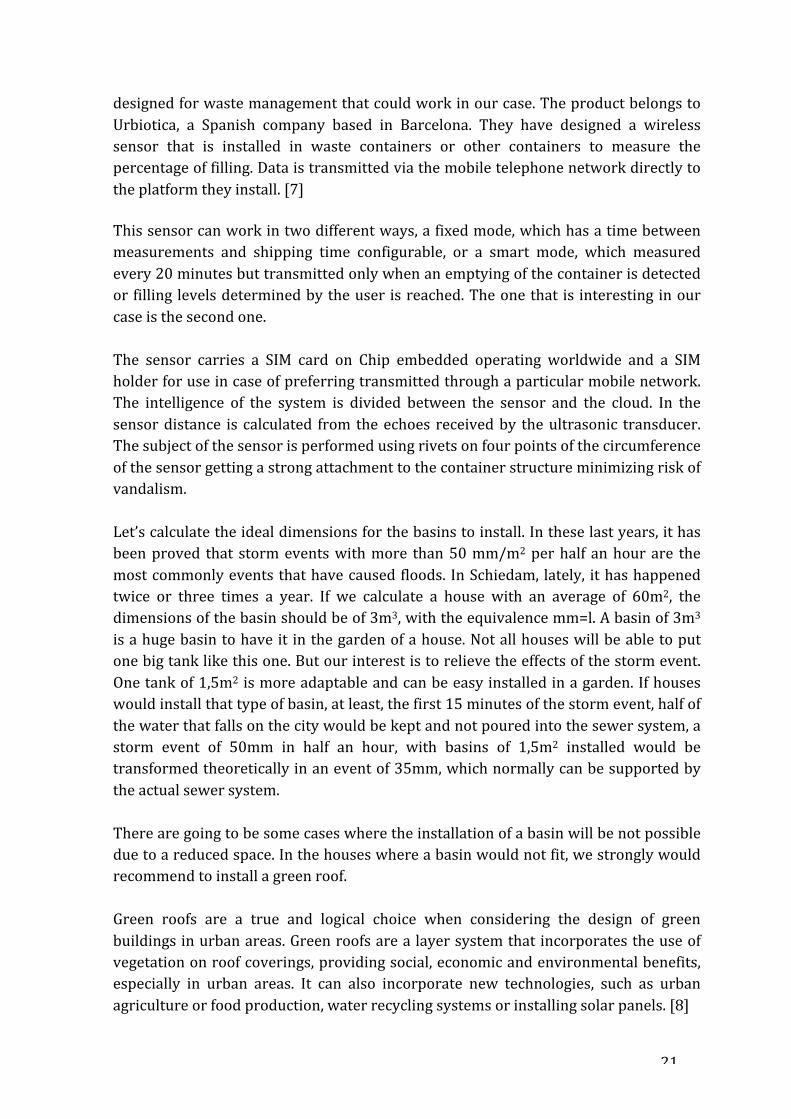
The main reasons for their use have to do with energy saving, excellent thermalinsulation properties and benefits in controlling rainwater, which is from themaximuminterestonourstudy.Greenroofsareusedinmanycountriesforstormwatercontrol.Thankstoitsabilitytoabsorbwater,itisagoodoptiontomitigatetheimpactoftherainsandsubsequentflooding in the city. The ceiling absorbs most of the falling water and graduallyreleased it later. Water absorbed by the roof it is afterwards released to theatmosphere via condensation and evapotranspiration, leaving contaminants in thesoil,improvingairqualityandavoidingcontaminationofnaturalwaterways.InFigure21 we can compare the superiority in absorption between a common plane and agreenroof.
23
Figure21.Comparisonofrunoffwaterbetweenaflatroofandagreenroofinthesamestormwaterevent[7]
Greenroofscanbeclassifiedintotwocategories.Intensiveroofsaremorethan20cmthick, theyrequireareinforcementstructurearepark-likewitheasyaccessandcanincludeanythingfromspicesforcookingshrubsandevensmalltrees.Theyrequirealotofwork,irrigation,fertilizerandothercare.Anothercategoryareextensiveroofs,rangingfrom2to15cmthick,andaredesignedtorequireminimalcare,perhapsonceayearorapplicationofslow-actingfertilizertostimulateweedgrowth.Theycangrowinaverythinlayerofsoil;mostuseaspecialformulaofcompostoreven"rockwool"directlyaboveawaterproofmembrane.For the typeof theexistingbuildings in thecityofSchiedamOost,bothcasesareapplicableandafurtherstudymustbedone.If theCityCouncilwould invest inbasinsor ingreenroofs tobe installed inprivatehousestheycouldfoundthefollowingproblems:● Citizenswouldnotacceptanintrusionfrompublicgovernmentintheirprivate
space.Bigtanksoccupyspaceinhouses.Theinstallofgreenroofsmaynotbeinallcasesaestheticpleasantforhousesresidents.
● Ifcitizensdonotunderstandthebasinorthegreenroofastheirs,theywillnotmaintainitinworkinguse.
The main issue would be how we keep people involved. In the next lines we willdevelopthefollowingproposalsinordertoinvolvecitizensintheproject:● Togetpeopleinformedofclimatechange.● Reportcitizensoffloodsrisk:Longtermandrealtimeinformation.● Introduceavirtualcurrencyinordertodecreasetaxes.● Facilitatetheinteractionwithcitizens.Easycomplainsandreports.

24
Inorder toarticulateall thisproposalswewilldefineamobileApp,whichcouldbecomplementarywiththeAppproposedbyotherstudentsofUdGinourcollaborationwiththeCityofSchiedam.
4.2.MobileAppInthischapterwewillproposethedistributionandcontentsofamobileApp.TheAppwillneedadatabaseinorderthatcitizenscancreatehisownprofileinside.EveryuserwillhavetobeidentifiedandberelatedwithanaddressandacitizenId.Inthisworkwe will focus on how to structure it. Unfortunately we cannot deal with thearchitecture design of the App. Just the creation of an App could be thework of aProjectitself.Although,wewillestablishabaseinordertohaveaclearideaoftheAppdesign.WhentheAppwillbeoperativeitwillneedapersontomaintainit,actualizecontents,launchalarmsanddecideaboutthefilesuserswillbeabletoupload.Theobjectives of thismobileApp are to incentivize citizens to collaboratewith theCityCounciltoreleasetheeffectsofclimatechangeandtheconsequentriseoffloods.This App will swing between three main pillars; marketing, information andinteraction.Wehave tobe conscious that citizenshave the final anddecisive say. Ifcitizenswillnotcollaborate, itwillbedifficult thatanyprojectwillwork.Firstofallwehavetoconvincethem,gettheirattention.Afterweneedtokeeptheminformed.Last,wehavetokeepincentivizingthem.WewilldivideourAppinthreesections,Beaware, Be informed and Get involved. In Figure 22 it is shown a possible screenaccordingtotheactualmobileApp.
Figure22.InitialscreensformobileApp.OverstromingenistheDutchwordforFloods,LetOpmeansBeaware,WeesgeïnformeerdmeansBeinformedandBetrokkenrakenmeansGetinvolved.
25
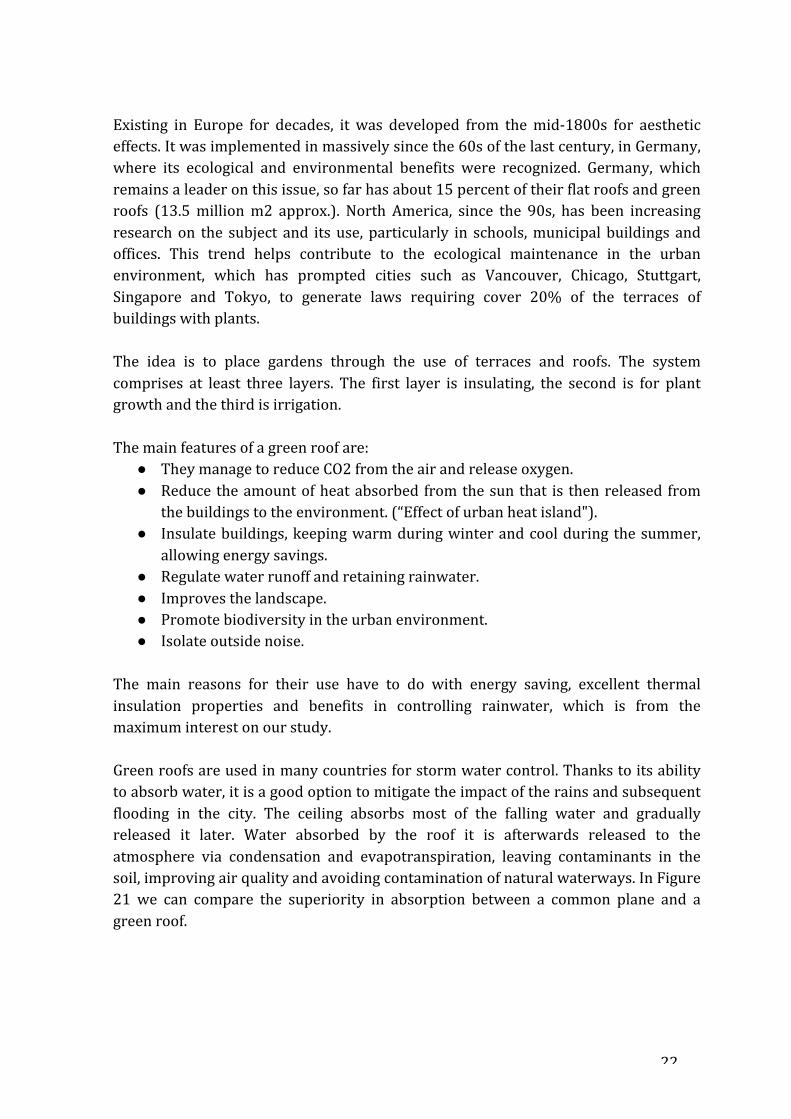
4.2.1.Beaware:MarketingonclimatechangeandfloodsThe first step to get people involved is to draw their attention. The context iscomplicated. Netherlands has historically suffered numerous important floods. Theonein1953left1,836deathsandwidespreadpropertydamage[9].Asitcanbeseenin Figure 23, Netherlands is one of the countries better informed about climatechange.Actually,morethanthe95%ofNetherlandspopulationareawareofclimatechange.Althoughcitizensareaware,inthesamestudy[10]theyensurethatlessthan70% of citizens fromNetherlands think that climate change is a threat. Despite allfloodssufferedandtheknowledgeofclimatechange,theimplicationofpeoplecouldbebetter.Agoodexampleisthatthegreenleftpartyonlygot2,3%ofvotesinthelastgeneralelection.Even ifpeopleareconsciousabout floodsandclimatechange, theyhavetobeshackedupinordertoreact.
Figure23.Percentageofrespondentssayingtheywereawareofclimatechange:topandbottom10countries.Datasource:Leeetal.(2015)[10].
InthissectionoftheAppweproposetocreateagame.DuringourstayinSchiedam,wevisitthestudioofBasSalainRotterdam[11].Althoughthemainobjectiveofthevisitwastoseesomebasinsthathehadcreated,whenhewasawareofourobjectiveheshowedusacardgameabout floods.Thegamegoalwas toawarecitizensabouttheimportanceoftheircontributioninsolvingtheproblemoffloods.AsthegamehasnotyetbeenacquiredbythecityofSchiedam,wecannotexplaininthischapterthenatureandschemeofthegameduetocopyrightreasons.Wethinkitcouldbeagoodinvestment buying the idea and create an easy mobile game in order to raise theawarenessofSchiedampopulation.EventhoughforcopyrightreasonswecannotshowtheBasSalagame,wethinkitisinterestingtopresentinthischapteragamedestinedtoraisetheawarenessofpeopleabout floods. Ifwe look at Figure 24wewill see thework of Professor ShihChungKang [12]. They used a learningmodel, GIL,which consists in three steps: gaming,discussing and self-directed learning. With this system a user can experiencequestions in the real world from gaming, after he can learn if he receives the

26
appropriate information for finally, achieve the knowledge we wanted to give him(Tsai et al. 2014) [13]. The group of Professor Kang designed a game called FloodProtection.Duringeach levelof thegame, thereare fivewavesofheavyrain,whichshall cause flood.Gameplayershave toprotect the threedifferentareas in the city,depending on their thinking and strategies and prevent those areas fromwaves offloodsbyusingselectedengineeringmethods.Thekeytosuccessreliesonhowwellthe users manage and allocate their resources. Special policies can increase theeffectivenessoftheresourcesinspecificregions.Afteracertainnumberoffloods,thetotalscoreitisevaluatedandreflectedonthescreen.
Figure 24. Illustration of the game,where each area has its ownproperties such as tax rates, funds,population,andcapabilityagainstfloods.[12]This game includes six different engineering methods for disaster mitigation: sandbags,pumps,dikes,retentionparks,greenroofsandgreenstreets.Playerscanmakeuseofvariedengineeringmethodstoprotect fromflooding.Thegameit isdesignedwith six progressive levels, with different maps and difficulty levels, with a newengineeringmethodaddedineachlevel.Thissetupallowsthemtohavemorechoicein the decision making process. With increasing the level of difficulty, flood-proneareasbecomeharder toprotect.Usersare to learnona “trialanderror”basis.Thisforcesplayerstoconsiderdifferentstrategiesformanipulatingtheresourcesandthedifferent engineering methods. The goal is not only for users to learn about floodprotectionthroughthegame,butalsoformotivatecitizenstogetcollaborative.Themostdifficult thingwillbetoconvincepeopletousetheApp.Weneedthemtoplay to the game in order to raise the awareness of population.We need asmanypeopleusingtheAppaspossible.Weproposetwowaystoincentivizethecitizens.

27
Ourfirstproposal isrelatedwithchapter4.2.3,where itwillbe introducedavirtualcurrency.Therough ideaabout this firstproposal is to introduce thegainofvirtualcurrency if theyachieve thegoals in thegame.Wewilldevelop thisproposal in thecorrespondingchapter.OursecondproposalistocreateonceayearaWaterPartyinSchiedam.Wethinkthatthispartyshouldbechildrenorientedandproposeactivitiesrelatedwiththecultureofwater and the history of Schiedam. The objective of this section is not the partyorganization,butwewillproposesomewaystopromotethemobileAppinit:● GetorientedinthepartywiththemobileApp.● Possibilitytopayextras, like fairgroundrides, foodordrinkswiththevirtual
currency.● PartyprogramonlyavailableinthemobileApp.
4.2.2.Beinformed:ShortandLongterminformationWhenwehavedrawntheattentionofcitizens, it is important togivethemaccurateand planned information. The main idea is to give them the tools in order to getinvolvedandbepartofthesolution.Wecanclassifytheinformationintwodifferentsections:Afirstone,givinglong-terminformation,whichmeansinformationthathasbeenprocessedandanalyzedandalso,givingthemusefultipstoelaboratetheirownprotectionelementsagainst floods.A secondsection includes real-time information.Forexample,givinginformationofnextstormeventorcreatingalarmsinthemobilephone.SeeinFigure25aproposalofscreen.
Figure25.ScreenformobileApp.LangetermijnistheDutchwordforLongtermandElijetijdmeansRealtime.
28
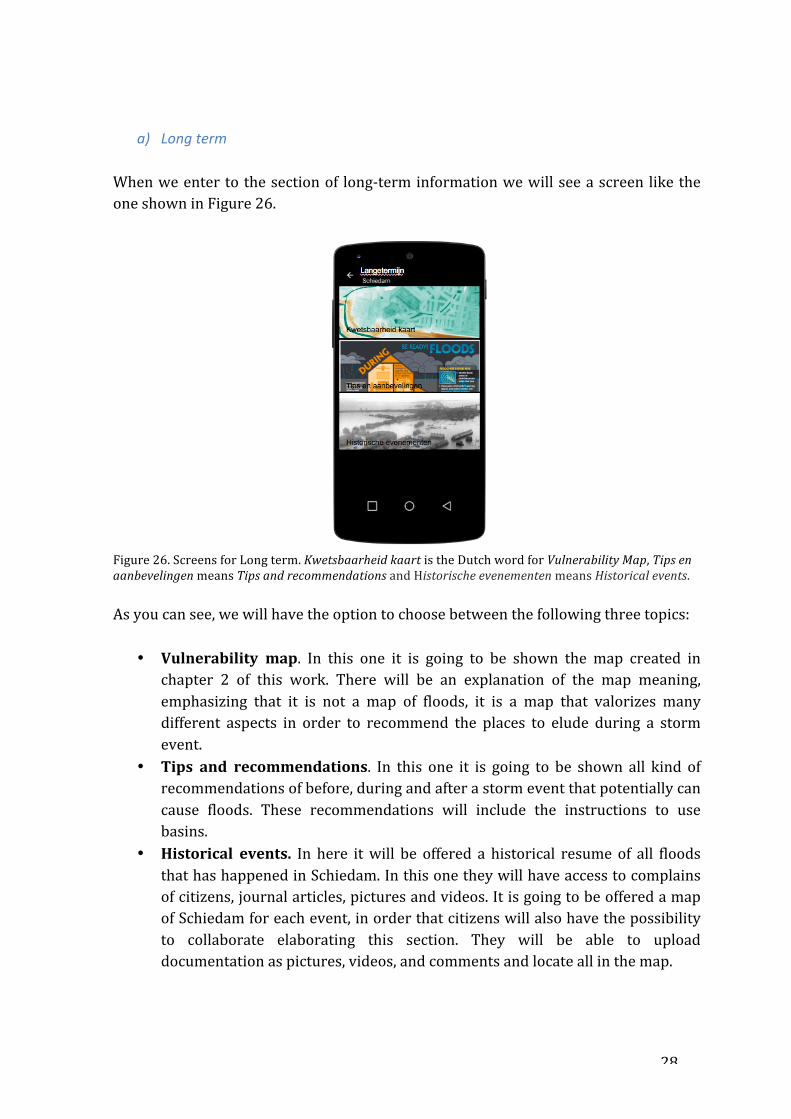
a) LongtermWhenweentertothesectionof long-terminformationwewillseeascreen liketheoneshowninFigure26.
Figure26.ScreensforLongterm.KwetsbaarheidkaartistheDutchwordforVulnerabilityMap,TipsenaanbevelingenmeansTipsandrecommendationsandHistorischeevenementenmeansHistoricalevents.Asyoucansee,wewillhavetheoptiontochoosebetweenthefollowingthreetopics:
• Vulnerability map. In this one it is going to be shown the map created inchapter 2 of this work. There will be an explanation of the map meaning,emphasizing that it is not a map of floods, it is a map that valorizes manydifferent aspects in order to recommend the places to elude during a stormevent.
• Tips and recommendations. In this one it is going to be shown all kind ofrecommendationsofbefore,duringandafterastormeventthatpotentiallycancause floods. These recommendations will include the instructions to usebasins.
• Historical events. In here itwill be offered a historical resumeof all floodsthathashappenedinSchiedam.Inthisonetheywillhaveaccesstocomplainsofcitizens,journalarticles,picturesandvideos.ItisgoingtobeofferedamapofSchiedamforeachevent,inorderthatcitizenswillalsohavethepossibilityto collaborate elaborating this section. They will be able to uploaddocumentationaspictures,videos,andcommentsandlocateallinthemap.

29
b) RealTime:AlarmsystemInthissectionoftheApp,thecitizenwillbeallowedtochoosewhichalertshewantstoreceivetohismobilephone.Aproposalofalertsareshownasfollowing:Before:
• StormpotentiallycausingfloodsinXhours.• Blockyourdoors.• Emptyyourbasins.
During:
• WestronglyrecommendnotgoingtoXarea.• TheaccesstoXareaisstronglyprohibited.• Westronglyrecommendyoutostayhome.
ThesemessageswillbereceivedasperAppalertsandcitizenswilldecidewhichonestheywanttoreceive.Astheuserwillhaveloggedinandtherewillbeinformationofhislocationandthelocationofhishouse,dependingonthestormevent,personalizedmessagescanbesend.
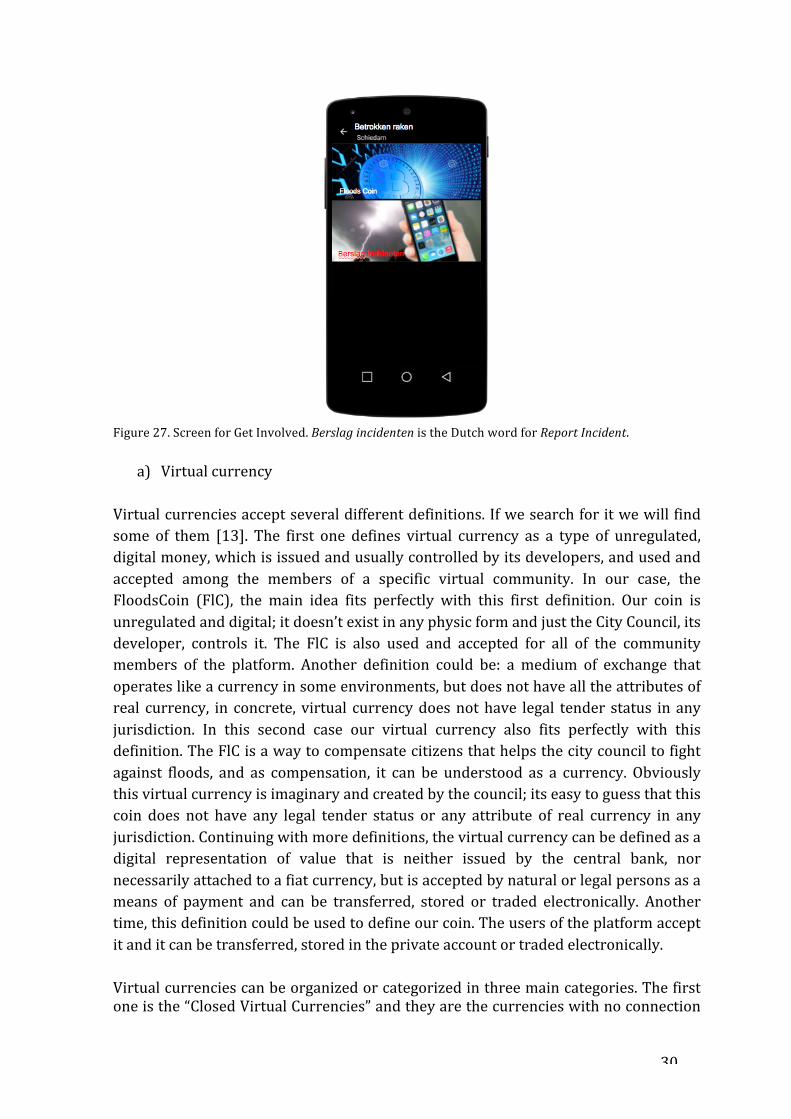
4.2.3.Getinvolved:InteractionbetweenCouncilandCitizensNewtechnologieshavechangedthewayweunderstandinformation.Noweverybodycan be a source of information. Crowdsourcing gives us the opportunity to havesensors and potentially, reports, spatially distributed throughout the City. If wecorrectly focus thesituation, ICTcanalsohelpus tochange thewayweunderstandcities,neighborhoodsandtherelationshipbetweencitizensandgovernments.Inthischapter we will expose two ideas in order to increase the participation andimplicationof citizens.Bothof them theyneed the supportof theApp towork,buttheyaremuchmorethanasimplefunctionofanApp.Thefirstideathatwearegoingtoexposeistointroduceavirtualcurrencyinordertogiveincentivestocitizenstobecollaborative.Thesecondideaistohelppeopletoreportstormevents.YoucanseeaproposalofscreeninFigure27.
30
Figure27.ScreenforGetInvolved.BerslagincidentenistheDutchwordforReportIncident.
a) Virtualcurrency
Virtualcurrenciesacceptseveraldifferentdefinitions.Ifwesearchforitwewillfindsome of them [13]. The first one defines virtual currency as a type of unregulated,digitalmoney,whichisissuedandusuallycontrolledbyitsdevelopers,andusedandaccepted among the members of a specific virtual community. In our case, theFloodsCoin (FlC), the main idea fits perfectly with this first definition. Our coin isunregulatedanddigital;itdoesn’texistinanyphysicformandjusttheCityCouncil,itsdeveloper, controls it. The FlC is also used and accepted for all of the communitymembers of the platform. Another definition could be: a medium of exchange thatoperateslikeacurrencyinsomeenvironments,butdoesnothavealltheattributesofreal currency, in concrete, virtual currencydoesnothave legal tender status in anyjurisdiction. In this second case our virtual currency also fits perfectly with thisdefinition.TheFlCisawaytocompensatecitizensthathelpsthecitycounciltofightagainst floods, and as compensation, it can be understood as a currency. Obviouslythisvirtualcurrencyisimaginaryandcreatedbythecouncil;itseasytoguessthatthiscoin does not have any legal tender status or any attribute of real currency in anyjurisdiction.Continuingwithmoredefinitions,thevirtualcurrencycanbedefinedasadigital representation of value that is neither issued by the central bank, nornecessarilyattachedtoafiatcurrency,butisacceptedbynaturalorlegalpersonsasameans of payment and can be transferred, stored or traded electronically. Anothertime,thisdefinitioncouldbeusedtodefineourcoin.Theusersoftheplatformacceptitanditcanbetransferred,storedintheprivateaccountortradedelectronically.Virtualcurrenciescanbeorganizedorcategorizedinthreemaincategories.Thefirstoneisthe“ClosedVirtualCurrencies”andtheyarethecurrencieswithnoconnection
31
totherealeconomy.Oneexampleofthiscategorycouldbethein-online-games-onlyliketheWoW.Thesecondcategoryisthe“Virtualcurrencieswithcurrencyflowintoonedirection”. In thiscategorythevirtualcurrencycanbeboughtusingrealmoneybut not be exchanged back into real money. The main application of this kind ofcurrency is tobeused inonlineservicesordevelopmentofonlinecommunitiesandgames. The third and last category is named “Convertible virtual currencies”. Thecurrenciesinthisthirdcategorycanbeboughtwithandsoldbackforalegaltender.TheycanbecentralizedordecentralizedandthemostfamousexampleistheBitCoin.Ourvirtualcurrency,theFloodsCoin,couldbepartofthefirstcategory.Itcannotbeboughtusingrealmoneyanditcannotbeexchangedback;thecounterpointwouldbethat,asitwillbeseenlately,themoneycanbeusedtopaytaxes,thathavearealcost,butwebettergetdeeperintothedefinitionofthecurrencyinordertounderstandthepurposeofit.TheFloodsCoin(FlC)isavirtualcurrencycreatedtoincentivizepeopletocollaboratewiththecitycouncilinthefightagainstfloods.Thethingsthatthecitycouncilwantsthecitizensdoarethefollowing:
• Getinformedabouthowtoreactwhenastormeventhappens;beforeandduringtheevent.
• Installbasinsintheirhousestokeepthewaterfromstorms.• Ifthereisnospaceforawaterbasin,installgreenroof.• Participateinreportdangeroussituationsoffloods.
Whenyoucreateasocialvirtualcurrencyofthistype,itisgoodtohaveclearwhatyouwant to achievewith it, but it is also important to planwhat people can get to beincentivized to use it. Even if the actions they we want them to do will be in allpopulationbenefitandinterest,itiscomplicatedthatcitizensparticipate,asthesocialbenefits will be long-term. So, what the City Council can offer to citizens? Taxes.Peoplewhocollaborateshouldgetadeductionoftaxes.Ifwe think about itmore accurately,wewill find it evenmore logic. Ifwe focus incosts, imagine that all peoplewill participate. Thiswill relieve the impact of floodsenormously,whichconsequentlywillreducethecostsofthecitycouncilwhenastormeventhappens.Thereduceofcostswillbeinthefollowingitems:
• Energyofwaterpumping.Fuelofpump’smotors.• Costsofpublicworkersdoingextrahours.Police,firemen,etc.• Noaccessblocked.Betterproductivityofcitizens.• Streetfurnituredamaged.• Cleaningofstreets.• Elude potential penalty fees fromEuropeanUnion due to pouringwater not
treatedtotheriver.As you see there some costs that the city Council could prevent if citizen wouldcollaborate.Butanotherquestionis,whyacitizenthatcollaborateswiththecouncil,giving information, installing a basin and helping the City Council to reduce costsshouldpaythesametaxesthanapersonthatdoesnotcollaborate.Weagreethatthe
32
personthatcollaboratesdoesnothave topay forcostscausedbyhisneighbor.But,howwecandiscriminatebetweengoodsorbadcitizens,andmostimportant,howwecanvalproate theparticipation.Theanswer to thosequestions is theFloodsCoin. Inthenextlineswewillexplaintheoperationalsystemofthisvirtualcurrency.ObtainingmethodThefirstFlCareobtainedjustregisteringintheApp.Thefreeregisterwillgiveyou40FlC.ThemostcommonwaystoobtainFlCwillbe:
• PlayingwiththeAppgame.Foreachlevelyoucomplete,youget5FlC.Withatotalof30FlC.
• Installingthebasin.Eachinhabitantwillreceiveatotalof600FlCbylettingtheCityCouncilinstallthebasininhishouse.
• Quantity of water collected. As explained before, each basin should beequippedwithasensor.Thissensorwillhavetobeembeddedintheplastic,inorder to be protected against manipulation. For every 100 liters of wateraccumulatedandnotpouredtothesewersystemtheinhabitantwillreceive1FlC. This means that for an average strong storm event they can recollectaround30FlC.
• Installing the green roof. As the impact of the works will be bigger for theinhabitantofthehouseincaseofinstallingthegreenroof,theinitialpaymentwill be bigger, of 800 FlC. After, for each storm event, with the data of theweather stations crossed with the data got from the basin sensors, theinhabitantthathaveinstalledagreenroofwillreceivethesameamountthantheonethathaveinstalledthebasin.
• Reportingtheevent.Aswewillexplaininparagraphb),itwillbepossiblethatduring a storm eventwe can collaborate in reporting incidences. Every timeyouwillreporttothecitycouncilyouwillget15FlC.
• Collaboratinginhistoricalreviews.Ifyoucollaboratewithcomments,pictures,etc.inthelong-terminformation,youwillget5FlCforeveryitem.
TheFlCwillbeautomaticallyaccumulatedinyourmobileApp.Asitisexplainedinthestructure of the App, there is going to be a section where you can check your FlCaccountbalance.CirculationmethodOnceyouhaveFlCinyouraccountyoucanstartusingthem.ThedifficultissuewillbetogivevaluetotheFlC.ThisdecisionwillbetakenbytheCityCouncil.Werecommendthefollowingpremises:
• ThevalueofFlChastobeverystable.PeopleneedtotrusttheFlC.• ThecostofallseweragetaxesforoneyearneedstobelesserthantheFlCgiven
forinstallingthebasinorthegreenroof.• Asthecostsforthecitycouncil inseweragesystemwillbebiggerinthenext
years, the price in euros must be bigger, but the percentage relation of FlCneedstoremainimmovable.
33
WithinthispremisesweproposethefollowingpercentagerelationbetweentaxesandFlC.Thekeycomparisonwillbethatforanaveragehouse,withstandardtaxesvalue,allannualseweragetaxescostwillbeequivalentto500FlC.Inordertodothetransactions itwillbethedeveloper, in thiscase, thecitycouncil,whowillberesponsibleforcontrolit.OneexampleinhowtocontrolthattransactioncouldbetheWIRcurrency,aSwissvirtualcurrencywithalonghistoryandmorethan50.000thousandsofusers.TheCityCouncilwillcontrolthepaymentofFlCtousersandthepaymentoftaxeswithit.EliminationmethodAll currency needs a system to regulate their value. In this case the transactionalmethodsimplifiesthisissue.AsitisgoingtobetheCityCouncilwhowillcontrolthetransactions, the regulation can be planned every year with the costs of taxes andtheirequivalencewiththeFlC.StructureinthemobileAppThe operational of the FlC will be mostly invisible for users. They are going torecollect FlC in other sections of theApp, or even,without interacting, just keepingoperablethebasinintheirhouses.ThetwosectionsthatmustbeclearvisibleintheFlC section are the current balancewith a transaction history and a sectionwhereuserwillbeinformedaboutFloodsCoin.Thissectionwillhavetoincludethefollowinginformation:
• InformationabouthowtoobtainFlC.• Information about how to pay taxes with it (a link to taxes payment of the
councilwillbeincluded)Asmanyotherplaces,theCityofSchiedamwillsooneror laterallowcitizenstopaytaxesviaInternetorApp.WiththeFloodsAppyouwillnotbeallowedtopaythetaxesbutyouaregoingtoberedirectedtothepayment.Thesystemoftaxespaymentwillhavetobepreparedtopaywithbothcurrencies,EurosandFlC.FutureThemarketdimensionof theFloodsCoin is small; the structure is simpleand theirpossibilities,little.Thisvirtualcurrencycanbeusefulbutwithlittlegrowingpotential.Wethinkitcouldbemoreinterestingtocreateavirtualcurrencyforallissuesrelatedwith the City of Schiedam. Create a virtual currency including waste management,mobility,etc.withthepossibilitytobuyinlocalshops,paytaxesandservices.Inthisworkwehavepresentedthestructureofavirtualcoinjustrelatedwithfloods,butitcouldbemuchmoreinterestingandpowerfultocreateawholegeneralcurrency, in
34
ordertopromotethelocalcommerceandchangethebehaviorofcitizens.Introducinga virtual currency allows the City Council to reward the attitudes of citizens thatfacilitatetheworkoftheCitymanagementandtopenalize,withoutapplyingfees,badcommunitybehavior.
b) ReportincidencesNowadays it exists in the City of Schiedam one system for report incidences aboutfloods.Theproblemisthatthisinformationarriveslateandinmostofthecasescanbe insufficient and biased. If citizens could have an easy platform to report floodsincidentsatthesamemomentithappensandtheycouldbecompensatedviaFloodsCoin, we could have real time information, more accurately and outspread in theterritory.ThemainideaisthatinthissectionoftheApptheywouldhaveaplacetointroducepictures, respond a quick test of the floods magnitude and if they want, to leavecommentsaboutit.AseverytimethatcitizenswillentertotheApp,theywillbeloginin, allowing us to see their position. With every report we will have as extrainformation,thelocationoftheuserwhenhehasreportedtheincidentandthetimewhenhehasreportedtheincident.This informationwillbeusefulforthelong-termanalysisand tovalidate the information theygiveus.Nowadays, technologydoesn’tallow having a big accuracy reporting levels, but the idea would be that whentechnologyallowsit,thesameAppwouldfacilitatethattheusergivesusinformationofthewaterlevelwhenhereportstheincident.
4.3.GovernanceWe agree that technology is the key of cities evolution to a future Smart City, buttechnology alone is worthless. Technology has to be accompanied with adaptivepolitical policies. The governments that will move quicker will take profit of thesituation, transforming their cities in better places to live in. The relation ofgovernments and citizens has to evolve with more participation and with sharedresponsibilities. Changes like e-voting, online participation between others willchangethewaywelooktheCityCouncils. Inthatsense,Governmentshavetoadaptlawstothenewerawelivein.Weproposeinthischapter,twoessentialchangesthatarebasic for the reliefof climatechangeeffects in the floods thataffects theCityofSchiedam.
4.3.1.AdaptationofBuildingLawFrom our point of view it is imperative that new urban promotions includesustainablepolitics. In the constructionof newbuildingswe think that it shouldbe
35
obligatorytoinstallbasinsandarecirculationgreywatersystem.Thisregulationhasbeen already implemented in some areas of Belgium, or in some of the States ofAustralia. The results are positives and prove thatwith politic predisposition thesechangescanbeimplemented[14].
4.3.2.TaxesInordertoapplytheproposalsofthisworks,itisessentialthattaxesdepartmentofthe City Council of Schiedam adapt their politics to our requests. They shouldunderstand the benefits that will report this changes to the city and they have tounderstandthatallchangesareintheirhands.ThepaymentoftaxeswithFloodCoinsisnotaneasychangetodo.Thecapacityexists,thetechnologyalsoiseasytoimplement.Itisonlyaquestionofpoliticalwill.Thefollowingyearswillbringusabigamountofchangesinallfieldsandonlypeople,companiesand institutions thatwouldhave the facility toeasilyadapt to thesenewchangeswillsurvive.Withthiswork, thechangesandchallengesforthecitycouncilarehuge,butallowthemtomakeabigchangewithahugeamountofbenefits.
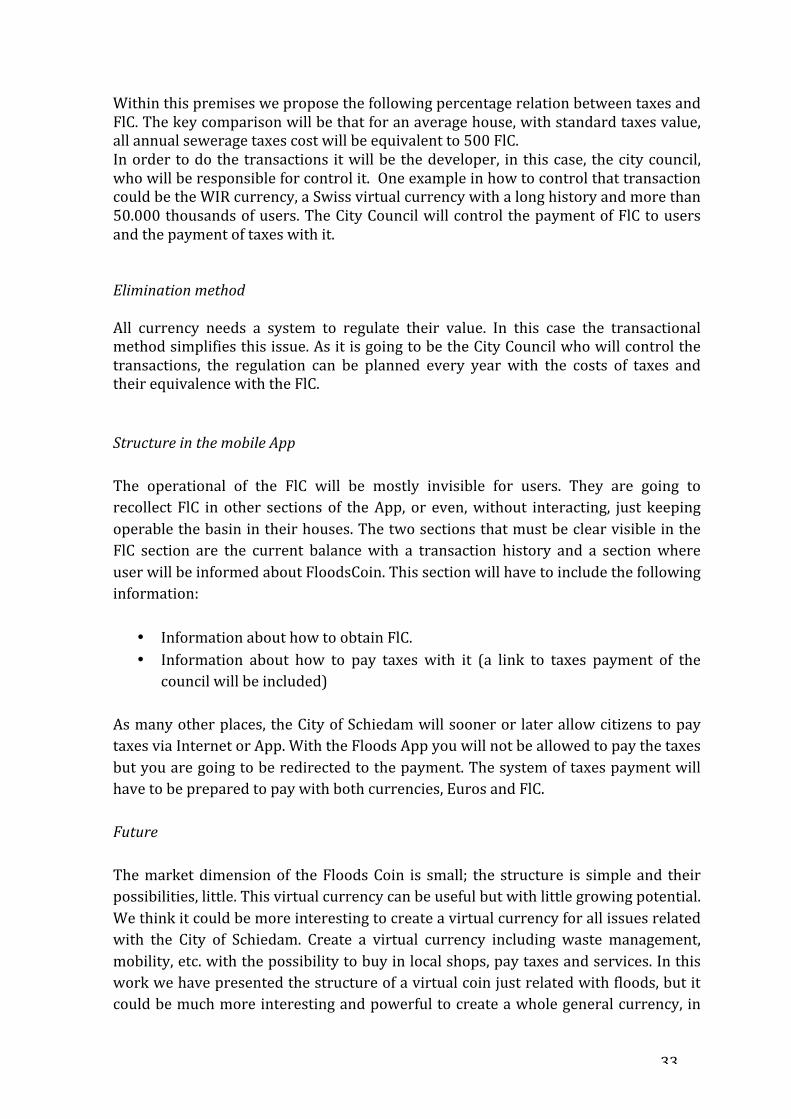
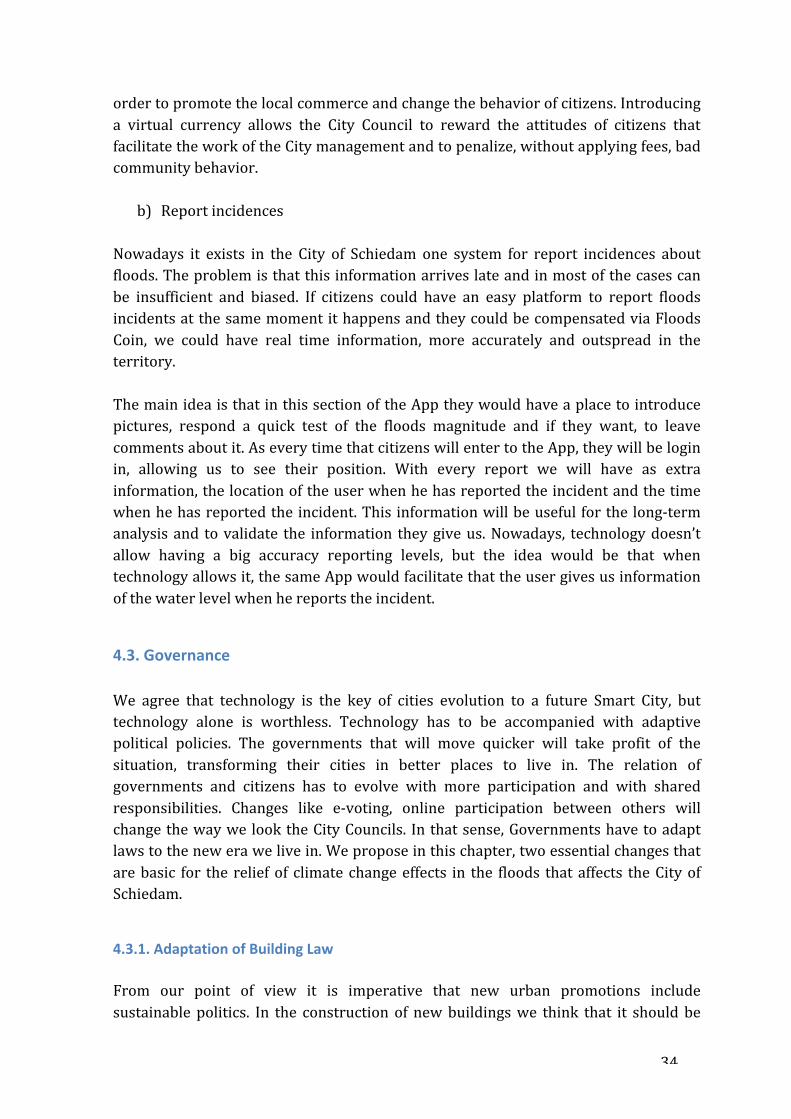
4.4.UrbansensitiveadaptationAswehaveexplained,thechallengesofaCitythatwantstobesmarterarenotbasedonly in ICT’s. ICT’sareagoodsupportand theyare thedriving forceofchange,butotherinnovationfieldsarewelcomedinordertocontributetothewealthofcitizens.We are going to focus in two architectural aspects that can help us to relieve theeffectsoffloods.The first one it is based in Benthemplein square, in Rotterdam. Inaugurated inDecember2013,itwasbuiltbyDeURBANISTEN.Itwasdesignedtocopewithclimatechangeandheavyrains,itscourtsfunctionashugewatercontainersthatrelievethepressure falls on the drainage system of the town. You can see a plan drawing inFigure28andtwopicturesinFigure29.Toachievethis,theparkhastwosmallbasinsthatcollectwaterfromthesurroundingarea.Athirdbasin,thelargestpitch,connectstootherareastoreceivewaterfromawider area, including neighboring buildings. In total, the square can temporarilycontainmorethanonemillionandahalfliters.Parkareasthatcanfloodarepaintedinvariousshadesofblue.Thespaceiscompletedanddividedbysmallgreenareaswithflowersandsomeoftheexistingtreespreservedinthenewdesign.
36
ThedifferentthingofBenthempleinSquareisthatneighborscanuseitsconstructionas urban space in the dayswhen thewater is not a problem,while it is serving assupport of the underground infrastructure, which is already outdated to deal withextremeweather.
Figure28.Planviewofthesquare.[15]
Figure29.PicturesofBenthempleinSquare.[15]
ThesecondexampleofinnovativechangesnotcomingfromICT,andeasilyapplicabletotheCityofSchiedamistheuseofnewtechnologicpavement.Lately,duetofloodsproblems,abigamountofnewproductshavebeendesignedinordertoabsorbwaterandslowlypouritintothesewersystem.Theresultsareextraordinary.TheexampleofFigure31,Hydroblob,isDutchfabricatedandtheyhaveverypositiveexperiences.
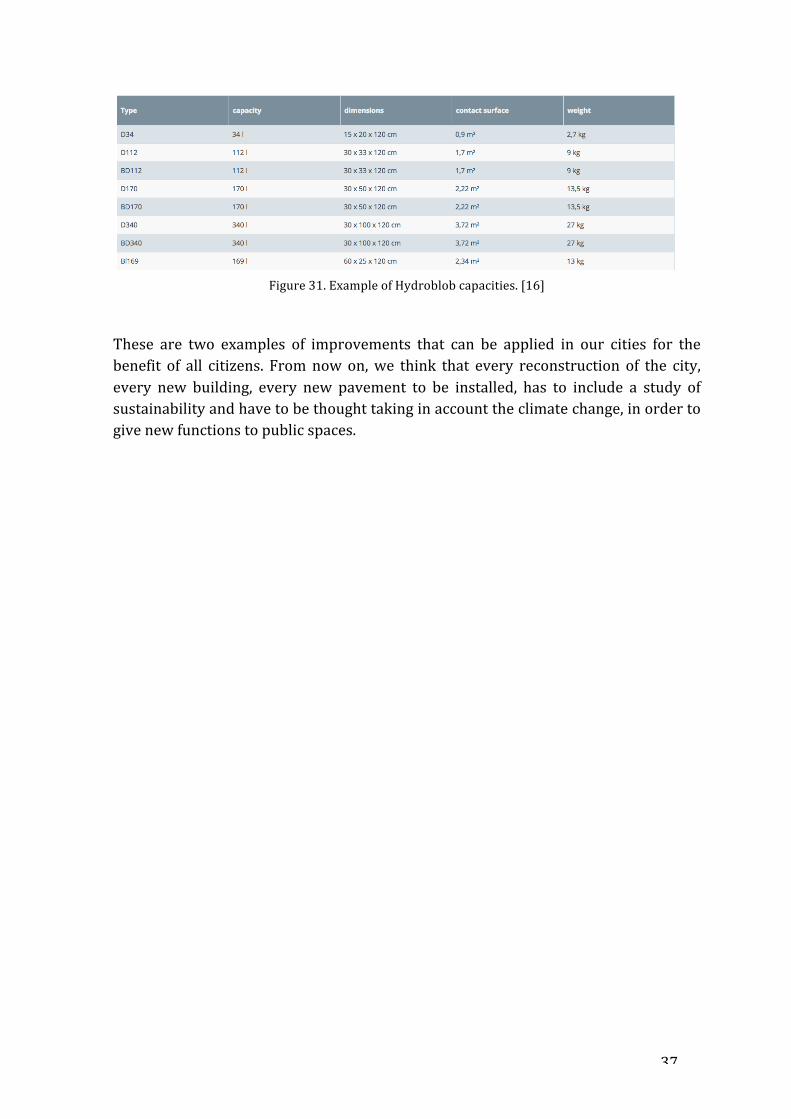
37
Figure31.ExampleofHydroblobcapacities.[16]
These are two examples of improvements that can be applied in our cities for thebenefit of all citizens. Fromnow on,we think that every reconstruction of the city,every new building, every new pavement to be installed, has to include a study ofsustainabilityandhavetobethoughttakinginaccounttheclimatechange,inordertogivenewfunctionstopublicspaces.
38
5.ConclusionsTheelaborationofthisworkhasreportedthreemainconclusionsasitfollows:
o Climate change is really affecting the type conditions of people living. IndifferentpartsoftheworldaffectsindifferentwaysandintheNetherlands,themain problem is the sea level rise and the floods, direct consequence of thestormeventsviolenceincrease.
o Schiedamisavulnerablepoint.ThemostvulnerableareaistheCityisnearthe
station,belongingtoSchiedamEastaccordingtothevulnerabilitymapwehavedone.
o Only with the collaboration and implication of institutions and citizens a
solutionwillbepossible.Wehaveofferedvarioussolutionsbut it isessentialthatcitizensgetawarded,informedandinvolved.
39
6.References[1]IPCC,2013:ClimateChange2013:ThePhysicalScienceBasis.ContributionofWorkingGroupItotheFifthAssessmentReportoftheIntergovernmentalPanelonClimateChange[Stocker,T.F.,D.Qin,G.-K.Plattner,M.Tignor,S.K.Allen,J.Boschung,A.Nauels,Y.Xia,V.BexandP.M.Midgley(eds.)].CambridgeUniversityPress,Cambridge,UnitedKingdomandNewYork,NY,USA[2]KNMI,2014:ClimateChangescenariosforthe21stCentury–ANetherlandsperspective.ScientificReportWR2014-01,KNMI,DeBilt,TheNetherlands.www.climatescenarios.nl[3]http://www.overmaas.nl/regels-beleid/beleid-waterschap/notitie/[4]KalNorthMinesLimited.QuarterlyActivitiesReport:December2015[5]https://schiedam.portal.skygeo.com/portal/schiedam/[6]http://theriverwhisperer.blogspot.com.au/2011/10/greywater-new-technology-for-ancient.html[7]http://www.urbiotica.com/producto/u-dump-m2m/[8]http://www.plataformaarquitectura.cl/cl/02-72263/en-detalle-techos-verdes[9]https://en.wikipedia.org/wiki/North_Sea_flood_of_1953[10]Lee,T.M.etal.(2015)Predictorsofpublicclimatechangeawarenessandriskperceptionaroundtheworld,NatureClimateChange,doi:10.1038/nclimate2728.[11]http://www.bassala.com/[12]TheeffectivenessofafloodprotectioncomputergamefordisastereducationTsaietal.VisualizationinEngineering(2015)3:9[13]Tsai,MH,Wen,MC,Chang,YL,Kang,SC(2014).“Game-BasedEducationforDisasterPrevention.”AI&Society.doi:10.1007/s00146-014-0562-7.[14]http://www.health.nsw.gov.au/environment/domesticwastewater/Documents/greywater-reuse-policy.pdf[15]http://www.urbanisten.nl/wp/wp-content/uploads/paisea_024.pdf[16]http://www.hydroblob.com/en/