a spatial & socio-economic profile of higher …...a spatial & socio-economic profile of...
TRANSCRIPT

❑
A Spatial & Socio-Economic Profile of Higher Education Institutions in Ireland
Using Census Small Area Deprivation Index Scores derived from Student Home Address Data, Academic Year 2017/18
All analysis in this profile is of the Irish student population in higher education in Ireland,
based on domicile, and only includes HEA funded higher education institutions, excluding
Trinity College Dublin.
October 2019
For more information please contact Victor Pigott, Senior Statistics Manager, Statistics Unit, Higher Education Authority at [email protected]

2
Table of Contents National Plan for Equity of Access to Higher Education Policy Context .......................... 3
Introduction and Methodology ................................................................................ 7
National Overview ................................................................................................ 8
Maps: Total Enrolments 2017/18 and Distance to College Analysis ............................13
Profile Legend .....................................................................................................15
Athlone Institute of Technology (AIT) .....................................................................16
Cork Institute of Technology (CIT) .........................................................................17
Dublin City University (DCU) .................................................................................18
Dublin Institute of Technology (DIT) ......................................................................19
Dun Laoghaire Institute of Art, Design and Technology (IADT) ..................................20
Dundalk Institute of Technology (DKIT) ..................................................................21
Galway-Mayo Institute of Technology (GMIT) ..........................................................22
Institute of Technology Blanchardstown (ITB) .........................................................23
Institute of Technology Carlow (ITC) ......................................................................24
Institute of Technology Sligo (ITS) ........................................................................25
Institute of Technology Tallaght (ITTa) ...................................................................26
Institute of Technology Tralee (ITTr) ......................................................................27
Letterkenny Institute of Technology (LYIT) .............................................................28
Limerick Institute of Technology (LIT) ....................................................................29
Mary Immaculate College (Mary I) .........................................................................30
Maynooth University (MU) ....................................................................................31
National College of Art and Design (NCAD) .............................................................32
National University of Ireland Galway (NUIG) ..........................................................33
Royal College of Surgeons (RCSI) ..........................................................................34
St. Angela’s College of Home Economics (St. Angela’s) ............................................35
University College Cork (UCC) ...............................................................................36
University College Dublin (UCD) ............................................................................37
University of Limerick (UL) ...................................................................................38
Waterford Institute of Technology (WIT) ................................................................39
Focus on Medicine Field of Study ...........................................................................40
Deprivation Index Scores in Graduate Outcomes Analysis .........................................42
CSO Electoral Division Level Income Data and Other Small Area Data ........................46
Appendix A: HEI Student Numbers, Coverage and Deprivation Ratios ........................49
Appendix B: Deprivation Index Scores by Student Cohort & Age ...............................50
Appendix C: Distribution Comparison v Population & by Sector/Level .........................51
Appendix D: Direct Comparison of HEI Index Score Distributions ...............................52
Appendix E: HEI Composition by County (%) and Mobility Analysis ............................53

3
National Plan for Equity of Access to Higher Education Policy Context
Background
Goal 3 of the National Plan for Equity of Access to Higher Education 2015-2019 is to “gather
accurate data and evidence on access and participation and to base policy on what that data
tells us”. Specifically, the National Access Plan identified the need to develop an overall data
strategy for equity of access; to review current and new data to see how this may be
developed to identify geographic areas with high levels of disadvantage and to analyse rates
of participation in higher education from those areas.
Since 2007 the HEA has used the Equal Access Survey (EAS) to collect equal access data
on the socio-economic, ethnic/cultural and disability background of incoming students. The
socio-economic elements of the EAS are based on the socio-economic group categories used
in the Census. Throughout the National Access Plan’s consultation phase, the limitations of
the current data in relation to students from target socio-economic groups was raised
including the need to move away from a survey-based approach for measuring disadvantage
to one that made use of recent technological advances in data collection to develop a more
refined and targeted understanding of socio-economic disadvantage. In addition, it was felt
that changing perceptions and definitions of socio-economic groups presented challenges in
interpreting data relating to these issues.
The socio-economic groups currently identified as target groups in the National Access Plan
are:
• Non-manual worker group
• Semi/unskilled manual worker group
Arising from the stated goal in the National Access Plan, the HEA subsequently
commissioned Trutz Haase to examine and report on a data plan for equity of access to
higher education with an emphasis on the development of a new approach to socio-economic
group data. Key stakeholders were involved in this process. The report was completed in
late 2017 and published in 2018 and sets out a new framework for evidence based-policy
making and target setting for equity of access.
A further important development relevant to the above-mentioned goal in the National
Access Plan is the Review of the Allocation Model for Funding Higher Education Institutions

4
published in January 2018. Among the metrics currently underpinning the block grant
allocations to HEIs from the State are those relating to student numbers from the equity of
access target groups, including socio-economic groups. These metrics are included in the
block grant in recognition of the traditionally higher cost associated with the provision of
supports and services to students from equity of access target groups. As part of its
recommendations, the review of the funding model recommended that the “use of the Equal
Access Survey as the basis for access allocations on the basis of target socio-economic
groups should be reviewed by the HEA, with consideration given to how a wider base of
metrics can be developed and drive access allocations over time.”
Therefore, the recommendation made in the funding model review supports the stated goal
of the National Access Plan in relation to the development of a data plan for equity of access
to higher education.
Data Plan for Equity of Access to Higher Education
The main approach underpinning the Trutz Haase report was that the data plan for equity
of access to higher education be based on identifying and geocoding students entering and
studying in higher education institutions and estimating the socio-economic position of these
students by identifying the Census small area based on home address. As the report states,
“this way of identifying socio-economic position – using an aggregate-level indicator as
proxy – provides an accurate and effective measure of social background” and helps
overcome the challenges presented by a survey-based approach e.g. low response rate,
understanding of questions by respondents as well as the principle of determining socio-
economic position based on parent’s occupation. The report also noted that the use of
aggregate small area data is widely used in other fields such as health and is also consistent
with the approach adopted by the Department of Education and Skills in identifying schools
for inclusion in the DEIS programme.
Progress to date
Since the publication of the Trutz Haase report, the HEA has taken several steps in
implementing its recommendations.
For the 2017/18 academic year the HEA’s Student Record System (SRS) was enhanced by
the collection of name and address data for all enrolments and graduates in all but one
higher education institution who did not return address data. This address information was
subsequently geocoded. Using this information, the HEA has been able to analyse the socio-

5
economic profile of Irish higher education students on an individual institutional level and,
as presented in this report, develop deprivation index scores and profiles for each institution.
Next steps
The information contained in this report represents a step forward in meeting Goal 3 of the
National Plan for Equity of Access to Higher Education. Although it covers just one academic
year, the data is a rich and valuable source of information for higher education institutions
and policymakers. This data offers both opportunity and potential to develop a better and
more refined understanding of the socio-economic make-up of higher education student
population and to further develop policy relating to access to higher education, funding,
social inclusion and other relevant public policy interventions.
There are two immediate implications arising from this revised set of data. The first relates
to the setting of targets for participation in higher education among students from
disadvantaged socio-economic backgrounds. Following the publication of a Progress Review
in December 2018, the National Plan for Equity of Access to Higher Education has been
extended to 2021. The development of deprivation index scores means that the next
National Access Plan, consultation for which will start in 2020, will likely include not only
revised targets for participation among students from disadvantaged socio-economic
backgrounds but also a recategorisation and change in definition of these target groups.
Secondly, the development of deprivation index scores will allow the HEA to explore how
these scores can be used to inform access metrics in block grant allocations to higher
education institutions as a replacement to the Equal Access Survey-based approach. This is
in line with the recommendation in the Review of the Allocation Model for Funding Higher
Education Institutions.
In relation to both the setting of revised targets for participation in higher education among
students from disadvantaged socio-economic backgrounds and the revised socio-economic
data to inform the access metrics used in core grant allocations, it is important to note that
just one year’s worth of data is currently available. Data for additional academic years after
2017/18 will be required to fully understand trends and the performance of institutions in
improving access.
In relation to the setting of targets, the consultation process for the next National Access
Plan will be key to identifying the views of stakeholders in relation to the development of
revised targets or redefined target groups.
6
In relation to funding, any change arising from the introduction of revised metrics will need
to be gradually phased in over a period and take into consideration measures to moderate
against significant fluctuations in funding levels. Additional years of data will also be
required before a new model can be implemented. This gradual and moderated approach
is consistent with previous approaches taken to significant changes in the HEA’s funding
model.
The HEA will continue to work closely with the Department of Education and Skills and higher
education institutions in the implementation of the Data Plan for Equity of Access to Higher
Education and use the information contained in this report to better understand the
composition and diversity of higher education students in Ireland as well as the backgrounds
and communities from which they come.

7
Introduction and Methodology This report uses 2017/18 student address data in the HEA Student Records System to
analyse the socio-economic profile of Irish higher education students in Ireland by institute.
HP deprivation index scores based on Census small areas that students come from are used
to assign a relative measure of deprivation/affluence to students for aggregate analysis1.
HP deprivation index scores are a composite index of 10 Census measures (the age
dependency rate, population change, primary education figure, third level education figure,
professional classes figure, persons per room, lone parents figure, semi and unskilled classes
figure, male unemployment rate and female unemployment rate). These measures cover
the demographic profile, social class composition and labour market situation of each area.
For this analysis the 2016 Census relative HP scores for small areas are used. On average,
there are just under 100 households in each Census small area, with a high degree of
homogeneity. The maps presented in this report are at Census Electoral Division level rather
than at small area level as the latter is too detailed for maps of this nature (the deprivation
index scores used are all at small area level). This method of measuring disadvantage is
also used by the Department of Education and Skills in DEIS programme identification2.
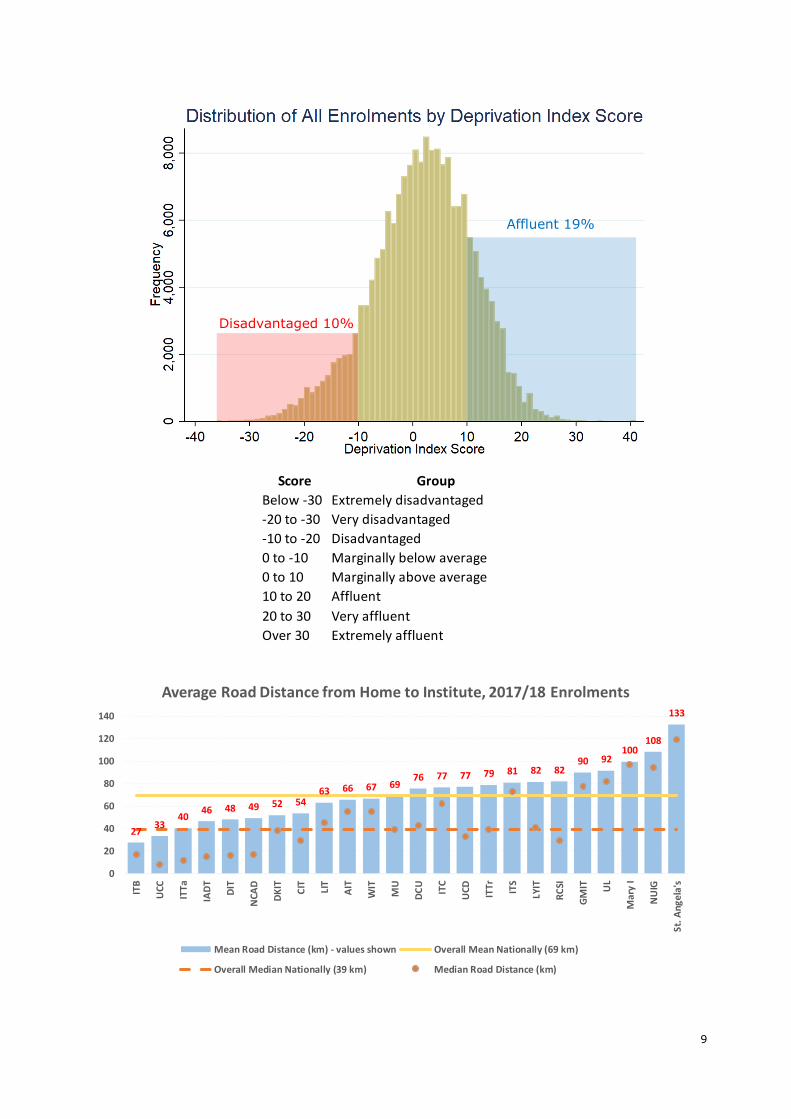
Deprivation index scores range from around -40 to +40. The most disadvantaged areas
have scores less than -30 and the most affluent areas have scores greater than +30. Less
than -10 is considered disadvantaged (used in DEIS school identification) and more than 10
is considered affluent for the analysis in this report. The scores for the whole population by
area approximately follow a normal distribution with a mean of zero and standard deviation
of 10 (therefore just less than 16% of areas have scores less than -10). The mean of the
higher education population in this analysis (total enrolments, full-time + part-time), based
on the small areas they come from, is 1.9. 10% of the higher education population in this
analysis, based on the small areas they come from, are from disadvantaged areas (<-10).
Firstly, a national overview of the data is presented, followed by a broad overview profile of
24 higher education institutes. Address data are not available for Trinity College Dublin, so
TCD is excluded from all analysis in this report, including the national analysis. The most
disadvantaged and affluent field of study cohorts in each HEI are shown, as well as a
comparison to the deprivation index scores of local areas in general. A measure of the
average road distance between students home locations and the college is also included.
Finally, an analysis of medicine and of the relationship between deprivation index scores
and graduate outcomes (earnings data) are presented to show further value of these data.
1 https://www.pobal.ie/app/uploads/2018/06/The-2016-Pobal-HP-Deprivation-Index-Introduction-07.pdf; Haase,
T. & Pratschke, J. (2018) The Pobal HP Deprivation Index for Small Areas in the Republic of Ireland. Dublin: Pobal. 2 https://www.education.ie/en/Schools-Colleges/Services/DEIS-Delivering-Equality-of-Opportunity-in-Schools-
/DEIS-Identification-Process.pdf
8
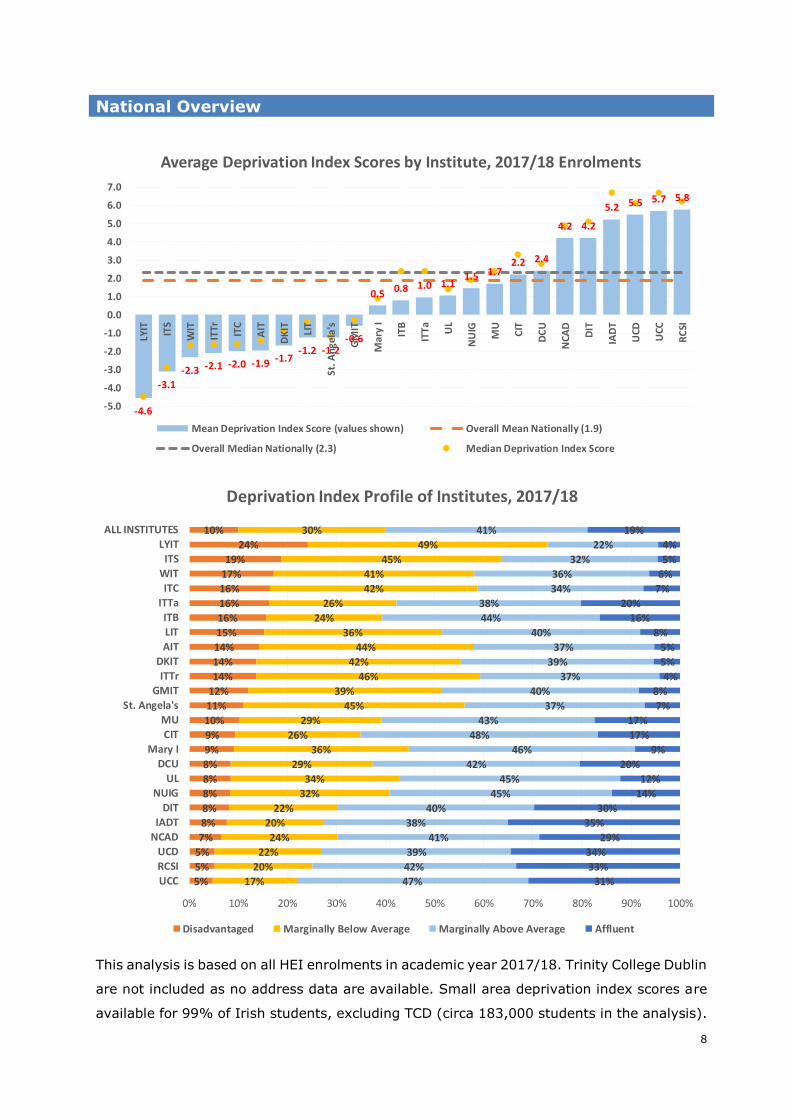
National Overview
This analysis is based on all HEI enrolments in academic year 2017/18. Trinity College Dublin
are not included as no address data are available. Small area deprivation index scores are
available for 99% of Irish students, excluding TCD (circa 183,000 students in the analysis).
-4.6
-3.1
-2.3 -2.1 -2.0 -1.9 -1.7-1.2 -1.2
-0.6
0.5 0.8 1.0 1.11.5 1.7
2.2 2.4
4.2 4.2
5.2 5.5 5.7 5.8
-5.0
-4.0
-3.0
-2.0
-1.0
0.0
1.0
2.0
3.0
4.0
5.0
6.0
7.0
LYIT ITS
WIT
ITTr ITC
AIT
DK
IT LIT
St. A
ngel
a's
GM
IT
Mar
y I
ITB
ITTa U
L
NU
IG
MU
CIT
DC
U
NCA
D
DIT
IAD
T
UCD
UCC
RC
SI
Average Deprivation Index Scores by Institute, 2017/18 Enrolments
Mean Deprivation Index Score (values shown) Overall Mean Nationally (1.9)
Overall Median Nationally (2.3) Median Deprivation Index Score
5%
5%
5%
7%
8%
8%
8%
8%
8%
9%
9%
10%
11%
12%
14%
14%
14%
15%
16%
16%
16%
17%
19%
24%
10%
17%
20%
22%
24%
20%
22%
32%
34%
29%
36%
26%
29%
45%
39%
46%
42%
44%
36%
24%
26%
42%
41%
45%
49%
30%
47%
42%
39%
41%
38%
40%
45%
45%
42%
46%
48%
43%
37%
40%
37%
39%
37%
40%
44%
38%
34%
36%
32%
22%
41%
31%
33%
34%
29%
35%
30%
14%
12%
20%
9%
17%
17%
7%
8%
4%
5%
5%
8%
16%
20%
7%
6%
5%
4%
19%
0% 10% 20% 30% 40% 50% 60% 70% 80% 90% 100%
UCC
RCSI
UCD
NCAD
IADT
DIT
NUIG
UL
DCU
Mary I
CIT
MU
St. Angela's
GMIT
ITTr
DKIT
AIT
LIT
ITB
ITTa
ITC
WIT
ITS
LYIT
ALL INSTITUTES
Deprivation Index Profile of Institutes, 2017/18
Disadvantaged Marginally Below Average Marginally Above Average Affluent
9
Disadvantaged 10%
Affluent 19%
Score Group
Below -30 Extremely disadvantaged
-20 to -30 Very disadvantaged
-10 to -20 Disadvantaged
0 to -10 Marginally below average
0 to 10 Marginally above average
10 to 20 Affluent
20 to 30 Very affluent
Over 30 Extremely affluent
2733
4046 48 49 52 54
63 66 67 6976 77 77 79 81 82 82
90 92100
108
133
0
20
40
60
80
100
120
140
ITB
UC
C
ITTa
IAD
T
DIT
NC
AD
DK
IT
CIT LIT
AIT
WIT
MU
DC
U
ITC
UC
D
ITTr ITS
LYIT
RC
SI
GM
IT UL
Mar
y I
NU
IG
St.
An
ge
la's
Average Road Distance from Home to Institute, 2017/18 Enrolments
Mean Road Distance (km) - values shown Overall Mean Nationally (69 km)
Overall Median Nationally (39 km) Median Road Distance (km)

10
Detailed ISCED Field of Study: Top 15 Most Affluent and Disadvantaged CohortsMean Deprivation
Index Score
(0311) Economics 7.1
(0322) Library, information and archival studies 6.7
(0912) Medicine 6.5
(0540) Mathematics and statistics n.e.c. 6.2
(0223) Philosophy and ethics 5.7
(0412) Finance, banking and insurance 4.9
(0312) Political sciences and civics 4.5
(0710) Engineering and engineering trades n.e.c. 3.9
(0731) Architecture and town planning 3.9
(0231) Language acquisition 3.8
(0416) Wholesale and retail sales 3.8
(0711) Chemical engineering and processes 3.8
(0542) Statistics 3.7
(1010) Personal services n.e.c. 3.6
(0313) Psychology 3.5
……………………………………………………………………………………………………………………………… …………………………
(0520) Environment n.e.c. 0.0
(0722) Materials (glass, paper, plastic and wood) 0.0
(0821) Forestry -0.3
(0788) Interdisciplinary programmes( engineering, manufacturing and construction) -0.6
(0923) Social work and counselling -0.8
(0819) Agriculture not further defined or elsewhere classified -0.9
(0888) Interdisciplinary programmes (agriculture, forestry, fisheries and veterinary) -1.0
(1014) Sports -1.6
(0612) Database and network design and administration -1.7
(0922) Child care and youth services -1.8
(1032) Protection of persons and property -1.8
(0712) Environmental protection technology -2.0
(0920) Welfare not further defined or elsewhere classified -2.2
(1031) Military and defence -2.6
(0415) Secretarial and office work -4.5
0.31.7
3.3
1.9
0.0
0.5
1.0
1.5
2.0
2.5
3.0
3.5
4.0
Institutes ofTechnology
Colleges Universities Overall NationalScore
Average Deprivation Index Scores by Institute Type
Mean Deprivation Index Score (values shown)
Median Deprivation Index Score

11
1.7
2.4
0.0
0.5
1.0
1.5
2.0
2.5
3.0
Full-time Part-time
Average Deprivation Index Scores by Mode
Mean Deprivation Index Score (values shown)
Median Deprivation Index Score
1.82.0
0.0
0.5
1.0
1.5
2.0
2.5
Female Male
Average Deprivation Index Scores by Gender
Mean Deprivation Index Score (values shown)
Median Deprivation Index Score
-2.1-0.9 -0.8
0.72.0 2.1 2.1 2.5 2.6
3.23.8 4.0
4.65.3
-3.0
-2.0
-1.0
0.0
1.0
2.0
3.0
4.0
5.0
6.0
Foun
dati
on a
nd A
cces
s
Ord
inar
y D
egre
es
Hig
her
Cer
tific
ates
Cer
tifi
cate
s
Und
ergr
adua
te D
iplo
mas
Res
earc
h M
aste
rs
Ho
nour
s D
egre
es
Hig
her
Dip
lom
as
Un
de
rgra
du
ate
Occ
asio
nal
s
Po
stgr
adu
ate
Occ
asi
on
als
Tau
ght
Mas
ters
Post
grad
uate
Dip
lom
as
PhD
Po
stgr
adu
ate
Ce
rtif
ica
tes
Average Deprivation Index Scores by Programme Type
Mean Deprivation Index Score (values shown) Median Deprivation Index Score
Undergraduate Overall Mean: 1.5
Postgraduate Overall Mean: 3.8

12
-5.7-4.7
-3.3-3.2-3.2
-2.9-2.7-2.7
-2.0-1.7
-1.4-1.3-1.0
-0.6-0.1
0.00.8
1.01.11.2
2.42.5
2.64.2
4.56.1
-6.0 -4.0 -2.0 0.0 2.0 4.0 6.0
DonegalLongfordWexford
CavanOffalyMayo
MonaghanLeitrimCarlow
RoscommonLouthLaois
TipperaryWestmeath
WaterfordSligo
KerryKilkenny
ClareLimerickWicklow
MeathGalway
CorkKildareDublin
Mean Deprivation Index Scores by Home County
-14.1
-8.0
-4.6
-3.8
-3.1
-2.5
0.6
2.2
4.4
4.5
5.1
6.0
6.7
6.7
7.6
9.2
10.3
10.4
12.3
12.9
13.4
13.5
15.5
-15.0 -10.0 -5.0 0.0 5.0 10.0 15.0
Dublin 10
Dublin 17
Dublin 22
Dublin 24
Dublin 11
Dublin 12
Dublin 5
Dublin 20
Dublin 13
Dublin 7
Dublin 15
Dublin 1
Dublin 9
Dublin 8
Dublin County
Dublin 16
Dublin 3
Dublin 6W
Dublin 14
Dublin 18
Dublin 4
Dublin 2
Dublin 6
Mean Deprivation Index Scores by Dublin Postcode

13
Maps: Total Enrolments 2017/18 and Distance to College Analysis
The national map of higher education enrolments above largely reflects a population map of
Ireland, with highly populated areas accounting for higher proportions of higher education
enrolments. However, the more detailed maps of city areas show that there are pockets of
deprived inner-city areas with relatively few higher education enrolments. For instance,
areas of north Cork City around Blackpool (Fair Hill B ED deprivation index score = -22.3,
Fair Hill A ED score = -15.6 & Blackpool A ED = -13.0) and areas such as St. Mary’s Park
(John’s A ED score = -31.9) and O’Malley Park (Galvone B ED score = -28.1) in Limerick
City have relatively few higher education enrolments compared to other areas in the
respective cities. Note: Trinity College Dublin enrolments are not included in this analysis.
Dublin City
Cork City
Galway City Limerick City

14
Map: Distance Travelled
from Home Address to
College (in kilometres)
Students from
• Mayo
• Donegal
• Leitrim
• Cavan
• Monaghan
• Sligo
• Roscommon
• Longford
• Wexford
travel more than 100km on
average to go to college
Map: Proportion
Travelling More Than 45
Kilometres (eligible for
non-adjacent SUSI rate)
Over 80% of students from
• Cavan
• Mayo
• Wexford
• Longford
• Roscommon
• Monaghan
• Leitrim
• Laois
• Offaly
travel more than 45km to
go to college

15
Profile Legend
Mean Score -1.9
Median Score -1.4
Electoral Division maps (1 Ireland, 1
local area) for each HEI show total
enrolments in 2017/18, where ED
enrolments >1, map legend included.
Colours on maps as per the legend
show concentration of enrolments,
not deprivation scores. Small areas
not shown - too detailed. Note that
the colours used for each HEI differ
based on the scale/size of that HEI
and are not comparable across HEIs.
Deciles are used in all instances to
divide EDs with more than 1
enrolment into 10 equal groups.
The average distance from AIT
students home addresses to the
college is 66km, the average travel
time from home addresses to the
college is 53 minutes.
Enrolments based on Small Area Data:
% Disadvantaged: 14%
% Affluent: 5%
Distribution of small area deprivation
index scores for all students in the
HEI, with mean and median shown.
Note that the y axis scale and the 0
position on the x axis change for
each HEI.
Top (most affluent) and bottom (most
disadvantaged) 5 detailed fields of study in
the HEI based on small area deprivation
scores (average of all students in those
fields). Only fields >=10 students in each
HEI are shown.
Comparison of mean HEI score to
local authority scores overall in
the vicinity. Local area scores are
population weighted aggregates
of small area scores in that larger
area.
% Disadvantaged: % <-10 score
% Affluent: % >10 score
Mean/median road distance from
home address in km (and minutes)
to college for all enrolments - not
term address.

16
Athlone Institute of Technology (AIT)
-1.9 -2.1
-4.6
0.4
-5.0
-4.0
-3.0
-2.0
-1.0
0.0
1.0
Athlone IT Westmeath LA Offaly LA Galway County LA
Comparison to Catchment Area Local Authority Scores
Mean -1.9
Median -1.4
The Electoral Division maps
above show that AIT enrolments
primarily come from the midlands
area, concentrated around
Athlone, Roscommon, Tullamore,
Longford and east Galway.
The mean distance from AIT students
home addresses to the college is 66km
(55km median), the mean travel time
from home addresses to the college is
53 minutes.
Enrolments based on Small Area Data:
% Disadvantaged: 14%
% Affluent: 5%
ISCED Field of Study Score
(0921) Care of the elderly and of disabled adults 2.7
(0910) Health n.e.c. 1.8
(0841) Veterinary 0.2
(0722) Materials (glass, paper, plastic and wood) 0.1
(0230) Languages n.e.c. -0.1
……………………………………………………………………………………… …………….
(1013) Hotel, restaurants and catering -3.9
(0531) Chemistry -4.1
(1015) Travel, tourism and leisure -4.1
(0011) Basic programmes and qualifications -4.8
(0215) Music and performing arts -6.1

17
Cork Institute of Technology (CIT)
Mean 2.2
Median 3.3
The ED maps above show that CIT
enrolments primarily come from
Cork and to a lesser extent Kerry.
The map of Cork City shows that
pockets of the inner-city have fewer
enrolments than surrounding areas.
The mean distance from CIT students
home addresses to the college is 54km
(median 29km), the mean travel time
from home addresses to the college is
48 minutes.
Enrolments based on Small Area Data:
% Disadvantaged: 9%
% Affluent: 17%
2.2
-0.4
3.4
-1.3-2.0
-1.0
0.0
1.0
2.0
3.0
4.0
Cork IT Cork City LA Cork County LA Kerry LA
Comparison to Catchment Area Local Authority Scores
ISCED Field of Study Score
(0416) Wholesale and retail sales 8.0
(0310) Social and behavioural sciences n.e.c. 7.5
(0110) Education n.e.c. 7.1
(0540) Mathematics and statistics n.e.c. 5.4
(0610) Information and Communication Technologies n.e.c. 4.7
……………………………………………………………………………………… …………….
(0819) Agriculture n.e.c. 1.1
(1015) Travel, tourism and leisure 1.0
(0716) Motor vehicles, ships and aircraft 0.3
(1013) Hotel, restaurants and catering 0.1
(0713) Electricity and energy -0.2

18
Dublin City University (DCU)
Mean 2.4
Median 2.8
The ED maps above show that the
DCU catchment area extends far
beyond Dublin and surrounding
Counties. Within Dublin, as expected,
north Dublin has higher enrolment
numbers than south Dublin.
The mean distance from DCU students
home addresses to the college is 76km
(median 43km), the mean travel time
from home addresses to the college is
58 minutes.
Enrolments based on Small Area Data:
% Disadvantaged: 8%
% Affluent: 20%
2.4
3.1
5.3
1.8
0.0
1.0
2.0
3.0
4.0
5.0
6.0
DCU Dublin City LA Dublin Fingal LA Meath LA
Comparison to Catchment Area Local Authority Scores
ISCED Field of Study Score
(0223) Philosophy and ethics 8.5
(0412) Finance, banking and insurance 7.2
(0221) Religion and theology 6.3
(0413) Management and administration 5.5
(0011) Basic programmes and qualifications 5.5
……………………………………………………………………………………… …………….
(0913) Nursing and midwifery 1.3
(0321) Journalism and reporting 0.9
(0210) Arts n.e.c. 0.7
(0114) Teacher training with subject specialization -0.9
(0920) Welfare n.e.c. -2.4
19
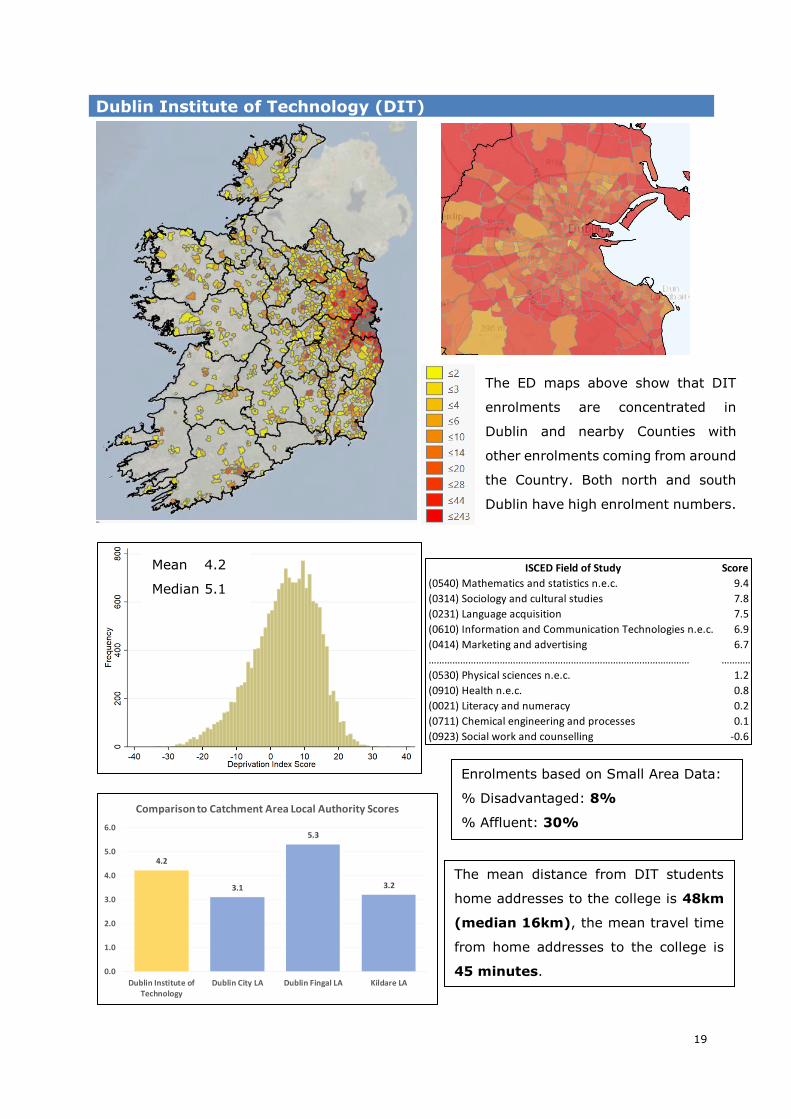
Dublin Institute of Technology (DIT)
Mean 4.2
Median 5.1
The ED maps above show that DIT
enrolments are concentrated in
Dublin and nearby Counties with
other enrolments coming from around
the Country. Both north and south
Dublin have high enrolment numbers.
The mean distance from DIT students
home addresses to the college is 48km
(median 16km), the mean travel time
from home addresses to the college is
45 minutes.
Enrolments based on Small Area Data:
% Disadvantaged: 8%
% Affluent: 30%
4.2
3.1
5.3
3.2
0.0
1.0
2.0
3.0
4.0
5.0
6.0
Dublin Institute ofTechnology
Dublin City LA Dublin Fingal LA Kildare LA
Comparison to Catchment Area Local Authority Scores
ISCED Field of Study Score
(0540) Mathematics and statistics n.e.c. 9.4
(0314) Sociology and cultural studies 7.8
(0231) Language acquisition 7.5
(0610) Information and Communication Technologies n.e.c. 6.9
(0414) Marketing and advertising 6.7
……………………………………………………………………………………… …………….
(0530) Physical sciences n.e.c. 1.2
(0910) Health n.e.c. 0.8
(0021) Literacy and numeracy 0.2
(0711) Chemical engineering and processes 0.1
(0923) Social work and counselling -0.6

20
Dun Laoghaire Institute of Art, Design and Technology (IADT)
Mean 5.2
Median 6.7
The ED maps above show that
IADT enrolments are
concentrated around south
Dublin and north Wicklow, with
relatively few enrolments from
around the Country.
The mean distance from IADT students
home addresses to the college is 46km
(median 15km), the mean travel time
from home addresses to the college is
40 minutes.
Enrolments based on Small Area Data:
% Disadvantaged: 8%
% Affluent: 35%
ISCED Field of Study Score
(0413) Management and administration 7.8
(0541) Mathematics 7.7
(0111) Education science 7.4
(0611) Computer use 6.6
(0410) Business and administration n.e.c. 6.5
……………………………………………………………………………………… …………….
(0610) Information and Communication Technologies n.e.c. 5.4
(0211) Audio-visual techniques and media production 5.1
(0220) Humanities (except languages) n.e.c. 4.5
(0212) Fashion, interior and industrial design 4.3
(0213) Fine arts 2.9
5.2
10.0
3.1
1.4
0.0
2.0
4.0
6.0
8.0
10.0
12.0
Comparison to Catchment Area Local Authority Scores
21
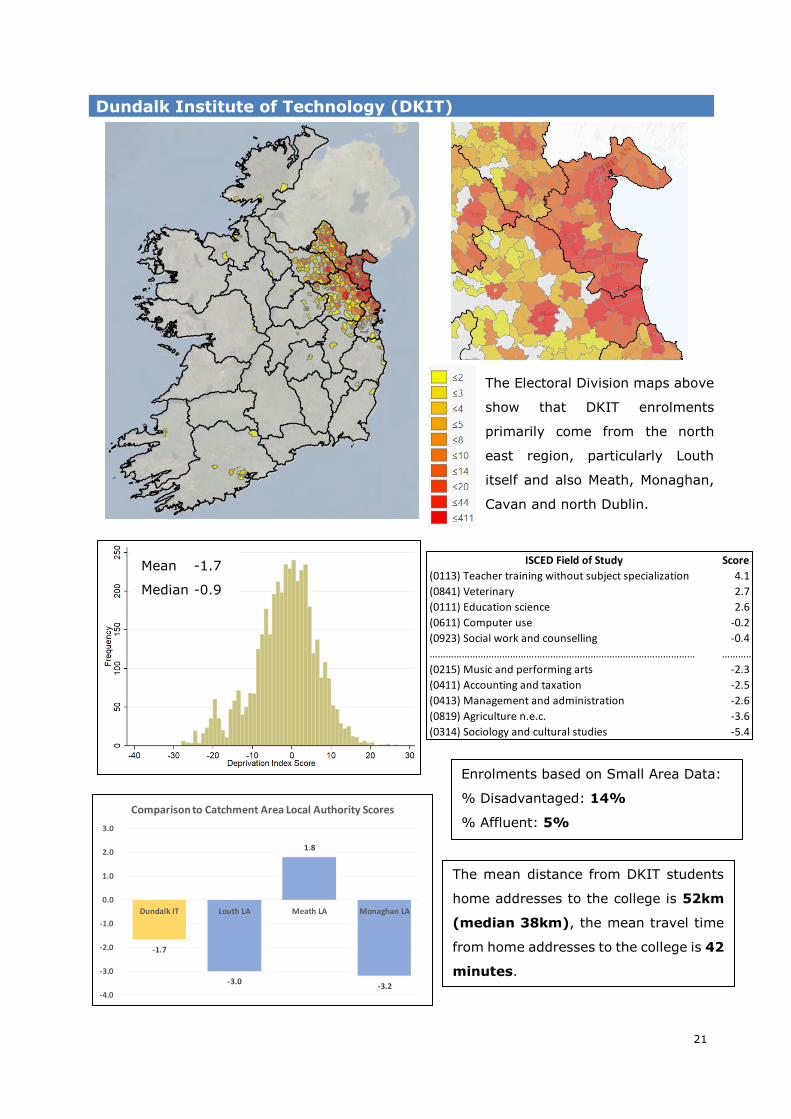
Dundalk Institute of Technology (DKIT)
Mean -1.7
Median -0.9
The Electoral Division maps above
show that DKIT enrolments
primarily come from the north
east region, particularly Louth
itself and also Meath, Monaghan,
Cavan and north Dublin.
The mean distance from DKIT students
home addresses to the college is 52km
(median 38km), the mean travel time
from home addresses to the college is 42
minutes.
Enrolments based on Small Area Data:
% Disadvantaged: 14%
% Affluent: 5%
ISCED Field of Study Score
(0113) Teacher training without subject specialization 4.1
(0841) Veterinary 2.7
(0111) Education science 2.6
(0611) Computer use -0.2
(0923) Social work and counselling -0.4
……………………………………………………………………………………… …………….
(0215) Music and performing arts -2.3
(0411) Accounting and taxation -2.5
(0413) Management and administration -2.6
(0819) Agriculture n.e.c. -3.6
(0314) Sociology and cultural studies -5.4
-1.7
-3.0
1.8
-3.2-4.0
-3.0
-2.0
-1.0
0.0
1.0
2.0
3.0
Dundalk IT Louth LA Meath LA Monaghan LA
Comparison to Catchment Area Local Authority Scores

22
Galway-Mayo Institute of Technology (GMIT)
Mean -0.6
Median -0.3
The ED maps above show that GMIT
enrolments are concentrated in Galway
and Mayo, particularly Galway City,
north Galway and Castlebar. Other
enrolments are dispersed around the
west, midlands and Donegal.
The mean distance from GMIT students
home addresses to the college is 90km
(median 78km), the mean travel time
from home addresses to the college is
72 minutes.
Enrolments based on Small Area Data:
% Disadvantaged: 12%
% Affluent: 8%
ISCED Field of Study Score
(0488) Interdisciplinary business, administration & law 2.3
(0413) Management and administration 1.9
(0720) Manufacturing and processing n.e.c. 1.9
(0211) Audio-visual techniques and media production 1.0
(0611) Computer use 0.6
……………………………………………………………………………………… …………….
(0610) Information and Communication Technologies n.e.c. -2.6
(0923) Social work and counselling -2.8
(0913) Nursing and midwifery -3.2
(0416) Wholesale and retail sales -4.1
(0232) Literature and linguistics -4.4
-0.6
4.9
0.4
-3.8-5.0
-4.0
-3.0
-2.0
-1.0
0.0
1.0
2.0
3.0
4.0
5.0
6.0
Galway-Mayo IT Galway City LA Galway County LA Mayo LA
Comparison to Catchment Area Local Authority Scores
23
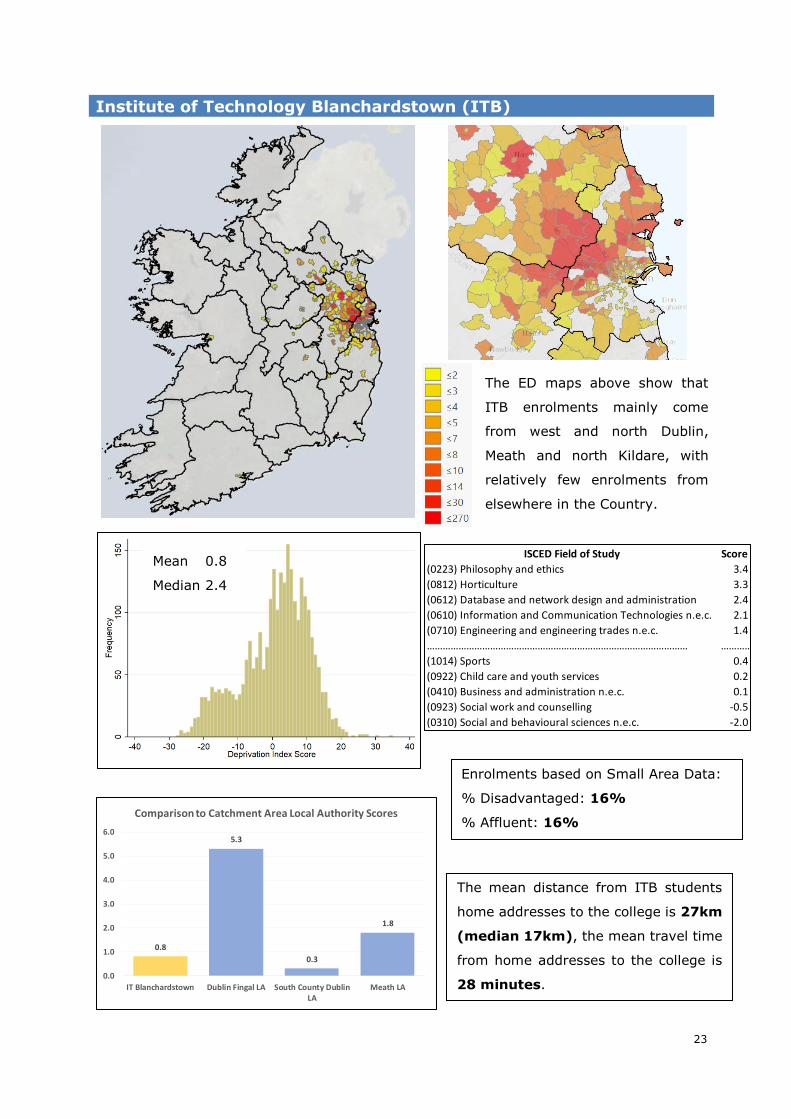
Institute of Technology Blanchardstown (ITB)
Mean 0.8
Median 2.4
The ED maps above show that
ITB enrolments mainly come
from west and north Dublin,
Meath and north Kildare, with
relatively few enrolments from
elsewhere in the Country.
The mean distance from ITB students
home addresses to the college is 27km
(median 17km), the mean travel time
from home addresses to the college is
28 minutes.
Enrolments based on Small Area Data:
% Disadvantaged: 16%
% Affluent: 16%
ISCED Field of Study Score
(0223) Philosophy and ethics 3.4
(0812) Horticulture 3.3
(0612) Database and network design and administration 2.4
(0610) Information and Communication Technologies n.e.c. 2.1
(0710) Engineering and engineering trades n.e.c. 1.4
……………………………………………………………………………………… …………….
(1014) Sports 0.4
(0922) Child care and youth services 0.2
(0410) Business and administration n.e.c. 0.1
(0923) Social work and counselling -0.5
(0310) Social and behavioural sciences n.e.c. -2.0
0.8
5.3
0.3
1.8
0.0
1.0
2.0
3.0
4.0
5.0
6.0
IT Blanchardstown Dublin Fingal LA South County DublinLA
Meath LA
Comparison to Catchment Area Local Authority Scores

24
Institute of Technology Carlow (ITC)
Mean -2.0
Median -1.6
The ED maps above show that ITC
enrolments are widespread in the
south east, in Counties Carlow,
Wexford, Kildare, Kilkenny, Laois and
Wicklow, with pockets of enrolments
from elsewhere in the Country.
The mean distance from ITC students
home addresses to the college is 77km
(median 62km), the mean travel time
from home addresses to the college is
65 minutes.
Enrolments based on Small Area Data:
% Disadvantaged: 16%
% Affluent: 7%
ISCED Field of Study Score
(0416) Wholesale and retail sales 2.2
(0716) Motor vehicles, ships and aircraft 1.8
(0313) Psychology 1.2
(0710) Engineering and engineering trades n.e.c. -0.1
(1032) Protection of persons and property -0.2
……………………………………………………………………………………… …………….
(0610) Information and Communication Technologies n.e.c. -4.1
(0314) Sociology and cultural studies -5.1
(0210) Arts n.e.c. -5.9
(0221) Religion and theology -6.0
(0220) Humanities (except languages) n.e.c. -6.2
-2.0
-3.7
-4.8
3.2
-6.0
-5.0
-4.0
-3.0
-2.0
-1.0
0.0
1.0
2.0
3.0
4.0
IT Carlow Carlow LA Wexford LA Kildare LA
Comparison to Catchment Area Local Authority Scores

25
Institute of Technology Sligo (ITS)
Mean -3.1
Median -2.9
The ED maps above show that
ITS enrolments are concentrated
in Sligo, Mayo and Donegal and
the north west in general, with
very few enrolments from the
south of the Country.
The mean distance from ITS students
home addresses to the college is 81km
(median 73km), the mean travel time
from home addresses to the college is
71 minutes.
Enrolments based on Small Area Data:
% Disadvantaged: 19%
% Affluent: 5%
ISCED Field of Study Score
(0220) Humanities (except languages) n.e.c. 0.1
(0613) Software and applications development/analysis -0.3
(0222) History and archaeology -0.6
(0232) Literature and linguistics -1.0
(0212) Fashion, interior and industrial design -1.7
……………………………………………………………………………………… …………….
(0721) Food processing -4.1
(0922) Child care and youth services -4.2
(0712) Environmental protection technology -5.0
(0310) Social and behavioural sciences n.e.c. -5.5
(0415) Secretarial and office work -5.7
-3.1
-1.6
-3.8
-6.4-7.0
-6.0
-5.0
-4.0
-3.0
-2.0
-1.0
0.0
IT Sligo Sligo LA Mayo LA Donegal LA
Comparison to Catchment Area Local Authority Scores

26
Institute of Technology Tallaght (ITTa)
Mean 1.0
Median 2.4
The ED maps above show that
ITTa enrolments are
concentrated as expected around
south and west Dublin and
Kildare. There are also
enrolments from the Cork area.
The mean distance from ITTa students
home addresses to the college is 40km
(median 12km), the mean travel time
from home addresses to the college is
34 minutes.
Enrolments based on Small Area Data:
% Disadvantaged: 16%
% Affluent: 20%
ISCED Field of Study Score
(0613) Software and applications development/analysis 8.8
(0417) Work skills 6.3
(0011) Basic programmes and qualifications 5.6
(0410) Business and administration n.e.c. 5.2
(0721) Food processing 4.1
……………………………………………………………………………………… …………….
(0411) Accounting and taxation -1.1
(0512) Biochemistry -1.2
(0612) Database and network design and administration -1.6
(1015) Travel, tourism and leisure -1.7
(0531) Chemistry -2.1
1.0
0.3
3.1 3.2
0.0
0.5
1.0
1.5
2.0
2.5
3.0
3.5
IT Tallaght South County DublinLA
Dublin City LA Kildare LA
Comparison to Catchment Area Local Authority Scores
27
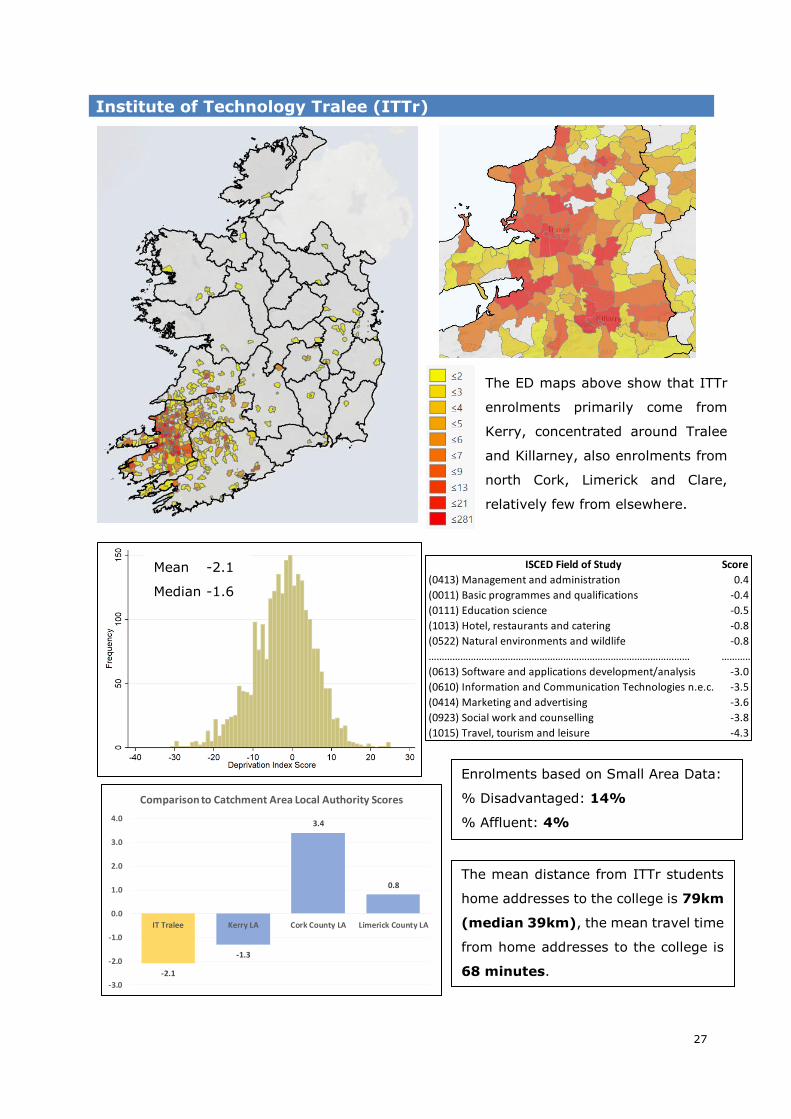
Institute of Technology Tralee (ITTr)
Mean -2.1
Median -1.6
The ED maps above show that ITTr
enrolments primarily come from
Kerry, concentrated around Tralee
and Killarney, also enrolments from
north Cork, Limerick and Clare,
relatively few from elsewhere.
The mean distance from ITTr students
home addresses to the college is 79km
(median 39km), the mean travel time
from home addresses to the college is
68 minutes.
Enrolments based on Small Area Data:
% Disadvantaged: 14%
% Affluent: 4%
ISCED Field of Study Score
(0413) Management and administration 0.4
(0011) Basic programmes and qualifications -0.4
(0111) Education science -0.5
(1013) Hotel, restaurants and catering -0.8
(0522) Natural environments and wildlife -0.8
……………………………………………………………………………………… …………….
(0613) Software and applications development/analysis -3.0
(0610) Information and Communication Technologies n.e.c. -3.5
(0414) Marketing and advertising -3.6
(0923) Social work and counselling -3.8
(1015) Travel, tourism and leisure -4.3
-2.1
-1.3
3.4
0.8
-3.0
-2.0
-1.0
0.0
1.0
2.0
3.0
4.0
IT Tralee Kerry LA Cork County LA Limerick County LA
Comparison to Catchment Area Local Authority Scores

28
Letterkenny Institute of Technology (LYIT)
Mean -4.6
Median -4.5
The ED maps above show that
LYIT enrolments primarily come
from County Donegal itself,
particularly around Letterkenny
and environs. Other enrolments
from Sligo, Cavan and Monaghan.
The mean distance from LYIT students
home addresses to the college is 82km
(41km median), the mean travel time
from home addresses to the college is
70 minutes.
Enrolments based on Small Area Data:
% Disadvantaged: 24%
% Affluent: 4%
ISCED Field of Study Score
(0110) Education n.e.c. -0.2
(0413) Management and administration -1.6
(0512) Biochemistry -2.2
(0410) Business and administration n.e.c. -2.7
(0612) Database and network design and administration -2.8
……………………………………………………………………………………… …………….
(0521) Environmental sciences -6.5
(0011) Basic programmes and qualifications -7.1
(1013) Hotel, restaurants and catering -7.4
(0730) Architecture and construction n.e.c. -7.8
(0731) Architecture and town planning -8.6
-4.6
-6.4
-1.6
-4.0
-7.0
-6.0
-5.0
-4.0
-3.0
-2.0
-1.0
0.0
Letterkenny IT Donegal LA Sligo LA Border Region
Comparison to Catchment Area Local Authority Scores

29
Limerick Institute of Technology (LIT)
Mean -1.2
Median -0.4
The ED maps above show that LIT
enrolments are concentrated in
Limerick, Clare and Tipperary,
particularly around Limerick City,
although some inner-city areas
have lower levels of enrolment.
The mean distance from LIT students
home addresses to the college is
63km (45km median), the mean
travel time from home addresses to
the college is 53 minutes.
Enrolments based on Small Area Data:
% Disadvantaged: 15%
% Affluent: 8%
ISCED Field of Study Score
(0214) Handicrafts 1.4
(0111) Education science 0.9
(0713) Electricity and energy 0.9
(0310) Social and behavioural sciences n.e.c. 0.8
(1022) Occupational health and safety 0.7
……………………………………………………………………………………… …………….
(0410) Business and administration n.e.c. -2.8
(0923) Social work and counselling -3.3
(0031) Personal skills and development -4.2
(0314) Sociology and cultural studies -4.4
(1013) Hotel, restaurants and catering -6.2
-1.2
-6.3
0.8
-0.2
-7.0
-6.0
-5.0
-4.0
-3.0
-2.0
-1.0
0.0
1.0
2.0
Limerick IT Limerick City LA Limerick County LA Clare LA
Comparison to Catchment Area Local Authority Scores
30
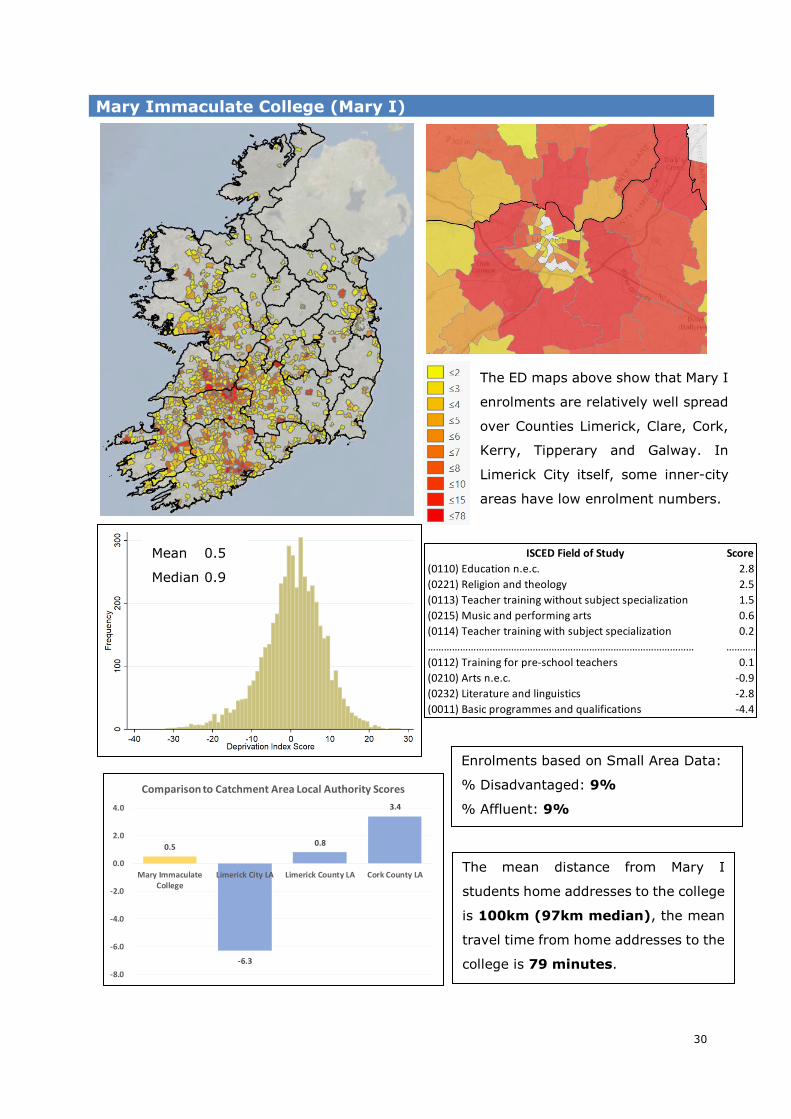
Mary Immaculate College (Mary I)
Mean 0.5
Median 0.9
The ED maps above show that Mary I
enrolments are relatively well spread
over Counties Limerick, Clare, Cork,
Kerry, Tipperary and Galway. In
Limerick City itself, some inner-city
areas have low enrolment numbers.
The mean distance from Mary I
students home addresses to the college
is 100km (97km median), the mean
travel time from home addresses to the
college is 79 minutes.
Enrolments based on Small Area Data:
% Disadvantaged: 9%
% Affluent: 9%
ISCED Field of Study Score
(0110) Education n.e.c. 2.8
(0221) Religion and theology 2.5
(0113) Teacher training without subject specialization 1.5
(0215) Music and performing arts 0.6
(0114) Teacher training with subject specialization 0.2
……………………………………………………………………………………… …………….
(0112) Training for pre-school teachers 0.1
(0210) Arts n.e.c. -0.9
(0232) Literature and linguistics -2.8
(0011) Basic programmes and qualifications -4.4
0.5
-6.3
0.8
3.4
-8.0
-6.0
-4.0
-2.0
0.0
2.0
4.0
Mary ImmaculateCollege
Limerick City LA Limerick County LA Cork County LA
Comparison to Catchment Area Local Authority Scores

31
Maynooth University (MU)
Mean 1.7
Median 2.4
The ED maps above show that MU
enrolments are concentrated in
Counties Kildare and Meath, but
enrolments overall are widely
dispersed around the east and
midlands of the Country.
The mean distance from MU students
home addresses to the college is
69km (39km median), the mean
travel time from home addresses to
the college is 58 minutes.
Enrolments based on Small Area Data:
% Disadvantaged: 10%
% Affluent: 17%
ISCED Field of Study Score
(0915) Therapy and rehabilitation 4.9
(0223) Philosophy and ethics 3.8
(0488) Interdisciplinary programmes business, admin & law 3.7
(0212) Fashion, interior and industrial design 3.7
(0413) Management and administration 3.7
……………………………………………………………………………………… …………….
(0311) Economics 0.2
(0923) Social work and counselling 0.2
(0312) Political sciences and civics 0.0
(0510) Biological and related sciences n.e.c. -1.9
(0922) Child care and youth services -5.2
1.7
3.2
5.3
1.8
0.0
1.0
2.0
3.0
4.0
5.0
6.0
MaynoothUniversity
Kildare LA Dublin Fingal LA Meath LA
Comparison to Catchment Area Local Authority Scores

32
National College of Art and Design (NCAD)
Mean 4.2
Median 4.9
The Electoral Division maps above
show that NCAD enrolments
primarily come from the greater
Dublin region, with relatively few
enrolments from elsewhere in the
Country.
The mean distance from NCAD
students home addresses to the college
is 49km (17km median), the mean
travel time from home addresses to the
college is 44 minutes.
Enrolments based on Small Area Data:
% Disadvantaged: 7%
% Affluent: 29%
ISCED Field of Study Score
(0613) Software and applications development/analysis 7.9
(0210) Arts n.e.c. 5.3
(0211) Audio-visual techniques and media production 4.9
(0212) Fashion, interior and industrial design 4.6
(0213) Fine arts 3.9
(0114) Teacher training with subject specialization 1.2
4.23.1
5.3
10.0
0.0
2.0
4.0
6.0
8.0
10.0
12.0
Comparison to Catchment Area Local Authority Scores
33
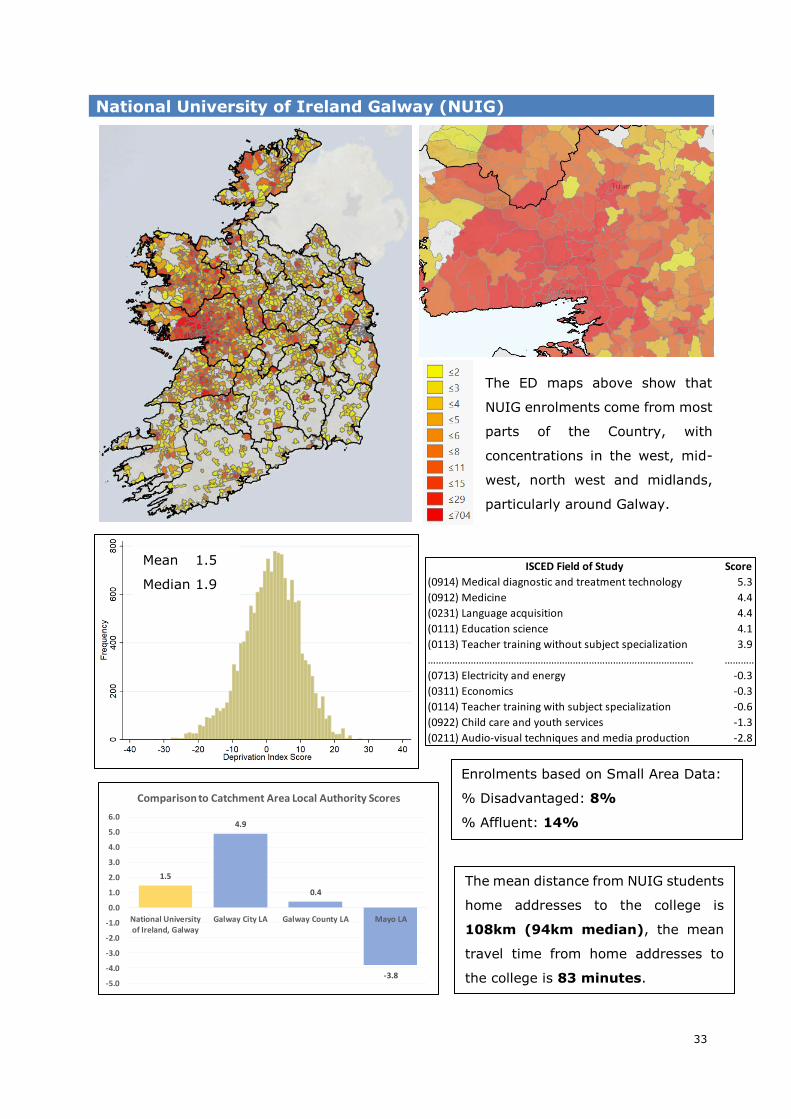
National University of Ireland Galway (NUIG)
Mean 1.5
Median 1.9
The ED maps above show that
NUIG enrolments come from most
parts of the Country, with
concentrations in the west, mid-
west, north west and midlands,
particularly around Galway.
The mean distance from NUIG students
home addresses to the college is
108km (94km median), the mean
travel time from home addresses to
the college is 83 minutes.
Enrolments based on Small Area Data:
% Disadvantaged: 8%
% Affluent: 14%
ISCED Field of Study Score
(0914) Medical diagnostic and treatment technology 5.3
(0912) Medicine 4.4
(0231) Language acquisition 4.4
(0111) Education science 4.1
(0113) Teacher training without subject specialization 3.9
……………………………………………………………………………………… …………….
(0713) Electricity and energy -0.3
(0311) Economics -0.3
(0114) Teacher training with subject specialization -0.6
(0922) Child care and youth services -1.3
(0211) Audio-visual techniques and media production -2.8
1.5
4.9
0.4
-3.8-5.0
-4.0
-3.0
-2.0
-1.0
0.0
1.0
2.0
3.0
4.0
5.0
6.0
National Universityof Ireland, Galway
Galway City LA Galway County LA Mayo LA
Comparison to Catchment Area Local Authority Scores
34
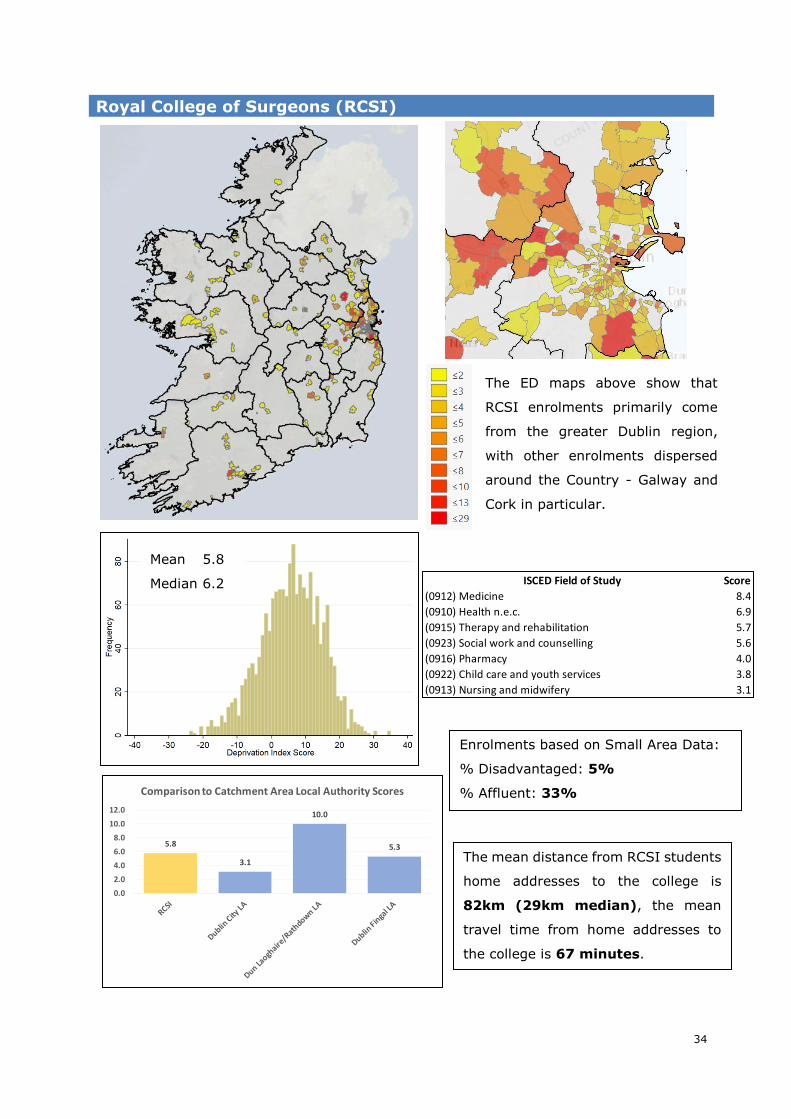
Royal College of Surgeons (RCSI)
Mean 5.8
Median 6.2
The ED maps above show that
RCSI enrolments primarily come
from the greater Dublin region,
with other enrolments dispersed
around the Country - Galway and
Cork in particular.
The mean distance from RCSI students
home addresses to the college is
82km (29km median), the mean
travel time from home addresses to
the college is 67 minutes.
Enrolments based on Small Area Data:
% Disadvantaged: 5%
% Affluent: 33%
5.8
3.1
10.0
5.3
0.0
2.0
4.0
6.0
8.0
10.0
12.0
Comparison to Catchment Area Local Authority Scores
ISCED Field of Study Score
(0912) Medicine 8.4
(0910) Health n.e.c. 6.9
(0915) Therapy and rehabilitation 5.7
(0923) Social work and counselling 5.6
(0916) Pharmacy 4.0
(0922) Child care and youth services 3.8
(0913) Nursing and midwifery 3.1

35
St. Angela’s College of Home Economics (St. Angela’s)
Mean -1.2
Median -1.2
The Electoral Division maps above
show that St. Angela’s enrolments
primarily come from the north west
region, particularly Sligo, Donegal
and Mayo, with other enrolments
dispersed around the Country.
The mean distance from St. Angela’s
College students home addresses to the
college is 133km (119km median), the
mean travel time from home addresses
to the college is 112 minutes.
Enrolments based on Small Area Data:
% Disadvantaged: 11%
% Affluent: 7%
ISCED Field of Study Score
(0031) Personal skills and development 3.7
(0413) Management and administration 0.6
(0421) Law 0.6
(0222) History and archaeology 0.2
(0221) Religion and theology -0.4
……………………………………………………………………………………… …………….
(0111) Education science -1.6
(0910) Health n.e.c. -1.7
(0210) Arts n.e.c. -1.8
(0913) Nursing and midwifery -1.8
(0721) Food processing -2.0
-1.2-1.6
-3.8
-6.4-7.0
-6.0
-5.0
-4.0
-3.0
-2.0
-1.0
0.0
St. Angela's College Sligo LA Mayo LA Donegal LA
Comparison to Catchment Area Local Authority Scores
36
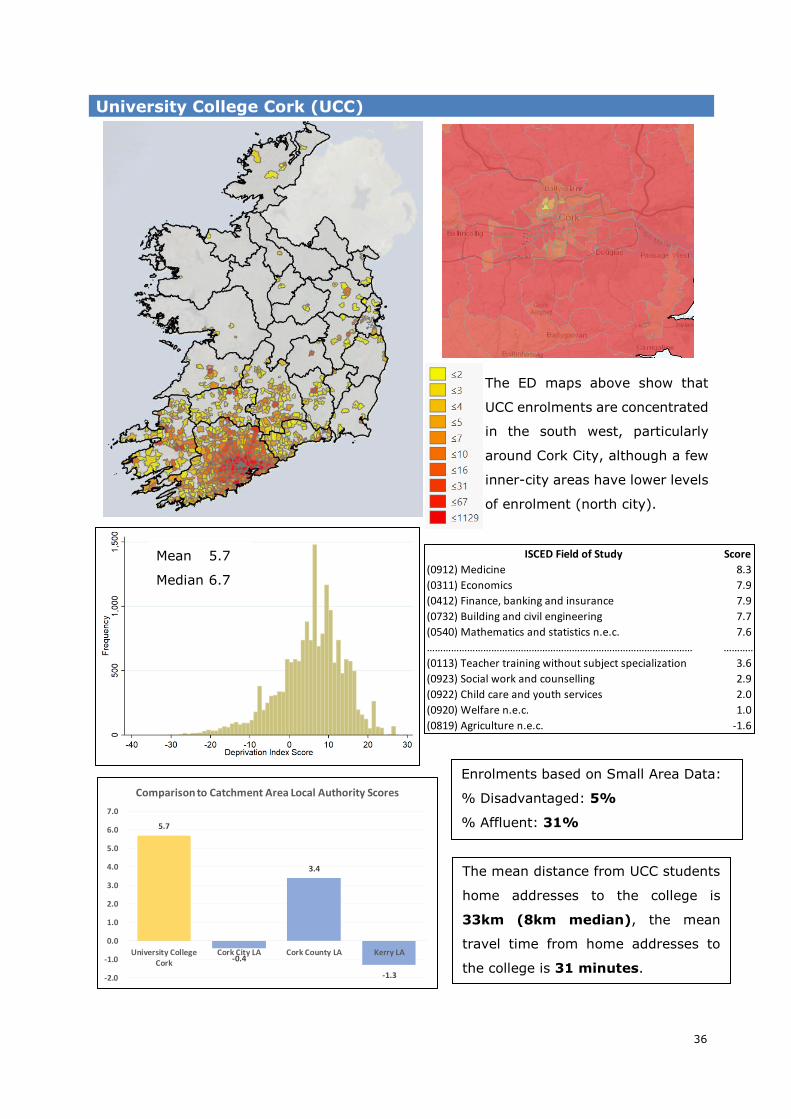
University College Cork (UCC)
Mean 5.7
Median 6.7
The ED maps above show that
UCC enrolments are concentrated
in the south west, particularly
around Cork City, although a few
inner-city areas have lower levels
of enrolment (north city).
The mean distance from UCC students
home addresses to the college is
33km (8km median), the mean
travel time from home addresses to
the college is 31 minutes.
Enrolments based on Small Area Data:
% Disadvantaged: 5%
% Affluent: 31%
ISCED Field of Study Score
(0912) Medicine 8.3
(0311) Economics 7.9
(0412) Finance, banking and insurance 7.9
(0732) Building and civil engineering 7.7
(0540) Mathematics and statistics n.e.c. 7.6
……………………………………………………………………………………… …………….
(0113) Teacher training without subject specialization 3.6
(0923) Social work and counselling 2.9
(0922) Child care and youth services 2.0
(0920) Welfare n.e.c. 1.0
(0819) Agriculture n.e.c. -1.6
5.7
-0.4
3.4
-1.3-2.0
-1.0
0.0
1.0
2.0
3.0
4.0
5.0
6.0
7.0
University CollegeCork
Cork City LA Cork County LA Kerry LA
Comparison to Catchment Area Local Authority Scores

37
University College Dublin (UCD)
Mean 5.5
Median 6.1
The ED maps above show that UCD
enrolments come from across the
Country but with a concentration in
south Dublin. Certain areas of north
Dublin City and south west Dublin
have relatively few enrolments.
The mean distance from UCD students
home addresses to the college is
77km (33km median), the mean
travel time from home addresses to
the college is 61 minutes.
Enrolments based on Small Area Data:
% Disadvantaged: 5%
% Affluent: 34%
ISCED Field of Study Score
(0220) Humanities (except languages) n.e.c. 10.0
(0414) Marketing and advertising 9.7
(0213) Fine arts 9.6
(0110) Education n.e.c. 9.3
(0713) Electricity and energy 8.3
……………………………………………………………………………………… …………….
(0811) Crop and livestock production 1.9
(0521) Environmental sciences 1.8
(0114) Teacher training with subject specialization 1.3
(0113) Teacher training without subject specialization 1.3
(0888) Interdisciplinary agri, forestry, fisheries and vet. 1.1
5.5
10.0
3.1
1.4
0.0
2.0
4.0
6.0
8.0
10.0
12.0
Comparison to Catchment Area Local Authority Scores

38
University of Limerick (UL)
Mean 1.1
Median 1.4
The ED maps above show that UL
enrolments are dispersed around
the Country but with a
concentration in the mid-west,
particularly in Limerick and Clare. In
Limerick City, there are some areas
with relatively few enrolments.
The mean distance from UL students
home addresses to the college is
92km (82km median), the mean
travel time from home addresses to
the college is 76 minutes.
Enrolments based on Small Area Data:
% Disadvantaged: 8%
% Affluent: 12%
ISCED Field of Study Score
(0113) Teacher training without subject specialization 7.7
(0711) Chemical engineering and processes 5.2
(0414) Marketing and advertising 4.4
(0912) Medicine 4.1
(0111) Education science 3.3
……………………………………………………………………………………… …………….
(0222) History and archaeology -0.7
(0923) Social work and counselling -0.8
(0521) Environmental sciences -0.9
(0215) Music and performing arts -1.1
(0011) Basic programmes and qualifications -3.8
1.1
-6.3
0.8
-0.2
-7.0
-6.0
-5.0
-4.0
-3.0
-2.0
-1.0
0.0
1.0
2.0
University ofLimerick
Limerick City LA Limerick County LA Clare LA
Comparison to Catchment Area Local Authority Scores

39
Waterford Institute of Technology (WIT)
Mean -2.3
Median -1.7
The ED maps above show that WIT
enrolments primarily come from the
south east region – Waterford,
Wexford, Kilkenny, Tipperary and
Carlow. A few areas in Waterford
City have relatively few enrolments.
The mean distance from WIT students
home addresses to the college is
67km (55km median), the mean
travel time from home addresses to
the college is 58 minutes.
Enrolments based on Small Area Data:
% Disadvantaged: 17%
% Affluent: 6%
-2.3
-4.8
-0.6
-4.8
-6.0
-5.0
-4.0
-3.0
-2.0
-1.0
0.0
Waterford IT Waterford City LA Waterford CountyLA
Wexford LA
Comparison to Catchment Area Local Authority Scores
ISCED Field of Study Score
(0221) Religion and theology 5.5
(0812) Horticulture 1.4
(0220) Humanities (except languages) n.e.c. 0.3
(0412) Finance, banking and insurance 0.3
(0111) Education science -0.2
……………………………………………………………………………………… …………….
(0210) Arts n.e.c. -3.9
(0722) Materials (glass, paper, plastic and wood) -4.3
(0922) Child care and youth services -4.4
(0213) Fine arts -6.3
(0416) Wholesale and retail sales -6.9

40
Focus on Medicine Field of Study
Economics, library & information studies and medicine are highlighted as the three most
affluent student cohorts on average (mean deprivation index scores of 7.1, 6.7 and 6.5
respectively). However, the first two are based on a relatively small number of courses (the
economics score is driven by economics courses in UCD; many economics related courses
in the Country are not classified in the economics ISCED field of study as they are
interdisciplinary courses). The medicine field of study is the only one of the top 15 most
affluent student cohorts with over 3,000 Irish enrolments with deprivation index scores
available and is actually the 13th largest detailed field of study in 2017/18, based on Irish
enrolments with deprivation index scores (98 fields in this analysis in total). 3.5% of
medicine enrolments come from disadvantaged areas (this figure is 10% for all fields),
36.3% of medicine enrolments come from affluent areas (this figure is 18.9% for all fields).
3.5%
7.2%
10.0%
60.2%
70.3%
71.1%
36.3%
22.5%
18.9%
0% 10% 20% 30% 40% 50% 60% 70% 80% 90% 100%
Medicine
All University Honours Degree Enrolments
All Enrolments
Deprivation Index Profile of Medicine Students v Others
All Disadvantaged All Average All Affluent
Dublin City
Cork City Limerick City
The ED maps show that medicine enrolments from Dublin
come from south Dublin more than north Dublin City,
although Clontarf, Howth, Castleknock and Malahide have
relatively high enrolment numbers. D4 and D6 combined
account for 14% of medicine enrolments from Dublin but
only account for 6% of all enrolments from Dublin. Many of
the most deprived areas in inner-city Limerick and Cork
have very few/no enrolments. Only ED counts >1 shown.
41
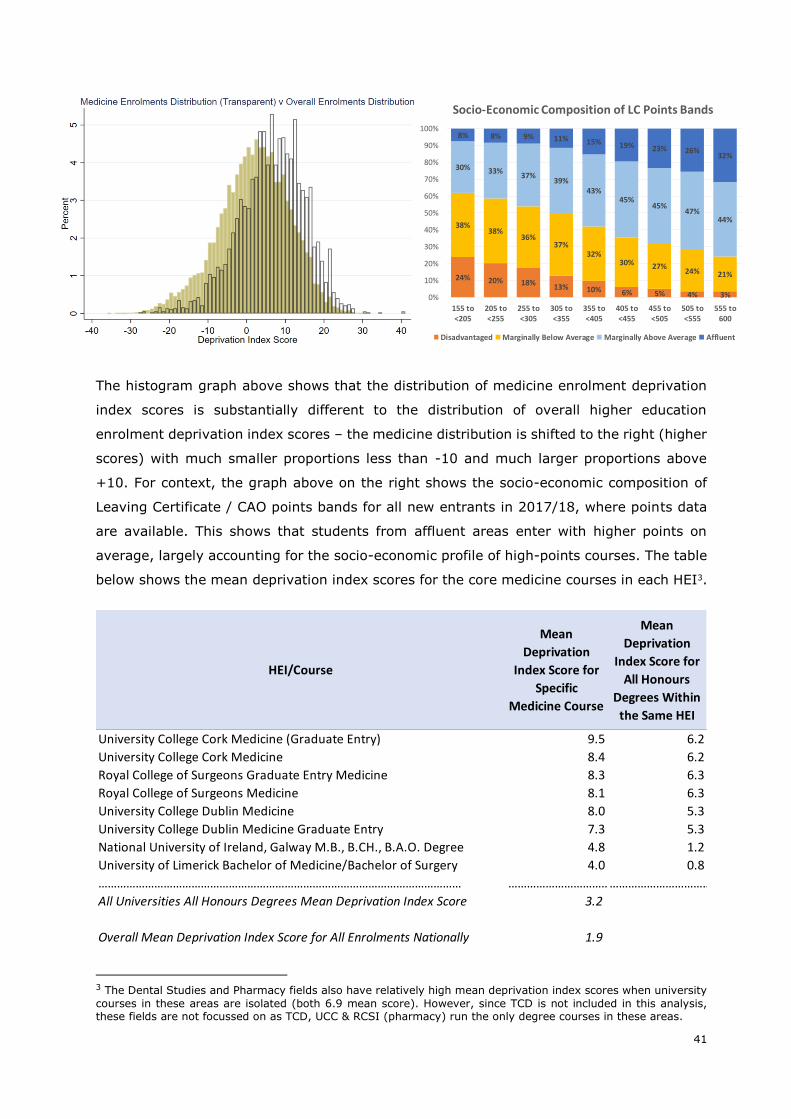
The histogram graph above shows that the distribution of medicine enrolment deprivation
index scores is substantially different to the distribution of overall higher education
enrolment deprivation index scores – the medicine distribution is shifted to the right (higher
scores) with much smaller proportions less than -10 and much larger proportions above
+10. For context, the graph above on the right shows the socio-economic composition of
Leaving Certificate / CAO points bands for all new entrants in 2017/18, where points data
are available. This shows that students from affluent areas enter with higher points on
average, largely accounting for the socio-economic profile of high-points courses. The table
below shows the mean deprivation index scores for the core medicine courses in each HEI3.
3 The Dental Studies and Pharmacy fields also have relatively high mean deprivation index scores when university
courses in these areas are isolated (both 6.9 mean score). However, since TCD is not included in this analysis, these fields are not focussed on as TCD, UCC & RCSI (pharmacy) run the only degree courses in these areas.
HEI/Course
Mean
Deprivation
Index Score for
Specific
Medicine Course
Mean
Deprivation
Index Score for
All Honours
Degrees Within
the Same HEI
University College Cork Medicine (Graduate Entry) 9.5 6.2
University College Cork Medicine 8.4 6.2
Royal College of Surgeons Graduate Entry Medicine 8.3 6.3
Royal College of Surgeons Medicine 8.1 6.3
University College Dublin Medicine 8.0 5.3
University College Dublin Medicine Graduate Entry 7.3 5.3
National University of Ireland, Galway M.B., B.CH., B.A.O. Degree 4.8 1.2
University of Limerick Bachelor of Medicine/Bachelor of Surgery 4.0 0.8
……………………………………………………………………………………………………… ………………………………………………………………………
All Universities All Honours Degrees Mean Deprivation Index Score 3.2
Overall Mean Deprivation Index Score for All Enrolments Nationally 1.9
24% 20% 18%13% 10% 6% 5% 4% 3%
38%38%
36%37%
32%30% 27%
24% 21%
30% 33%37%
39%43%
45%45%
47%44%
8% 8% 9% 11% 15% 19% 23% 26%32%
0%
10%
20%
30%
40%
50%
60%
70%
80%
90%
100%
155 to<205
205 to<255
255 to<305
305 to<355
355 to<405
405 to<455
455 to<505
505 to<555
555 to600
Socio-Economic Composition of LC Points Bands
Disadvantaged Marginally Below Average Marginally Above Average Affluent

42
Deprivation Index Scores in Graduate Outcomes Analysis
The HEA Graduate Outcomes Analysis for the class of 2017 contains an earnings regression
analysis in section 8, with full results in appendix 84. Interval regression models were used
to analyse graduate earnings for the class of 2017, nine months after they graduated.
Estimates of earnings differences by institute type, field of study, NFQ level, gender, sector
of employment, region of employment, age, final grade, contract type, occupation group
and employment type (employee, internship, self-employed) were obtained for all graduates
and younger graduates, defined as under age 30 in that analysis. Results showed that, after
controlling for the set of predictors above, university graduates earn more than institute of
technology graduates, males earn more than females, those in Dublin earn more than those
elsewhere in Ireland, education graduates earn more than graduates from other fields
initially, higher grades attract an earnings premium and earnings rise with higher levels of
qualification.
That analysis has been extended below to include deprivation index scores for each graduate
based on the Census small area they come from. Since home address is used, the analysis
is restricted to graduates aged 25 or under as home address for older graduates is less likely
to indicate their origins and this analysis is designed to show socio-economic mobility from
origins. PhDs are also excluded since there are so few in that group at that age. The same
set of predictor variables is used as the analysis described above in the graduate outcomes
report, with the addition of deprivation index score as a continuous variable in one model
variation and as a categorical variable in another model variation (affluent, marginally above
average, marginally below average and disadvantaged). Estimates of the other coefficients
are not dissimilar to the model for younger graduates in the graduate outcomes report and
are not focussed on here. The analysis below focusses on the relationship between
deprivation index scores and graduate earnings after controlling for the set of characteristics
above and also attempts to analyse socio-economic mobility of sorts using these data via a
transition analysis from deprivation index decile to earnings decile. There are 7,011
observations in the model, weighted for non-response by institute, NFQ and mode of study.
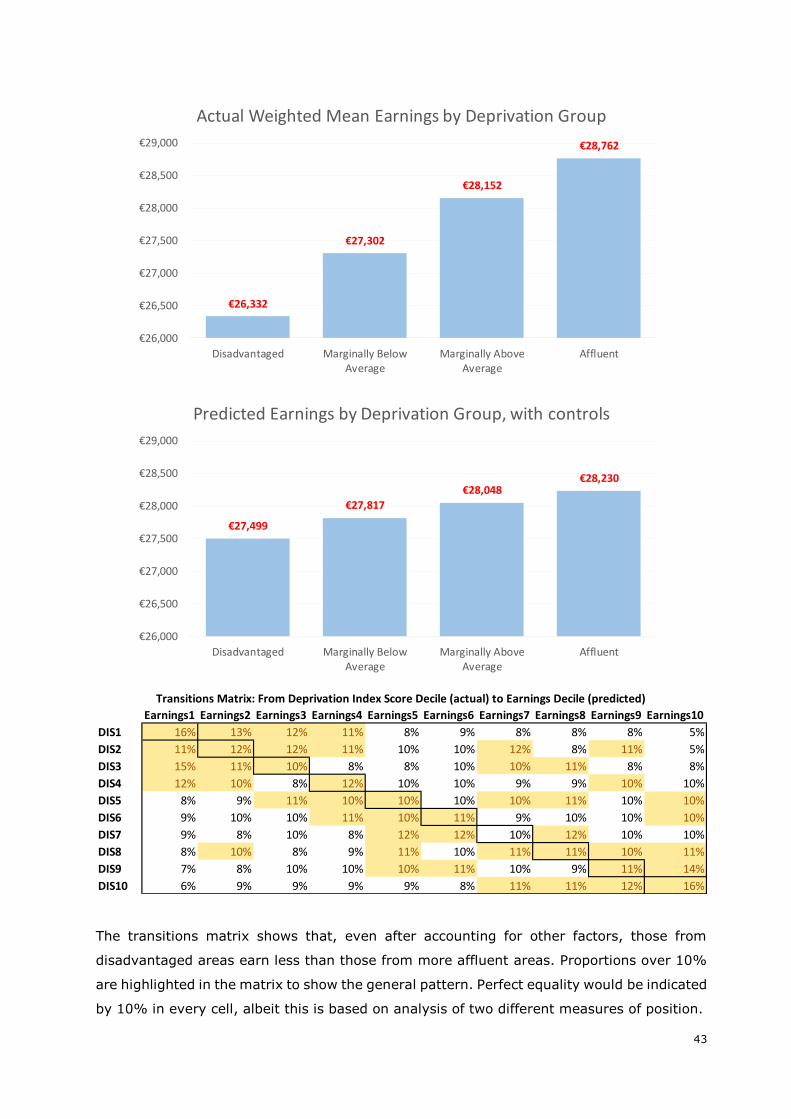
Firstly, mean earnings for graduates by deprivation index group, before controls are
introduced, are presented. Then predicted earnings after the controls are introduced in a
model are presented, followed by a transitions matrix which shows the composition of
earnings deciles by deprivation index deciles. The deprivation deciles are based on the actual
deprivation index score for each graduate, the earnings deciles are based on predicted
earnings, therefore showing levels of mobility after other factors are accounted for.
4 http://hea.ie/assets/uploads/2019/02/HEA-Graduate-Outcomes-Survey.pdf
43
The transitions matrix shows that, even after accounting for other factors, those from
disadvantaged areas earn less than those from more affluent areas. Proportions over 10%
are highlighted in the matrix to show the general pattern. Perfect equality would be indicated
by 10% in every cell, albeit this is based on analysis of two different measures of position.
€26,332
€27,302
€28,152
€28,762
€26,000
€26,500
€27,000
€27,500
€28,000
€28,500
€29,000
Disadvantaged Marginally BelowAverage
Marginally AboveAverage
Affluent
Actual Weighted Mean Earnings by Deprivation Group
€27,499
€27,817
€28,048€28,230
€26,000
€26,500
€27,000
€27,500
€28,000
€28,500
€29,000
Disadvantaged Marginally BelowAverage
Marginally AboveAverage
Affluent
Predicted Earnings by Deprivation Group, with controls
Earnings1 Earnings2 Earnings3 Earnings4 Earnings5 Earnings6 Earnings7 Earnings8 Earnings9 Earnings10
DIS1 16% 13% 12% 11% 8% 9% 8% 8% 8% 5%
DIS2 11% 12% 12% 11% 10% 10% 12% 8% 11% 5%
DIS3 15% 11% 10% 8% 8% 10% 10% 11% 8% 8%
DIS4 12% 10% 8% 12% 10% 10% 9% 9% 10% 10%
DIS5 8% 9% 11% 10% 10% 10% 10% 11% 10% 10%
DIS6 9% 10% 10% 11% 10% 11% 9% 10% 10% 10%
DIS7 9% 8% 10% 8% 12% 12% 10% 12% 10% 10%
DIS8 8% 10% 8% 9% 11% 10% 11% 11% 10% 11%
DIS9 7% 8% 10% 10% 10% 11% 10% 9% 11% 14%
DIS10 6% 9% 9% 9% 9% 8% 11% 11% 12% 16%
Transitions Matrix: From Deprivation Index Score Decile (actual) to Earnings Decile (predicted)

44
Dependent variable: Salary bands (interval regression)Standard
Error
Small area deprivation index score 24 * 10
Gender
Female - (base)
Male 1,487 *** 188
ISCED Broad Field of Study
Agriculture, forestry, fisheries and veterinary 3,565 *** 844
Arts and humanities - (base)
Business, administration and law 2,402 *** 355
Education 7,997 *** 643
Engineering, manufacturing and construction 5,036 *** 446
Health and welfare 5,226 *** 483
Information and Communication Technologies (ICTs) 6,517 *** 474
Natural sciences, mathematics and statistics 4,991 *** 408
Services 3,227 *** 592
Social sciences, journalism and information 1,673 *** 434
Institute Type
College -650 624
Institute of Technology -1,450 *** 218
University - (base)
NACE Employment Sector
Accommodation and food service activities -3,869 *** 589
Administrative and support service activities -2,372 *** 613
Agriculture, forestry and fishing 1,067 852
Construction -367 646
Education -4,809 *** 619
Financial, insurance and real estate activities -2,459 *** 345
Human health and social work activities 51 505
Industry - (base)
Information and communication -279 465
Professional, scientific and technical activities -305 374
Public administration and defence -1,022 741
Transportation and storage -238 722
Unknown -2,117 *** 435
Wholesale and retail trade -3,610 *** 547
Employment Region
Border -4,360 *** 604
Dublin - (base)
Mid-East -1,733 *** 322
Mid-West -1,553 *** 312
Midlands -1,849 *** 449
Other Countries 1,073 581
South-East -2,154 *** 421
South-West -951 *** 271
Unknown -1,645 1,027
Unknown Ireland -1,379 898
West -2,184 *** 345
NFQ Level
Level 6 -2,754 * 1,217
Level 7 -431 540
Level 8 - (base)
Level 9 771 ** 262
Age 845 *** 97
1st/Upper 2nd or Equivalent Grade 641 ** 197
Coefficient

45
The full model results above, with deprivation index score included as a continuous variable,
indicate that for every point increase in the deprivation index score, earnings increase by
€24, importantly – after all other factors are used to determine variation in earnings, i.e.
socio-economic origins have a bearing on earnings, regardless of the level, specialism or
grade achieved in higher education or employment characteristics. However, the coefficient
is €78 without any controls, indicating that higher education outcomes do assist in improving
earnings equality across the deprivation spectrum (account for circa 70% of the difference).
Dependent variable: Salary bands (interval regression)Standard
Error
Employment Type
An Employee - (base)
On a graduate internship/placement -684 * 318
Self-employed/freelance/starting up own business 1,161 1,654
Unknown -2,723 3,803
Contract Type
Fixed term contract lasting 12 months or longer -1,165 *** 209
Fixed term contract lasting less than 12 months -2,049 *** 325
Permanent or open-ended contract - (base)
Temporary, casual or employed through an agency -2,587 *** 364
Unknown -162 1,105
Occupation Group
Administrative and secretarial occupations -1,446 *** 349
Associate professional and technical occupations -833 ** 259
Caring, leisure and other service occupations -4,727 *** 547
Elementary occupations -7,359 *** 837
Managers, directors and senior officials 2,612 *** 746
Postdoctoral researchers -4,683 *** 793
Process, plant and machine operatives -1,062 698
Professional occupations - (base)
Sales and customer service occupations -3,753 *** 368
Skilled trades occupations -1,557 * 776
Unknown -2,119 ** 621
***p<.001 **p<.01 *p<.05 7,011 observations
Coefficient

46
CSO Electoral Division Level Income Data and Other Small Area Data
The CSO released household income data at Electoral Division level in June 2019, based on
linking Revenue and Social Protection data with Census records. These data are used here
in further graduate outcomes analysis and for a profile of institution level enrolments by
home ED income levels. All income referred to here is median gross household income.
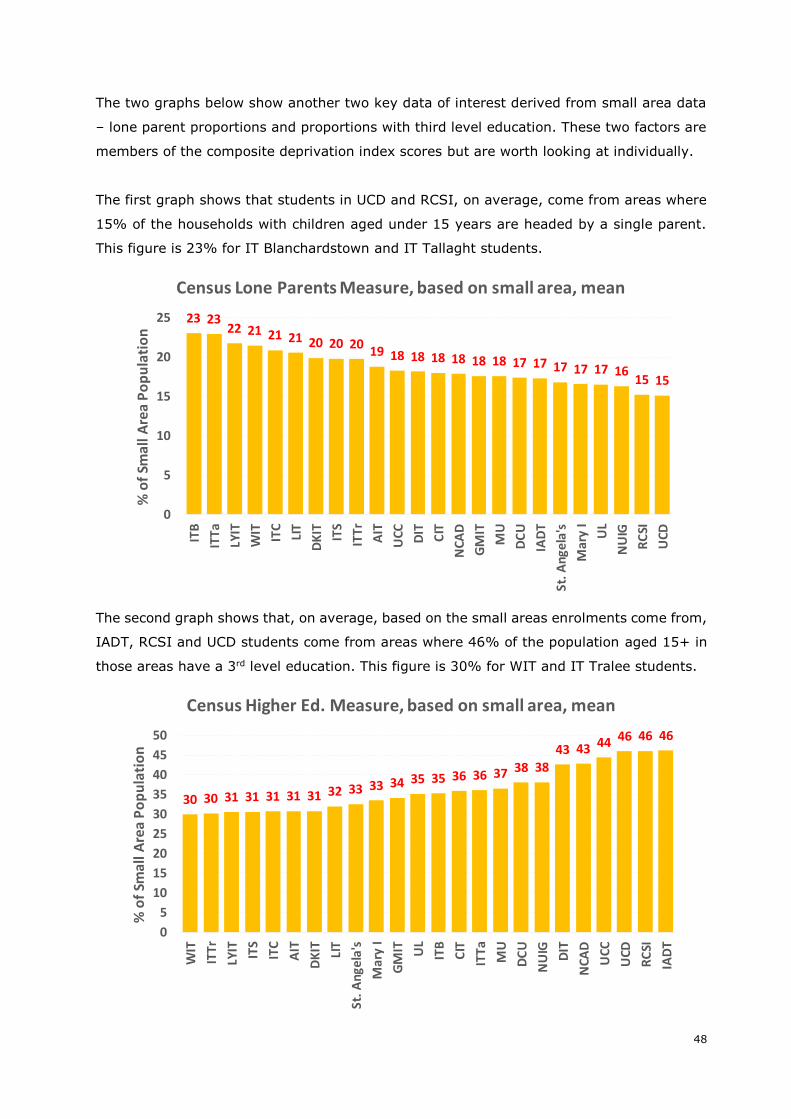
The graphs below are based on an analysis of younger graduates earnings from graduate
outcomes survey data, linked to CSO ED level income data. Model results indicate that home
origin ED household income is a determinant of earnings, but the magnitude effect is small
and differences only become meaningful when comparing the top and bottom levels. The
lowest income deciles (1st and 2nd) tend to stay in the lower income bands and the higher
income deciles (9th and 10th) are represented more in the higher income bands. However,
there is considerably more mobility in the middle deciles (3rd to 8th) – e.g. the 3rd and 5th.
0%
10%
20%
30%
40%
50%
60%
70%
80%
90%
100%
0-15 15-20 20-25 25-30 30-35 35-40 40-45 45-50 50-60 60-70 70-80 80+
Annual Salary in €000's (actual, not predicted)
Income Transition: From Household Income Decile to Earnings Post-Graduation
1st Decile 2nd Decile 3rd Decile 4th Decile 5th Decile
6th Decile 7th Decile 8th Decile 9th Decile 10th Decile

47
The graph below profiles institution level enrolments by home ED average household income
and the maps compare median household incomes in Dublin to medicine enrolments from
Dublin. As expected, there is a strong positive correlation between household income and
deprivation index scores. Also evident, medicine enrolments tend to come from the highest
income areas.
36,4
67
39,0
49
40,8
62
42,2
13
43,2
69
43,3
61
43,4
19
43,9
43
44,8
39
45,1
49
46,0
55
46,1
82
46,3
64
46,9
86
48,7
15
51,2
72
51,5
12
52,1
29
53,5
28
54,0
05
54,8
67
54,9
67
56,0
09
56,8
84
-6.0
-4.0
-2.0
0.0
2.0
4.0
6.0
8.0
0
10,000
20,000
30,000
40,000
50,000
60,000
70,000
LYIT ITS
ITTr
St. A
ngel
a's
GM
IT
WIT
AIT LIT
ITC
DK
IT
NU
IG UL
Mar
y I
UCC CIT
DC
U
MU
ITTa ITB
NC
AD
DIT
RC
SI
UC
D
IAD
T
De
priva
tion
Ind
ex Sco
re
Euro
s
Median Household Income of Enrolments based on Home Electoral Division
Median Household Income, € (ED)
National Median Household Income of HE Population (€48,747)
Median Household Income of Admin. County Area, € (for context)
Average Deprivation Index Score (SA)
Median Household
Income in Dublin by
Electoral Division
Medicine Enrolments
From Dublin (n>1 only
shown)
48
The two graphs below show another two key data of interest derived from small area data
– lone parent proportions and proportions with third level education. These two factors are
members of the composite deprivation index scores but are worth looking at individually.
The first graph shows that students in UCD and RCSI, on average, come from areas where
15% of the households with children aged under 15 years are headed by a single parent.
This figure is 23% for IT Blanchardstown and IT Tallaght students.
The second graph shows that, on average, based on the small areas enrolments come from,
IADT, RCSI and UCD students come from areas where 46% of the population aged 15+ in
those areas have a 3rd level education. This figure is 30% for WIT and IT Tralee students.
23 2322 21 21 21 20 20 20
19 18 18 18 18 18 18 17 17 17 17 17 1615 15
0
5
10
15
20
25
ITB
ITTa
LYIT
WIT
ITC
LIT
DK
IT ITS
ITT
r
AIT
UCC DIT
CIT
NC
AD
GM
IT
MU
DC
U
IAD
T
St. A
ngel
a's
Mar
y I
UL
NU
IG
RC
SI
UCD
% o
f Sm
all A
rea
Po
pu
lati
on
Census Lone Parents Measure, based on small area, mean
30 30 31 31 31 31 31 32 33 33 34 35 35 36 36 37 38 38
43 43 44 46 46 46
0
5
10
15
20
25
30
35
40
45
50
WIT
ITT
r
LYIT ITS
ITC
AIT
DK
IT LIT
St.
An
ge
la's
Ma
ry I
GM
IT UL
ITB
CIT
ITT
a
MU
DC
U
NU
IG
DIT
NCA
D
UCC
UCD
RC
SI
IAD
T
% o
f Sm
all A
rea
Po
pu
lati
on
Census Higher Ed. Measure, based on small area, mean

49
Appendix A: HEI Student Numbers, Coverage and Deprivation Ratios
Letterkenny IT has almost 54 students from disadvantaged areas for every 10 students from
affluent areas compared to 1.5 students from disadvantaged areas for every 10 students
from affluent areas in UCD, UCC and RCSI.
The ratio in the medicine field of study is 1 student from a disadvantaged area for every 10
students from affluent areas, the lowest ratio for any detailed field of study.
Institute
Small Area
Deprivation Index
Score Available
ED Location
Available for
Mapping
Total Number of
Irish Enrolments
% SA
Coverage
% ED
Coverage
Ratio of Students from
Disadvantaged Areas
to Every 10 Students
from Affluent Areas
AIT 4,334 4,352 4,355 100% 100% 26.9
CIT 10,796 10,846 10,851 99% 100% 5.6
DCU 13,821 13,957 13,982 99% 100% 4.1
DIT 16,942 17,122 17,182 99% 100% 2.7
IADT 2,377 2,397 2,399 99% 100% 2.2
DKIT 4,149 4,177 4,179 99% 100% 25.9
GMIT 6,396 6,409 6,414 100% 100% 14.4
ITB 2,771 2,827 2,830 98% 100% 9.5
ITC 7,595 7,637 7,642 99% 100% 22.1
ITS 3,427 3,428 3,429 100% 100% 41.2
ITTa 5,022 5,087 5,098 99% 100% 8.1
ITTr 2,471 2,478 2,480 100% 100% 33.1
LYIT 3,973 3,981 3,983 100% 100% 53.9
LIT 5,849 5,871 5,871 100% 100% 18.6
Mary I 4,667 4,692 4,698 99% 100% 9.9
MU 11,346 11,438 11,468 99% 100% 5.9
NCAD 1,010 1,020 1,021 99% 100% 2.3
NUIG 14,992 15,032 15,103 99% 100% 6.0
RCSI 1,687 1,713 1,793 94% 96% 1.5
St. Angela's 1,343 1,349 1,364 98% 99% 15.5
UCC 17,354 17,472 17,480 99% 100% 1.5
UCD 21,464 21,618 21,649 99% 100% 1.5
UL 12,458 12,494 12,500 100% 100% 6.9
WIT 7,219 7,277 7,285 99% 100% 27.6
All HEIs 183,463 184,674 185,056 99% 100% 5.3
Sector
Ratio of Students from
Disadvantaged Areas
to Every 10 Students
from Affluent Areas
Colleges 5.3
Institutes of Technology 9.2
Universities 3.1
All HEIs 5.3

50
Appendix B: Deprivation Index Scores by Student Cohort & Age
HEI All Enrolments All FT UG New Entrants (1st Year FT UG) All FT All PT All UG All PG
RCSI 5.8 6.6 6.4 6.5 5.0 6.3 5.4
UCC 5.7 6.2 5.8 6.1 3.6 5.8 5.2
UCD 5.5 5.3 5.2 5.3 6.4 5.3 6.1
IADT 5.2 4.7 5.1 4.8 8.1 4.9 7.8
DIT 4.2 4.1 3.7 4.1 4.5 4.0 5.7
NCAD 4.2 3.1 2.7 3.5 8.3 4.1 4.9
DCU 2.4 2.2 2.2 2.2 3.9 2.2 3.8
CIT 2.2 1.7 1.7 1.8 3.7 2.1 3.6
MU 1.7 1.6 1.2 1.6 2.2 1.6 2.6
NUIG 1.5 1.2 1.4 1.3 2.3 1.3 2.3
UL 1.1 0.7 0.7 0.9 2.8 0.8 2.5
ITTa 1.0 -0.7 -1.1 -0.6 2.9 0.8 4.4
ITB 0.8 0.2 -0.4 0.2 3.3 0.7 3.3
Mary I 0.5 0.4 0.5 0.5 0.5 0.4 1.5
GMIT -0.6 -0.9 -1.1 -0.9 1.3 -0.7 1.7
St. Angela's -1.2 -1.4 -1.3 -1.6 -0.9 -1.7 -0.5
LIT -1.2 -1.6 -1.8 -1.6 0.5 -1.3 0.1
DKIT -1.7 -1.9 -2.3 -1.9 -0.4 -1.8 1.0
AIT -1.9 -2.2 -2.7 -2.1 -1.6 -2.1 -0.2
ITC -2.0 -2.7 -2.8 -2.2 -1.7 -2.2 -0.2
ITTr -2.1 -2.3 -2.2 -2.3 -0.2 -2.1 -1.5
WIT -2.3 -2.7 -2.8 -2.6 -0.9 -2.6 0.0
ITS -3.1 -3.2 -3.1 -3.1 -1.5 -3.1 -2.4
LYIT -4.6 -5.8 -6.2 -5.7 -1.6 -4.8 -1.4
Overall 1.9 1.6 1.2 1.7 2.4 1.5 3.8
-2.0
-1.0
0.0
1.0
2.0
3.0
4.0
5.0
6.0
17 19 21 23 25 27 29 31 33 35 37 39 41 43 45 47 49 51 53 55 57 59 61 63 65
Dep
riva
tio
n In
dex
Sco
re
Age
Mean Deprivation Index Scores by Age
Postgraduate Undergraduate
Linear (Postgraduate) Linear (Undergraduate)

51
Appendix C: Distribution Comparison v Population & by Sector/Level

52
Appendix D: Direct Comparison of HEI Index Score Distributions
• The y axis is in percentage units (% of the HEI enrolments at each index score).
• A perfect normal distribution for the HEI displayed is overlaid on each HEI distribution
(mean = the actual HEI mean, not zero).
• The red lines show the zero position in all distributions. Zero is the mean deprivation
index score for all Census small areas in the Country. The mean deprivation index
score for all students enrolled in higher education in 2017/18, based on the Census
small area they come from, is 1.9. The bottom right graph illustrates the distribution
for the overall higher education population. The standard deviation for the overall
student population is 9.2. By HEI, the largest standard deviation is 10.5 for IT
Tallaght (the widest distribution, i.e. IT Tallaght has students from across the
deprivation spectrum), the smallest standard deviation is 7.6 for St. Angela’s College
(the narrowest distribution, i.e. St. Angela’s College has a more homogenous student
population).
• HEIs with distributions tending to the right of the red line are those with more affluent
student populations in general (e.g. the RCSI) and those with distributions tending
to the left of the red line are those with more disadvantaged student populations in
general (e.g. Letterkenny IT).
-------------------------------------------------
-------
-------------------------------------------------
-------
-------------------------------------------------
-------
-------------------------------------------------
-------
-------------------------------------------------
-------

53
Appendix E: HEI Composition by County (%) and Mobility Analysis
* All figures are rounded to the nearest % (Leitrim accounts for less than 0.5% of 20 – 29
year olds, as per Census 2016 figures).
HEI Irish student body proportions over 10% are highlighted (table is read across rows).
The final two rows show a comparison between the County composition of the higher
education population overall versus the proportion of all 20 - 29 year olds in the Country by
County, as per Census 2016. Trinity College Dublin are not included in this analysis, inclusion
of TCD brings the Dublin proportion of the higher education population up by around 2
percentage points. As with elsewhere in the report, analysis is of Irish students only.
HEI Car
low
Cav
an
Cla
re
Co
rk
Do
ne
gal
Du
blin
Gal
way
Ker
ry
Kild
are
Kilk
en
ny
Lao
is
Leit
rim
Lim
eri
ck
Lon
gfo
rd
Lou
th
May
o
Me
ath
Mo
nag
han
Off
aly
Ro
sco
mm
on
Slig
o
Tip
pe
rary
Wat
erf
ord
We
stm
eat
h
We
xfo
rd
Wic
klo
w
AIT 0 3 1 1 1 3 13 0 2 1 3 1 1 7 1 4 4 1 15 10 1 2 0 25 1 1
CIT 0 0 1 77 0 1 1 7 1 1 0 0 2 0 0 0 0 0 0 0 0 4 3 0 1 0
DCU 2 3 1 1 4 41 2 1 5 2 1 1 1 1 5 3 9 3 1 1 1 1 1 2 5 3
DIT 1 2 0 2 1 57 1 0 7 1 1 0 1 1 2 1 6 1 1 1 1 1 0 1 2 6
IADT 1 1 1 1 1 61 2 1 3 1 0 0 0 1 1 1 3 1 1 0 0 1 1 1 4 14
DKIT 0 6 0 2 1 12 0 0 1 0 0 0 0 0 44 0 16 13 0 0 0 0 0 1 1 1
GMIT 0 2 5 1 4 2 43 1 1 0 1 2 1 2 1 19 1 1 2 5 2 1 0 2 0 1
ITB 0 2 0 0 0 66 0 0 7 0 1 0 0 0 2 0 16 1 0 0 0 0 0 1 0 2
ITC 15 1 1 2 1 9 2 1 13 7 7 0 1 1 1 1 2 1 2 1 0 2 2 1 16 9
ITS 0 6 0 1 15 2 5 0 1 0 0 8 0 3 1 15 1 3 1 5 28 0 0 4 0 1
ITTa 0 0 0 5 0 68 1 0 10 0 1 0 2 0 1 0 2 0 1 0 0 1 0 1 0 5
ITTr 0 0 5 13 0 2 1 57 1 1 1 0 10 0 0 1 1 0 0 0 0 2 1 0 1 1
LYIT 0 2 1 1 72 3 4 0 1 0 0 1 1 1 1 2 1 2 0 2 3 0 0 1 0 1
LIT 0 0 19 5 0 1 4 3 1 1 2 0 38 0 0 2 1 0 2 1 0 16 1 1 1 0
Mary I 1 1 10 16 1 5 10 8 1 2 3 0 17 0 1 3 1 0 2 1 0 11 3 1 2 1
MU 2 3 1 1 3 28 1 0 19 2 2 1 1 1 4 1 12 1 2 1 1 1 1 3 4 2
NCAD 2 0 0 1 1 56 3 0 7 1 1 0 0 0 5 1 5 2 1 1 0 0 1 1 4 5
NUIG 1 1 5 2 5 3 46 2 2 1 1 1 3 1 1 8 2 1 2 3 3 2 1 2 1 1
RCSI 1 1 1 5 1 51 4 2 5 2 1 0 2 1 2 2 5 1 1 2 1 2 1 2 2 3
St. Angela's 1 3 2 4 13 4 8 2 1 3 1 6 2 2 1 9 2 4 1 6 17 2 1 2 2 1
UCC 0 0 2 62 0 2 1 9 1 2 1 0 4 0 0 0 0 0 0 0 0 6 5 0 1 0
UCD 1 1 1 3 2 48 2 1 5 2 1 1 1 1 2 2 4 1 1 1 1 2 1 2 4 6
UL 1 1 12 10 1 3 6 7 2 3 3 0 25 0 0 4 1 0 2 1 1 10 3 1 2 1
WIT 3 0 1 7 0 2 1 1 3 13 3 0 1 0 0 0 1 0 1 0 0 12 33 0 15 2
All HEIs 1 1 3 13 3 22 7 3 5 2 2 1 5 1 3 3 4 1 2 1 2 4 3 2 3 3
2 2 3 32 0 4 1 3 2
%
Population
Aged 20 -
29 (Census)
1 1 2 11 3 36 1 1 1 33 16 2 4 2
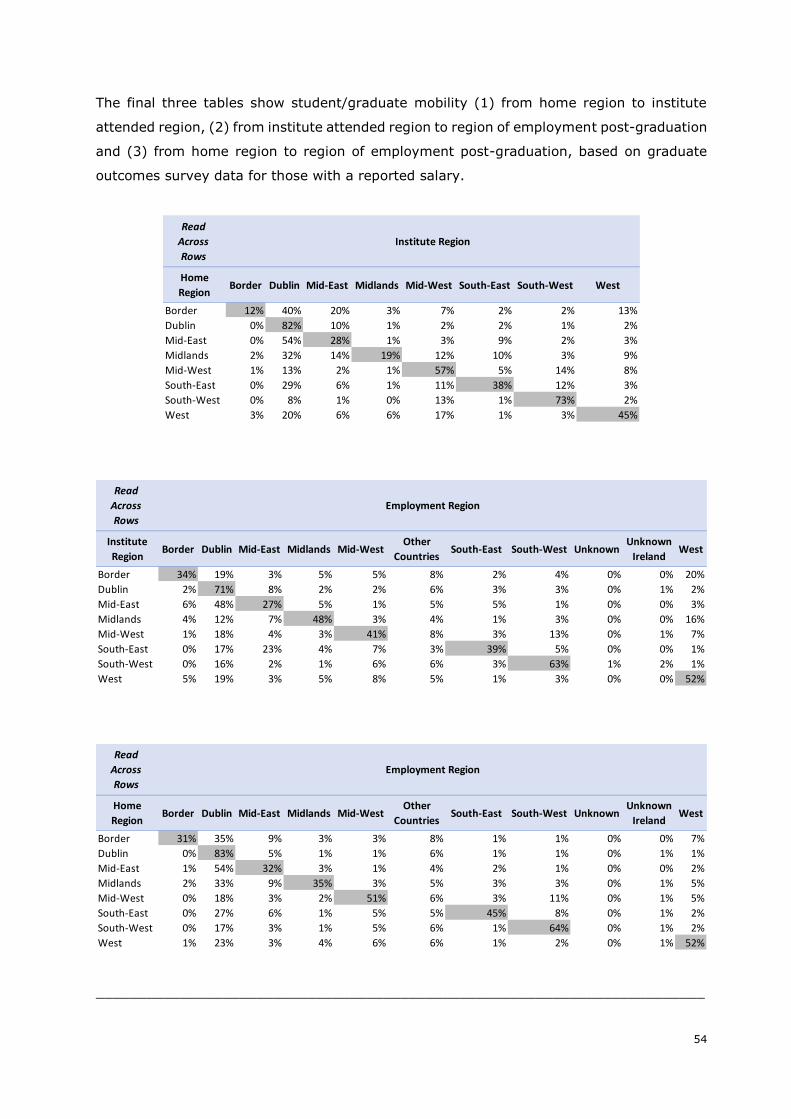
54
The final three tables show student/graduate mobility (1) from home region to institute
attended region, (2) from institute attended region to region of employment post-graduation
and (3) from home region to region of employment post-graduation, based on graduate
outcomes survey data for those with a reported salary.
________________________________________________________________________
Read
Across
Rows
Home
RegionBorder Dublin Mid-East Midlands Mid-West South-East South-West West
Border 12% 40% 20% 3% 7% 2% 2% 13%
Dublin 0% 82% 10% 1% 2% 2% 1% 2%
Mid-East 0% 54% 28% 1% 3% 9% 2% 3%
Midlands 2% 32% 14% 19% 12% 10% 3% 9%
Mid-West 1% 13% 2% 1% 57% 5% 14% 8%
South-East 0% 29% 6% 1% 11% 38% 12% 3%
South-West 0% 8% 1% 0% 13% 1% 73% 2%
West 3% 20% 6% 6% 17% 1% 3% 45%
Institute Region
Read
Across
Rows
Institute
RegionBorder Dublin Mid-East Midlands Mid-West
Other
CountriesSouth-East South-West Unknown
Unknown
IrelandWest
Border 34% 19% 3% 5% 5% 8% 2% 4% 0% 0% 20%
Dublin 2% 71% 8% 2% 2% 6% 3% 3% 0% 1% 2%
Mid-East 6% 48% 27% 5% 1% 5% 5% 1% 0% 0% 3%
Midlands 4% 12% 7% 48% 3% 4% 1% 3% 0% 0% 16%
Mid-West 1% 18% 4% 3% 41% 8% 3% 13% 0% 1% 7%
South-East 0% 17% 23% 4% 7% 3% 39% 5% 0% 0% 1%
South-West 0% 16% 2% 1% 6% 6% 3% 63% 1% 2% 1%
West 5% 19% 3% 5% 8% 5% 1% 3% 0% 0% 52%
Employment Region
Read
Across
Rows
Home
RegionBorder Dublin Mid-East Midlands Mid-West
Other
CountriesSouth-East South-West Unknown
Unknown
IrelandWest
Border 31% 35% 9% 3% 3% 8% 1% 1% 0% 0% 7%
Dublin 0% 83% 5% 1% 1% 6% 1% 1% 0% 1% 1%
Mid-East 1% 54% 32% 3% 1% 4% 2% 1% 0% 0% 2%
Midlands 2% 33% 9% 35% 3% 5% 3% 3% 0% 1% 5%
Mid-West 0% 18% 3% 2% 51% 6% 3% 11% 0% 1% 5%
South-East 0% 27% 6% 1% 5% 5% 45% 8% 0% 1% 2%
South-West 0% 17% 3% 1% 5% 6% 1% 64% 0% 1% 2%
West 1% 23% 3% 4% 6% 6% 1% 2% 0% 1% 52%
Employment Region

55
Background Notes and Limitations
Background Notes:
1. Prior to deprivation index score analysis, the HEA primarily used socio-economic group,
derived from fathers occupation, collected in the Equal Access Survey to measure relative
socio-economic position of students. Students were coded into 11 groups: higher
professional, lower professional, employers and managers, non-manual, manual skilled,
semi-skilled, unskilled, own account workers, farmers, agricultural workers and all others
gainfully occupied and unknown. The non-manual, semi-skilled, unskilled and agricultural
worker groups are underrepresented in higher education and were a key focus in the
National Plan for Equity of Access to Higher Education. These data are no longer collected
in the Equal Access Survey, partly due to data protection concerns regarding collecting data
on parents and partly due to the adoption of deprivation index scores as the method of
measuring socio-economic position. Deprivation index scores are a composite of ten Census
measures - the age dependency rate, population change, primary education figure, third
level education figure, professional classes figure, persons per room, lone parents figure,
semi and unskilled classes figure, male unemployment rate and female unemployment rate.
Scores are available at aggregated level such as Local Authority area and disaggregated
levels such as at Electoral Division level and Census small area level. The Census 2016
relative scores at small area level are used in the analysis in this profile, since these are the
most disaggregated available (small areas have less than 100 dwellings on average with a
high degree of socio-economic homogeneity). Student home address data is used to assign
a student to the appropriate Census small area and that is the origin of their index score.
2. Broad geographic differences in deprivation index scores are evident (e.g. Donegal
generally low scores, Dun Laoghaire generally high scores). To provide context the analysis
incudes comparisons to local area scores to show general local representativeness.
3. Arc GIS and Stata were used for the spatial analysis and data modelling in this profile.
Limitations:
1. The home address requested from HEIs was ‘The full permanent address prior to entry
to the programme of study. It is not necessarily the correspondence/term address.’ Despite
this, a small proportion of addresses provided were updated (mid-course) home addresses.
Term address has been returned for some students (e.g. UCC student campus addresses,
however removal of that cohort has a limited effect on the overall HEI level scores).
2. The overall enrolment analysis/maps are not a participation analysis since population of
younger persons by area is not analysed. The analysis is simply number of enrolments.
3. No time series data are available but will be going forward as more data are geocoded.
4. Graduate outcomes analysis uses a restricted sample, plus the mobility analysis uses
different measures of socio-economic position (home area income/deprivation/earnings).