a spatiotemporal coding mechanism for … information title a spatiotemporal coding mechanism for...
TRANSCRIPT

Supplementary information
Title
A spatiotemporal coding mechanism for background-invariant odor recognition
Authors
Debajit Saha, Kevin Leong, Chao Li, Steven Peterson, Gregory Siegel and Baranidharan Raman
Nature Neuroscience: doi:10.1038/nn.3570

Supplementary Figure 1: Mean ORN, PN and KC responses for all odor pairs used in this study
Supplementary Figure 1: PSTHs are shown for: (a) 2oct–hex, (b) chex–2hep, (c) bzald–iaa, (d) hxa–
hex, (e) ger–cit, (f) mint–apple. The 4 s odor stimulation period is shown using a gray bar along the x-
axis. For all odors used, three dynamical states can be clearly identified: an on-transient response
following odor onset, an off-transient response after stimulus termination, and a steady-state between the
two transient activity phases. n represents the number of neurons recorded. (g) The diverse set of
background–foreground odor combinations chosen for the study is listed here. Diversity assessed based
on functional groups, electroantennogram responses, vapor pressures, and complexity of the odorants
(mono-molecular versus complex blend).
Nature Neuroscience: doi:10.1038/nn.3570

Supplementary Figure 2: Electroantennogram (EAG) responses to the chosen odor pairs
Supplementary Figure 2: EAG recordings obtained from four locusts are shown for all six background–
foreground odor pairs. Raw EAG signals (mean ± s.d.) obtained from one locust are shown on the left
panels. Right panels reveal the distribution of peak EAG response amplitude to the background and
foreground odors across different locusts to illustrate response consistency. Three groups of odor pairs
can be easily identified based on their relative EAG response profiles: (a) odor pairs where the foreground
odor has stronger EAG response: 2oct–hex and hxa–hex (b) odor pairs where the background odor has
stronger EAG response: bzald–iaa and ger–cit, and (c) odor pairs with comparable EAG responses: chex–
2hep and mint–apple. (* P < 0.05; paired t-test, n = four trials).
Nature Neuroscience: doi:10.1038/nn.3570

Supplementary Figure 3: Visualization of ensemble PN responses using linear principal component
analysis (PCA)
Supplementary Figure 3: PCA trajectories to all six odor pairs are shown. Same convention as that used
in Fig. 4. The same sets of PNs used in Fig. 4 were used for generating the PCA plots.
Nature Neuroscience: doi:10.1038/nn.3570

Supplementary Figure 4: LLE plots showing PN ensemble response trajectories for 3 additional
overlapping conditions
Supplementary Figure 4: LLE plots showing PN ensemble response trajectories for 3 additional
overlapping conditions. The three new presentation conditions include: background–500 ms latency–
foreground, background–1000 ms latency–foreground, and background offset–500 ms latency–
foreground. n = number of PNs recorded for each odor pair.
Nature Neuroscience: doi:10.1038/nn.3570

Supplementary Figure 5: Significance of PN classification results
Supplementary Figure 5: (a) Percentage of time bins during pre-stimulus periods that were classified is
less than 3% for all odor pairs. (b) Histograms revealing the distribution of angular distances between
individual test patterns and their closest reference templates are shown. Same coloring scheme as used in
panel a. Only vectors exceeding standard deviation test were included in this analysis. Black bars
represent angular distance greater than 85°. The mean angular distance was between 68.65°–71.79°. (c)
Classification of random vectors using reference vector templates obtained for each odor pair. Less than
5% of the random vectors were within the tolerance limit by chance. All other vectors exceeded the
tolerance threshold and were not classified into any odor category.
Nature Neuroscience: doi:10.1038/nn.3570

Supplementary Figure 6: Average KC PSTHs for all odor pairs and for different overlapping conditions
Supplementary Figure 6: Average KC PSTHs for all odor pairs and for different overlapping conditions.
For each condition, firing rates were calculated over 100 ms non-overlapping time bins, averaged over ten
trials and smoothed using a 3-point running average. For each odor pair, the plot follows the stimulus
protocol scheme shown in Fig. 1b. n denotes the total number of KCs recorded for each odor pair. Max
indicates the maximum firing rate observed.
Nature Neuroscience: doi:10.1038/nn.3570

Supplementary Figure 7: Locust retention tests and T-maze assay
Supplementary Figure 7: (a) A schematic of locust palp opening response (POR). Dotted red line
indicates the POR threshold used to determine a response. One or both maxillary palps have to cross this
detection threshold at least once during the odor presentation period to be counted as positive response.
(b) PORs for four consecutive blocks of unrewarded test trials are shown. Each block consisted of two
test trials: presentations of the CST (iaa) and an untrained odor (bzald). Test trials started 10 min after the
last training trial. A 10 min delay was maintained between test trials in a single block, and a 30 min delay
was observed between consecutive blocks of test trials. Conditioned locusts had a significantly higher
POR to the trained odor (iaa) during all four test trials (**P = 1.22×10⁻⁴
, 6.10×10⁻⁵
, 7.63×10⁻⁵
, 3.05×10⁻⁵
;
McNemar’s exact test, n = 28 locusts). The frequency of POR observed for trained and untrained odor
remained consistent across the four consecutive test blocks (Cochran’s Q test; for CST: Q = 0.67, df = 3,
P = 0.87; for untrained odor: Q = 2.2, df = 3, P = 0.53). (c) The bar graph summarizes responses of
locusts to a trained odor (CST – cit) and an untrained odor (ger). The POR to citral was low indicating
that effective association between CST and unconditioned stimulus was not achieved (P = 0.50;
Nature Neuroscience: doi:10.1038/nn.3570

McNemar’s exact test, n = 26 locusts). n denotes the number of locusts used in the training set. (d,e) Bar
graphs summarizing conditional POR probability in those locusts that responded only to the CST are
shown (*P = 0.0351; NS indicates not significant, P > 0.05; McNemar’s exact test with Bonferroni
correction for multiple comparisons, n = 25 locusts for 2oct–hex, n = 27 locusts for bzald–iaa). (f) A
schematic of the T-maze assay is shown. Locusts were restrained in a custom-designed holder and
released just before the odor delivery. A test odor and the control (mineral oil) were simultaneously
presented at the two odor delivery ports. An exhaust fan at the center of the maze ensured that there was a
stable airflow inside the maze (flow patterns were confirmed with titanium tetrachloride). Each locust
was given 4 min to make a decision: i.e. select a T-maze arm, reach and touch the sidewall at the end of
the selected arm with its leg or antenna.
Nature Neuroscience: doi:10.1038/nn.3570

Supplementary Figure 8: Qualitatively similar results obtained from analysis of ensemble neural
activity recorded from single locusts
Supplementary Figure 8: Classification analysis using PN responses obtained from a single locust is
shown. Results for all six different odor pairs are arranged as in Fig. 5b–g. n denotes the number of PNs
recorded from both antennal lobes of the locust. Note that for each odor pair a different locust was used.
Nature Neuroscience: doi:10.1038/nn.3570
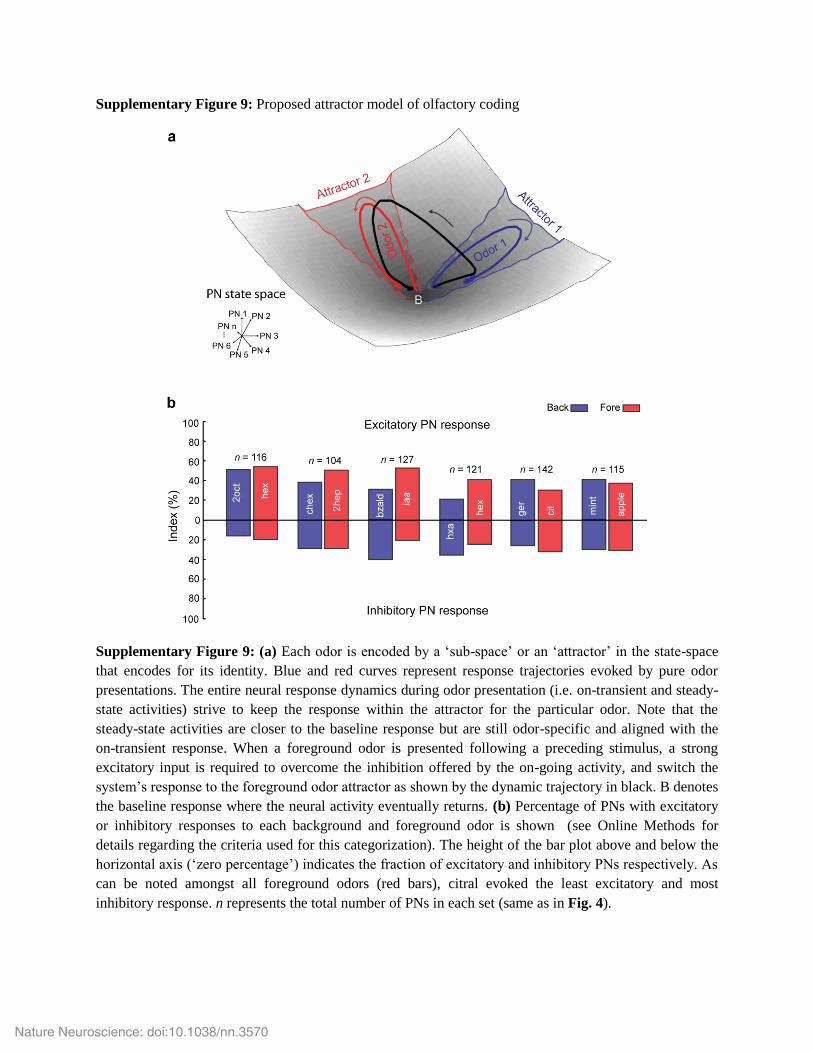
Supplementary Figure 9: Proposed attractor model of olfactory coding
Supplementary Figure 9: (a) Each odor is encoded by a ‘sub-space’ or an ‘attractor’ in the state-space
that encodes for its identity. Blue and red curves represent response trajectories evoked by pure odor
presentations. The entire neural response dynamics during odor presentation (i.e. on-transient and steady-
state activities) strive to keep the response within the attractor for the particular odor. Note that the
steady-state activities are closer to the baseline response but are still odor-specific and aligned with the
on-transient response. When a foreground odor is presented following a preceding stimulus, a strong
excitatory input is required to overcome the inhibition offered by the on-going activity, and switch the
system’s response to the foreground odor attractor as shown by the dynamic trajectory in black. B denotes
the baseline response where the neural activity eventually returns. (b) Percentage of PNs with excitatory
or inhibitory responses to each background and foreground odor is shown (see Online Methods for
details regarding the criteria used for this categorization). The height of the bar plot above and below the
horizontal axis (‘zero percentage’) indicates the fraction of excitatory and inhibitory PNs respectively. As
can be noted amongst all foreground odors (red bars), citral evoked the least excitatory and most
inhibitory response. n represents the total number of PNs in each set (same as in Fig. 4).
Nature Neuroscience: doi:10.1038/nn.3570

Supplementary Figure 10: Examples of ORN, PN and KC spike-sorting
Supplementary Figure 10: (a) An example of ORN recording and spike-sorting. (Left panel) Raw
extracellular trace showing response of a single ORN. (Middle panel) Individual ORN spike events
(black) and their mean (red). (Right panel) Inter-spike interval distribution for the identified ORN. (b)
An example of PN spike-sorting. (Left panel) Extracellular waveforms from four independent channels
of a tetrode are shown for all spiking events corresponding to two simultaneously recorded PNs.
Individual events (black), mean (red), and s.d. (blue) are shown for both cells. (Right panel – top)
Histograms obtained by projecting high-dimensional PN event representations (180 dimensional vector
obtained by concatenating signals from all electrodes) onto the line connecting their means. To be
considered a well-isolated unit, as in this case, a bimodal distribution with cluster centers separated by at
least five times the noise s.d. is expected for every pair of simultaneously recorded cells. (Right panel –
bottom) Distributions of inter-spike intervals are shown for these two PNs. (c) Similar plot showing an
example for KC spike-sorting.
Nature Neuroscience: doi:10.1038/nn.3570