a spill management information - epa archives of civil and environmental engineering ... buffering,...
TRANSCRIPT


A Spill Management Information System for Freshwater Incidents
Edsel B. Daniel, James P. Dobbins, Paul H. Martin, Eugene J. LeBoeuf, Mark D. Abkowitz
Vanderbilt University Department of Civil and Environmental Engineering
in conjunction with
The Nashville District and the Engineering Research and DevelopmentCenter, U.S. Army Corps of Engineers

Presentation Outline • Background
• Project Objectives
• Conceptual Design and System Architecture
• Water and Air Quality Models
• Model Execution
• Spill Scenario Example
• Project Accomplishments
• Current and Future Work

Background • U.S. Army Corps of Engineers (USACE) maintains over 11,000 miles of
navigable waterways which include numerous critical marine elements: – Water supply, recreation areas, and sensitive environmental areas
• Marine transportation is considered one of the nation’s most efficient,safe, and economical modes of freight transport.
• Hazardous materials comprise a large portion of barge transportedcommodities, placing communities along navigable waterways at risk ofexposure to toxic chemicals in the event of a collision, grounding, orterrorist action.
• Managing a navigable water body chemical spill response involvescoordination and communication among numerous federal, state, andlocal entities posing challenges in the areas of:
• Retrieving characteristic chemical data • Jurisdictional responsibility of responding agencies • Location of waterway access points • Community notification

Project Objectives
Develop a spill management information system (SMIS) that:
• Addresses accidental releases and terrorist incidents
• Provides the capability to perform simulation training, contingency planning, and real-time incident management
• Utilizes advanced information technologies to deliver timely and accurate information in a spatial-based framework

Conceptual Design
GIS Data Layers
Spill Modeling
Impact Assessment

System Architecture
Database Management System
Chemical data Background Data
ArcView GIS
Menu driven, multimedia interface Spatial analysis functionality Closely coupled interfacing
DSS Functionality
Results
Inputs
Results
Inputs
User
Air Quality Modeling
EPA CAMEO 2-D Gaussian dispersion
Water Quality Modeling
USACE CE-QUAL-W2 2-D laterally averaged
model
MeteorologyInflows/Outflows FTP FTP

GIS is a system of computersoftware, hardware, and datato help manipulate, analyze,and present information thatis tied to a spatial location.
Geographic Information Systems

CE QUAL W2 2-D, longitudinal/verticalhydrodynamic and waterquality model applicable torivers, lakes, reservoirs, andestuaries.
Developed by Portland StateUniversity in conjunction withUSACE Waterways ExperimentStation (WES).
Version 3.1 developed for theCheatham Reach of the Cumberland River.
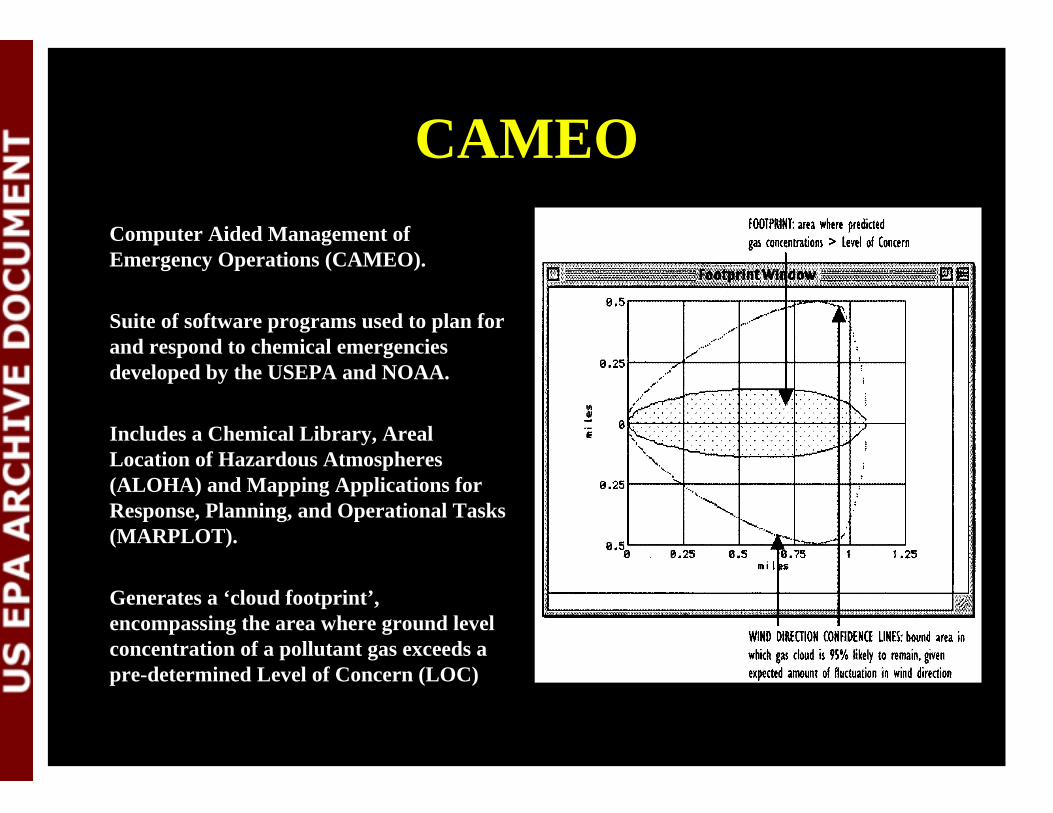
CAMEO Computer Aided Management of Emergency Operations (CAMEO).
Suite of software programs used to plan for and respond to chemical emergencies developed by the USEPA and NOAA.
Includes a Chemical Library, Areal Location of Hazardous Atmospheres (ALOHA) and Mapping Applications for Response, Planning, and Operational Tasks (MARPLOT).
Generates a ‘cloud footprint’, encompassing the area where ground level concentration of a pollutant gas exceeds a pre-determined Level of Concern (LOC)
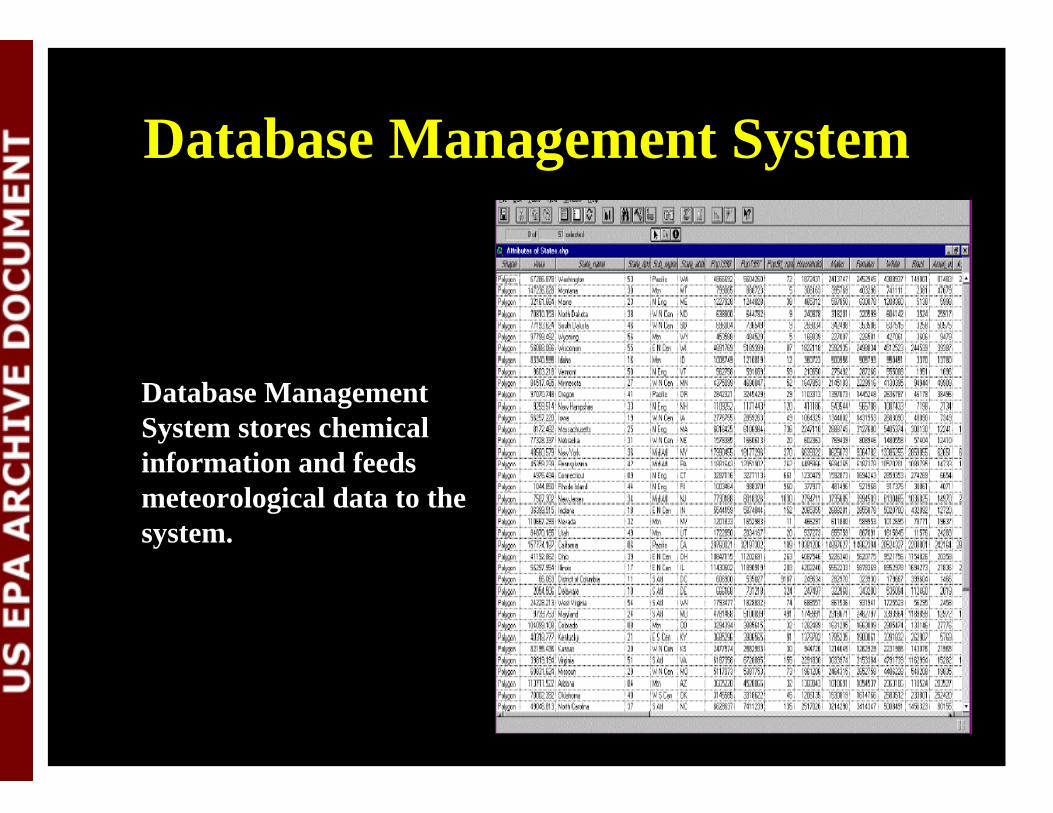
Database Management System
Database Management System stores chemical information and feeds meteorological data to the system.
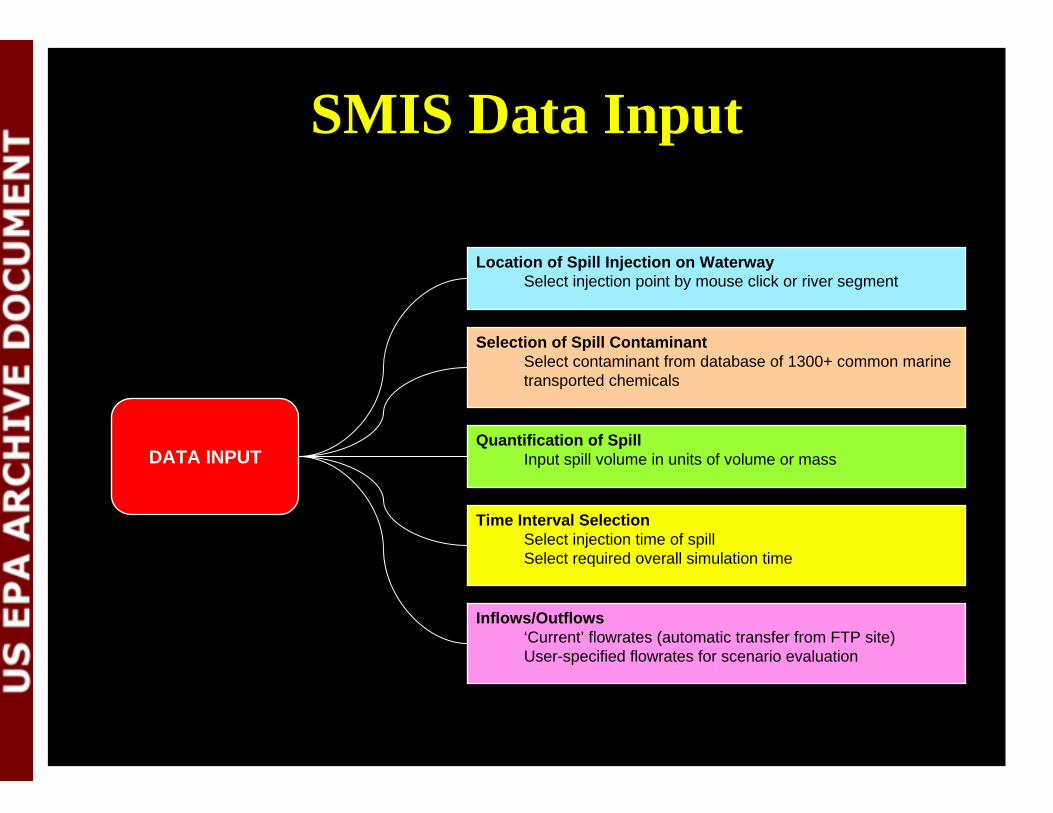
SMIS Data Input
DATA INPUT
Location of Spill Injection on Waterway Select injection point by mouse click or river segment
Selection of Spill Contaminant Select contaminant from database of 1300+ common marine transported chemicals
Quantification of Spill Input spill volume in units of volume or mass
Time Interval Selection Select injection time of spill Select required overall simulation time
Inflows/Outflows ‘Current’ flowrates (automatic transfer from FTP site) User-specified flowrates for scenario evaluation
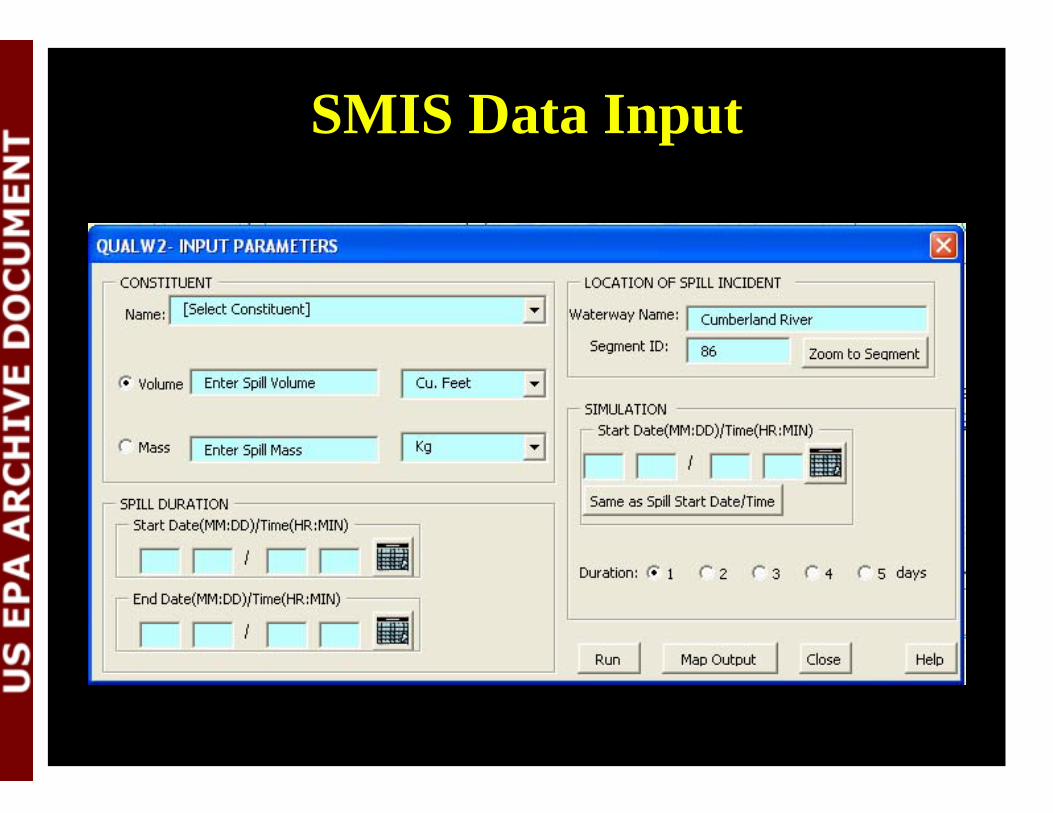
SMIS Data Input

SMIS Data Input
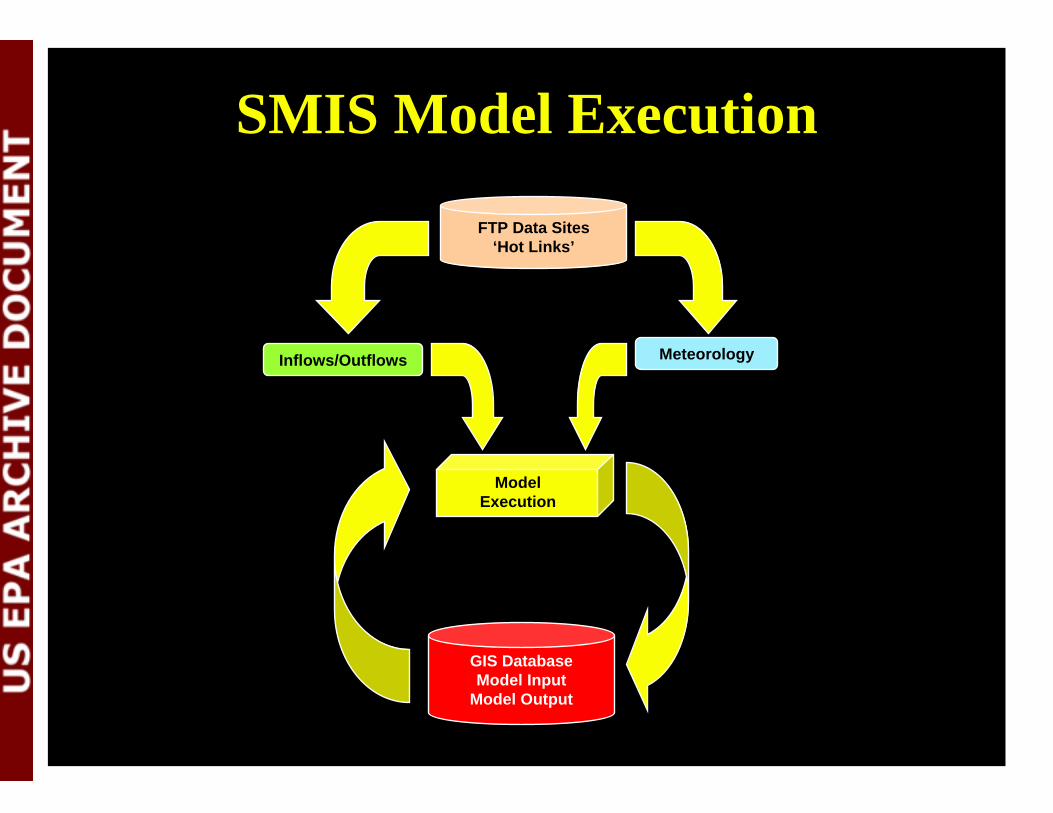
SMIS Model Execution
Inflows/Outflows Meteorology
FTP Data Sites ‘Hot Links’
Model Execution
GIS Database Model Input
Model Output

SMIS Output
Data Output
Time Series Contaminant Transport 1-hour intervals (24 per day up to 5 days) Surface, 1-meter, 2-meter, 3-meter, and bottom depths
Animation Visual progression of spill plume through the watercourse
Supplementary Contaminant Information Detailed PDF file for each contaminant in database
Areal Plume Dispersion Contaminant plume dispersion 1-hour after spill injection Accounts for uncertainty in meteorological conditions
GIS Risk Analysis Routines Interactive contaminant layers generated Rapid identification of impact regions
GIS Data Management/Analysis Functions
Visualization and translation of study results Dynamic color graphics for model output Symbolic representation of study area allowing easy and immediate understanding of
basic spatial patters and relationships Logical/Arithmetic selection of features by time, location, proximity, parameters range Overlay point-in-polygon, buffering, distance calculation, contouring, and map algebra Trend analysis, summary statistics, correlation, regression
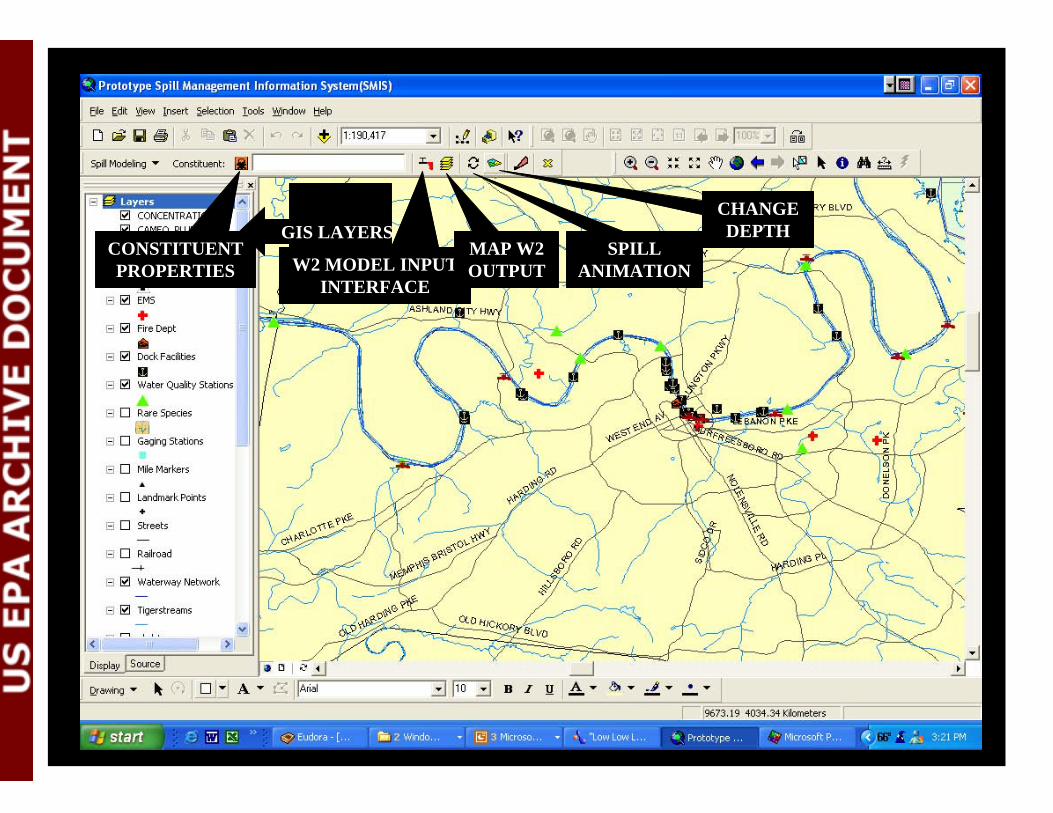
GIS LAYERS
W2 MODEL INPUT INTERFACE
MAP W2 OUTPUT
CONSTITUENT PROPERTIES
CHANGE DEPTH
SPILL ANIMATION

Sample Output – Surface Water Contaminant Dispersion

Sample Output – Air Dispersion
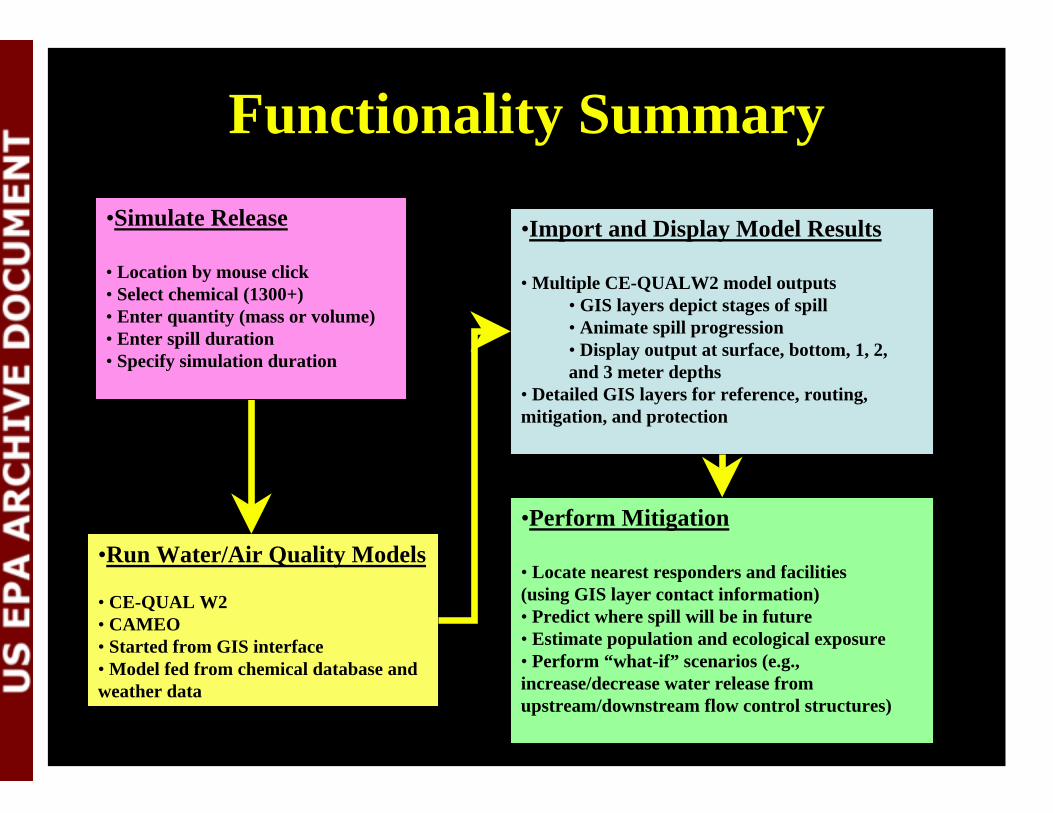
Functionality Summary
•Run Water/Air Quality Models
• CE-QUAL W2 • CAMEO • Started from GIS interface • Model fed from chemical database and weather data
•Import and Display Model Results
• Multiple CE-QUALW2 model outputs • GIS layers depict stages of spill • Animate spill progression • Display output at surface, bottom, 1, 2, and 3 meter depths
• Detailed GIS layers for reference, routing, mitigation, and protection
•Perform Mitigation
• Locate nearest responders and facilities (using GIS layer contact information) • Predict where spill will be in future • Estimate population and ecological exposure • Perform “what-if” scenarios (e.g., increase/decrease water release from upstream/downstream flow control structures)
•Simulate Release
• Location by mouse click • Select chemical (1300+) • Enter quantity (mass or volume) • Enter spill duration • Specify simulation duration
Scenario Demonstration

Scenario • Location: Cheatham Reach - RM 194
• Incident: Barge Grounding
• Release: 25,000 barrels (1.05 x 10⁶ gallons) over 30minutes
• Chemical: ethylene glycol
• Meteorology: 10 mph easterly wind, 70o F, partly cloudy

SMIS Input
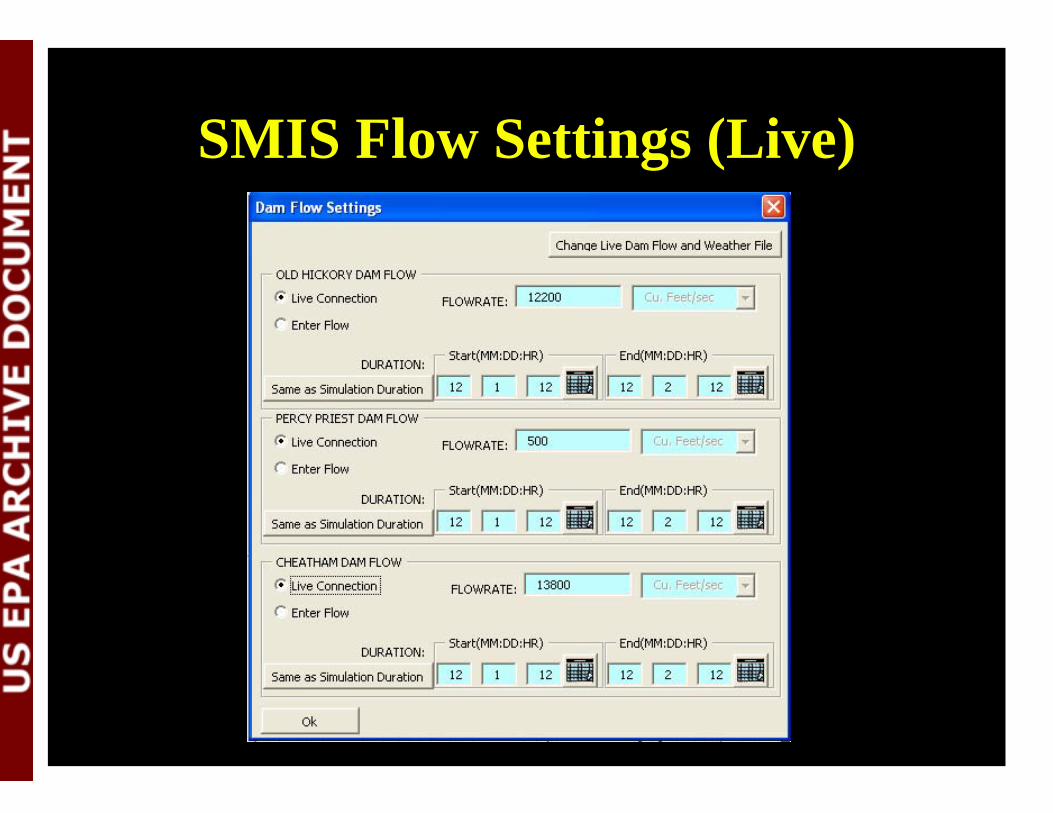
SMIS Flow Settings (Live)
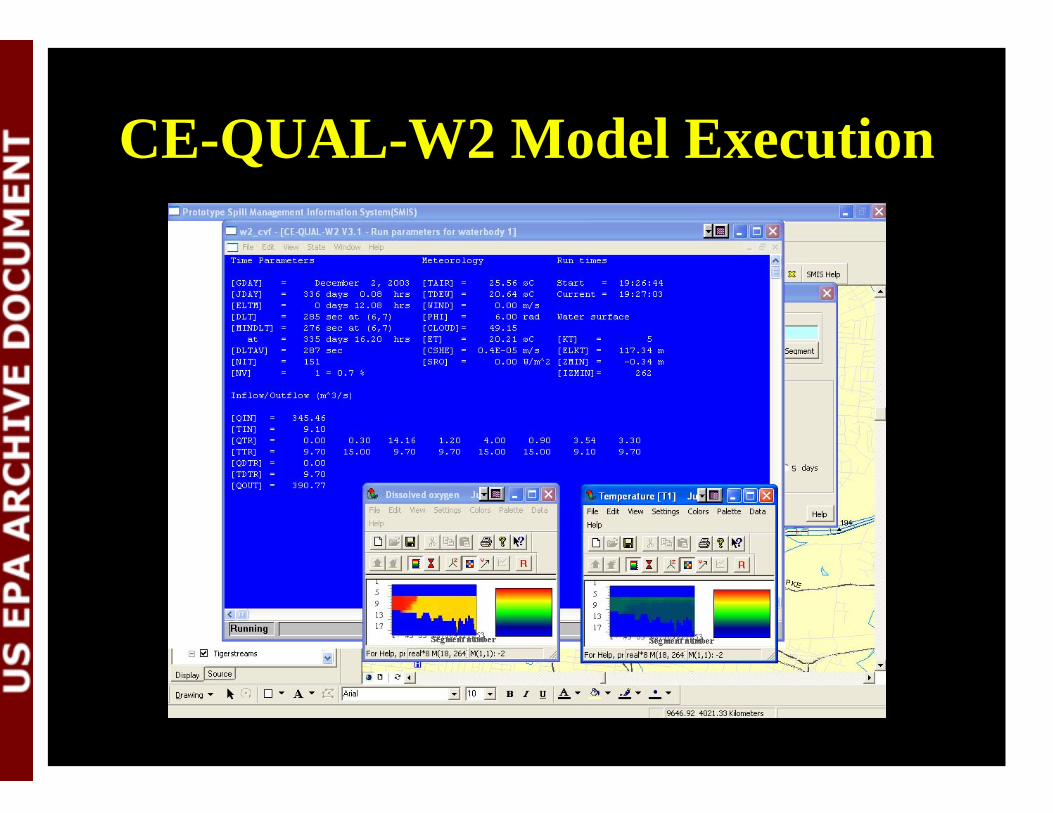
CE-QUAL-W2 Model Execution
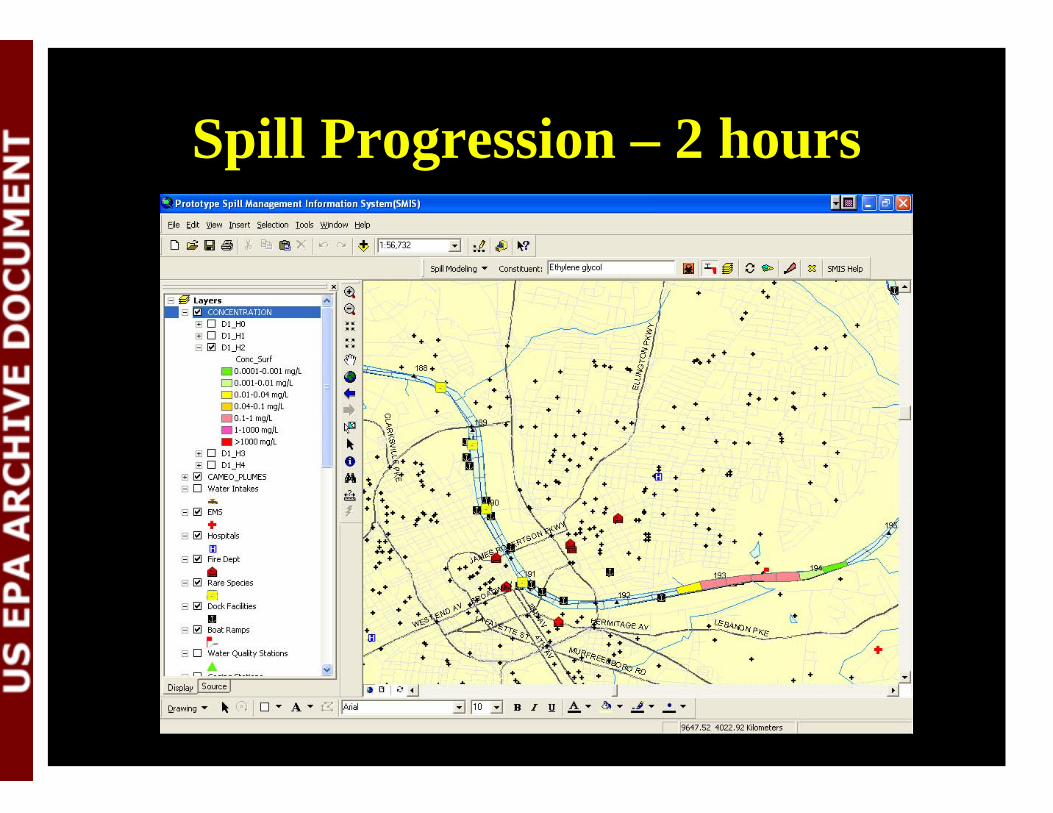
Spill Progression – 2 hours

Air Dispersion – 1 hour

Analysis and Abatement Routines
• Animation Tool – toggles on/off layers in succession to create dynamic viewing of spill incident progression
• GIS Risk Analysis Routines – search for sensitive receptors within generated GIS layers (water intakes, endangered species, population centers) and associated attributes (contact numbers, responders, HAZMAT teams)
• Locating Access Points – boat launches, bridges, dock facilities, etc.

Key Project Accomplishments • Completed information system design for
managing spills on waterways
• Deployed state-of-the-art information model, data,and technologies
• Established proof of concept that a comprehensiveSpill Management Information System is feasible
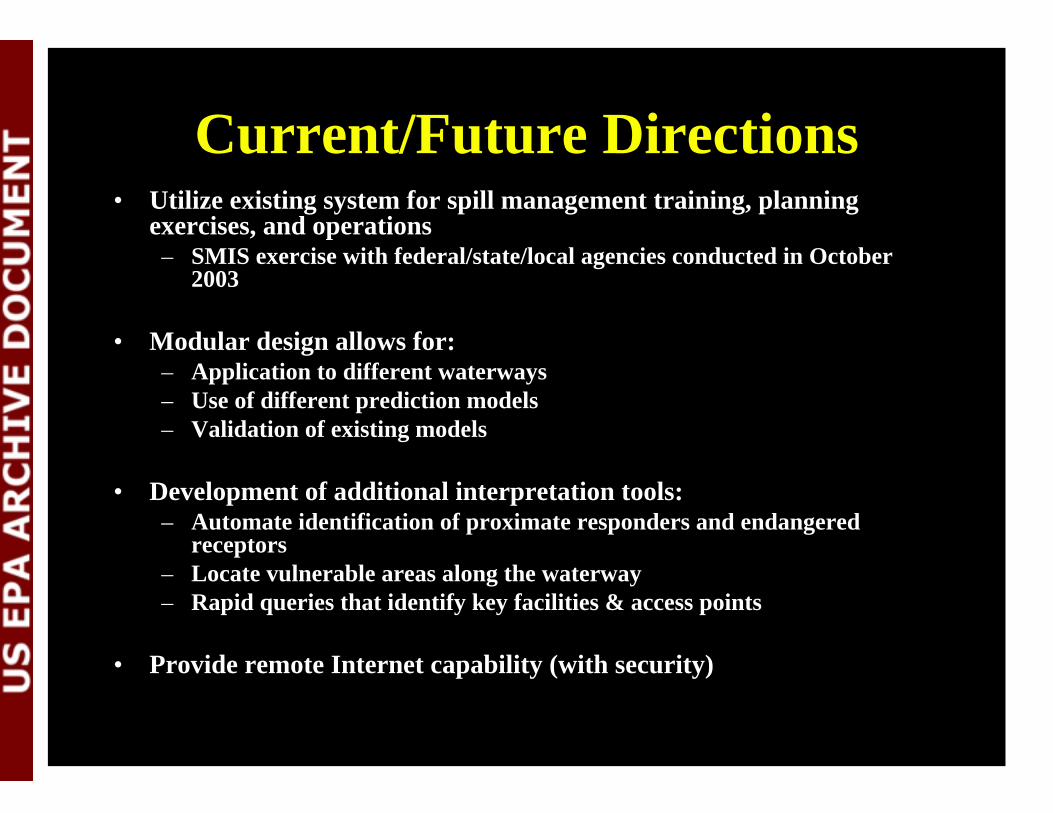
Current/Future Directions • Utilize existing system for spill management training, planning
exercises, and operations – SMIS exercise with federal/state/local agencies conducted in October
2003
• Modular design allows for: – Application to different waterways – Use of different prediction models – Validation of existing models
• Development of additional interpretation tools: – Automate identification of proximate responders and endangered
receptors – Locate vulnerable areas along the waterway – Rapid queries that identify key facilities & access points
• Provide remote Internet capability (with security)

Potential Applications and Developmental Options
Model enhancements to existing Cheatham Reach may include: • Threat zone analysis queries to evaluate where a spill might occur that could threaten
particular areas (e.g., endangered species areas, water intakes, schools, businesses,homes, etc.);
• Notification systems that can provide contact lists for facilities in affected areas, to include automated calling;
• Web-based SMIS to provide portability to first responders in the field (includingemployment of proper security measures to ensure access to SMIS is limited to authorized users);
• Resource analysis to help estimate the level of response needed to adequately addressimpacts of modeled spills, and the quantity of a particular resource that could be impacted by given spills (e.g., equipment required to isolate a specific endangered species area or water intake zone, such as length of boom, number of transport trucks,number of boats, number of personnel);
• Improved reactivity and transport capability within CE-QUAL-W2 to allow forinclusion of the effects of contaminant volatilization, reaction, and/or sorption; and
• Improved air dispersion model capabilities (nuclear, biological capability (HPAC))

Potential Applications and Developmental Options
Transferability of Cheatham Reach SMIS to Similar Waterway Systems:
• SMIS can be readily adapted to other waterways that can be effectively modeledwith CE-QUAL-W2.
• Suggested prioritization of work includes other major population centers and/orlarge volume transportation sectors possessing similar water hydrodynamics to theCheatham Reach of the Cumberland River.
• Required enhancements: – Incorporation of GIS layers representative of the geographic area of interest; – Development and calibration of CE-QUAL-W2 model to waterway of interest,
to include: • Waterway bathymetry • Collection of appropriate flow and water quality data;
– Establishment of ‘hot links’ to meteorological and water flow data; and – Installation and training.

Potential Applications and Developmental Options
Model enhancements for dissimilar waterway systems: • Modular framework of SMIS allows employment of additional water quality
models to more appropriately model water bodies possessing hydrodynamics thatare dissimilar to those modeled by CE-QUAL-W2.
• Such systems may include Resource Management Associates 2 (RMA-2) andResource Management Associates 4 (RMA-4), and others.
• Required enhancements: – Evaluation of the waterway and needs of the client to determine the most appropriate
hydrodynamic and contaminant transport models; – Incorporation of GIS layers representative of the geographic area of interest; – Development and calibration of the hydrodynamic and contaminant transport models of
interest, to include: – Waterway bathymetry – Collection of appropriate flow and water quality data;
– Design and implementation of applications module to activate and integrate modelfunctionality within SMIS;
– Establishment of ‘hot links’ to meteorological and water flow data; and – Installation and training.

Questions?
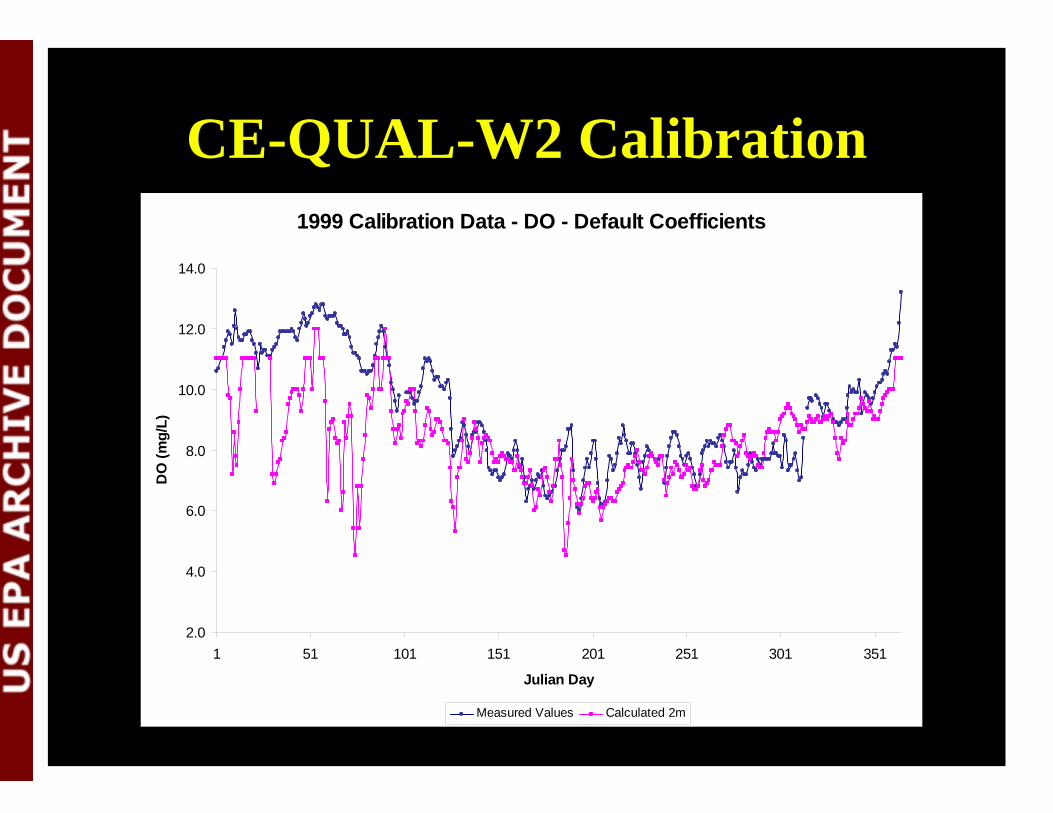
CE-QUAL-W2 Calibration 1999 Calibration Data - DO - Default Coefficients
2.0
4.0
6.0
8.0
10.0
12.0
14.0
1 51 101 151 201 251 301 351
Julian Day
DO
(mg/
L)
Measured Values Calculated 2m

CE-QUAL-W2 Calibration 1999 Calibration Data - Temp - Default Coefficients
0.0
5.0
10.0
15.0
20.0
25.0
30.0
1 51 101 151 201 251 301 351
Julian Day
Deg
rees
Cel
cius
Measured Values Calculated 2m