a splitting storm in southwest idaho david … storm.pdfa splitting storm in southwest idaho david...
TRANSCRIPT

A SPLITTING STORM IN SOUTHWEST IDAHO
David B. Billingsley, WSFO BOI
Introduction
Results from three-dimensional numerical cloud modelsimulations suggest a strong relationship between environmentalvertical wind shear and buoyancy, and the structure and evolutionof thunderstorms (Weisman and Klemp, 1982, 1984). A balancebetween these two environmental parameters is apparently necessaryto support certain long-lived modes of convection such assupercells and severe multi-cellular storms.
As an example, given enough instability for convection, amoderate-to-strong unidirectional shear profile should produce anupdraft that splits into two individual storms which move to theleft and right of the environmental wind, respectively (Fig. la, b).Rotation associated with the left-moving updraft is shown to be inthe anticyclonic sense while the right-moving updraft rotates inthe more familiar cyclonic direction (Klemp and Wilhelmson,1978a,b; Wilhelmson and Klemp, 1978; Klemp, 1987).
In this attachment, an observational example of a splittingstorm on 27 May 1994 in southwestern Idaho is compared to thesetheoretical concepts of storm structure and evolution.
synoptic setting
On the morning of 27 May, a 500 mb trough was located on theWashington-oregon coastline, placing Idaho in a southwesterly upperflow pattern (Fig. 2). A segment of the jetstream was positionedin southeast British Columbia-Western Alberta, trailing back intoeastern Washington and Oregon. This location placed southwestIdaho in the favorable right entrance region of the jet, andcontributed to increased vertical wind shear. At the surface, acold front was situated from central Montana to southcentral Idahowith a weaker stationary segment tailing back into the northernNevada-California area (not shown).
Quasi-geostrophic diagnostics (using the NGM PCGRIDDs datasetat 1200 UTC) depicted an area of layer-averaged Q-vectorconvergence in the mid-troposphere (700-400 mb average) in thesouthwestern Idaho-southeast Oregon-northern Nevada region at 1800UTe (Fig. 3). Examination of layer-averaged Q-vector convergencecentered at other levels revealed a similar pattern. Modelproduced lifted indices were in the -1 to -3 range across this samearea (Fig. 4). This combination of QG forcing and instability issupportive of synoptic-scale upward motion across the region ofconcern. It is interesting to note that the model-derived verticalmotions were in a DOWNWARD sense (though weak at @ 1.5 ubars/sec)in the mid-troposphere, opposing the inferred upward motion usingQG simplifications.
As indicated, several features appeared to confirm thatsynoptic-scale ascent and destabilization were taking place in the

•
environment, prior to and near the time of initiation of convectionin southwest Idaho. These included a favorable position of a jetmaximum, a nearby surface front, a mid-tropospheric trough to thewest, and a moderate amount of static instability.
soundinq AnalysisThe 1200 UTC 27 May 1994 Boise sounding was modified for the
afternoon hours using a combination of PCGRIDDs, the VelocityAzimuth Display (VAD) profile on the 88D, and estimated terraininduced boundary layer winds for the southwest corner of Idaho.The thermodynamic plot shown in Fig. 5 displays the typicalinverted V sounding of the intermountain west. Lifting a surfaceparcel gives a CAPE of 820 m2 S·2, only marginal instability whencompared to the areas east of the Rockies. From sUbjectiveexperience so far in Boise, this value appears to be marginal tomoderate for this area. The actual instability at the time ofstorm initiation could be quite different since the thermodynamicprofile was smoothed using gridded data at mandatory levels.
The hodograph (Fig. 6) was developed uS1ng assumed boundarylayer winds below 2 Km MSL, VAD winds from the Boise 88D at 2022UTC, and NGM forecasted winds from PCGRIDDs at 1800 UTC using the1200 UTC model run. The boundary layer winds were generated usingmodel-derived boundary layer flow and sUbjectively adjusting thedirection and speed for terrain effects near the initiation regionof the splitting storm. The VAD/NGM winds above the boundary layerwere in excellent agreement. The accuracy of the sUbjectivelyestimated boundary layer winds is much more uncertain.Additionally, the terrain in the area of thunderstorm initiation ishigher than at Boise, so the first few points of the hodograph canbe ignored.
The modified hodograph depicts a shear of 23 m S·l (length ofthe hodograph) from 1.5 to 6 km. The shape is basicallyunidirectional (straight hodograph), especially above the boundarylayer, though some counterclockwise curvature is noted. Comparingthis hodograph to the conceptual hodograph in Fig. 7 (from Fig.15.16b in weisman and Klemp, 1986, but rotated 90 0
counterclockwise) and considering the significant vertical shear inFig. 6, a splitting updraft would be expected. The "left-mover"(to be referred to as LM) would propagate to the north at a slowerspeed than the east-northeastward propagating "right-mover" (RM).with the slight counterclockwise curvature, the LM storm should bemore dominate with an expected anticyclonic updraft rotation. TheRM storm should be weaker and have a cyclonically rotating updraft.
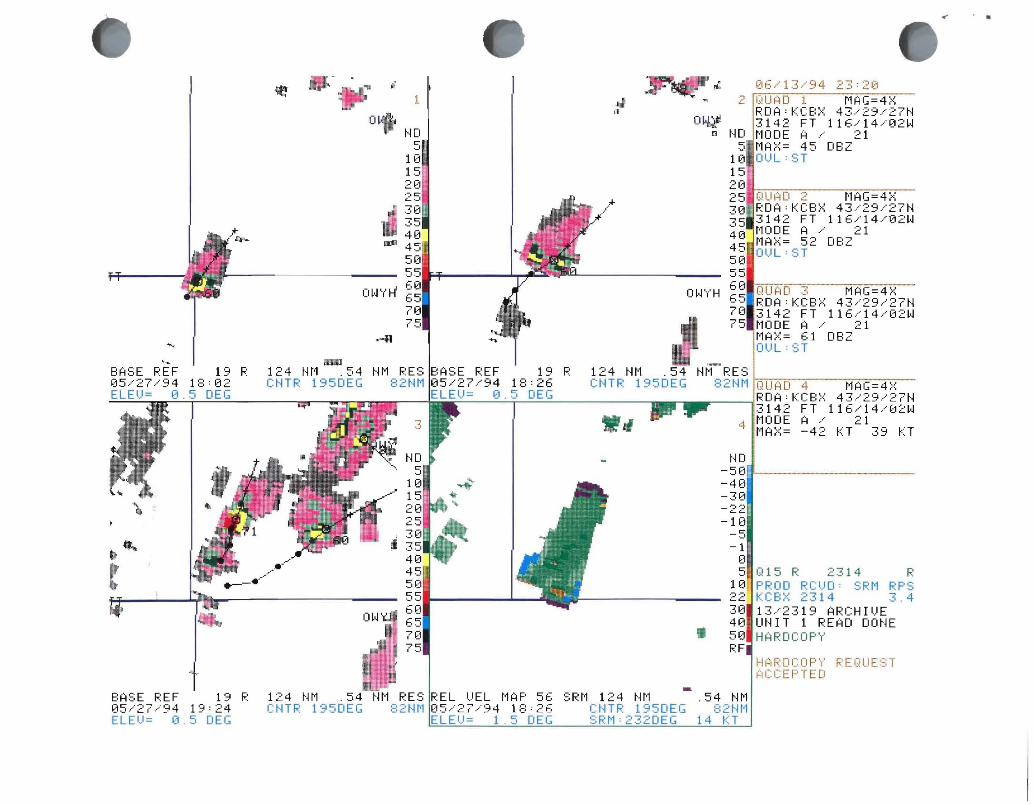
WSR-BBD ExaminationFig. 8a-c is an attempt to depict the evolution of the
splitting storm using 0.5 0 reflectivity data from the WSR-88D atBoise. (Obviously, the best way to view this evolution is withtime-lapse display.) At 1802 UTC (Fig. 8a), a singlenortheastward moving thunderstorm cell can be seen on thesouthwestern Idaho-northern Nevada-southeast Oregon border. By1826 UTC (Fig. 8b), the cell splits into two distinct reflectivitymaximums, neither one of which looks particularly impressive. One

hour later at 1924 UTC (Fig. 8c), the tracks of the two stormsreveal the distinct deviant motion compared to the initial path ofthe parent cell in Fig. 8a. Direction of motion of the LM stormhas been from 200 0 at 14 knots while the RM storm tracked from 240 0
at 23 knots. Initial parent storm motion (Fig. 8a) was from 225 0
at 16 knots. Thus, the motion and speed of these two storms is inexcellent agreement with the conceptual hodograph in Fig. 7. TheLM storm was slower and slightly more dominant (per the moredeviant motion) than the faster moving RM storm.
Fig. 8d exhibits the storm-relative velocity display at the1.5 0 elevation angle at 1826 UTC. Close examination revealscyclonic radial shear of approximately 20 m s~ on the right flankof the reflectivity maximum of the RM storm (compare with Fig. 8b).Much weaker anticyclonic radial shear (-14 m S·l) is evident on theleft flank of the LM storm. Radial divergence is also evident,centered on the reflectivity maximum of the LM storm. Once again,this arrangement agrees quite well with the numerical modeldepiction of a left-moving anticyclonic updraft and a right-movingcyclonic updraft under moderate to strong unidirectional verticalwind shear (Fig. 1a,b), though the magnitude of the radial shearsare not that strong.
At 1924 UTC, the WSR-88D indicated a mesocyclone on the rightflank of the LM storm. This pattern was associated with the rightside of a strong zone of radially outbound winds centered on the LMreflectivity maximum (not shown). Thus, the cyclonic mesocyclonewas indicated by the mesocyclone algorithm on the right flank whilenearly as strong anticyclonic radial shear persisted on the leftflank. In the conceptual framework (Fig. 1b), this pattern wouldcorrespond to the anticyclonic updraft and the cyclonic downdraftof the LM storm. The more proper position, however, of thecyclonic downdraft would be centered on the low-level reflectivitymaximum, not the right flank.
After 1924 UTC, the LM storm began to dissipate. The RM stormmerged with the slower moving cells to the northeast (seen in Fig.8c) and formed a small line with a very short bowed-out portion.Near the time of merger, one inch diameter hail was reported nearGrasmere, Idaho, which verified a severe thunderstorm warning thatwas issued earlier for the splitting storm system. No otherverif ication was possible due to the sparse population in southwestIdaho.
Summary and Conclusions
The splitting storm system on 27 May 1994 agreed well withnumerical model simulations of storms initiating in unidirectionalvertical shear. The CAPE and vertical shear were marginal forsupercellular development and splitting storms. Neither celldisplayed strong evidence of supercellular characteristics such asan inflow notch, an obvious weak echo region, or strong andpersistent rotation. Identification of inflow into each of thestorms was difficult to determine due to the distance of the stormsfrom the radar (center of the beam was at 15 Kit ASL at 0.5 0
slice). On the other hand, the storms were well organized, lasting

for one and a half to two hours. Both storms also exhibited weakerrotational signals which were qualitatively similar to patternsexpected by numerical simulations. Several other storms in thearea were much more pulse-like and weaker (in terms ofreflectivity), dissipating within thirty minutes to one hour. TheLM storm was more quasi-steady, but both the LM and RM storms wentthrough pUlsing periods appearing similar to organized multi-cellstorms at times. In summary, it would be quite difficult tocategorize these storms.
Several important points are brought to light by this study:
• Boundary-layer winds are difficult to determine in complexterrain and this creates difficulties in determining the lowlevel vertical wind shear on the hodograph.
• Conceptual model features do appear from time-to-time and canbe captured by the 880, though complicated variations arelikely to be common. Being familiar with these conceptualmodels can help to focus the meteorologist's attention on themore important storms and can help him/her to understand thestructure and evolution of the storms occurring in the "realworld" •
•• Terrain features could have easily influenced the initiation
and evolution of the splitting storm along with othermesoscale forcing not resolvable on current operationalmodels. Thus, it cannot be said for certain that theevolution of this system was completely due to dynamicsfeatured in the three-dimensional models.
• 0-3 Km storm-relative helicity was difficult to assess due tothe questionable low-level shear profile in the vicinity ofthe thunderstorms. It seems more appropriate to concentrateon sfc-6 Km shear and the shape of the hodograph in complexterrain.

•
References
Klemp, J.B., 1987: Dynamics of tornadic thunderstorms. Ann. Rev.Fluid Mech., 19, 369-402.
Klemp, J.B. and R.B. Wilhelmson, 1978a: The simulation of threedimensional convective storm dynamics. J. Atmos. Sci., 35,1070-1096.
__, and ,1978b: simulations of right- and left-movingstorms produced through storm splitting. J. Atmos. Sci., 35,1097-1110.
Weisman, M.L. and J.B. Klemp, 1982: The dependence of numericallysimulated convective storms on vertical wind shear andbuoyancy. Mon. Wea. Rev., 110, 504-520.-'
__, and 1984: The structure and classification ofnumerically simulated convective storms in directionallyvarying wind shears. Mon. Wea. Rev., 112, 2479-2498.
__, and ,1986: Characteristics of isolated convectivestorms. Chapter 15, Mesoscale Meteorology and Forecasting,P.S. Ray, editor, Amer. Meteor. Soc., Boston, MA, 331-358.
Wilhelmson, R. B., and J. B. Klemp, 1978: A numerical study of stormsplitting that leads to long-lived storms. J. Atmos. Sci.,35, 1974-1986.

Or---~--
u(a)
v
2.5 5
,,,
B--</~ " , , ...
fi
(b)
Figure 1. Schematics of storm splitting. (a) Updraft evolution inmoderate to strong wind shear for unidirectional wind shearprofile. Hodograph on left shows unidirectional shear to 5 KID.Circles on right depict updrafts with paths shown by dotted lines.Early stage is shown by single updraft on left with mid-levelmesolow pressure on each flank (L). Mature phase on right exhibitstwo mesolows with the left/right moving storms turninganticyclonically/ cyclonically. Barbed lines are surface gustfronts. (b) shows splitting of updraft as downdraft bends vortextubes. Circular arrows depict the two pairs of cyclonic (+) andnticyclonic (-) mid-level circulations. The "left-mover" is shownn the right side of the schematic (anticyclonic on outside flank
in region of updraft). (For further details see Klemp, 1987).

~
I I
J .'-7:'" : ./ ~ "1.. b I .
_·... _:~....r...-_-_.:....--_::,~::\~,{~L ~_~~~=.~~~:~
~
I
III
Figure 2. NGM 06 hour forecast of 500 rob geopotential height(solid) and absolute vorticity (dashed) valid at 1800 UTC 27 May1994. Heights in dam at 60 m intervals . Vorticity at 2X10⁻⁵ S-l •
• '~ :_-.. ~~,~// - ~.,~ )iJ4.f \~B.',) y'" ~ :~"-----.~, ~- ,. \ " ~ -', '(. / -"f -~' l. ( ...., " II .~
____ (' , \ ~-\ l
___ a (_'~''0 u:"~··c.'_~';~;:'C~::'-_~_::~:~: ~,~~/ • I ' " ~-~-! '._
./ IPa !t ,,' ~ - a I '-
-"f J \ . ,..' !
-~/ ~ (:-.0.... .\.. ~ .:.~-~..__ .r-. ...•~_ J .:::: =--;\ '----\ . \E~.. a ~U (-_.:\ '\."-' ~-\.:- I ~ 0::., . . ~ l~~'.~_;~=-=-_-:"~__ ...r/_. _____ __'
Figure 3. NGM 06 hour forecast of layer-averaged Q-vectordivergence valid at 1800 UTC 27 May 1994. Divergence of Q is solidand convergence of Q is dashed. Layer-average is centered at 500Mb and extends from 700 to 400 mb. Contours at 4X10-ls mb- l 5.
3•
~static stability is not involved in calculation.)

. .-.-'" / ..___ II'
~
. I. l-i
.!
il L __., ....-i.I' 'r---I . 0" -3 •
_ • L '.~ _,.~ • _ • ._L
Figure 4. NGM 06 hour forecasted lifted indices valid at 1800 UTe27 May 1994. contoured in 3 0 intervals.
20
30
40
50
70
as
fgg tz::::::====~~:::::::::==::::::2=====::z::s::====:::z::=====t::§:;;;:::::::==:::::::2===:::::::J-20 -~O 0 ~O 20 30 40 50
LEFT-EDIT LEVEL RICHT-RE-DRAW CHART
Figure 5. Thermodynamic profile for southwest corner of Idaho atA1800 UTC 27 May 1994. Shaded is positive area proportional to.upward parcel motion. Approximate latitude/longitude for this
modified sounding is 42.0/117.0.

180I
090--+--270I
360-,... 56
,.........-------------......;.;....-'----------1 D1 / 65/27/94 / 18Z------r-=--~-...;.....-.,-..MOl) [F (Ell
1~4 70
SFC - 7000 1ft
LEFT - EDIT MOTION RIGHT - RE-])RAW -i
Figure 6. Hodograph at 1800 UTC 27 May 1994 for southwest cornerof Idaho. Speeds are in knots. vertical intervals (marked by opencircles) are 0.5 Km apart starting at 0.8 Km at surface, then 1.0,1.5, 2.0, etc. The first two levels can be ignored since surface
~iS above these levels (Boise sounding was used as first guess).
>
C"') cr:--.,',,
Figure 7. Conceptual hodograph with motion of split storms (L andR for left/right movers) relative to unidirectional vertical windshear. Heights in Km. Thin solid vectors depict ground-relativewinds. Thin dashed vectors show ground-relative storm motions.
~Thick vectors are the hodograph. (from Weisman and Klemp, 1986).WHodograph has been rotated by 90° counterclockwise to have a
similar orientation with figure 6.
«" '.
-I) ~.J '/ H'
"':JIIII
.....
.::,10
O~t~D JJi t·lD
I:' 5.J
HJ 11J15 15213' 20.')1:' 25'- "_I
30~ 31335 354£1 41345 4550 5055 1:'1:',_1._,60
O~~'/H613
65 -I:'tlo_'70 7075 71:', .J
C!UAD 1 MAG=4>~
RDA:KC8X 43/29/27N3142 FT 116/14/132Wt'lODE A / 21t'lA>~= 45 D8ZOI.)L: ST
OUAD 2 t'1AG=4>::RDA:KCBX 43/29/27N3142 FT 116/14/02Wt'lODE A / 21MAX= 52 D8ZI)I..JL: ST
OUAD 3 MAG=4XRDA:KCBX 43/29/27N3142 FT 116/14/02WMODE A / 21t'1A::<:= 61 DBZOI..JL: ST
HARDCOPY REQUESTACCEPTED
-5-1
[1
5 Q15 R 2314 R113 PROD RCVD' SRM RPS22 KCBX 2314 3.430 13/2319 ARCHIVE413 UNIT 1 READ DONE513 HARDCOPYRF
t~D
- 5011'------ _-40-313-22-113
. 54 ~H1:::2t·H1
14 KT
•-I:'( ,_I
124 NM .54 NM RES REL UEL MAP 56 SRM 124 NMCNIR 195DEG 82NM OS/27/94 1B:26 CNTR 195DEG
ELEU= 1.5 DEG SRM:232DEG
JIIIIIDliII124 NM .54 NM RES BASE REF 19 R 124 NM .54 NM RESCNTR 195 DEG :3 2 t·m 0 5 / 2 7 ...-9 4 1:::: 2 6 CtH R 19 5 DEG :=: 2~m I-::C""-IL-:-'IA'-;'[=-1-4-:-----:-:t1,..,-A-=G,-=-:4,..,->'=-:-
ELE,...:-IJ_=_--=0'-"'--i5;:-.:[:..:'E;:..G=----------._r-lI_.-----,!RDA: KCB:<: 43/29/2 7 t·~3142 FT 116/14/02W
oJ t'10DE A / 21• 4 t'lAX= -42 KT 39 KT
BASE REF 1':' ROS/27/94 1B' 132ELEI.)= 0.5 DEG
~.BASE REF 19 R135/27.··.. 94 19' 24ELEI.)= 0 . 5 DEG