a statewide archaeological predictive model of pennsylvania: lessons learned
TRANSCRIPT

PennsylvaniaPredictive Model:Lessons LearnedMatthew D. Harris, AECOM - Burlington, [email protected]

FHWA Statement
“The contents of the report reflect the views of the author(s) who areresponsible for the facts and accuracy of the data presented within. The
contents do not necessarily reflect the official view or policies of theDepartment or FHWA at the time of publication.”
Report available at: www.penndotcrm.org

“Remember that all models arewrong; the practical question ishow wrong do they have to beto not be useful.”~ George E. P. Box, 1987
Organization of talk
• Introduction to PA Model
• Data lessons
• Methodological lessons
• Policy lessons
• Concluding observations

Pennsylvania PredictiveModel

PA Model Specs
• 45,293 square miles
• 1 billion raster cells
• 2 million site-present cells
• 18,226 pre-contact sites
• 132 geographic study areas
• 528 individual models
• 93 model variables
• 102 billion cells processed
• Random Forest, MARS, and Stepwise
Logistic Regression models
Archaeo “Big Data”
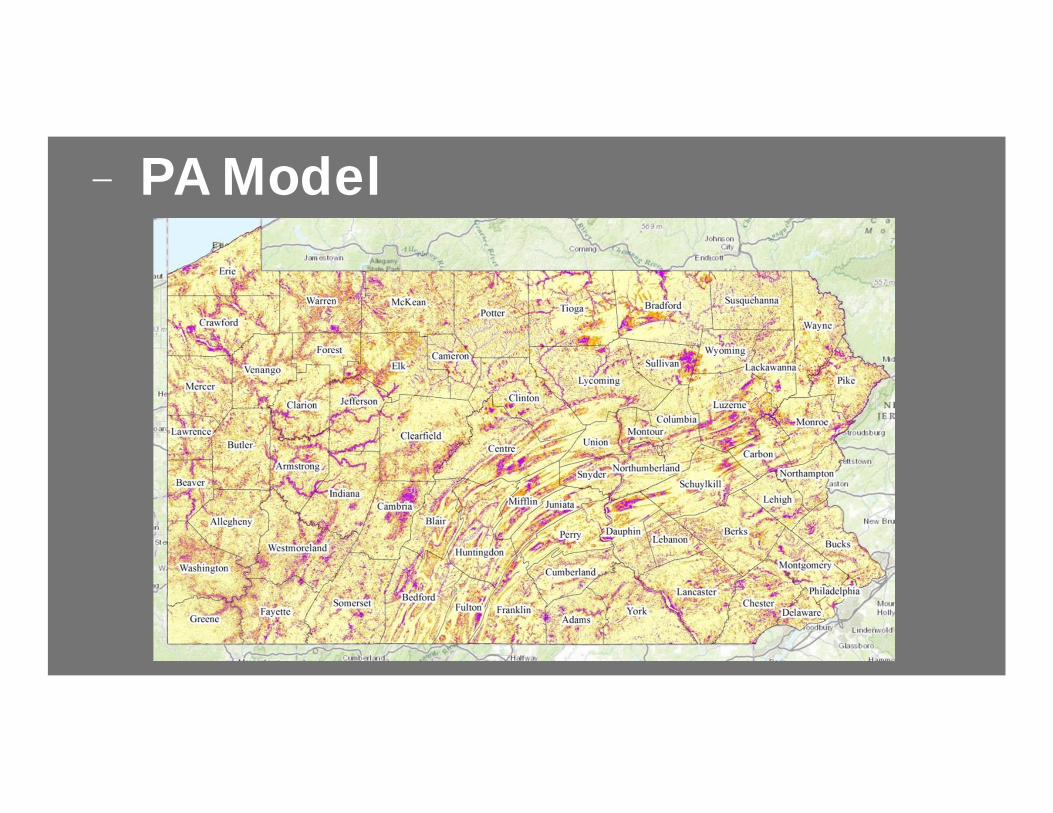
PA Model

PA Model incomparison

PA Model incomparison
DATA Lessons Learned
• Unique characteristics of archaeological data
• Representation of archaeological data
• Archaeological site prevalence
• Covariates and correlation
• Dealing with uncertainty
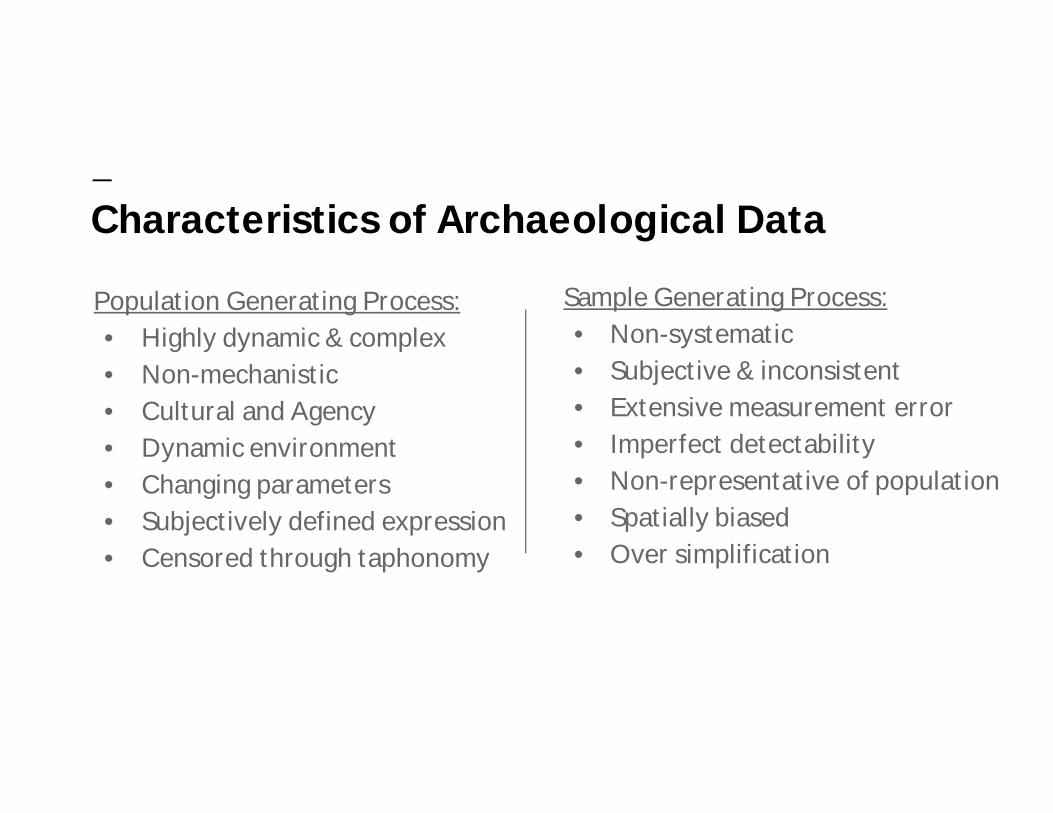
Characteristics of Archaeological Data
Population Generating Process:
• Highly dynamic & complex
• Non-mechanistic
• Cultural and Agency
• Dynamic environment
• Changing parameters
• Subjectively defined expression
• Censored through taphonomy
Sample Generating Process:
• Non-systematic
• Subjective & inconsistent
• Extensive measurement error
• Imperfect detectability
• Non-representative of population
• Spatially biased
• Over simplification

Data Representation
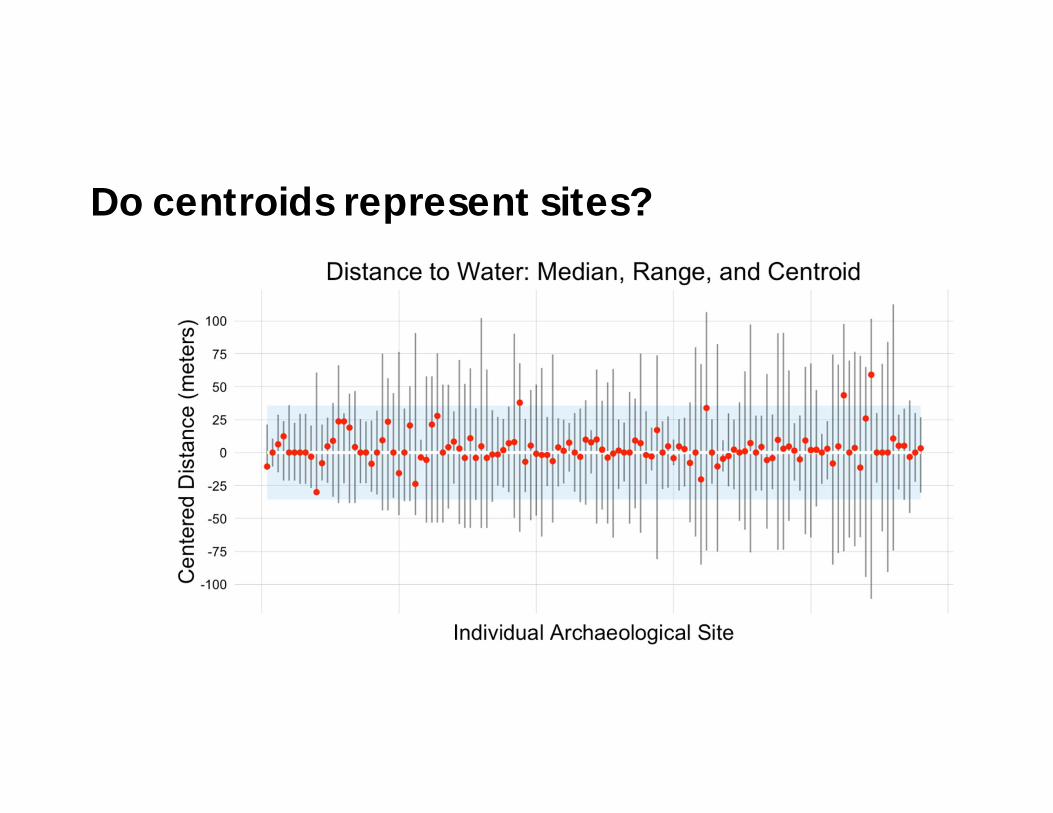
Do centroids represent sites?

BackgroundSamples and
model varianceHow many non-site samples to
use?
Background gif
Model uncertainty

Quantifying Uncertainty
Logistic regression (Bayesian GLM)

Quantifying Uncertainty
95% Credibility Interval

Quantifying Uncertainty
500 simulated plausible models
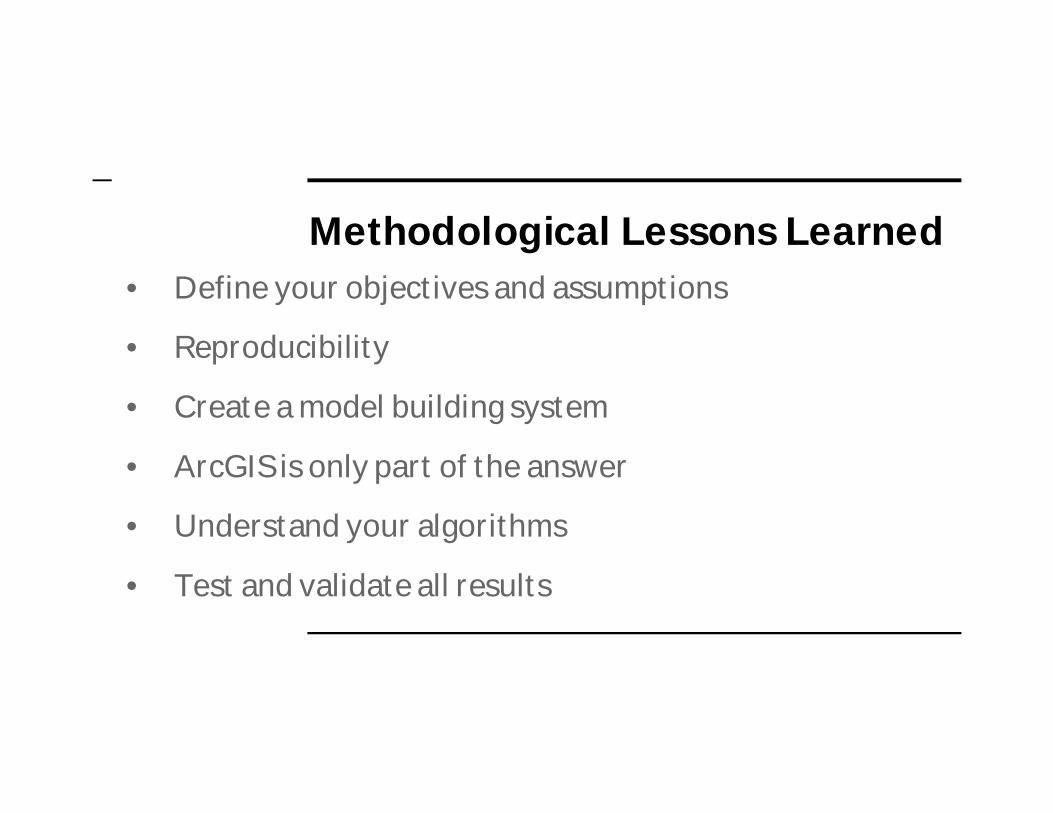
Methodological Lessons Learned• Define your objectives and assumptions
• Reproducibility
• Create a model building system
• ArcGIS is only part of the answer
• Understand your algorithms
• Test and validate all results

Reproducibility

Reproducibility and Accountability
www.rstudio.com
www.python.org
www.esri.com
aws.amazon.com
code example:
pseudo-code example:
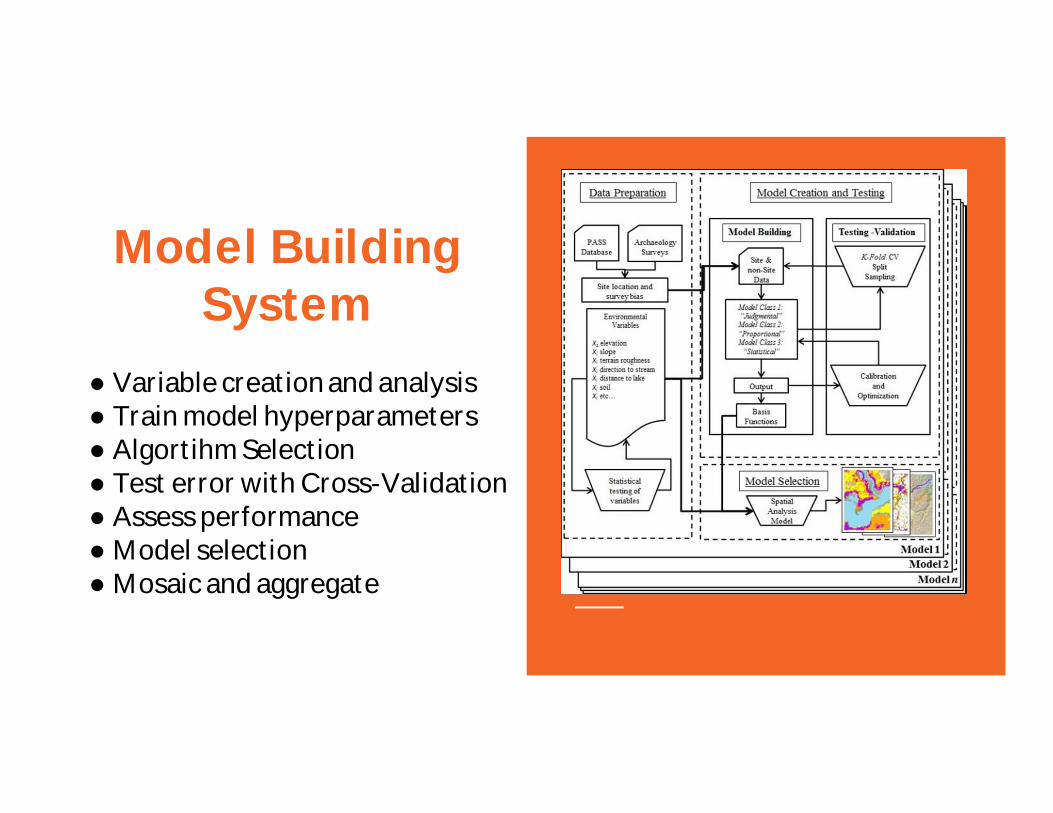
Model BuildingSystem
● Variable creation and analysis● Train model hyperparameters● Algortihm Selection● Test error with Cross-Validation● Assess performance● Model selection● Mosaic and aggregate
Validation and errorDoes this model predict new sites?

“The generalization performance of alearning method relates to its predictioncapability on independent test data.” ~ Hastie et al.(2008)
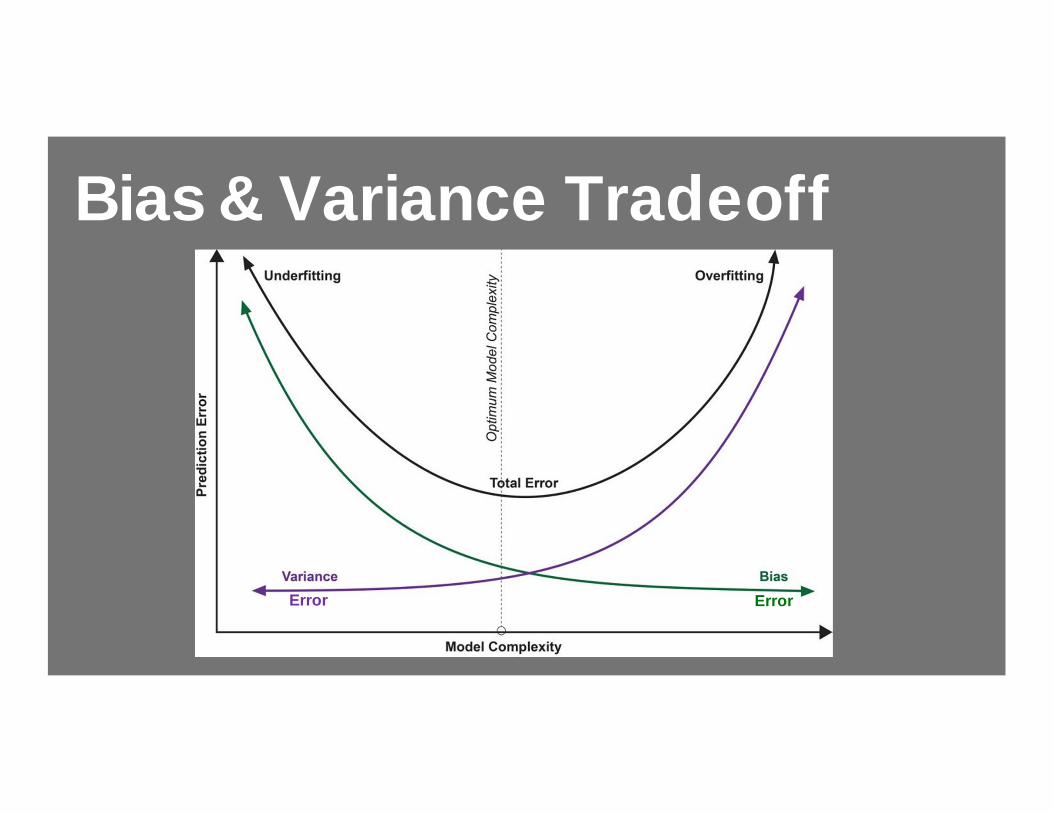
Bias & Variance Tradeoff
ErrorError
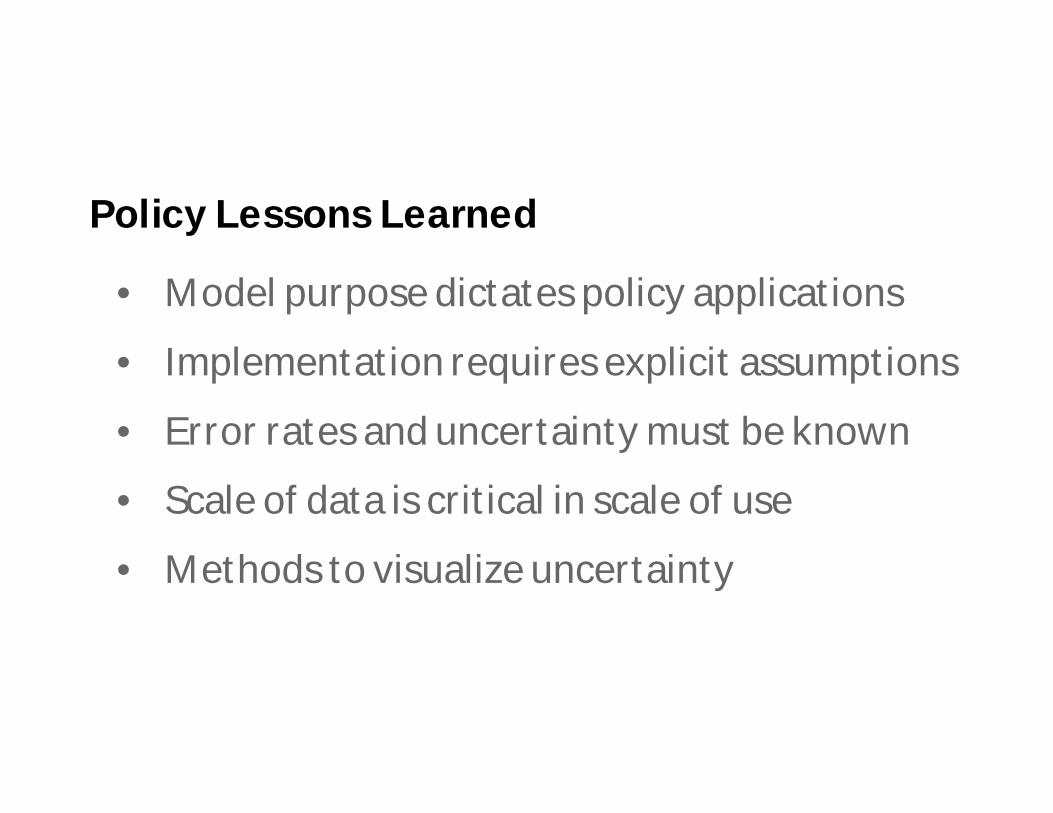
Policy Lessons Learned
• Model purpose dictates policy applications
• Implementation requires explicit assumptions
• Error rates and uncertainty must be known
• Scale of data is critical in scale of use
• Methods to visualize uncertainty

How it all works...
PURPOSE ASSUMPTIONS METHODS
ALGORITHMS /MODELS
INTERPRETATIONPOLICY

Lessons learned
ReproducibilityAccountability in all aspects of model building
Clear and understandable assumptions

ValidationTest predictions on independent data to assess error
Balance Models to achieve appropriate generalization
UncertaintyUnderstand and control for sources of uncertainty
Communicate uncertainty in text and visually
PurposeAssess all aspects of a model relative to its purpose
Policy and implementation are based on model purpose
Not all doom and gloom!
• Face modeling issues head-on
• Model for our unique data
• Standardize our approaches
• Formalize our theory
• Compare our results

THANKYOU!!!
@md_harris
github.com/mrecos
matthewdharris.com
www.penndotcrm.orgReport: