a stepped-bar apparatus for thermal resistance...
TRANSCRIPT
Dakotah R. Thompson
Sameer R. Rao
George W. Woodruff School
of Mechanical Engineering,
Georgia Institute of Technology,
Atlanta, GA 30332
Baratunde A. ColaGeorge W. Woodruff School
of Mechanical Engineering,
Georgia Institute of Technology,
Atlanta, GA 30332;
School of Materials Science Engineering,
Georgia Institute of Technology,
Atlanta, GA 30332
A Stepped-Bar Apparatusfor Thermal ResistanceMeasurementsA stepped-bar apparatus has been designed and constructed to characterize the thermalresistance of materials using steady-state heat transfer techniques. The design of the ap-paratus is a modification of the ASTM D5470 standard where reference bars of equalcross-sectional area are used to extrapolate surface temperatures and heat flux across asample of unknown thermal resistance. The design modification involves intentionallyoversizing the upper reference bar (URB) of the apparatus to avoid contact area uncer-tainty due to reference bar misalignment, which is difficult to account for, as well as thehigh cost that can be associated with equipping the apparatus with precise alignmentcontrols (e.g., pneumatic alignment). Multidimensional heat transfer in the upper refer-ence bar near the sample interface is anticipated using numerical modeling. The result-ing nonlinear temperature profile in the upper reference bar is accounted for by fitting asecond order regression line through thermocouple readings near the sample interface.The thermal resistances of commercially available thermal gap pads and thermalpastes were measured with the stepped-bar apparatus; the measured values were in goodagreement with published results, and exhibited a high degree of reproducibility. Themeasurement uncertainty of both the standard and stepped-bar apparatus decrease withincreased thermocouple precision. Notably, the uncertainty due to reference bar mis-alignment with the standard apparatus becomes more pronounced as thermocouple pre-cision and the number of thermocouples increases, which suggests that the stepped-barapparatus would be especially advantageous for enabling accurate, high-precision meas-urements of very low thermal resistances. [DOI: 10.1115/1.4025116]
Introduction
Because the burgeoning demand for smaller electronics isincreasing device and component densities in the semiconductorindustry, thermal management of these electronic packages isbecoming an increasingly important issue. Thermal interfacematerials (TIMs) with a high thermal conductance are necessaryto cool electronic devices to protect them from overheating. Asthe power density of electronic devices becomes larger, there is agrowing need for higher-performance TIMs and tools to charac-terize them with the degree of reproducibility demanded in indus-try. Inaccurately characterized TIMs may lead to failure ofelectronic devices at an unacceptably high rate. Thus, improvedmeasurement reproducibility will save companies in the electron-ics industry, which frequently tests TIMs, time and money. As acompounding factor, the advent of new materials has introduced aclass of high-performance TIMs [1–5] that are difficult to charac-terize properly because they have thermal resistances lower thanthe uncertainty floor of commercially available measurementtools. Research to improve these characterization tools is criticalin order for high-performance TIMs to be successfully introducedinto the market.
Thermal conductivity and interface resistance of materials arecommonly measured using steady-state, 1D heat transfer techni-ques [6–8]. A standard experimental approach based on ASTMD5470 [9] employs an apparatus that conducts heat longitudinallythrough two well-characterized reference bars that sandwich asample of unknown thermal resistance; the thermal resistance ofthe sample is measured using simple heat conduction equations.There have been several studies in recent years to improvethe measurement uncertainty of the standard 1D reference bar
apparatus. Savija et al. [10,11] designed and constructed a 1D ref-erence bar apparatus that could characterize commercially avail-able graphite pads with an uncertainty between 2.2% and 13.6%.Kearns [12] developed an apparatus that could measure thermalresistances as low as 3 mm2 K/W with an uncertainty of 10%.Most notably, Kempers et al. [13] designed a 1D apparatus with ameasurement uncertainty of 2.7% for thermal resistances as lowas 4.7 mm2 K/W. Although these studies have effectively reducedthe measurement uncertainty of the 1D reference bar apparatus,few improvements regarding reference bar geometry have beenconsidered. Further, the issue of measurement reproducibility hasreceived little attention in the literature, yet is a critical issue inpractice when numerous samples must be tested to reach firmconclusions about the data.
The standard approach to calculate the specific thermal resist-ance of a sample uses Fourier’s Law, given in the followingequation:
R ¼ DT
QAc (1)
where DT is the difference between the upper interface tempera-ture and the lower interface temperature of the sample, Q is theaverage heat rate through the sample, and Ac is the effective con-tact area between reference bars and sample. All recent studies of1D reference bar techniques to measure thermal resistance utilizereference bars of equal cross-sectional area [11–13], which makesreference bars difficult to align with each other and the sample.Any misalignments reduce the effective contact area between thesample and the reference bars (Acontact). Because such misalign-ments often go undetected and are difficult to control, significanterrors can propagate through the system, making reproduciblemeasurements difficult to achieve.
The values of the interface temperatures and the heat rate inEq. (1) are calculated by performing a least-squares regression of
Contributed by the Electronic and Photonic Packaging Division of ASME forpublication in the JOURNAL OF ELECTRONIC PACKAGING. Manuscript received March 15,2013; final manuscript received June 24, 2013; published online August 13, 2013.Assoc. Editor: Mehmet Arik.
Journal of Electronic Packaging DECEMBER 2013, Vol. 135 / 041002-1Copyright VC 2013 by ASME
Downloaded From: http://electronicpackaging.asmedigitalcollection.asme.org/ on 01/21/2014 Terms of Use: http://asme.org/terms

thermocouple readings in each reference bar. The temperatureprofile through each reference bar in a conventional, well-insulated set-up is linear, allowing heat flux and surface tempera-tures to be determined by linear regression of thermocouplereadings in each reference bar. The slope of the regression line inthe upper reference bar is used with simple heat conduction equa-tions to determine the heat rate into the system. Equation (2) givesthe specific formulation of the heat conduction equation used todetermine the heat rate
Q ¼ �kAref
dT
dz(2)
where k is the thermal conductivity of the reference bar, Aref isthe cross-sectional area of the reference bar, and dT=dz is thetemperature gradient through the reference bar. This procedureis used in the lower reference bar (LRB) to calculate the lowerinterface temperature at the sample and the heat rate leavingthe system. To determine the interface temperature at the topof the sample, this same regression line is extrapolated to theinterface.
To improve the reproducibility and accuracy of the 1D refer-ence bar apparatus outlined in the ASTM D5470 standard anddescribed briefly above, we developed a modified “stepped-bar”design with an oversized URB. This modified design allowsmachining errors and bar misalignments without a reduction inthe contact area between the upper reference bar and the sample.This system requires the operator to only align the sample tothe LRB rather than aligning the sample to both reference bars,obviating the need for expensive bar alignment mechanisms. As aconsequence of this modification, a constriction to heat flow isanticipated between the upper reference bar and the sample, whichcan be accounted for by the counter measures presented in thisstudy.
Numerical Analysis of Stepped-Bar Design
The temperature profile in the upper reference bar is expectedto be nonlinear near the sample interface in the stepped-bar appa-ratus because of an area constriction from the upper reference barto the sample. A numerical heat transfer model of the stepped-barapparatus confirmed that the temperature profile near the sampleinterface is indeed nonlinear in this design. This 2D heat transfermodel was generated in MATLAB and employs a finite-difference
method to approximate heat conduction between nodes with aspacing of 0.05 mm. Heat transfer in the stepped-bar designshould be modeled as 3D in a rigorous treatment; however, the 2Dmodel used here is sufficient for elucidating the predominateeffects of the stepped design on the temperature near the sampleinterface. A simulated center-line temperature profile in the upperreference bar is shown in Fig. 1.
The 2D MATLAB model of the stepped-bar apparatus used to gen-erate Fig. 1 sets the thermal conductivity of both reference bars tothat of Al 2024 (k¼ 138 W/m K). The upper reference bar has awidth of 1.4 cm and the lower reference bar has a width of 1 cm.The set point temperatures at the top of the URB and bottom ofthe LRB were maintained at 105 �C and 15 �C, respectively. Zeroheat flux (q00) was maintained as the side boundary condition,which assumes perfectly insulated reference bars. The modelwas run with a 0.5 mm thick test sample with various thermal con-ductivity values (K_sample) between 1 and 150 W/m K. Thesethermal conductivity values correspond to TIM samples withresistances between 500 and 3.3 mm2 K/W.
Figure 1 shows that the heat spreading effect becomes morepronounced as the thermal conductivity of the sample increases orthe resistance of the TIM decreases relative to that of the referencebars. Fitting a linear curve to thermocouple readings in the URBof the stepped-bar apparatus would systematically overestimatethe heat rate and produce higher measurement uncertainty becausethe residual of the regression line would be relatively large.
Based on the numerical analysis, the curve fit of thermocouplereadings through the upper reference bar can be divided into a firstorder fit through the top of the bar and a second order fit throughthe bottom of the bar to account for nonlinear effects. The firstorder curve fit in the top of the URB determines the heat rate intothe URB. The second order fit in the URB near the sample inter-face extrapolates the upper interface temperature of the sample.The data in Fig. 1 indicate that the temperature profile in the URBbecomes nonlinear within about 5 mm of the sample interface,although this result is only valid for the particular geometry of thestepped-bar set-up presented in this study. The inset of Fig. 1(b)shows that the temperature profile in the lower reference barremains linear, so a single first order curve fit is appropriate todetermine the heat rate and interface temperature correspondingto the LRB. The temperature profile through the sample alsoappears to be linear along the centerline based on this MATLAB
model, justifying the validity of Eq. (1) to calculate the samplespecific thermal resistance.
Fig. 1 (a) Schematic of model geometry used in 2D heat transfer model. Constant tempera-ture boundary conditions at top of URB and bottom of URB. Zero heat flux boundary condi-tions on all sides of stepped-bar apparatus. Simulated temperatures in URB recorded alongdotted line. (b) Simulated center-line (see dotted line in Fig. 1(a)) temperature profile in URBof stepped-bar apparatus.
041002-2 / Vol. 135, DECEMBER 2013 Transactions of the ASME
Downloaded From: http://electronicpackaging.asmedigitalcollection.asme.org/ on 01/21/2014 Terms of Use: http://asme.org/terms

Stepped-Bar Apparatus Details and Measurement
Procedure
The designed and built stepped-bar apparatus is shown inFig. 2. Two identical sets of stepped reference bars weremachined from stainless steel 303 (k¼ 15 W/m K) and aluminumalloy 2024 (k¼ 138 W/m K). According to ASTM standardE1225-09 [14], heat shunting through the insulation around thereference bars occurs when the thermal conductivity of the sampleis much less than the thermal conductivity of the reference bars.To avoid heat-shunting errors, the stainless-steel reference barswere necessary to characterize low conductivity or high resistancesamples and the aluminum alloy reference bars were required tocharacterize high conductivity or low resistance samples. As such,the performance of the reference bar apparatus could be character-ized for materials over a wide range of thermal conductivity orthermal resistance.
Eight ungrounded T-type thermocouples (Special Limits ofError, 60.5 K) of diameter 0.020 in. were inserted into the upperreference bar along its length. Four T-type thermocouples of di-ameter 0.020 in. are inserted into the lower reference bar along itslength. A 16-channel temperature recorder (SR 630 StanfordInstruments) was used to acquire the temperature data. Wemachined a total of 11 thermocouple holes in the upper referencebar and 9 thermocouples in the lower reference bar. These addi-tional holes allow thermocouples to be repositioned and extrathermocouples to be added to the apparatus when necessary. Eachthermocouple hole is 0.022 in. in diameter and is machined intothe reference bars at a depth equal to half of the bar width. Posi-tions of each thermocouple hole, as well as the relevant featuresof the set-up are displayed in Fig. 2.
The mechanical transducer, comprised of the threaded rod andsteel hand wheel, applies pressure to the sample under test. Theuse of a mechanical transducer can greatly lower the cost (�50%)
Fig. 2 Stepped-bar thermal measurement apparatus. (a) Photograph of apparatus with screwpress in place. (b) Schematic of apparatus (Two 0.5 in. thick aluminum base plates (a, b), eachmeasuring 12 in. 3 12 in. Four vertical steel rods (c) of 0.5 in. outer diameter. Bottom base platemounted on rubber feet (d) to provide extra stability. Third plate (e) mounted in between baseplates using Rulon sleeve bearings and the steel rods as guide rails. Assembly connected tomechanical transducer (f) comprised of 3/8 in.–12 size acme threaded rod, acme nut and a steelhand wheel. Load cell (g) of maximum load 500 N positioned between free plate and thermal testsections (h, i) to monitor the pressure being applied to the sample. Cartridge heater (150 W120 V) embedded in a block (j) of oxygen free high conductivity copper (OHFC) and connectedto a constant temperature PID controller to maintain the set point and the heat rate through thesystem. OFHC block (k) machined to allow coolant (water) to flow through it. Blocks j and kserve as the high and low temperature reservoirs, respectively). (c) Annotated drawing of URBwith thermocouple positions (dimensions in mm). (d) Annotated drawing of LRB with thermo-couple positions (dimensions in mm).
Journal of Electronic Packaging DECEMBER 2013, Vol. 135 / 041002-3
Downloaded From: http://electronicpackaging.asmedigitalcollection.asme.org/ on 01/21/2014 Terms of Use: http://asme.org/terms

of the entire apparatus in comparison to a stepper motor orpneumatic-based loading system (see section on cost comparisonfor more details). Because instabilities of the threaded rod intro-duce imprecision in aligning the upper reference bar with thelower reference bar, the upper reference bar is oversized to ensurethat these misalignments do not reduce the contact area of thesample and introduce errors into the thermal resistance measure-ments. The URB has a square cross-sectional area measuring1.4 cm to a side. The LRB has a square cross-sectional area meas-uring 1.0 cm to a side. The URB and LRB are 1.5 cm and 3.0 cmlong in the axial direction, respectively.
Heating of the system is delivered by a cylindrical cartridgeheater that provides a constant temperature boundary condition atthe top of the URB. The heater power is controlled with a constanttemperature proportional-integral-derivative (PID) control device.The top thermocouple at the position above U1 in Fig. 2(c) is usedfor the PID control of the cartridge heater so that the upper setpoint temperature remains constant during steady-state operation.The cooling of the heat sink below the LRB is realized by the useof a constant temperature coolant recirculator.
The heat rate into the URB is measured by fitting a first ordercurve through four thermocouple readings corresponding tothermocouple positions U1, U2, U3, and U4. The slope of this linegives the temperature gradient along the centerline of the URB.Knowledge of the reference bar thermal conductivity and cross-sectional area are used with Equation (2) to determine the heatrate into the URB. Similarly, a first order curve is fit through thethermocouple readings in the LRB, corresponding to thermocou-ple positions L1, L2, L3, and L4, to measure the heat rate out ofthe sample. This first order fit is also used to extrapolate the lowerinterface temperature of the sample.
The upper interface temperature is calculated by fitting asecond order curve through the thermocouple readings in theURB to account for heat constriction. Specifically, the secondorder curve is fit through thermocouples corresponding tothermocouple positions U4, U5, U6, U7, and U8 and the interfacetemperature is extrapolated from this curve. This curve-fitting pro-cedure in the URB is shown graphically in Fig. 3 for a representa-tive measurement.
The error bars in Fig. 3 depict the uncertainties of the T-typethermocouples as well as the uncertainties in their positions. Thesecond order curve fit was applied to the nonlinear portion of thetemperature profile in the URB, which was accurately predicted tobe within 5 mm of the sample interface by the numerical analysisdescribed previously (Fig. 1).
Both reference bars were well-insulated on each side with acustom insulation system, shown in Fig. 4. The insulation systemis comprised of two halves of a nylon foam block (not shown) thatenclose the reference bars. The reference bars are surrounded by3.5 in. of nylon foam on each side. Additional layers of fiberglassinsulation were added to each surface of the nylon foam halves toprovide additional insulation.
Several commercially available samples were characterizedin the stepped-bar apparatus using aluminum alloy Al-2024(k¼ 138 W/m K) reference bars. The thermal conductivity of theseAl-2024 reference bars was measured using a HotDisk thermalconductivity analyzer. The faces of the reference bars were highlypolished, with an average roughness of 0.5 lm and a flatnessbetween 0.127 and 0.254 lm. A high set point temperature wasmaintained at 105 �C and the chiller set point temperature wasmaintained at 15 �C for all measurements. Samples were measuredunder applied pressures ranging from 50 kPa to 400 kPa. Two dif-ferent thermal pastes were characterized: Arctic Silver 5 andCeramique. A small amount of spacer-grade, soda lime glassmicrospheres (22–25 lm) from Cospheric was added to thesepastes to maintain a constant bond line thickness over the range ofapplied pressures. It was assumed that these spacer beads did notsignificantly affect the measured thermal resistance values becausethey comprise only a small volume fraction of the paste under test.
We also tested the repeatability of the stepped-bar apparatuswith stainless steel SS-303 (k¼ 15 W/m K) reference bars bymeasuring a sample of TC100 thermal gap pad manufactured byStockwell Elastomerics. The manufacturer-specified value of thespecific thermal resistance across the TC100 sample of thickness1.575 mm is 12.1 cm2 K/W [15]. The testing conditions specifiedby the manufacturer are as follows: testing pressure is 690 kPaand mean stack temperature is 100 �C. We measured the TC100sample in the stepped-bar apparatus at the manufacturer-specifiedtesting pressure. The chiller set point temperature was 15 �C.Measurements were taken with upper set point temperatures of70 �C, 140 �C, 160 �C, and 190 �C. For each measurement, thesample was removed from the apparatus and reinserted to accountfor operator error in aligning the sample to the LRB.
Measurement Results
Figure 5 reveals thermal resistance measurements of the ther-mal pastes to be slightly pressure dependent for each sample. A
Fig. 3 Curve-fitting procedure in upper reference bar of modi-fied apparatus. The slope of the blue dashed line is used todetermine the input heat rate. The red dashed-dot curve is usedto extrapolate the interface temperature.
Fig. 4 Cross-sectional view of the custom insulation systemsurrounding the reference bars. Fiberglass insulation is addedto each surface of the nylon foam halves (not seen in thephoto). The photo also shows the thermocouples in their mea-surement positions in each reference bar.
041002-4 / Vol. 135, DECEMBER 2013 Transactions of the ASME
Downloaded From: http://electronicpackaging.asmedigitalcollection.asme.org/ on 01/21/2014 Terms of Use: http://asme.org/terms

minimum thermal resistance of 32 mm2 K/W (614.7%) wasmeasured for Arctic Silver 5 at an applied pressure of 300 kPa.This result agrees closely with a similar study by NREL in 2008[4], which measures the thermal resistance for Arctic Silver 5with a bond line thickness of 23.5 lm to be 30.9 mm2 K/W. TheNREL study used an experimental apparatus based on ASTMD5470 with reference bars polished to 0.5 lm and test pressuresbetween 170 and 340 kPa.
Figure 6 shows the frequency histogram for all measurementsof the TC100 gap pad using the stepped-bar apparatus withstainless-steel reference bars. The average specific thermal resist-ance measurement was approximately 12.09 cm2 K/W. The stand-ard deviation of the eighteen measurements was 0.38 cm2 K/W. Aconfidence interval based on the student’s T distribution suggeststhat 95% of all measurements of the TC100 gap pad fall within6.4% of the mean value. These results imply good repeatability ofthe stepped-bar apparatus under these testing conditions. Like-wise, the manufacturer-specified thermal resistance value of 12.12cm2 K/W falls within this 95% confidence interval, suggestingexcellent measurement accuracy.
There is a slight skew of the histogram in Fig. 6. This skew isthe result of heat loss from the apparatus at the higher set pointtemperatures. Heat losses tend to increase the value of the thermalresistance measurement. These results suggest that there is an
important trade-off to be made when selecting testing conditions.Using higher set point temperatures reduces measurement uncer-tainty because it generates larger temperature drops between adja-cent thermocouples. However, a higher set point temperature alsoincreases heat losses, which adversely affects measurementaccuracy.
Uncertainty Analysis
A rigorous error analysis was performed to estimate how theuncertainties in each measured value propagate through the spe-cific thermal resistance measurement of the stepped-bar apparatus.Table 1 lists the uncertainty of each measured quantity.
The uncertainty of each thermocouple position is equal to thedifference between the radius of the hole and the radius ofthe thermocouple [13]. The uncertainty of the temperature mea-surement is based on the Special Limits of Error for the T-typethermocouples [16]. The error contribution from the SR 630 ther-mocouple reader was assumed to be negligible. The uncertainty inthe thermal conductivity measurement of the reference bars wasdetermined by the precision of the HotDisk thermal conductivityanalyzer [17].
The overall uncertainty of the specific thermal resistance mea-surement is derived from the Kline and McClintock method [18],given generically by the following equation:
Uz ¼
ffiffiffiffiffiffiffiffiffiffiffiffiffiffiffiffiffiffiffiffiffiffiffiffiffiffiffiXn
i¼1
@Z
@xiUi
� �2
vuut (3)
where Ui is the uncertainty of each measured quantity xi. UsingEq. (1) to calculate the specific thermal resistance results in a for-mulation of Kline and McClintock given by
UR ¼
ffiffiffiffiffiffiffiffiffiffiffiffiffiffiffiffiffiffiffiffiffiffiffiffiffiffiffiffiffiffiffiffiffiffiffiffiffiffiffiffiffiffiffiffiffiffiffiffiffiffiffiffiffiffiffiffiffiffiffiffiffiffiffiffiffiffiffiffiffiffiffiffiffiffiAc
QUDT
� �2
þ DTAc
Q2UQ
� �2
þ DT
QUAc
� �2s
(4)
where Ac is the effective contact area between the sample and thereference bars. The value of DT is the difference between the top
Fig. 5 Measured thermal resistance of commercially available thermal paste. Thedashed orange and blue lines estimate the lower bounds of the measured thermalresistances for Ceramique and Arctic Silver 5, which occur at high pressures.
Fig. 6 Frequency histogram of 18 independent thermal resist-ance measurements (red) of TC100 thermal interface material.The sample was removed and reloaded in the system after eachmeasurement. Manufacturer-specified thermal resistance ofTC100 sample was 12.12 cm2 K/W. The dotted red line indicatesthe average value of the thermal resistance measurements.Also shown is the upper set point temperature (blue shadedregion) used in each measurement.
Table 1 Uncertainty of measured quantities
Measured quantity Uncertainty
Temperature 60.5 K (T-type)Thermocouple position 625.4 lmReference bar thermal conductivity (Al 2024) 61.5 W/m K
Journal of Electronic Packaging DECEMBER 2013, Vol. 135 / 041002-5
Downloaded From: http://electronicpackaging.asmedigitalcollection.asme.org/ on 01/21/2014 Terms of Use: http://asme.org/terms
interface temperature and bottom interface temperature. The valueof UDT was calculated using
UDT ¼ffiffiffiffiffiffiffiffiffiffiffiffiffiffiffiffiffiffiffiffiffiffiffiffiffiffiffiffiffiffiffiffiffiffiffiffiffiffiffiffiffiUTint;top
� �2þ UTint;bot
� �2q(5)
where Tint,top is the top interface temperature of the sample andTint,bot is the bottom interface temperature of the sample. Thevalue of Q was calculated as the average value of the heat ratethrough the URB and LRB. The uncertainty UQ was calculatedusing
UQ ¼ffiffiffiffiffiffiffiffiffiffiffiffiffiffiffiffiffiffiffiffiffiffiffiffiffiffiffiffiffiffiffiffiffiffiffiffiffiffiffiffiffiffiffiffiffiffiffiffi0:5UQtop
� �2þ 0:5UQbot
� �2q(6)
where UQtopis the uncertainty of the heat rate in the upper refer-
ence bar and UQbotis the uncertainty of the heat rate in the lower
reference bar. Recall that the heat rate through each reference baris calculated using simple heat conduction equations. Equations (7)and (8) show how the uncertainty of the heat rate through eachreference bar is calculated
UQtop¼
ffiffiffiffiffiffiffiffiffiffiffiffiffiffiffiffiffiffiffiffiffiffiffiffiffiffiffiffiffiffiffiffiffiffiffiffiffiffiffiffiffiffiffiffiffiffiffiffiffiffiffiffiffiffiffiffiffiffiffiffiffiffiffiffiffiffiffiffiffiffiffiffiffiffiffiffiffiffiffiffiffiffiffiffiffiffikAtopUGtop
� �2þ AtopGtopUk
� �2þ kGtopUAtop
� �2q(7)
UQbot¼
ffiffiffiffiffiffiffiffiffiffiffiffiffiffiffiffiffiffiffiffiffiffiffiffiffiffiffiffiffiffiffiffiffiffiffiffiffiffiffiffiffiffiffiffiffiffiffiffiffiffiffiffiffiffiffiffiffiffiffiffiffiffiffiffiffiffiffiffiffiffiffiffiffiffiffiffiffiffiffiffiffiffikAbotUGbot½ �2þ AbotGbotUk½ �2þ kGbotUAbot
½ �2q
(8)
where k is the thermal conductivity of the reference bar, A is thecross-sectional area of the reference bar, and G is the temperaturegradient through the reference bar. Subscripts top and bot refer tothe upper and lower reference bars, respectively. Recall that weobtain the values of Tint,top, Tint,bot, Gtop, and Gbot by performinga least-squares regression of the thermocouple readings in eachreference bar. The uncertainty in these measurements reflects theerror in the thermocouple readings and thermocouple placement,as well as the statistical error related to the residual of the least-squares regression.
A Monte Carlo analysis of the least-squares regression per-formed in each reference bar is used to determine the uncertaintiesUTint;top
, UTint;bot, UG,top, and UG,bot. The Monte Carlo analysis
involves perturbing experimental thermocouple readings and ther-mocouple positions by the standard uncertainty of each measure-ment. Each thermocouple reading is perturbed by a Terror term.The Terror term is generated from a random normal distributionwith a standard deviation of 0.25 K to reflect the uncertainty of theT-type thermocouple readings [16]: we assume that the speciallimits of error of 6 0.5 K for T-type thermocouples is based on a95% confidence interval or twice the standard deviation. Like-wise, thermocouple positions are randomly perturbed by a term
generated from a random distribution with maximum values of625.4 lm. Thus, we generate multiple sets of perturbed data andperform a least-squares regression to each one of these perturbeddata sets. The standard uncertainties UTint;top
, UTint;bot, UG,top, and
UG,top are then calculated by taking the standard deviation of theparameters of the entire set of curve fits. The standard deviationsof the slopes of the linear regression in the URB and LRB deter-mine the values UG,top and UG,top, respectively. The standard devi-ations of the extrapolated temperatures of the second order curvefit in the URB and the linear curve fit in the LRB determine thevalues of UTint;top
and UTint;bot, respectively.
A 2D heat transfer model of a standard reference bar apparatuswas developed in MATLAB to compare the uncertainty of thestepped-bar apparatus to the standard apparatus using the analysistechnique discussed above. The model was used to simulate thetemperature profile through reference bars of equal cross-sectionalarea with varying degrees of reference bar misalignment. Similarto the model used to analyze the stepped-bar design, this finite-difference model used nodes with a spacing of 0.05 mm, and con-sidered all sides to be insulated perfectly. The model also fixes thesample and LRB in perfect alignment so that the contact area isonly reduced because of misalignment of the URB. The sameheater and heat sink set point temperatures used in the 2D analysisof the stepped-bar design were used here. Using these boundaryconditions, the numerical model generates virtual thermocouplereadings that have the same placement as the thermocouples usedin our actual stepped-bar apparatus. As a result, the measurementuncertainty of the stepped-bar apparatus can be compared to thatof a standard apparatus with the same number, placement, andprecision of thermocouples.
To directly observe the effects of reference bar misalignmentwithout considering machining errors, we set the uncertainty UA
of the reference bar cross-sectional area to zero for boththe stepped-bar apparatus and simulated standard apparatus. Forthe standard apparatus, we estimate the uncertainty UAc
of thesample contact area, which results from misalignment of theURB, using
UAc¼ 1
2Abotv (9)
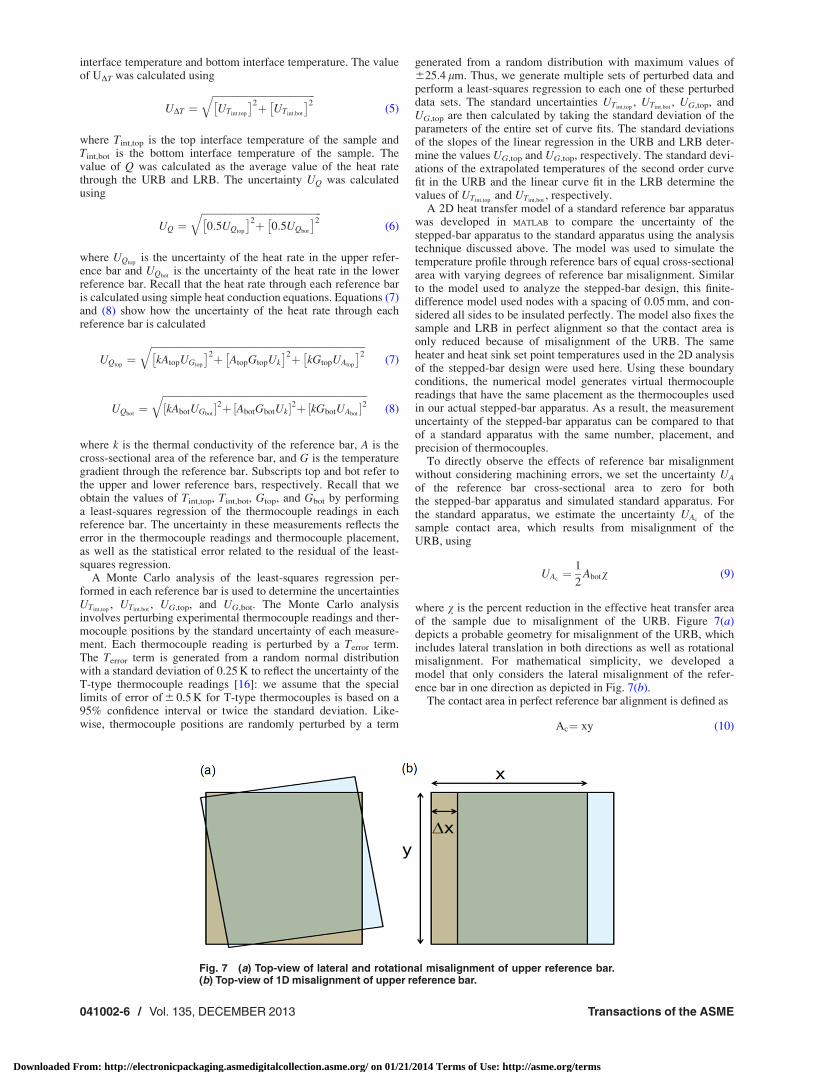
where v is the percent reduction in the effective heat transfer areaof the sample due to misalignment of the URB. Figure 7(a)depicts a probable geometry for misalignment of the URB, whichincludes lateral translation in both directions as well as rotationalmisalignment. For mathematical simplicity, we developed amodel that only considers the lateral misalignment of the refer-ence bar in one direction as depicted in Fig. 7(b).
The contact area in perfect reference bar alignment is defined as
Ac¼ xy (10)
Fig. 7 (a) Top-view of lateral and rotational misalignment of upper reference bar.(b) Top-view of 1D misalignment of upper reference bar.
041002-6 / Vol. 135, DECEMBER 2013 Transactions of the ASME
Downloaded From: http://electronicpackaging.asmedigitalcollection.asme.org/ on 01/21/2014 Terms of Use: http://asme.org/terms

The uncertainty in the contact area is given as
UAc¼
ffiffiffiffiffiffiffiffiffiffiffiffiffiffiffiffiffiffiffiffiffiffiffiffiffiffiffiffiffiffiffiffiffiðyUxÞ
2 þ ðxUyÞ2q
(11)
It is apparent from Fig. 7(b) that the value of Uy is zero. Based ona flat distribution, the value of Ux can be estimated as Dx/2. Thus,the expression for the contact area uncertainty is given as
UAc¼ 1
2yDx (12)
The value of Dx can be expressed in terms of the percent misalign-ment of the upper reference bar to the sample as
v ¼ xy� yðx� DxÞxy
(13)
where v is the percent contact area reduction due to misalignment.After cancelations, Eq. (13) reduces to
v ¼ Dx
x(14)
Equation (9) is recovered by substituting Eq. (14) into Eq. (12). It isimportant to note that this estimation of the contact area uncertaintyonly considers the special case of 1D misalignment. In reality, ref-erence bar misalignment can arise from lateral translation in eitheror both directions, as well as rotational misalignment as shown inFig. 7(a). However, we do not undertake a more rigorous analysisof the contact area uncertainty for all cases of reference bar mis-alignment in this work because establishing the percent reductionin contact area based on 1D misalignment is sufficient to illustratethe effects of misalignment on measurement uncertainty.
The measurement uncertainty for the stepped-bar apparatus wascalculated for various samples, including the graphite pad HT 1220from GrafTech (k¼ 10 W/m K, thickness¼ 0.51 mm) [19]. Themeasurement uncertainty of the standard reference bar apparatusfor the HT 1220 was then calculated using the numerical model. Inthe model, the set point temperatures at the top of the URB and bot-tom of the LRB were 105 �C and 15 �C, respectively. The percentmisalignment of the URB with respect to the LRB and sample wasthen varied from 0% to 18% and simulated thermocouple readingswere generated. Thus, the uncertainty of a standard apparatus couldbe directly compared to the experimental uncertainty of ourstepped-bar apparatus measuring the same graphite pad (HT 1220).The results of the uncertainty analysis comparing the stepped-barapparatus to a standard apparatus are shown in Fig. 8.
In Fig. 8, the solid black line represents the measurement uncer-tainty of the stepped-bar apparatus when T-type thermocouples(60.5 K) are used. The black dashed line represents the measure-ment uncertainty of the stepped-bar apparatus when high-precision thermistors (60.001 K) are used. Similarly, the solidand dashed red lines correspond to measurement uncertainties forthe standard apparatus with T-type thermocouples and high-precision thermistors, respectively: the number and placement ofthese temperature probes is identical to that of the stepped-barapparatus. The uncertainty of the ASTM D5470-06 standard refer-ence bar apparatus is plotted in blue. ASTM D5470-06 requiresonly two temperature probes in each reference bar3. From Fig. 8,it is clear that the number of thermocouples in each reference barhas a smaller effect on the measurement uncertainty when moreprecise temperature probes are used.
We assume that misalignment of the reference bars does notaffect the measurement uncertainty of the stepped-bar apparatussince the contact area of the sample is not reduced. On the otherhand, the measurement uncertainty of the standard apparatusincreases nonlinearly with reference bar misalignment. Figure 8suggests that the relative contribution of the reference bar
misalignment to the overall measurement uncertainty of the stand-ard apparatus increases as the temperature probes used becomemore precise. For example, Kempers et al. [13] use 60.001 K reso-lution thermistors to take highly precise thermal conductivitymeasurements. With thermistors such as these, the measurementuncertainty of a standard apparatus is greater than that of thestepped-bar apparatus if reference bars are misaligned by 1% ormore. Aligning equal-area reference bars with a mismatch lessthan 1% may be difficult to achieve without the aid of expensivepneumatic alignment mechanisms and in situ metrology to verifyalignment. Thus, operators that require highly precise thermal re-sistance measurements may be able to decrease the uncertainty oftheir measurements while also saving money on equipment to alignthe reference bars precisely when the stepped-bar approach is used.
An analysis of the statistical uncertainty in the least-squaresregression for each apparatus explains why the measurementuncertainty for the stepped-bar apparatus is greater than that of aperfectly aligned conventional apparatus. Recall that least-squaresregression involves fitting a curve of a certain order through anumber of data points. The degree of freedom of this regression isgiven by
c ¼ n� O (15)
where c is the degree of freedom, n is the number of data points,and O is the number of parameters in the regression line. Thestepped-bar apparatus fits a first order curve through the top fourthermocouples and a second order curve through the bottom fivethermocouples in the URB. Each of these curve fits has twodegrees of freedom. However, a standard apparatus with eightthermocouples in the URB employs a first order fit that has sixdegrees of freedom. The statistical uncertainty of the parametersof a best-fit equation increases as the degrees of freedom parame-ter decreases [20]. As a result, the uncertainty of the heat rate andupper interface temperature are greater for the stepped-bar appara-tus than for the conventional apparatus because the least-squaresregression for the stepped-bar apparatus has fewer degrees of free-dom than that of the conventional apparatus with the same numberof thermocouples. ASTM D5470-06 requires the use of only twotemperature probes in each reference bar [9], which results in zerodegrees of freedom in each curve fit in the URB and LRB. There-fore, Fig. 8 shows that the uncertainty curve for the conventionalapparatus with T-type thermocouples shifts upward by a signifi-cant amount if the ASTM D5470-06 standard is used. As a result,the measurement uncertainty of the stepped-bar apparatus com-pares more favorably to that of an apparatus adhering to ASTMstandards when thermocouple precision is relatively low.
Fig. 8 Comparison of measurement uncertainty for standard andstepped-bar apparatus with Al 2024 meter bars and a graphite padTIM. Solid lines and dotted lines represent measurement uncer-tainties when 0.5 K and 0.001 K temperature probes are used,respectively. ASTM D-5470-06 and conventional reference barcurves overlap for high-precision (0.001 K) thermal probes.
Journal of Electronic Packaging DECEMBER 2013, Vol. 135 / 041002-7
Downloaded From: http://electronicpackaging.asmedigitalcollection.asme.org/ on 01/21/2014 Terms of Use: http://asme.org/terms

Cost of Stepped-Bar Versus Standard Apparatus
The cost of a reference bar apparatus is an important considera-tion in industry and academic research settings. In order for thestepped-bar apparatus to achieve the same uncertainty as that of aconventional apparatus, more temperature probes are required.Each additional temperature probe increases the cost of the appara-tus. However, the stepped-bar apparatus offsets this extra expensebecause it utilizes an inexpensive mechanical transducer instead ofmore costly pneumatic-based alignment mechanisms that arerequired to precisely align reference bars of equal cross-sectionarea. A parts list for the stepped-bar apparatus is tabulated in theAppendix. Table 2 compares the cost of our stepped-bar apparatusto several commercially available standard reference bar set-ups.
Conclusions
This study demonstrates that a modified reference bar apparatuswith an oversized upper reference bar can achieve more precisethermal resistance measurements than a standard apparatus withequal cross-sectional area reference bars. Misalignment ofequal-area reference bars tends to decrease the contact area of thesample without the operator knowing. Thus, reference bar mis-alignment propagates error through the thermal resistance mea-surement of a standard 1D reference bar apparatus. Because themodified apparatus employs an oversized upper reference bar, iteliminates this source of misalignment error, and enables thermalresistance measurements with high reproducibility as a result. Themeasurement uncertainty of the modified apparatus is less thanthat of a standard apparatus for reference bar misalignmentsgreater than 1% when highly precise (60.001 K) thermal probesare employed. This fact suggests that a stepped-bar apparatus maybe appropriate when highly precise thermal resistance measure-ments are desired. This study also reveals that the placement andnumber of thermocouples in each reference bar are crucial param-eters that greatly affect the measurement uncertainty of the refer-ence bar apparatus.
Acknowledgment
This work was partially supported by National Science Founda-tion Award No. CBET 1055479 and the NSF Pre-TeachingSummer Undergraduate Research Experience program at GeorgiaTech.
References[1] Cola, B. A., Xu, J., and Fisher, T. S., 2009, “Contact Mechanics and Thermal
Conductance of Carbon Nanotube Array Thermal Interfaces,” Int. J. Heat MassTransfer, 52, pp. 3490–3503.
[2] Harris, D. K., Palkar, A., and Wonacott, G., 2010, “An Experimental Investiga-tion in the Performance of Water-Filled Silicon Microheat Pipe Arrays,” ASMEJ. Electron. Packag., 132(2), p. 021005.
[3] Huang, H., Liu, C. H., Wu, Y., and Fan, S., 2005, “Aligned Carbon NanotubeComposite Films for Thermal Management,” Adv. Mater., 17(13), pp. 1652–1656.
[4] Narumanchi, S., Mihalic, M., and Kelly, K., 2008, “Thermal Interface Materialsfor Power Electronics Applications,” Itherm 2008, Orlando, FL, May 28–31,Paper No. NREL/CP-540-42972.
[5] Xu, J., and Fisher, T. S., 2005, “Enhancement of Thermal Interface MaterialsWith Carbon Nanotube Arrays,” Int. J. Heat Mass Transfer, 49, pp. 1658–1666.
[6] Gwinn, J. P., and Webb, R. L., 2003, “Performance and Testing of ThermalInterface Materials,” Microelectron. J., 34(3), pp. 215–222.
[7] Khandelwal, M., and Mench, M. M., 2006, “Direct Measurement of Through-Plane Thermal Conductivity and Contact Resistance in Fuel Cell Materials,”J. Power Sources, 161, pp. 1106–1115.
[8] Liao, P., Hua, Z. K., Liao, Y. C., and Zhang, J. H., 2010, “A Novel ThermalConductivity Meter for Thermal Interface Materials in Optoelectronic Device,”11th International Conference on Electronic Packaging Technology and HighDensity Packaging (ICEPT-HDP), Xi’an, China, August 16–19, pp. 889–892.
[9] ATSM, 2006, “Standard Test Method for Thermal Transmission Properties ofThermally Conductive Electrical Insulating Materials,” D5470, ASTM Interna-tional, West Conshohocken, PA.
[10] Savija, I., Culham, J. R., and Yovanovich, M. M., “Effective ThermophysicalProperties of Thermal Interface Materials: Part I—Definitions and Models,”Proceedings of ASME International Electronic Packaging Technical Confer-ence and Exhibition, Maui, HI, July 6–11, ASME Paper No. IPACK2003-35088, pp. 189–200.
[11] Savija, I., Culham, J. R., and Yovanovich, M. M., “Effective ThermophysicalProperties of Thermal Interface Materials: Part II—Experiments and Data,”Proceedings of International Electronic Packaging Technical Conference andExhibition, Maui, HI, July 6–11, ASME Paper No. IPACK2003-35264, pp.567–573.
[12] Kearns, D., 2003, “Improving Accuracy and Flexibility of ASTM D 5470 forHigh Performance Thermal Interface Materials,” 19th IEEE SemiconductorThermal Measurement and Management Symposium, San Jose, CA, March11–13, pp. 129–133.
[13] Kempers, R., Kolodner, P., Lyons, A., and Robinson, A. J., 2009, “A High-Precision Apparatus for the Characterization of Thermal Interface Materials,”Rev. Sci. Instrum., 80, p. 095111.
[14] ASTM, 2004, “Standard Test Method for Thermal Conductivity of Solids byMeans of the Guarded-Comparative-Longitudinal Heat Flow Technique,”E1225, ASTM International, West Conshohocken, PA.
[15] Stockwell Elastomerics, 2012, “Thermally Conductive Silicon Rubber HeatTransfer Pads and Gaskets From Gap Filling Compounds,” Stockwell Elasto-merics, Inc., Philadelphia, PA, http://www.stockwell.com/data_sheets/thermal/se200_thermal_mgmt_products.pdf
[16] ASTM, 2011, “Standard Specification and Temperature-Electromotive Force(emf) Tables for Standardized Thermocouples,” E230/E230M-11, ASTM Inter-national, West Conshohocken, PA.
[17] Hot Disk, 2012, “TPS 1500,” Hot Disk AB, Gothenburg, Sweden, http://www.hotdiskinstruments.com/products/instruments/tps-1500.html
[18] Kline, S. J., and McClintock, F. A., 1953, “Describing Uncertainties in Single-Sample Experiments,” Mech. Eng., 75(1), pp. 3–8.
[19] GrafTech, 2012, “HITHERM Thermal Interface Materials Technical Data Sheet318,” GraphTech International, Parma, OH, http://graftechaet.com/getattachment/a98eb932-9a95-419f-82e5-9d7683b6b67b/eGRAF%C2%AE-HITHERM%E2%84%A2-Typical-Properties.aspx
[20] Bowker, A. L., and Lieberman, G. J., 1972, Engineering Statistics, 2nd ed.,Prentice-Hall, Englewood Cliffs, NJ.
[21] Culham, J. R., Teertstra, P., Savija, I., and Yovanovich, M. M., 2002, “Design,Assembly and Commissioning of a Test Apparatus for Characterizing ThermalInterface Materials,” Eighth Intersociety Conference on Thermal and Thermo-mechanical Phenomena in Electronic Systems (ITHERM 2002), San Diego,CA, June 1, pp. 128–135.
[22] Hunan Zhenhua Analysis Instrument Co., 2013, “DRX-I-PB/PC Thermal Con-ductivity Tester (Guarded Hot Plate Testing System),” http://hfyq.en.alibaba.com/product/553015923-209348254/DRX_I_PB_PC_Thermal_Conductivity_Tester_Guarded_hot_plate_testing_system_.html
Table 2 Cost-comparison between reference bar set-ups
Manufacturer Total cost ($)
Our stepped-bar apparatus 9681Culham [21] 23,785Huafeng instrument [22] 9000–13,000
Erratum Notice
This paper has been modified since being posted online. TheDOI of the published erratum is: 10.1115/1.4025800
The following Appendix on the next page has been incorpo-rated into this version of the paper.
041002-8 / Vol. 135, DECEMBER 2013 Transactions of the ASME
Downloaded From: http://electronicpackaging.asmedigitalcollection.asme.org/ on 01/21/2014 Terms of Use: http://asme.org/terms

Table 3 Parts list for stepped-bar apparatus
Part name Supplier Part ID Unit cost ($) No. of units Total cost ($)
Machining componentsCast iron hand wheel McMaster Carr 6025K37 12.8 1 12.8ACME threaded rod McMaster Carr 99030A277 56.25 1 56.25ACME round nut McMaster Carr 95072A371 54.63 1 54.63ACME round nut mounting flange McMaster Carr 95082A643 32.58 1 32.58Ceramic washer McMaster Carr 94610A215 3.14 1 3.14Shaft/support rod McMaster Carr 6649K101 43.32 4 173.28Sleeve bearing rulon McMaster Carr 6371K119 27.44 1 27.44Rubber feet McMaster Carr 9540K36 14.48 1 14.48Copper alloy 110 block McMaster Carr 89275K54 206.33 1 206.33Aluminum alloy 2024 block McMaster Carr 86895K231 36.34 1 36.34
Pressure applicationLoad cell Omega Engineering LCM305-500N 480 1 480Digital strain gage meter Omega Engineering DPiS32 195 1 195
Temperature recordingThermocouples Omega Engineering TJ36-CPSS-020U-6 33 13 386.1016 channel reader Stanford Instruments SR 630 1495 1 1495
Heater/chillerCartridge heater Omega Engineering CIR-1014/120 47 2 94Process control Omega Engineering CN 8201-DC1-C2 359 1 359Heat sink Omega Engineering FHS-6 21 1 21Fuse holder Omega Engineering FB-1 20 2 40Fuse Omega Engineering KAX-10 30 2 60Solid state relay Omega Engineering SSR L240DC10 21 1 21Chiller VWR scientific 13271-110 3605.91 1 3605.91
DAQ and communicationNI GPIB-USB-HS National Instruments 778927-01 549 1 549X2 GPIB cable National Instruments 763061-005 75 1 75X2 GPIB cable National Instruments 763061-02 90 1 90
MiscellaneousNylon foam insulation McMaster Carr 3623K64 5.16 7 36.12Flexible fiberglass insulation McMaster Carr 4478K1 6.28 1 6.28Machining costs (meter bars) — — 1550 — 1550
Grand total $9681
Appendix
Journal of Electronic Packaging DECEMBER 2013, Vol. 135 / 041002-9
Downloaded From: http://electronicpackaging.asmedigitalcollection.asme.org/ on 01/21/2014 Terms of Use: http://asme.org/terms