a structural census of genomes: comparing bacterial, eukaryotic, and archaeal genomes in terms of...
TRANSCRIPT

J. Mol. Biol. (1997) 274, 562±576
A Structural Census of Genomes: ComparingBacterial, Eukaryotic, and Archaeal Genomes in Termsof Protein Structure
Mark Gerstein
Department of MolecularBiophysics & Biochemistry266 Whitney AvenueYale UniversityPO Box 208114, New HavenCT 06520, USA
Abbreviations used: HI, HaemopMJ, Methanococcus jannaschii; SC, Sor yeast; AÊ , AngstroÈm; ORF, openProtein Data Bank.
0022±2836/97/490562±15 $25.00/0/m
Representative genomes from each of the three kingdoms of life are com-pared in terms of protein structure, in particular, those of Haemophilusin¯uenzae (a bacteria), Methanococcus jannaschii (an archaeon), and yeast (aeukaryote). The comparison is in the form of a census (or comprehensiveaccounting) of the relative occurrence of secondary and tertiary structuresin the genomes, which particular emphasis on patterns of supersecondarystructure. Comparison of secondary structure shows that the three gen-omes have nearly the same overall secondary-structure content, althoughthey differ markedly in amino acid composition. Comparison of super-secondary structure, using a novel ``frequent-words'' approach, showsthat yeast has a preponderance of consecutive strands (e.g. beta±beta±beta patterns), Haemophilus, consecutive helices (alpha±alpha±alpha), andMethanococcus, alternating helix-strand structures (beta±alpha±beta).Yeast also has signi®cantly more helical membrane proteins than theother two genomes, with most of the differences concentrated in proteinscontaining two transmembrane segments. Comparison of tertiary struc-ture (by sequence matching and domain-level clustering) highlights thesubstantial duplication in each genome (�30% to 50%), with the degreeof duplication following similar patterns in all three. Many sequencefamilies are shared among the genomes, with the degree of overlapbetween any two genomes being roughly similar. In total, the three gen-omes contain 148 of the �300 known protein folds. Forty-®ve of these148 that are present in all three genomes are especially enriched in mixedsuper-secondary structures (alpha/beta). Moreover, the ®ve most com-mon of these 45 (the ``top-5``) have a remarkably similar super-secondarystructure architecture, containing a central sheet of parallel strands withhelices packed onto at least one face and beta±alpha±beta connectionsbetween adjacent strands. These most basic molecular parts, which, pre-sumably, were present in the last common ancestor to the three king-doms, include the TIM-barrel, Rossmann, ¯avodoxin, thiamin-binding,and P-loop-hydrolase folds.
# 1997 Academic Press Limited
Introduction
In the past two years the complete genomesequences of a number of free-living organismshave been announced, generating tremendousinterest (Nowak, 1995; Wade, 1997). This providesa unique opportunity to perform comprehensive
hilus in¯uenzae;accharomyces cerevisiaereading frame; PDB,
b971412
comparisons between different organisms on amolecular level. Here three genomes are comparedin terms of the protein structures that they encode,those of Haemophilus in¯uenzae (Fleischmann et al.,1995a,b), Methanococcus jannaschii (Bult et al., 1996),and the yeast Saccharomyces cerevisiae (Goffeau et al.,1996, 1997). These organisms are representatives ofthe three major kingdoms of life (bacteria, archaeaand eukarya) and so provide a most diverse com-parison.
Structurally, each of these organisms appearsdifferent on the micron scale as they have different
# 1997 Academic Press Limited

A Structural Census 563
internal cell structures, but on the scale of singleAÊ ngstroÈms they appear nearly the same, containingsimilar proportions of C, H, O, N, P, and S atoms.The question addressed here is how they compareon the scale of protein structure (10 to 100 AÊ ). Forinstance, since these organisms live in such differ-ent physical environments, from deep-sea vents athigh temperature and pressure for Methanococcus(85�, 200 atm) to rotting ®gs and grapes at normaltemperature and pressure (for yeast) it is possiblethat particular types of secondary or tertiary struc-ture would be favored over others.
To address this and other related questions, thethree genomes (or more properly proteomes) wereanalyzed by established techniques of sequencematching and secondary-structure prediction. Theyare found to differ in terms of overall amino acidcomposition, yet, surprisingly, have a similar com-position in terms of secondary structures. Theresults of the sequence comparison and structureprediction were clustered and combined using newmethods to address questions related the distri-bution of supersecondary structures. It is found thatthe genomes have different frequencies of super-secondary structures (e.g. abab), with yeast havingrelatively more consecutive strands (e.g. bbb), Hae-mophilus having more consecutive helices (e.g. aa),and Methanococcus having more alternating helix-strand structures (e.g. abab). Yeast also has morehelical membrane proteins, especially those withonly one or two transmembrane elements.
The genomes also have a different compositionof tertiary structures (or folds). The number ofdistinct folds contained in the three genomes isconsiderably less than the aggegrate number ofsequences (�10,000) because of substantial dupli-cation within each genome (involving between athird and half the sequences in each genome)and the many protein families shared betweengenomes. A small group of sequence families arecommon to all three genomes and presumablywere present in the last common ancestor to bac-teria, eukaryotes and archaea, hypothesized toexist two billion years ago (Doolittle et al., 1996).In total the three genomes contain 148 knownprotein folds, which mostly have an a/b architec-ture. A disproportionate number of the sharedsequence families have a known structure (45),and ®ve of these 45 are among the most commonfolds in each genome (i.e. in the ``top-10``). These®ve, which appear to be basic ``molecular parts,``are the TIM-barrel fold, Rossmann fold, ¯avodox-in fold, thiamin-binding fold, and P-loop-hydro-lase fold. They have a remarkably similararchitecture, containing a central sheet of parallelstrands with helices packed on at least one faceand with, almost exclusively, bab connectionsbetween adjacent strands.
There has been much recent work analyzing gen-omes (or partial genomes) that this work is follow-ing upon. Automated methods have beendeveloped for comparing a whole genome againsta number of interlocking databases, and these have
been used to characterize a number of recentlysequenced genomes (Bork et al., 1992a,b; Scharfet al., 1994; Casari et al., 1995; Ouzounis et al.,1995a,b). Genes have been related to the metabolicpathways, enabling determination of whether ornot a pathway is present in a given organism andmaking possible estimation of the minimal set ofgenes necessary for life (Karp et al., 1996a,b;Koonin et al., 1996a; Mushegian & Koonin, 1996;Tatusov et al., 1996). The number of membraneproteins in genomes has been surveyed (Arkin et al.,1997; Goffeau et al., 1993; Rost et al., 1995, 1996), andduplications (i.e. clusters of paralogous genes) ingenomes have been identi®ed (Brenner et al., 1995;Koonin et al., 1996b; Riley & Labedan, 1987; Wolfe& Shields, 1997). Genomes have been comparedbased on the frequencies of oligonucleotide and oli-gopeptide words, focusing especially on the relativeabundance of dinucleotides as a unique genomicsignature (Blaisdell et al., 1996; Karlin & Burge,1995; Karlin et al., 1992, 1996). Finally, it has beenpossible to identify certain sequences, called ancientconserved regions, that have been conserved overlong evolutionary time scales between phylogeneti-cally distant organisms (Green et al., 1993; Kooninet al., 1995). Recently, comparisons have just beenmade focussing on archea, highlighting thesequence families unique to this kingdom(Ouzounis et al., 1995a,b; Clayton et al., 1997).
As the work here involves comparing the proteinstructures implied by the genome sequences it alsorests upon the great amount of recent work sys-tematizing protein structures and classifying theminto fold families (Gibrat et al., 1996; Holm &Sander, 1996; Murzin et al., 1995; Orengo et al.,1994; Schmidt et al., 1996; Pascarella & Argos, 1992;Sander & Schneider, 1991). In particular, a censussimilar to this one has recently been done, compar-ing the occurrence of fold families in differentspecies (Gerstein & Levitt, 1997a).
One expects analysis of structure to reveal moreabout distant evolutionary relationships than justsequence comparison since structure is usuallymore conserved than sequence (Chothia &Gerstein, 1997; Chothia & Lesk, 1986). In otherwords, it is at the level of protein structure, whereone sees the greatest redundancy and reuse inbiology. Speci®cally, it is believed that there is onlya very limited number of protein motifs, and eluci-dation of this limited repertoire of molecular partsis seen as one of the principal future challenges forbiology (Chothia, 1992; Lander, 1996).
Results and Discussion
Overall genome size and composition
As shown in Table 1, the Haemophilus (HI) andMethanococcus (MJ) genomes are approximately thesame size, both in terms of the number and aver-age length of the sequences (�1700 and �295,respectively). However, the yeast (SC) genome isconsiderably larger, coding for six times as many

Table 1. Overall statistics for secondary structures
HI MJ SC
All sequences in genomeTotal number 1680 1735 6218Average length (residues) 301 287 466
Average strand propensity per residue (kcal/mole) ÿ0.33 ÿ0.37 ÿ0.35Average helix propensity per residue (kcal/mole) ÿ1.02 ÿ1.03 ÿ0.98Average TM-helix propensity per residue (kcal/mole) 1.35 1.74 1.64
Sequences corresponding to soluble proteinsTotal number 1376 1502 4810
(as fraction of number of sequences in genome) 82% 87% 77%
Average length (residues) 285 280 432Fraction of residues that are predicted to be in a sheet 16% 18% 16%Fraction of residues that are predicted to be in a helix 42% 41% 35%
Predicted number of secondary structure elements 20 21 29Fraction of elements that are strands 51% 53% 54%Fraction of elements that are helices 49% 47% 46%
Average number of residues per strand 4.4 4.5 4.4Average number of residues per helix 11.8 11.9 11.2
The number of soluble protein is the total number of sequences less those predicted to contain at least two trans-membrane elements (see Methods). For reference, the size of a domain in a protein of known structure is 174.1.This was determined by averaging the lengths of the 971 non-homologous chains in scop (see Methods). Thelength distribution for the structure domains and for the ORFs in the three genomes are unimodal. There is noperiodicity observed (e.g. for multiples of 125, as suggested by Berman et al. (1994)). The average strand, a-helix,and TM-helix propensities are derived by computing a weighted average of the propensities in Table 2, using asweighting factors for each residue the fractional composition of it in the whole genome.
564 A Structural Census
residues, spread over more than 6200 sequences withan average size of�470. For comparison the averagesize of a protein domain in known crystal structuresis �175 residues (calculation described in the Tablelegend), about a third the size of a protein in yeast or60% of one in Haemophilus or Methanococcus.
As shown in Table 2, the three genomes havesome signi®cant differences in terms of their over-all amino acid composition. The average differencefor any amino acid is 45%. The greatest particulardifferences are between Methanococcus in compari-son to Haemophilus and yeast, perhaps re¯ectingthe radically different environment that Methano-coccus lives in. For instance, Ile and Lys are morecommon (by about half) in the Methanococcus gen-ome than in those of yeast and Haemophilus, andSer and Gln are much less common (Gln by a fac-tor of almost ®ve). These differences are somewhatlarger than the compositional differences usuallyfound in comparing sets of sequences from differ-ent species (Doolittle, 1987).
Each amino acid has a different propensity toconfer secondary structure, whether a-helices,transmembrane helices, or b-strands (also shown inTable 2). Consequently, the differences in compo-sition might be expected to give rise to more ofone type of secondary structure, e.g. more helices.This can be tested to some degree through predic-tion of secondary structure.
Overall secondary-structure andtransmembrane-helix composition
Bulk prediction of secondary structure was donefor every protein in the three genomes by a num-
ber of standard approaches (see Methods). First,the proteins that contain transmembrane heliceswere determined. There appears to be relativelymore helical membrane proteins in yeast than inHaemophilus and more in Haemophilus than Metha-nococcus (as a fraction of the total genome, 23% ver-sus 18% to 13%). The large fraction of membraneproteins in the yeast genome may re¯ect the great-er number of membranes in a eukaryotic cell.(However, it may also result from the larger aver-age size of a yeast protein if there is an assumedconstant propensity for transmembrane segmentformation per residue.)
Second, the membrane proteins were set asideand conventional helix±turn±strand secondarystructure was predicted for the remaining proteins.Surprisingly, despite the differences in amino acidcomposition, the overall statistics for secondarystructure composition (the number and size ofhelices and strands) are nearly identical in thethree genomes: about 54% of secondary structuralelements are predicted to be strands (with an aver-age length of 4.5 residues) and the remaining frac-tion are helices (with an average length of 11.5residues). (By residue, about 40% of the genomesare predicted to be helical, and about 17%, strand.)
How can the genomes have such similar second-ary structure composition, while having such amarkedly different amino acid composition? Thisis analogous to how genomes can have very differ-ent base compositions (AT or GC rich) while cod-ing for proteins with similar amino acidcomposition. To some degree it has do with a``degeneracy'' in the coding of secondary structurepropensities and the ``trading-off'' of residues with

Table 2. Differences in amino acid composition
Max diff.between Propensity (kcal/mol)
Amino acid composition (%) genomes TM a bHI MJ SC (%) helix helix strand
Q 4.6 1.5 3.9 105 �4.1 ÿ1.3 ÿ0.4S 5.6 4.5 9.0 67 ÿ0.6 ÿ1.1 ÿ0.9K 6.3 10.4 7.3 49 �8.8 ÿ1.5 ÿ0.4I 7.1 10.5 6.6 46 ÿ3.1 ÿ1.2 ÿ1.3W 1.1 0.7 1.0 43 ÿ1.9 ÿ1.1 ÿ1.0H 2.1 1.4 2.2 40 �3.0 ÿ1.1 ÿ0.4A 8.2 5.5 5.5 40 ÿ1.6 ÿ1.9 0.0T 5.2 4.0 5.9 37 ÿ1.2 ÿ0.6 ÿ1.4Y 3.1 4.4 3.4 33 �0.7 ÿ1.2 ÿ1.6E 6.5 8.7 6.5 29 �8.2 ÿ1.2 ÿ0.2G 6.6 6.3 5.0 29 ÿ1.0 0.0 �1.2P 3.7 3.4 4.3 25 �0.2 �3.0 >3.0C 1.0 1.3 1.3 24 ÿ2.0 ÿ1.1 ÿ0.8N 4.9 5.3 6.1 22 �4.8 ÿ1.0 ÿ0.5V 6.7 6.9 5.6 20 ÿ2.0 ÿ0.8 ÿ0.9R 4.5 3.9 4.5 16 �12.3 ÿ1.9 ÿ0.4D 5.0 5.5 5.8 15 �9.2 ÿ1.0 �0.9M 2.4 2.2 2.1 14 ÿ3.4 ÿ1.4 ÿ0.9L 10.5 9.5 9.6 10 ÿ2.8 ÿ1.6 ÿ0.5F 4.5 4.2 4.5 7 ÿ3.7 ÿ1.0 ÿ1.1
The Table shows the amino acid composition of the three genomes. The average rms difference incomposition for an individual amino acid is 0.023, and expressed as a fraction of 5%, this is 45%.(0.023 is computed from determining the rms difference between each of pair of composition vec-tors, viz: ����������������������������������������������������������������������������������������������
�VHI ÿVMJ�2 � �VMJ ÿVSC�2 � �VSC ÿVHI�260
swhere VHI is the composition vector for HI and other vectors are named correspondingly.) The®fth column shows the differences in composition in more detail. For each amino acid the maxi-mum difference is expressed as a percentage, viz: 2(X ÿ y)/(X � y), where is X is the maximumcomposition amount of a particular amino acid in the three genomes and y is the minimum. TheTM-helix scale gives the energy in kcal/mol for inserting this amino acid into a membrane(Engelman et al., 1986). As described in the Methods it is used here for the identi®cation of mem-brane proteins. The a-helix and b-stand propensity scales illustrate how different compositions ofamino acids would be expected, to a ®rst approximation, to give rise to different secondary struc-tures. They are also expressed in kcal/mol. Both scales are derived from protein-unfolding experi-ments (Chakrabartty et al., 1994; Smith et al., 1994), but similar scales can be determined fromdoing statistics on solved crystal structures (King & Sternberg, 1996).
A Structural Census 565
equivalent propensities between genomes. This isevident in the similar values calculated for eachgenome for average helix and strand propensityper residue (Table 1).
Frequent super-secondary structure words
Groups of linked secondary structures (e.g.abab) form super secondary structures, and the fre-quency of these in each genome can also be ana-lyzed. For this analysis the ``frequent words''approach often used for characterizing oligopep-tide and oligonucleotide sequences is applied tothe predicted secondary structures. The results,shown in Table 3, are for super secondary structure``words'' of length 2 to 7. Unlike secondary struc-tures, there are great differences in the frequencythat super secondary structures occur in the threegenomes. In general the greatest differences occurfor symmetrical or repeating patterns of super sec-ondary structure (i.e. symmetrical patterns, such asaaaaa and abab, which are underlined in theTable, versus asymmetrical ones, such as abbb or
abbaa). These differences become more pro-nounced as one looks at longer and longer words(i.e. bbb versus bbbbbbb).
There is a much greater chance of ®nding all-bwords (e.g. bb, bbb, bbbb, and so forth) in yeastthan in the other genomes. Speci®cally, the chanceof ®nding bbbb in yeast is 54% greater than ®ndingit in Haemophilus and a 27% greater than ®nding itin Methanococcus, for 41% greater on average. Thisis interesting in that all-b proteins are expected tobe common in metazoa, which contain a greatnumber of all-b immunoglobulin-like and ®bronec-tin type III-like folds, but not necessarily in lowereukaryotes such as yeast (Doolittle, 1995; Gerstein& Levitt, 1997a).
Conversely, all-a proteins are more common inHaemophilus than in the other two organisms. Inparticular, four consecutive helices (as in a four-helix bundle) are more frequent in Haemophilusthan Methanococcus or yeast by 25%. As is necess-arily implied, alternating alpha±beta structures aremore common in Methanococcus than the other two

Table 3. Frequencies of supersecondary structure words
A.Super- Maximumsecondary difference Relative abundancestructure between 3 (odds ratio)``word'' genomes (%) HI MJ SC PDB
bb 26 0.96 1.06 1.24 1.22aa 15 0.97 0.85 0.83 0.85ab 10 1.09 1.09 0.99 0.95ba 7 0.98 1.00 0.93 0.99bbb 41 0.96 1.15 1.46 1.62aaa 19 1.01 0.83 0.84 0.92aba 18 1.04 1.03 0.87 1.16aab 15 1.03 0.97 0.89 0.70bab 12 1.15 1.24 1.10 1.19baa 11 0.93 0.87 0.83 0.78bba 9 0.90 0.94 0.99 0.82abb 6 0.97 0.98 1.03 0.80bbbb 54 1.03 1.35 1.78 2.28aaaa 29 1.10 0.82 0.89 1.18bbba 25 0.85 0.94 1.10 0.98baba 23 1.11 1.18 0.94 1.48abab 21 1.21 1.23 0.99 1.39abaa 21 1.00 0.95 0.81 1.00abbb 20 0.93 0.95 1.14 0.93aaba 20 0.97 0.88 0.80 0.91aaab 19 1.03 0.94 0.85 0.50baaa 14 0.92 0.84 0.79 0.63baab 13 1.06 1.01 0.93 0.92babb 12 1.04 1.13 1.18 0.98bbab 12 1.07 1.21 1.20 0.97bbaa 8 0.84 0.78 0.85 0.59abba 8 0.95 0.94 0.87 0.68aabb 6 0.90 0.84 0.89 0.58bbbbb 67 1.14 1.71 2.27 3.43aaaaa 41 1.27 0.84 0.97 1.63bbbba 38 0.85 0.98 1.25 1.15ababa 32 1.21 1.24 0.90 2.06abbbb 30 0.96 0.99 1.30 1.05bbabb 29 0.99 1.13 1.32 1.04babab 28 1.33 1.48 1.11 1.9325 more 5-letter words follow...
B.BBBBB (67%), aaaaa (41%), BBBBa (38%), aBaBa (32%), aBBBB (30%),BBaBB (29%), BaBaB (28%), aaaBa (27%), BBBaB (27%), aBaaa (26%),BaBaa (21%), aaBBB (24%), aaBaB (23%), aBaaB (23%), BBBaa (22%),aaBaa (21%), BaBaa (21%), aaaaB (20%), BaaaB (18%), aBBaa (17%),Baaaa (14%), aaBBa (14%), aBBaB (13%), BaaBa (13%), BBaBa (12%),BBaaB (11%), aaaBB (09%), aBBBa (09%), aBaBB (07%), BaBBa (04%),BBaaa (04%), BaaBB (03%)
BBBBBBB aaaaaaa BBBBBBa BBBaBBB BaBBBBB BBaBBBB BBBBaBB BBBBBaaBaBaBaa BBBBBaB aBaBaBa BBaaBBB BaaaBaa aBBBBBB aaaaBBB aaBaBaBaBaBaaa aBaaaaa aBaaBBa BaBaBaB aBaBaaB aaBBBBB aBBBaBB BaaBaBaBBBBaaa aBBBBBa BaaBBBB aaaBaaa aBaBBaa aaaaBaB aaBBaBa BBaBaBaBaaaaaa aaaaaaB aaaBaaB BBBaaBa BaBaaaB BaaBBaB aaaBBBB aBaaaaBBaBBaBa aaaaaBa BBBBaaB aBBaaBa BaBBaaa BBBaaBB BBBaBBa BaBaaaaaaBBBaa aaBBBBa aBaBaBB aBBaBaa BBaaaBa aBBaBaB aaBaBaa BBBaaaaaaaBBaB aaaaaBB aaBaaaa BBBaBaB aBaaaBa BaBBaBB BBaBBBa aBBaaaaaBaaaBB aaaBaBa aaaaBaa aBaaBaB BaaaaaB BaBaaBB BaBaBBB aaBaaaBBBaBBaB BBBBaBa aaBBaaB aBBaBBB aBaaBaa aaBaaBa BaaaaBaaaBaBBa BBaaBaB aaBaBBB aaaBBaa BaaBaaB aBaBBBa BBaaaaa aBBaaaBBBaBaBB aBBBaaB BBaaaBB BaBaBBa aaaBaBB aBaBBBB aBaBBaB BaaaBaBBaBBBBa BaBBaaB BaBaaBa aBBBBaB aaaBBBa aBBBBaa aaBaaBB aBBaBBaBBaaBaa BaaaBBa BBaBaaa aBBaaBB BaBBBaa BaaBaBB BaaaBBB BaaBBaaBBBaBaa aBaaBBB aBBBaaa aBBBaBa BBaBaaB BaaaaBB BBaBBaa BBaaaaBaaBBBaB BaaBBBa BBBaaaB aaBBaBB BBaaBBa aaaaBBa aaBBaaa BaaBaaa
A. The different frequencies of super secondary patterns in the predicted secondary structure for the three genomes. The frequenciesare shown as odds ratios of the observed number to the expected number (so values greater than 1.0 denote frequent patterns). Thesecond column of the Table provides a measure of the differences between the genomes viz: D � 2(X ÿ y)/(X � y), where is X is themaximum odds ratio for a particular word and y is the minimum. Symmetrical and repeating words are underlined. For ®ve-letterwords, 32 in total, only the seven that exhibit the greatest differences between genomes are shown. For comparison the frequenciesof super-secondary words observed in a representative set of known protein structures is shown in the last column, labeled ``PDB''(see Methods for discussion of the representative set). The structure-databank appears to have an even higher representation ofsome super-secondary structure patterns (particularly all-b) than any of the genomes, perhaps re¯ecting its biased compositiontoward such folds as the immunoglobulins. B. All the 5 and 7 character words ordered according to the difference D between gen-omes. Symmetrical and repeating words are underlined. Note how symmetrical words often appear to exhibit the greatest differencebetween genomes.
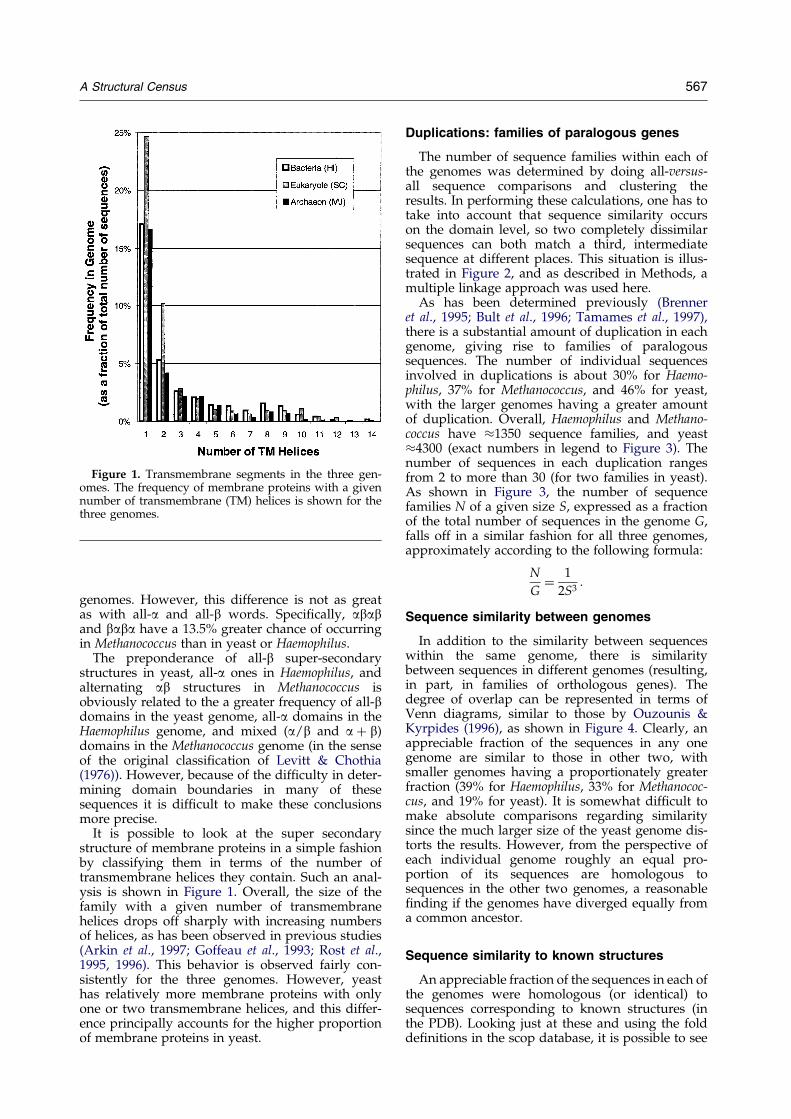
Figure 1. Transmembrane segments in the three gen-omes. The frequency of membrane proteins with a givennumber of transmembrane (TM) helices is shown for thethree genomes.
A Structural Census 567
genomes. However, this difference is not as greatas with all-a and all-b words. Speci®cally, ababand baba have a 13.5% greater chance of occurringin Methanococcus than in yeast or Haemophilus.
The preponderance of all-b super-secondarystructures in yeast, all-a ones in Haemophilus, andalternating ab structures in Methanococcus isobviously related to the a greater frequency of all-bdomains in the yeast genome, all-a domains in theHaemophilus genome, and mixed (a/b and a � b)domains in the Methanococcus genome (in the senseof the original classi®cation of Levitt & Chothia(1976)). However, because of the dif®culty in deter-mining domain boundaries in many of thesesequences it is dif®cult to make these conclusionsmore precise.
It is possible to look at the super secondarystructure of membrane proteins in a simple fashionby classifying them in terms of the number oftransmembrane helices they contain. Such an anal-ysis is shown in Figure 1. Overall, the size of thefamily with a given number of transmembranehelices drops off sharply with increasing numbersof helices, as has been observed in previous studies(Arkin et al., 1997; Goffeau et al., 1993; Rost et al.,1995, 1996). This behavior is observed fairly con-sistently for the three genomes. However, yeasthas relatively more membrane proteins with onlyone or two transmembrane helices, and this differ-ence principally accounts for the higher proportionof membrane proteins in yeast.
Duplications: families of paralogous genes
The number of sequence families within each ofthe genomes was determined by doing all-versus-all sequence comparisons and clustering theresults. In performing these calculations, one has totake into account that sequence similarity occurson the domain level, so two completely dissimilarsequences can both match a third, intermediatesequence at different places. This situation is illus-trated in Figure 2, and as described in Methods, amultiple linkage approach was used here.
As has been determined previously (Brenneret al., 1995; Bult et al., 1996; Tamames et al., 1997),there is a substantial amount of duplication in eachgenome, giving rise to families of paralogoussequences. The number of individual sequencesinvolved in duplications is about 30% for Haemo-philus, 37% for Methanococcus, and 46% for yeast,with the larger genomes having a greater amountof duplication. Overall, Haemophilus and Methano-coccus have �1350 sequence families, and yeast�4300 (exact numbers in legend to Figure 3). Thenumber of sequences in each duplication rangesfrom 2 to more than 30 (for two families in yeast).As shown in Figure 3, the number of sequencefamilies N of a given size S, expressed as a fractionof the total number of sequences in the genome G,falls off in a similar fashion for all three genomes,approximately according to the following formula:
N
G� 1
2S3:
Sequence similarity between genomes
In addition to the similarity between sequenceswithin the same genome, there is similaritybetween sequences in different genomes (resulting,in part, in families of orthologous genes). Thedegree of overlap can be represented in terms ofVenn diagrams, similar to those by Ouzounis &Kyrpides (1996), as shown in Figure 4. Clearly, anappreciable fraction of the sequences in any onegenome are similar to those in other two, withsmaller genomes having a proportionately greaterfraction (39% for Haemophilus, 33% for Methanococ-cus, and 19% for yeast). It is somewhat dif®cult tomake absolute comparisons regarding similaritysince the much larger size of the yeast genome dis-torts the results. However, from the perspective ofeach individual genome roughly an equal pro-portion of its sequences are homologous tosequences in the other two genomes, a reasonable®nding if the genomes have diverged equally froma common ancestor.
Sequence similarity to known structures
An appreciable fraction of the sequences in each ofthe genomes were homologous (or identical) tosequences corresponding to known structures (inthe PDB). Looking just at these and using the foldde®nitions in the scop database, it is possible to see

Figure 2. ``Domain problem'' inclustering sequence families. TheFigure illustrates some of the com-plexities in clustering sequences.Domains are fundamentally de-®ned at the structural level. Herethe de®nitions in the scop databaseare used (Murzin et al., 1995). Itcan be the case that a given ORFmatches more than one domain-level fold (e.g. yeast ORF
YAL026C). This is illustrated by the top two lines in the Figure, where sequence 2 matches both the A and B domainfolds. Statistics based on this type of matching (where a single ORF can count more than once) and are used in theconstruction of Figure 5 and Table 4. However, for sequences that do not correspond to known structures, it is notpossible to rigorously or consistently de®ne domains, although some approaches exist (Sonnhammer & Kahn, 1994;Sonnhammer et al., 1996). Consequently, the sequence-level clustering in Figure 3 is done only in terms of individualgenes. If this approach is taken, single-linkage clustering can give potentially misleading results, as has been pointedbefore (Koonin et al., 1996b; Riley & Labedan, 1997), it will group together two sequences (i.e. 2 and 4) that havesimilarity to different domains (B and C) in a third, intermediate sequence (3). One can get around this problem intwo ways: one can split sequence 3 in half during the clustering or one can use a multiple-linkage algorithm andonly create a cluster where all the members have similarity to each other. The ®rst case is in a sense more accurate.However, it greatly biases the resulting statistics on the fraction of duplication since one knows how many genesthere are in the genome but not how many domains there are. Here the later approach is taken. In a sense this iswhat happens in a governmental census. Even if one has multiple homes or jobs, the annual census forces one into asingle category to keep the statistics fair.
568 A Structural Census
how the known folds are distributed amongst thethree genomes. This is shown in Figure 5 and Table 4.
The known domain structures presently corre-spond to 971 sequence families (at the 40% hom-ology level, see Methods: S. Brenner, C. Chothia &T. Hubbard, unpublished results), and a total of355 of these are present in at least one of the gen-omes. Obviously more are represented in yeastthan Haemophilus and more in Haemophilus thanMethanococcus, re¯ecting the greater size of theyeast genome as well as the biases of investigators.Comparison of Figures 4 and 5 shows thatsequence families common to one or more genomehave a greater chance of having a known structure.This ®nding could again re¯ect the biases of inves-tigators but it could also indicate the omnipresentcharacter of the ancient shared families.
Using the structural similarity relationships inthe scop database, sequence families that share thesame fold but which have no detectable homologycan be combined into fold families. These are cur-rently 299 folds in scop, and of these about half(148) are contained in at least one of the three gen-omes. The fact that these numbers are considerablyless than the number of sequence families showshow many of the evolutionary similarities betweenthese highly diverged organisms are only apparentin terms of structure, all the sequence similarityhaving been eroded away (Doolittle, 1995).Although the Haemophilus and Methanococcus gen-omes are approximately the same size about twiceas many folds are known for the former in com-parison to the latter. This undoubtedly re¯ects thebiased nature of the structure database.
It is possible to classify each fold as all-a, all-b,a/b, a � b, or other using the original de®nitionsof Levitt & Chothia (1976) and then to see how the
folds corresponding to each of the structuralclasses are distributed among the genomes(Figure 5). Overall, the genomes contain a dispro-portionate number of mixed folds (a/b and a � b,83/148). Yeast also has the most all-b folds (with14 of the 18 all-b folds in the three genomes).
There are 45 domain folds shared between thethree genomes. These presumably represent a mostancient set of molecular parts. They include suchdiverse folds as that of a common, metabolicenzyme, similar in structure to ¯avodoxin, andthat of a domain involved in tRNA recognition(speci®cally, the substrate-binding domain of thedehydrogenase 2DLD and the C-terminal, antico-don-binding domain of the glutamyl-tRNA synthe-tase 1GLN). These 45 folds are especially enrichedin a/b supersecondary structures, with 38 of 45having one of the mixed architectures.
Top-10 folds in each genome and fivebasic folds
Finally, it is possible to look at the frequencywith which the known folds occur in the genomes.This is shown in the form of top-10 lists (Table 4).As was the case for the folds overall, most of thecommon folds have an a/b architecture. This isespecially true for the common, ``shared'' folds thatare present in all three genomes. The nine mostcommon of these folds all have an a/b architecture.
The ®ve most common folds that are present inall three genomes are shown in Figure 6. Orderedin terms of the frequency of their occurrence (seelegend to Figure 6), they are: the P-loop containingNTP hydrolase fold, the Rossmann fold, the TIM-barrel fold, the ¯avodoxin fold, and the thiamin-binding fold. Each of these overall ``top-5`` folds

Figure 3. Number of duplicationsin the three genomes. Log±loggraph showing how the number ofsequence families (i.e. clusters ofparalogs, shown on the verticalaxis) of a given size (shown on thehorizontal axis) drops off in nearlythe same way in each of the threegenomes. The exact numbers thatthis chart is based on are shownbelow.
Size of Frequency in genomefamily HI MJ SC
1 1172 1095 33472 161 183 5993 33 45 1804 6 12 765 3 6 286 1 3 157 1 1 158 0 1 59 0 0 5
10 0 0 511 0 0 212 0 0 313 1 1 214 0 1 315 0 0 116 0 0 217 0 0 118 0 0 319 0 0 020 0 0 0
>20 1 0 4
A Structural Census 569
occurs in the top-10 list for each of the individualgenomes (with the exception of the ¯avodoxin fold,which does not occur in the yeast top-10). They areall associated with basic metabolism (as opposed toother functions such as transcription or regulation).They have a remarkably similar super-secondarystructure architecture. They are all classic a/b pro-teins, containing a central sheet of parallel strandswith helices packed onto at least one face of thissheet. (For this discussion, it is convenient to ima-gine the barrel in an unrolled fashion as shown inthe Figure.) As emphasized in the schematic part ofthe Figure, the topology of the central sheet is verysimilar in the proteins. Almost all of the connectionsare right-handed links between adjacent parallelstrands through an intervening helix packed ontothe central sheet. (Speci®cally, 18 of the total 24 con-nections fall into this pattern, with ®ve other onesbeing very similar, but involving connectionsbetween strands two apart in the sheet.)
Conclusion
Three genomes have been compared in terms ofthe protein structure, particularly supersecondarystructure, they encode. This has demonstrated thateven using as crude a measure as secondary-struc-ture prediction, one can ®nd marked, statistical
differences between the genomes in terms of over-all protein-structure features. It is found that yeasthas more all-b supersecondary structure and Hae-mophilus, more all-a. This particular result isfurther borne out from looking at the distributionof known folds.
Secondly, using straightforward sequence com-parison, it is possible to ®nd that these diverseorganisms share many common folds. In particu-lar, there are 45 known folds common to the threekingdoms. Presumably, these are ancient folds thatwere present in the last common ancestor that pre-dated the divergence of the major kingdoms abouttwo billion years ago (Doolittle et al., 1996). Five ofthese are amongst the most common folds in eachorganism and share a remarkably similar a/barchitecture.
The two different general types of calculationsperformed here, structure prediction and sequencematching, give conclusions with complementarystrengths and weaknesses. Structure prediction canbe applied to the whole genome in a uniformfashion, providing comprehensive, statistical con-clusions. However, these conclusions suffer fromthe inherent inaccuracy of the prediction methods,especially given that the application of structureprediction methods to genomes is such a greatextrapolation from the data that the methods were

Figure 4. Sequence similaritybetween genomes. The Figureshows for each genome what frac-tion of its sequences (expressed asa percentage of the total, 100%)have homologs in the other twogenomes. For instance, yeast hasroughly equal number of sequenceswith homologs to Methanococcus(12.2% � 6.5% � 5.7%) and Haemo-philus (12.9% � 6.5 � 6.4%).
570 A Structural Census
trained on (i.e. the PDB). In contrast, sequencecomparison to known structure gives almost com-pletely accurate ``predictions'' (about the fold).However, only a small sample of each genome canbe surveyed (7% to 15% of the ORFs), giving con-clusions that are necessarily anecdotal and biasedto a degree.
More re®ned methods of sequence comparisonand secondary structure prediction (if developed)would allow a greater percentage of the genome tobe matched with known folding patterns, furtherdeveloping the conclusions of this paper. In anycase, the general idea of comparing genomes interms of protein structures is expected to be a veryfertile topic in the future. There are currently sevenmicrobial genomes completed and at least 36 morebeing worked on (Kerlavage, 1997), so there willbe many possibilities for comparison soon.
Methods
A relational database of genome sequencesand structure assignments
Translated genome sequences were taken fromthe web sites (www.tigr.org and genome-www.stanford.edu). Note that there is some uncer-tainty regarding whether all of the translated openreading frames (ORFs) are really genes. Forinstance, in yeast 5888 of the 6218 ORFs are de®-nitely believed to be genes, but there is someuncertainty about the remaining 330 (Goffeau et al.,1996). Non-genome sequences were taken from thenon-redundant OWL databank (version 27.1)(Bleasby et al., 1994), structures from the PDB(Bernstein et al., 1977), and domain fold de®nitionsfrom scop (version 1.32, May 1996) (Brenner et al.,1996; Murzin et al., 195). Core structures for each
Figure 5. Folds shared betweengenomes. This Figure shows howthe known folds are distributedamongst the three genomes interms of a Venn diagram. All thedomains in the PDB can beclustered into 971 sequence familiesat 40% homology (Brenner et al.,unpublished results). Of these 355appear in at least one of the threegenomes and how they are distrib-uted is indicated in the top-leftpanel. As shown in the top-rightpanel, the structural similarities inscop (Murzin et al., 1995) collapsemany of the 971 sequence familiesinto a smaller number (299) of foldfamilies. Of these 148 appear in thethree genomes, with 45 sharedbetween all three. The bottom-leftand bottom-right panels showselections of fold families shown attop-right, corresponding, respect-ively, to all-a or all-b structures.Note that the total number of foldsconsists of essentially ®ve parts: all-a folds, all-b folds, a/b folds, a � bfolds, and miscellaneous folds(148� 32� 18� 47� 36� 15). Thus,from subtracting the two bottompanels from the top-right one, onecan see how the overall prevalenceof mixed (a/b and a � b) folds isdistributed amongst the genomes.
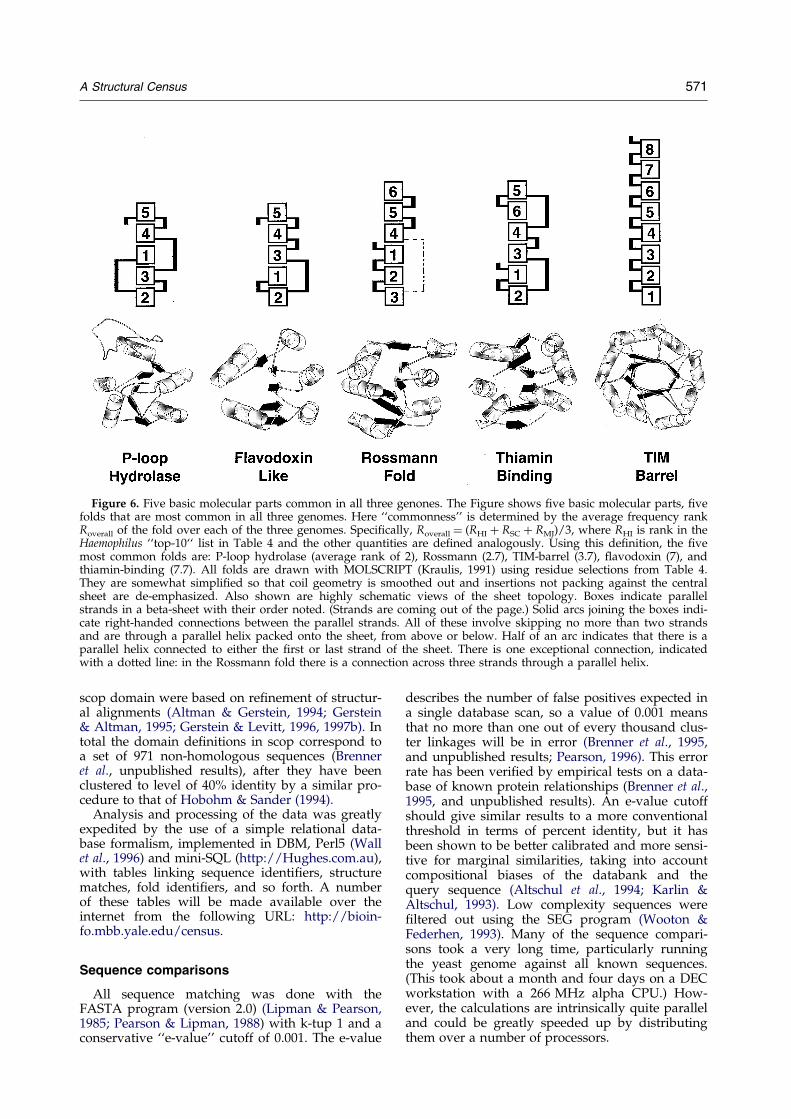
Figure 6. Five basic molecular parts common in all three genones. The Figure shows ®ve basic molecular parts, ®vefolds that are most common in all three genomes. Here ``commonness'' is determined by the average frequency rankRoverall of the fold over each of the three genomes. Speci®cally, Roverall � (RHI � RSC � RMJ)/3, where RHI is rank in theHaemophilus ``top-10`` list in Table 4 and the other quantities are de®ned analogously. Using this de®nition, the ®vemost common folds are: P-loop hydrolase (average rank of 2), Rossmann (2.7), TIM-barrel (3.7), ¯avodoxin (7), andthiamin-binding (7.7). All folds are drawn with MOLSCRIPT (Kraulis, 1991) using residue selections from Table 4.They are somewhat simpli®ed so that coil geometry is smoothed out and insertions not packing against the centralsheet are de-emphasized. Also shown are highly schematic views of the sheet topology. Boxes indicate parallelstrands in a beta-sheet with their order noted. (Strands are coming out of the page.) Solid arcs joining the boxes indi-cate right-handed connections between the parallel strands. All of these involve skipping no more than two strandsand are through a parallel helix packed onto the sheet, from above or below. Half of an arc indicates that there is aparallel helix connected to either the ®rst or last strand of the sheet. There is one exceptional connection, indicatedwith a dotted line: in the Rossmann fold there is a connection across three strands through a parallel helix.
A Structural Census 571
scop domain were based on re®nement of structur-al alignments (Altman & Gerstein, 1994; Gerstein& Altman, 1995; Gerstein & Levitt, 1996, 1997b). Intotal the domain de®nitions in scop correspond toa set of 971 non-homologous sequences (Brenneret al., unpublished results), after they have beenclustered to level of 40% identity by a similar pro-cedure to that of Hobohm & Sander (1994).
Analysis and processing of the data was greatlyexpedited by the use of a simple relational data-base formalism, implemented in DBM, Perl5 (Wallet al., 1996) and mini-SQL (http://Hughes.com.au),with tables linking sequence identi®ers, structurematches, fold identi®ers, and so forth. A numberof these tables will be made available over theinternet from the following URL: http://bioin-fo.mbb.yale.edu/census.
Sequence comparisons
All sequence matching was done with theFASTA program (version 2.0) (Lipman & Pearson,1985; Pearson & Lipman, 1988) with k-tup 1 and aconservative ``e-value'' cutoff of 0.001. The e-value
describes the number of false positives expected ina single database scan, so a value of 0.001 meansthat no more than one out of every thousand clus-ter linkages will be in error (Brenner et al., 1995,and unpublished results; Pearson, 1996). This errorrate has been veri®ed by empirical tests on a data-base of known protein relationships (Brenner et al.,1995, and unpublished results). An e-value cutoffshould give similar results to a more conventionalthreshold in terms of percent identity, but it hasbeen shown to be better calibrated and more sensi-tive for marginal similarities, taking into accountcompositional biases of the databank and thequery sequence (Altschul et al., 1994; Karlin &Altschul, 1993). Low complexity sequences were®ltered out using the SEG program (Wooton &Federhen, 1993). Many of the sequence compari-sons took a very long time, particularly runningthe yeast genome against all known sequences.(This took about a month and four days on a DECworkstation with a 266 MHz alpha CPU.) How-ever, the calculations are intrinsically quite paralleland could be greatly speeded up by distributingthem over a number of processors.

Table 4. Top-10 folds in the three genomes
RepresentativeNo. in structuregenome Class Fold name (PDB selection)
Top-10 in a eukaryotic genome (SC)84 a � b Protein kinases (catalytic core) 1irk49 a/b P-loop containing NTP hydrolasses 1gky35 a/b Rossmann fold 2ohx A:175±32431 A/B TIM barrel 1tim A:25 a/b Ribonuclease H-like 2rn218 S Classic zinc finger 1zaa C:14 a � b Ubiquitin conjugating enzyme 1aak12 b GroES-like 1acy L: 109±21110 a/b Thioredoxin-like 1trx9 a/b Thiamin-binding fold 1pvd A:2±181
5 � 8 ... ... ...7 a/b Flavodoxin-like 3chy
Top-11 in a eubacterial genome (HI)18 a/b Rossmann fold 2ohx A:175±32413 a/b P-loop containing NTP hydrolases 1gky12 a/b Flavodoxin-like 3chy10 a/b TIM barrel 1tim A:10 a � b Ferredoxin-like 1fxd10 a/b Ribonuclease H-like 2rn26 a/b Periplasmic binding protein-like II 1sbp5 a/b Periplasmic binding protein-like I 2dri5 a � b Like class II aaRS synthetases 1sry A:111±4214 b OB-fold 1pyp4 a/b Thiamin-binding fold 1pvd A:2±181
Top-11 in an archaeal genome (MJ)19 a � b Ferredoxin-like 1fxd10 a/b P-loop containing NTP hydrolases 1gky7 a/b TIM barrel 1tim A:6 a/b Rossmann fold 2ohx A:175±3245 a Histone-fold 1ntx4 a/b Thiamin-binding fold 1pvd A:2±1814 a/b Flavodoxin-like 3chy4 b Reductase/elongation factor common 1efg A:283±4033 a � b ATP-grasp 1bnc A:115±3303 a/b PLD-dependent transferases 1dka3 a/b ATP pyrophoshatases 1gpm A:208±404
The most common of the known folds in the various genomes. Folds common to all three genomes areunderlined. The ¯avodoxin-like fold occurs seven times in the yeast genome, making it the 16th mostcommon fold in this genome.
572 A Structural Census
There are more sensitive methods of comparingsequences to structures than the FASTA program,e.g. pro®les, Hidden-Markov models, motif anal-ysis, and threading (Bowie & Eisenberg, 1993; Jones& Thornton, 1996; Eddy, 1996). These methodswould be expected to ®nd more homologues forcertain folds. (For instance, using careful sequencecomparison and motif analysis Hunter & Plowman(1997) recently reported that yeast had 113 proteinkinases, considerably more than the numberreported here.) However, the sensitivity improve-ment would not be uniform over all folds. This is notadvantageous for a large-scale census since uniformsampling and treatment of the data is more import-ant than sensitivity (as one is more concerned withrelative rather than absolute numbers).
Multiple linkage clustering
The sequences were grouped into families byapplying single and multiple linkage clustering(Kaufman & Rousseeuw, 1990) to an all-against-all
comparison of the three genomes, taken individu-ally and jointly, plus a set of non-homologoussequences corresponding to the structures in scop.The basic clustering procedure was very similar toalgorithm 1 (``select until done'') by Hobohm et al.(1992) with the inclusion of a test for multiple link-age. Initially one starts with an empty list ofsequences in the ®rst cluster and a list of N unas-signed sequences (which can be ordered accordingto a useful criteria such as length). One then takesthe ®rst unassigned sequence (s0) and compares itsequentially to each of the other unassignedsequences (si). At each step, if the sequence beingcompared (si) matches the ®rst sequence (s0) andevery other sequence in the current ®rst cluster list,it is added to the (growing) ®rst cluster. The testhere for multi-linkage addresses the ``domain pro-blem'' described in Figure 2. Then one repeats thewhole procedure, creating new clusters at eachiteration, until all the unassigned sequencesare exhausted. If the mean cluster size is C, it ispossible to show that this procedure requires

A Structural Census 573
approximately:
N ÿ 1ÿ �C� 1�C� 1
� �N ÿ 1
2
� �comparisons, with approaches N2/2(C � 1) forlarge N and N4C. This is signi®cantly less thanthe number of operations when one considers allpairs: N(N ÿ 1/2), which approaches N2/2 forlarge N.
Transmembrane helix prediction
Transmembrane segments were identi®ed byusing the GES hydrophobicity scale, shown inTable 2 (Engelman et al., 1986). The values fromthe scale for amino acids in a window of size 20(the typical size of a transmembrane helix) wereaveraged and then compared against a cutoff ofÿ1 kcal/mole. A value under this cutoff was takento indicate the existence of a transmembrane helix.Initial hydrophobic stretches corresponding to sig-nal sequences for membrane insertion wereexcluded. (These have the pattern of a chargedresidue within the ®rst seven, followed by a stretchof 14 with an average hydrophobicity under thecutoff.) These parameters have been used, tested,and re®ned on surveys of membrane protein ingenomes (Arkin et al., 1997; Tomb et al., 1997).Here detection of at least two transmembranehelices was necessary for the protein to be classi-®ed as a ``membrane protein.`` This rather conser-vative threshold was used for two reasons: (i)sequences with only a single transmembraneelement are not really integral membrane proteins,and (ii) the false positive rate for misclassifyingproteins as membrane proteins was much higheron the basis of one transmembrane helix than mul-tiple ones. (Speci®cally, the error rate on a test setof 395 non-homologous chains was �4% (21/395)for classi®cations based on a single transmembranehelix versus �1% (4/395) for those based on two ormore.)
Transmembrane identi®cations based on theGES scale were compared against those based onthe Kyte±Doolittle scale using both a strict andmore lax threshold (JaÈhnig, 1990; Kyte & Doolittle,1982). They were also compared against a neuralnetwork approach (Rost et al., 1995, 1996). Thereare differences in the predictions for a number ofthe sequences. However, the overall results of thebulk prediction are fairly insensitive to this. Forinstance, the number of membrane proteins pre-dicted using the GES scale in Haemophilus, Metha-nococcus, and yeast were 303, 232, and 1407,respectively. The corresponding numbers for theKyte±Doolittle scale (with the strict threshold)were 386, 358, and 1845. The GES scale is a littlemore conservative, but the relative amounts ofmembrane proteins in the three genomes are simi-lar. The differences between the scales re¯ect theextremely small size of the membrane protein data-base that the predictions extrapolate from.
Secondary structure prediction
Secondary structure prediction was done usingthe GOR program (Garnier et al., 1978, 1996; Gibratet al., 1987). This is a well-established and com-monly used method. It is statistically based so thatthe prediction for a particular residue (say Ala) tobe in a given state (i.e. helix) is directly based onthe frequency that this residue (and taking intoaccount neighbors at �1, �2, and so forth) occursin this state in a database of solved structures.Speci®cally, version 4 of the GOR program is usedhere (Garnier et al., 1996). This bases the predictionfor residue i on a window from i ÿ 8 to i � 8around i, and within this window, the 17 individ-ual residue frequencies (singlets) are combinedwith the frequencies of all 136 possible di-residuepairs (doublets). The GOR method only uses singlesequence information and because of this achieveslower accuracy (65% versus 71%) than the current``state-of-art'' methods that incorporate multiplesequence information (King & Sternberg, 1996;Rost, 1996; Rost & Sander, 1993; Salamov &Solovyev, 1995). However, it is not possible toobtain multiple sequence alignments for most ofthe proteins in each of the three genomes. Conse-quently, bulk predictions of all the proteins in agenome based on multiple-alignment approachesare in a sense skewed. One gets two distinctlydifferent types of prediction, depending on howmany homologues a given protein has. Conse-quently, for the bulk prediction approaches usedhere the simpler single sequence approach wasdeemed more consistent. However, for one genome(Haemophilus) tests were also done using the PHDserver (Rost, 1996). This does predictions using aneural-network, multiple sequence alignmentapproach. While obviously the predictions differedat individual positions from that of the GORapproach, most of the aggregate properties (e.g.total number and size of helices and strands) werefairly consistent. (In particular, on a randomsample of 125 proteins that did not contain trans-membrane elements or have PDB homologues,PHD predicted 38% of the residues to be helical,18% to be strand, and the rest coil: the correspond-ing numbers for GOR are 36% and 18%.)
Note also that the analysis here is not at allfocused on the particular secondary structure pre-diction for any individual residue. What is of con-cern is aggregate secondary structure content ofwhole proteins (and genomes) and the predictionof secondary structure elements (i.e. whether ornot a helix is present, regardless of its length). Pre-diction of aggregate quantities is expected to bemore accurate than the prediction of individualresidues (Rost & Sander, 1993).
Frequent words for super-secondary structures
To simplify the secondary structure predictions,they were ``condensed'' into simple ``ab-code''where ``a`` stands for the position of a helix and

574 A Structural Census
``b`` for a strand. Speci®cally, for the condensation,two or more adjacent residues of strand or helixwere merged into single ``a`` or ``b`` characters.(The few isolated residues predicted to be in differ-ent conformation than both their neighbors weresometimes merged with their neighbors or directlypromoted to ``a`` or ``b`` characters.)
The frequency of various two to ten letter wordsin each sequence's ab-code was assessed usingmethods developed for analyzing frequent wordsin nucleotide sequences (Karlin et al., 1992, 1996;Karlin & Cardon, 1994). The observed frequency ofwords of a given type was divided by the expectedfrequency for this type, based on the frequencies ofindividual a and b elements, to form an odds ratioR. For instance, for the pattern abbb the odds ratiois:
R � N�abbb�N�????�
� ��N�a�N�?�
N�b�N�?�
N�b�N�?�
N�b�N�?�
� �where N (xy) is the number of words matching pat-tern ``xy`` with ``?`` as the wildcard, so N(????) is thetotal number of four-character words and N(a) isthe number of a's (helices). This analysis assumesthat the expected frequency of words only dependson the frequency of individual characters (e.g.N(a)). However, it is also possible to do the analysistaking into account higher-order frequencies andconditional probabilities so the odds ratio becomes:
R � N�abbb�N�????�
� ��N�a�N�?�
N�ab�N�??�
N�bb�N�??�
N�bb�N�??�
� �Both analyses were used here, but there was littledifference in the results.
Acknowledgments
D. Engelman, L. Regan, F. Richards, A. BruÈ nger,W. Krebs, and T. Johnson are acknowledged for com-ments on the manuscript. Helpful correspondence withM. Cherry and A. Murzin is appreciated. Support forthis work was provided by an ONR Young InvestigatorGrant (N00014-97-1-0725).
References
Altman, R. & Gerstein, M. (1994). Finding an averagecore structure: application to the globins. In Proceed-ings of the Second International Conference on Intelli-gent Systems in Molecular Biology, pp. 19±27, AAAIPress, Menlo Park, CA.
Altschul, S. F., Boguski, M. S., Gish, W. & Wootton, J. C.(1994). Issues in searching molecular sequence data-bases. (Review). Nature Genet. 6, 119±129.
Arkin, I., Brunger, A. & Engelman, D. (1997). Are theredominant membrane protein families with a givennumber of helices?. Proteins: Struct. Funct. Genet. Inthe press.
Berman, A. L., Kolker, E. & Trifonov, E. N. (1994).Underlying order in protein sequence organization.Proc. Natl Acad. Sci. USA, 91, 4044±4047.
Bernstein, F. C., Koetzle, T. F., Williams, G. J. B., Meyer,E. F., Jr, Brice, M. D., Rodgers, J. R., Kennard, O.,Shimanouchi, T. & Tasumi, M. (1977). The ProteinData Bank: a computer-based archival ®le for macro-molecular structures. J. Mol. Biol. 122, 535±542.
Blaisdell, B. E., Campbell, A. M. & Karlin, S. (1996).Similarities and dissimilarities of phage genomes.Proc. Natl Acad. Sci. USA, 93, 5854±5859.
Bleasby, A. J., Akrigg, D. & Attwood, T. K. (1994). OWL± a non-redundant composite protein sequencedatabase. Nucl. Acids Res. 22, 3574±3577.
Bork, P., Ouzounis, C., Sander, C., Scharf, M., Schneider,R. & Sonnhammer, E. (1992a). Comprehensivesequence analysis of the 182 predicted open readingframes of yeast chromosome iii. Protein Sci. 1,1677±1690.
Bork, P., Ouzounis, C., Sander, C., Scharf, M., Schneider,R. & Sonnhammer, E. (1992b). What's in a genome?.Nature, 358, 287.
Bowie, J. U. & Eisenberg, D. (1993). Inverted protein struc-ture prediction. Curr. Opin. Struct. Biol. 3, 437±444.
Brenner, S., Hubbard, T., Murzin, A. & Chothia, C.(1995). Gene duplication in H. In¯uenzae. Nature,378, 140.
Brenner, S., Chothia, C., Hubbard, T. J. P. & Murzin,A. G. (1996). Understanding protein structure: usingscop for fold interpretation. Methods Enzymol. 266,635±642.
Bult, C. J., White, O., Olsen, G. J., Zhou, L.,Fleischmann, R. D., Sutton, G. G., Blake, J. A.,Fitzgerald, L. M., Clayton, R. A., Gocayne, J. D.,Kerlavage, A. R., Dougherty, B. A., Tomb, J.-F.,Adams, M. D., Reich, C. I., Overbeek, R., Kirkness,E. F., Weinstock, K. G., Merrick, J. M., Glodek, A.,Scott, J. L., Geohagen, N. S. M., Weidman, J. F.,Fuhrmann, J. L., Nguyen, D., Utterback, T. R.,Kelley, J. M., Peterson, J. D., Sadow, P. W., Hanna,M. C., Cotton, M. D., Roberts, K. M., Hurst, M. A.,Kaine, B. P., Borodovsky, M., Klenk, H.-P., Fraser,C. M., Smith, H. O., Woese, C. R. & Venter, J. C.(1996). Complete genome sequence of the methano-genic archaeon, Methanococcus jannaschii. Science,273, 1058±1073.
Casari, G., Andrade, M., Bork, P., Boyle, J., Daruvar, A.,Ouzounis, C., Schneider, R., Tamames, J., Valencia,A. & Sander, C. (1995). Challenging times forbioinformatics. Nature, 376, 647±648.
Chakrabartty, A., Kortemme, T. & Baldwin, R. L. (1994).Helix propensities of the amino acids measured inalanine-based peptides without helix-stabilizingside-chain interactions. Protein Sci. 3, 843±852.
Chothia, C. (1992). Proteins ± 1000 families for the mol-ecular biologist. Nature, 357, 543±544.
Chothia, C. & Gerstein, M. (1997). Protein evolution. Howfar can sequences diverge?. Nature, 385, 579±581.
Chothia, C. & Lesk, A. M. (1986). The relation betweenthe divergence of sequence and structure inproteins. EMBO J. 5, 823±826.
Clayton, R. A., White, O., Ketchum, K. A. & Venter, J. C.(1997). The ®rst genome from the third domain oflife (news). Nature, 387, 459±462.
Doolittle, R. F. (1987). Of Urfs and Orfs. UniversityScience Books, Mill Valley, CA.
Doolittle, R. F. (1995). The multiplicity of domains inproteins. (Review). Annu. Rev. Biochem. 64, 287±314.
Doolittle, R. F., Feng, D. F., Tsang, S., Cho, G. & Little,E. (1996). Determining divergence times of themajor kingdoms of living organisms with a proteinclock. Science, 271, 470±477.

A Structural Census 575
Eddy, S. R. (1996). Hidden Markov models. Curr. Opin.Struct. Biol. 6, 361±365.
Engelman, D. M., Steitz, T. A. & Goldman, A. (1986).Identifying nonpolar transbilayer helices in aminoacid sequences of membrane proteins. (Review).Annu. Rev. Biophys. Biophys. Chem. 15, 321±353.
Fleischmann, R. D., Adams, M. D., White, O., Clayton,R. A., Kirkness, E. F., Kerlavage, A. R., Bult, C. J.,Tomb, J. F., Dougherty, B. A., Merrick, J. M.,McKenney, K., Sutton, G., Fitzhugh, W., Fields, C.,Gocayne, J. D., Scott, J., Shirley, R., Liu, L. I.,Glodek, A., Kelley, J. M., Weidman, J. F., Phillips,C. A., Spriggs, T., Hedblom, E., Cotton, M. D.,Utterback, T. R., Hanna, M. C., Nguyen, D. T.,Saudek, D. M., Brandon, R. C., Fine, L. D.,Fritchman, J. L., Fuhrmann, J. L., Geoghagen,N. S. M., Gnehm, C. L., McDonald, L. A., Small,K. V., Fraser, C. M., Smith, H. O. & Venter, J. C.(1995a). Whole-genome random sequencing andassembly of Haemophilus in¯uenzae rd. Science(Washington DC), 269, 496±498.
Fleischmann, R. D., Adams, M. D., White, O., Clayton,R. A., Kirkness, E. F., Kerlavage, A. R., Bult, C. J.,Tomb, J. F., Dougherty, B. A., Merrick, J. M.,McKenney, K., Sutton, G., Fitzhugh, W., Fields, C.,Gocayne, J. D., Scott, J., Shirley, R., Liu, L. I.,Glodek, A., Kelley, J. M., Weidman, J. F., Phillips,C. A., Spriggs, T., Hedblom, E., Cotton, M. D.,Utterback, T. R., Hanna, M. C., Nguyen, D. T.,Saudek, D. M., Brandon, R. C., Fine, L. D.,Fritchman, J. L., Fuhrmann, J. L., Geoghagen,N. S. M., Gnehm, C. L., McDonald, L. A., Small,K. V., Fraser, C. M., Smith, H. O. & Venter, J. C.(1995b). Whole-genome random sequencing andassembly of Haemophilus in¯uenzae rd. Science(Washington DC), 269, 507±512.
Garnier, J., Osguthorpe, D. & Robson, B. (1978). Anal-ysis of the accuracy and implications of simplemethods for predicting the secondary structure ofglobular proteins. J. Mol. Biol. 120, 97±120.
Garnier, J., Gibrat, J. F. & Robson, B. (1996). GORmethod for predicting protein secondary structurefrom amino acid sequence. Methods Enzymol. 266,540±553.
Gerstein, M. & Altman, R. (1995). Average core struc-tures and variability measures for protein families:Application to the immunoglobulins. J. Mol. Biol.251, 161±175.
Gerstein, M. & Levitt, M. (1996). Using iterativedynamic programming to obtain accurate pairwiseand multiple alignments of protein structures. Pro-ceedings of the Fourth International Conference on Intel-ligent Systems for Molecular Biology, pp. 59±67,AAAI Press, Menlo Park, CA.
Gerstein, M. & Levitt, M. (1997a). A structural census ofthe current population of protein sequences. Proc.Natl Acad. Sci. USA, In the press.
Gerstein, M. & Levitt, M. (1997b). Comprehensiveassessment of automatic structural alignmentagainst a manual standard, the scop classi®cation ofproteins. Protein Sci. In the press.
Gibrat, J., Garnier, J. & Robson, B. (1987). Further devel-opments of protein secondary structure predictionusing information theory. J. Mol. Biol. 198, 425±443.
Gibrat, J. F., Madej, T. & Bryant, S. H. (1996). Surprisingsimilarities in structure comparison. Curr. Opin.Struct. Biol. 6, 377±385.
Goffeau, A., Slonimski, P., Nakai, K. & Risler, J. L.(1993). How many yeast genes code for membrane-spanning proteins?. Yeast, 9, 691±702.
Goffeau, A., Barrell, B. G., Bussey, H., Davis, R. W., Dujon,B., Feldmann, H., Galibert, F., Hoheisel, J. D., Jacq, C.,Johnston, M., Louis, E. J., Mewes, H. W., Murakami,Y., Philippsen, P., Tettelin, H. & Oliver, S. G. (1996).Life with 6000 genes. Science, 274, 546±567.
Goffeau, A., et al. (1997). The yeast genome directory.Nature, 387 (Suppl.), 5.
Green, P., Lipman, D., Hillier, L., Waterston, R., States,D. & Claverie, J. M. (1993). Ancient conservedregions in new gene sequences and the proteindatabases. Science, 259, 1711±1716.
Hobohm, U. & Sander, C. (1994). Enlarged representa-tive set of protein structures. Protein Sci. 3, 522.
Hobohm, W., Scharf, M., Schneider, R. & Sander, C.(1992). Selection of representative protein data sets.Protein Sci. 1, 409±417.
Holm, L. & Sander, C. (1996). Mapping the proteinuniverse. Science, 273, 595±602.
Hunter, T. & Plowman, G. D. (1997). The proteinkinases of budding yeast: six score and more.Trends Biochem. Sci. 22, 18±22.
JaÈhnig, F. (1990). Structure predictions of membrane pro-teins are not that bad. Trends Biochem. Sci. 15, 93±95.
Jones, D. T. & Thornton, J. M. (1996). Potential energy func-tions for threading. Curr. Opin. Struct. Biol. 6, 210±216.
Karlin, S. & Altschul, S. F. (1993). Applications and stat-istics for multiple high-scoring segments in molecularsequences. Proc. Natl Acad. Sci. USA, 90, 5873±5877.
Karlin, S. & Burge, C. (1995). Dinucleotide relative abun-dance extremes: a genomic signature. (Review).Trends Genet. 11, 283±290.
Karlin, S. & Cardon, L. R. (1994). Computational DNAsequence analysis. (Review). Annu. Rev. Microbiol.48, 619±654.
Karlin, S., Burge, C. & Campbell, A. M. (1992). Statisticalanalyses of counts and distributions of restrictionsites in DNA sequences. Nucl. Acids Res. 20, 1363±1370.
Karlin, S., Mrazek, J. & Campbell, A. M. (1996). Frequentoligonucleotides and peptides of the haemophilusin¯uenzae genome. Nucl. Acids Res. 24, 4263±4272.
Karp, P., Riley, M., Paley, S. & Pellegrini-Toole, A.(1996a). EcoCyc: electronic encyclopaedia of E. coligenes and metabolism. Nucl. Acids Res. 24, 32±40.
Karp, P. D., Ouzounis, C. & Paley, S. M. (1996b). Hin-Cyc: a knowledge base of the complete genome andmetabolic pathways of H. in¯uenze. Proceedings ofthe Fourth International Conference on Intelligent Sys-tems for Molecular Biology, pp. 116±124, AAAI Press,Menlo Park, CA.
Kaufman, L. & Rousseeuw, P. J. (1990). Finding Groupsin Data: An Introduction to Cluster Analysis. Wiley,New York.
Kerlavage, A. R. (1997). TIGR Microbial Genome Data-base. http://www.tigr.org/mdb (as of 2/97).
King, R. D. & Sternberg, M. J. E. (1996). Identi®cationand application of the concepts important for accu-rate and reliable protein secondary structureprediction. Protein Sci. 5, 2298±2310.
Koonin, E. V., Tatusov, R. L. & Rudd, K. E. (1995).Sequence similarity analysis of Escherichia coli pro-teins: functional and evolutionary implications.Proc. Natl Acad. Sci. USA, 92, 11921±11925.
Koonin, E. V., Mushegian, A. R. & Rudd, K. E. (1996a).Sequencing and analysis of bacterial genomes. Curr.Biol. 6, 404±416.

576 A Structural Census
Koonin, E. V., Tatusov, R. L. & Rudd, K. E. (1996b). Pro-tein sequence comparison at a genome scale.Methods Enzymel. 266, 295±322.
Kraulis, P. J. (1991). MOLSCRIPT ± a program to pro-duce both detailed and schematic plots of proteinstructures. J. Appl. Crystallog. 24, 946±950.
Kyte, J. & Doolittle, R. F. (1982). A simple method fordisplaying the hydrophobic character of a protein.J. Mol. Biol. 157, 105±132.
Lander, E. S. (1996). The new genomics: global views ofbiology. Science, 274, 536±539.
Levitt, M. & Chothia, C. (1976). Structural patterns inglobular proteins. Nature, 261, 552±558.
Lipman, D. J. & Pearson, W. R. (1985). Rapid and sensitiveprotein similarity searches. Science, 227, 1435±1441.
Murzin, A., Brenner, S. E., Hubbard, T. & Chothia, C.(1995). SCOP: a structural classi®cation of proteinsfor the investigation of sequences and structures.J. Mol. Biol. 247, 536±540.
Mushegian, A. R. & Koonin, E. V. (1996). A minimalgene set for cellular life derived by comparison ofcomplete bacterial genomes. Proc. Natl Acad. Sci.USA, 93, 10268±10273.
Nowak, R. (1995). Bacterial genome sequence bagged.Science, 269, 468±470.
Orengo, C. A., Jones, D. T. & Thornton, J. M. (1994).Protein superfamilies and domain superfolds.Nature, 372, 631±634.
Ouzounis, C. & Kyrpides, N. (1996). The emergence ofmajor cellular processes in evolution. FEBS Letters,390, 119±123.
Ouzounis, C., Bork, P., Casari, G. & Sander, C. (1995a).New protein functions in yeast chromosome VIII.Protein Sci. 4, 2424±2428.
Ouzounis, C., Kyrpides, N. & Sander, C. (1995b). Novelprotein families in archaean genomes. Nucl. AcidsRes. 23, 565±570.
Pascarella, S. & Argos, P. (1992). A databank mergingrelated protein structures and sequences. ProteinEng. 5, 121±137.
Pearson, W. R. (1996). Effective protein sequencecomparison. Methods Enzymol. 266, 227±259.
Pearson, W. R. & Lipman, D. J. (1988). Improved toolsfor biological sequence analysis. Proc. Natl Acad. Sci.USA, 85, 2444±2448.
Riley, M. & Labedan, B. (1997). Protein evolutionviewed through Escherichia coli protein sequences:introducing the notion of a structural segment ofhomology, the module. J. Mol. Biol. 268, 857±868.
Rost, B. (1996). PHD: Predicting one-dimensional proteinsecondary structure by pro®le-based neuralnetworks. Methods Enzymol. 266, 525±539.
Rost, B. & Sander, C. (1993). Prediction of protein sec-ondary structure at better than 70% accuracy. J. Mol.Biol. 232, 584±599.
Rost, B., Fariselli, P., Casadio, R. & Sander, C. (1995).Prediction of helical transmembrane segments at95% accuracy. Protein Sci. 4, 521±533.
Rost, B., Fariselli, P. & Casadio, R. (1996). Topology pre-diction for helical transmembrane segments at 95%accuracy. Protein Sci. 7, 1704±1718.
Salamov, A. & Solovyev, V. (1995). Prediction of proteinsecondary structure by combining nearest-neighboralgorithms and multiple sequence alignments. J. Mol.Biol. 247, 11±15.
Sander, C. & Schneider, R. (1991). Database of hom-ology-derived protein structures and the structuralmeaning of sequence alignment. Proteins: Struct.Funct. Genet. 9, 56±68.
Scharf, M., Schneider, R., Casari, G., Bork, P., Valencia,A., Ouzounis, C. & Sander, C. (1994). GeneQuiz: aworkbench for sequence analysis. In Proceedings ofthe Second International Conference on Intelligent Sys-tems for Molecular Biology, pp. 348±353, AAAI Press,Menlo Park, CA.
Schmidt, R., Gerstein, M. & Altman, R. (1996). LPFC: aninternet library of protein family core structures.Protein Sci. 6, 246±248.
Smith, C. K., Withka, J. M. & Regan, L. (1994). A thermo-dynamic scale for the beta-sheet forming tendenciesof the amino acids. Biochemistry, 33, 5510±5517.
Sonnhammer, E. L. L. & Kahn, D. (1994). Modulararrangement of proteins as inferred from analysis ofhomology. Protein Sci. 3, 482±492.
Sonnhammer, E., Eddy, S. & Durbin, R. (1996). Pfam: acomprehensive database of protein domain familiesbased on seed alignments. Proteins: Struct. Funct.Genet. 28, 405±420.
Tamames, J., Casari, G., Ouzounis, C. & Valencia, A.(1997). Conserved clusters of functionally relatedgenes in two bacterial genomes. J. Mol. Evol. 44, 66±73.
Tatusov, R. L., Mushegian, A. R., Bork, P., Brown, N. P.,Hayes, W. S., Borodovsky, M., Rudd, K. E. &Koonin, E. V. (1996). Metabolism and evolution ofHaemophilus in¯uenzae deduced from a whole- gen-ome comparison with Escherichia coli. Curr. Biol. 6,279±291.
Tomb, J.-F., White, O., Kerlavage, A. R., Clayton, R. A.,Sutton, G. G., Fleischmann, R. D., Ketchum, K. A.,Klenk, H. P., Gill, S., Dougherty, B. A., Nelson, K.,Quackenbush, J., Zhou, L., Kirkness, E. F., Peterson,S., Loftus, B., Richardson, D., Dodson, R., Khalak,H. G., Glodek, A., McKenney, K., Fitzegerald, L. M.,Lee, N., Adams, M. D., Hickey, E. K., Berg, D. E.,Gocayne, J. D., Utterback, T. R., Peterson, J. D.,Kelley, J. M., Cotton, M. D., Weidman, J. M., Fujii,C., Bowman, C., Watthey, L., Wallin, E., Hayes,W. S., Borodovsky, M., Karpk, P. D., Smith, H. O.,Fraser, C. M. & Venter, J. C. (1997). The completegenome sequence of the gastric pathogen Helicobac-ter pylori. Nature, 388, 539±547.
Wade, N. (1997). Thinking small paying off big in genequest. In New York Times 3 February 1997, p. A1(front page).
Wall, L., Christiansen, D. & Schwartz, R. (1996). Program-ming PERL. O'Reilly and Associates, Sebastapol, CA.
Wolfe, K. H. & Shields, D. C. (1997). Molecular evidencefor an ancient duplication of the entire yeastgenome. Nature, 387, 708±713.
Wooton, J. C. & Federhen, S. (1993). Statistics of localcomplexity in amino acid sequences and sequencedatabases. Comput. Chem. 17, 149±163.
Edited by F. E. Cohen
(Received 25 February 1997; received in revised form 4 September 1997; accepted 4 September 1997)