a structural model for the in vivo human cornea including collagen-swelling...
TRANSCRIPT
on July 9, 2018http://rsif.royalsocietypublishing.org/Downloaded from
rsif.royalsocietypublishing.org
ResearchCite this article: Cheng X, Petsche SJ, Pinsky
PM. 2015 A structural model for the in vivo
human cornea including collagen-swelling
interaction. J. R. Soc. Interface 12: 20150241.
http://dx.doi.org/10.1098/rsif.2015.0241
Received: 18 March 2015
Accepted: 17 June 2015
Subject Areas:biophysics, computational biology,
biomechanics
Keywords:cornea, hydration, collagen-swelling
interaction, proteoglycan, osmotic pressure,
pump-leak
Author for correspondence:Peter M. Pinsky
e-mail: [email protected]
Electronic supplementary material is available
at http://dx.doi.org/10.1098/rsif.2015.0241 or
via http://rsif.royalsocietypublishing.org.
& 2015 The Author(s) Published by the Royal Society. All rights reserved.
A structural model for the in vivo humancornea including collagen-swellinginteraction
Xi Cheng, Steven J. Petsche and Peter M. Pinsky
Department of Mechanical Engineering, Stanford University, Stanford, CA, USA
A structural model of the in vivo cornea, which accounts for tissue swelling
behaviour, for the three-dimensional organization of stromal fibres and for
collagen-swelling interaction, is proposed. Modelled as a binary electrolyte
gel in thermodynamic equilibrium, the stromal electrostatic free energy is
based on the mean-field approximation. To account for active endothelial
ionic transport in the in vivo cornea, which modulates osmotic pres-
sure and hydration, stromal mobile ions are shown to satisfy a modified
Boltzmann distribution. The elasticity of the stromal collagen network is
modelled based on three-dimensional collagen orientation probability distri-
butions for every point in the stroma obtained by synthesizing X-ray
diffraction data for azimuthal angle distributions and second harmonic-
generated image processing for inclination angle distributions. The model
is implemented in a finite-element framework and employed to predict
free and confined swelling of stroma in an ionic bath. For the in vivocornea, the model is used to predict corneal swelling due to increasing intra-
ocular pressure (IOP) and is adapted to model swelling in Fuchs’ corneal
dystrophy. The biomechanical response of the in vivo cornea to a typical
LASIK surgery for myopia is analysed, including tissue fluid pressure and
swelling responses. The model provides a new interpretation of the corneal
active hydration control (pump-leak) mechanism based on osmotic pressure
modulation. The results also illustrate the structural necessity of fibre incli-
nation in stabilizing the corneal refractive surface with respect to changes
in tissue hydration and IOP.
1. IntroductionIn the simplest terms, the cornea is a fibre-reinforced fluid membrane, which
resists the intraocular pressure (IOP) applied on its internal boundary. Its tensile
strength derives from the three-dimensional organization of collagen fibres and
its bulk properties derive from the interfibrillar fluid pressure. The fluid pressure
depends on both the IOP and the tissue osmotic pressure. The osmotic pres-
sure causes the cornea to have a tendency to swell by imbibing water from the
adjacent anterior chamber of the eye [1,2]. In the in vivo cornea, the osmotic
pressure is modulated by active ionic transport processes as a means to control
the level of tissue hydration, which is important for transparency and also affects
the mechanical behaviour of the tissue (cf. bending of a swollen and non-swollen
cornea). Ideally, the tissue fluid pressure, swelling effects (including active modu-
lation processes) and the local interaction of collagen fibres with the swelling
tissue, should be accounted for in any structural model based on first princi-
ples. Some important modelling concepts towards this end have already been
introduced, as described below. However, no fully three-dimensional and
comprehensive model has yet been presented. It is noteworthy that current
finite-element-based models for structural analysis of the cornea treat the inter-
fibrillar fluid as an incompressible or nearly incompressible elastic solid [3–6].
While this approach is convenient, it cannot describe swelling behaviour or
(steady-state) bulk compressibility. The goal of this work is to present a math-
ematical description of the corneal stroma as an electrolyte gel, characterizing

rsif.royalsocietypublishing.orgJ.R.Soc.Interface
12:20150241
2
on July 9, 2018http://rsif.royalsocietypublishing.org/Downloaded from
the fluid pressure, swelling behaviour and collagen-swelling
interaction. We show that such a model can extend predictive
accuracy in corneal biomechanics.
The cornea has five principal layers which, from anterior to
posterior, are the epithelium, Bowman’s, stroma, Descemet’s
and endothelium. Bowman’s and Descemet’s layers are
basement membranes for the cellular epithelium and endo-
thelium layers, respectively. The stroma occupies 90% of the
cornea’s thickness and like other soft, highly hydrated and
charged collagenous tissues such as cartilage and interverteb-
ral disc, is a polyelectrolyte gel consisting of a mixture of
interacting fluid, solid and ionic phases. Water is the principal
component of stroma which saturates the collagen solid phase,
solvates the ionic phase and accounts for about 78% of the
cornea by weight [7]. A small portion of the water is cellular
or bound to the stromal collagen [8], but much of the water
is free to flow within the stroma in response to gradients in
fluid pressure. The solid phase of corneal stroma comprises a
flexible collagen network, organized as fibrils within lamellae
and associated proteoglycans (PGs). Stromal PGs have sulfated
linear side chains of negatively charged disaccharide units
called glycosaminoglycans (GAGs) that are covalently bound
at one end to the PG core protein [9,10]. At normal pH, the
stromal fixed charge is almost entirely due to GAG ionization
[1]. The ionic phase includes dissolved salts, primarily Naþ
and Cl2, and metabolites such as C3H5O3� (lactate ion) and
HCO3� (bicarbonate ion).
The stromal mobile ions interact electrostatically with the
GAG fixed charges and form cloud-like distributions giving
rise to osmotic pressure. The aqueous humour filling the
anterior chamber produces the IOP, acts as an ionic bath for
the stroma and provides a reservoir of water that is available
for exchange with the stroma. Water transport across the per-
meable endothelial layer is driven by the osmotic pressure
difference between the stroma and the aqueous humour.
When the stromal ionic concentration exceeds the ionic con-
centration in the aqueous humour, a positive osmotic
pressure difference exists and the stroma will swell by
inflow of water from the anterior chamber until the ionic con-
centrations are equalized or the expansion is restrained by
some agent. By contrast, the anterior stroma is sealed by
the epithelial cellular layer, which is nearly impermeable to
water and ions (although permeable to O2 and CO2) [11].
In the in vivo cornea, the endothelial layer supports active
molecular mechanisms that produce an outward flux of
ions from the stroma into the aqueous humour. Our analysis
herein confirms that such active pumping reduces the stromal
ionic concentrations and hence lowers the osmotic pressure
[1]. The regulatory system and details of the molecular mech-
anisms responsible for active ion transport, which requires
Naþ, Kþ, ATPase and carbonic anhydrase activity to trans-
port HCO3�, Cl2 and possibly Naþ, are not yet fully
understood [12].
From a macroscopic perspective, the control of hydration
has been explained by a ‘pump-leak’ theory [12–14]. In the
pioneering work of [15], based on the phenomenological
membrane transport theory of Kedem–Katchalsky (KK)
[16], non-equilibrium fluid and ionic fluxes through the
corneal stroma and endothelium were modelled and time-
dependent swelling resulting from osmotic perturbations
were predicted. This work, and the related study by Ruberti &
Klyce [17], provides a theoretical confirmation that active
endothelial ion transport produces an osmotic gradient
across the endothelium which can modulate water flow and
swelling. Li & Tighe [18] later proposed an extended model
which considers multiple ionic species and Leung et al. [19]
have further extended the theory to include metabolites
(e.g. C3H5O3�) and metabolic reactions in a steady-state
model. These models employ a one-dimensional represen-
tation of the cornea, do not consider stromal fixed charge
or collagen interaction with swelling, and the swelling (i.e.
osmotic) pressure is not derived, but assumed as an empirical
function of tissue hydration based on measurements by
Hedbys & Dohlman [20]. In the important extension by
Bryant & McDonnell [21], a spherically symmetric (one-
dimensional) steady-state model based on the triphasic
theory of Lai et al. [22] was combined with KK theory for pas-
sive and active transport across the endothelium. This model
describes ionic interaction with fixed charges, fluid inter-
action with a solid elastic phase and ideal Donnan osmotic
pressure. While greatly simplifying the stromal elasticity,
this model does capture the full range of interactions in an
elegant triphasic framework. The above models are complex,
and it is not surprising that they do not agree for all predic-
tions, for example, on the sign of the stromal fluid pressure.
In this work, we build on these foundational efforts but
take an alternative modelling approach.
In the proposed model, conditions of thermodynamic
equilibrium are assumed to hold, rendering water and ionic
fluxes time-independent. Such an approach has utility when
the long-time, steady-state response of the cornea to disease
processes or surgical alteration is desired. While modelling
based on steady-state conditions does not allow the time
course of swelling to be described, it does avoid some of the
high complexity of non-equilibrium multiphasic theory and
the analytical simplicity of the resulting theory leads to a
practical and effective theory for finite-element-based general
structural analysis of the living cornea.
Modelled as an electrolyte gel, the free energy is taken to
be additively decomposed into various components which
characterize the behaviour of the tissue under general defor-
mations [23,24]. A key ingredient in this approach is the
statement of electrostatic free energy. For the ex vivo cornea
with no active ionic transport, we use the mean-field approxi-
mation of the Helmholtz free energy for a binary electrolyte
which measures the energy of the GAG-based fixed charge,
the osmotic energy of mobile ions in a Boltzmann distribution
and the dielectric free energy [25]. To account for active endo-
thelial ion transport in the in vivo cornea, we consider
thermodynamic equilibrium expressed in terms of ionic and
water electrochemical potentials and show that the stromal
mobile ions satisfy a modified Boltzmann distribution that
depends on the active ionic fluxes and endothelial ionic per-
meability. The theory easily takes into account the important
volume exclusion effects associated with collagen and kerato-
cyte populations [23] and the electrostatic free energy
corresponding to the modified Boltzmann ionic distribution
is readily found and used to predict the osmotic pressure in
the in vivo cornea. Under certain assumptions on the electro-
static potential, we are able to find analytical approximations
for the electrostatic free energy density and osmotic pressure
for the in vivo cornea. The electrostatic free energy functional
is convex in the volume dilation and provides the key vari-
ational ingredient for the finite-element formulation. The
approach can be easily implemented within a standard
finite-element framework using only the displacement field.

rsif.royalsocietypublishing.orgJ.R.Soc.Interface
12:20150241
3
on July 9, 2018http://rsif.royalsocietypublishing.org/Downloaded from
Turning to collagen-swelling interaction, the influence of
collagen architecture on tissue swelling is readily demon-
strated in the ex vivo cornea. When a sample of human
corneal stroma is immersed in deionized water, the tissue
undergoes extreme swelling to many times its original
thickness by absorbing water from the surrounding bath.
However, the observed swelling is far from uniform, reflect-
ing the interaction of local swelling with the collagen
network. The swelling is observed to occur primarily in the
thickness direction and is most pronounced in the posterior
region of the stroma [26–29]. An analogous situation also
occurs in the in vivo swollen cornea [30]. This observed rigid-
ity of the anterior cornea with respect to swelling under
extreme hydration states has been ascribed to the specific
architecture of the collagen fibres [29,31].
The stroma consists of 200–500 superposed sheet-like
lamellae. Meek et al. [32] quantified the orientation of lamellae
when viewed in the plane perpendicular to the optical axis
using X-ray diffraction. That study, and numerous others
since, described superior–inferior and nasal–temporal prefer-
ential collagen orientations in the central cornea and a
circumferential orientation near the limbus. These data have
been employed directly or indirectly in a number of conti-
nuum mechanics-based models to characterize the elastic
anisotropy induced by this ‘in-plane’ description of collagen
architecture, e.g. [3–6]. Abahussin et al. [33] have also per-
formed X-ray diffraction studies on isolated third-thickness
central stromal samples and showed that the percentage of
lamellae exhibiting preferential orientation is greatest in the
posterior stroma and reduces towards the anterior.
To investigate the inclination of lamellae as seen in
corneal cross-sections, Morishige et al. [34] used second
harmonic-generated (SHG) image stacks to reveal lamellae
exiting Bowman’s layer at steep angles (average 238 maxi-
mum 438) and extending up to 120 mm into the stromal
depth. It has long been thought that lamella inclination and
insertion into Bowman’s layer provides mechanical stabiliz-
ation of the refractive surface [26–29]. High-resolution
macroscopic imaging, which combines many SHG image
stacks to produce entire limbus-to-limbus stromal three-
dimensional cross-sections, has allowed some lamellae to be
traced over millimetres, even with branching and led to the
discovery of ‘bow string’ fibres that enter and exit Bowman’s
layer [35,36]. Recently, Winkler et al. [37] processed SHG
images to quantify inclination angle distributions in the
anterior stroma and found that lamellae inclination angles
satisfy a Gaussian distribution with inclination angles being
maximum at the anterior stroma and reducing linearly
towards the posterior.
In this work, we have synthesized X-ray scattering inten-
sity data and SHG image processing to describe the spatially
varying, three-dimensional orientation of lamellae at every
point in the human stroma, including through the depth.
The raw data are still incomplete in some regions and
extrapolation has been necessary, as described in §5. Never-
theless, the most significant features of collagen architecture
are now most probably accounted for, allowing a comprehen-
sive description of the elastic anisotropy of the stromal
collagen network and regional collagen-swelling interaction.
The proposed model is implemented in a finite-element
framework and employed to predict free and confined swel-
ling of stroma in an ionic bath. For the in vivo cornea, the
model is used to simulate corneal hydration changes which
occur as a result of increasing IOP, such as occurs in glau-
coma. Corneal swelling in Fuchs’ corneal dystrophy is
employed as an illustration of how the model can be adapted
to describe certain pathological conditions. Whenever the
cornea is altered by the surgical removal of tissue, the
tissue fluid pressure will change and a swelling response
can be anticipated. We analyse the biomechanical response of
the in vivo cornea to a typical LASIK surgery for myopia
and predict, for the first time, how the fluid pressure and
tissue swelling will respond. As a validation of the model,
the predicted biomechanical response of the cornea (based
on elastic deformation and swelling) is compared to extensive
clinical data.
2. Electrolyte gel in thermodynamic equilibrium2.1. Electrostatic free energyConsider a binary electrolyte gel, consisting of a mixture of
solid, fluid and ionic phases, immersed in an ionic bath at
constant electrostatic potential w0, hydrostatic pressure p0,
and ionic concentration C0þ ¼ C0� ¼ C0: The stroma can be
modelled as such a binary electrolyte of Naþ and Cl2. This
is justified by the fact that the molar concentration of these
ions accounts for about 85% of the total molarity of the aqu-
eous humour [18,19], which acts as an ionic bath. Noting that
all ionic species in the stroma have the same valence value of
21, we set the ionic concentration of Naþ and Cl2 in the aqu-
eous humour to C0þ ¼ C0� ¼ 150 mM and thereby account
for the total molarity of all solutes in the aqueous humour,
which is approximately 300 mM [18,19,23].
The reference state for the electrostatic free energy is taken
to be the normo-hydrated cornea (i.e. the physiological state)
which can be routinely measured. A unit cell reference con-
figuration is denoted V0, with volume V0, and with a fixed
charge concentration distribution modelled by the function
Cf0ðXÞ with X [ V 0: The motion maps V0 into the current
configuration V with deformation gradient F, considered
uniform over the unit cell by virtue of the small unit cell
size. The volume of V is V ¼ JV0 with J ¼ det F: The fixed
charge concentration distribution in the current configura-
tion is modelled by the function Cf(x, J ) with x [ V: The
fixed charge concentration functions Cf0(X) and Cf(x, J ) are
developed in §3.1.
The reference configuration V0 will generally not be a
stress-free configuration for the solid (collagen) phase1 and
it is necessary to introduce a stress-free reference configur-
ation for the solid phase, denoted S [3]. The deformation
gradient F0 from S to the current configuration V may be
multiplicatively decomposed such that F0 ¼ FF0, where F0
is the deformation gradient from S to V0. Algorithms for
finding S and F0 have been described, for example, by
Pinsky et al. [3] and Gee et al. [38].
The Gibbs free energy density, measured per unit refer-
ence volume, of the electrolyte gel in V may be additively
decomposed [24] into four components
Gðw, C, C0Þ ¼WelasticðC0Þ þWelectrolyteðw, CÞþWbathðCÞ þ Vexternal, ð2:1Þ
where w is the electrostatic potential and C ¼ FTF and
C0 ¼ F0TF0 are right Cauchy–Green deformation tensors.
The elastic strain energy density Welastic of the solid phase

rsif.royalsocietypublishing.orgJ.R.Soc.Interface
12:20150241
4
on July 9, 2018http://rsif.royalsocietypublishing.org/Downloaded from
is associated with fibril stretching and matrix shearing and
must be based on the three-dimensional collagen organiz-
ation within the stroma. A detailed description of this term
is deferred to §5.
The mean-field approximation for the Helmholtz free
energy density Welectrolyte of a binary electrolyte in V is
given by [25]
Welectrolyteðw, CÞ ¼ 1
V0
ðV
"zfFCfðx, JÞwðxÞ
� 2RTC0
cosh
FRT
wðxÞ� �
� 1
!� ew
2jrwðxÞj2
#dV,
ð2:2Þ
where Cf(x, J ) is the fixed charge concentration in V and
measured in moles per litre, zf ¼ 21 is the fixed charge
valence value, and R, T, F and ew are the gas constant, temp-
erature, Faraday constant and dielectric permittivity of the
electrolyte solvent, respectively. The first term in the inte-
grand measures the free energy of the fixed charge. The
second term includes the excess mean concentration of
the mobile ions at any point in the electrolyte compared to
the bath and, after multiplication by RT, may be interpre-
ted as the osmotic work of introducing excess ions into
the neighbourhood of the fixed charges. The last term
ew=2jrwj2 ¼ E �D=2, where E ¼ rw is the electric field and
D ¼ ewE is the electric displacement, measures the dielectric
free energy. Observe that Welectrolyte is defined to be the
average electrostatic free energy density over the unit cell.
The average free energy density of the bath is
WbathðCÞ ¼ �1
V0
ðV(J)
V0
p0dV ¼ � p0ðJ � 1Þ: ð2:3Þ
Finally, Vexternal is the potential of the external loads, includ-
ing body forces and boundary tractions. The list of terms
appearing in the free energy expression (2.1) is not exhaus-
tive; for example, the free energies of mixing and
disassociation [39,40] can also be considered. However,
osmotic energy is dominant in highly hydrated gels [2,39]
and additional terms are neglected in the current theory.
2.2. Thermodynamic equilibriumThe condition dwWelectrolyte ¼ 0 corresponds to electrostatic
equilibrium and the Euler–Lagrange equation is the Poisson–
Boltzmann equation for the electrostatic potential on V,
�r2w ¼ Few
�Cf þX
i¼þ,�ziCi
!, ð2:4Þ
with ionic concentrations satisfying the Boltzmann distribution
Ci ¼ C0 exp �ziF
RT(w� w0)
� �, i ¼ þ,� : ð2:5Þ
The condition for mechanical equilibrium is found by set-
ting dC0Welastic þ dCWelectrolyte þ dCWbath ¼ 0: The variation of
the elastic free energy Welastic is taken with respect to C0 to
incorporate the solid phase prestress, as discussed above.
Noting that Welectrolyte and Wbath depend on C only through
J, it follows that:
@Welastic
@C0:dC0 þ
@Welectrolyte
@Jþ @Wbath
@J
� �@J@C
:dC ¼ 0: ð2:6Þ
The Euler–Lagrange equation of this variational form on V is
found to be
r � ðs� ðPos þ p0Þ1Þ ¼ 0, ð2:7Þ
where the effective Cauchy stress s is given in the standard
manner by
s ¼ f0� 2@Welastic
@C0
� �, ð2:8Þ
in which f0�ð�Þ ¼ ðJ0Þ�1F0ð�ÞF0T is the second-order push-
forward operator from S to V, with J0 ¼ det F0: The unit
cell osmotic pressure Pos in V is given by
Pos ¼ �@Welectrolyte
@J: ð2:9Þ
It is also seen that,
p0 ¼ �@Wbath
@J, ð2:10Þ
so that the electrolyte fluid pressure p is given by
p ¼ �@Welectrolyte
@J� @Wbath
@J¼ Pos þ p0: ð2:11Þ
2.3. Recovery of Donnan osmotic pressureTo illustrate the application of functional (2.2), consider the
special case in which the reference fixed charge density Cf0
is uniform over the unit cell. The fixed charge density in
the deformed configuration is then simply
CfðJÞ ¼ J�1Cf0: ð2:12Þ
For this problem, the (Donnan) electrostatic potential,
denoted ~w, is uniform over the unit cell and be may be
solved from (2.4) as
~w ¼ w0 þRTF
sinh�1 zfCf
2C0
� �: ð2:13Þ
Observing that jrewj ¼ 0 and introducing (2.13) into (2.2) and
with use of (2.12), the Helmholtz electrostatic free energy
density reduces to
Welectrolyte(J) ¼ Cf0RT sinh�1 Cf0
2 JC0
� �
� 2JRTC0
ffiffiffiffiffiffiffiffiffiffiffiffiffiffiffiffiffiffiffiffiffiffiffiffiffiffiffiffiCf0
2 JC0
� �2
þ 1
s� 1
0@ 1A: ð2:14Þ
Employing the above equation in (2.9) yields
Pos ¼ 2RTC0
ffiffiffiffiffiffiffiffiffiffiffiffiffiffiffiffiffiffiffiffiffiffiffiffiffiCf
2C0
� �2
þ 1
s� 1
0@ 1A, ð2:15Þ
which recovers the classical Donnan osmotic pressure [41,42].
Table 1. Parameters of the electrolyte and collagen organization models.
parameter value
fcol, volume fraction of the collagen fibrils (%) 24.9a
fker, volume fraction of the keratocytes (%) 11.2a
fcoat, volume fraction of the PG-dense
coating (%)
13.3a
Cavg, average charge density of the corneal
stroma (mM)
38.6b
l, the charge partition parameter 0.65c
QþQ2, dimensionless parameter by the ionic
pumping effect
0.965d, 1.0e
m, matrix shear modulus (kPa) 5.0f
a, collagen fibril stiffness parameter (MPa) 0.03f
b, collagen fibril stiffness parameter 75.0f
p0, the hydrostatic pressure in bath solution
(mmHg)
0e, 15.0g
C0, bath concentration (mM) 150, 0.00015h
T, temperature (K) 298aValues derived from [8,23].bCalibrated value by Cheng & Pinsky [23].cValue estimated by Cheng & Pinsky [23].dValues calibrated for in vivo corneas (see §4).eValue for ex vivo corneas.fValues estimated by Petsche [44].gValues for in vivo corneas.hRepresentative of the ionic concentrations for aqueous humour anddeionized water.
rsif.royalsocietypublishing.orgJ.R.Soc.Interface
12:20150241
5
on July 9, 2018http://rsif.royalsocietypublishing.org/Downloaded from
3. Application to the human cornea3.1. Fixed charge concentrationThe predominant corneal GAGs are keratan sulfate, dermatan
sulfate and chondroitin sulfate [9,10]. A detailed FACE2 [43]
analysis reveals that only a portion of the available GAG
monosaccharides is sulfated in the human cornea. It has
been estimated [23] that the average ionization fraction
(i.e. ratio of the charge per disaccharide unit to the num-
ber of groups that are ionizable) over all corneal GAGs is
favg ¼ 72.6%. If the unit cell within the normo-hydrated
stroma contains Ng GAG chains with average contour
length Lc and if b is the length of a monosaccharide unit,
the total GAG fixed charge in the unit cell is
Q ¼NgLce favg
b, ð3:1Þ
where e is the unit charge. The average fixed charge concen-
tration, measured in mM units, is then
Cavg ¼Q
FV0¼
ngLce favg
Fb, ð3:2Þ
where ng ¼ Ng=V0 is the average GAG number density and Fis the Faraday constant. Cavg has been measured indirectly
[1,2], and the value used in this study is taken from [23]
and given in table 1.
X-ray scattering studies under varying tissue hydration
[45] suggest that some portion of stromal PGs form a
charge-rich and water-binding PG-coating surrounding each
collagen fibril. The radius of the coating has been measured
to be rc ¼ 18.25 nm and this radius is insensitive to hydration
over a wide range. The existence of such a surface ultrastruc-
ture on the collagen fibrils is corroborated by image studies
from [46,47]. In addition, a theoretical study on transparency
by Twersky [48] proposed that collagen fibrils must be
centred in a transparent coating and the coated fibrils
occupy approximately 60% of the matrix volume, giving
rc ¼ 21.56 nm. Recent three-dimensional electron microscopy
reconstructions of corneal collagen and GAG chains [9] also
suggests that some GAG chains are in close association
with the fibrils while the remaining GAG chains have
random orientation in the interfibrillar fluid.
Given the regular arrangement of fibrils within a lamella,
the nanoscale unit cell is selected to be of the form shown in
figure 1c. It is a rectangular prism with cross-section as
shown in figure 1c and with axial axis aligned with the
collagen fibrils. Each fibril has a GAG-coating region. As
described below, fixed charge concentrations in the unit cell
will depend on various volume fractions, including the
collagen and coating regions.
Let the unit cell current configuration V be partitioned
into collagen fibril, coating and inter-coating domains
(figure 1c) such that V ¼ Vcoll < Vcoat < Vinter and where
vol(VÞ ¼ V ¼ JV0: We seek expressions for the fixed charge
density over the subregions of V as a function of dilation J.A parameter l is used to partition the total unit cell GAG
fixed charge Q into interfibrillar GAG fixed charge lQ and
coating GAG fixed charge (1 2 l)Q. The value of l ¼ 0.65
has been estimated from swelling pressure measurements
[23]. Note that because all GAG chains bind at one end to a
collagen fibril, the interfibrillar GAG chains must pass
through the GAG-coating region and their charges therefore
combine in that region. The coating and interfibrillar GAGs
are assumed to produce uniform charge concentration
distributions over their respective domains.
In determining the fixed charge concentrations as a func-
tion of macroscopic dilation J, account must be taken of
keratocyte volumes which are assumed to exclude GAG
fixed charge. Keratocytes are morphologically flattened fibro-
blasts that occur between lamellae [11]. They are considerably
larger than the unit cell and their effect is therefore intro-
duced in an average way (figure 1b). Stromal collagen and
keratocyte volume fractions are denoted fcol and fker,
respectively. Assuming that keratocyte cells dilate with the
tissue dilation [49] and assuming collagen fibrils are non-
swelling [1,50,51], the charge concentrations in the current
unit cell configuration V are then given by Ccoat and Cinter
in the coating and inter-coating regions, respectively, as
Ccoatðx, JÞ ¼ l
Jð1� fkerÞ � fcol
þ 1� l
fcoat
� �Cavg,
x [ Vcoat
ð3:3Þ
and
Cinterðx, JÞ ¼ l
Jð1� fkerÞ � fcol
� �Cavg, x [ Vinter, ð3:4Þ
where fcoat is the volume fraction of the coating region. Note
that the coating volume is independent of dilation J as
required by the experimental observations of Fratzl &
rsif.royalsocietypublishing.orgJ.R.Soc.Interface
12:20150241
6
on July 9, 2018http://rsif.royalsocietypublishing.org/Downloaded from
Daxer [45]. In (3.3) and (3.4), Cavg ¼ Q/FV0 is the average
charge concentration in the reference configuration V0 given
by (3.2). It is easily verified that (3.3) and (3.4) conserve
unit cell total fixed charge under any volume dilation J.Volume fraction values used in this study are provided in
table 1.
Finally, assuming that keratocytes have the same mass
density as water, the unit cell volume dilation J can be related
to the stromal hydration Hw, defined as water weight per unit
dry (collagen) weight, as follows:
HwðJÞ ¼ðJ � frfcolÞrw
frfcolrcol
, ð3:5Þ
where rw ¼ 1 g cm23 and rcol ¼ 1.36 g cm23 are the mass
density of the water and dry collagen fibrils [51], respectively,
and fr is the relative volume fraction of collagen molecules
within the fibrils (which excludes the intrafibrillar bound
water) [1,50]. The value of fr is estimated to be 0.75 such
that the stromal hydration Hw is 3.2 at the normal condition
J ¼ 1 [1]. Therefore, equation (3.5) is rewritten as
HwðJÞ ¼ 3:94 J � 0:74: ð3:6Þ
The linearity is consistent with measurements [52,53].
It should also be noted that the estimated value fr ¼ 0.75 is
in very close agreement with the value 0.77 reported by
Goodfellow et al. [50].
3.2. Active endothelial ion transportThe corneal endothelium is a 5 mm thin cellular monolayer
located on the posterior surface of the cornea. It is permeable
to water, metabolic species, including glucose and lactate ion,
and other salt ions [11]. The endothelium regulates stromal
hydration by providing active ion transport across the endo-
thelium, from the stroma to the aqueous humour [1,12]. To
allow sufficient generality, we model steady and independent
anion and cation active transport and measure their effects
(singularly or combined) on osmotic pressure by deriving
a modified Boltzmann ion distribution for the stroma and
the corresponding electrostatic free energy density for the
in vivo cornea.
The endothelial layer is here modelled as an ideal mem-
brane in which the action of the ion pumps is represented
by independent active steady anion flux Ja2 and cation flux
Jaþ, transporting ions out of the stroma and into the aqueous
humour [21]. Because the endothelium is thin compared with
the stroma, we will assume transport across the endothelium
is one-dimensional. A coordinate z is introduced with z ¼ z0
at the endothelium–aqueous interface and z ¼ z* at the
endothelium–stroma interface. At equilibrium, the net ionic
fluxes J2 and Jþ, which result from both active and passive
transport, must vanish so that
Ji ¼ �Lidmi
dz� Jai ¼ 0, i ¼ þ,� , ð3:7Þ
where Li is the membrane permeability of ionic species i and
Jai . 0 is the steady active ionic flux across the endothelium,
from the stroma and into the aqueous humour. The ionic elec-
trochemical potential mi is given by
mi ¼ mrefi þ
RTMi
ln Ci þ ziFwMi
, i ¼ þ,� , ð3:8Þ
where Mi(i ¼ þ,2) are the cation and anion atomic weights,
respectively, mrefi are the ionic chemical potentials at the
reference state. Using (3.8) in (3.7) gives
1
Ci
dCi
dzþ zi
FRT
dw
dzþ 1
RTMiJai
Li¼ 0, i ¼ þ,� , ð3:9Þ
and adding both equations in (3.9) results in
1
Cþ
dCþdzþ 1
C�
dC�dz¼ � 1
RTMþJaþ
LþþM�Ja�
L�
� �: ð3:10Þ
Integrating (3.10) across the endothelium leads to
lnC�þC0þ ln
C��C0¼ � h
RTMþJaþ
LþþM�Ja�
L�
� �, ð3:11Þ
where h ¼ z� � z0 is the thickness of the endothelial layer, C�iare the ionic concentrations at z ¼ z� and C0 is the bath
(i.e. aqueous humour) ionic concentration. Observe that
the right-hand side of (3.11) is dimensionless as required.
Defining,
Qi ¼ exp � hRT
MiJai
Li
� �, i ¼ þ,� , ð3:12Þ
it follows that 0 � Qi � 1 and from (3.11),
C�þC�� ¼ QþQ�C20: ð3:13Þ
Finally, integrating (3.9) across the endothelium, and taking
the electrostatic potential in the aqueous w0 ¼ 0, gives
C�i ¼ QiC0 exp �ziFw�
RT
� �, ð3:14Þ
where w� is the electrostatic potential at z ¼ z*.
At thermodynamic equilibrium, the gradients of the ion
electrochemical potentials vanish and mi ¼ m�i , where mi is
the electrochemical potential at any point in the stroma, and
assuming that ionic concentrations are continuous across the
endothelial–stroma interface, this condition implies that
Ci ¼ C�i exp �ziF
RTðw� w�Þ
� �: ð3:15Þ
Introducing (3.14) into the above equation allows the stromal
ionic concentrations Ci to be expressed as
Ci ¼ QiC0 exp �ziFwRT
� �, ð3:16Þ
which generalizes the Boltzmann distribution (2.5). From this
result, it may be seen that at any point in the stroma, the ionic
concentrations Cþ and C2 must satisfy the condition
CþC� ¼ QþQ�C20: ð3:17Þ
3.3. Modified electrostatic free energyBased on (3.16), a modified Poisson–Boltzmann equation for
the electrostatic potential in the stroma is introduced as
�r2w ¼ Few
�Cf þX
i¼þ,�ziQiC0 exp �zi
FwRT
� � !, ð3:18Þ

stroma
epithelium
endothelium
IOP = 15 mmHg
K
(b)
(a)
(c)
Figure 1. (a) The cornea is a fibre-reinforced electrolyte gel that resists the IOP. The collagen lamellae mostly follow the corneal curvature except in the anteriorregion where the lamellae are interweaving and inclined relative to the corneal surface, and are seen to insert into Bowman’s layer. (b) An illustration of theorganization of the corneal stroma showing several lamellae and a keratocyte cell. Collagen fibrils within lamellae are found in parallel arrays following thefibril direction; keratocyte cells are found interspersed between adjacent lamellae. (c) Cross-section of an idealized unit cell representing the hexagonal collagenfibril lattice. The coating region around the central cylinder (representing the collagen fibril) and the irregular lines in between are illustrative of the coating GAGsand interfibrillar GAGs, respectively.
rsif.royalsocietypublishing.orgJ.R.Soc.Interface
12:20150241
7
on July 9, 2018http://rsif.royalsocietypublishing.org/Downloaded from
and the corresponding modified electrostatic free energy
density is
Wstroma ¼1
V0
ðV
"�FCfw� RTC0
Xi¼þ,�
Qi exp �ziFwRT
� �� 2
!
� ew
2jrwj2
#dV:
ð3:19Þ
It may be verified that this functional is stationary at the
solution of the modified Poisson–Boltzmann equation
(3.18), i.e. dwWstroma ¼ 0: It may also be observed that if the
active fluxes Ja2 and Jaþ increase, the osmotic free energy,
measured by the second term in the integrand, reduces.
3.4. Analytical approximation for osmotic pressureRecognizing that the fixed charge density Cf(x, J ) is piecewise
constant over the unit cell, and noting that the unit cell is large
compared to the Debye length [23], we employ a piecewise
constant Donnan potential ~w as an approximation for the
exact electrostatic potential w which is required to satisfy the
Poisson–Boltzmann equation (3.18). By assumption r~w ¼ 0,
and equation (3.18) may be used to solve for the Donnan poten-
tial. Recalling that the fixed charge density Cfðx,JÞ ¼ CcoatðJÞfor x [ Vcoat and Cfðx,JÞ ¼ CinterðJÞ for x [ Vinter, the
Donnan potentials over Vcoat and Vinter are given by
~wrðJÞ ¼RTF
ln �~CrðJÞQ�þ
ffiffiffiffiffiffiffiffiffiffiffiffiffiffiffiffiffiffiffiffiffiffiffi~C
2
r ðJÞQ2�þQþ
Q�
s0@ 1A,
r ¼ coat, inter,
ð3:20Þ
where the non-dimensional fixed charge concentrations ~Ccoat
and ~Cinter are defined by
~CrðJÞ ¼CrðJÞ2C0
, r ¼ coat, inter, ð3:21Þ
and where the fixed charge densities Ccoat(J ) and Cinter(J ) are
given by (3.3) and (3.4), respectively.
Employing potentials (3.20), the Helmholtz free energy
density (3.19) reduces to
WstromaðJÞ ¼X
r¼coat,inter
VrðJÞV0
"�FCrðJÞ~wrðJÞ � RTC0
Xi¼þ,�
Qi exp �ziF~wrðJÞ
RT
� �� 2
!#, ð3:22Þ
where Vcoat¼fcoatV0 and Vinter¼ðJð1� fkerÞ � fcol � fcoatÞV0:
It can be shown that Wstroma is convex in J. The
unit cell osmotic pressure then follows from (2.9) as
Pos ¼ �@Wstroma=@J, giving
PosðJÞ¼2ð1�fkerÞRTC0
ffiffiffiffiffiffiffiffiffiffiffiffiffiffiffiffiffiffiffiffiffiffiffiffiffiffiffiffi~C
2
interþQþQ�
q�1
� �þ2ð1�fkerÞfcoat
Jð1�fkerÞ�fcol
RTC0~Cinter(gsinh�1 ~Ccoat�gsinh�1 ~Cinter),
ð3:23Þ
in which a modified inverse hyperbolic sine function is
introduced to simplify the expression
gsinh�1ðxÞ ¼ ln xþffiffiffiffiffiffiffiffiffiffiffiffiffiffiffiffiffiffiffiffiffiffiffiffix2 þQþQ�
p� �: ð3:24Þ
The osmotic compressibility, defined as KosðJÞ ¼�@Pos=@J, is the core function in the stroma electrolyte
tensor Cstroma ¼ 4@2Wstroma=@C@C required for the finite-
element tangent operator (see the electronic supplementary
80
60
40
20
–20
–40
–60
–800.94 0.96 0.98 1.00
0
P os (
mm
Hg)
Q+Q–
ex v
ivo
in v
ivo
reduced osmotic pressure
increased ionicpumping
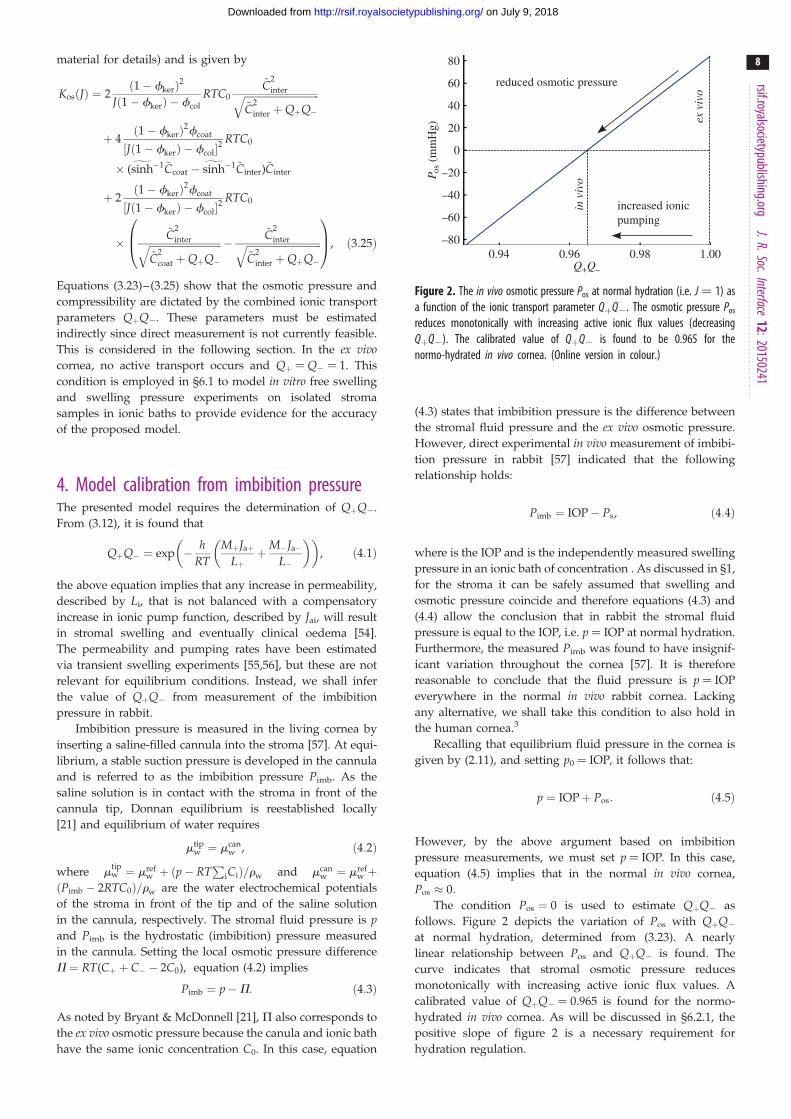
Figure 2. The in vivo osmotic pressure Pos at normal hydration (i.e. J ¼ 1) asa function of the ionic transport parameter QþQ2. The osmotic pressure Pos
reduces monotonically with increasing active ionic flux values (decreasingQþQ2). The calibrated value of QþQ2 is found to be 0.965 for thenormo-hydrated in vivo cornea. (Online version in colour.)
rsif.royalsocietypublishing.orgJ.R.Soc.Interface
12:20150241
8
on July 9, 2018http://rsif.royalsocietypublishing.org/Downloaded from
material for details) and is given by
KosðJÞ ¼ 2ð1� fkerÞ2
Jð1� fkerÞ � fcol
RTC0
~C2
interffiffiffiffiffiffiffiffiffiffiffiffiffiffiffiffiffiffiffiffiffiffiffiffiffiffiffiffiffiffi~C
2
inter þQþQ�q
þ 4ð1� fkerÞ2fcoat
½Jð1� fkerÞ � fcol�2RTC0
� (gsinh�1 ~Ccoat �gsinh�1 ~Cinter)~Cinter
þ 2ð1� fkerÞ2fcoat
½Jð1� fkerÞ � fcol�2RTC0
�~C
2
interffiffiffiffiffiffiffiffiffiffiffiffiffiffiffiffiffiffiffiffiffiffiffiffiffiffiffiffiffi~C
2
coat þQþQ�q �
~C2
interffiffiffiffiffiffiffiffiffiffiffiffiffiffiffiffiffiffiffiffiffiffiffiffiffiffiffiffiffiffi~C
2
inter þQþQ�q
0B@1CA, ð3:25Þ
Equations (3.23)–(3.25) show that the osmotic pressure and
compressibility are dictated by the combined ionic transport
parameters QþQ2. These parameters must be estimated
indirectly since direct measurement is not currently feasible.
This is considered in the following section. In the ex vivocornea, no active transport occurs and Qþ ¼ Q2 ¼ 1. This
condition is employed in §6.1 to model in vitro free swelling
and swelling pressure experiments on isolated stroma
samples in ionic baths to provide evidence for the accuracy
of the proposed model.
4. Model calibration from imbibition pressureThe presented model requires the determination of QþQ2.
From (3.12), it is found that
QþQ� ¼ exp � hRT
MþJaþLþ
þM�Ja�L�
� �� �, ð4:1Þ
the above equation implies that any increase in permeability,
described by Li, that is not balanced with a compensatory
increase in ionic pump function, described by Jai, will result
in stromal swelling and eventually clinical oedema [54].
The permeability and pumping rates have been estimated
via transient swelling experiments [55,56], but these are not
relevant for equilibrium conditions. Instead, we shall infer
the value of QþQ2 from measurement of the imbibition
pressure in rabbit.
Imbibition pressure is measured in the living cornea by
inserting a saline-filled cannula into the stroma [57]. At equi-
librium, a stable suction pressure is developed in the cannula
and is referred to as the imbibition pressure Pimb. As the
saline solution is in contact with the stroma in front of the
cannula tip, Donnan equilibrium is reestablished locally
[21] and equilibrium of water requires
mtipw ¼ mcan
w , ð4:2Þ
where mtipw ¼ mref
w þ ðp� RTP
iCiÞ=rw and mcanw ¼ mref
w þðPimb � 2RTC0Þ=rw are the water electrochemical potentials
of the stroma in front of the tip and of the saline solution
in the cannula, respectively. The stromal fluid pressure is pand Pimb is the hydrostatic (imbibition) pressure measured
in the cannula. Setting the local osmotic pressure difference
P ¼ RT(Cþ þ C� � 2C0), equation (4.2) implies
Pimb ¼ p�P: ð4:3Þ
As noted by Bryant & McDonnell [21], Q also corresponds to
the ex vivo osmotic pressure because the canula and ionic bath
have the same ionic concentration C0. In this case, equation
(4.3) states that imbibition pressure is the difference between
the stromal fluid pressure and the ex vivo osmotic pressure.
However, direct experimental in vivo measurement of imbibi-
tion pressure in rabbit [57] indicated that the following
relationship holds:
Pimb ¼ IOP� Ps, ð4:4Þ
where is the IOP and is the independently measured swelling
pressure in an ionic bath of concentration . As discussed in §1,
for the stroma it can be safely assumed that swelling and
osmotic pressure coincide and therefore equations (4.3) and
(4.4) allow the conclusion that in rabbit the stromal fluid
pressure is equal to the IOP, i.e. p ¼ IOP at normal hydration.
Furthermore, the measured Pimb was found to have insignif-
icant variation throughout the cornea [57]. It is therefore
reasonable to conclude that the fluid pressure is p ¼ IOP
everywhere in the normal in vivo rabbit cornea. Lacking
any alternative, we shall take this condition to also hold in
the human cornea.3
Recalling that equilibrium fluid pressure in the cornea is
given by (2.11), and setting p0 ¼ IOP, it follows that:
p ¼ IOPþ Pos: ð4:5Þ
However, by the above argument based on imbibition
pressure measurements, we must set p ¼ IOP. In this case,
equation (4.5) implies that in the normal in vivo cornea,
Pos � 0:
The condition Pos ¼ 0 is used to estimate QþQ2 as
follows. Figure 2 depicts the variation of Pos with QþQ2
at normal hydration, determined from (3.23). A nearly
linear relationship between Pos and QþQ2 is found. The
curve indicates that stromal osmotic pressure reduces
monotonically with increasing active ionic flux values. A
calibrated value of QþQ2 ¼ 0.965 is found for the normo-
hydrated in vivo cornea. As will be discussed in §6.2.1, the
positive slope of figure 2 is a necessary requirement for
hydration regulation.

offset D(X)
q q q
p p0
htotaltotal scatter area
FX-rayinterpolated total scatter
huniuniform scatter area
halign
aligned scatter area
2
q
p p02
q
p p02
p p02
p0 p2
rq (X, s, q)X-ray(b)
(a)
Figure 3. (a) The X-ray scattering intensity can be additively decomposed into uniform and aligned parts. (b) The distribution interpolated from surrounding scanpoints is offset based on the depth within the stroma to increase alignment in the posterior.
rsif.royalsocietypublishing.orgJ.R.Soc.Interface
12:20150241
9
on July 9, 2018http://rsif.royalsocietypublishing.org/Downloaded from
5. Collagen organization and stromal elasticity5.1. Angular averagingIn this section, we review the modelling of the stromal fibres
which contribute to the elastic strain energy density Welastic
appearing in (2.1). It is assumed that Welastic is additively
decomposed into an anisotropic part describing the strain
energy density of the three-dimensional collagen fibre network
and an isotropic part that gives a simple phenomenological
description of the small background shear stiffness of the
extracellular matrix such that
WelasticðC0Þ ¼WfibreðC0Þ þWshearðI01Þ: ð5:1Þ
Recall from §2.1, that C0 ¼ F0TF0 describes the deformation
measured from the stress-free configuration S, and F0 is
the deformation gradient from the stress-free configuration
S to the current configuration V. The invariant I01 ¼ tr C0
is used to describe an isotropic contribution based on the
unimodular right Cauchy–Green deformation tensor
C0 ¼ ðJ0Þ�2=3C0 and J0 ¼ det F0 [58].
The invariant I04 ¼ A � C0A ¼ ðl0AÞ2, which measures the
stretch along a fibre with direction A, is used to describe elas-
tic anisotropy. It is important to note that I04 depends on the
dilation through its dependence on C0, allowing the descrip-
tion of fibre stretching resulting from electrolyte swelling. The
form of WfibreðC0Þ is based on the use of angular integration
[3,59] such that
WfibreðC0Þ ¼ kWstretchðI04ÞlA ð5:2Þ
¼ 1
n
ðv
rðX, AÞWstretchðl0AÞdv, ð5:3Þ
where v is the unit sphere, r(X, A) is the distribution of fibre
directions, n ¼Ðv rðX, AÞdv is the normalization and the
fibre stretching energy Wstretchðl0AÞ is described below.
The function r(X, A) may be based on fibre orientation
information obtained from X-ray diffraction and SHG
imaging as described in [6]. A fibre direction A can be
expressed in spherical coordinates with azimuthal angle
u [ ½0, 2p� and inclination angle f [ ½0, p�: As the anterior
and posterior surfaces have different curvatures, a local coor-
dinate system is introduced that varies pointwise through the
corneal thickness and matches both the anterior and posterior
curvatures at those limits; details can be found in [6]. Every
material point within the cornea has a unique angular distri-
bution with no perfect symmetry over quadrants. We set
rðX, AÞ ¼ rð�X, s, u, fÞ where �X is a point on the cornea
anterior surface, s [ ½0, 1� is the non-dimensional corneal
depth measured from the anterior surface, and assume,
rð�X, s, u, fÞ ¼ rX�rayu ð�X, s, uÞrSHG
f ð�X, s, fÞ, ð5:4Þ
where rX-rayu is based on X-ray diffraction data and rSHG
f is
based on SHG imaging. The current model generalizes
the approach in [6] in two respects: rX-rayu incorporates
depth-dependence of preferred fibre directions, and rSHGf
incorporates direct statistical measurement of inclination
data. These are briefly summarized below.
5.2. Azimuthal distribution rX-rayu
In [3], analytical distribution functions were introduced to
represent data from X-ray diffraction experiments by Meek
et al. [60]. Following [6], we have eliminated the need to
introduce analytical distribution functions and directly
employ the raw X-ray data. These data provide scattering
intensities versus orientation on a discrete grid of points
over the cornea’s anterior surface. At any point in the
cornea, the orientation distribution is obtained by interpolat-
ing the X-ray diffraction measurements taken at the nearest
four grid points using bilinear Lagrange functions. This
procedure ensures that any subtle variations in distribu-
tions found in the X-ray data are faithfully reproduced in
the model. At any scan point �X, the X-ray scattering data
FX�rayðuÞ, which corresponds to a measurement through
the entire thickness, can be analysed in the following way.

70
60
50
40
30
20
10
0
70
60
50
40
30
20
10
010 anterior central posterior
(0.3s + 0.16) × 100% (0.3s + 0.35) × 100%
per
cent
alig
ned
depth depth
13
23
10 anterior central posterior13
23
(b)(a)
Figure 4. Data from [33] of alignment percentage for each third in the central cornea is fit with a linear curve (a). The depth-dependence of alignment is approxi-mated from a full-thickness X-ray scan near the limbus by fitting with a line of the same slope (b). (Online version in colour.)
rsif.royalsocietypublishing.orgJ.R.Soc.Interface
12:20150241
10
on July 9, 2018http://rsif.royalsocietypublishing.org/Downloaded from
The total scatter htotal is the area under the curve,
htotal ¼ðp
0
FX-rayðuÞdu: ð5:5Þ
This can be additively decomposed into aligned and
uniform parts htotal ¼ halign þ huni where huni ¼ mp and
m ¼ min½FX-rayðuÞ� (figure 3a).
The percentage of all aligned fibres �nalign is then
�nalign ¼htotal �mp
htotal
: ð5:6Þ
The depth-dependence of aligned fibres may be intro-
duced based on the work of Abahussin et al. [33], who
performed X-ray diffraction studies on isolated third-
thickness stromal samples and characterized the variation
of scattering intensity with depth at the corneal centre.
They found the average percentage of total fibres exhibiting
preferred azimuthal directions valign was 22%, 31% and 42%
in the anterior, central and posterior thirds, respectively.
However, depth-dependent alignment was not measured at
the cornea’s periphery where there is significantly more
alignment. A linear best-fit of alignment as a function of
depth for the data is 0.3sþ1/6 with R2 ¼ 0.997. Based on
the slope of this function, a first approximation for the
depth-dependence of aligned fibres is nalignðsÞ ¼ 0:3sþ d:
For the central full-thickness X-ray scans in the current data-
base of implemented X-ray diffraction data (four donor
corneas, including a right and left cornea from the
same donor), we find �nalign � 31% for all subjects,
which corresponds well to the mid-thickness value measu-
red by Abahussin et al. [33]. Thus, to evaluate d we set
nalignð0:5Þ ¼ �nalign which gives d ¼ �nalign � 0:15: Then,
nalignð�X, sÞ ¼ �nalignð�XÞ þ 0:3s� 0:15 ð5:7Þ
defines the fraction of aligned fibres based on in-plane
position �X and depth s (figure 4).
In order to generate a depth-dependent distribution,
the full thickness distribution htotal is augmented by D(s)
such that nalignðsÞ ¼ halign=ðhtotal þ pDðsÞÞ (figure 3b). Solving
for D(s) gives
DðsÞ ¼ 1
p
halign
nalignðsÞ� htotal
!: ð5:8Þ
The final distribution will then be,
rX-rayu ð�X, s, uÞ ¼ FX-rayð�X, uÞ þ Dð�X, sÞ:
Incorporating the X-ray diffraction data in this manner
describes the depth-dependent anisotropy resulting from
the well-documented S–I and N–T preferred directions of
lamellae in the vicinity of the corneal vertex as well as the
circumferentially preferred orientations at the limbus [44].
5.3. Inclination distribution rSHGf
The presence of inclined fibres has been well-documented
with macroscale SHG imaging [34–36]. However, because
the angular distribution of inclined fibres was missing, an
approximation was proposed by Petsche & Pinsky [6] based
on inspection of the macroscale images and calibration
based on the depth-dependence of shear properties. Recently,
Winkler et al. [37] have processed SHG images to detect
and quantify the spatial distribution of inclined lamellae
and their distribution is employed in this study. Winkler
et al. [37] analysed half cross-sectional image stacks to
measure the inclination angle of every lamella in the anterior
half of the stroma. Lamellae were binned based on depth,
corneal quadrant and radial position. For each bin, a histo-
gram of fibre inclination was fit to a Gaussian distribution
for the full-width at half-maximum (FWHM), with the
mean fixed at 08 from the plane tangent to the anterior
surface (figure 5).
They found no significant differences between quadrants
and radial position but measured a significant variation with
depth. On the anterior half of the cornea, where analysis was
performed, a linear decrease of FWHM was found. In order
to complete the data through full thickness, it is assumed
that FWHM extrapolates linearly to zero at the posterior sur-
face. A best-fit line that forces no inclined lamellae at s ¼ 1
(R2 ¼ 0.87) was used to find FWHM as a function of depth
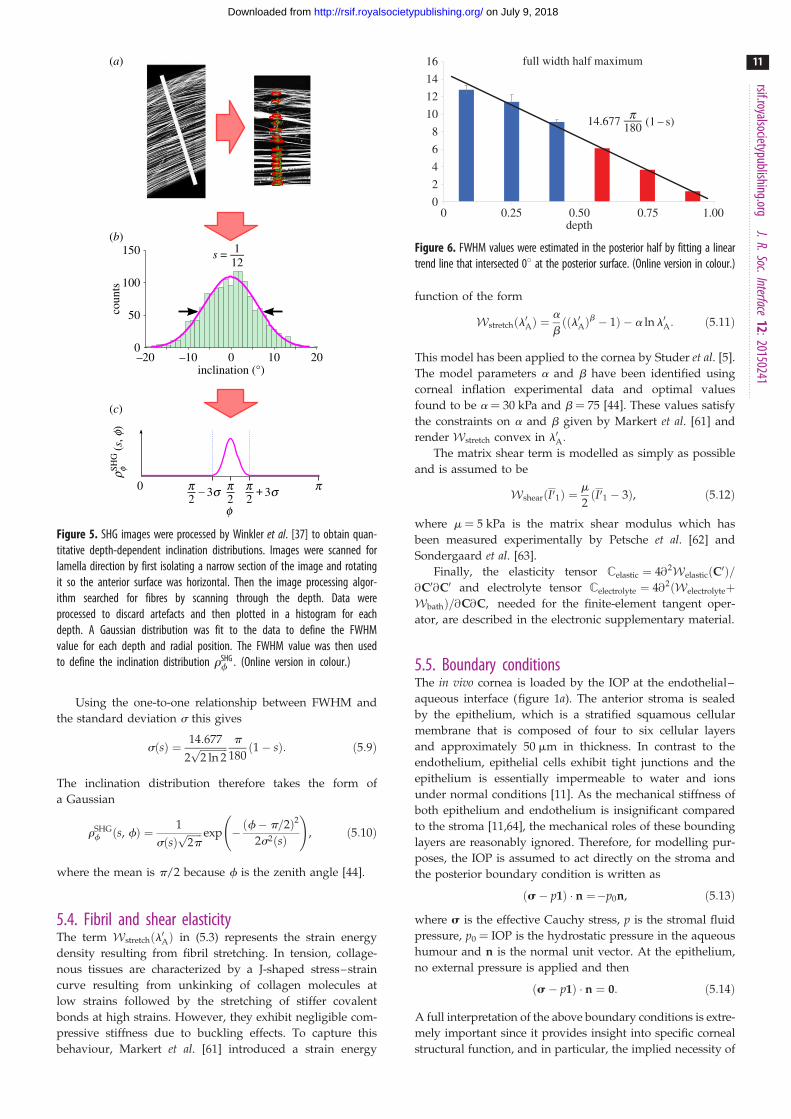
(figure 6).
150
100
50
0
s =
12
345678
910111213141516
(s, f
)SH
Gr f
f
0 p
112
inclination (°)
coun
ts
–20 –10 0 10 20
3s2p –
2p 3s
2p +
(b)
(a)
(c)
Figure 5. SHG images were processed by Winkler et al. [37] to obtain quan-titative depth-dependent inclination distributions. Images were scanned forlamella direction by first isolating a narrow section of the image and rotatingit so the anterior surface was horizontal. Then the image processing algor-ithm searched for fibres by scanning through the depth. Data wereprocessed to discard artefacts and then plotted in a histogram for eachdepth. A Gaussian distribution was fit to the data to define the FWHMvalue for each depth and radial position. The FWHM value was then usedto define the inclination distribution rSHG
f : (Online version in colour.)
16
14
12
10
8
6
4
2
00 0.25 0.50 0.75 1.00
14.677
full width half maximum
(1 – s)
depth
180p
Figure 6. FWHM values were estimated in the posterior half by fitting a lineartrend line that intersected 08 at the posterior surface. (Online version in colour.)
rsif.royalsocietypublishing.orgJ.R.Soc.Interface
12:20150241
11
on July 9, 2018http://rsif.royalsocietypublishing.org/Downloaded from
Using the one-to-one relationship between FWHM and
the standard deviation s this gives
sðsÞ ¼ 14:677
2ffiffiffiffiffiffiffiffiffiffiffi2 ln 2p p
180ð1� sÞ: ð5:9Þ
The inclination distribution therefore takes the form of
a Gaussian
rSHGf ðs, fÞ ¼ 1
sðsÞffiffiffiffiffiffi2pp exp �ðf� p=2Þ2
2s2ðsÞ
!, ð5:10Þ
where the mean is p/2 because f is the zenith angle [44].
5.4. Fibril and shear elasticityThe term Wstretchðl0AÞ in (5.3) represents the strain energy
density resulting from fibril stretching. In tension, collage-
nous tissues are characterized by a J-shaped stress–strain
curve resulting from unkinking of collagen molecules at
low strains followed by the stretching of stiffer covalent
bonds at high strains. However, they exhibit negligible com-
pressive stiffness due to buckling effects. To capture this
behaviour, Markert et al. [61] introduced a strain energy
function of the form
Wstretchðl0AÞ ¼a
bððl0AÞ
b � 1Þ � a ln l0A: ð5:11Þ
This model has been applied to the cornea by Studer et al. [5].
The model parameters a and b have been identified using
corneal inflation experimental data and optimal values
found to be a ¼ 30 kPa and b ¼ 75 [44]. These values satisfy
the constraints on a and b given by Markert et al. [61] and
render Wstretch convex in l0A:
The matrix shear term is modelled as simply as possible
and is assumed to be
WshearðI01Þ ¼m
2ðI01 � 3Þ, ð5:12Þ
where m ¼ 5 kPa is the matrix shear modulus which has
been measured experimentally by Petsche et al. [62] and
Sondergaard et al. [63].
Finally, the elasticity tensor Celastic ¼ 4@2WelasticðC0Þ=@C0@C0 and electrolyte tensor Celectrolyte ¼ 4@2ðWelectrolyteþWbathÞ=@C@C, needed for the finite-element tangent oper-
ator, are described in the electronic supplementary material.
5.5. Boundary conditionsThe in vivo cornea is loaded by the IOP at the endothelial–
aqueous interface (figure 1a). The anterior stroma is sealed
by the epithelium, which is a stratified squamous cellular
membrane that is composed of four to six cellular layers
and approximately 50 mm in thickness. In contrast to the
endothelium, epithelial cells exhibit tight junctions and the
epithelium is essentially impermeable to water and ions
under normal conditions [11]. As the mechanical stiffness of
both epithelium and endothelium is insignificant compared
to the stroma [11,64], the mechanical roles of these bounding
layers are reasonably ignored. Therefore, for modelling pur-
poses, the IOP is assumed to act directly on the stroma and
the posterior boundary condition is written as
ðs� p1Þ � n ¼�p0n, ð5:13Þ
where s is the effective Cauchy stress, p is the stromal fluid
pressure, p0 ¼ IOP is the hydrostatic pressure in the aqueous
humour and n is the normal unit vector. At the epithelium,
no external pressure is applied and then
ðs� p1Þ � n ¼ 0: ð5:14Þ
A full interpretation of the above boundary conditions is extre-
mely important since it provides insight into specific corneal
structural function, and in particular, the implied necessity of
porous piston
porous piston
2500
2000
1500
1000
500
0
confined swellingunconfined swellingOlsen & Sperling [52]Hedbys & Dohlman [20]
thickness, t (mm)
P s (
mm
Hg)
0.2 0.3 0.4 0.5 0.6 0.7
confined
unconfined
corneal button
corneal button
bath solution
bath solution
(b)(a) (i)
(ii)
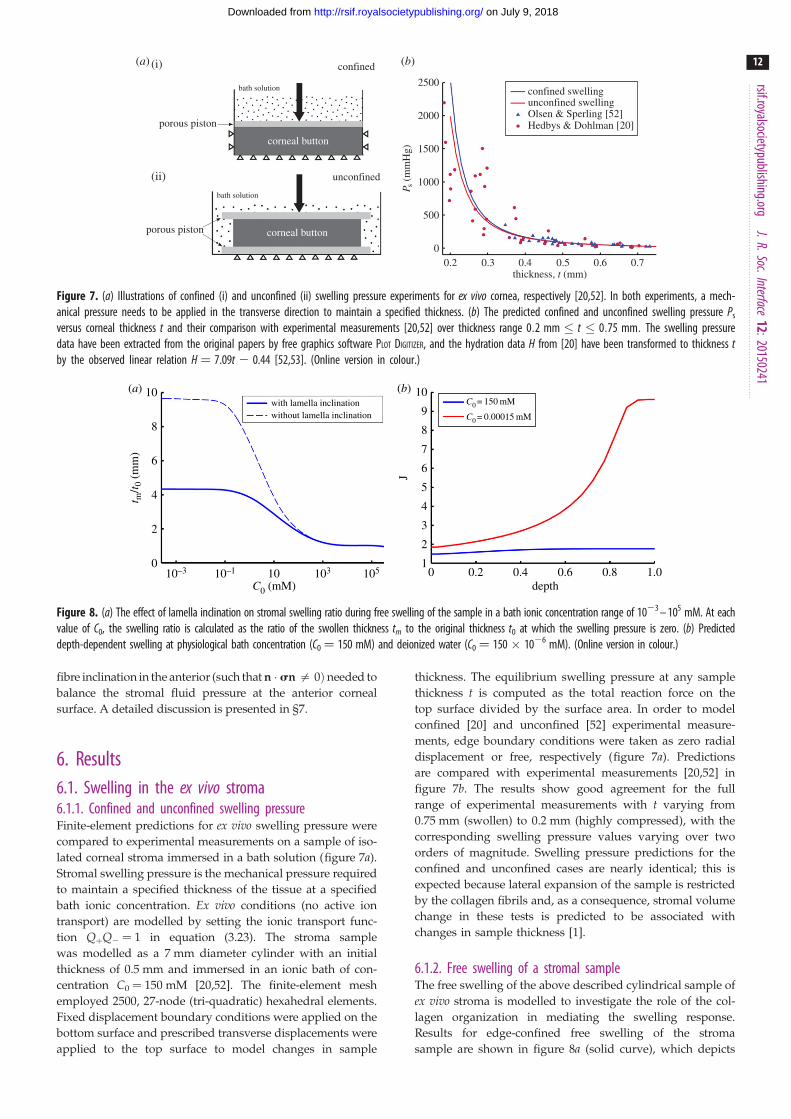
Figure 7. (a) Illustrations of confined (i) and unconfined (ii) swelling pressure experiments for ex vivo cornea, respectively [20,52]. In both experiments, a mech-anical pressure needs to be applied in the transverse direction to maintain a specified thickness. (b) The predicted confined and unconfined swelling pressure Ps
versus corneal thickness t and their comparison with experimental measurements [20,52] over thickness range 0:2 mm � t � 0:75 mm: The swelling pressuredata have been extracted from the original papers by free graphics software PLOT DIGITIZER, and the hydration data H from [20] have been transformed to thickness tby the observed linear relation H ¼ 7.09t 2 0.44 [52,53]. (Online version in colour.)
10 10
9
8
7
6
5
4
3
2
1
8
6
4
2
0
t m/t 0
(m
m)
J
depthC0 (mM)0 0.2 0.4 0.6 0.8 1.010–3 10–1 10 103 105
(b)(a)with lamella inclinationwithout lamella inclination
C0 = 150 mM
C0 = 0.00015 mM
Figure 8. (a) The effect of lamella inclination on stromal swelling ratio during free swelling of the sample in a bath ionic concentration range of 1023 – 105 mM. At eachvalue of C0, the swelling ratio is calculated as the ratio of the swollen thickness tm to the original thickness t0 at which the swelling pressure is zero. (b) Predicteddepth-dependent swelling at physiological bath concentration (C0 ¼ 150 mM) and deionized water (C0 ¼ 150 � 1026 mM). (Online version in colour.)
rsif.royalsocietypublishing.orgJ.R.Soc.Interface
12:20150241
12
on July 9, 2018http://rsif.royalsocietypublishing.org/Downloaded from
fibre inclination in the anterior (such that n � sn = 0Þ needed to
balance the stromal fluid pressure at the anterior corneal
surface. A detailed discussion is presented in §7.
6. Results6.1. Swelling in the ex vivo stroma6.1.1. Confined and unconfined swelling pressureFinite-element predictions for ex vivo swelling pressure were
compared to experimental measurements on a sample of iso-
lated corneal stroma immersed in a bath solution (figure 7a).
Stromal swelling pressure is the mechanical pressure required
to maintain a specified thickness of the tissue at a specified
bath ionic concentration. Ex vivo conditions (no active ion
transport) are modelled by setting the ionic transport func-
tion QþQ2 ¼ 1 in equation (3.23). The stroma sample
was modelled as a 7 mm diameter cylinder with an initial
thickness of 0.5 mm and immersed in an ionic bath of con-
centration C0 ¼ 150 mM [20,52]. The finite-element mesh
employed 2500, 27-node (tri-quadratic) hexahedral elements.
Fixed displacement boundary conditions were applied on the
bottom surface and prescribed transverse displacements were
applied to the top surface to model changes in sample
thickness. The equilibrium swelling pressure at any sample
thickness t is computed as the total reaction force on the
top surface divided by the surface area. In order to model
confined [20] and unconfined [52] experimental measure-
ments, edge boundary conditions were taken as zero radial
displacement or free, respectively (figure 7a). Predictions
are compared with experimental measurements [20,52] in
figure 7b. The results show good agreement for the full
range of experimental measurements with t varying from
0.75 mm (swollen) to 0.2 mm (highly compressed), with the
corresponding swelling pressure values varying over two
orders of magnitude. Swelling pressure predictions for the
confined and unconfined cases are nearly identical; this is
expected because lateral expansion of the sample is restricted
by the collagen fibrils and, as a consequence, stromal volume
change in these tests is predicted to be associated with
changes in sample thickness [1].
6.1.2. Free swelling of a stromal sampleThe free swelling of the above described cylindrical sample of
ex vivo stroma is modelled to investigate the role of the col-
lagen organization in mediating the swelling response.
Results for edge-confined free swelling of the stroma
sample are shown in figure 8a (solid curve), which depicts

600 1000
800
600
400
200
500
400
300
200
100
–100
0
Ksexp = 39.12J–4.48 kPa
Kos
(kP
a)
P os (
mm
Hg)
dilation J0.5 1.0 1.5
dilation J0.5 1.0 1.5
(b)(a)predictionOlsen & Sperling [52]
Q+Q– = 1.0
Q+Q– = 0.930
Q+Q– = 0.965
Olsen & Sperling [52]Hedbys & Dohlman [20]
Figure 9. (a) The computed osmotic pressure Pos versus volume dilation J for three representative values of QþQ2 and comparison with swelling pressure measure-ments [20,52]. (b) The predicted osmotic compressibility Kos versus volume dilation J and its comparison with experimental measurements [52]. The measuredmodulus is given by K exp ¼ 39:12J�4:48 kPa, which is computed by the power law fit function for swelling pressure Pexp
s ¼ 7:56t�3:48 mmHg from [52].(Online version in colour.)
rsif.royalsocietypublishing.orgJ.R.Soc.Interface
12:20150241
13
on July 9, 2018http://rsif.royalsocietypublishing.org/Downloaded from
the ratio of swollen thickness to original thickness (swelling
ratio) versus bath ionic concentration C0. For dilute bath sol-
utions, the model predicts that the stroma sample will swell
to approximately four times its original thickness, which
may be compared to experimental measurements in de-
ionized water [28,29] in which human corneas were observed
to swell to approximately three times their original thickness.
For concentrated bath solutions, the abundance of ions results
in ionic shielding of the fixed charges, reduction in osmotic
pressure and minimal swelling. Both limiting states are
captured by the swelling predictions.
It has been observed in free swelling experiments that the
anterior third of the stroma remains virtually unswollen with
most swelling taking place in the deeper stroma [28,29].
We used the model to investigate the depth-dependence
of stromal swelling at two bath ionic concentrations C0 ¼
150 mM and 150 � 1026 mM, corresponding to the physio-
logical state and de-ionized water, respectively. The results are
presented in figure 8b which depicts the profile of local volume
dilation J across the depth of the stroma (J ¼ 1 corresponding
to the normo-hydrated state). At C0 ¼ 150 mM, the local
volume dilation varies from 1.5 in the anterior to 1.8 in the pos-
terior. Massive swelling occurs when C0 ¼ 150 � 1026 mM and
volume dilation varies from 1.8 in the anterior to 10.0 in the pos-
terior. The highly non-uniform swelling across the corneal
thickness agrees qualitatively with experimental observations
[28,29]. Comparison of the two results in figure 8b indicates
that the stromal anterior third thickness is predicted to maintain
its thickness for any bath concentration, indicating the rigidity of
this region with respect to extreme hydration changes.
A theoretical study was also undertaken to confirm
the importance of lamellae inclination with respect to
anterior stromal rigidity. The above study was repeated
while constraining lamellae to have zero inclination. This is
accomplished by replacing the Gaussian inclination distri-
bution given by (5.10) with rSHGf ðs, fÞ ¼ dðf� p=2Þ, where
d is the Dirac delta. In this case, all lamellae throughout the cor-
neal depth will have zero inclination. As shown in figure 8a(dashed curve), for dilute bath solutions the stroma sample
now swells to almost 10 times its original thickness. In fact,
the only mechanical constraint preventing infinite swelling is
the work done by the matrix shear stiffness which bounds
the swelling. As expected, the model still predicts little
swelling when the bath ionic concentration is high.
6.2. Swelling in the in vivo cornea6.2.1. Effect of active endothelial ion transportRecall that the active endothelial ionic transport term
(equation (4.1)) satisfies 0 � QþQ� � 1, with QþQ2 ¼ 1 cor-
responding to no active transport and QþQ2 ¼ 0.965
corresponding to normal active transport in the in vivocornea. Predicted values of osmotic pressure Pos (equation
(3.23)) are plotted in figure 9a for these two values of the
ionic transport function and also for QþQ2 ¼ 0.930 which
corresponds to hyper-active ionic transport. Osmotic pressure
is reduced with reducing values of QþQ2. For QþQ2 ¼ 1, the
osmotic pressure is positive for all dilation J and the tissue
will tend to swell. For the normal in vivo cornea with
QþQ2 ¼ 0.965, it is seen that a reduction in dilation from
the physiological condition (J ¼ 1) will result in positive stro-
mal osmotic pressure which will produce a tendency to swell.
On the other hand, an increase in dilation will result in negative
stromal osmotic pressure and produce a tendency to de-swell.
Consider the curve for the hyper-active QþQ2 ¼ 0.930. In this
case, positive or negative deviations in dilation from J ¼ 1 will
always result in negative osmotic pressure and produce a ten-
dency to de-swell. These conditions illustrate the hydration
regulation mechanism of active endothelial ion transport.
Increasing active transport shifts the osmotic pressure–dilation
curve downwards in figure 9a. Predicted values of osmotic
compressibility Kos (equation (3.25)) versus dilation J are
shown in figure 9b for no active transport. Values closely
match measurements reported in [52].
6.2.2. Swelling of a cornea with Fuchs’ dystrophyFuchs’ dystrophy is usually characterized by morphological
changes in endothelial cells or by an accelerated loss of endo-
thelial cells [11,54]. In this situation, the cornea will swell due
to increasing endothelial permeability, decreasing active ion
flux, or both mechanisms simultaneously. The effect of
these pathological changes on stromal ionic concentrations
is described by the ionic transport function QþQ2 (equation
(4.1)). Because the absolute values of endothelial ionic
permeability Lþ and L2 and active ionic fluxes Jaþ and Ja2
have limited clinical significance, swelling effects due to
relative changes in these parameters are considered. For sim-
plicity and without loss of generality, we consider active
anion transport only and set Qþ ¼ 1. Let L�n and Ja�n be

700
670
640
610
580
550
5201.0 1.5 2.0 2.5 3.0 3.5 4.0 4.5 0.25 0.40 0.55 0.70 0.85 1.00
CC
T (
mm)
L–p/L–n Ja–p/Ja–n
(b)(a)
Figure 10. The predicted swollen CCT in Fuchs’ dystrophy when (a) the endothelial ionic permeability is increased up to a factor of 4.5 (1 � L�p=L�n � 4:5) withnormal active ionic flux (Ja�p=Ja�n ¼ 1) and (b) the active ionic flux rate is reduced up to a factor of 0.2 (0:2 � Ja�p=Ja�n � 1) with normal anionicpermeability (L�p=L�n ¼ 1). (Online version in colour.)
53.0
–58.5
–170.0
uz (mm)
Figure 11. Fringe plot of the vertical displacement field uz at Ja�p=Ja�n ¼ 0:22 for a cornea with Fuchs’ dystrophy. The anterior surface of the cornea deformsmuch less than that of the posterior surface. It is noted that the sclera elements are distorted at the limbus. This artefact is due to the abrupt transition fromswelling to non-swelling tissue, and may be removed by defining a transition zone between the cornea and sclera.
rsif.royalsocietypublishing.orgJ.R.Soc.Interface
12:20150241
14
on July 9, 2018http://rsif.royalsocietypublishing.org/Downloaded from
the anion membrane permeability and active anion flux rate
of the normal cornea, respectively, and consider pathological
increases in ionic permeability such that 1 � L�p=L�n � 1
and reductions active flux such that 0 � Ja�p=Ja�n � 1: For
any value of L�p=L�n and Ja�p=Ja�n, the value of Q�p can
be found through equation (4.1)
ln Q�p ¼Ja�p
Ja�n� L�n
L�p
� �ln Q�n, ð6:1Þ
where Q�n ¼ 0:965 is the calibrated value for normal cornea
as determined in §4.
The cornea was modelled geometrically with a central
thickness of 520 mm and the anterior and posterior surfaces
defined as spherical surfaces with radii of 7.87 and 6.7 mm,
respectively. Part of the sclera was also modelled with
anterior and posterior surfaces defined with radii of 12.00
and 11.38 mm, respectively. Because the sclera swells much
less than the cornea [8], its bulk behaviour was modelled as
a (non-swelling) compressible neo-Hookean material, as
described by Petsche & Pinsky [6], and the limbal corneal
collagen fibre elasticity was extended to the scleral tissue.
At the junction of the cornea and sclera, there is an abrupt
interface of swelling and non-swelling tissue, which should
be replaced by use of a gradual transition (although we
have not done so). Homogeneous Dirichlet boundary con-
ditions are applied to fix the periphery of the scleral
section. The solution proceeds by first solving for the
normal cornea4 with QþQ� ¼ 0:965, and then solving a
sequence of problems in which QþQ� ¼ Q�p is systematically
varied to simulate changes in endothelial permeability and
active anionic flux.
Figure 10a shows the predicted swollen central corneal
thickness (CCT) for endothelial ionic permeability increased
with 1 � L�p=L�n � 4:5 and with normal active ionic flux
Ja�p=Ja�n ¼ 1: Figure 10b shows the predicted swollen CCT
for active ionic flux rate reduced up to a factor of 0.2, so
that 0:2 � Ja�p=Ja�n � 1, with normal anionic permeability
L�p=L�n ¼ 1: In both cases, the cornea swells. The predicted
maximum swollen CCT of approximately 690 mm lies in the
range of clinical observation (500–1000 m) measured for
patients with Fuchs’ dystrophy [30].
The model predicts that at any value of the swollen CCT,
the anterior surface deforms much less than the posterior sur-
face, with swelling concentrated in the posterior region. This
prediction agrees with the clinical observation of Brunette
et al. [30] that the anterior surface of the cornea is nearly
normal among patients with Fuchs’ dystrophy, whereas the
posterior surface shows significant change. Figure 11 pro-
vides a fringe plot of axial (vertical) displacements due to
swelling resulting from a 78% reduction in active ion trans-
port, Ja�p=Ja�n ¼ 0:22: The results again suggest the stability
of the anterior surface with respect to swelling resulting
from the presence of inclined lamellae.
6.2.3. Swelling due to changes in intraocular pressureAn example of corneal oedema with an intact and functional
endothelium occurs in acute glaucoma. In this case, elevated
IOP combined with normal stromal osmotic pressure can
create an increase in corneal thickness [65]. Likewise, corneal
thickening is reported in patients with ocular hypertension
[66,67]. We emphasize that we are considering the equili-
brium solution that is achieved after long-time exposure to

p = IOP
p = IOP sel
sel
Epi.
Endo.
Figure 12. Illustration of the stress state in the normal living cornea. A nearlyuniform fluid pressure exists in the stroma at the magnitude of the IOP. The in-plane lamellae are responsible for resisting such pressure in the lateral direction.In the transverse direction, the applied IOP at the posterior surface balanceswith the fluid pressure. At the anterior surface, the inclined lamellae insertinto Bowman’s layer and act as anchors resisting the stromal fluid pressureapplied to the epithelium. (Online version in colour.)
680
640
600
560
520
IOP (mmHg)
CC
T (
mm)
15 30 45 60 75 90 105 120
with lamella inclinationwithout lamella inclination
Figure 13. The predicted CCT response to increased IOP from 15 to120 mmHg. The absence of inclined lamellae results in a much more swollencornea. (Online version in colour.)
rsif.royalsocietypublishing.orgJ.R.Soc.Interface
12:20150241
15
on July 9, 2018http://rsif.royalsocietypublishing.org/Downloaded from
increased IOP. It is very likely that the short-time non-
equilibrium response of the cornea is that of elastic thinning.
In fact, if we model an increase in IOP and do not allow the
fluid pressure to equilibrate, the model does predict small
corneal thinning. However, persistent elevated IOP produces
an increased pressure gradient which drives more fluid across
the endothelium, creating oedema of the stroma (and epi-
thelium), as seen in acute angle-closure glaucoma [65,68].
This is undoubtedly a simplified view of a complex problem
but it is supported by predictions from the current model.
There are two competing mechanisms with regard to cor-
neal swelling. The increased (mechanical) IOP loading at the
endothelial–aqueous humour interface acts to thin the
cornea, but an increase in stromal fluid pressure produces a
countering ‘inflation’ effect. At Bowman’s layer, the stromal
fluid pressure must be balanced by forces in the inclined
lamellae, because there is no external pressure loading at
that boundary which can balance the stromal fluid pressure
(figure 12). As shown in figure 13 (solid curve), at
44.5 mmHg, the CCT is predicted to swell by approximately
15 mm, which is in agreement with clinical data [65] in which
the CCT was measured to be 575 and 593 mm for a group of
patients who had normal IOP (average 15.8 mmHg) in one
eye and high IOP (average 44.5 mmHg) in the other eye,
giving a thickness difference of 18 mm. In the simulation of
increasing IOP, the active ionic pumping was maintained at
a normal level throughout. It is important to note that other
measurements, performed on eyes with retinal detachment
or non-human species, or performed within a relatively
short timescale, have concluded an opposite trend [69–71].
To illustrate the importance of lamella inclination in
resisting the IOP, the cornea was reanalysed with lamella
inclination constrained to be zero, as described in §6.1.2. In
this case, the response shown in figure 13 (dashed curve)
includes a significant further increase in swelling.
6.2.4. Biomechanical behaviour after LASIK surgeryLASIK (laser in-situ keratomileusis) is commonly used to cor-
rect refractive errors including myopia and hyperopia. An
anterior circular hinged flap of about 150 mm thickness is
first created using a femtosecond laser. The flap is then
folded back to expose the stromal bed which is reshaped by
excimer laser ablation. The procedure is completed by
returning the flap to conform with the ablated profile.
Although laser ablation creates a new central corneal curvature
with the goal of achieving emmetropia, the biomechanical
response of the residual (significantly thinned) stromal tissue
is an important but challenging factor that should be con-
sidered [72]. In this study, we assume that active
endothelium ionic pumping is functioning normally and use
the proposed model to investigate the biomechanical response
of the cornea, including stromal fluid pressure and local swel-
ling, resulting from a typical and representative myopic
correction.
The geometry shown in figure 14 is for the pre-operative
cornea and defines the shape of the normo-hydrated cornea
and surgical profile while the cornea is supporting an IOP
of 15 mmHg. The ablation depth profile was determined
using theory presented by Munnerlyn [73] for an ablation
radius of curvature of 8.847 mm (corresponding to an intended
correction of approx. 25 dioptres). The CCT is 520 mm, and the
maximum ablation depth of 87 mm combines with the 150 mm
flap to produce a residual central stromal thickness of 283 mm.
With this ablation profile, the residual stromal thickness is
54.4% at the cornea centre and gradually increases to 71.2%
at the periphery of the flap. The flap is returned after
ablation (where negative osmotic pressure holds it in place by
suction) but it is no longer mechanically integrated with the
stroma and can be easily separated at any time after surgery
[72]. LASIK therefore effectively removes that part of the
stroma in which lamella inclination is most pronounced (the
anterior third).
Because the collagen fibril distribution is not symmetric
about any axis, a full 3608 model is required. The eye is sup-
ported in the eye socket by fatty tissue and stabilized by six
muscles responsible for eye movement. However, it is not
necessary to extend the sclera to the posterior pole; numerical
experiments were conducted and it was determined that
extending the scleral tissue for an arc length of 2 mm was suf-
ficient, at which point the tissue can be ‘clamped’. The finite-
element model consists of 7008 27-node hexahedral elements.
The solution was obtained in two phases. In the presurgical
phase, the normal cornea was loaded by an IOP of 15 mmHg
and a global fixed-point algorithm was employed to obtain
the collagen prestress. With this prestress, the normal cornea
is in equilibrium under the IOP and is in the pre-operative geo-
metry of figure 14. In the postsurgical phase, the elements
corresponding to the flap and ablation region are removed

Cposterior Cablation
Canteriord1
d2
F
T
A
O
t
Figure 14. Illustration of the flap geometry and ablation profile in the LASIK surgery designed for an intended correction of approximately 25 dioptres. Theanterior flap diameter F ¼ 9 mm, transition zone diameter T ¼ 6.16 mm, sculpted surface diameter A ¼ 6 mm and optic zone diameter (for least-squares cur-vature extraction) O ¼ 5 mm. The CCT is 520 mm, and the maximum ablation depth of 87 mm combines with the 150 mm flap thickness to produce a residualcentral stromal thickness of d2 ¼ 283 mm.
Table 2. Comparisons of the curvature change coefficient C, postsurgicalcorneal radius Rpost and spherical equivalent SE calculated by FEM andmeasured by Ortiz et al. [74].
C Rpost (mm) SE (1/m)
Ortiz et al.—mech 23.2%+ 1.9% 8.516 23.638
Ortiz et al.—laser 21.6%+ 1.3% 8.685 24.411
FEM 23.12% 8.571 23.892
rsif.royalsocietypublishing.orgJ.R.Soc.Interface
12:20150241
16
on July 9, 2018http://rsif.royalsocietypublishing.org/Downloaded from
from the mesh while maintaining the IOP and normal ionic
pumping. The model is no longer in equilibrium and the
new deformed state is obtained by Newton’s method.
We first compare the predicted biomechanical response to
clinical measurements. Ortiz et al. [74] made measurements of
changes in corneal anterior curvature and correlated these to
the surgical radius of curvature in the ablation profile. The
case study analysed 85 eyes with myopia or myopic astigma-
tism and subdivided them into two groups: 44 with flaps
created by microkeratome (‘mechanical’) and 41 with
flaps created by femtosecond laser (‘laser’). The biomechani-
cal response to LASIK was evaluated by means of the
coefficient of curvature change defined by
C ¼Rpost � RS
RS� 100,
where Rpost is the postsurgical corneal radius at one month
and RS is the surgical radius imposed on the stromal bed
by ablation. The postsurgical corneal radius was measured
by topography over a central 5 mm diameter central zone.
Likewise, the postsurgical corneal radius of the finite-element
model used least-squares fitting over a 5 mm diameter zone.5
The mean value of C found by Ortiz et al. [74] is compared to
the predicted value found by the present model in table 2.
Ortiz et al. [74] also performed a statistical analysis for a
linear fit function between Rpost and RS and found
Rpost ¼ 0:68� RS þ 2:5 ðr2 ¼ 0:85Þ for the ‘mechanical’ group
and Rpost ¼ 0:88� RS þ 0:9 ðr2 ¼ 0:85Þ for the ‘laser’ group.
Using the model value RS ¼ 8:847, the fit functions for Rpost
are compared to the predicted value in table 2. Finally, the
spherical equivalent SE ¼ 337:5=Rpost � 337:5=Rpre measures
the power change in dioptres achieved by changing the presur-
gical radius Rpre to the postsurgical radius Rpost. Clinical values
for SE with Rs ¼ 8.847 are compared to the predicted value6 in
table 2. It may be seen that the finite-element model predictions
agree closely with the clinical data.
We analysed the fluid pressure and swelling response of
the postsurgical cornea. The fluid pressure is given by
p ¼ Pos þ p0 (equation (2.11)), where Pos is the osmotic
pressure and p0 is the bath pressure (IOP) of 15 mmHg.
Because most inclined lamellae have been removed by
surgery, it may be anticipated that the fluid pressure must
approach zero in the anterior region of the residual stroma.
Since p0 is constant, this implies that the tissue will swell
and the osmotic pressure will become negative (see also
figure 9a). Fluid pressure fringes are shown in the cutaway
half-mesh of figure 15a and local volume dilation fringes
are shown in 15b. Figure 15a shows that the fluid pressure
reduces to approximately half of its normal value in the abla-
tion region.7 The local swelling shown in figure 15b is
necessary to produce a negative osmotic pressure. It is con-
centrated in the upper region of the residual stroma,
particularly where the ablation is deepest and lamella incli-
nation is lost. It is observed that the swelling is modest,
around 3.5% maximum and decreasing with depth. This is
so because only small swelling is needed to produce negative
osmotic pressure of the order of 15 mmHg (figure 9a). This
will add some contribution to the biomechanical response
in LASIK, but it is probably secondary to the elastic response.
However, if IOP increases, then the swelling increases signifi-
cantly, as shown in table 3.
7. DiscussionThe proposed model follows the general theory for hydrophi-
lic and highly swollen polyelectrolyte gels introduced by
Katchalsky & Michaeli [24] combined with the membrane
transport theory of Kedem & Katchalsky [16]. The main
work was the characterization of the stromal electrolyte and

18.6
15.7
12.8
9.9
7.0
1.050
1.038
1.026
1.014
1.002
0.990
4.1
p (mmHg)
dilation J(b)
(a)
Figure 15. Fringe plots of (a) the fluid pressure and (b) volume dilation of a postsurgical cornea after LASIK designed for an intended correction of 25 dioptres.
Table 3. Predicted volume dilation of the anterior residual stroma afterLASIK for three values of IOP.
IOP (mmHg) dilation J
15 1.031
30 1.086
45 1.147
rsif.royalsocietypublishing.orgJ.R.Soc.Interface
12:20150241
17
on July 9, 2018http://rsif.royalsocietypublishing.org/Downloaded from
elastic free energies, including the modelling of modifications
due to active endothelial ionic transport. The resulting model
predicts the ex vivo (no active endothelial ionic transport)
osmotic pressure and osmotic compressibility with good
accuracy compared to experimental measurements (as
described in §6.1.1) and provides some confidence in the gen-
eral framework. Previous equilibrium modelling of corneal
swelling by Bryant & McDonnell [21] was based on numeri-
cal solution of the spherically symmetric (one-dimensional)
fluid and ionic continuity equations in a multiphasic theory
[22,75]. The current energy-based approach is equivalent
(see the electronic supplementary material) in that it implies
satisfaction of the same governing equations but it offers
some distinct advantages.
The energy approach provides an average (or homogen-
ized) energy-equivalent value of osmotic pressure over a
unit cell (see equation (2.9)). This is useful for consistently
embedding nanoscale effects, for example, the distribution
of GAG charge into collagen coating and non-coating
regions, in a macroscopic theory. By contrast, the triphasic
theory produces a pointwise varying expression for the
osmotic pressure. The energy approach is also convenient
for describing the deviation of the stromal electrolyte from
ideal conditions, including electrolyte volume exclusion
effects associated with the collagen fibrils and stromal cell
(keratocyte) population. Also noteworthy is the fact that the
energy formulation is a natural approach for finite-element
approximation which can be based directly on the variatio-
nal forms provided by the free energy terms. The proposed
formulation only requires solving for the displacement
field, which gives practical convenience in finite-element
implementation. The model contains numerous physical
constants and parameters (see reference values in table 1),
but most are well characterized and all simulations pres-
ented used these reference values—no problem-dependent
parameters appear in the theory.
Modelling the influence of active endothelial ionic fluxes
on the biophysics of corneal tissue hydration in a fully three--
dimensional context presents a challenge. In this approach,
we have analytically integrated the phenomenological KK
[16] membrane transport equations to describe the membrane
osmotic gradient as a function of the active ionic fluxes and
endothelial ionic permeability.8 This leads to a modified
Boltzmann ionic distribution in the stroma and correspond-
ing electrostatic free energy. The effects are contained in the
introduced ionic transport parameters Qþ and Q2 which cor-
respond to cation and anion transport, respectively.
Interestingly, for a binary electrolyte the influence of active
ionic transport appears as a function of the combined

rsif.royalsocietypublishing.orgJ.R.Soc.Interface
12:20150241
18
on July 9, 2018http://rsif.royalsocietypublishing.org/Downloaded from
parameter QþQ2. The model suggests that active endothelial
ionic transport reduces osmotic pressure and hence swelling
pressure (these are essentially equivalent in the case of the
highly hydrated cornea) and the pump-leak mechanism can
be explained as active pumping producing a downward
shift of the swelling pressure–hydration curve as discussed
in §6.2.1 and illustrated in figure 9a.
Precise quantification of the fluid and osmotic pressures
remains an open question for the human in vivo cornea, as
direct measurements are not currently feasible. Conventional
analysis [15,18,19] predicts a negative fluid pressure throughout
the cornea. In this study, osmotic calibration based on imbibition
pressure measurements for rabbit indicate positive fluid pressure
at normal hydration, which is in agreement with [21]. The cali-
bration suggests that stromal fluid pressure must be close to
IOP and osmotic pressure must be close to zero. It is interesting
to analyse how the forces acting at the corneal bounding surfaces
are balanced under these conditions. The posterior stroma
boundary condition, equation (5.13), may be rewritten in the
direction normal to the corneal posterior surface as
sel� p0�Pos ¼� p0, where sel is the collagen effective stress
component and p0 denotes the IOP. As the posterior collagen
fibres are parallel to the corneal surface, they can provide negli-
gible force in the transverse direction and so sel � 0: Thus, it
may be concluded that the in vivo osmotic pressure Pos must be
zero at the posterior stroma—in agreement with the calibration.
The situation is quite different at the epithelial layer. Here
there is no external pressure loading to balance the stromal
fluid pressure (figure 12). Inclined lamellae insert into
Bowman’s layer [35] where they must act to resist the stromal
fluid pressure applied to the epithelium. The mechanical bal-
ance equation across the epithelium, equation (5.14), written
in the normal direction is sel � p0 � Pos ¼ 0: Thus, the cor-
neal anterior boundary could not be stably maintained
without the contribution from inclined fibres and which
leads to the following hypothetical question—if lamella incli-
nation was absent, how would the boundary condition then
be satisfied? This in essence is what occurs in LASIK where
the inclined lamellae are largely removed by flap creation
and ablation. In this case, the effective stress will become
zero in the normal direction sel � 0 and the in vivo cornea
must swell until a negative osmotic pressure is generated so
that Pos ¼ � p0: This is precisely what the model predicts in
LASIK as described in §6.2.4 (although only approx. 3%
swelling is needed to achieve Pos¼� p0).
We have calibrated this model for the normal living
cornea by assuming that GAG fixed charge is not depth-
dependent; this leads to a hydration state that is also uniform
with depth. It has been observed by Castoro et al. [76] that the
anterior stroma may be slightly less hydrated than the pos-
terior. The water content of these two stromal layers is
measured to be 75% and 79% for rabbit, respectively [77].
Furthermore, biochemical studies on bovine corneas have
shown that posterior stroma has a higher ratio of keratan
sulfate to dermatan sulfate [76]. For human corneas, the
depth-dependence of GAG types is unknown. Given that
the hydration gradient is small through the corneal depth
(less than 5%), it seems justifiable to employ a uniform
fixed charge distribution as a first approximation. However,
this can be easily modified as new information becomes
available. Likewise, flexible GAG chains, the linear macro-
molecular structures formed from disaccharide units, may
contribute an entropic elastic energy [23]. Each GAG chain
is covalently bound at one end to the PG core protein and
so is anchored to a collagen fibril (and thereby providing
fixed charges). It has been proposed [9,10] that two or
more GAG chains can link to form antiparallel duplex struc-
tures bridging between neighbouring collagen fibrils and
can transmit entropic-based forces deriving from thermal
motions. Such contributions can be modelled through appro-
priate free energy expressions but are considered to be a
second-order effect and neglected in this study.
The stromal electrolyte free energy (equation (3.22)) is
convex in the dilation J and represents a rational basis for
modelling the osmotic behaviour of the tissue. Indeed we
have shown that the model is capable of simulating massive
swelling and the associated hydration change in the case of
stroma immersed in an ionic bath. The predictions also
show that swelling interaction with the collagen network
leads to the observed anisotropy of swelling (primarily
through the thickness direction) and inhomogeneity (most
swelling occurs in the posterior cornea) which strongly sup-
ports the idea that the anterior cornea exhibits rigidity with
respect to changes in hydration [29,31]. Measurements for
in vivo swelling are not precise, but model predictions
appear to agree qualitatively in all presented cases, and quan-
titatively for the rather subtle problem of swelling under
increasing IOP. The model has provided predictions for swel-
ling under Fuchs’ dystrophy and should also be adaptable to
modelling other diseases of the cornea such as macular cor-
neal dystrophy, where the GAG concentration is found to
be abnormally low.
The model supports the necessity of lamellae inclination
for stability of the corneal anterior (refractive) surface
[29,31]. When lamella inclination is removed synthetically
by adjusting the fibre distributions, the model predicts an
enormous increase in swelling in a stroma sample immersed
in de-ionized water (§6.1.2). Theoretically, such swelling
would become infinite, but in this model is limited by the
small matrix shear stiffness. The structural role of lamella
inclination has been examined here for the first time and
the results suggest that this aspect of the collagen architecture
is extremely important for understanding swelling behaviour
and how the stromal fluid pressure is equilibrated.
Finally, it is remarked that clinical swelling (oedema),
which results from hydration changes in the pathological
cornea, can occur under a wide variety of circumstances.
For example, during hypoxia due to contact lens wear, lactate
ion production increases and results in oedema [19,78]. The
underlying mechanism has been identified as the accumu-
lation of lactate acid due to increasing anaerobic respiration
[78]. Extension of the model to include these multiple species
and their interactions through metabolic reactions for aerobic
and anaerobic respiration is currently under development.
Authors’ contributions. X.C. and P.M.P. designed the research and devel-oped the mathematical modelling of the electrolyte; S.J.P. and P.M.P.developed the mathematical modelling of the stromal elasticity; X.C.and P.M.P. performed the numerical analysis and interpretation; allauthors wrote the paper jointly.
Competing interests. We declare we have no competing interests.
Funding. This research was supported by the Stanford University Bio-XInterdisciplinary Initiatives Program (IIP). X.C. received a StanfordGraduate Fellowship (SGF) from Stanford University. S.J.P. receiveda Bio-X Graduate Student Fellowship from Stanford University.

rsif.royalsocietypublishing.org
19
on July 9, 2018http://rsif.royalsocietypublishing.org/Downloaded from
Endnotes1For example, in application to the in vivo cornea, collagen fibres inV0 are prestressed by the action of the IOP.2Fluorophore-assisted carbohydrate electrophoresis.3If future studies produce a different conclusion regarding human stro-mal fluid pressure, including variation through depth, the value ofQþQ2 can be re-calibrated without any change to the general theory.4This requires iterative solution for the configuration S and collagenprestress that equilibrates the IOP—see §2.5The model analysed the biomechanical (elastic and swelling)response of the residual stroma. The flap was not analysed and
the postsurgical anterior radius of the cornea was takento be that of the postsurgical ablation profile radius, foundby least-squares fitting, extended by a constant flap thickness of150 mm.6The mean clinical and finite-element model values of Rpre were 7.8and 7.87 mm, respectively—the value Rpre ¼ 7.8 mm was used in cal-culating SE for consistency.7Because p0 is constant at 15 mmHg (0.002 MPa), we have Pos ¼ p20.002,and the fringe plot can be interpreted in terms of osmotic pressure.8Water permeability does not appear because at equilibrium waterflux will be zero.
J.R.Soc.
References
Interface12:20150241
1. Elliott GF, Hodson SA. 1998 Cornea, and theswelling of polyelectrolyte gels of biologicalinterest. Rep. Prog. Phys. 61, 1325 – 1365. (doi:10.1088/0034-4885/61/10/001)
2. Hodson SA. 1971 Why the cornea swells. J. Theor.Biol. 33, 419 – 427. (doi:10.1016/0022-5193(71)90090-7)
3. Pinsky PM, Heide D, Chernyak D. 2005Computational modeling of mechanicalanisotropy in the cornea and sclera. J. Cataract.Refract. Surg. 31, 136 – 145. (doi:10.1016/j.jcrs.2004.10.048)
4. Pandolfi A, Holzapfel GA. 2008 Three-dimensionalmodeling and computational analysis of the humancornea considering distributed collagen fibrilorientations. J. Biomech. Eng. 130, 061006. (doi:10.1115/1.2982251)
5. Studer H, Larrea X, Riedwyl H, Buchler P. 2010Biomechanical model of human cornea based onstromal microstructure. J. Biomech. 43, 836 – 842.(doi:10.1016/j.jbiomech.2009.11.021)
6. Petsche SJ, Pinsky PM. 2013 The role of 3-Dcollagen organization in stromal elasticity: a modelbased on X-ray diffraction data and secondharmonic-generated images. Biomech. Model.Mechanobiol. 12, 1101 – 1113. (doi:10.1007/s10237-012-0466-8)
7. Maurice DM. 1962 Clinical physiology of the cornea.Int. Ophthalmol. Clin. 2, 561 – 572. (doi:10.1097/00004397-196210000-00002)
8. Meek KM. 2008 The cornea and sclera. InCollagen: structure and mechanics (ed. P Fratzl),pp. 359 – 396. Berlin, Germany: Springer.
9. Lewis PN, Pinali C, Young RD, Meek KM, QuantockAJ, Knupp C. 2010 Structural interactions betweencollagen and proteoglycans are elucidated by three-dimensional electron tomography of bovine cornea.Structure 18, 239 – 245. (doi:10.1016/j.str.2009.11.013)
10. Scott JE. 1988 Proteoglycan – fibrillar collageninteractions. Biochem. J. 252, 313 – 323.
11. Dawson DG, Ubels JL, Edelhauser HF. 2011 Corneaand sclera. In Adler’s physiology of the eye (edsLA Levin et al.), pp. 71 – 130, 11th edn.Amsterdam, The Netherlands: Elsevier.
12. Bonanno JA. 2012 Molecular mechanismsunderlying the corneal endothelial pump. Exp. Eye.Res. 95, 2 – 7. (doi:10.1016/j.exer.2011.06.004)
13. Maurice DM. 1972 The location of the fluid pump inthe cornea. J. Physiol. 221, 43 – 54. (doi:10.1113/jphysiol.1972.sp009737)
14. Fischbarg J, Maurice DM. 2004 An updateon corneal hydration control. Exp. Eye. Res.78, 537 – 541. (doi:10.1016/j.exer.2003.09.010)
15. Klyce SD, Russell SR. 1979 Numerical solution ofcoupled transport equations applied to cornealhydration dynamics. J. Physiol. 292, 107 – 134.(doi:10.1113/jphysiol.1979.sp012841)
16. Kedem O, Katchalsky A. 1958 Thermodynamicanalysis of the permeability of biologicalmembranes to non-electrolytes. Biochim. Biophys.Acta. 27, 229 – 246. (doi:10.1016/0006-3002(58)90330-5)
17. Ruberti JW, Klyce SD. 2003 NaCl osmoticperturbation can modulate hydration control inrabbit cornea. Exp. Eye. Res. 76, 349 – 359. (doi:10.1016/S0014-4835(02)00301-9)
18. Li LY, Tighe B. 2006 Numerical simulation of cornealtransport processes. J. R. Soc. Interface 3, 303 – 310.(doi:10.1098/rsif.2005.0085)
19. Leung BK, Bonanno JA, Radke CJ. 2011 Oxygen-deficient metabolism and corneal edema followingepithelial hypoxia in the rabbit. Prog. Retin. Eye.Res. 30, 471 – 492. (doi:10.1016/j.preteyeres.2011.07.001)
20. Hedbys BO, Dohlman CH. 1963 A new method forthe determination of the swelling pressure of thecorneal stroma in vitro. Exp. Eye. Res. 2, 122 – 129.(doi:10.1016/S0014-4835(63)80003-2)
21. Bryant MR, McDonnell PJ. 1998 A triphasicanalysis of corneal swelling and hydration control.Trans. ASME 120, 370 – 381. (doi:10.1115/1.2798004)
22. Lai WM, Hou JS, Mow VC. 1991 A triphasic theoryfor swelling and deformation behaviors of articularcartilage. J. Biomech. Eng. 113, 245 – 258. (doi:10.1115/1.2894880)
23. Cheng X, Pinsky PM. 2013 Mechanisms of self-organization for the collagen fibril lattice in thehuman cornea. J. R. Soc. Interface 10, 20130512.(doi:10.1098/rsif.2013.0512)
24. Katchalsky A, Michaeli I. 1955 Polyelectrolyte gels insalt solutions. J. Polym. Sci. 15, 69 – 86. (doi:10.1002/pol.1955.120157906)
25. Sharp KA, Honig B. 1990 Calculating totalelectrostatic energies with the nonlinear Poisson –
Boltzmann equation. J. Phys. Chem. 94,7684 – 7692. (doi:10.1021/j100382a068)
26. Lee D, Wilson G. 1981 Non-uniform swellingproperties of the corneal stroma. Curr. Eye. Res. 1,457 – 461. (doi:10.3109/02713688109019986)
27. Kikkawa Y, Hirayama K. 1970 Uneven swellingof the corneal stroma. Investig. Ophthalmol. Vis. Sci.9, 735 – 741.
28. Meek KM, Leonard DW, Connon CJ, Dennis S, KhanS. 2003 Transparency, swelling and scarring in thecorneal stroma. Eye 17, 927 – 936. (doi:10.1038/sj.eye.6700574)
29. Muller LJ, Pels E, Vrensen GF. 2001 The specificarchitecture of the anterior stroma accounts formaintenance of corneal curvature. Br. J. Ophthalmol.85, 437 – 443. (doi:10.1136/bjo.85.4.437)
30. Brunette I, Sherknies D, Terry MA, Chagnon M,Bourges JL, Meunier J. 2009 3-D characterization ofthe corneal shape in Fuchs’ dystrophy andpseudophakic keratopathy. Invest. Ophthalmol. Vis.Sci. 52, 206 – 214. (doi:10.1167/iovs.09-4101)
31. Bron AJ. 2001 The architecture of the cornealstroma. Br. J. Ophthalmol. 85, 379 – 383. (doi:10.1136/bjo.85.4.379)
32. Meek KM, Blamires T, Elliott GF, Gyi TJ, Nave C.1987 The organisation of collagen fibrils in thehuman corneal stroma: a synchrotron X-raydiffraction study. Curr. Eye. Res. 6, 841 – 846.(doi:10.3109/02713688709034853)
33. Abahussin M, Hayes S, Knox Cartwright NE,Kamma-Lorger CS, Khan Y, Marshall J, Meek KM.2009 3D collagen orientation study of the humancornea using X-ray diffraction and femtosecondlaser technology. Invest. Ophthalmol. Vis. Sci. 50,5159 – 5164. (doi:10.1167/iovs.09-3669)
34. Morishige N, Wahlert AJ, Kenney MC, Brown DJ,Kawamoto K, Chikama TI, Nishida T, Jester JV. 2007Second-harmonic imaging microscopy of normalhuman and keratoconus cornea. Invest. Ophthalmol.Vis. Sci. 48, 1087 – 1094. (doi:10.1167/iovs.06-1177)
35. Winkler M, Chai D, Kriling S, Nien CJ, Brown DJ,Jester B, Juhasz T, Jester JV. 2011 Nonlinear opticalmacroscopic assessment of 3-D corneal collagenorganization and axial biomechanics. Investig.Ophthalm. Vis. Sci. 52, 8818 – 8827. (doi:10.1167/iovs.11-8070)
36. Jester JV, Winkler M, Jester BE, Nien C, Chai D,Brown DJ. 2010 Evaluating corneal collagen

rsif.royalsocietypublishing.orgJ.R.Soc.Interface
12:20150241
20
on July 9, 2018http://rsif.royalsocietypublishing.org/Downloaded from
organization using high-resolution non-linearoptical macroscopy. Eye Contact Lens 36, 260 – 264.(doi:10.1097/ICL.0b013e3181ee8992)
37. Winkler M, Shoa G, Xie Y, Petsche SJ, Pinsky PM,Juhasz T, Brown DJ, Jester JV. 2013 Three-dimensional distribution of transverse collagenfibers in the anterior human corneal stroma.Investig. Ophthalm. Vis. Sci. 54, 7293 – 7301.(doi:10.1167/iovs.13-13150)
38. Gee MW, Forster C, Wall WA. 2010 A computationalstrategy for prestressing patient-specificbiomechanical problems under finite deformation.Int. J. Numer. Meth. Biomed. Engng. 26, 52 – 72.(doi:10.1002/cnm.1236)
39. Li Y, Suo Z, Vlassak JJ. 2014 A model of idealelastomeric gels for polyelectrolyte gels. Soft. Matt.10, 2582 – 2590. (doi:10.1039/c3sm52751d)
40. Hong W, Zhao X, Suo Z. 2010 Large deformationand electrochemistry of polyelectrolyte gels.J. Mech. Phys. Solids 58, 558 – 577. (doi:10.1016/j.jmps.2010.01.005)
41. Buschmann MD, Grodzinsky AJ. 1995 A molecularmodel of proteoglycan-associated electrostatic forcesin cartilage mechanics. J. Biomech. Eng. 117,179 – 192. (doi:10.1115/1.2796000)
42. Urban JPG, Maroudas A, Bayliss MT, Dillon J. 1979Swelling pressures of proteoglycans at theconcentrations found in cartilaginous tissues.Biorheology 16, 447 – 464.
43. Plaas AH, West LA, Thonar EJ, Karcioglu ZA, SmithCJ, Klintworth GK, Hascall VC. 2001 Altered finestructures of corneal and skeletal keratan sulfateand chondroitin/dermatan sulfate in macularcorneal dystrophy. J. Biol. Chem. 276, 39 788 – 39796. (doi:10.1074/jbc.M103227200)
44. Petsche SJ. 2014 Multiscale mechanics andexperimental investigation of the human cornea.PhD thesis, Stanford University, USA.
45. Fratzl P, Daxer A. 1993 Structural transformation ofcollagen fibrils in corneal stroma during drying.Biophys. J. 64, 1210 – 1214. (doi:10.1016/S0006-3495(93)81487-5)
46. Miyagawa A, Kobayashi M, Fujita Y, Hamdy O,Hirano K, Nakamura M, Miyake Y. 2001 Surfaceultrastructure of collagen fibrils and their associationwith proteoglycans in human cornea and scleraby atomic force microscopy and energy-filteringtransmission electron microscopy. Cornea 20, 651 –656. (doi:10.1097/00003226-200108000-00019)
47. Muller LJ, Pels E, Schurmans LR, Vrensen GF. 2004 Anew three-dimensional model of the organizationof proteoglycans and collagen fibrils in the humancorneal stroma. Exp. Eye. Res. 78, 493 – 501.(doi:10.1016/S0014-4835(03)00206-9)
48. Twersky V. 1975 Transparency of pair-correlated,random distributions of small scatterers, withapplications to the cornea. J. Opt. Soc. Am. 65,524 – 530. (doi:10.1364/JOSA.65.000524)
49. Huang Y, Meek KM. 1999 Swelling studies on thecornea and sclera: the effects of pH and ionic
strength. Biophys. J. 77, 1655 – 1665. (doi:10.1016/S0006-3495(99)77013-X)
50. Goodfellow JM, Elliot GF, Woolgar AE. 1978 X-raydiffraction studies of the corneal stroma. J. Mol.Biol. 119, 237 – 252. (doi:10.1016/0022-2836(78)90436-9)
51. Meek KM, Fullwood NJ, Cooke PH, Elliott GF,Maurice DM, Quantock AJ, Wall RS, Worthington CR.1991 Synchrotron X-ray diffraction studies of thecornea, with implications for stromal hydration.Biophys. J. 60, 467 – 474. (doi:10.1016/S0006-3495(91)82073-2)
52. Olsen T, Sperling S. 1987 The swelling pressure ofthe human corneal stroma as determined by a newmethod. Exp. Eye. Res. 44, 481 – 490. (doi:10.1016/S0014-4835(87)80159-8)
53. Hedbys BO, Mishima S. 1966 The thickness –hydration relationship of cornea. Exp. Eye. Res. 5,221 – 228. (doi:10.1016/S0014-4835(66)80010-6)
54. Elhalis H, Azizi B, Jurkunas U. 2010 Fuchsendothelial corneal dystrophy. Ocul. Surf. 8,173 – 184. (doi:10.1016/S1542-0124(12)70232-X)
55. Bourne WM. 1998 Clinical estimation of cornealendothelial pump function. Trans. Am. Ophthalmol.Soc. 96, 229 – 242.
56. Watsky MA, McDermott ML, Edelhauser HF. 1989 Invitro corneal endothelial permeability in rabbit andhuman: the effects of age, cataract surgery anddiabetes. Exp. Eye. Res. 49, 751 – 767. (doi:10.1016/S0014-4835(89)80036-3)
57. Hedbys BO, Mishima S, Maurice DM. 1963 Theimbibition pressure of the corneal stroma. Exp. Eye.Res. 2, 99 – 111. (doi:10.1016/S0014-4835(63)80001-9)
58. Hartmanna S, Neffb P. 2003 Polyconvexity ofgeneralized polynomial-type hyperelastic strainenergy functions for near-incompressibility.Int. J. Solids. Struct. 40, 2767 – 2791. (doi:10.1016/S0020-7683(03)00086-6)
59. Lanir Y. 1979 A structural theory for thehomogeneous biaxial stress – strain relationships inflat collagenous tissues. J. Biomech. 12, 423 – 436.(doi:10.1016/0021-9290(79)90027-7)
60. Meek KM, Tuft SJ, Huang Y, Gill PS, Hayes S,Newton RH, Bron AJ. 2005 Changes in collagenorientation and distribution in keratoconus corneas.Invest. Ophthalmol. Vis. Sci. 46, 1948 – 1956.(doi:10.1167/iovs.04-1253)
61. Markert B, Ehlers W, Karajan N. 2005 A generalpolyconvex strain – energy function fiber-reinforcedmaterials. Proc. Appl. Math. Mech. 5, 245 – 246.(doi:10.1002/pamm.200510099)
62. Petsche SJ, Chernyak D, Martiz J, Levenston ME, PinskyPM. 2012 Depth-dependent transverse shear propertiesof the human corneal stroma. Investig. Ophthalmol.Vis. Sci. 53, 873 – 880. (doi:10.1167/iovs.11-8611)
63. Sondergaard AP, Ivarsen A, Hjortdal J. 2013 Cornealresistance to shear force after UVA-riboflavincross-linking. Investig. Ophthalmol. Vis. Sci. 54,5059 – 5069. (doi:10.1167/iovs.12-10710)
64. Elsheikh A, Alhasso D, Rama P. 2008 Assessmentof the epithelium’s contribution to cornealbiomechanics. Exp. Eye. Res. 86, 445 – 451.(doi:10.1016/j.exer.2007.12.002)
65. Ytteborg J, Dohlman CH. 1965 Corneal edema andintraocular pressure II. Clinical results. Arch.Ophthalmol. 74, 477 – 484. (doi:10.1001/archopht.1965.00970040479008)
66. Herman DC, Hodge DO, Bourne WM. 2001 Increasedcorneal thickness in patients with ocularhypertension. Arch. Ophthalmol. 119, 334 – 336.(doi:10.1001/archopht.119.3.334)
67. Lee GA, Khaw PT, Ficker LA, Shah P. 2002 Thecorneal thickness and intraocular pressurestory: where are we now? Clin. Exp. Ophthalmol.30, 334 – 337. (doi:10.1046/j.1442-9071.2002.00551.x)
68. Waring GO, Bourne WM, Edelhauser HF, Kenyon KR.1982 The corneal endothelium: normal andpathologic structure and function. Ophthalmology89, 531 – 590. (doi:10.1016/S0161-6420(82)34746-6)
69. Ehlers N. 1966 The fibrillary texture and thehydration of the cornea. Acta. Ophthalmol.44, 620 – 630. (doi:10.1111/j.1755-3768.1966.tb08080.x)
70. Ehlers N, Riise D. 1967 On corneal thicknessand intraocular pressure. Acta. Ophthalmol. 45,809 – 813.
71. Johnson CS, Mian SI, Moroi S, Epstein D, Izatt J,Afshari NA. 2007 Role of corneal elasticity indamping of intraocular pressure. Invest. Ophthalmol.Vis. Sci. 48, 2540 – 2544. (doi:10.1167/iovs.06-0719)
72. Dupps WJ, Wilson SE. 2009 Biomechanics andwound healing in the cornea. Exp. Eye. Res. 83,709 – 720. (doi:10.1016/j.exer.2006.03.015)
73. Munnerlyn CR, Koons SJ, Marshall J. 1988Photorefractive keratectomy: a technique for laserrefractive surgery. J. Cataract. Refract. Surg. 14,46 – 52. (doi:10.1016/S0886-3350(88)80063-4)
74. Ortiz D, Alio JL, Pinero D. 2008 Measurement ofcorneal curvature change after mechanical laser insitu keratomileusis flap creation and femtosecondlaser flap creation. J. Cataract. Refract. Surg. 34,238 – 242. (doi:10.1016/j.jcrs.2007.09.023)
75. Huyghe JM, Janssen JD. 1997 Quadriphasic theoryof swelling incompressible porous media. Int. J. Eng.Sci. 35, 793 – 802. (doi:10.1016/S0020-7225(96)00119-X)
76. Castoro JA, Bettelhem AA, Berrelheim FA. 1988Water gradients across bovine cornea. Investig.Ophthalmol. Vis. Sci. 29, 963 – 968.
77. Turss R, Friend J, Reim M, Dohlman CH. 1971Glucose concentration and hydration of the cornealstroma. Ophthalmic. Res. 2, 253 – 260. (doi:10.1159/000264570)
78. Klyce SD. 1981 Stromal lactate accumulation canaccount for corneal oedema osmotically followingepithelial hypoxia in the rabbit. J. Physiol. 321,49 – 64. (doi:10.1113/jphysiol.1981.sp013971)