a study about co2/ch4 separation using polymeric...
TRANSCRIPT

A STUDY ABOUT CO2/CH4 SEPARATION USING
POLYMERIC MEMBRANES
Elísio Fernandes de Almeida Quintino
Júlia de Andrade Stock
Graduation Project presented to the Petroleum
Engineering Course at Escola Politécnica,
Universidade Federal do Rio de Janeiro, as
a partial fulfillment of the requirements for
the degree of Engineer.
Advisor: Regis da Rocha Motta
Rio de Janeiro
December, 2014

ii
A STUDY ABOUT CO2/CH4 SEPARATION USING POLYMERIC
MEMBRANES
Elísio Fernandes de Almeida Quintino
Júlia de Andrade Stock
GRADUATION PROJECT SUBMITTED TO THE TEACHING STAFF OF THE
PETROLEUM ENGINEERING COURSE AT ESCOLA POLITÉCNICA OF
UNIVERSIDADE FEDERAL DO RIO DE JANEIRO AS A PARTIAL
FULFILLMENT TO OBTAIN THE DEGREE OF PETROLEUM ENGINEER.
Evaluated by:
____________________________________________
Regis da Rocha Motta, Ph.D.
____________________________________________
Thereza Cristina Nogueira de Aquino, D.Sc.
____________________________________________
Engº Bernardo Cascon Neves
RIO DE JANEIRO, RJ - BRAZIL
DECEMBER, 2014
iii
[Rio de Janeiro, 2012]
(DEI-POLI/UFRJ, Engenharia de Produção, 2012)
p. XXX x 29,7 cm
Quintino, Elísio Fernandes de Almeida
Stock, Júlia de Andrade
A Study about CO2/CH4 Separation Using Polymeric
Membranes/ Elísio Fernandes de Almeida Quintino and Júlia
de Andrade Stock. – Rio de Janeiro, Brazil: UFRJ/ ESCOLA
POLITÉCNICA, 2014.
xi, 56 p.: il.; 29,7 cm.
Advisor: Regis da Rocha Motta
Graduation Project – UFRJ/ Escola Politécnica/ Petroleum
Engineering Course, 2014.
Bibliography: p. 55-56
1. CO2/CH4 separation. 2. Membranes. 3. Pre-salt
reservoirs. 4. Reverse Engineering
I. Motta, Regis da Rocha. II. Universidade Federal do Rio de
Janeiro, Escola Politécnica, Petroleum Engineering Course. III.
A Study about CO2/CH4 Separation Using Polymeric
Membranes.
iv
Preciso admitir que tenho a inegável incapacidade de transformar sentimentos
em palavras. É como pintar um pôr-do-Sol apenas em tons de cinza: fica evidente que
não se dispunha de cores suficientes, das cores certas, daquelas que retratariam a
absoluta verdade fidedigna na tela. É assim que me sinto quando procuro as palavras em
minha paleta. De todo modo, tentarei pincelar alguns borrões.
Em primeiro lugar, agradeço ao meu pai. Posso dizer com total confiança que
cada passo que dei e darei nessa vida carrega sua influência e seus ensinamentos. Não
teria chegado muito longe, não fosse o professor e exemplo que tenho dentro de casa.
Recebi a honra de carregar seu nome e espero que, quando chegar a hora de serenar e
olhar para trás, eu possa concluir que fiz por merecê-la.
Fui filho de uma mulher incrível. Com um carinho incomensurável e, por que
não dizê-lo, paciência celestial, minha mãe cuidou de mim. Espero que eu tenha podido
herdar nem que seja um pouquinho de toda a sua sabedoria, e que no futuro lhe traga
orgulho. A ela devo minha vida, e uma gratidão infinita.
Independentemente de religião, tenho meus anjos da guarda. Agradeço aos meus
anjos no céu - Zigue, Elis, Elza e Enya - e aos meus anjos na Terra - Ymer, Henry,
Mary e Nicolas. Deixo um agradecimento muito especial ao meu anjinho Gracinha, que
se juntou aos anjos do céu no dia em que apresentei esse trabalho. Obrigado por ter
esperado para me dar os parabéns.
Nessa vida, tenho irmãos que não são de sangue - somos ligados por laços mais
especiais que isso. É por isso que gostaria de agradecer ao Breno, ao Luiz Octávio, ao
Luis Henrique, ao Caíque e ao Pepê. Agradeço a cada dia por tê-los em minha vida.
Gostaria também de deixar separado um agradecimento especial para minha
namorada Mika, alguém que tem feito minha vida mais feliz e completa desde nosso
encontro inesperado em uma manhã fria de janeiro. Feliz é o homem que tem uma
verdadeira companheira ao seu lado.
Agradeço, não com menos atenção, aos mestres que participaram de maneira
indispensável da minha formação. Dentre eles, os professores Paulo Couto, Flávio
Dickstein, Paulo Goldfeld e Regis Motta merecem meus especiais agradecimentos por
terem participado de maneira marcante em minha vida acadêmica.
Por fim, agradeço aos amigos de curso e faculdade, que transformaram mais essa
etapa da minha vida em algo prazeroso, de que sempre guardarei boas recordações.
Agradecimento especial dirijo à Júlia, companheira de estudos e trabalhos e amiga
muito querida; ao Ronny, amigo desde os primeiros créditos e que carrego no peito; ao
Cascon, amigo e profissional exemplar que tive a honra de ter em minha banca
examinadora; ao Danilo, amigo e fantástico companheiro de viagem; ao Gronow, à
Naty, ao Marcelo, ao Effren, ao Longhi, ao Sauma, ao Attias e aos outros que somaram
em minha vida.
Elísio Fernandes de Almeida Quintino

v
First and foremost, I would like to thank God, for all the blessings He has
bestowed upon me. I would also like to thank my family for all their help,
encouragement and patience.
I would like to thank my boyfriend for supporting my choices and for helping
me to achieve my goals.
I would like to thank the professors and employees of UFRJ for making this
moment possible. I would like to thank my colleagues who made the passage of these
six years less stressful and more enjoyable.
Finally, I would like to thank my grandfather who gave me a Petroleum
Engineering books collection that have helped me enormously during my studies.
Júlia de Andrade Stock

vi
”Jag gick i ett kvarter idag
Som en gång var min hela värld
Allting var ju enklare då
Men ingenting kan bli vad det var”
– Andreas Grega, ”Mammas Gata”
med Promoe, Timbuktu och Supreme
"The value of a college education
is not the learning of many facts
but the training of the mind to think."
–Albert Einstein

vii
Abstract of the Graduation Project presented to Escola Politécnica/UFRJ as a partial
fulfillment of the requirements to obtain the degree of Petroleum Engineer.
A STUDY ABOUT CO2/CH4 SEPARATION USING POLYMERIC MEMBRANES
Elísio Fernandes de Almeida Quintino
Júlia de Andrade Stock
December/2014
Advisor: Regis da Rocha Motta
Course: Petroleum Engineering
This work has two main objectives. The first one is to present an overview of the usage
of polymeric membranes for CO2/CH4 separation. First, it is presented the need for this
separation, focusing in the fact that high concentrations of CO2 are expected in the pre-
salt reservoirs in Brazil. Subsequently, different methods for the separation are
presented in a comparative way, in order to give to the reader a broader sense about the
state of the art in the technology for separations of gases. The technology of polymeric
membranes is then discussed in more details, with attention to the physics that model
the phenomena of selective permeation of gases through membranes. Technical
description of the usage of membranes in separation systems and its equipment is also
explored. The discussion about the membrane technology, which is the first objective of
this work, gives enough comprehension of the subject to make it possible to develop the
second objective, which is the development of a simple membrane system simulator.
This simulator aims to represent a membrane separation system and it will be built
using a procedure of reverse engineering: analyzing history data from the operation of a
separation system and obtaining functions by data fitting in order to model the unknown
parts of the physics behind the membrane systems. This procedure is useful when an
enterprise wants to make decision about the operation of a membrane system but does
not want to depend on the know-how kept by the membrane seller.
Keywords: Membranes, CO2/CH4 separation, Pre-salt reservoirs, Reverse engineering.

viii
Resumo do Projeto de Graduação apresentado à Escola Politécnica/ UFRJ como parte
dos requisitos necessários para a obtenção do grau de Engenheiro de Petróleo.
UM ESTUDO SOBRE A SEPARAÇÃO DE CO2/CH4 USANDO MEMBRANAS
POLIMÉRICAS
Elísio Fernandes de Almeida Quintino
Júlia de Andrade Stock
Dezembro/2014
Orientador: Regis da Rocha Motta
Curso: Engenharia de Petróleo
Esse trabalho tem dois objetivos principais. O primeiro é apresentar o uso de
membranas poliméricas para a separação de CO2 e CH4. Primeiro, é apresentada a
necessidade dessa separação, focando no fato de que altas concentrações de CO2 são
esperadas nos reservatórios do pré-sal no Brasil. Subsequentemente, diferentes métodos
para a separação são apresentados de maneira comparativa, a fim de dar ao leitor uma
visão mais ampla acerca do estado da arte na tecnologia de separação de gases. A
tecnologia de membranas poliméricas é então discutida em maiores detalhes, com
atenção para a física que modela os fenômenos de permeabilidade seletiva de gases
através de membranas. Uma descrição técnica do uso de membranas em sistemas de
separação e seus equipamentos também é apresentada. A discussão sobre a tecnologia
de membranas, que é o primeiro objetivo desse trabalho, dá compreensão suficiente
sobre o assunto para possibilitar o desenvolvimento do segundo objetivo, que é o
desenvolvimento de um simulador simples de um sistema de membranas. Esse
simulador tem como objetivo representar um sistema de separação usando membranas e
será construído usando um procedimento de engenharia reversa: analisar históricos de
dados da operação de um sistema de separação e obter funções por ajuste de dados a fim
de modelar a parte desconhecida da física por trás dos sistemas de membranas. Esse
procedimento é útil quando uma empresa deseja tomar decisões acerca da operação de
um sistema de membranas mas não quer depender do know-how mantido pelo vendedor
de membranas.
Palavras-chave: Membranas, Separação CO2/CH4, Reservatórios do pré-sal,
Engenharia reversa.
ix
Summary
1 Introduction ................................................................................................................... 1
1.1 Research Objectives ................................................................................................ 1
1.2 Research Context .................................................................................................... 2
1.2.1 The need for CO2/CH4 separation .................................................................... 2
1.2.2 Membranes technology overview .................................................................... 4
1.2.2.1 Membrane elements .................................................................................. 6
1.2.3 Alternative techniques ...................................................................................... 9
1.2.4 Membranes X Amines .................................................................................... 12
1. 3 Membranes technology and sustainable development ......................................... 13
2 State of the art .............................................................................................................. 18
2.1 Molecules transport in membranes ....................................................................... 18
2.1.1 Characterizing transport in membranes.......................................................... 18
2.1.2 Permeation theory .......................................................................................... 19
2.1.3 Thermodynamic aspects ................................................................................. 23
2.2 Separation Polymers ............................................................................................. 24
2.2.1 Overview ........................................................................................................ 24
2.2.2 Vitreous X Rubbery polymers........................................................................ 26
2.2.2.1 Plasticization and physical ageing in glassy polymers ........................... 27
2.3 Other Materials ..................................................................................................... 29
2.3.1 Composite membranes ................................................................................... 29
2.3.2 Facilitated transport membranes .................................................................... 30
3 Case modeling ............................................................................................................. 32
3.1 Considerations ...................................................................................................... 32
3.2 The membrane separation system ......................................................................... 33
3.2.1 Membrane separation stages .......................................................................... 34
3.2.1.1 Usage of history data .............................................................................. 35
3.2.2 Composite separation systems ....................................................................... 39
3.3 Algorithm and implementation ............................................................................. 42
3.3.1 Stage 1 ............................................................................................................ 42
3.3.2 Stages 2 and 3 ................................................................................................. 44
3.3.3 The 3-stage simulator ..................................................................................... 45
3.4 Validation of the model ........................................................................................ 45

x
4 Applications ................................................................................................................. 48
4.1 Optimization using the 3-stage membrane simulator ........................................... 48
4.2 Sensitivity analysis using the 3-stage membrane simulator ................................. 50
5 Conclusions ................................................................................................................. 52
Bibliography ................................................................................................................... 55
Figures list
Figure 1: FPSO Cidade de Paraty ..................................................................................... 2
Figure 2: Dry ice formation on different diameter pipes introducing a blockage risk ..... 3
Figure 3: Scheme of membrane gas separation ................................................................ 4
Figure 4: Asymmetric membrane structure ...................................................................... 5
Figure 5: Scheme of the spiral-wound membrane ............................................................ 6
Figure 6: Scheme of the hollow-fiber membrane ............................................................. 7
Figure 7: Cross-section illustrating how carbon dioxide and water can be used to flush
residual oil from subsurface rock formation between wells ........................................... 14
Figure 8: General CCS process and CO2 injection typical depth ................................... 16
Figure 9: Schematic representation of three of the different possible mechanisms for
membrane gas ................................................................................................................. 19
Figure 10: Sorption and diffusion mechanisms .............................................................. 20
Figure 11: Robeson’s trade-off curve for carbon dioxide/natural gas pair..................... 22
Figure 12: Graph showing the change in the phase envelope of CO2 containing natural
gas during processing of the gas by CO2 selective membrane ....................................... 24
Figure 13: Robeson’s plot of CO2/CH4 selectivity versus membrane permeability
(permeance) .................................................................................................................... 25
Figure 14: Schematic representation of the relationship between the polymer specific
volume and temperature in an amorphous polymer ....................................................... 27
Figure 15: Difference of selectivity calculated from pure gas measurements and gas
mixtures for acetate cellulose membranes ...................................................................... 28
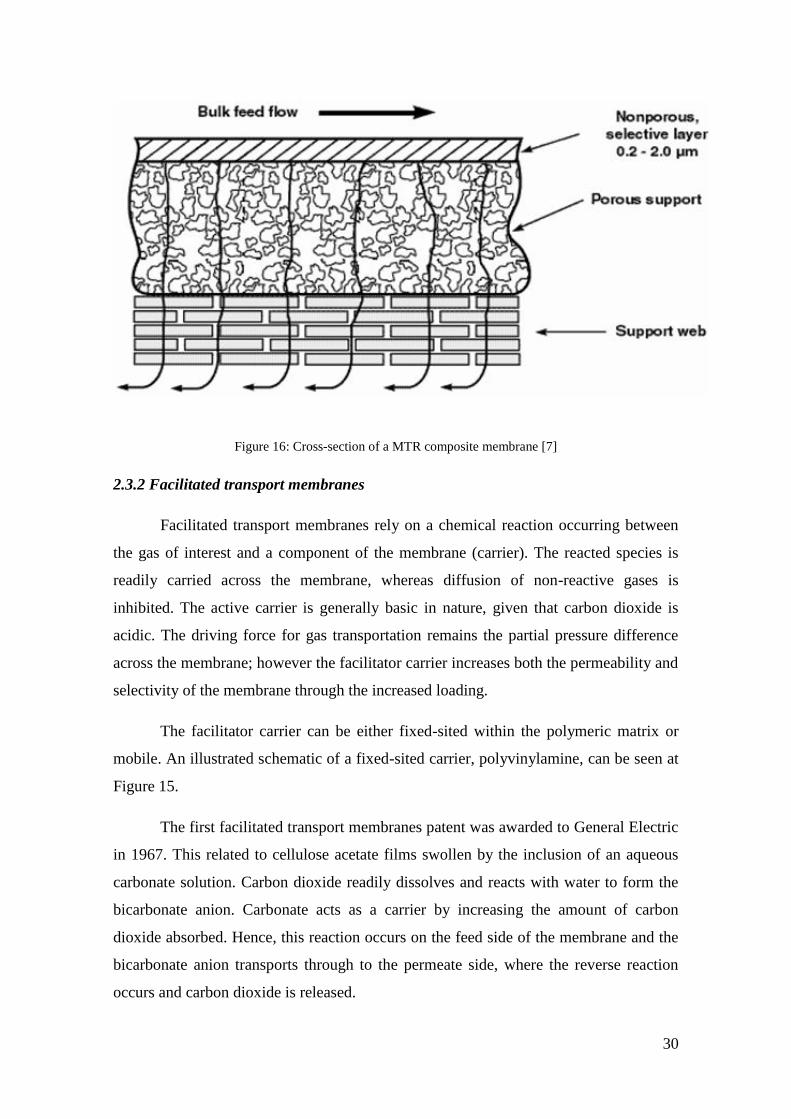
Figure 16: Cross-section of a MTR composite membrane ............................................. 30
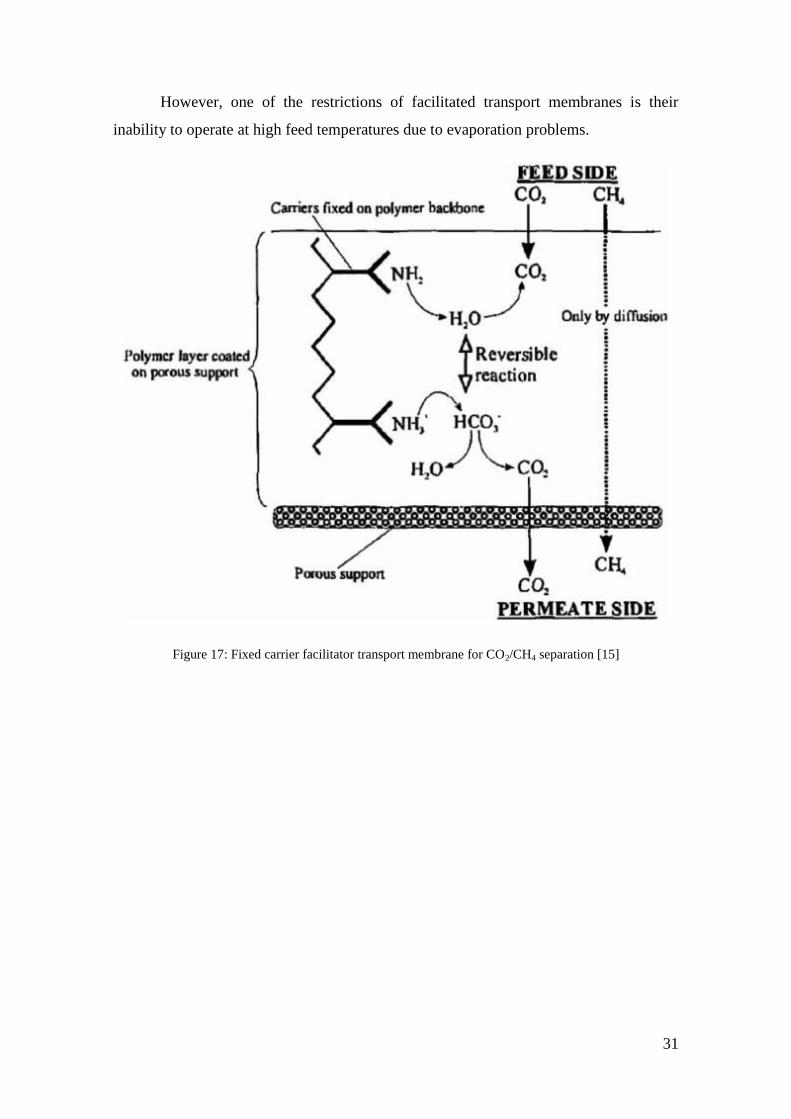
Figure 17: Fixed carrier facilitator transport membrane for CO2/CH4 separation ......... 31
Figure 18: Separation stage scheme ............................................................................... 34
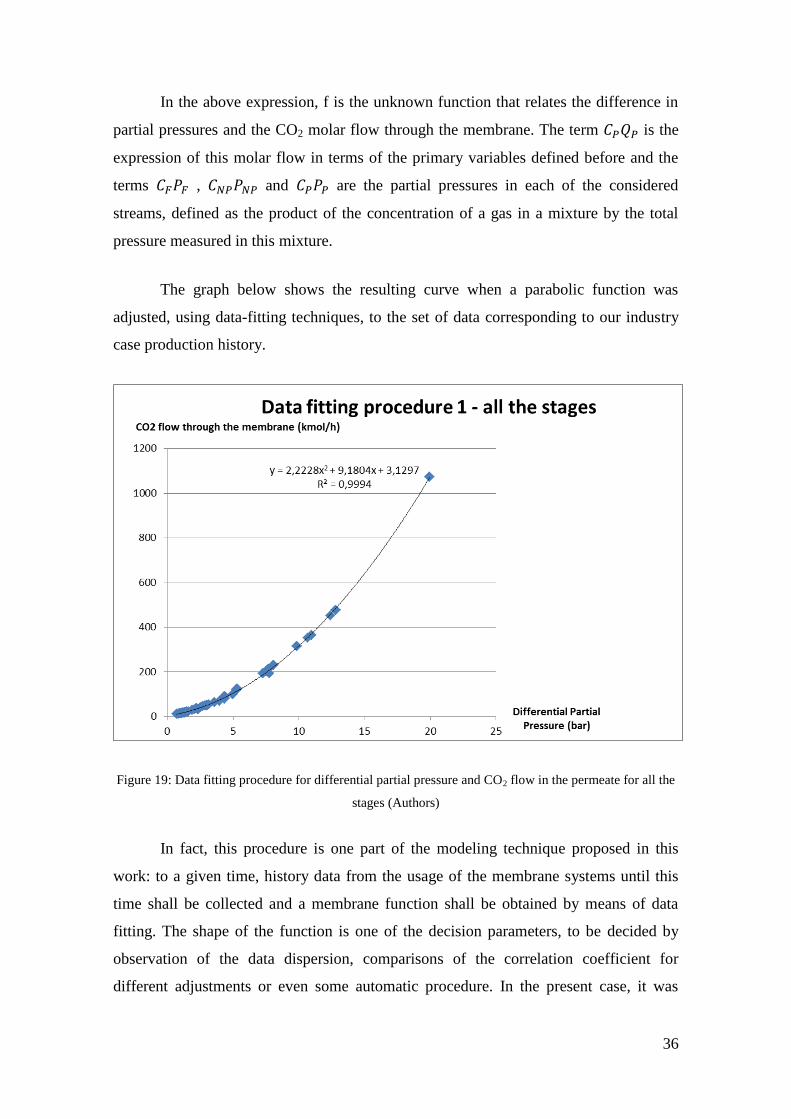
Figure 19: Data fitting procedure for differential partial pressure and CO2 flow in the
permeate for all the stages .............................................................................................. 36
Figure 20: Data fitting procedure for non-permeate total flow and feed total flow for
stage 3 ............................................................................................................................. 37

xi
Figure 21: Data fitting procedure for non-permeate total flow and feed total flow for
stage 2 ............................................................................................................................. 38
Figure 22: Data fitting procedure for permeate CO2 flow and feed CO2 flow for stage 1
........................................................................................................................................ 38
Figure 23: Parallel formation representation .................................................................. 40
Figure 24: Two-step system representation .................................................................... 40
Figure 25: Membrane’s simplified plant ........................................................................ 41
Figure 26: Three-stage membrane separation system scheme ....................................... 41
Figure 27: Optimization methodology scheme .............................................................. 49
Tables list
Table 1: Comparison between different membrane elements .......................................... 8
Table 2: Comparison between amines and membrane techniques ................................. 12
Table 3: Principal suppliers of membrane natural gas separation systems .................... 25
Table 4: Process design parameters ................................................................................ 33
Table 5: Relative errors with respect to concentrations ................................................. 46
Table 6: Relative errors with respect to total molar flows ............................................. 46
Table 7: Relative errors with respect to CO2 molar flows .............................................. 47
Table 8: Synthetic study case properties ........................................................................ 50
Table 9: Sensitivity analysis in the synthetic case .......................................................... 51

1
1 INTRODUCTION
1.1 Research Objectives
The present work has two main objectives. The first one is to briefly present the
technology of separation of gases using membranes, with mentions to its necessity in
the petroleum industry and comparison with alternative technologies. This first part
aims to be informative on its own and also to justify the need and furnish material for
the second part, which is a study about simulation applied to the usage of systems of
membranes in order to improve the quality of decisions related to these systems. An
industry case study will be used as the background of the whole development, namely
the project of FPSO Cidade de Paraty’s separation system based on membranes
technology, by the enterprise SBM.
Separation using membranes is an upcoming technology that has started to be
widely applied for CO2/CH4 separation. When considering offshore structures and
reservoirs containing high levels of carbon dioxide, the application of this technology
was found to be very favorable, since it is an efficient system with relatively simple
operation even under motion conditions. The industry case study considered here was
originated from the fact that SBM is an offshore specialized company, producing
vessels that will operate on pre-salt reservoirs, which implies that these vessels may
have to deal with high CO2 content in the production streams. Thus, the membrane
technology is a clear and immediate option to be applied in SBM’s projects.
One of the key motivations for the development of simulation methods is the
fact that the knowledge about membrane specific technology aspects may be kept as an
industrial secret by membrane separation systems’ producers, in order to aggregate
value to their product. In this case, the company that is buying the equipment has access
only to history data regarding the upstream and downstream streams, and the membrane
devices remain as a “black box”. It can be profitable to these companies to be able to,
given data from the production and separation, simulate different cases that are similar
to the ones that produced the data, performing in this way sensitivity analysis, and
calculate optimal operational variables in order to optimize this and other membrane
2
arrangements, thus becoming less dependent on the membrane supplier’s confidential
know-how. These features can be reached by use of a membrane system simulator.
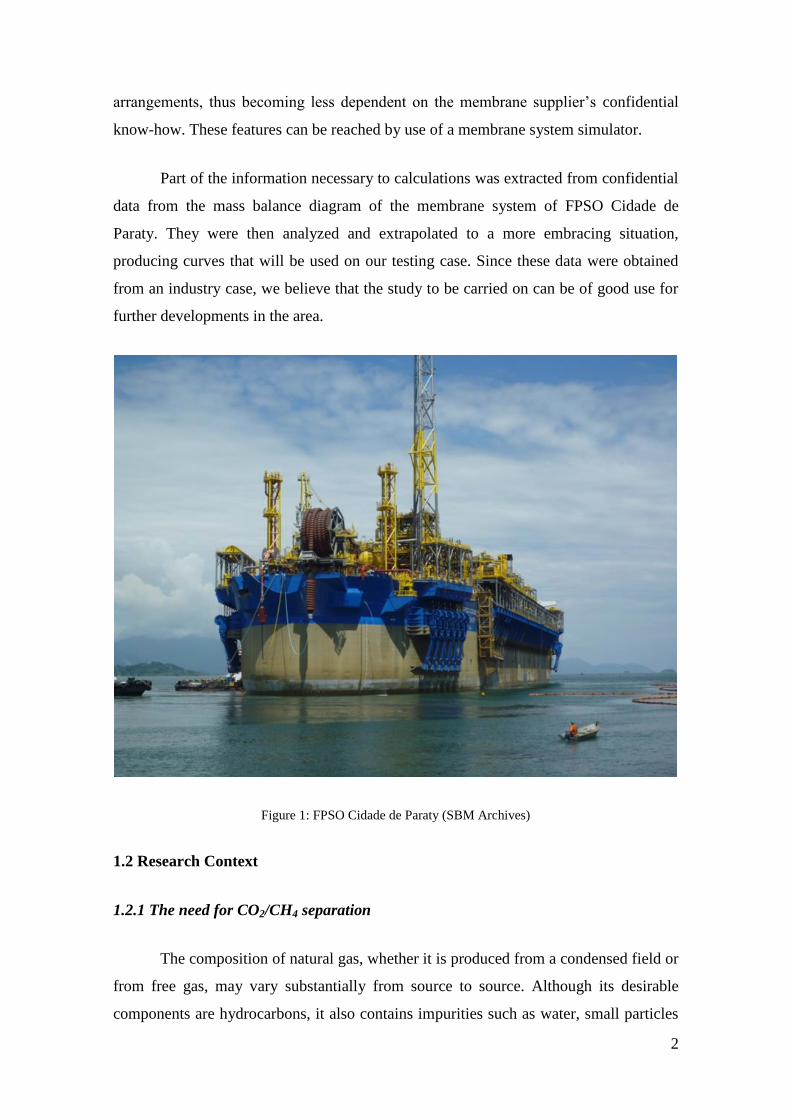
Part of the information necessary to calculations was extracted from confidential
data from the mass balance diagram of the membrane system of FPSO Cidade de
Paraty. They were then analyzed and extrapolated to a more embracing situation,
producing curves that will be used on our testing case. Since these data were obtained
from an industry case, we believe that the study to be carried on can be of good use for
further developments in the area.
Figure 1: FPSO Cidade de Paraty (SBM Archives)
1.2 Research Context
1.2.1 The need for CO2/CH4 separation
The composition of natural gas, whether it is produced from a condensed field or
from free gas, may vary substantially from source to source. Although its desirable
components are hydrocarbons, it also contains impurities such as water, small particles
3
and acid gases. Those contaminants may represent a threat during the production
process; hence, it becomes necessary to remove them. [4]
Due to its high volume, gas is traditionally transported through long and highly
pressurized pipes. Therefore the occasional presence of any quantity of acid gases may
become dangerous as it will induce a corrosive environment. Analyzing the case of
carbon dioxide, it is well known that, when in presence of water, it presents a relevant
corrosive potential due to the formation of carbonic acid, fact that demands CO2
removal from these streams.
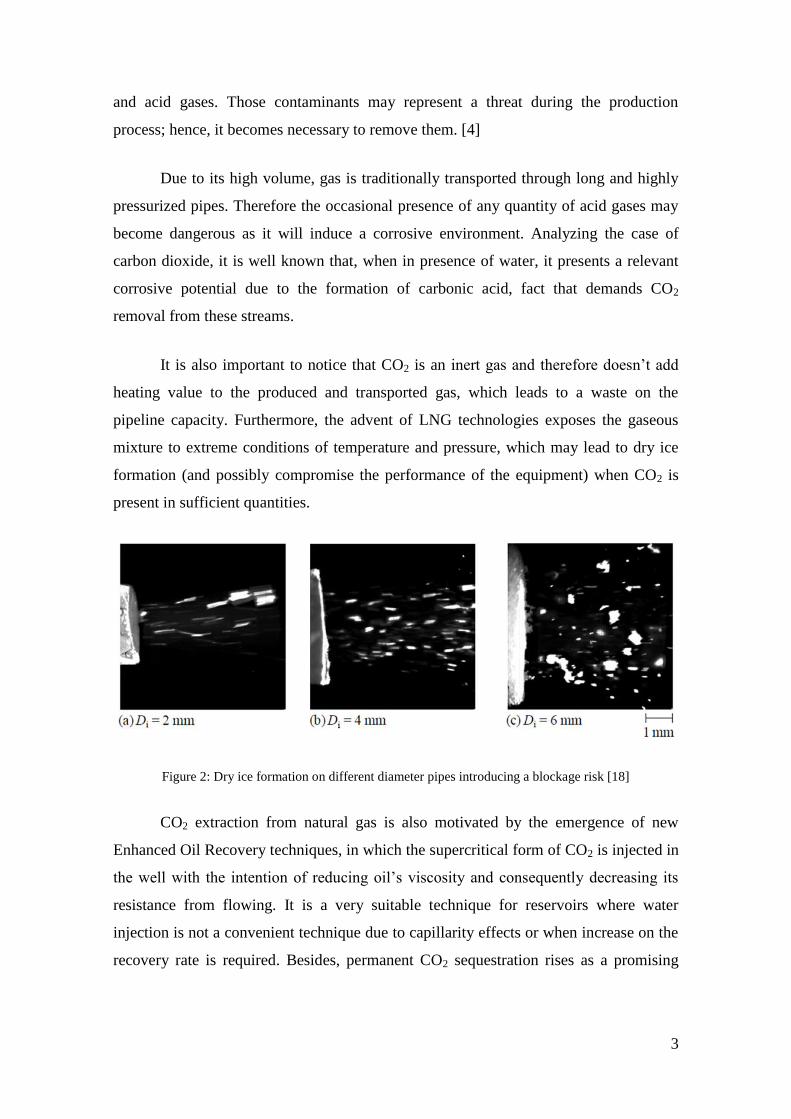
It is also important to notice that CO2 is an inert gas and therefore doesn’t add
heating value to the produced and transported gas, which leads to a waste on the
pipeline capacity. Furthermore, the advent of LNG technologies exposes the gaseous
mixture to extreme conditions of temperature and pressure, which may lead to dry ice
formation (and possibly compromise the performance of the equipment) when CO2 is
present in sufficient quantities.
Figure 2: Dry ice formation on different diameter pipes introducing a blockage risk [18]
CO2 extraction from natural gas is also motivated by the emergence of new
Enhanced Oil Recovery techniques, in which the supercritical form of CO2 is injected in
the well with the intention of reducing oil’s viscosity and consequently decreasing its
resistance from flowing. It is a very suitable technique for reservoirs where water
injection is not a convenient technique due to capillarity effects or when increase on the
recovery rate is required. Besides, permanent CO2 sequestration rises as a promising

4
field, as it offers the potential to provide a permanent sink for CO2 industrial emissions.
[6]
1.2.2 Membranes technology overview
The concept of membrane separation was originally proposed by Graham in
1866 as initially the majority of membranes research was directed towards reverse
osmosis. Gas separation membranes were first commercialized in 1977. During the
1980s and 1990s, Cynara, Separex and Generon led to substantial innovations on
membrane materials, which have improved the gas separation efficiency and membrane
durability, making gas separation using membranes commercially competitive. [15]
Membranes act as filters to separate one or more gases from a feed mixture and
to generate a specific gas rich permeate or a specific gas retentate (or Non-Permeate). It
is based on the principle that some gases permeate the membrane more rapidly than
others, since the permeation rate for a given gas component will be dependent on its
molecular size, its solubility in the membrane polymer and operational conditions. The
permeation rate will be dependent mostly on the differential partial pressures through
the membrane, membrane’s permeability and the area exposed to the flow on each side.
Figure 3: Scheme of membrane gas separation [15]
The first CO2/CH4 separation membranes were based on cellulose acetate and
derivatives. They were characterized by a thin, dense and selective layer that would
separate both gases by the difference in their permeation coefficient through the
membrane. However, the practical application of the concept proved to be challenging,
since the membranes were very fragile due to their composition and thickness, lacking

5
the mechanical strength necessary for any industrial process. In order to change this
scenery, a different membrane (now asymmetric) was developed; it consisted on the
already proposed thin and dense layer supported by a less dense, porous layer. In this
configuration, the dense layer participates in the separation as the selective material,
whereas the porous layer provides sufficient mechanical resistance and increases the
area exposed to flow on the permeate side, which will enhance gas permeation.
Figure 4: Asymmetric membrane structure [4]
The first membrane systems to separate carbon dioxide from natural gas were
introduced by Grace Membrane Systems (a division of W.R. Grace), Separex (now part
of UOP), and Cynara (now part of Natco). These companies used the previously
mentioned anisotropic cellulose acetate membrane, produced using the Loeb-Sourirajan
technique (involving precipitation of a casting solution by immersion in a non-solvent
bath).
However, a further development of CO2 permeable materials is beginning to
challenge traditional polymeric membranes. Although cellulose acetate membranes are
still widely used, newer membranes such as the polyimide membranes (made by Medal,
a division of Air Liquide) are starting to be industrially produced and commercialized.
One of the reasons for that is that the flux through Cellulose Acetate membranes
decreases substantially with the time, due to the plasticization (reaction between CO2

6
and the polymeric chain) and compaction of the material (low mechanical strength). In
fact, the presence of a differential pressure through the membrane will induce the
collapse of the pores, decreasing the exposed area to flow, which will affect
membrane’s performance. Since polyamide membranes are less reactive and more
resistant, cellulose acetate is slowly being replaced by them. [1]
In order for membranes to be used in a commercial separation system, they must
be packaged in a manner that supports the membrane and facilitates handling of the two
product gas streams. These packages are generally referred to as elements or bundles.
The most common types of membrane elements in use today for natural gas separation
are the spiral-wound type and the hollow-fibber type. [5]
1.2.2.1 Membrane elements
Spiral-wound elements (Figure 5) consist of one or more membrane leaves. Each
leaf contains two membrane layers separated by a rigid, porous, fluid-conductive
material called the permeate spacer. The spacer facilitates the flow of the permeate gas,
an end product of the separation. Another space, the high pressure feed spacer, separates
Figure 5: Scheme of the spiral-wound membrane (Courtesy of ProSep)

7
one membrane leaf from another and facilitates the flow of the high pressure stream
linearly along the element. The membrane leaves are wound around a perforated hollow
tube, known as the permeate tube, through which permeate is removed. The membrane
leaves are sealed with an adhesive on three sides to separate the feed gas from the
permeate gas, while the fourth side is open to the permeate tube. [5]
The operation of the spiral-wound element can be best explained by means of an
example. In order to separate carbon dioxide from a natural gas, the feed mixture enters
the pressure vessel (tube) at high pressure and is introduced into the element via the
feed spacer. The more permeable CO2 and H2O rapidly pass through the membrane into
the permeate spacer, where they are concentrated as a low pressure gas stream. This low
pressure CO2 gas stream flows radially through the element in the permeate spacer
channel and is continuously enriched by additional CO2 entering from other sections of
the membrane. When the low pressure CO2 reaches the permeate tube at the center of
the element, the gas is removed in one or both directions. The high pressure residual gas
mixture remains in the feed spacer channel, losing more and more of the carbon dioxide
and being enriched in hydrocarbon gases as it flows through the element, and exits at
the opposite end of the element.
Figure 6: Scheme of the hollow-fiber membrane (Courtesy of Cameron Limited)

8
The membrane system consists of membrane elements connected in series and
contained within pressure tubes. A rubber U-cup attached to the element serves to seal
the element with the inner diameter of the pressure tube, thereby forcing the feed gas to
flow through the element. The pressure tubes are mounted in racks on a skid.
To construct hollow fiber elements, very fine hollow fibers are wrapped around
a central tube in a highly dense pattern. The feed natural gas flows over and between the
fibers and the fast components permeate into the middle of the hollow fiber. The
wrapping pattern used to make the element is such that both open ends of the fiber
terminate at a permeate pot on one side of the element. The permeate gas travels within
the fibers until it reaches the permeate pot, where it mixes with permeate gas from other
fibers. A permeate pipe allows the collected gases to exit the element. An illustration is
shown in Figure 6.
Table 1: Comparison between different membrane elements [10]
As the feed gas passes over the fibers, the components that do not permeate
eventually reach the center tube in the element, which is perforated like the spiral-
wound permeate tube. In this case, however, the central tube is for residual gas
collection, not permeate collection. Many optimizations are possible for either element
configuration. For hollow fibers, an important parameter is adjusting fiber diameter –
finer fibers give higher packing density while larger fibers have lower permeate
pressure drop and so use the feed-to-permeate-side pressure drop driving force more
Types of Membranes
ADVANTAGES DISADVANTAGES
Hollow Fiber Greater amount of membrane surface area within a given volume.
Ability to operate effectively in the presence of heavy hydrocarbons
Limited maximum operating pressure
Strength reduces with increasing CO2 concentration
Spiral Wounds Able to withstand relatively high pressures
Minimum permeate pressure drop
Hydrocarbon condensation may not be easily removed and liquid accumulated inside reduces the productivity of the membrane

9
efficiently. While each element type has its own advantages, the mechanism for gas
separation is independent of the membrane configuration.
While each membrane has its own pros and cons, in order to a better comparison
Mat Isa [10] introduced the scheme illustrated in Table 1.
1.2.3 Alternative techniques
Membranes technology is one among several others that may be used in order to
remove acid gases from natural gas streams; therefore, in order to better evaluate a
membrane technique one should be informed about the alternative systems and be aware
of the conditions that will justify choosing one over the other.
A wide variety of acid gas removal technologies are available. They include:
• Absorption Processes (Chemical and Physical)
• Cryogenic Processes
• Adsorption Processes
Similarly, selecting an acid gas treating scheme hinges on many factors, such as:
(Adapted from: [9] - Concentration and degree of removal desired for the impurities
(acid gases))
• Feed pressure and temperature
• Presence of heavier hydrocarbons
• Feed rate
• Relative economics of suitable processes
• Energy costs
• Production location
10
• Capital versus operation costs
• Reliability
• Others
On an Absorption Process a component of gaseous phase is contacted with a
liquid in which it is preferentially soluble. It is usually carried out in a counter current
tower (column), through which liquid descends and gas ascends.
The reverse process is employed when it is needed to remove the absorbed gases
from the solvent for the purpose of recovery of the gas, or the solvent or both. In
physical absorption, the desired gas component being absorbed (absorbate) is more
soluble in the liquid solvent (absorbent) than other components in the gas phase but
does not interact chemically with the absorbent; whereas in chemical absorption the
absorbate reacts chemically with the absorbent or a component within the absorbent.
Among main absorption processes, chemical absorption with amines stands out
as the traditional technique used when removing CO2 from CH4. For this reason the
technique will be further detailed in the next section, where a comparison will be made
between amine and membrane CO2 extraction.
When considering the method’s disadvantages, the corrosive potential of
amine’s solutions may lead to corrosion of the unit. Depending on the inhibitor used, it
may cause a high tendency for foaming and solid suspension. In an offshore
environment, the volume occupied by the equipment and its sensitivity to ship’s
motions may be added to the disadvantages list.
Regarding Cryogenic Fractionation, it is a technique that uses very low
temperature (-73.30 ⁰C) for purifying gas mixtures in the separation process. While the
method is used commercially to liquefy and purify CO2 from streams that have high
CO2 contents (typically greater than 50-70%), it has not been applied to large scale CO2
capture from flue gas due to their low concentration of CO2, which makes the
application of this technique not economical.
11
Cryogenic Separation has the advantage that the CO2 can be obtained at
relatively high pressure as opposed to the other methods of recovering CO2. This
advantage may, however, be offset by the large refrigeration, and consequent energy
costs, required. Moreover, the tendency for blockage of process equipment is high and
cryogenic fluids may be flammable and toxic and special materials are required due to
the extreme conditions achieved.
Finally, Adsorption Process is described as the adhesion or retention of
selective components of feed gas stream brought into contact to the surface of certain
solid as the result of the field force at the surface. As the surface of an adsorbing
material may exhibit different affinities for the various components of a fluid, it offers a
straightforward means of purification as well as potentially useful method of bulk
separation.
Depending on the nature and strength of surface forces, adsorptive gas
separation can be divided into two types: physical adsorption and chemisorptions,
where chemisorptions can be considered as the formation of a chemical bond between
the sorbate (element to be extracted from the mixture) and the solid surface. Such
interactions are strong, highly specific and often not reversible. In physical adsorption
the forces are weaker (a combination of Van der Waals force and electrostatic force),
therefore the adsorbent is more easily regenerated
The primary requirement for an economic adsorption separation process is an
adsorbent with sufficient selectivity, capacity and service life. Since adsorption is a
surface phenomenon, an adsorbent should have high surface area to volume ratio. The
main advantage of physical adsorption methods is its low energy requirements for the
regeneration of the sorbent material with short period of time associated to the change in
pressure. [13]
As it is a method mainly used for purification processes, and the present case
requires a bulk extraction, the technique is not indicated.

12
1.2.4 Membranes X Amines
Initially, membranes were restricted to either small natural gas streams or those
with very high CO2 content, such as in enhanced oil recovery CO2 floods. However, as
the technology evolved, it became better known and more competitive.
As the technique settles into the market, it becomes more important to compare
it with the well-established ones (amine technology), evaluating the relative strengths
and weaknesses of the each process.
Many alkalonamines are most widely used as the chemical solvent gas treating
process for acid gas removal in natural gas and petroleum processing industries. These
processes use a solvent in an aqueous solution. The common amine based solvents used
for the absorption process are monoethanolamine (MEA), diethanolamine (DEA) and
methyldietanolamine (MDEA) that reacts with the acid gas (CO2 and H2S) to form a
complex or bond.
As discussed above, the method’s disadvantages include a high tendency for
foaming and solid suspension, the system’s sensitivity to ship’s motion and the large
space required by the installations.
The table below (Table 2) looks at some key areas for comparison.
Amines Membranes
User Comfort Level Very Familiar Becoming Familiar Hydrocarbon Losses Very Low Depend Upon Operational
Conditions and Initial and Final CO2 Concentration
Energy Consumption Moderate to high Low (for one-phased plants)
Operating Costs Moderate to high Low (for one-phased plants)
Maintenance Costs Low to moderate Low (for one-phased plants), although misuse cause irreversible damage
Ease of Operation Relatively Complex Relatively Simple
Table 2: Comparison between Amines and Membrane techniques (Adapted from [5])
In another dimension, membranes can be coupled with a solvent to capture
desired gases (such as CO2). This process is known as membrane gas absorption. In

13
such process, the CO2 diffuses between the pores in the membrane and is then absorbed
by the solvent. The membrane maintains the surface area between gas and liquid phases.
This technique will be advantageous when CO2 presents a low partial pressure (not the
present case), due to the small driving force for separation.
This technique does not use the permeation coefficient of the gas through the
membrane as the separation factor; it functions rather as a barrier between liquid and
gas permeability through the pores. This physical separation between liquid and gas
flow eliminates transport problems such as foaming and channeling.
1.3 Membranes technology and sustainable development
When introducing new technologies in a global market it is not only important to
evidence a product's contribution to the industry immediately involved. In order to
secure a long-lasting profitable future of an unconventional technique one must make
sure it may be considered a sustainable technology.
When touching the subject of sustainable development it is important to be
aware of the broad definition of the concept. Although words such as "green" or "eco-
friendly" may have been used to define the early beginning of sustainable technologies,
the current definition has grown very much outside the ecological sphere, enclosing
economic and social concepts to it. Nowadays a technology is not only judged over its
efficiency, cost and other performance-oriented issues, its environment impact and its
future social consequences are just as important.
Those three spheres (economical, environmental and social) are interconnected
and the result of this process can be seen with much more complex analysis of a new
project's consequence. Surely, we live in a capitalist world, and for this reason the
economic sphere may at times prevail over the others, however there is no doubt that
both of the other elements still carry considerable weight.
Regarding relatively recent membranes technology, it is possible to identify
research trends oriented to all three parameters. It is very naive to assume that the oil
industry interest on the technique considers its advantages related to environmental and

14
social concepts, since even though some slight benefits may be noticed, it is clear that
the industry's focus is directed towards profit increase and the creation of value.
The membranes technology applied to CO2 rich oil production wells will enable
an efficient gas separation into two primary streams, a first, methane rich flow and a
second carbon dioxide rich one. In the studied case, the later stream is used to Enhanced
Oil Recovery techniques that will extend the life of an oil reservoir by improving oil
flow, flow properties and/or its interaction with the rock.
Gas injection EOR methods are based on the theory that the injection of gas into
the oil-bearing layer under reservoirs conditions and high pressure will promote a
decrease on oil viscosity and therefore facilitate its displacement. A very good oil
recovery can be guaranteed if the pressure is higher than the minimum miscibility
pressure, which is function of temperature and crude oil characteristics.
Figure 7: Cross-section illustrating how carbon dioxide and water can be used to flush residual oil from
subsurface rock formation between wells. [14]

15
The injected CO2-gas for EOR applications has typically purity from 95% to
99% (vol.). CO2 is compressed, dried and cooled, before being transported and injected
into the formation. In a classical EOR-CO2 flooding, CO2 is introduced into the field
through injection wells, typically drilled around the producer well. Once the oil is
mobilized, through miscible or immiscible processes, it has to be transported to the
production well.
The WAG (water-alternating-gas) process, in which water and CO2 are
alternated in small slugs until necessary CO2 slug size is reached, is the most common
method employed. This approach helps to mitigate the tendency for the lower viscosity
CO2 to finger its way ahead of the displaced oil, since once the injected CO2 breaks
through the producing well, any gas injected afterwards will follow that path, reducing
the overall efficiency of the injected fluids to sweep the oil from the reservoir rock.
Part of the injected CO2 (30 to 70%) returns with the produced oil and is usually
recompressed and re-injected into the reservoirs. Remaining CO2 stays permanently
sequestered into the reservoir.
The possibility of a permanent CO2 storage induced a great amount of research
investment in the area. Due to well-known malefic effects of high amount of
atmospheric CO2 (global warming, glacial melt, oceans acidification, etc.) techniques
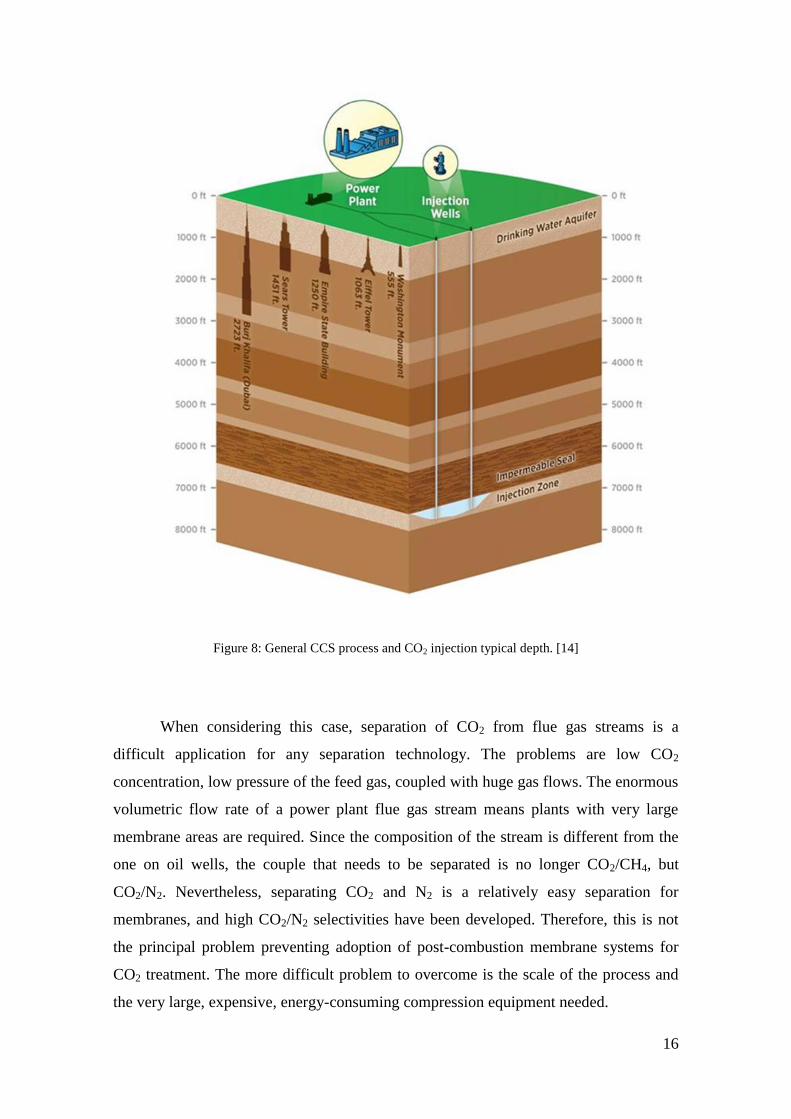
are being developed in an attempt to detain the process. In this context, geological
sequestration has become a promising alternative. Figure 8 illustrates the general CCS
(carbon capture and sequestration) process and shows a typical depth at which CO2
would be injected.
CCs will reduce emissions from large stationary sources of CO2, which include
coal- and natural gas- fired power plants. There is where an opportunity may lay, on
post-combustion CO2 capture.
Compared to oil and gas, coal is the lowest cost method of producing electric
power and it is relatively abundant in large energy-consuming nations, such as China.
For these reasons, it is clear that coal will continue to be used to produce a large
percentage of world’s electric power.
16
Figure 8: General CCS process and CO2 injection typical depth. [14]
When considering this case, separation of CO2 from flue gas streams is a
difficult application for any separation technology. The problems are low CO2
concentration, low pressure of the feed gas, coupled with huge gas flows. The enormous
volumetric flow rate of a power plant flue gas stream means plants with very large
membrane areas are required. Since the composition of the stream is different from the
one on oil wells, the couple that needs to be separated is no longer CO2/CH4, but
CO2/N2. Nevertheless, separating CO2 and N2 is a relatively easy separation for
membranes, and high CO2/N2 selectivities have been developed. Therefore, this is not
the principal problem preventing adoption of post-combustion membrane systems for
CO2 treatment. The more difficult problem to overcome is the scale of the process and
the very large, expensive, energy-consuming compression equipment needed.

17
Ultimately, the competitiveness of a membrane flue gas CO2 capture process
hinges on membrane cost and reliability issues, demonstration and acceptance of large
vacuum/compression equipment, and efficient integration with power facility systems.
These issues will require close collaboration between membrane developers and the
power industry, as well as successful demonstrations of membrane plants of
progressively larger size in the field.

18
2 STATE OF THE ART
2.1 Molecules Transport in Membranes
2.1.1 Characterizing transport in membranes
Since membrane separation is based on the molecular behavior of each
component of the feed gas, an analysis of molecular behavior throughout the separation
appears to be useful to promote a better understanding of the process. [8]
There are five possible mechanisms for membrane separation:
• Knudson diffusion
• Molecular sieving
• Solution-diffusion separation
• Surface diffusion
• Capillary condensation
Being molecular sieving and solution-diffusion transport the mainly ones used
mechanisms on gas/gas separation.
Knudson separation is based on a gas molecules passing through pores small
enough to prevent bulk diffusion. Separation is based on the difference in the mean path
of the gas molecules due to collisions with the pore walls, which is related to the
molecular weight.
Molecular sieving relies on size exclusion to separate gas mixtures. Pores within
the membrane are of a carefully controlled size relative to the kinetic (sieving) diameter
of the gas molecule. This allows diffusion of smaller gases at a much faster rate than
larger gas molecules.
Surface diffusion is the migration of adsorbed gases along the pore walls of
porous membranes. The rate of surface diffusion is determined by the level of
interaction between the adsorbed gases and pore surface. Thus, molecules diffuse along
the pore walls relative to the strength of this interaction, achieving separation.

19
Capillarity condensation is an extension of surface diffusion. When the vapor
pressure is low enough, adsorbed gas can undergo partial condensation within the pores.
This condensed component diffuses more rapidly through the pore than gases, causing
separation of the condensable gas.
Solution-diffusion separation is the mechanism actually used with polymeric
CO2/ CH4 separations, and therefore will be explained in detail at the next section.
Figure 9: Schematic representation of three of the different possible mechanisms for membrane gas [15]
2.1.2 Permeation theory
When describing solution-diffusion processes, it is commonly accepted that the
principal mechanisms are identified in the following order (Figure 10):
Sorption (at the Feed Gas/Membrane interface)
Diffusion (through the Membrane)
Desorption (at the Membrane/Permeate Gas interface)

20
Figure 10: Sorption and diffusion mechanisms [2]
Since the processes of sorption and desorption are opposite phenomena they can
be equationated together (adapted Henry’s Law) as function of CO2/membrane material
condensability [8]:
𝐽𝑆 = 𝑆𝑖. (𝐶𝐹 − 𝐶𝑃) Equation 2.1
Being 𝐽𝑆 the molar flux due to (de)sorption mechanisms; 𝑆𝑖 the condensability factor
between the membrane material and the feed gas; 𝐶𝐹 the CO2 concentration at the feed
gas; 𝐶𝑃 the CO2 concentration at the permeate gas.
Moreover, the diffusion process is described by Fick’s Law and is equationated
as follow:
𝐽𝐷 = 𝐷𝑖
𝛾. (𝐶𝐹 − 𝐶𝑃) Equation 2.2
Being 𝐽𝐷 the molar flux due to diffusion; 𝐷𝑖 the diffusion coefficient of the membrane
material - it is a function of different operational variables being very much affected by
the operating temperature; γ the membrane’s thickness; 𝐶𝐹 the CO2 concentration at the
feed gas; 𝐶𝑃 the CO2 concentration at the permeate gas.

21
Considering both phenomena independent, we may have the total molar flux
equation as follow:
𝐽𝑇 = 𝐽𝑆 + 𝐽𝐷 Equation 2.3
𝐽𝑇 = 𝑆𝑖. (𝐶𝐹 − 𝐶𝑃) + 𝐷𝑖
𝛾. (𝐶𝐹 − 𝐶𝑃) Equation 2.4
𝐽𝑇 = 𝑆𝑖.𝐷𝑖
𝛾. (𝐶𝐹 − 𝐶𝑃) Equation 2.5
Multiplying both sides by the membranes area, we end up with the molar flow
through the membrane:
𝐽𝑇 . 𝐴 = 𝐹𝑇 = 𝐴 .𝑆𝑖 .𝐷𝑖
𝛾. (𝐶𝐹 − 𝐶𝑃) Equation 2.6
Equations 2.5 and 2.6 clearly show dependence between the mass flow and
(de)sorption and diffusion coefficients, therefore we will find that the total mass flux
will depend on the most demanding of these two phenomena.
On a separation application of membranes, it is not only important to analyze the
gases’ individual permeation rate. In order to adequately measure a membrane’s ability
to separate two gases i and j, the ratio of their permeability (𝛼𝑖 𝑗⁄ ) must be analyzed; this
parameter is called membrane selectivity, and can be written as:
𝛼𝑖 𝑗⁄ = 𝑃𝑖
𝑃𝑗=
𝐷𝑖𝑆𝑖
𝐷𝑗𝑆𝑗 Equation 2.7
The ratio 𝐷𝑖
𝐷𝑗⁄ is the ratio of the diffusion coefficients of the two gases and can
be viewed as the mobility selectivity, which indicates the relative motion of individual
molecules of the two components. The mobility selectivity is proportional to the ratio of
the molecular kinetic size of the two permeants. The ratio 𝑆𝑖
𝑆𝑗⁄ is the ratio of the
sorption coefficients, which indicates the relative concentration of the components i and
j in the membrane material. The sorption selectivity is proportional to the relative
condensability of components i and j.
22
On CO2 separation with polymeric membranes mobility selectivity 𝐷𝑖
𝐷𝑗⁄
always favours the permeation of small molecules (such as water (kinetic diameter of
2.65 Å) and carbon dioxide (kinetic diameter of 3.30 Å)) over larger ones (such as
methane (kinetic diameter of 3.80 Å)). [15]
In order evaluate membranes performance in a gas separation, two
characteristics may be considered: the above mentioned permeability (specifying the
mass flow rate the material is able to reach) and its selectivity (the membrane’s
preference to pass one gas species and not another).
Unfortunately, high CO2 permeability does not correspond to high selectivity
when polymeric materials are regarded. In fact the relationship between those two
factors tends to be inversely proportional, admitting either one or the other. Achieving
this combination is a constant goal for membrane’s scientist.
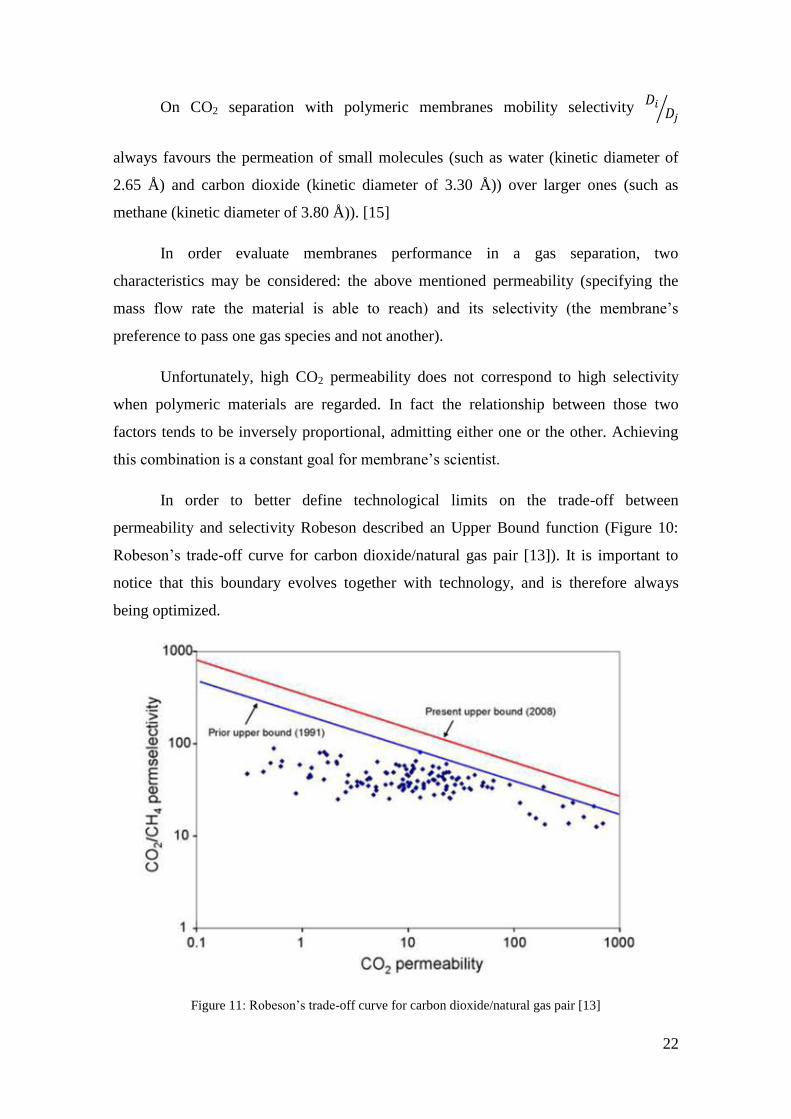
In order to better define technological limits on the trade-off between
permeability and selectivity Robeson described an Upper Bound function (Figure 10:
Robeson’s trade-off curve for carbon dioxide/natural gas pair [13]). It is important to
notice that this boundary evolves together with technology, and is therefore always
being optimized.
Figure 11: Robeson’s trade-off curve for carbon dioxide/natural gas pair [13]

23
2.1.3 Thermodynamic aspects
A thermodynamic analysis of the feed gas is found to be necessary in order to
assure proper membrane functioning. A dew point analysis is particularly important in
order to foresee liquid formation in the membrane due to the increased heavy
hydrocarbons concentration.
The problem of liquid condensation on the membrane surface is illustrated in
Figure 10. This figure shows an example of two natural gas phase envelope curves. [8]
The dew-point temperature is dependent on the pressure and the concentration of
heavy hydrocarbons in the gas mixture. In the example, the feed gas (A) is at 55 °C,
comfortably above the dew point of the feed, which is approximately 35 °C. When the
gas is processed by a membrane, carbon dioxide and some methane is removed from the
feed side to the permeate side. Because membranes are relatively impermeable to
heavier hydrocarbons, these components are retained and concentrated in the residue
gas. This increase in heavy hydrocarbon concentration in the gas causes the phase
envelope to shift to higher temperatures; the dew point of the residue gas (B) is, in this
case, increased to around 50 °C.
In addition to the movement of the dew point line, the system will also present a
cooling tendency. The depressurization of the permeate gas (passing from a ≈50 bar to
≈2 bar) will induce a temperature reduction by the Joule-Thompson effect that will be
transferred to the high pressure side trough thermal diffusion. In the case analyzed the
non-permeate gas will reach temperatures 10- 15 °C below the feed gas. Therefore, in
this case the combination of these effects is sufficient to bring the gas into the two-
phase region of the phase envelope. Condensation of hydrocarbon at the end of the non-
permeate portion of the membrane train would then likely occur. Condensation of this
type may damage the membrane permanently (when reacting with membrane’s
material) and reduce its performance (by decreasing relative area of contact).
When occurred to spiral-wound membrane elements, the condensation of heavy
hydrocarbons is especially prejudicial as the internal structure of the element encumbers
liquid’s drainage. Hollow-fiber modules will be less severely damaged since, due to its
vertical positioning and the horizontal gas flow, liquid may be accumulated and
occasionally drained through the bottom. Condensate formation will be more harmful

24
when the feed gas contains traces of water and/or aromatic hydrocarbons since they
easily react with the polymer forming the membrane (traditionally cellulose acetate).
In order to prevent those difficulties, a pre-treatment system may be employed.
It must have a wide safety margin and be highly flexible to cope with unexpected
circumstances. The heavy hydrocarbon content of a feed gas can vary widely from
initial pre-start-up estimates and also from month to month during the plant’s life. Large
variations are seen even between different wells in the same area. For this reason a
reliable pre-treatment system must take this variation into account and must be able to
protect the membranes against all kinds of contaminants that may possibly be
encountered. [4]
Figure 12: Graph showing the change in the phase envelope of CO2 containing natural gas during
processing of the gas by CO2 selective membrane [8]
2.2 Separation Polymers
2.2.1 Overview
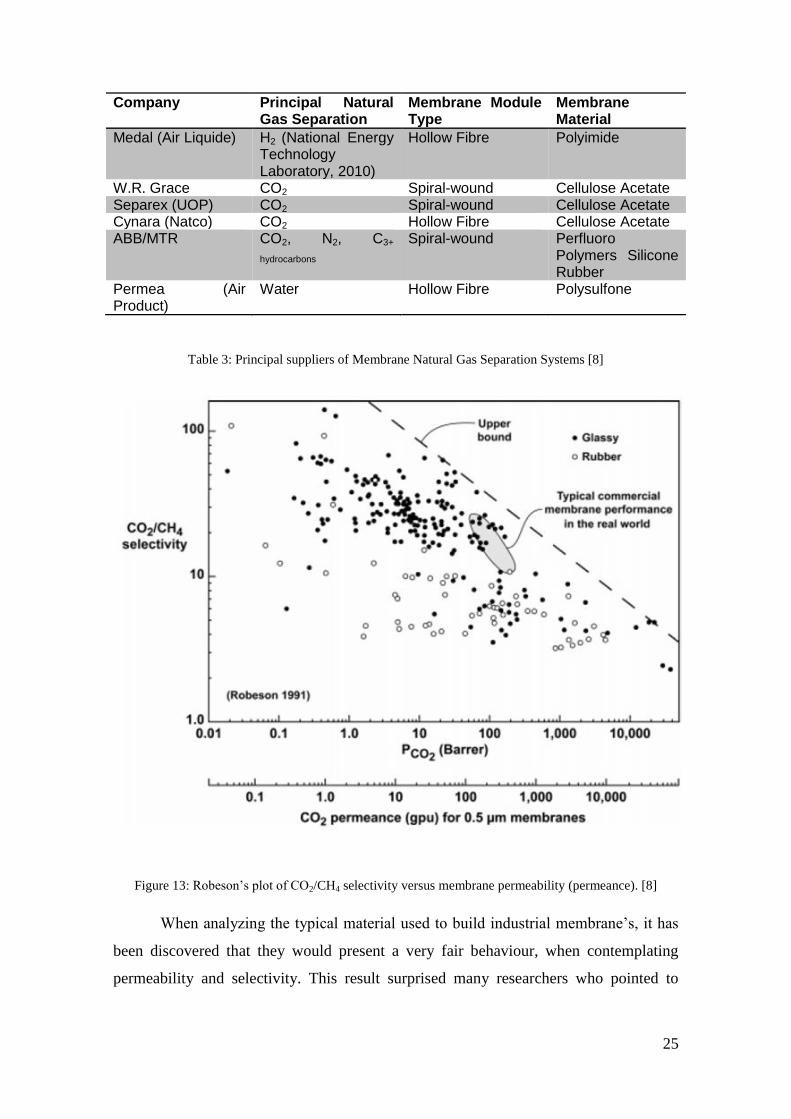
Current membrane carbon dioxide separation plants use a very limited number
of membrane materials, of which cellulose acetate is probably the most common (Table
3).
25
Company Principal Natural Gas Separation
Membrane Module Type
Membrane Material
Medal (Air Liquide) H2 (National Energy Technology Laboratory, 2010)
Hollow Fibre Polyimide
W.R. Grace CO2 Spiral-wound Cellulose Acetate Separex (UOP) CO2 Spiral-wound Cellulose Acetate Cynara (Natco) CO2 Hollow Fibre Cellulose Acetate ABB/MTR CO2, N2, C3+
hydrocarbons
Spiral-wound Perfluoro Polymers Silicone Rubber
Permea (Air Product)
Water Hollow Fibre Polysulfone
Table 3: Principal suppliers of Membrane Natural Gas Separation Systems [8]
Figure 13: Robeson’s plot of CO2/CH4 selectivity versus membrane permeability (permeance). [8]
When analyzing the typical material used to build industrial membrane’s, it has
been discovered that they would present a very fair behaviour, when contemplating
permeability and selectivity. This result surprised many researchers who pointed to
26
literature data that showed the availability of much-better membrane materials (Figure
13).
In addition, commercial membranes that are presently in use have half the
selectivity showed in the plot. Since Figure 11 measurements are obtained from the
ratio of pure-gas permeability plotted against carbon dioxide permeability. When
applied with natural gas, impurities will promote a shift towards weaker performance,
reflecting the effect of water, carbon dioxide, and heavy hydrocarbons. Anyhow this is a
situation that will be faced by any membrane in use and therefore should not be
considered a comparative downside.
2.2.2 Vitreous X Rubbery polymers
Amorphous polymeric membranes may be classified as rubbery or glassy
membranes, depending on its operating temperature relative to the glass transition
temperature of the polymer. It is a very important parameter to analyse the mobility of
sorbed molecules, which is mainly dependent on the free volume (Figure 14) of the
polymer and on the degree of rigidity of the chains.
In polymer materials, diffusion coefficients decrease as the molecular size
increases, since large molecules interact with more polymer segments chain than do
small molecules. In the other hand the sorption coefficients for a particular gas pair is
relatively constant for all amorphous polymers. Thereby it is safe to say that gas
selectivity will be very dependent of the diffusive conditions.
Moreover, depending on the kind of polymer the membrane is made of, a
different transport commands. As a general rule one can say that sorption transport is
the more demanding movement on rubbery polymers, while glassy polymers will select
preferably through diffusion movements.
When the operational temperature is above Tg, polymer is in a rubbery state. In
this state, it tend to have a higher free volume (high specific volume) and more flexible
chains. This configuration does not impose a resistance for molecular diffusion, as the
chains can adjust to the molecular flow relatively easy; consequently the effect of
molecular size of the permeating gases on relative mobility is reduced. Therefore, the

27
main selection promoted by rubbery membranes will be on the sorption coefficients,
which is facilitated as molecular size increases.
Figure 14: Schematic representation of the relationship between the polymer specific volume and
temperature in an amorphous polymer [15]
However if the operational temperature is below glass transition temperature
(Tg) , the polymer is at a vitreous state. This implicates a relevant reduction on intern
free volume and the formation of rigid and often brittle chains, and the effect of
differences in size of the permeating gases on their relative mobility is large, favoring
small molecules diffusion. In other words, the diffusive coefficient (and therefore
molecular size) will prevail on determining gas selectivity.
2.2.2.1 Plasticization and physical ageing in glassy polymers
The deterioration in membrane separation performance under field conditions is
primarily due to the action of CO2 and higher hydrocarbon contaminants present in
natural gas. Large hydrocarbons are highly condensable and have high solubility in the
hydrocarbon polymers. Upon sorbing into a polymer, these higher hydrocarbons can act
28
as plasticizers, increasing polymer chain mobility by increasing the free inside volume
and decreasing the size-sieving ability (or diffusivity selectivity) of the polymer.
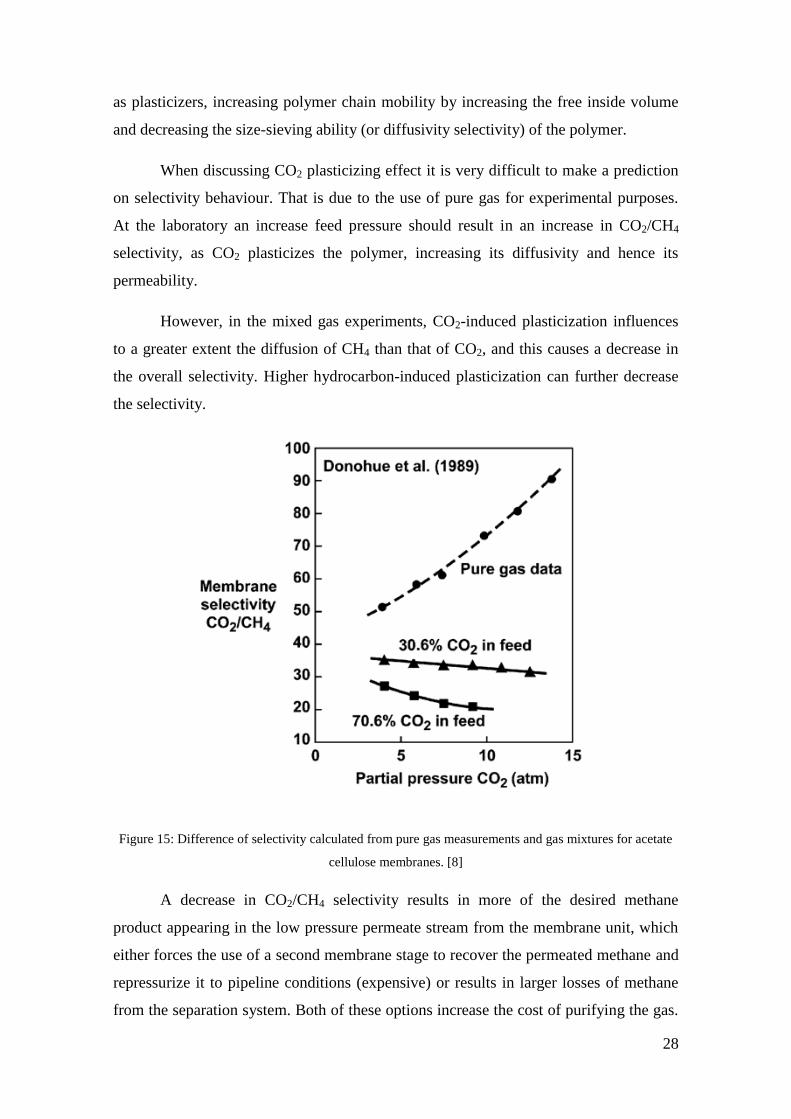
When discussing CO2 plasticizing effect it is very difficult to make a prediction
on selectivity behaviour. That is due to the use of pure gas for experimental purposes.
At the laboratory an increase feed pressure should result in an increase in CO2/CH4
selectivity, as CO2 plasticizes the polymer, increasing its diffusivity and hence its
permeability.
However, in the mixed gas experiments, CO2-induced plasticization influences
to a greater extent the diffusion of CH4 than that of CO2, and this causes a decrease in
the overall selectivity. Higher hydrocarbon-induced plasticization can further decrease
the selectivity.
Figure 15: Difference of selectivity calculated from pure gas measurements and gas mixtures for acetate
cellulose membranes. [8]
A decrease in CO2/CH4 selectivity results in more of the desired methane
product appearing in the low pressure permeate stream from the membrane unit, which
either forces the use of a second membrane stage to recover the permeated methane and
repressurize it to pipeline conditions (expensive) or results in larger losses of methane
from the separation system. Both of these options increase the cost of purifying the gas.

29
Several strategies have been used to overcome membrane plasticization, being pre-
treatment the most common one.
Finally, when working with those glassy materials one must be very attentive to
physical aging. This is because the polymers used in CO2-selective membranes are in a
nonequilibrium state and, over time, the polymer chains can slowly relax into a
preferred higher-density-lower-permeability form. This type of aging effect can reduce
membrane permeability significantly over the average 2-5-year life of a membrane used
in natural gas service.
2.3 Other Materials
2.3.1 Composite membranes
Polymers that exhibit good CO2/CH4 separation performance (selectivity and
flux) may not be ideally suited for providing mechanical support and long-term
chemical stability. Therefore a membrane has usually either very good separation
proprieties or very good mechanical resistance. Composite membranes result of the
attempt to uncouple performance and strength properties. The membrane consists of
three layers: a nonwoven fabric that serves as the membrane substrate (the support
web); a tough, durable, solvent-resistant microporous layer that provides mechanical
support without mass transfer resistance; and a nonporous, defect-free selective layer
that performs the separation. (Figure 14)
This configuration allows each of the layers to be independently chosen to
optimize their function: the selective layer for high flux and selectivity, and the support
layers for mechanical and chemical stability that will not influence the separation.
Composite membranes are structured trying to use materials that are impervious
to hydrocarbon exposure intending a better performance even in the presence of
condensates and a reduction of costs on gas pre-treatment. Furthermore the packing
configuration of this new membrane is spiral-wound.
Finally, although it is clearly a very promising new technology, it is still on its
preliminary fase of manufacturing, not being available at an industrial scale.
30
Figure 16: Cross-section of a MTR composite membrane [7]
2.3.2 Facilitated transport membranes
Facilitated transport membranes rely on a chemical reaction occurring between
the gas of interest and a component of the membrane (carrier). The reacted species is
readily carried across the membrane, whereas diffusion of non-reactive gases is
inhibited. The active carrier is generally basic in nature, given that carbon dioxide is
acidic. The driving force for gas transportation remains the partial pressure difference
across the membrane; however the facilitator carrier increases both the permeability and
selectivity of the membrane through the increased loading.
The facilitator carrier can be either fixed-sited within the polymeric matrix or
mobile. An illustrated schematic of a fixed-sited carrier, polyvinylamine, can be seen at
Figure 15.
The first facilitated transport membranes patent was awarded to General Electric
in 1967. This related to cellulose acetate films swollen by the inclusion of an aqueous
carbonate solution. Carbon dioxide readily dissolves and reacts with water to form the
bicarbonate anion. Carbonate acts as a carrier by increasing the amount of carbon
dioxide absorbed. Hence, this reaction occurs on the feed side of the membrane and the
bicarbonate anion transports through to the permeate side, where the reverse reaction
occurs and carbon dioxide is released.
31
However, one of the restrictions of facilitated transport membranes is their
inability to operate at high feed temperatures due to evaporation problems.
Figure 17: Fixed carrier facilitator transport membrane for CO2/CH4 separation [15]

32
3 CASE MODELING
3.1 Considerations
In order to model a membrane separation system, it is necessary to define a set
of considerations that will be taken into account when formulating the equations to be
used. Since the technology of membranes is still a matter of deep study and most
technical details are classified by its developers, effort was carried in order to design an
acceptable model of membrane separation system and to incorporate the information
available from the industry case, so the present study could approach the reality as much
as possible.
One important consideration is that our model will treat only CO2/CH4
separation, which means that the composition of a stream will consist of only these two
gases. Furthermore, we consider steady-state conditions, in the sense that the molar flow
rates and pressures of the streams do not change with time, or at least are kept constant
for the moment. These two considerations simplify a lot the development of the model
and at the same time seem not to change qualitatively the problem, in the sense that the
model developed in this work can easily be adapted to more complex conditions
regarding these two considerations.
Trying to simulate a real situation in the industry, where the membrane systems’
producer may want to sell the whole separation systems and not want to reveal technical
details about the membranes themselves, the interaction between membrane and gases is
considered to be a set of unknown functions. In fact, this is what happens with our
industry study case. It is possible to measure pressures, concentrations and flow rates of
the different streams considered in the process, but the behavior of the membrane that
will reflect the degree of separation is unknown. This situation was presented in the
introduction of this work, and the approach used to deal with it will be presented in the
appropriate section.

33
3.2 The membrane separation system
The membrane separation system aims to receive a production stream, called
Feed Stream, with specific pressure, flow rate and concentration of gases, and produce
a stream with higher concentration of desirable gases, namely hydrocarbons, being this
stream called Non-permeate Stream and presenting its own values of pressure, flow
rate and concentrations. A third stream, called Permeate Stream, is formed by the flow
which permeated the membranes, and is expected to present lower concentrations of
hydrocarbons and this higher concentration of CO2. The quantities of hydrocarbons and
other gases in each downstream flow are functions of the behavior of the membrane, its
interaction with each of the gases and, as we are going to see in more details, the
concentrations, and thus partial pressures, of the gases in the upstream and downstream
flows.
In order to have a better comprehension of the process, some numbers from our
industrial example are commented. The process gas stream has a total inlet flow of
about 5.7 MMSCMD (Million Metric Standard Cubic Meter Per Day). The CO2
concentration in the feed gas ranges from 4% to 61%. The gas processing design
capacity of the unit is different for different CO2 concentrations in the feed. The gas for
the membranes feed is pre-treated in the molecular sieve dehydration unit in order to
avoid liquid water formation in the membranes, followed by mechanical refrigeration
unit for hydrocarbon dew point control so as to condense and separate eventual
aromatics compounds which would damage the membranes when in liquid phase. The
process design parameters for the membrane system are provided in the following table:
Table 4: Process design parameters (courtesy from Cameron)

34
The membrane elements installed in the housings remove the CO2 rich permeate
gas from the feed gas so that the CO2 concentration in the non-permeate gas is less than
3 mol%. The CO2 rich permeate gas is produced at a pressure of 2.5 bar and the non-
permeate gas is delivered at a pressure of 48 bar minimum.
3.2.1 Membrane separation stages
The simplest system of membranes can be visualized as a unique stage, where
one can identify one feed stream, one permeate stream and one non-permeate stream.
Arrangements of such stages can lead to more complex systems, to be commented
below. Each stage contains a certain number of membrane modules inside of it. These
modules are the inseparable units that are placed together in order to perform the
separation of gases. One of the objectives of the modeling studied in the present work is
to observe how the number and organization of modules inside different stages can
impact the performance of the separation system.
Figure 18: Separation stage scheme (Authors)
For each of the streams above, we will define variables that will be used in the
process of modeling the physics of the system. First, PF, PP and PNP are the absolute
pressures measured in the feed, permeate and non-permeate streams respectively. The
reasoning regarding the subscripts will be maintained, what implies the definitions of
the molar flow rates QF, QP and QNP and the concentrations CF, CP and CNP of CO2.
Since only two gases are considered, the concentration of CH4 is obtained as 1 minus
the concentration of CO2. Furthermore, N will represent the number of membrane
modules in a given stage.
35
Two mass balances are applied to the above situation. First, the total molar flow
must be conserved. This leads to:
𝑄𝐹 = 𝑄𝑁𝑃 + 𝑄𝑃 Equation 3.1
Second, since no chemical reaction is considered to happen inside the membrane
module, the molar flow of one of the gases must also be conserved. This leads to:
𝐶𝐹𝑄𝐹 = 𝐶𝑁𝑃𝑄𝑁𝑃 + 𝐶𝑃𝑄𝑃 Equation 3.2
Further relations are needed in order to represent the way the membrane device
works in order to separate the gases from the feed current. As already mentioned, our
study has as an objective the possibility of working without the explicit quantitative
knowledge about the physics of the membranes. In order to replace this information,
history data from the previous usage of membrane systems alike should be used in some
way in order to provide this information. Below it will be commented how this
procedure was performed in the industry case studied in this work.
3.2.1.1 Usage of history data
The usage of history data, as said before, aims to replace the unknown
information about the physics that regulates the membranes and their interaction with
the different streams. For one separation stage, two relations were needed in order to
model the problem consistently. Considering that our study modeled a 3-stage system,
to be discussed later, the first relation, which was obtained considering the validity of
Fick’s Law of Diffusion in our study, was used for every stage modeled, while one
additional relation was researched for each of the stages separately.
As our first relation, it can be considered that the molar flow of CO2 through a
membrane unit, that is, the CO2 content in the permeate stream divided by the number
of membranes in the stage, is proportional to the difference between the mean of the gas
partial pressure in the feed and non-permeate and the gas partial pressure in the
permeate stream. In terms of the variables already defined previously, we can write:
𝐶𝑃𝑄𝑃
𝑁= 𝑓(
𝐶𝐹𝑃𝐹+𝐶𝑁𝑃𝑃𝑁𝑃
2− 𝐶𝑃𝑃𝑃) Equation 3.3
36
In the above expression, f is the unknown function that relates the difference in
partial pressures and the CO2 molar flow through the membrane. The term 𝐶𝑃𝑄𝑃 is the
expression of this molar flow in terms of the primary variables defined before and the
terms 𝐶𝐹𝑃𝐹 , 𝐶𝑁𝑃𝑃𝑁𝑃 and 𝐶𝑃𝑃𝑃 are the partial pressures in each of the considered
streams, defined as the product of the concentration of a gas in a mixture by the total
pressure measured in this mixture.
The graph below shows the resulting curve when a parabolic function was
adjusted, using data-fitting techniques, to the set of data corresponding to our industry
case production history.
Figure 19: Data fitting procedure for differential partial pressure and CO2 flow in the permeate for all the
stages (Authors)
In fact, this procedure is one part of the modeling technique proposed in this
work: to a given time, history data from the usage of the membrane systems until this
time shall be collected and a membrane function shall be obtained by means of data
fitting. The shape of the function is one of the decision parameters, to be decided by
observation of the data dispersion, comparisons of the correlation coefficient for
different adjustments or even some automatic procedure. In the present case, it was

37
observed that the quadratic model should present a good fitting, and it is indeed the
case.
The second relation to be obtained was stage-dependent in our case. That is, for
each of the three stages considered in our model, one specific function was obtained. In
this way, for stage 3, it was obtained a function with the form:
𝑄𝑁𝑃 = 𝑓(𝑄𝐹) Equation 3.4
That is, f relates the total molar flow in the feed stream with the total molar flow
in the non-permeate stream. The shape of f can be observed in Figure 20.
Figure 20: Data fitting procedure for non-permeate total flow and feed total flow for stage 3 (Authors)
For stage 2, the same approach was considered, that is, the total molar flow in
the feed stream as a function of the total molar flow in the non-permeate stream. The
result can be seen in Figure 21.

38
Figure 21: Data fitting procedure for non-permeate total flow and feed total flow for stage 2 (Authors)
Figure 22: Data fitting procedure for permeate CO2 flow and feed CO2 flow for stage 1 (Authors)
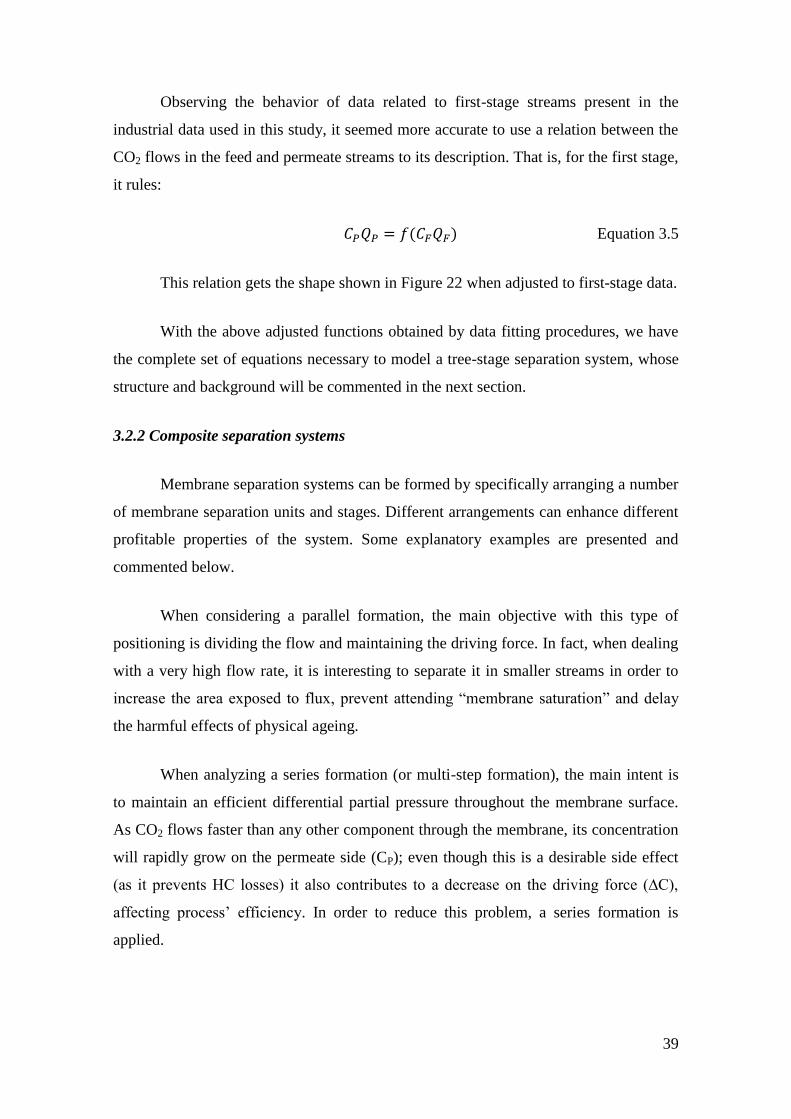
39
Observing the behavior of data related to first-stage streams present in the
industrial data used in this study, it seemed more accurate to use a relation between the
CO2 flows in the feed and permeate streams to its description. That is, for the first stage,
it rules:
𝐶𝑃𝑄𝑃 = 𝑓(𝐶𝐹𝑄𝐹) Equation 3.5
This relation gets the shape shown in Figure 22 when adjusted to first-stage data.
With the above adjusted functions obtained by data fitting procedures, we have
the complete set of equations necessary to model a tree-stage separation system, whose
structure and background will be commented in the next section.
3.2.2 Composite separation systems
Membrane separation systems can be formed by specifically arranging a number
of membrane separation units and stages. Different arrangements can enhance different
profitable properties of the system. Some explanatory examples are presented and
commented below.
When considering a parallel formation, the main objective with this type of
positioning is dividing the flow and maintaining the driving force. In fact, when dealing
with a very high flow rate, it is interesting to separate it in smaller streams in order to
increase the area exposed to flux, prevent attending “membrane saturation” and delay
the harmful effects of physical ageing.
When analyzing a series formation (or multi-step formation), the main intent is
to maintain an efficient differential partial pressure throughout the membrane surface.
As CO2 flows faster than any other component through the membrane, its concentration
will rapidly grow on the permeate side (CP); even though this is a desirable side effect
(as it prevents HC losses) it also contributes to a decrease on the driving force (∆C),
affecting process’ efficiency. In order to reduce this problem, a series formation is
applied.
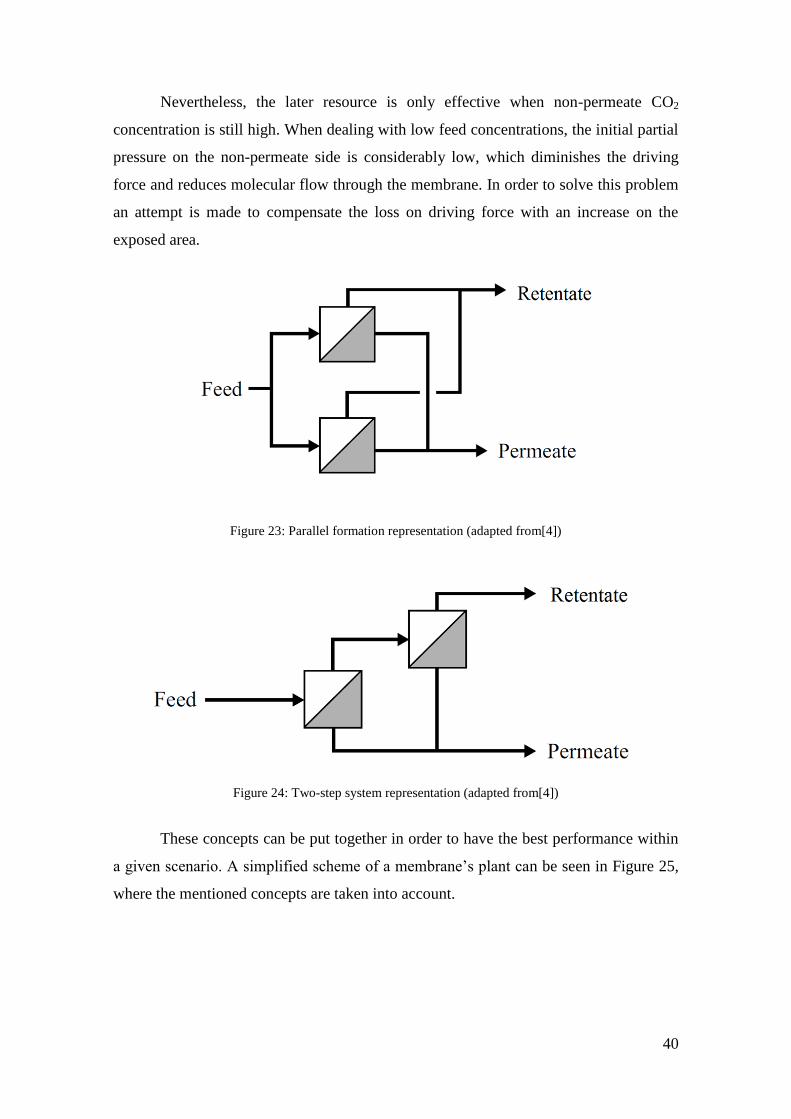
40
Nevertheless, the later resource is only effective when non-permeate CO2
concentration is still high. When dealing with low feed concentrations, the initial partial
pressure on the non-permeate side is considerably low, which diminishes the driving
force and reduces molecular flow through the membrane. In order to solve this problem
an attempt is made to compensate the loss on driving force with an increase on the
exposed area.
Figure 23: Parallel formation representation (adapted from[4])
Figure 24: Two-step system representation (adapted from[4])
These concepts can be put together in order to have the best performance within
a given scenario. A simplified scheme of a membrane’s plant can be seen in Figure 25,
where the mentioned concepts are taken into account.
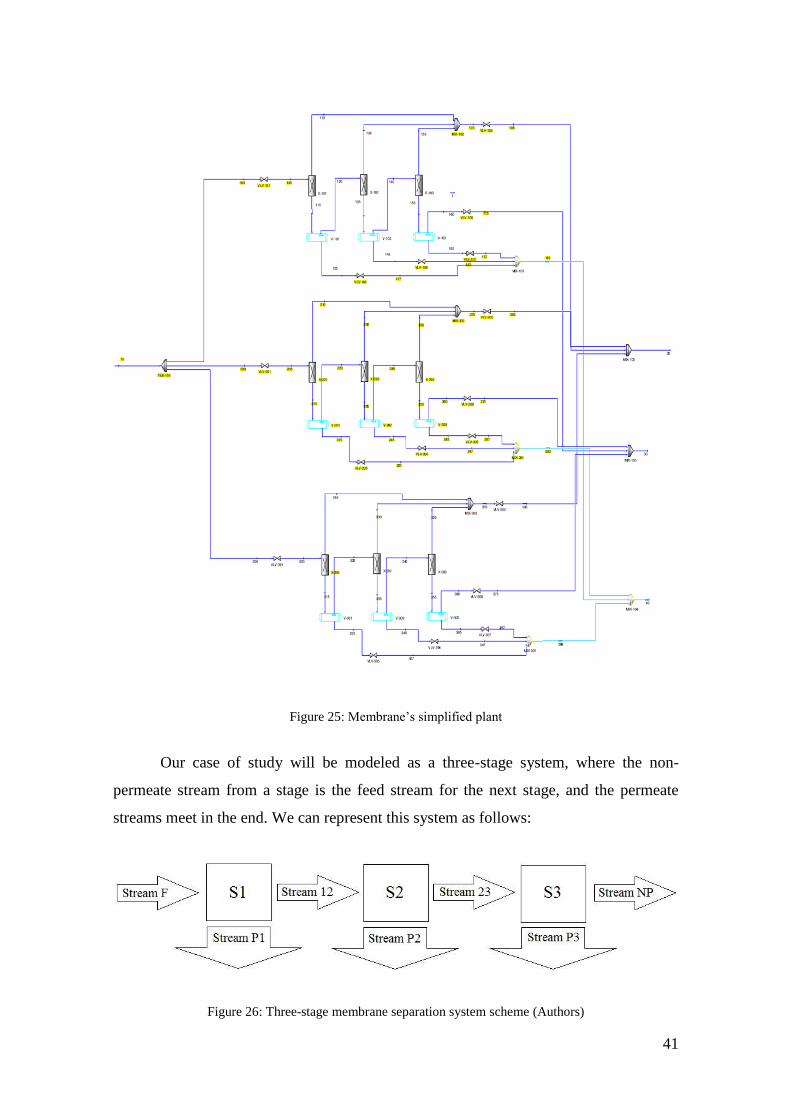
41
Figure 25: Membrane’s simplified plant
Our case of study will be modeled as a three-stage system, where the non-
permeate stream from a stage is the feed stream for the next stage, and the permeate
streams meet in the end. We can represent this system as follows:
Figure 26: Three-stage membrane separation system scheme (Authors)

42
Following the subscript organization, the properties molar flow Qsub, pressure
Psub and CO2 concentration Csub for each current will be referred with the subscript
“sub” assuming the respective labels. In this way, the non-permeate current leaving the
module 1 and serving as feed current for module 2 will present the properties Q12, P12
and C12, following the convention.
3.3 Algorithm and implementation
Using the mass balances and functions obtained by data fitting as shown above,
it is possible to implement a simulator aiming to reproduce the behavior of the
membrane separation system. The simulations will resemble the real observed results as
much as the model is accurate enough, and in our case this means both choosing the
right equations to model the system and having accurate data fitting. Another important
point is that the simulator will always be more trustable close to the points which
participated on the data fitting procedure. That is, simulating cases that are close to one
of the real cases used in the data fitting procedures will always lead to more reliable
results. It is though expected that the simulator becomes more robust as more data is
incorporated to the history data.
Following the reality, it is considered that all the pressures and all the data
related to the feed stream are known, together with the number and distribution of
membrane modules among the stages. That is, it is known from the beginning the values
of 𝑄𝐹, 𝐶𝐹, 𝑃𝐹, 𝑃𝑃1, 𝑃𝑃2, 𝑃𝑃3, 𝑃12, 𝑃23, 𝑃𝑁𝑃, 𝑁1, 𝑁2 and 𝑁3. Since the stages are solved in
order, that is, stage 1 is completely solved before stage 2, which is completely solved
before stage 3, each stage can be solved with full information about the feed stream
related to it. That is, stage 2 can use all the information with subscript 12 and stage 3
can use all the information with subscript 23.
Each of the stages is modeled using two mass balances and two adjusted
functions. Since the nature of stages 2 and 3 is slightly different from stage 1, we will
describe both situations separately.
3.3.1 Stage 1
Stage 1 is modeled using the following equations:

43
𝑄𝐹 = 𝑄𝑃1 + 𝑄12 Equation 3.6
𝐶𝐹𝑄𝐹 = 𝐶𝑃1𝑄𝑃1 + 𝐶12𝑄12 Equation 3.7
𝐶𝑃1𝑄𝑃1
𝑁1= 𝑓 (
𝐶𝐹𝑃𝐹+𝐶12𝑃12
2− 𝐶𝑃1𝑃𝑃1) Equation 3.8
𝐶𝑃1𝑄𝑃1 = 𝑔(𝐶𝐹𝑄𝐹) Equation 3.9
Being:
𝑓(𝑥) = 2.2228 𝑥2 + 9.1804 𝑥 + 3.1297 Equation 3.10
𝑔(𝑥) = 0.8013 𝑥 − 141.15 Equation 3.11
In order to find the value of the unknown variables, the following algorithm is
used:
0) 𝑄𝐹, 𝐶𝐹, 𝑃𝐹, 𝑃𝑃1, 𝑃12 and 𝑁1 are known from the beginning.
1) From equation 4, 𝐶𝑃1𝑄𝑃1 = 𝑔(𝐶𝐹𝑄𝐹) and we obtain the product 𝐶𝑃1𝑄𝑃1.
2) From equation 2, 𝐶12𝑄12 = 𝐶𝐹𝑄𝐹 − 𝐶𝑃1𝑄𝑃1 and we obtain the product 𝐶12𝑄12.
3) We can write 𝐶𝑃1 =𝐶𝑃1𝑄𝑃1
𝑄𝑃1=
𝐶𝑃1𝑄𝑃1
𝑄𝐹−𝑄12 (using equation 1 for the denominator), where
𝑄12 is unknown.
4) We can write 𝐶12 =𝐶12𝑄12
𝑄12 , where 𝑄12is unknown, as above.
5) Steps 3 and 4 and equation 3 can be used to write:
𝐶𝑃1𝑄𝑃1
𝑁1= 𝑓 (
𝐶𝐹𝑃𝐹
2+
𝑄12𝐶12𝑃12
2𝑄12−
𝐶𝑃1𝑄𝑃1𝑃𝑃1
𝑄𝐹−𝑄12) Equation 3.12
Using the bisection method, we can obtain the only unknown value in the above
equation, 𝑄12.
6) Substituting the value of 𝑄12 in the equations from steps 3 and 4, we can obtain 𝐶𝑃1
and 𝐶12.
7) Finally, from equation 1, 𝑄𝑃1 = 𝑄𝐹 − 𝑄12, obtaining 𝑄𝑃1.
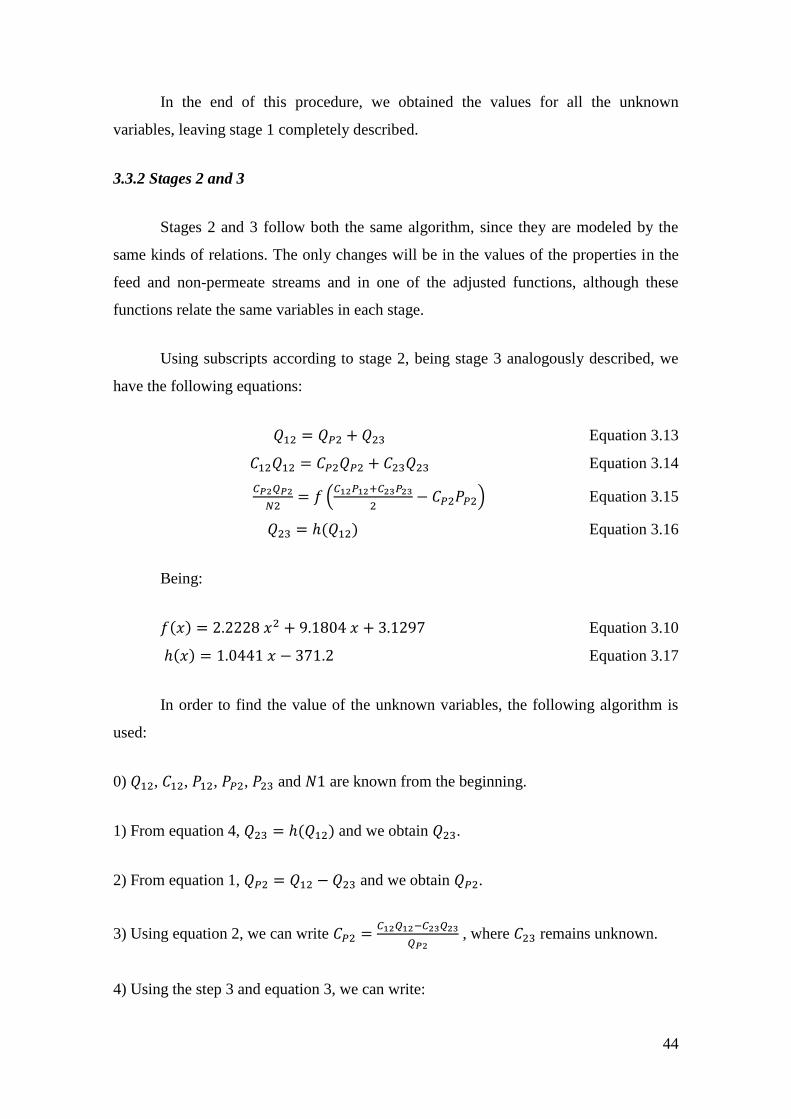
44
In the end of this procedure, we obtained the values for all the unknown
variables, leaving stage 1 completely described.
3.3.2 Stages 2 and 3
Stages 2 and 3 follow both the same algorithm, since they are modeled by the
same kinds of relations. The only changes will be in the values of the properties in the
feed and non-permeate streams and in one of the adjusted functions, although these
functions relate the same variables in each stage.
Using subscripts according to stage 2, being stage 3 analogously described, we
have the following equations:
𝑄12 = 𝑄𝑃2 + 𝑄23 Equation 3.13
𝐶12𝑄12 = 𝐶𝑃2𝑄𝑃2 + 𝐶23𝑄23 Equation 3.14
𝐶𝑃2𝑄𝑃2
𝑁2= 𝑓 (
𝐶12𝑃12+𝐶23𝑃23
2− 𝐶𝑃2𝑃𝑃2) Equation 3.15
𝑄23 = ℎ(𝑄12) Equation 3.16
Being:
𝑓(𝑥) = 2.2228 𝑥2 + 9.1804 𝑥 + 3.1297 Equation 3.10
ℎ(𝑥) = 1.0441 𝑥 − 371.2 Equation 3.17
In order to find the value of the unknown variables, the following algorithm is
used:
0) 𝑄12, 𝐶12, 𝑃12, 𝑃𝑃2, 𝑃23 and 𝑁1 are known from the beginning.
1) From equation 4, 𝑄23 = ℎ(𝑄12) and we obtain 𝑄23.
2) From equation 1, 𝑄𝑃2 = 𝑄12 − 𝑄23 and we obtain 𝑄𝑃2.
3) Using equation 2, we can write 𝐶𝑃2 =𝐶12𝑄12−𝐶23𝑄23
𝑄𝑃2 , where 𝐶23 remains unknown.
4) Using the step 3 and equation 3, we can write:
45
𝐶12𝑄12−𝐶23𝑄23
𝑁2= 𝑓 (
𝐶12𝑃12+𝐶23𝑃23
2−
𝑃𝑃2(𝐶12𝑄12−𝐶23𝑄23)
𝑄𝑃2) Equation 3.18
Using the bisection method, we can obtain the only unknown value in the above
equation, 𝐶23.
5) Using the relation in step 3, we obtain 𝐶𝑃2.
After this procedure, we could find the values for all the previously unknown
variables. The solution for stage 3 follows the same algorithm, replacing subscripts P2
by P3, 12 by 23 and 23 by NP. Additionally, it must be used the appropriate function
h(x), already described in the section 3.2.1.1.
3.3.3 The 3-stage simulator
Considering the algorithms described above, it is straightforward to build the 3-
stage simulator. Non-permeate streams in stages 1 and 2 have their values assigned to
feed streams in stages 2 and 3, respectively. In this way, the 3-stage simulator can be
viewed as a function S with the following structure:
[𝑄12, 𝐶12, 𝑄𝑃1, 𝐶𝑃1, 𝑄23, 𝐶23, 𝑄𝑃2, 𝐶𝑃2, 𝑄𝑁𝑃, 𝐶𝑁𝑃, 𝑄𝑃3, 𝐶𝑃3]
= 𝑆(𝑄𝐹, 𝐶𝐹, 𝑃𝐹 , 𝑃12, 𝑃𝑃1, 𝑃23, 𝑃𝑃2, 𝑃𝑁𝑃, 𝑃𝑃3, 𝑁1, 𝑁2, 𝑁3)
Thus, we built a function that receives as entries values from all the variables we
have as a priori information and calculates all the other considered variables. This
function simulates how a 3-stage membrane separator behaves given the entry variables.
Its concordance with real data from the field depends both on the quality of our
assumptions, given by the equations we chose to model the problem, and on the quality
of the adjusted functions obtained from data-fitting.
3.4 Validation of the model
In order to check how accurate the model is when simulating the reality, its
results will be compared to real cases from the industry, namely the ones we had access
to make this study. Since this data is classified by Cameron, an overall of the results
will be showed here, instead of the whole comparison.

46
Data from 30 streams were available to our work, so the comparison procedure
consisted of simulating all these 30 streams using its respective initial values as inputs
for the simulator and then comparing the simulated values of each output property with
the values from the real cases. Instead of showing the results of every simulation,
which, as mentioned above, was prohibited by Cameron, we are going to show the mean
value, standard deviation, the two greatest values and the two smallest values of the
relative errors between each property of each stream. The relative errors, given in
percentages, were calculated as below:
𝐸𝑟𝑟𝑜𝑟(%) = 100 ∗𝑎𝑏𝑠(𝑆𝑖𝑚𝑢𝑙𝑎𝑡𝑒𝑑 𝑣𝑎𝑙𝑢𝑒 − 𝑅𝑒𝑎𝑙 𝑣𝑎𝑙𝑢𝑒)
𝑅𝑒𝑎𝑙 𝑣𝑎𝑙𝑢𝑒
The notation abs(x) stands for the absolute value of x. Below are the tables with the
results.
Table 5: Relative errors with respect to concentrations (Authors)
Table 6: Relative errors with respect to total molar flows (Authors)
C12 C23 Cnp Cp1 Cp2 Cp3
Mean 4,76 8,44 19,98 30,38 20,46 13,57
Std Deviation 6,01 8,45 24,81 19,72 14,37 11,84
Maximum 23,99 28,23 104,36 77,61 41,99 39,11
2° Maximum 23,94 28,00 97,45 77,21 41,92 38,94
2° Minimum 0,18 0,32 0,86 6,58 0,34 1,05
Minimum 0,08 0,32 0,73 2,09 0,16 0,16
Q12 Q23 Qnp Qp1 Qp2 Qp3
Mean 12,15 13,46 15,37 51,74 48,83 19,17
Std Deviation 13,25 17,40 20,30 52,59 35,99 20,55
Maximum 47,43 69,13 83,31 215,86 130,53 75,36
2° Maximum 47,25 68,84 82,93 214,77 130,53 75,36
2° Minimum 0,68 0,89 1,73 8,98 4,83 1,45
Minimum 0,68 0,70 1,14 4,21 0,79 1,39

47
Table 7: Relative errors with respect to CO2 molar flows (Source: Authors)
Some observations can be made. First, it is possible to notice that some very
good results could be obtained, if one looks at the two smallest errors obtained for each
quantity. Unfortunately, very big errors, prohibitive to an industrial use, were also
encountered. However, only with a bigger quantity of data one could decide if these big
errors are really product of a bad model or simply represent corrupted or untreated data.
Furthermore, it is interesting to notice that the quantities 𝐶𝑃𝑄𝑃, which stand for
the CO2 flow rate in each of the permeate streams, can be more accurately simulated
than the concentrations 𝐶𝑃 and total flow rate 𝑄𝑃 alone. Particularly, the mean error in
stage one is 12.63 for 𝐶𝑃1𝑄𝑃1, while 30.38 for 𝐶𝑃1 and 51.74 for 𝑄𝑃1. This is perfectly
understandable when analyzing the solution algorithm to solve stage 1: the value of
𝐶𝑃1𝑄𝑃1 is directly obtained from 𝐶𝑃1𝑄𝑃1 = 𝑔(𝐶𝐹𝑄𝐹), where g(x) is one of the adjusted
functions obtained from data fitting and 𝐶𝐹 and 𝑄𝐹 are known variables, thus their exact
values are used. Consequently, the only error present in the calculation of the quantity
𝐶𝑃1𝑄𝑃1 is the error from the data fitting procedure used to obtain g(x). The quantities 𝐶𝐹
and 𝑄𝐹 are calculated after the usage of both adjusted functions, thus errors arising from
two data fitting procedures contribute to the final result.
One high point of the model that is not presented in the tables is the respect to
the physics of the problem. There is nothing in the equations and algorithms
constituting the model that could avoid concentrations and molar flows from being
negative. Furthermore, nothing constrains concentrations to be between 0 and 1. Yet,
these quantities not only remain positive and appropriately bounded, but also keep the
same order of magnitude verified in the real data. This is a good sign that the model is
adequate, even though adjustments and improvements are clearly necessary.
Q12C12 Q23C23 QnpCnp Qp1Cp1 Qp2Cp2 Qp3Cp3
Mean 15,87 23,24 40,83 12,63 22,18 19,00
Std Deviation 15,98 29,09 64,63 8,02 15,40 21,83
Maximum 58,73 113,85 273,85 29,70 58,72 84,16
2° Maximum 58,73 113,79 261,95 29,70 58,54 83,85
2° Minimum 0,69 1,90 2,45 0,89 1,95 0,50
Minimum 0,59 1,85 1,81 0,39 0,42 0,43

48
4 APPLICATIONS
As mentioned in the introduction, it can be important for an enterprise to be able
to make good decisions about the usage of a membrane separation system even without
the knowledge about the membranes inner behavior, being this information probably
classified by the enterprise which sells the membrane systems’ projects. For this
purpose, the usage of a simulator, like the one developed in the previous chapter, is very
important and, in most of the cases, essential.
Considering that a decision maker has a simulator to use, possibly one following
the strategy explored in the last chapter, there are some ways in which information can
be produced in order to improve the quality of the decision. We can name optimization
and sensitivity analysis as two of these procedures.
4.1 Optimization using the 3-stage membrane simulator
Optimization is the procedure of finding the optimal - maximal or minimal -
value of a specific function, called objective function, searching through a space of
variables, the optimization variables, on which the objective function depends, and
keeping these variables subjected to certain constraints. Optimization problems are
inverse problems, in the sense that we know the value of the objective function
associated to each combination of optimization variables, but we do not know which
combination of variables will lead to the maximal or minimal - depending on the
problem - value of the objective function.
The most straightforward method to solve optimization problems is the brute
force. It consists basically of a trial-and-error procedure, where one chooses randomly a
set of optimization variables and looks at the value of the objective function. Of course,
this method is not only extremely inefficient but also do not guarantee that the optimal
value will be found. In order to solve optimization problems with some hope of
efficiency, a great variety of types and variations of optimization methods was
developed and exists now in the literature. The choice of the method is considerably
dependent on the type of optimization problem to be treated.

49
One example of optimization problem related to the subject of separation of
CO2/CH4 using membrane systems is the following: one wants to minimize the total
number of membrane modules used in all the three stages of a 3-stage system, subject to
the fact that the CO2 concentration at the non-permeate stream must be smaller than a
given value, in order to avoid the formation of hydrates and a corrosive environment in
the piping. Using the notation applied in the previous chapter, this problem is written
mathematically in the following way:
min 𝑁1 + 𝑁2 + 𝑁3
𝑠. 𝑡. 𝐶𝑁𝑃 < 𝐶𝑙𝑖𝑚
In this problem, being given all the other input variables to the membrane
simulator than the numbers of membrane modules, a choice of N1, N2 and N3 gives a
value for all the output variables, being 𝐶𝑁𝑃 one of them. It is simple to notice that a
decrease in the number of membrane modules will generally worsen the efficiency of
the separation of gases, thus leading to a greater value for 𝐶𝑁𝑃. Consequently, the above
optimization problem has not a trivial solution.
If considering the strategy of obtaining relations among variables through data
fitting as described in the previous chapter, optimizing the usage of the membrane
system and improving the quality of the simulator can be seen as a feedback procedure.
Figure 27: Optimization Methodology Scheme
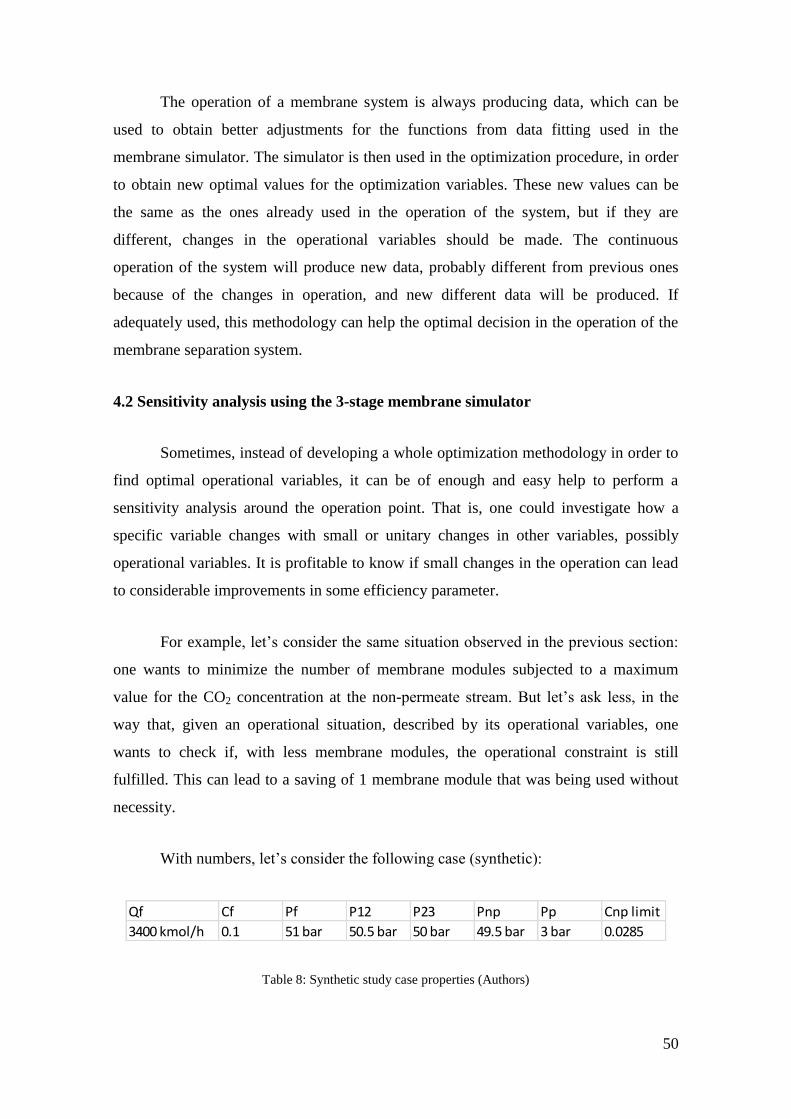
50
The operation of a membrane system is always producing data, which can be
used to obtain better adjustments for the functions from data fitting used in the
membrane simulator. The simulator is then used in the optimization procedure, in order
to obtain new optimal values for the optimization variables. These new values can be
the same as the ones already used in the operation of the system, but if they are
different, changes in the operational variables should be made. The continuous
operation of the system will produce new data, probably different from previous ones
because of the changes in operation, and new different data will be produced. If
adequately used, this methodology can help the optimal decision in the operation of the
membrane separation system.
4.2 Sensitivity analysis using the 3-stage membrane simulator
Sometimes, instead of developing a whole optimization methodology in order to
find optimal operational variables, it can be of enough and easy help to perform a
sensitivity analysis around the operation point. That is, one could investigate how a
specific variable changes with small or unitary changes in other variables, possibly
operational variables. It is profitable to know if small changes in the operation can lead
to considerable improvements in some efficiency parameter.
For example, let’s consider the same situation observed in the previous section:
one wants to minimize the number of membrane modules subjected to a maximum
value for the CO2 concentration at the non-permeate stream. But let’s ask less, in the
way that, given an operational situation, described by its operational variables, one
wants to check if, with less membrane modules, the operational constraint is still
fulfilled. This can lead to a saving of 1 membrane module that was being used without
necessity.
With numbers, let’s consider the following case (synthetic):
Table 8: Synthetic study case properties (Authors)
Qf Cf Pf P12 P23 Pnp Pp Cnp limit
3400 kmol/h 0.1 51 bar 50.5 bar 50 bar 49.5 bar 3 bar 0.0285

51
Furthermore, let’s consider that the equipment producer sold a project using N1,
N2 and N3 equals to 2, 3 and 4 membrane modules respectively, in order to meet the
requirements a maximum CO2 concentration of 0.0285 in the non-permeate stream.
After installing the equipment and using it for a while, some history data is produced,
and it is possible to adjust and use a membrane simulator. If we use the simulator
developed in the previous chapter, we can perform a sensitivity analysis around the
configuration 2-3-4 for the membrane modules, and decide if this something better can
be done.
Table 9: Sensitivity analysis in the synthetic case (Authors)
As can be observed above, taking out one membrane module from stage 1 still
leads to a CO2 concentration in the non-permeate stream smaller than the maximum
limit, thus respecting the constraint of the problem. Consequently, it is profitable for the
enterprise to spare one membrane module from the first stage instead of keep using it. It
happened thus that the sensitivity analysis performed using the simulator helped the
enterprise to save one membrane module, leading to a more profitable situation than
following strictly the project sold by the membrane company.
N1 N2 N3 Cnp
2 3 4 0.0275
1 3 4 0.0282
2 2 4 0.0312
2 3 3 0.0301
52
5 CONCLUSIONS
In this work, two main objectives were pursuit. The first one was to give an
introduction to the technology of gas separation, with special attention to the usage of
polymeric membranes in this process. The second objective, being dependent on the
knowledge presented by the first one, was to develop a simulation tool aiming to help
the decision taking when using membrane separation systems. An industrial case was
used as a background for information and data.
In order to justify the interest for membranes technology, it was first presented
the necessity for gases separation in the petroleum industry. Using the Brazilian pre-salt
reservoirs an example, it was observed that big amounts of CO2 are expected to be
produced associated to the natural gas streams. Since not only CO2 has no heat power
associated to it but also it helps in the formation of dry ice and corrosive environments,
CO2 removal is of crucial importance when dealing with reservoirs with high
concentration of this gas. The usage of carbon dioxide in enhanced oil recovery
methods, namely WAG, and the possibility of its reinjection in the subsurface in order
to decrease atmospheric emissions were also presented as reasons that can point to the
benefits of CO2 separation.
With the conclusion that gases separation is necessary and/or beneficial in some
sense, different techniques for this procedure were presented. Alternative techniques
such as absorption, adsorption and cryogenic processes were discussed in comparison
with membranes technology. Since amines technology is well-established in the market
nowadays, it was important to compare polymeric membranes and amines in a separated
section.
The whole analysis of the state of the art related to the membrane technology,
following the reasoning about its necessity and its prevalence over other technologies,
allowed the conclusion that membranes separation systems are competitive and can be
an important option when dealing with separation of gases, particularly in offshore
environments.

53
The first part of this work provided informative background to the development
of the second objective, which was the elaboration of a membranes system simulator.
The need for this tool was justified: enterprises which produce membrane modules do
not have in general the interest of transmitting the technology associated to the
equipment, since keeping the know-how as a secret can aggregate value to the product
membrane modules. Thus, the enterprise which wants to buy these modules depends on
this secret knowledge, which is a very uncomfortable situation.
In order to solve this problem, it was proposed in this work the development of a
model partially based on data fitting using history data from the streams present in the
operation of the separation system, this procedure consisting of a reverse engineering
method. Combining basic material balance equations and functions obtained by assisted
data fitting, it was possible to develop a simulator in order to mimic in the best way the
reality, represented by a real case study.
When analyzing the comparison between real data and data generated by the
simulator, it was possible to notice that very good results could be obtained, but also
very bad ones were present. The mean values of the errors and its standard deviations
showed that the simulator cannot be used in industrial procedures yet, since a much
better accuracy is desired in this usage. However, we believe that the lack of an enough
amount of data led to such imprecision in the data fitting procedures. Since big amounts
of data are produced in an industrial membrane plant, it is likely that this problem will
not exist when the procedure described in this work is applied to an industrial routine.
Also, as it was commented in the sections above, the results are qualitatively acceptable,
in the sense that the basic physics of the problem - constrained values of concentrations,
positive values of flows - are respected in all the simulations, without a priori
constraints.
In the end, examples of direct applications of the developed tool were explored,
indicating ways that an enterprise, after buying some membrane modules, can produce
valuable information to help and guide the decision taking related to the separation
system, without depending completely on the membrane seller.
54
The next steps in this research should be concentrated on two ways. First, the
technique proposed in this work should be applied to longer time situations, where not
only more data would be available, but also changes in the membranes due to
plasticization would test if the optimization strategy proposed in the above sections
would converge and improve the quality of information. Only with bigger amounts of
data, covering a longer time and wider domains of variables, it will be possible to
conclude if the approach proposed in this work is really efficient for industrial usage.
Second, it is important that theoretical knowledge of flow through polymeric
membranes is gradually added to the modeling of the membrane system. Even though
the procedure described has as an objective the production of information with low
levels of technical knowledge about the membrane system, it is still possible to improve
the model presented here in terms of technical knowledge with low investments in
know-how applied to polymeric membranes.

55
BIBLIOGRAPHY
[1] Baker, R. W. (2002). Future Directions of Membrane Gas Separation
Technology. Industrial & Engineering Chemistry Research , 1393-1411.
[2] Braga Junior, B. W. (2007). Recuperacao de Hidrocarbonetos Volateis de
Correntes Gasosas por Permeacao de Vapor. Rio de Janeiro: COPPE/UFRJ.
[3] Dae-Hwan, L., & Hyung-Taex, K. (2004). Simulation Study of CO2 Separation
Process by Using Hollow Fiber Membrane. Americal Chemical Society , 49(2), 829.
[4] Dortmundt, D., & Doshi, K. (n.d.). Recent Developments in CO2 Removal
Membrane.
[5] Echt, W. (2002). Hybrid Systems: Combining Technologies Leads to More
Efficient Gas Conditioning. Laurance Reid Gas Conditioning Conference .
[6] Hill, l. B. (2010). A U.S. NGO’s Perspectives on Monitoring of Saline and EOR
Geologic Carbon. Energy Procedia , 6.
[7] Lokhandwala, K. A., Jariwala, A., & Malsam, G. M. (2007). High Performance
Contaminant Resistant Membranes Minimize Pretreatment and Improve CO2 Removal
Economics. 57th Laurance Reid Gas Conditioning Conference. Norman: Membrane
Technology and Research.
[8] Lokhandwala, K., & Baker, R. W. (2008). Natural Gas Processing with
Membranes: An Overview. Ind. Eng. Chem. Res , 2109-2121.
[9] Maddox, R. N., & John, M. (2006). Gas Conditioning and Processing. Norman:
Campbell Petroleum Series.
[10] Mat Isa, M. F., & Akkil Azhar, M. (2009). Meeting Technical Challenges in
Developing High CO2 Gas Field Offshore.
[11] Merkel, T. C., Lin, H., Wei, X., & Baker, R. (2010). Power plants post-
combustion carbon dioxide capture: An opportunitty for membranes. Journal of
Membrane Science 359 , 126-139.
[12] Meyer, P. J. Summary of Carbon Dioxide Enhanced Oil Recovery (CO2EOR)
Injection Well Technology. Plano, Texas: Contek Solutions.
[13] Mukhtar, B. S. (2004). Natural Gas Purification Technologies - Major Advances
for CO2 Separation and Future Directions. In D. H. Al-Megren, Advances in Natural
Gas Technology (pp. 235-270). InTech.
[14] National Energy Technology Laboratory. (2010). Carbon Dioxide Enhanced Oil
Recovery. U.S. Department of Energy.

56
[15] Scholes, C. A., Kentish, S. E., & Stevens, G. W. (2008). Carbon Dioxide
Separation through Polymeric Membrane Systems for Flue Gas Applications. Recent
Patents on chemical engineering , 52-56.
[16] Shimekit, B., & Mukhtar, H. (2010). Natural Gas Purification Technologies -
Major Advances for CO2 Separation and Future Directions. InTech Open .
[17] Wang, S., & Han, X. (2012). Application of Polymeric Membrane in CO2
Capture from Post Combustion. Advances in Chemical Engineering and Science , 2,
336-341.
[18] Yi-Hung, L. (2012). Analysis of Production Process of Fine Dry Ice Particles
and Application for Surface Cleaning. Kyoto: Kyoto University.