a study investigating the impact of brand equity, product
TRANSCRIPT

A Study Investigating the Impact of Brand Equity, Product Category and Product Recall on Purchase Intention
by
Shreya Khastagir
A Thesis
presented to
The University of Guelph
In partial fulfilment of requirements for the degree of
Master of Science
in
Marketing and Consumer Studies
Guelph, Ontario, Canada
© Shreya Khastagir, April, 2019

ABSTRACT
A STUDY INVESTIGATING THE EFFECT OF BRAND EQUITY AND PRODUCT
CATEGORY ON PURCHASE INTENTION POST RECALL
Shreya Khastagir
University of Guelph, 2019
Advisor(s):
Dr. Tirtha Dhar
Dr. Vinay Kanetkar
This thesis investigated the moderating role of brand equity on the relationship between
product category and purchase likelihood in a no recall and product recall context. The
study measured the purchase likelihood of a sample of undergraduate students at the
University of Guelph for branded food products through an ANOVA analysis. The results
from this study indicate that there is a significant relationship between brand equity and
product category in influencing purchase intention in a product recall, but the result is
not significantly different from no recall scenario. In other words, a high equity brand in a
hedonic product category has a higher purchase likelihood than a utilitarian product
category. Similarly, a low equity brand in a utilitarian product category has a higher
purchase likelihood than a hedonic product category. However, a product recall does
not lead to a lower purchase intention compared to a no recall condition.

iii
ACKNOWLEDGEMENTS
I would like to take this opportunity to express my heartfelt thanks to every
person who supported me throughout my MSc degree.
I would first like to thank my thesis advisors, Dr. Tirtha Dhar & Dr. Vinay
Kanetkar. Tirtha, your guidance and immense support has always pushed me to excel.
You motivated me to make progress at every step of the research process and steered
me in the right direction whenever you thought I needed it. I am indebted to you and
your unwavering patience in the face of my many questions. I cannot thank you enough
for being a paramount figure in helping me complete this journey successfully. Vinay,
your encouraging words and willingness to always help have been invaluable in making
this possible. I am profoundly grateful for the extended discussions and valuable
suggestions which have contributed greatly to the improvement of the thesis.
I would like to thank Dr. Tanya Mark and Dr. Rogier Holtermans. You were willing
to be my committee member despite your busy schedule. Thank you for being so kind
and supportive.
I would also like to thank the rest of the faculty and staff of the MCS department
for all the help they provided. I credit the great experience I have had at the University
of Guelph to the support and kindness you all showed me. Thank you, Rita, Cori,
Melinda, Karen and Cassandra.
Finally, I would like to thank my family and friends for their unconditional love and
support. Thank you, Prashant Arora, for being my pillar of support. Thank you, Mom,
Dad and my sister, Eshaa, for always believing in me.

iv
TABLE OF CONTENTS
ABSTRACT………………………………………………………………………………………ii
ACKNOWLEDGEMENT………………………………………………………………………. iii
LIST OF TABLES ........................................................................................................... vii
LIST OF FIGURES ........................................................................................................ viii
CHAPTER 1: INTRODUCTION ....................................................................................... 1
CHAPTER 2: LITERATURE REVIEW ............................................................................. 5
2.1 Product Recall ....................................................................................................... 5
2.2 Product recall and consumer purchase likelihood ................................................. 8
2.3 Brand Equity ........................................................................................................ 12
2.4 Type of product category-Hedonic and Utilitarian ................................................ 21
2.5 Brand Equity and Product Category .................................................................... 26
CHAPTER 3: RESEARCH HYPOTHESIS .................................................................... 28
3.1 Research Gap and Goals .................................................................................... 28
3.2 Research Hypothesis ........................................................................................... 29
3.3 Proposed Conceptual Model ............................................................................... 32
CHAPTER 4: METHODOLOGY (PRE-TEST) ............................................................... 32
4.1 Objective .............................................................................................................. 32
4.2 Participants .......................................................................................................... 33
4.3 Design ................................................................................................................. 33
4.4 Materials .............................................................................................................. 34
4.5 Procedure ............................................................................................................ 35
CHAPTER 5: ANALYSIS AND RESULTS (PRE-TEST) ................................................ 36
CHAPTER 6: METHODOLOGY (MAIN STUDY) .......................................................... 38

v
6.1 Objective .............................................................................................................. 38
6.2 Participants .......................................................................................................... 38
6.3 Design ................................................................................................................. 39
6.4 Stimuli .................................................................................................................. 40
6.5 Procedure ............................................................................................................ 40
CHAPTER 7: ANALYSIS AND RESULTS (MAIN STUDY) ........................................... 41
7.1 Descriptive Statistics ............................................................................................ 41
7.2 ANOVA Analysis .................................................................................................. 42
7.2.1 ANOVA Assumptions .................................................................................... 43
7.2.2 Hypothesis Testing ........................................................................................ 44
CHAPTER 8: DISCUSSIONS ....................................................................................... 50
CHAPTER 9: CONTRIBUTION ..................................................................................... 55
9.1 Theoretical Contributions ..................................................................................... 55
9.2 Managerial Contributions ..................................................................................... 57
CHAPTER 10: LIMITATIONS AND FUTURE RESEARCH ........................................... 58
CHAPTER 11: CONCLUSION ...................................................................................... 59
REFERENCES .............................................................................................................. 60
APPENDICES ............................................................................................................... 72
Appendix 1: Pre-test survey for product categories ................................................... 72
Appendix 2: Pre-test survey for brand equity ............................................................. 77
Appendix 3: Pre-test demographic questions ............................................................ 88
Appendix 4: Main study survey measuring purchase likelihood ................................. 88
Appendix 5: Main study demographic question ....................................................... 106
Appendix 6: Frequency table of demographics ........................................................ 107

vi
Appendix 7: Pre-test mean hedonic and utilitarian scores ....................................... 108
Appendix 8: Paired differences of utilitarian and hedonic means ............................ 109
Appendix 9: Pre-test brand equity scores ................................................................ 109
Appendix 10: Main study table of demographics ..................................................... 111
Appendix 11: Main study frequency table of the treatment conditions ..................... 112
Appendix 12: Box plot for outlier assumption ........................................................... 112
Appendix 13: Normality plot and test for ANOVA assumption ................................. 113
Appendix 14: Levene’s test for equality of variances for ANOVA assumption ......... 114
Appendix 15: Main study ANOVA output ................................................................. 115
Appendix 16: ANOVA pairwise comparisons ........................................................... 116

vii
LIST OF TABLES
Table 1: Means for Equity, Category and Recall interaction in No Recall condition. ..... 48
Table 2: Means for Equity, Category and Recall interaction in Recall condition. ........... 49

viii
LIST OF FIGURES
Figure 1: CFIA statistics for food recalls in Canada….……………………………………..8
Figure 2: Conceptual Model…………………………………………………………………..32
Figure 3: Profile plot of Equity and Product Category interaction………………………...46
Figure 4: Graph of Equity and Product Category interaction in no-Recall condition…...49
Figure 5: Graph of Equity and Product Category interaction in Recall condition……….50

1
CHAPTER 1: INTRODUCTION
The thesis is concerned with the role of brand equity, product category and
product recall on consumer’s purchase intention. As a means of understanding this
relationship, the statistical model for ANOVA with brand equity, product category and
product recall is used as determinants of purchase likelihood (dependent variable). This
work contributes to accumulating literature on the role of guilt in consumption of hedonic
products and how reducing guilt can increase the preference for hedonic products
(Baghi & Antonetti, 2017). This study uses the theory of Attribution in making the
prediction that brand equity associated with high goodwill will reduce the guilt factor of
the hedonic product, and increase the purchase likelihood of such products over
utilitarian products. The results confirm this prediction. The study also predicts that in
the event of a product recall, high brand equity would trigger defensive strategies
against the negative information brought about on the product (Cleeren et al., 2008) and
generate positive attribution (Dhar & Wertenbroch, 2004) of owing that product. Hence,
still justifying the hedonic choice. Whereas a source low in brand equity may not be able
to protect the hedonic product, and a product recall would impact the hedonic category
with low brand equity the most. This prediction, however, was not confirmed by this
study.
The background literature for this research is briefly reviewed below.

2
In April 2015, a package of the noodles called Maggi, manufactured by the world’s
largest food and beverage company, Nestle, was found to contain seven times the
permissible level of lead by India’s government agencies. Over the next few days, amid
the scare created by media and the growing consumer concerns, Nestle India
temporarily stopped selling noodles in June 2015 and recalled Maggi until the situation
was resolved. The product did come back to the shelves of retail chains in November
2015, but in the period between June to November, Maggi lost 80% of market share in
India’s noodles market (“Striking the right chord,” 2018). The Maggi meltdown proved
very costly for Nestle. It lost at least $277 million to missing sales, around $70 million
was spent to execute the recall, and it was estimated that Nestle lost another $200
million because of the damage to its brand value (Fry, 2016). This incident like many
others in different industries and countries, prove that it can take just one incident to
crumble a brand that takes years and decades to build. The number of product recalls
have increased markedly over the last few years, and all of these recalls have not only
sparked unprecedented concern among companies, who are struggling to manage this
risk-laden landscape but has also significantly impacted consumers.
Firms understand that they face not only negative consequences in terms of their
short-term performance metrics like sales and market share but also long-term
marketing metrics like brand equity which is based on consumer’s perception of the
firms. However, despite the increasing frequency of product recalls in consumers’
everyday lives and the significant negative impact on companies, companies’ interest to
understand consumer behaviour and reactions to these recalls and to implement

3
proactive strategies to manage the recall crisis is fairly recent (Souiden & Pons, 2009).
Most of the past research has either looked at estimating the financial or sales loss
associated with a product recall or a firm’s crisis management strategies (Kempen et al.,
2016; Chu, Lin & Parther, 2005) and there are still few empirical investigation studies
into how consumers process this type of negative information. The negative information
associated with product recall has been found to impact consumer’s purchase likelihood
based on the strength and value of the brand, defined by Brand Equity, in the minds of
the consumers (Roehm & Brady, 2007; Dean, 2004). Brand Equity has been an area of
increasing importance for researchers as well as marketers, as attempts have been
made to understand the determinants of a consumer purchase decision. Much of the
early theoretical and empirical work associated with this effort has focussed on
exploring whether consumers’ purchase decision is based on the brand equity of
products. In general, it has been found that higher brand equity leads to higher
consumer purchase likelihood (Taylor, Celuch & Goodwin, 2004). This interest in
customer-based brand equity is accompanied by scholarly questions regarding the role
brand equity plays within a product-harm crisis like product recall. Though research
related to brand equity as an independent or moderating variable in the context of
product recall is limited (Rea, Wang & Stoner, 2014), a few of those research studies
which did look into the two, suggests that there are mixed results. Dawar and Pillutla
(2000) found that consumers’ prior positive expectations of a firm or a brand, which may
be signified by customer-based brand equity (Keller, 1993), make them discount any
inconsistent information including product harm and hence ensures the brand or firm

4
against negative effects of the crisis. Hence, these authors suggested that high brand
equity products would have higher purchase likelihood than utilitarian products in the
event of a product recall. Whereas, Roehm and Brady (2007) and Andreassen (2000)
found that low equity brands will have higher purchase likelihood than high equity
brands. Their study found that the low equity brands have relatively low positive
associations compared to high equity brands in the consumers’ mind and hence may
experience little change in the wake of performance failure. Since consumers’ have high
favourable associations for high equity brands, a failure by such a brand brings
significant disappointment among consumers lowering the purchase likelihood of these
brands.
Different brands operate under different product categories. Moreover, these product
categories have been found to influence consumer purchase decisions (Dhar &
Wertenbroch, 2000). In the context of a product recall, only one study by Magno et al.
(2017) looked at the role of the product category in influencing consumers’ purchase
decision. These authors found that in the event of a product recall, the utilitarian brands
are heavily affected than hedonic brands in terms of consumers’ purchase likelihood.
However, this study did not take into account the role of brand equity in the interaction
between product category and product recall, analyzing a three-way interaction through
two-way interaction. The particular concern in this research was the confound of brand
equity. As a result, the major objective of this research study is to critically study the
effect of brand equity and product category on consumer’s purchase decision in both no
recall and the recall context. To accomplish this objective, an ANOVA analysis is

5
performed on purchase likelihood as the dependent variable with a focus on studying
the two-way interaction of product category and brand equity and the three-way
interaction of product category, brand equity and recall. A pre-test was performed first to
determine the hedonic/utilitarian product categories and high/low brand equity products
followed by the main study.
The findings would provide firms with insights that would help them on the aspects of
product recall management well depending on the context of the recall. The research
proposes that for a brand with high brand equity, the purchase likelihood for its hedonic
product category will be higher than its utilitarian product category and there would not
be any significant impact of a product recall on this result. On the other hand, for a
brand with low brand equity, the purchase likelihood for its hedonic product category will
be lesser than its utilitarian product category in a pre-recall scenario and the hedonic
product category will be impacted the most post product recall. This study will look at
the conceptual model, develop the hypothesis and design the research methodology
before concluding with the predicted findings.
CHAPTER 2: LITERATURE REVIEW
2.1 Product Recall
All brands in their lifetime are likely to undergo a crisis that can occur
unexpectedly and create negative publicity for the brands as well as the firms that
manufacture those brands (Rubel, Naik, & Srinivasan, 2011). A product recall is one

6
such product-harm crisis during which firms and government regulators try and manage
the damage of the crisis in different ways. The U.S FDA (2014) defines recalls as
‘actions taken by a firm to remove a product from the market that may be conducted on
a firm's initiative, by FDA request, or by FDA order under statutory authority.’ At the
same time, a recall letter or information posted by the firm or regulatory agency would
be issued to consumers, formally requesting them to discontinue the use of the product
till the issue is resolved (Etayankara & Bapuji, 2009). Such crises are devastating for
firms as well as society. A report by U.S. Consumer Product Safety Commission (2005)
suggests that product recall related injuries, deaths and damage to properties cost over
$700 billion annually (as cited in Cleeren, Dekimpe, & Helsen, 2008, p. 262). There are
multiple ways in how a product recall can occur: The manufacturer could trigger it
because of shortcomings in the product that could lead to safety issues. A flaw in the
design or a manufacturing defect, incorrect labelling or packaging, adding too much or
too little of an ingredient that does not match the food label requirements (Kempen,
Martinetti, & Dongen, 2016; Kumar & Budin, 2006; Luo 2008; Woo, 2008). It could even
be caused by patent infringement, use of forbidden materials, poor management and
organization control, supply chain issue or corrupt business practices (Luo, 2008;
Kempen et al., 2016). Food recall plays an important role in ensuring food safety and is
mostly initiated when there is a reason to believe that a potentially microbiological
contaminated food has reached the marketplace and hence can cause brief illness,
severe sickness or even death (CFIA, n.d; Onyango et al., 2007; Hooker & Salin, 2001).
Due to the ever-increasing consumer awareness and demand, rising speed and

7
complexity with which products are designed and made and stricter product safety
legislation, the severity and scale of these recalls have been magnified (Luo, 2008;
Kempen et al., 2016). Product recall thus provides an important intervention for firms to
manage the crisis and prevent liability and further damage to firms as well as
consumers (Kempen et al., 2016).
Firms, in general, adopt two types of product recall strategies-preventive recall
and reactive recall (Kempen et al., 2016). The author suggests that a preventive recall
is a recall that is voluntary and is initiated by the firm before any injury is reported and is
usually done after potential safety hazards or product defects are discovered during
quality checks and product inspections. On the other hand, in a reactive recall, firms
decide to initiate a recall investigation after an injury is reported and is usually imposed
by the regulatory agencies (Kempen et al., 2016). This study focusses on voluntary
product recalls in the packaged food category. Since the type of product category will be
evaluated as a determinant of the effect of a product recall on consumers in this study,
food category is chosen in this study since it represents a domain that contains several
types of product categories (Yi & Muhn, 2013). In terms of the number of food recalls,
approximately 3000 food safety investigations occur each year in Canada, 10% of which
result in a recall incident (CFIA, n.d.) which makes it an important area of study.
According to CFIA, the latest statistics on food recall from 2006 to 2013 does not look
too bright.
8
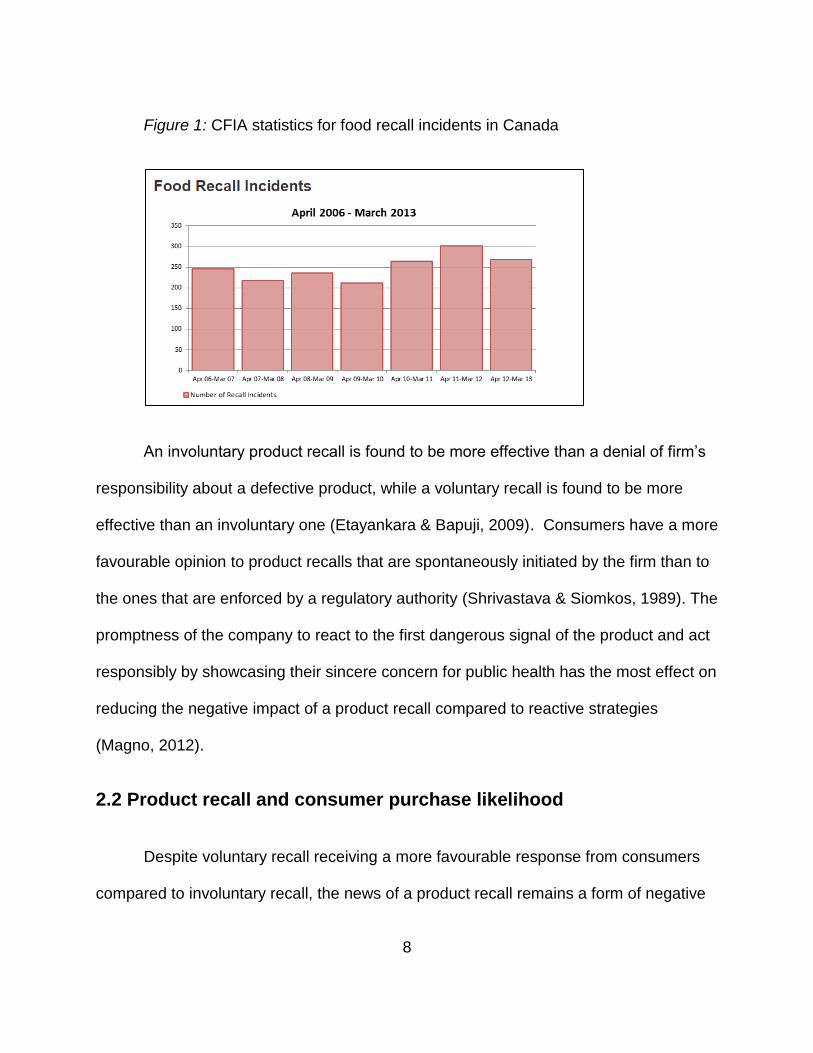
Figure 1: CFIA statistics for food recall incidents in Canada
An involuntary product recall is found to be more effective than a denial of firm’s
responsibility about a defective product, while a voluntary recall is found to be more
effective than an involuntary one (Etayankara & Bapuji, 2009). Consumers have a more
favourable opinion to product recalls that are spontaneously initiated by the firm than to
the ones that are enforced by a regulatory authority (Shrivastava & Siomkos, 1989). The
promptness of the company to react to the first dangerous signal of the product and act
responsibly by showcasing their sincere concern for public health has the most effect on
reducing the negative impact of a product recall compared to reactive strategies
(Magno, 2012).
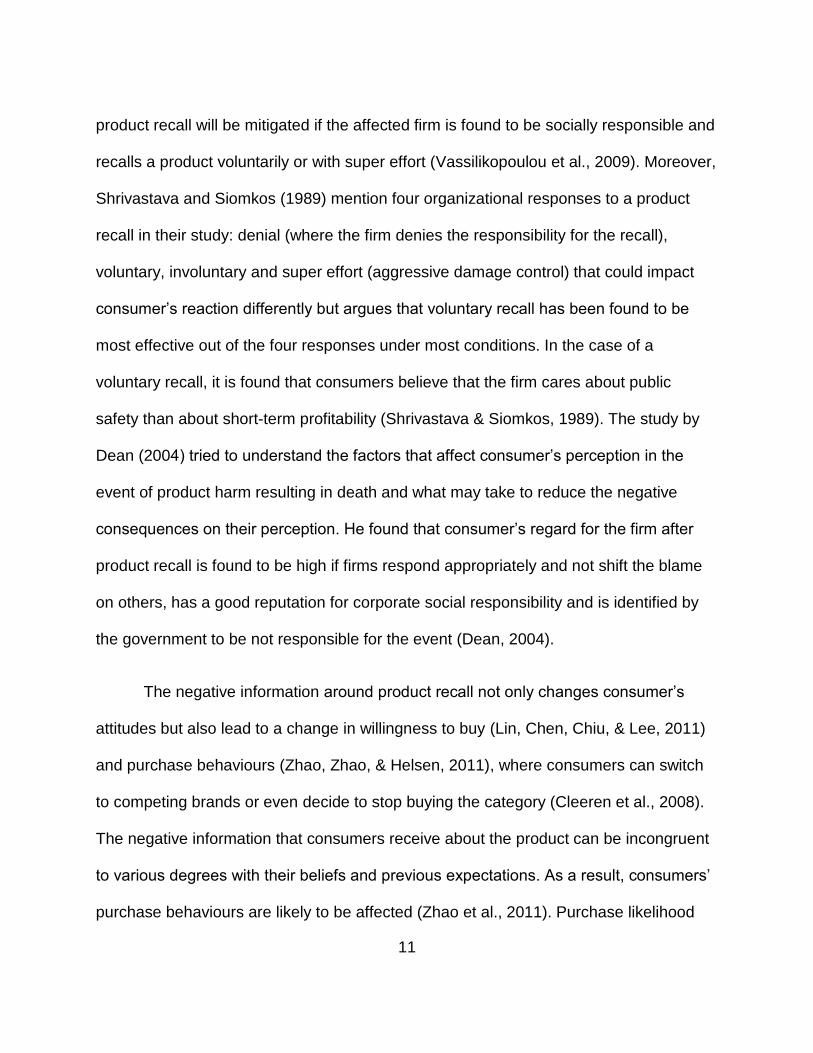
2.2 Product recall and consumer purchase likelihood
Despite voluntary recall receiving a more favourable response from consumers
compared to involuntary recall, the news of a product recall remains a form of negative

9
information that creates negative publicity for firms, irrespective of the specifics of the
recall situation (Dean, 2004). Also, since negative information tends to be
disproportionately weighed more than positive information on forming impressions
(Mizerski, 1982; as cited in Dean, 2004, p. 193), it can damage the image of the firm,
which sometimes takes years to build. With increasing recall incidents in the
marketplace, perhaps the most vital question for firms in a product recall situation is
how to overcome the challenges associated with a product recall event (Byun & Dass,
2015). A product recall negatively impacts a firm not only from a financial perspective
but bears huge indirect costs with respect to its intangible assets like consumer’s
perception and future purchase likelihood of the product. From a financial perspective, it
causes significant reduction in sales and market share because of withdrawal of the
affected products from the market and the sales loss until the product is relaunched in
the market (Kempen et al., 2016). The firms also bear huge costs with respect to recall
announcements or advertising, shipping, repair and replacement of the affected product
(Chu, Lin & Parther, 2005). From a long-term financial implication, there could be
significant, and prolonged negative effects on share prices since the total costs
associated with recalls are hardly reported in press releases nor could be determined
easily by market participants (Chu, Lin & Parther, 2005). From a consumer perspective,
it can negatively impact consumer’s attitude (Vassilikopoulou, Siomkos,
Chatzipanagiotou, & Pantouvakis, 2009) and their post-recall reactions to recalled
products, brands and firms that are associated with the recalled product (Dean, 2004).
However, companies’ desire to better understand consumer reactions to these recalls

10
and to implement proactive crisis management strategies is fairly recent although the
scale of product recalls in the last 30 years (Souiden & Pons, 2009). Very few studies
have investigated how consumers process this type of information and the various
factors that might affect the process (Matos & Rossi, 2007; as cited in Brandão,
Yamada, Ponchio, Cordeiro & Strehlau, 2016, p. 1431). According to Elliott et al. (2005),
the weakness of crisis management literature is its focus on the organization rather than
consumers (as cited in Vassilikopoulou et al., 2009). When a recalled product is
reintroduced in the market, the success of the product depends not only on the actions
that are taken by the firm but also how consumers view the product and their desire to
repurchase it (Vassilikopoulou et al., 2009). Previous studies have identified a few areas
that could influence consumers’ perception and buying behaviour in a product recall
event. One of the studies investigated the effect of product recall on consumers’ brand
loyalty, and found that a product recall can negatively impact consumer loyalty, and as
the seriousness of a product recall increases, there is greater reduction in loyalty
towards products under little known brands than that of well-known brands (Brandão et
al., 2016). The authors chose automobile and condom as the products which are highly
representative within the universe of recalled products in Brazil and established different
brands of these products as well known and little known through consumer survey
(Brandão et al., 2016). Vassilikopoulou et al. (2009) argue that the general impression
of the firm involved in the product recall will be unfavourable and the perceived danger
associated with the defect will be relatively high when the crisis is recent (up to 3
months) than if the crisis is old (1+ year). However, the negative effect of a recent
11
product recall will be mitigated if the affected firm is found to be socially responsible and
recalls a product voluntarily or with super effort (Vassilikopoulou et al., 2009). Moreover,
Shrivastava and Siomkos (1989) mention four organizational responses to a product
recall in their study: denial (where the firm denies the responsibility for the recall),
voluntary, involuntary and super effort (aggressive damage control) that could impact
consumer’s reaction differently but argues that voluntary recall has been found to be
most effective out of the four responses under most conditions. In the case of a
voluntary recall, it is found that consumers believe that the firm cares about public
safety than about short-term profitability (Shrivastava & Siomkos, 1989). The study by
Dean (2004) tried to understand the factors that affect consumer’s perception in the
event of product harm resulting in death and what may take to reduce the negative
consequences on their perception. He found that consumer’s regard for the firm after
product recall is found to be high if firms respond appropriately and not shift the blame
on others, has a good reputation for corporate social responsibility and is identified by
the government to be not responsible for the event (Dean, 2004).
The negative information around product recall not only changes consumer’s
attitudes but also lead to a change in willingness to buy (Lin, Chen, Chiu, & Lee, 2011)
and purchase behaviours (Zhao, Zhao, & Helsen, 2011), where consumers can switch
to competing brands or even decide to stop buying the category (Cleeren et al., 2008).
The negative information that consumers receive about the product can be incongruent
to various degrees with their beliefs and previous expectations. As a result, consumers’
purchase behaviours are likely to be affected (Zhao et al., 2011). Purchase likelihood

12
can be considered as the ultimate determinant of consumer reaction (Dabholkar &
Shepherd, 2000) and the authors argue that it reflects the inclination of consumers to
engage with the brand after receiving a stimulus (negative or positive).
Most of the research has adopted a case study approach to understand how to
strategically manage a brand crisis, what managers should do or not do when faced
with a product recall scenario (Dean, 2004; Choi & Lin, 2009) or estimating the financial
or sales loss from a firm’s point of view (Zhao et al., 2011; Dean, 2004; Siomkos, 1999).
However, these case studies cannot be necessarily generalized, and hence it is
required to look at research that looks at how product recall impacts consumers to
elucidate general principles (Korkofingas & Ang, 2011) that can assist firms to take
proactive and effective decisions when they face product recall situations.
2.3 Brand Equity
The contribution of a brand name on the product is called Brand Equity (Stahl et
al., 2012). The power of the brand name provides many functional, experiential and
symbolic benefits to the product (Stahl, Heitmann, Lehmann, & Neslin, 2012). An
advantage of using brand equity as an antecedent of consumer purchase likelihood is
that both manufacturer and private label or retailer brands can be classified according to
this criterion (Ailawadi et al. 2002, as cited in Sloot, Verhoef & Franses, 2005, p. 21)
and that helps in understanding product recall consumer reaction across a wide range
of brands.
13
The marketing literature on brand equity defines it from two perspectives:
financial and customer based (Keller, 2000; Aaker, 1991; Lassar, Mittal & Sharma,
1995). From the financial perspective, it is measured as the financial value or outcome
contributed by brand equity to the firm (Lassar et al., 1995). From a customer-based
perspective, consumer perception and response to a brand name or firm’s performance
is measured (Keller, 2000). The author defines customer-based brand equity as the
added value a product accrues as a result of the investments in the past marketing
activities by the firm for the brand, whereby it fits as a bridge between what happened in
the past and what should happen to it in the future. Keller (2008) refers to customer-
based brand equity as the power a brand accrues through customers’ interaction with
the brand and what the consumer has learned, felt, seen, and heard about the brand.
Another most cited definition of customer-based brand equity is given by Aaker (1991)
which defines brand equity as “a set of brand assets and liability linked to a brand, its
name and symbol, that add or subtract from the value provided by a product or service
to a firm and/or to that firm’s customers.” (Aaker 1991, p. 15). In other words, Brand
equity has been defined as “outcomes that accrue to a product with its brand name
compared with those that would accrue if the same product did not have the brand
name” (Ailawadi, Lehmann, & Neslin 2003, as cited in Stahl et al., 2012, p. 45). Hence,
most researchers agree that brand equity is the “differential contribution of the brand
name on the value of the branded product,” (Dawar & Pillutla, 2000, p. 216) and that
this differential value makes a strong brand and bring many potential benefits like less
vulnerability, more profit and greater support from trade partners (Keller, 2003). The

14
customer-based brand equity concept was further developed by looking at it from a
different perspective of brand signal credibility which comes from information economics
(Erdem & Swait, 1998). It underlines the role played by credibility as the main
determinant of customer-based brand equity, and that it increases customer-based
utility by signalling higher quality and decreasing risk perceived by consumers (Erdem &
Swait, 1998). This increased expected utility is synonymous to the added value that
brand equity gives a product (Keller, 2000). Since companies have more information
about their products than consumers do, consumers mostly make use of signals sent
out by companies, and decipher the information and know more about the product
before consumption (Rea, Wang, & Stoner, 2014).
The focus of most of the past research has been on consumer-based brand
equity since it is believed that consumer-based approach offers most insight than the
firm based approach, providing insights into consumer behaviour that can be converted
into actionable brand strategies to satisfy consumer needs (Keller, 1993). The author
also argues that since the source of brand equity is consumer perceptions, it is
important for firms to measure it at a consumer level. This interest in customer-based
brand equity co-occur with scholarly interests regarding the role brand equity has on
consumers’ response within a product-harm crisis such as product recall (Zhao et al., as
cited in Rea et al., 2014). Consumers response to product recall situations may vary
depending on the change in the brand-related beliefs or the brand equity due to the
product recall, and this may change the brand-consumer relationship (Dawar and Lei,
2009, as cited in Rea et al., 2014). Hence, it is important to look at the brand equity-

15
consumer relationship in a product recall situation. Korkofingas and Ang (2011) in their
study pointed out that the significance of managing the brand equity during a product
recall and why it should be the most important consideration by firms while managing a
recall situation. The authors mentioned that during a product recall, though the market
share of the brand drops to zero because the product is withdrawn from the market, this
does not necessarily mean that the brand equity falls to zero. Therefore, during a
product recall and considering consumers have some level of brand equity in their
minds (Keller, 2003; as cited in Korkofingas and Ang, 2011), the way product recall is
managed could be an attempt to improve customer’s sense of security and serve as key
sources of protecting the residual brand equity and recover market share for the firm
(Korkofingas and Ang, 2011)
Past literature has found that different levels of brand equity may generate different
consumer reactions in the event of a product recall (Rea et al., 2014; Korkofingas & Ang,
2011). This brings us to a question of what differentiates a high equity brand from a low
equity brand? While giving the difference between the two, Keller (2000) suggests that a
brand has high customer-based brand equity if customers react more favourably to a
product if its brand is identified than when it is not. The high favourability would be
because the customer knows about the brand and holds ‘strong, favourable and unique
brand associations in memory’ (Keller, 1993, p. 17). Though research related to brand
equity as an independent or moderating variable in the context of product recall is limited
(Rea et al., 2014), a few of those research studies which did look into it, suggests that
there are mixed results on the purchase likelihood of high brand equity brands over low

16
brand equity brands during product recall. The studies by Korkonfingas and Ang (2011)
looked at the overall effect of a hypothetical product recall situation on brand equity
evaluation as well as the impact of severity of product recall on brand equity evaluation.
In the first phase of their study, participants were first asked to choose between high and
low brand equity Mp3 players. The photographs of the Mp3 players with information about
prices, features and product dimension was provided to them, with player features being
identical in all aspects other than price and brand name. The brand equity measures were
taken after the choice was made. In the second phase of the study, the brand equity
measures were retaken after showing a hypothetical product recall scenario to
participants with their chosen brand from the first phase. Moreover, to measure the impact
of product recall severity on brand equity, the participants were randomly assigned to a
mild (irregular connection issue of earphone socket) or severe (faulty USB connection
that could severely damage any device connected to it) product recall condition. The
results from their study showed that the severe product recall situation significantly
decreased the brand equity evaluation for high equity brand but not for low equity brand.
However, in the mild-severe product recall situation, there was no significant impact on
either high or low brand equity brand. At an overall level, product recall significantly
impacted the high equity brand more than the low equity brand. The authors justified that
expectations for higher equity brands are higher relative to low equity brands and as such
consumers did not discount the negative effect of product recall because of higher brand
equity strength. On the other hand, Rea et al. (2014) found that product recall negatively
impacted low equity brand more than the high equity brand. In their experiment, 317 PC

17
consumer participants who were enrolled in a business education program at a University
were first randomly shown a high or low equity personal computer brand. Their reactions
were captured through a pre-test that measured their attitude towards the brand, brand
involvement, how credible they think the company that manufactures the brand is and
their purchase intention of the brand. This was followed by a short video that informed the
participants of a laptop recall news after a few cases of overheating and fire catching
incidents of laptop batteries were reported. The video was adopted from actual newscasts
for a similar product recall that happened in the previous year. The high equity or low
equity brand name associated with the recall was manipulated through the presence of
the brand logo of the particular brand in the video. The participants were informed about
subsequent product recall by the firms post the product crisis. The consumer reactions
were measured on the four dependent variables again following the recall. The results
showed that the mean scores of the dependent variables in the post-test were significantly
lower than that of the pre-test proving that regardless of brand equity level, a product
recall negatively impacted the consumer's evaluation. Also, the mean scores of the
dependent variables were all higher for the high equity brand than for the low equity brand
after a product recall. Hence, the high equity brand was lesser impacted by the product
recall and enjoyed more positive consumer evaluations than the low equity brand. They
found their results consistent with the findings of Grunwald and Hempelmann’s (2011)
that a prior high-quality reputation of a company creates a better starting ground to
managing a product recall (as cited in Rea et al., 2012, p. 538).

18
Dawar and Pillutla (2000) found consumers’ prior strong positive expectations of a
firm or a brand, which may be signified by high customer-based brand equity moderating
the effects of negative information of a product recall. These authors drew their conclusion
from the expectations-evidence framework, arguing that consumers who have high brand
equity would discount any inconsistent or disconfirmatory information like product recall
and this would ensure the brand or firm against negative effects of the crisis. On the other
hand, consumers who did not have a favourable opinion about the brand would draw
more negative conclusions (Dean, 2004). This is supported by the theory of buffer effect
(Dean, 2004; Kalaignanam, Kushwaha and Eilert, 2013) that suggests high brand equity
protects the brand from negative publicity by acting as a buffer and consumers would in
such cases would adopt defensive strategies and counter-argue the negative information
about the high equity brands more often to reduce cognitive dissonance (Dawar and
Pillutla, 2000). The authors hence suggest that the high brand equity would insure the
brand from the potentially devastating impact of a product recall. They also manipulated
different types of recall strategies by firms in evaluating the effect on brand equity and
found that high brand equity appears to be resilient to different types of firm response
(Dawar and Pillutla, 2000). A case study by Carroll (2009) examined the product recall in
June 2006 by Cadbury Schweppes in the UK, when the firm had to recall seven of its
branded products in Ireland and the UK due to possible contamination with Salmonella
Montevideo. The recall, in this case, was not a voluntary one but was initiated after UK
Food Standards Agency criticized the firm in the media over their negligence in handling
the issue and 180 people mainly children fell ill after consuming their product. In this case,

19
Cadbury was synonymous with chocolate in the UK for decades and had become an
integral part of the culture, loved by customers and retailers selling the brand. At the time
of the recall, Cadbury enjoyed a market share of 31% of the UK confectionery market. By
February 2007, the market share of Cadbury quickly returned to the pre-crisis level. This
case study underlined the importance of the heritage the Cadbury brand created for itself
and how the positive brand equity and reputation of the brand Cadbury insulated the firm
from the crisis and helped it recover from the damage. From an equity level point of view,
Zhao et al. (2011) also suggested how firms should adopt their recall coping strategies in
accordance with the brand equity level enjoyed by the brand (as cited in Rea et al., 2012,
p. 538). The authors discussed a peanut butter contamination incidence that affected
Kraft in Australia in 1996, which made Kraft recall both its peanut butter brands, Kraft and
Eta. The firm found that its brand with high equity (Kraft) showed more resilience than the
brand with low equity (Eta) to combat product recall crisis. While Kraft reached its 70%
pre-recall sales level within three months of its reintroduction to the market, Eta reached
less than 50% of its pre-recall sales level in the same period.
Studies by Roehm and Brady (2007) and Andreassen (2000) have used the theory
of disconfirmation of expectations (Oliver, 1977; as cited in Roehm & Brady, 2007, p. 538)
in pointing out why high equity brands suffer more from the negative effects of a product
crisis including product recall. The authors stated that low equity brands have relatively
fewer positive associations compared to high equity brands in the consumers’ mind and
hence may experience little change in the event of performance failure. However,
consumers expect strong benefits out of a high equity brand and as such if a product
20
recall occurs for the high equity brand signifying a performance failure, consumer’s
expectations fall short and tarnish consumer’s image of the brand (Roehm & Brady,
2007). In their study, they looked at the aspect of performance failure of a high and low
equity food delivery service on consumer evaluation. The design for their study was a 2
(brand equity: high or low) X 2 (failure type: severe or moderate) X 2 (evaluation timing:
immediate or delayed) between subject design. The participants were made to
experience an actual rather than a hypothetical failure that involved the delivery brands,
and the failure was in the form of late delivery of their pre-ordered lunchtime meal. Brand
equity level was varied by announcing that the lunch would be catered by a sandwich
shop that was popular with the graduate students or it would be catered by a relatively
lesser popular catering service that is university affiliated. The food catering brands were
selected via pre-tests with graduate students. Failure severity was varied by the delay in
catering at 30 (moderate) or 90 (severe) minutes. The evaluation timing was manipulated
by either getting the evaluation from students immediately after the announcement of the
delay (immediate) or after 10 minutes post announcement (delayed). The primary
dependent variable was satisfaction rating by students for the two food delivery brands.
The results saw a significant decrease in the post-evaluation vs pre-evaluation of high
equity brands and did not see any difference with respect to low equity brands.
Moreover, it was found that for a high equity brand, a post failure evaluation that
happens immediately will generate a more negative evaluation for a moderate failure than
a severe failure. Moreover, for a post failure evaluation that occurs at a delay, evaluation
of a high equity brand will be adversely impacted irrespective of the level of severity. In

21
the study by Andreassen (2000), low expectations from service were found to encourage
positive disconfirmation in the event of a service failure, and high expectations
encouraged negative disconfirmation. In other words, consumers who had low
expectations associated with low brand equity will only evaluate the dissatisfaction with
services from a positive standpoint considering it as a ‘better-than-expected outcomes’
(p. 21) whereas if the service is believed to have high equity and consumers have high
expectations from it, they will tend only to view it negatively (Andreassen, 2000). In
another study of recalls in the U.S Automobile industry from 1977 to 1999 by Rhee and
Haunschild (2006), the authors show that high equity brands are found to be more
vulnerable and suffer a high market penalty than low equity brands since good reputation
may act as a “double-edged sword” (p. 113).
All the studies mentioned above have thus proved that product recall may affect
high and low brand equity products differently. However, existing studies have not
looked into the category of product (utilitarian vs hedonic) while measuring brand equity
during a product recall though brands operate under different product categories.
As will be seen in the subsequent sections, the category of a product affects
consumers’ purchase likelihood and may interact with brand equity as well.
2.4 Type of product category-Hedonic and Utilitarian
Consumers choices are generally based on the type of consumption requirement
which is mainly driven by utilitarian or hedonic considerations (Dhar & Wertenbroch,

22
2000). A product evaluation is based on how useful the product is (utilitarian aspect),
or/and the experiential affect that is associated with it (Batra & Ahtola, 1990). Hedonic
food products like ice cream and salty snacks, provide hedonic benefits and more
experiential consumption. On the other hand, utilitarian food products like yogurt,
cereals are primarily instrumental and functional (Batra & Ahtola, 1990; Dhar &
Wertenbroch 2000). The hedonic or utilitarian aspects of a product may not be exclusive
as some products may provide both utilitarian and hedonic benefits to consumers. For
example, toothpaste can help prevent cavities and at the same time give pleasure from
its taste (Batra & Ahtola, 1990). An automobile purchase may be made based on its
hedonic aspects (design etc.) or utilitarian aspects (gas mileage etc.). However, Batra
and Ahtola (1990) suggest that the “different consumer considerations get mapped into
independent components of product evaluations and attitudes and enable people to
distinguish between goods according to their relative hedonic or utilitarian nature (as
cited in Dhar & Wertenbroch, 2000, p. 60). In other words, the authors argue that
consumers’ evaluation of a product is based on which of the two dimensions-hedonic or
utilitarian is more important as they characterize some product categories as primarily
hedonic and others as primarily utilitarian (Dhar & Wertenbroch, 2000). The buying
process of utilitarian products is mainly affected by rational buying motives whereas, for
hedonic products, emotional motives also play an important role (Sloot et al., 2005).
Keeping these considerations in mind, marketers generally use product
positioning based on either its experiential or its functional attributes (Dhar &
Wertenbroch, 2000). Also, consumers’ processing of these persuasive advertisements

23
would vary depending on the hedonic and utilitarian product category (Meyers-Levy &
Malaviya, 1999). They would engage in extensive cognitive information processing for
utilitarian products but use more affective processing for hedonic products (Meyers-
Levy & Malaviya, 1999).
Past literature has looked at the distinction of product category based on
utilitarian and hedonic on consumer’s evaluation in several studies. The study by Dhar
and Wertenbroch (2000) was one of the first studies that looked at this product
classification. In their study, the authors examined the evaluations of hedonic (view from
an apartment) and utilitarian dimensions (distance to work) and the how the trade-offs
between them are affected by the choice task of acquisition and forfeiture. In the
forfeiture condition, the participants were instructed to imagine that they were staying in
an apartment that had a 10-minute drive to work and a beautiful view of the sunset from
their apartment. In the acquisition condition, the participants were instructed to imagine
that they were staying in an apartment that had a 45-minute drive to work and a view of
the parking lot from their apartment. For both conditions, the participants had to switch
to one of the two decision alternatives because they would be moving to a new
apartment and their choices were measured as the dependent variable. The results
indicated that 64% of the participants opted for the apartment with a better view in the
forfeiture condition and 52% chose that apartment in the acquisition condition. Another
study by Chernev (2004) showed that product evaluations are a function of the
compatibility of consumers’ goals or regulatory focus (promotion vs prevention
orientation) with the choice attribute (hedonic or utilitarian). The author defines the

24
product as primarily hedonic or utilitarian based on the saliency of its attributes. He
argued that promotion-oriented individuals who focus on pleasure more find hedonic
attributes to be more relevant to their regulatory focus. At the same time, prevention-
oriented individuals who focus more on security and needs for protection, favour
utilitarian attributes more relevant to their regulatory focus. In his study results,
consumers chose the product that is superior to the product attribute matching their
regulatory focus. Hence, participants who were primed with a promotion focus in his
study chose the option superior on hedonic attributes and subjects primed with a
prevention focus selected the option superior on utilitarian attributes.
Hence, the studies mentioned above underlined the need to classify products
based on hedonic and utilitarian aspects since they impact consumer evaluation of a
product in different ways. As a product-harm crisis like product recall can occur for both
type of product category, a distinction between the two categories of products in the
context of product recall is also required to understand the influence on consumer’s
evaluation. Based on this understanding, only one recent study by Magno et al. (2017)
examined the role of a product recall on consumers’ evaluation based on utilitarian and
hedonic brands from the laptop category. The authors argued that consumers base their
understanding of utilitarian products through ‘attribute-based associations like quality,
performance’ (Homer, 2008, as cited in Magno et al., 2017, p. 163) and how useful or
beneficial the product is for the consumer. Since the event of a product recall is
negative publicity regarding the quality of a brand and given that attribute-based
perception is based on the quality of the product, the authors expected that utilitarian

25
brands would be more heavily affected than hedonic brands in terms of purchase
likelihood. The authors chose a laptop product category for their research because they
considered it a well-known category. The utilitarian and hedonic laptop were identified
through two pre-tests. In the first pre-test, participants were asked to provide up to three
comments on the laptop by the meanings they associated with the brands. Their
comments which were classified later into hedonic and utilitarian categories by
independent coders showed that the utilitarian comments for HP laptop were
significantly more than hedonic and the brand Apple had significantly more hedonic
comments than utilitarian. In the second pre-test, 55 undergraduate students were
asked to classify four brands (HP, Apple, Acer and Sony-VAIO) as either having
hedonic or utilitarian positioning after they were presented with verbal descriptions of
the hedonic and utilitarian brand positioning concepts. Majority of the students classified
Apple as hedonic and HP as utilitarian. The main study then involved the random
assignment of 237 undergraduate students to a product recall involving Apple (hedonic
product) or a product recall involving HP (Utilitarian product). The authors found that
participants’ attitudes were more negatively affected with respect to the product recall of
HP than Apple. Also, the study concluded that brands with hedonic positioning are more
resilient than utilitarian positioning in the event of a product recall.
At the same time, we know from the past literature that consumers when given a
choice between the two options: utilitarian and hedonic, tend to choose the product
which is primarily utilitarian because utilitarian products are need products whereas
hedonic products are want products (Dhar & Wertenbroch, 2005). The underlying

26
phenomenon with this reasoning is termed as “lay rationalism” (Lindgaard et al., 2006,
as cited in Kakkar, 2017, 52) which stresses the fact that consumers are always willing
to make a rational choice and want to address their utilitarian goals before addressing
their hedonic needs. Utilitarian options provide benefits that are easy to quantify and
justify whereas hedonic options induce guilt and need for justification (Dhar &
Wertenbroch, 2000, Okada, 2005).
Then why should the purchase likelihood for a hedonic brand be higher than a
utilitarian brand in Magno et al. (2017) study. Is there an influence of brand equity since
the brand Apple is also associated with high equity (Burmann, Jost-Benz & Riley,
2009)? Past research has not considered the role of brand equity on the purchase
likelihood of a product category.
The objective of this study will be to explore the link of purchase likelihood of
utilitarian vs hedonic packaged food product categories for a high and low equity brand
in the context of a product recall.
2.5 Brand Equity and Product Category
Brand equity and the nature of the product (hedonic and utilitarian) both affect
how consumers react to a particular marketing stimulus (Sloot et al., 2005). The study
by Sloot et al. (2005) evaluated the impact of brand equity and hedonic level of product
on consumer’s reactions during a product stock-out situation in a retail chain. The
authors found that the participants were less likely to postpone their purchase but were

27
more likely to switch to another item by the same brand in case of a hedonic product
category with high brand equity. Moreover, as such, consumers showed more loyalty
towards high equity brand than low equity brand in a stock out situation. In another
study by (Kuikka & Laukkanen, 2012), they measured the role of hedonic value of
chocolate (measured through the level of chocolate addiction among participants) on
the relationship between brand satisfaction and brand loyalty. The results pointed out
that consumers who experienced high hedonic value from chocolate had higher brand
satisfaction and brand loyalty than those who experienced low hedonic value. Also, past
literature has suggested that high brand equity leads to higher brand satisfaction and
brand loyalty (Nam, Ekinci, & Whyatt, 2011). The two studies above point out the
interaction of brand equity and hedonic aspect of products.
Two rationales exist for a moderating effect of brand equity on the relationship
between product category and consumer purchase likelihood. Keller (2002) found that
hedonic product categories provide more opportunities for brands to create high brand
equity and hence to differentiate the brands in the minds of consumers than do
utilitarian categories. He also suggested that positive brand equity for the brand can
trigger high hedonic emotions and the therefore high equity brands get a stronger
position in hedonic product categories.
Based on the self-perception theory developed from attribution theory (how
people determine their internal states through their behaviour), the purchase of hedonic
category would produce negative self-attributions ((Wertenbroch, Dhar & Khan, 2005).
However, the authors argued that the preference for a hedonic alternative could only

28
increase if the negative self-attributions with it are diminished or disconfirmed and the
purchase is justified (Okada, 2005). In their study, they found that participants chose a
pair of designer jeans (associated with the hedonic purchase) over a vacuum cleaner
(utilitarian) after they decided to donate to a charity which reduced the guilt factor
associated with the purchase of the jeans. Thus, once the guilt factor was reduced, the
preference for hedonic option increased over the utilitarian.
CHAPTER 3: RESEARCH HYPOTHESIS
3.1 Research Gap and Goals
Although the separate role of brand equity and product category in the event of a
product recall has been examined in past literature, the interaction of product category
and brand equity on consumers’ evaluation in a product recall event has not been
investigated. The study by Magno et al. (2017) which stated that in the event of a
product recall, utilitarian products would have a more negative impact than hedonic has
not looked into the aspect of high vs low brand equity. They categorized Apple
MacBook as a hedonic brand without considering that the brand is also associated with
high equity (Burmann et al., 2009) and that MacBook could be considered a hedonic
category. Also, previous studies gave mixed results with respect to the role of brand
equity on consumers’ evaluation in a product recall situation without looking into the
effect of the category of product. Given that brand equity has been found in a few
studies to interact with the product category, it would be worthwhile to investigate how

29
this role might interact in influencing consumer’s purchase likelihood in general and in
the context of a product recall event. Specifically, will, and if so, how will the role of
brand equity differ when the product is a hedonic vs utilitarian category and will brand
equity protect the hedonic category in a product recall situation? Hence, the goal of the
present study is to investigate the nature of interaction that brand equity could have with
product category in influencing consumer’s purchase intentions to pre and post product
recall.
3.2 Research Hypothesis
From the past literature, we know that people, in general, are motivated to
consume hedonic products but these products are associated with guilt, and hence
consumers mostly purchase a utilitarian product over a hedonic product. However, past
literature also suggests that once the negative self-attributions associated with a
hedonic purchase is removed, a hedonic option would be preferred over a utilitarian
option (Khan & Dhar, 2005). Hence, as consumers see brands with high brand equity
that have higher goodwill (Heiens, Leach & McGrath, 2012), it is expected that their
preference for hedonic categories will increase than utilitarian categories, as the high
equity brand will reduce the feelings of guilt (Baghi & Antonetti, 2017) and discount the
diagnosticity of the negative information associated with hedonic options., leading to the
direct buffering effect of the high equity brand (Cleeren et al., 2008).

30
During a product recall situation which is a associated with negative publicity for
the brand, a high brand equity would ‘trigger defensive strategies against the negative
information’ brought about on the product ( Ahluwalia et al. 2001; as cited in Cleeren et
al., 2008, p. 267) and generate positive attribution (Dhar & Wertenbroch, 2004) of
owning the brand. Hence, it is expected that the high credibility associated with a high
equity brand will draw the consumer into making a stronger positive attribution regarding
the brand, yielding significant impact on their attitude and help in justifying their hedonic
choice. Whereas a source low in brand equity may not be able to protect the hedonic
product (Griffin, Babin & Attaway, 1991) and hence the product recall would impact the
low equity hedonic product the most. In this case, the situation of product recall makes it
difficult for consumers to justify (Okada, 2005) their purchase of a hedonic product with
low brand equity. Therefore, the effect of brand equity will protect the hedonic category
in a situation of product recall and is likely to be purchased more than a utilitarian
category when the equity is high.
Hence, it is hypothesized that the purchase likelihood of a hedonic category will
be higher than a utilitarian category, when the brand equity is high, in both no recall and
recall situations. Also, there will not be any significant change between a recall and no
recall purchase likelihood for this case. Whereas, for a low equity brand, the choice will
be made for its utilitarian category which is more essential to live (Chernev, 2004) than
a hedonic category that creates negative self-attributions (Bodner & Prelec, 2003) and
induces greater guilt (Wilson & Gilbert, 2003, as cited in Zemack-Rugar, Rabino,
Cavanaugh, & Fitzsimons, 2016, p.2). Since, it is observed that consumers show higher

31
purchase likelihood to functional products in contrast with extravagant products, in the
situation of the same brand equity (He & Ran, 2015). However, during a product recall
for a low equity brand, the purchase likelihood would significantly drop for a hedonic
category compared to a utilitarian category because of the problem experienced with
the hedonic category (Dhar and Wertenbroch, 2000). Hence, low brand equity will not
protect the hedonic category under a product recall scenario.
Thus, the following are hypothesized:
Hypothesis 1a: For high equity brands, the purchase likelihood of hedonic
product category will be higher than the utilitarian product category
Hypothesis 1b: For low equity brands, the purchase likelihood of hedonic product
category will be lesser than the utilitarian product category
Hypothesis 2: For low equity brands, the purchase likelihood of hedonic category
will be significantly lesser than utilitarian category post product recall than the pre-recall
situation.

32
3.3 Proposed Conceptual Model
Figure 2: Conceptual model
CHAPTER 4: METHODOLOGY (PRE-TEST)
4.1 Objective
A pre-test was conducted before the designing and commencement of the main
study. The purpose of the pre-test was to achieve the following two objectives: 1.) to
identify both a hedonic and a utilitarian product category that could be used for the main
study to gauge purchase likelihood; 2.) to identify both a high equity brand and a low
equity brand from the product categories that are used in the pre-test to be used for the
main study as well.

33
4.2 Participants
Participants were drawn from the SONA-Marketing & Consumer Studies student
research pool at the University of Guelph. The research pool consisted of students
registered in the following Marketing and Consumer Studies courses: MCS*1000
Introductory Marketing, MCS*2020 Information Management, MCS*2600 Fundamentals
of Consumer Behaviour. Students who wished to participate in the study could do so by
visiting the SONA website at a time that was convenient for them. The study was posted
on SONA and the respective course website. Students were offered a course credit
worth 2% in exchange for their participation. There were no restrictions in terms of
gender or age. Participants conducted the survey online through Qualtrics.
Seventy-two undergraduate students from the University of Guelph in Ontario,
Canada, participated in the pre-test by completing an online survey. Of the participants,
65.3% (47 out of 72) identified themselves as females and 34.7% (25 out of 72) as
males. The participants’ ages ranged between 18 and 27 years old, and the average
participant age was 20 years old. The demographics for the pre-test are presented in
Appendix 6.
4.3 Design
All participants first saw a set of eight questions with respect to measuring the
first dependent variable that is consumer’s perception of each food product category
with respect to their primary use in functional vs hedonic consumption occasions. Eight

34
food categories were presented to the participant. A single item scale measurement of
hedonism and utilitarianism by Strahilevitz and Myers (1998) was used in this study to
characterize packaged food categories into primarily hedonic and utilitarian. Next set of
five questions measured the second dependent variable that is brand equity for different
brands in the form of brand logos shown to the participants. Brand equity was evaluated
on four brand equity indicators of brand attitude (good/not good; like/not like), brand
reliability (reliable/not reliable), brand trust (trustworthy/not trustworthy), and perceived
quality (high quality/low quality) used by Korkofingas and Ang (2011). Pictures of a total
of 27 brand logos were used (see Appendix 1 for images). Each participant viewed all
the brand logos presented in random order.
4.4 Materials
The choice for the selected product categories of cornflakes, cow’s milk, ice-
cream, chocolate chip cookies, plain yogurt, milk chocolate bar, potato chips and whole
wheat bread as manipulations of product category were taken from Dhar and
Wertenbroch (2000). Also, these were selected due to its relevance and familiarity with
undergraduate students. Three to four brands were selected from each product
category based on the availability in the retail stores. The brand logos of these brands
were shown to participants to gauge their brand equity levels since brand logos serve
as visible representation for the brand that is likely to be recognizable by consumers
(Watkins & Gonzenbach, 2013).

35
4.5 Procedure
Before beginning the study, participants were asked to read a consent form and
agree to participate in the study. Consenting participants were then shown the below
definitions from Strahilevitz and Myers (1998) study:
Utilitarian or practical products -- are products that are useful, practical,
functional, something that helps achieve a goal. Something which one ordinarily buys to
carry out a necessary function or task in one’s life.
Hedonic or frivolous products – are products that are pleasant, fun, experiential
and perhaps even ‘’ decadent.’’ Purchasing such products is enjoyable and appeals to
the senses.
These definitions were followed by a set of eight questions with pictures of
product categories and asked the participants to indicate their view of the shown
product category in terms of hedonic and utilitarian options (Appendix 1).
After the product category questions were answered, participants were required
to evaluate various brands (presented in the form of brand logos) based on their
experience with the brand. This section of the survey intended to classify the brands as
either high equity or low equity brand. A 3-point Likert scale (1=Yes, 0=Maybe, -1=No
and 4=don't know the brand) was used to evaluate the brand on brand indicators of
brand attitude (“This is a very good brand” and “I like this brand very much”), brand
reliability (“I consider this brand to be very reliable”), brand trust (“This brand is highly

36
trustworthy”) and perceived quality (“This is a high-quality brand”) (Appendix 2). At the
end of the survey, participants were asked to answer demographic questions on gender
and age (Appendix 3) and thanked for their time. On the whole, the survey took an
average of 30 minutes to complete.
CHAPTER 5: ANALYSIS AND RESULTS (PRE-TEST)
For each product category, the summation of the consumer response to hedonic
attributes (pleasure, fun and experiential) was calculated, and the summation of
consumer response to utilitarian attributes (useful, practical and functional) was
calculated first to generate a score for hedonism and utilitarianism for the category
(Appendix 7). Subsequently, the means of the scores for hedonic and utilitarian aspect
for each category was compared through Paired-samples T-Test in SPSS (Appendix 8).
An alpha level of .05 was used as a criterion of significance in the test.
Hence, through the pre-test, utilitarian category and hedonic category were
identified; cornflakes, milk, yogurt and bread were confirmed as utilitarian food category
(having a significant higher utilitarian mean than hedonic mean at p < 0.05) and ice-
cream, cookie, chocolate and chips were confirmed as hedonic food category (having a
significant higher hedonic mean than utilitarian mean at p < 0.05).
For the brand equity measure, for each brand, responses of option 4- ‘Don’t
know the brand’ on the Likert scale, were not considered as based equity is based on
awareness of the brand (Aaker, 1992) and the option of ‘Don’t know the brand’ was

37
included in the survey as a measurement of brand awareness. The final brand equity
score for each brand was calculated through the summation of the five brand equity
indicators to generate a brand equity score for each brand (-5 = minimum score and +5
= maximum score). Further, One-Sample T-Test was used in SPSS to determine
whether the brand equity scores of each of the brands is statistically different from the
population mean (The results are summarized in Appendix 9).
Six brands out of the set of 27 brands were found to have insignificant means (p
> 0.05) and were not considered in the determination of high vs low equity brands. The
mean scores of the rest of the 21 brands were compared to identify two brands under a
single product category which had a significant difference in their mean values to be
classified as high equity and low equity brands.
In the utilitarian yogurt category, brand Activia had a significantly higher brand
equity (M = 3.32, SE = 0.35) than Astro (M = 1.18, SE = 0.35), t (49) = 6.35, p < .001).
And in the hedonic chocolate category, brand Lindt had a significantly higher brand
equity (M = 3.94, SE = 0.23) than Astro (M = 1.15, SE = 0.30), t (50) = 8.81, p < .001).
Hence, through the pre-test, a utilitarian and a hedonic product category were
identified, and high equity and low equity brand under each category were also
identified for use in the main study which looked into the interaction of category and
brand.

38
CHAPTER 6: METHODOLOGY (MAIN STUDY)
6.1 Objective
The purpose of the main study was to determine whether the interaction between
the product category and brand equity influences purchase likelihood and particularly, if
they interact with a product recall.
6.2 Participants
Participants were drawn from the SONA-Marketing & Consumer Studies student
research pool at the University of Guelph as discussed in section 4.2. The original
sample size included 385 participants. Out of these responses, 11 participants did not
complete the study or did not answer any question. Hence, the final sample size
included 374 participants. The sample size was calculated based on a 0.80 power (the
standard power for social sciences), an alpha level of p < .05 and for an effect size of
0.25 (medium effect). According to the software, a minimum of 77 participants was
required for the study. However, to further increase statistical power, as many
participants as were available were recruited for the study. Of the 374 participants, 61%
(228 out of 374) identified themselves as male, and 37.2% (139 out of 374) identified
themselves as female. Six participants chose not to provide their gender, and one
participant chose other as gender. Appendix 10 shows the demographic details.

39
6.3 Design
The primary design for the study was a 2 (product category) X 2 (brand equity) X
2 (recall condition) between-subjects factorial design with purchase intention as the
dependent variable, resulting in eight conditions. The two levels of product category are
utilitarian and hedonic; the two levels of brand equity are high and low, and the two
levels of a recall are no recall and recall. Participants were randomly assigned to one of
the eight experimental conditions through the use of the ‘Randomizer’ feature provided
on Qualtrics, the software used for creating and distributing the survey used in the
study. All participants partook in the study by completing a survey that varied slightly
based on the experimental condition to which each participant was assigned. The
participants were then asked two sets of questions evaluating the dependent variable
‘Purchase likelihood.’ Response from participants was measured on a 5- point scale,
which finds its origin in a study from Laroche, Cleveland and Maravelakis (2006). The
purchase likelihood measure comprised of two questions: 1. ‘How likely is it that you
would purchase this product?’ and 2. ‘What is the state of your intention in purchasing
this product?’. The 5-point scale measured the score based on purchase likelihood
(1=highly unlikely to 5=highly unlikely) and confidence with the purchase intention
(1=very unsure to 5=very sure). The final purchase likelihood score for each product
was calculated through the average of the indicators from the two questions to generate
a purchase likelihood score for each condition (1 = minimum score and 5 = maximum
score).

40
6.4 Stimuli
Of the eight experimental conditions, four of the conditions were control
conditions (no recall condition) featuring the brand picture from the utilitarian (yogurt)
and hedonic (milk chocolate bar) category that was tested through the pre-test. The
name of the product along with the grammage size and the manufacturer name was
mentioned. The other four conditions (recall condition) featured the brand picture from
the utilitarian (yogurt) and hedonic (milk chocolate bar) category as well as the
hypothetical product recall news associated with them. The product recall scenario was
framed by a real product recall that occurred for Scope mouthwash manufactured by
P&G (“Scope original,” 2010) (All eight experimental conditions can be seen in
Appendix 4).
6.5 Procedure
Before beginning the study, participants were asked to read a consent form and
agree to participate in the study. If the participant refused consent, he or she was
forwarded directly to the end of the survey, thanked and dismissed from the session.
Participants who consented to participate in the study were randomly assigned to one of
the eight conditions (hedonic, high equity, no recall; hedonic, low equity, no recall;
utilitarian, high equity, no recall; utilitarian, low equity, no recall; hedonic, high equity,
recall; hedonic, low equity, recall; utilitarian, high equity, recall and utilitarian, low equity,
recall). Each participant in the recall condition (four out of the eight conditions) was
exposed to the image of the product shown in the condition for a few seconds and then

41
proceeded with the questions. In the no recall condition, participants were supposed to
spend a few seconds reading about the hypothetical product recall (recall information by
the manufacturing firm) that occurred for the product (shown in the condition) for a few
seconds and then proceed with the questions based on their purchase likelihood of the
product. The survey concluded with a demographic question of gender (see Appendix
5). Finally, participants in the recall condition were presented with a debriefing, in which
they were informed of the true purpose of the study and thanked for their time. On the
whole, the survey took an average of 20 minutes to complete.
CHAPTER 7: ANALYSIS AND RESULTS (MAIN STUDY)
7.1 Descriptive Statistics
Since the study had eight treatment conditions, the participants were randomly
distributed in the conditions through Qualtrics. Treatment 1, which is the ‘High equity,
Utilitarian and No-recall’ condition contained 49 respondents. Treatment 2, which is the
‘Low equity, Utilitarian and No-recall’ condition, contained 46 respondents. Treatment 3,
which is the ‘High equity, Hedonic and No-recall’ condition contained 46 respondents.
Treatment 4, which is the ‘Low equity, Hedonic and No-recall’ condition, contained 48
respondents. Treatment 5, which is the ‘High equity, Utilitarian Recall’ condition,
contained 48 respondents. Treatment 6, which is the ‘Low equity, Utilitarian Recall’
condition, contained 47 participants. Treatment 7, which is the ‘High equity, Hedonic
and Recall’ condition contained 45 respondents. Treatment 8, which is the ‘Low equity,

42
Hedonic and Recall’ condition, contained 45 respondents (Appendix 11 for the
distribution).
7.2 ANOVA Analysis
A three-way ANOVA was conducted to examine the effects of brand equity,
product category and recall condition on purchase likelihood.
We can also explain this analysis in terms of linear regression using the following equation:
PL= + (HD
HD +
HE HE+
R R) + (
HD,HE HD*HE +
HE,R HE*R +
HD, R HD*R) +
HD,HE,R
HD*HE*R
Where, HD=Hedonic, HE=High equity and R=Recall condition. In this case, Utilitarian, low equity and no recall condition is the base condition.
The simple effects of recall and equity explained using the following two equations:
PL (UT, LE, R) - PL (UT, LE, NR) = R (-ve)
PL (UT, HE, NR) - PL (UT, LE, NR) = HE
(+ve)
And the net effects that measure the hypothesis explained using the following four equations:
H1a - High equity, hedonic purchase likelihood more than utilitarian purchase likelihood
[PL (HD,HE,R) - PL (HD,HE,NR)] - [PL (UT,HE,R) - PL (UT,HE,NR)] = +ve
H1b - Low equity, hedonic purchase likelihood less than utilitarian purchase likelihood
[PL (HD,LE,R) - PL (HD,LE,NR)] - [PL (UT,LE,R) - PL (UT,LE,NR)] = -ve

43
H2 - For low equity brands, the purchase likelihood of hedonic category will be
significantly lesser than utilitarian category post product recall than the pre-recall
situation.
[PL (HD,LE,R) < PL (HD,LE,NR)] and [PL (UT,LE,R) ~ PL (UT,LE,NR)]
Further, post hoc analysis using pairwise comparisons with a Bonferroni
adjustment was used to assess significant main and interaction effects. An alpha level
of .05 was used as a criterion of significance in all the conducted ANOVA tests.
However, before the analysis, ANOVA assumptions were checked and discussed
below.
7.2.1 ANOVA Assumptions
Several assumptions need to be met in order for ANOVA tests to be considered
reliable. These assumptions include (1) a continuous dependent variable, (2) two
categorical independent variables with two or more groups in each, (3) independent
observations, (4) no significant outliers, (5) normal distribution of the dependent variable
residuals, and (6) equal variance of the dependent variables in each cell. The first two
assumptions are satisfied, and the randomization of participants in each treatment
condition ensured that the third assumption, independent observations, was met.
Residual analysis was conducted to tests for the remainder of the ANOVA assumptions.
Some outliers were detected (Appendix 12). However, these observations were not
eliminated as they were still within the plausible range of calculated value of purchase
likelihood. Shapiro-Wilk’s test of normality was used to check the assumption of the

44
normal distribution of the dependent variable residuals, but the result was not significant
(p < 0.05) (Appendix 13). Despite the violation of the normality assumption, the analysis
was completed because past literature suggests that for a between-subjects design,
ANOVA is known to be robust to deviations of the normality test as long as observations
are each group are relatively equal and the sample size is greater than 20 (Oberfeld &
Franke, 2013). In this study, the treatment conditions had an almost equal number of
participants (between 45-49), and there were 374 observations, thereby making it
feasible to continue with the analysis and assume that the F-tests would generate
reliable results despite the normality violation. Levene’s test for equality of variances
was used to check the assumption of the equal variance of the dependent variables in
each cell, and the nonsignificant results (p > 0.05) confirm that the assumption of
homogeneity of variances was not violated. (Appendix 14).
7.2.2 Hypothesis Testing
The first hypothesis predicted that for a brand with high brand equity, the
purchase likelihood for its hedonic product category would be higher than its utilitarian
product category. In other words, brand equity would moderate the relationship between
product category and purchase likelihood; and participants were expected to have
higher purchase likelihood for hedonic product category when the brand equity was
higher. On the other hand, the purchase likelihood would be higher for utilitarian product
category when the brand equity was lower.

45
The second hypothesis looked at the three-way interaction, that included product
recall.
The three-way and the two-way interaction effects of the independent variables
on the purchase likelihood was analyzed as can be seen in the test of between-subject
effects (Appendix 15). The results for the between-subject effects showed that there
was no statistically significant interaction between product category, recall condition and
brand equity level on purchase likelihood, F (1, 265.28) = 1.06, p = .303, partial ƞ2 =
0.003, from which it can be deduced that Hypothesis 2 was not supported.
With respect to the two-way interactions, there was no statistically significant
interaction between product category and recall condition on purchase likelihood, F (1,
265.28) = .253, p = .615, partial ƞ 2 = 0.001 and there was no statistically significant
interaction between brand equity and recall condition on purchase likelihood, F (1,
265.28) = .064, p = .801, partial ƞ 2 = 0.000. However, there was a statistically
significant interaction between product category and brand equity on purchase
likelihood, F (1, 265.28) = 4.396, p = .014, partial ƞ 2 = 0.02, thereby demonstrating that
brand equity is a moderator to the relationship between product category and purchase
likelihood (Appendix 15). Hence Hypothesis 1a and 1b are supported. The results are
demonstrated with the graphical representation in Figure 3.
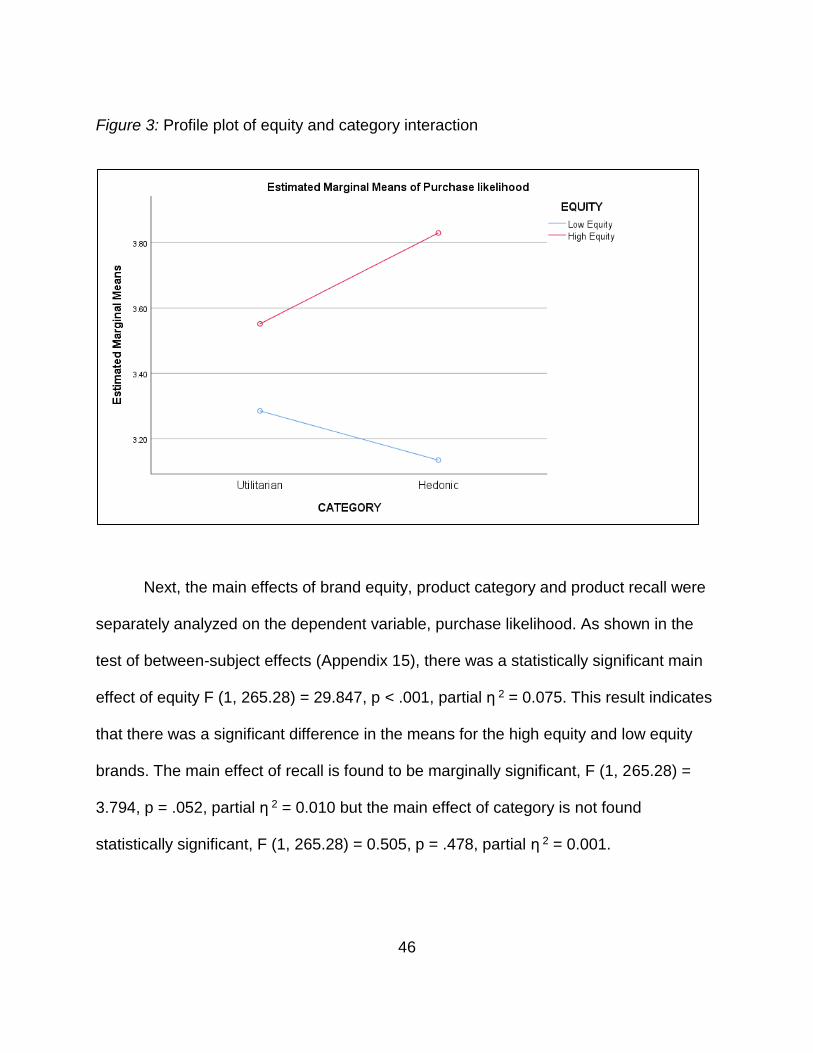
46
Figure 3: Profile plot of equity and category interaction
Next, the main effects of brand equity, product category and product recall were
separately analyzed on the dependent variable, purchase likelihood. As shown in the
test of between-subject effects (Appendix 15), there was a statistically significant main
effect of equity F (1, 265.28) = 29.847, p < .001, partial ƞ 2 = 0.075. This result indicates
that there was a significant difference in the means for the high equity and low equity
brands. The main effect of recall is found to be marginally significant, F (1, 265.28) =
3.794, p = .052, partial ƞ 2 = 0.010 but the main effect of category is not found
statistically significant, F (1, 265.28) = 0.505, p = .478, partial ƞ 2 = 0.001.

47
To find out where the differences in marginal means are for the two way and the
three-way interactions, we looked at pairwise comparisons (Appendix 16). Results of
pairwise comparisons for the main effects of equity show that there is a significant
difference between the effect of high equity and low equity brand on consumers’
purchase likelihood (Mlow equity = 3.21, SElow equity = .06; Mhigh equity = 3.69, SEhigh equity =
.06). The purchase likelihood was significantly higher when brand equity was high
compared to when it was low (p < 0.05). The pairwise comparison result for the main
effect of recall conditions shows that there is a marginally significant difference between
the purchase likelihood (Mno-recall = 3.54, SEno-recall = .06; Mrecall = 3.36, SErecall = .06) in a
recall vs no recall condition. The purchase likelihood was marginally higher in a no
recall condition than a recall condition (p = 0.05). However, the purchase likelihood
(Mutilitarian = 3.42, SEutilitarian = .06; Mhedonic = 3.48, SEhedonic = .06) was not significantly
different for the main effect of category (p > 0.05). From the pairwise results of the two-
way interaction terms, it was found that the for a low equity brand, the purchase
likelihood (utilitarian: M = 3.29, SE = .08; hedonic: M = 3.13, SE = .08) of utilitarian
product category was significantly higher compared to the hedonic product category (p
< 0.05). On the other hand, for a high equity brand, the purchase likelihood (utilitarian:
M = 3.55, SE = .08; hedonic: M = 3.83, SE = .08) of utilitarian product category was
significantly lower compared to the hedonic product category (p < 0.05). For the two
way interaction of the brand equity and recall, the purchase likelihood (recall: M = 3.13,
SE = 0.08; no recall: M = 3.28, SE = 0.08) for recall condition was lower than no recall
condition for low equity and the purchase likelihood (recall: M = 3.60, SE = 0.08; no

48
recall: M = 3.79, SE = 0.08) behaviour followed similar trend for high equity but both the
results were statistically not significant (p > 0.05). For the two way interaction of the
product category and recall, the purchase likelihood (recall: M = 3.31, SE = 0.08; no
recall: M = 3.53, SE = 0.08) for recall condition was lower than no recall condition for
utilitarian and the purchase likelihood (recall: M = 3.42, SE = 0.09; no recall: M = 3.54,
SE = 0.08) behavior followed similar trend for hedonic but both the results were
statistically not significant (p > 0.05). For the three-way interaction between equity,
category and recall, the pairwise results with means are demonstrated in Table 1 and
Table 2 as well as through the graphical representation as seen in Figure 4. Even
though there are differences in mean, the interaction is not significant (p > 0.05). In
other words, the recall was not a strong treatment; participants did not see any reason
to change their behaviour with respect to category and equity in a recall situation
compared to no recall situation.
Table 1: Equity * Category * Recall interaction (No recall condition)
No recall
Utilitarian category Hedonic category
Low equity M=3.34, SE=.126 M=3.23, SE=.123
High equity M=3.71, SE=.122 M=3.86, SE=.126

49
Table 2: Equity * Category * Recall interaction (Recall condition)
Recall
Utilitarian category Hedonic category
Low equity M=3.23, SE=.124 M=3.03, SE=.127
High equity M=3.39, SE=.123 M=3.8, SE=.127
Figure 4: Graph showing the interaction between equity and category in a no recall
condition

50
Figure 5: Graph showing the interaction between equity and category in a recall
condition
CHAPTER 8: DISCUSSIONS
The current research investigated the role of brand equity, product category and
product recall on consumer evaluation. The main measure of consumer evaluation
tested was consumers’ purchase likelihood. It was predicted that for a brand with high
brand equity, the purchase likelihood for its hedonic product category would be higher
than its utilitarian product category and there would be no change in the pre and post
product recall context. Moreover, for a brand with low brand equity, the purchase

51
likelihood for its hedonic product category will be lesser than its utilitarian product
category pre-recall and significantly lesser post product recall.
The results revealed that though the interaction between brand equity and
product category was significant in influencing consumers’ purchase decisions, the
relationship did not see any statistical difference in a recall vs no recall situation. The
significant interaction between brand equity and category indicate that when the brand
has high equity, consumers would have a higher purchase likelihood for hedonic
compared to a utilitarian product category. The result supports the novel prediction that
product category does not influence purchase likelihood alone but interacts with the
brand name that the category is associated with in influencing consumers’ purchase
likelihood. This result supports the notion that once the guilt factor of choosing a
hedonic product over utilitarian product is reduced or removed, consumers would show
increase preference for hedonic products. In this study, the high level of brand equity
has resulted in a significantly higher consumer evaluation for the hedonic product
category. Hence, the findings contribute to an existing body of research that looked at
the role of reducing the guilt of hedonic products to increase their purchase likelihood
over utilitarian products (Strahilevitz & Myers, 1998; Kivetz & Simonson, 2002; Khan &
Dhar, 2005). Kivetz and Simonson (2002) found how higher required effort in obtaining
a product reduced the guilt of obtaining hedonic products like luxury products over
utilitarian products or products that are necessities. Similarly, when a purchase is tied to
charity donations or a charity act, the positive attribution of the charity decreases the
negative self-attribution of obtaining hedonic products and hence the preference for

52
hedonic will be higher than utilitarian in such cases (Strahilevitz & Myers, 1998; Khan &
Dhar, 2005).
However, the predicted result that the high brand equity would protect the
hedonic product category under a product recall and would not be impacted compared
to the hedonic product with a low brand equity which would be the most impacted in a
recall situation did not come significantly different than the result of the control condition
(no recall situation). The recall interaction with neither the product category nor the
brand equity came out significant which was contrary to the results obtained in the past
literature which proved that product recall impacts product category and product recall
impacts brand equity respectively (Roehm & Brady, 2007; Dawar & Pillutla, 2000;
Magno et al., 2017). These studies have not looked at either the role of brand equity on
product recall or the role of product category on product recall but not the interaction of
both on product recall.
In the present study, the stimulus that was used included not only negative
publicity of the brand but also information about the voluntary nature of the product
recall. Since a voluntary recall can be considered a source of positive abstract belief by
consumers (Coombs & Holladay, 2006), consumers may not change their behaviour
post a voluntary product recall. One of the studies by Souiden (2009) that looked at car
recall even found that voluntary recall did not negatively impact the image of the
company concerned by the recall, but in some cases improved it. Hence, it can be
suggested that since the present study used a voluntary recall condition, it may not
have been a strong treatment to change the behaviour with respect to no recall

53
condition. Also, another moderator called recall severity which is found to impact brand
equity (Korkonfingas & Ang, 2011) was not considered in this study. The authors had
found that for a milder product recall situation impacting Mp3 players, there was no
observed effect on brand equity. However, if the product recall is severe (producing
harm or even causing death), it impacts brand equity significantly. The present study did
not use a severe product recall scenario but mentioned a mild recall scenario in terms of
undeclared peanuts in the product that may cause health issues to people who are
allergic to peanuts. It is also possible that most of the students who participated in the
study are not allergic to peanuts and found the recall condition very mild. Hence, it is
recommended that future research endeavours of this nature should manipulate the
recall severity and then assess the effect on purchase likelihood. By doing so, there is
an opportunity to understand further why the purchase likelihood scores did not differ
among the no recall and recall condition.
The present study used a between-subject design. Past studies that found a
significant impact of a product recall on either brand equity or category used within-
subject design. The within-subject design used in earlier studies exposed participants
first to the product (without recall information) measuring their brand equity evaluation or
category evaluation followed by exposing them to the product recall information for their
preferred brand. This process may have led to a carry-over effect that confounds
causality (Charness, Gneezy, & Kuhn, 2012). The author argues that the act of moving
a participant from one scenario to another makes them explicitly aware of the change
that happened which may prompt a behavioural change and hence this method has a

54
tendency to magnify differences between the within-subject evaluations. This study
adopted the between-subjects design to avoid the carry-over effect issue.
Another possibility for the insignificant interaction between brand equity, product
category and product recall on purchase likelihood could be the unaccountability of past
usage with the product presented to the participants. Since past behaviour can
influence purchase intentions of the product and can affect present behaviour indirectly
(Bagozzi & Kimmel, 1995), it may be worthwhile for future researchers to do this study
over the course of a few months, evaluating the purchase behaviour with the product
without the recall and finally assessing the purchase behaviour with the product recall.
Comparing the findings of this study to those reported in Magno et al. (2017)
study, it is evident that unlike the findings in their study, the product category did not
have a significant impact on purchase likelihood in a recall condition. Firstly, the authors
did not consider the interaction of the brand equity and product category which was
found to have a significant interaction in the present study. Secondly, their study
adopted a within-subject design that may have a carry-over effect. The lack of
statistically significant results of the three-way interaction in the present analysis could
also be a reflection of participants not perceiving the recall information presented in the
online study environment as a salient cue to change their behaviour. Furthermore, this
study reported purchase intentions to evaluate consumers’ behaviour in a recall
situation, but it may have been possible that the recall situation was not significantly
seen as different compared to a non-recall situation because the participants did not
have to make the actual purchase for the product. Since purchase intention do not

55
always correspond with behaviour (Sutton, 1998), it would be worthwhile for future
studies to evaluate actual purchase behaviour after a product recall.
CHAPTER 9: CONTRIBUTION
9.1 Theoretical Contributions
While the frequency of product crisis like product recalls is increasing
dramatically, marketing knowledge of this phenomenon is scarce (Magno et al., 2017).
While a few studies that have investigated the impact of a product recall on brand equity
and type of product category in terms of consumer reaction, these have not considered
the two dimensions together. This study is unique in providing a framework in which
brand equity and the product type together are the main antecedents of consumer
purchase likelihood even though the effect was not significantly different for a crisis like
product recall vs no recall situation. The findings of this research constitute an important
contribution to marketing theory and the research by demonstrating that even in the
event of a product recall, high brand equity will protect the brand and will get a
favourable response from consumers than low equity brands. This work contributes to
accumulating literature on the role of guilt in consumption of hedonic products and how
reducing guilt can increase the preference for hedonic products. This research mainly
looks at how high brand equity alleviates the feeling of guilt in the purchase of hedonic
products over utilitarian products. This study provides support to the theory that as
consumers see brands with high brand equity having high goodwill (Heiens, Leach &
McGrath, 2012), their preference for hedonic categories will increase than utilitarian
56
categories, as the goodwill of the brand will reduce the feelings of guilt (Baghi &
Antonetti, 2017) associated with hedonic options. However, for brands with low brand
equity, utilitarian product categories are expected to have higher purchase likelihood
than hedonic categories.
Second, this study demonstrates the high priority that guilty consumers place on
opportunities that could alleviate this guilt so that they could justify their consumption.
The finding of this study is consistent with previous research that looks at the primary
importance of emotion regulation (reducing guilt in this case) in consumer decision
making (Raghunathan & Corfman, 2004; Tice et al., 2001; as cited in Zemack-Rugar et
al., 2016, p. 16).
Third, this study explores choices that involve a tradeoff between hedonic and
utilitarian options. This trade-off is theoretically as practically appropriate; the regular
tradeoffs consumers are usually forced to make while making a decision to purchase
products and a tradeoff between hedonic and utilitarian option is a common tradeoff
(Zemack-Rugar et al., 2016). Consumer decisions are not made in isolation, they make
such tradeoffs regularly; eat candy or fruit for a snack (Shiv & Fedorikhin, 1999; as cited
in Zemack-Rugar et al., 2016) or selecting an apartment with a great view or closer to
place of work (Dhar & Wertenbroch, 2000) or spend money on vacuum cleaner of
designer jeans (Dhar & Khan, 2005).

57
9.2 Managerial Contributions
From a managerial implication point of view, this study assists in predicting
consumers’ attitudes and behaviours with respect to product category and brand equity.
Firms would be first recommended to focus on building high equity for their brands to
prevent them from negative consequences of product crisis like product recall since the
purchase likelihood for high equity brands is found to be higher than low equity brands
for both no recall and recall situation. However, it is also found that the effect on
utilitarian and hedonic categories will be different for established brands with high equity
and new brands that still have to build brand equity in the market. Particularly,
manufacturers of low equity brands in the hedonic category can suffer severe damage
due to a severe product recall and hence the necessity to engage in a better product
recall management process is relatively more important than other manufacturers.
Managers would accordingly have to build different strategies and efforts to manage the
affected category.
The results from the study are applicable across different food industries since
most of the recall research has been done for the auto industry which may not be
readily applicable to other industries due to industry concentration and traceability of
consumers (Etayankara & Bapuji, 2009). Past research also suggests that focusing on
consumer product industry will provide insights that could be applicable across other
industries (Etayankara & Bapuji, 2009).

58
CHAPTER 10: LIMITATIONS AND FUTURE RESEARCH
Although care was taken to ensure that the current research was as rigorous as
possible, there were a few limitations that could not be avoided due to monetary and
time constraints. This study was conducted through online surveys distributed to
University of Guelph undergraduate students, who participated in exchange for course
credit. Future research may also be able to improve on this study by including a sample
that does not only include students, which may yield different results for recall and
purchase intention due to greater attentiveness towards the study. Diversifying the
sample by including professionals as well, since they are more involved in activities
such as grocery shopping, could yield different results.
This study only considers voluntary recalls by firms and also does not manipulate
the recall severity level. Looking at other forms of recall and varying the recall severity
level would increase the generalizability of the findings of this research across different
types of recall scenarios. Our study also analyses short-term reactions after a recall, but
an evaluation of the medium-term effects would also be beneficial.
Another limitation of this research is the fact that the recall scenario was a
hypothetical scenario created for this research. Real life incidents can impact consumer
evaluations very differently than hypothetical ones. Considering food recall incidents
occur so frequently, future research can look at extending this study by evaluating
consumer responses to a real-life recall incident.

59
This study has not investigated the participants’ level of internet experience.
Studies have shown that less experienced consumers are less critical of information
found online (Lopez & Sicilia, 2014). In this study, the participant pool consisted of
students at the University of Guelph, and as a result, their level of internet experience
was not considered important. However, future research should consider collecting this
data.
Finally, future research could be done in evaluating the effects of product recalls
on both brand equity and type of product category in other industries since past studies
have only looked at them separately. In general, product recalls are increasing every
year, research about product recall is scarce (Magno & Ugilini, 2017), particularly for the
food category. Product recall research should be encouraged for other categories
beyond cars (De Matos and Rossi, 2007; as cited in Magno & Ugilini, 2017) and toys
(Beamish and Bapuji, 2008, as cited in Magno & Ugilini, 2017).
CHAPTER 11: CONCLUSION
Consumers are exposed to a multitude of food recall incidents that occur every
year for brands across different product categories. A product in the market hence is a
package of the brand equity that it carries as well as the product category that it
operates in and food recall impacts both. This research has demonstrated that a brand
in the hedonic product category has a higher level of purchase likelihood than utilitarian
category if the brand equity of that product is high. On the other hand, a brand in the
utilitarian product category has a higher level of purchase likelihood than hedonic

60
product category if the brand equity of that product is low. This study looked at exploring
this relationship in the context of product recall since the objective was to look at how a
high level of brand equity would protect the hedonic category in a product recall
scenario. The result in a recall scenario did not come out significantly different from no
recall scenario since the recall scenario considered in this study did not come out to be
a strong treatment. However, the direction of the means suggested that the purchase
likelihood for the recall scenario was lesser than that of the no recall scenario and the
product with the least purchase likelihood among the eight treatments came out to be
the low equity hedonic product.
REFERENCES
Aaker, D. (1991). Managing Brand Equity: Ontario.
Aaker, D. A. (1992). Managing the most important assets: Brand equity. Planning
review, 20(5), 56-58.
Andreassen, T.W., (2000). Antecedents to satisfaction with service recovery. European
Journal of Marketing, 34(1/2), 156–175. https://doi.org/10.1108/03090560010306269
Baghi, I., & Antonetti, P. (2017). High-fit charitable initiatives increase hedonic
consumption through guilt reduction. European Journal of Marketing, 51(11/12), 2030-
2053.

61
Bagozzi, R. P., & Kimmel, S. K. (1995). A comparison of leading theories for the
prediction of goal‐directed behaviours. British Journal of social psychology, 34(4), 437-
461.
Batra, R., & Ahtola, O. T. (1990). Measuring the hedonic and utilitarian sources of
consumer attitudes. Marketing Letters, 2(2), 159–170.
https://doi.org/10.1007/BF00436035
Bodner, R., & Prelec, D. (2003). Self-signaling and diagnostic utility in everyday
decision making. The psychology of economic decisions, 1, 105-26.
Brandão, M. H., Yamada, Y., Ponchio, M. C., Cordeiro, R. A., & Strehlau, V. I. (2016).
The influence of product recall on consumer loyalty. Revista de Administração, 14(1),
143-164.
Byun, K. A., & Dass, M. (2015). An investigation of the effects of product recalls on
brand commitment and purchase intention. Journal of Consumer Marketing, 32(1), 1-14.
Burmann, C., Jost-Benz, M., & Riley, N. (2009). Towards an identity-based brand equity
model. Journal of Business research, 62(3), 390-397.
Carroll, C. (2009). Defying a reputational crisis–Cadbury's salmonella scare: why are
customers willing to forgive and forget? Corporate Reputation Review, 12(1), 64-82.

62
CFIA. (n.d.). Food Safety Investigation and Recall Process. Retrieved from
http://www.inspection.gc.ca/food/information-for-consumers/food-safety-system/basic-
html/eng/1374439778888/1374821384212
Chandon, P., Wansink, B., & Laurent, G. (2000). A benefit congruency framework of
sales promotion effectiveness. Journal of marketing, 64(4), 65-81.
Charness, G., Gneezy, U., & Kuhn, M. A. (2012). Experimental methods: Between-
subject and within-subject design. Journal of Economic Behavior & Organization, 81(1),
1-8.
Chernev, A. (2004). Goal–attribute compatibility in consumer choice. Journal of
Consumer Psychology, 14(1-2), 141-150.
Chu, T. H., Lin, C. C., & Prather, L. J. (2005). An extension of security price reactions
around product recall announcements. Quarterly Journal of Business and Economics,
33-48.
Cleeren, K., Dekimpe, M. G., & Helsen, K. (2008). Weathering product-harm crises.
Journal of the Academy of Marketing Science, 36(2), 262–270.
https://doi.org/10.1007/s11747-007-0022-8
Timothy Coombs, W., & Holladay, S. J. (2006). Unpacking the halo effect: Reputation
and crisis management. Journal of Communication Management, 10(2), 123-137.

63
Dabholkar, P. A., Shepherd, C. D., & Thorpe, D. I. (2000). A comprehensive framework
for service quality: an investigation of critical conceptual and measurement issues
through a longitudinal study. Journal of retailing, 76(2), 139-173.
Dawar, N., & Pillutla, M. M. (2000). Impact of product-harm crises on brand equity: The
moderating role of consumer expectations. Journal of marketing research, 37(2), 215-
226.
Dhar, R., & Wertenbroch, K. (2000). Consumer choice between hedonic and utilitarian
goods. Journal of marketing research, 37(1), 60-71.
Dean, D. H. (2004). Consumer reaction to negative publicity: Effects of corporate
reputation, response, and responsibility for a crisis event. The Journal of Business
Communication (1973), 41(2), 192-211.
Diefenbach, S., & Hassenzahl, M. (2011). The Dilemma of the hedonic - appreciated,
but hard to justify. Interact. Comput., 23(5), 461–472.
https://doi.org/10.1016/j.intcom.2011.07.002
Erdem, T., & Swait, J. (1998). Brand equity as a signaling phenomenon. Journal of
consumer Psychology, 7(2), 131-157.
Etayankara, M., & Bapuji, H. (2009, June). Product recalls: a review of literature.
In ASAC (Vol. 30, No. 6).

64
Fry, E. (2016). Nestlé’s half-billion-dollar noodle debacle in India. Fortune, April, 26.
Retrieved from http://fortune.com/nestle-maggi-noodle-crisis/
Griffin, M., Babin, B. J., & Attaway, J. S. (1991). An empirical investigation of the impact
of negative public publicity on consumer attitudes and intentions. ACR North American
Advances.
Heiens, R. A., Leach, R. T., & McGrath, L. C. (2012). Assessing the Importance of
Brand Equity in Health Services Marketing Through the Impact of Acquired Goodwill on
Stockholder Returns. Journal of Economics and Behavioral Studies, 4(6), 364.
Salin, V., & Hooker, N. H. (2001). Stock market reaction to food recalls. Review of
Agricultural Economics, 23(1), 33-46.
Kakar, A. K. S. (2017). Why do users prefer the Hedonic but choose the Utilitarian?
Investigating user dilemma of Hedonic-Utilitarian choice. International Journal of
Human-Computer Studies, 108, 50-61.
Kalaignanam, K., Kushwaha, T., & Eilert, M. (2013). The impact of product recalls on
future product reliability and future accidents: Evidence from the automobile
industry. Journal of Marketing, 77(2), 41-57.
Keller, K. L. (1993). Conceptualizing, measuring, and managing customer-based brand
equity. Journal of marketing, 57(1), 1-22.

65
Keller, K. L. (2000). Building and managing corporate brand equity. The Expressive
Organization, Oxford University press: Oxford, 116-137.
Keller, K. L. (2002). Branding and brand equity. Handbook of marketing, 151.
Keller, K. L. (2003). Understanding brands, branding and brand equity. Interactive
Marketing, 5(1), 7-20.
Keller, K.L. (2008), Strategic Brand Management, 3d ed. Englewood Cliffs, NJ: Prentice
Hall.
Kempen, M., Martinetti, A., & van Dongen, L. A. M. (2016). “I’ll be back”: a deep
analysis on mass product recalls of non-food products. In 19th International Working
Seminar on Production Economics 2016.
Klein, K., & Melnyk, V. (2016). Speaking to the mind or the heart: effects of matching
hedonic versus utilitarian arguments and products. Marketing Letters, 27(1), 131-142.
Korkofingas, C., & Ang, L. (2011). Product recall, brand equity, and future
choice. Journal of Marketing Management, 27(9-10), 959-975.
https://doi.org/10.1080/0267257X.2011.560717
Kuikka, A., & Laukkanen, T. (2012). Brand loyalty and the role of hedonic value. Journal
of Product & Brand Management, 21(7), 529-537.
66
Kumar, S., & Budin, E. M. (2006). Prevention and management of product recalls in the
processed food industry: a case study based on an exporter's
perspective. Technovation, 26(5-6), 739-750.
Laroche, M., Cleveland, M., & Maravelakis, I. (2006). Competitive advertising and ad
repetition effects: comparing high-share and low-share brands. International journal of
advertising, 25(3), 271-307.
Lassar, W., Mittal, B., & Sharma, A. (1995). Measuring customer-based brand
equity. Journal of consumer marketing, 12(4), 11-19.
Lin, C. P., Chen, S. C., Chiu, C. K., & Lee, W. Y. (2011). Understanding purchase
intention during product-harm crises: Moderating effects of perceived corporate ability
and corporate social responsibility. Journal of business ethics, 102(3), 455.
https://doi.org/10.1007/s10551-011-0824-y
Luo, Y. (2008). A strategic analysis of product recalls: The role of moral degradation
and organizational control. Management and Organization Review, 4(2), 183-196.
Magno, F. (2012). Managing product recalls: The effects of time, responsible vs.
opportunistic recall management and blame on consumers’ attitudes. Procedia-Social
and Behavioral Sciences, 58, 1309-1315. https://doi.org/10.1016/j.sbspro.2012.09.1114

67
Magno, F., Cassia, F., & Ugolini, M. (2017). Impact of voluntary product recalls on
utilitarian and hedonic attitudes: Is it the same for all brands? Australian Journal of
Management, 42(1), 161-174. https://doi.org/10.1177/0312896215599812
Mathews, C., Ambroise, L., & Brignier, J. M. (2009, May). Hedonic and symbolic
consumption perceived values: opportunities for innovators and designers in the fields
of brand and product design. In Renaissance & Renewal in Management Studies (p.
32p).
Matos, C. A. D, & Rossi, C. A. V. (2007). Consumer reaction to product recalls: factors
influencing product judgement and behavioural intentions. International Journal of
Consumer Studies, 31(1), 109-116.
Meyers-Levy, J., & Malaviya, P. (1999). Consumers’ processing of persuasive
advertisements: An integrative framework of persuasion theories. Journal of
marketing, 63(4_suppl1), 45-60.
Nam, J., Ekinci, Y., & Whyatt, G. (2011). Brand equity, brand loyalty and consumer
satisfaction. Annals of tourism Research, 38(3), 1009-1030.
Okada, E. M. (2005). Justification effects on consumer choice of hedonic and utilitarian
goods. Journal of marketing research, 42(1), 43-53.
Oberfeld, D., & Franke, T. (2013). Evaluating the robustness of repeated measures
analyses: The case of small sample sizes and nonnormal data. Behavior Research
Methods, 45(3), 792-812.

68
Onyango, B. M., Miljkovic, D., Hallman, W. K., Nganje, W. E., Condry, S. C., & Cuite, C.
L. (2007). Food recalls and food safety perceptions: The September 2006 spinach recall
case(No. 1187-2016-93818).
Pullig, C., Netemeyer, R. G., & Biswas, A. (2006). Attitude basis, certainty, and
challenge alignment: A case of negative brand publicity. Journal of the Academy of
Marketing Science, 34(4), 528-542.
Rea, B., J. Wang, Y., & Stoner, J. (2014). When a brand caught fire: the role of brand
equity in product-harm crisis. Journal of Product & Brand Management, 23(7), 532-542.
Recalls, M. (2007). Communication implications for quality control, outsourcing and
consumer relations.
Rhee, M., & Haunschild, P. R. (2006). The liability of good reputation: A study of product
recalls in the US automobile industry. Organization Science, 17(1), 101-117.
Roehm, M. L., & Brady, M. K. (2007). Consumer responses to performance failures by
high-equity brands. Journal of Consumer Research, 34(4), 537-545.
Rubel, O., Naik, P. A., & Srinivasan, S. (2011). Optimal advertising when envisioning a
product-harm crisis. Marketing Science, 30(6), 1048-1065.
Hooker, N. H., & Salin, V. (1999). Stock market reaction to food recalls. Center for Food
Safety Department of Agricultural Economics, 1, 2.

69
Scope® Original Mint Mouthwash Recalled by Procter & Gamble Due to Failure to Meet
Child-Resistant Closure Requirement. (2010). Retrieved from
https://www.cpsc.gov/Recalls/2010/scope-original-mint-mouthwash-recalled-by-procter-
gamble-due-to-failure-to-meet-child
Shrivastava, P., & Siomkos, G. (1989). Disaster containment strategies. Journal of
Business Strategy, 10(5), 26-30. https://doi.org/10.1108/eb060058
Siomkos, G. J. (1999). On achieving exoneration after a product safety industrial
crisis. Journal of Business & Industrial Marketing, 14(1), 17-29.
Sloot, L. M., Verhoef, P. C., & Franses, P. H. (2005). The impact of brand equity and the
hedonic level of products on consumer stock-out reactions. Journal of Retailing, 81(1),
15-34.
Souiden, N., & Pons, F. (2009). Product recall crisis management: the impact on
manufacturer's image, consumer loyalty and purchase intention. Journal of Product &
Brand Management, 18(2), 106-114.
Stahl, F., Heitmann, M., Lehmann, D. R., & Neslin, S. A. (2012). The impact of brand
equity on customer acquisition, retention, and profit margin. Journal of marketing, 76(4),
44-63.
Strahilevitz, M., & Myers, J. G. (1998). Donations to charity as purchase incentives:
How well they work may depend on what you are trying to sell. Journal of consumer
research, 24(4), 434-446.

70
Striking the right chord: Culture and emotion in consumer choice. (2018). Retrieved
from http://www.forbesindia.com/printcontent/51145
Sutton, S. (1998). Predicting and explaining intentions and behavior: How well are we
doing?. Journal of applied social psychology, 28(15), 1317-1338.
Taylor, S. A., Celuch, K., & Goodwin, S. (2004). The importance of brand equity to
customer loyalty. Journal of product & brand management, 13(4), 217-227.
Voss, K. E., Spangenberg, E. R., & Grohmann, B. (2003). Measuring the hedonic and
utilitarian dimensions of consumer attitude. Journal of marketing research, 40(3), 310-
320.
Watkins, B. A., & Gonzenbach, W. J. (2013). Assessing university brand personality
through logos: An analysis of the use of academics and athletics in university
branding. Journal of Marketing for Higher Education, 23(1), 15-33.
Wertenbroch, K., Dhar, R., & Khan, U. (2005). A behavioral decision theory perspective
on hedonic and utilitarian choice. Inside consumption: Frontiers of research on
consumer motives, goals, and desires, 1, 144-165.
Yi, Y. J., & Muhn, S. H. (2013). Mixed Products-How Adding Different Attributes
Influences Consumer Perceptions and Product Evaluation. Asia Marketing
Journal, 15(1), 83-105.

71
Zemack-Rugar, Y., Rabino, R., Cavanaugh, L. A., & Fitzsimons, G. J. (2016). When
donating is liberating: The role of product and consumer characteristics in the appeal of
cause-related products. Journal of Consumer Psychology, 26(2), 213-230.
Zhao, Y., Zhao, Y., & Helsen, K. (2011). Consumer learning in a turbulent market
environment: Modeling consumer choice dynamics after a product-harm crisis. Journal
of Marketing Research, 48(2), 255-267.

72
APPENDICES
Appendix 1: Pre-test survey for product categories
You are presented with two definitions and based on these definitions, you may answer the subsequent questions. Utilitarian or practical products -- are products that are useful, practical, functional, something that helps achieve a goal. Something which one ordinarily buys to carry out a necessary function or task in one’s life.
Hedonic or frivolous products – are products that are pleasant, fun, experiential and perhaps even ‘’decadent.’’ Purchasing such products is enjoyable and appeals to the senses.
You will now see pictures of a few products. Based on your understanding of the definitions, please check all that applies.
Q1. Plain Cornflakes (breakfast cereal made by toasting flakes of corn)
For you, this product is: (Please check either Yes or No)

73
Q2. Cow's milk (2% M.F., partly skimmed milk)
For you, this product is: (Please check either Yes or No)
Q3. Ice-cream

74
For you, this product is: (Please check either Yes or No)
Q4. Chocolate chip cookie
For you, this product is: (Please check either Yes or No)

75
Q5. Plain Yogurt
For you, this product is: (Please check either Yes or No)
Q6. Milk chocolate bar

76
For you, this product is: (Please check either Yes or No)
Q7. Potato chips
For you, this product is: (Please check either Yes or No)

77
Q8. Pre-packed 100% whole wheat bread
For you, this product is: (Please check either Yes or No)
Appendix 2: Pre-test survey for brand equity
Instructions for the questions: The following questions (Q9. to Q13.) require you to
evaluate various brands based on your experience with the brand. Please check the
option that corresponds with your response to the questions asked about each brand.

78
Q9. This brand is highly trustworthy

79

80
Q10. This is a high-quality brand

81

82
Q11. I like this brand very much

83

84
Q12. This is a very good brand

85

86
Q13. I consider this brand to be very reliable

87

88
Appendix 3: Pre-test demographic questions
Q14. Your age (number 1-100)
Q15. Your gender
Appendix 4: Main study survey measuring purchase likelihood
4.1 High equity, utilitarian product category and no recall condition
Please spend a few seconds viewing the image below for Questions 1 to 6:

89
Q1. How likely is it that you would purchase "Activia" the next time you need to buy plain yogurt?
Q2. How sure are you with your purchase intention of "Activia"?
Q3. How much do you trust the government's regulation of food safety in Canada?

90
Q4. How much do you trust the retailer's regulation of food safety in Canada?
Q5. Given a choice to buy a brand of plain yogurt, which brand would you pick?
Q6. When was the last time you purchased a yogurt like "Activia"?
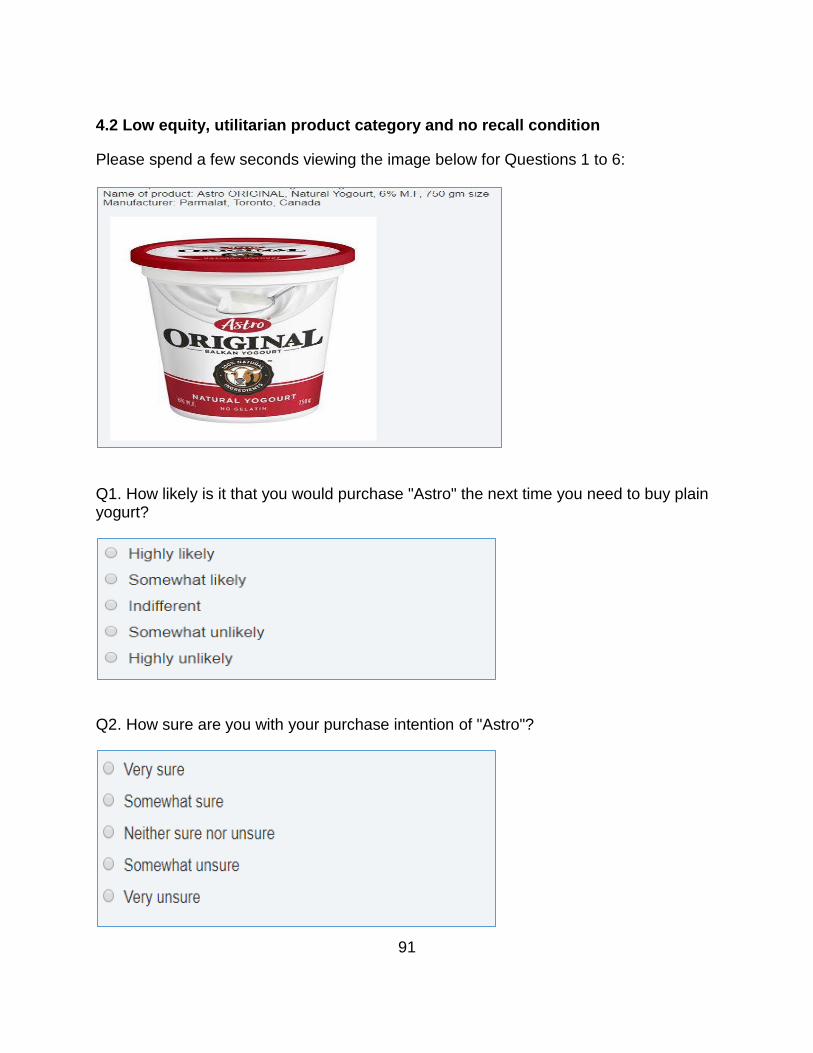
91
4.2 Low equity, utilitarian product category and no recall condition
Please spend a few seconds viewing the image below for Questions 1 to 6:
Q1. How likely is it that you would purchase "Astro" the next time you need to buy plain yogurt?
Q2. How sure are you with your purchase intention of "Astro"?

92
Q3. How much do you trust the government's regulation of food safety in Canada?
Q4. How much do you trust the retailer's regulation of food safety in Canada?
Q5. Given a choice to buy a brand of plain yogurt, which brand would you pick?

93
Q6. When was the last time you purchased a yogurt like "Astro"?
4.3 High equity, hedonic product category and no recall condition
Please spend a few seconds viewing the image below for Questions 1 to 6:
Q1. How likely is it that you would purchase "Lindt" the next time you need to buy a bar of milk chocolate?

94
Q2. How sure are you with your purchase intention of "Lindt"?
Q3. How much do you trust the government's regulation of food safety in Canada?
Q4. How much do you trust the retailer's regulation of food safety in Canada?

95
Q5. Given a choice to buy a bar of milk chocolate, which brand would you pick?
Q6. When was the last time you purchased a bar of milk chocolate like "Lindt"?
4.4 Low equity, hedonic product category and no recall condition
Please spend a few seconds viewing the image below for Questions 1 to 6:

96
Q1. How likely is it that you would purchase "Our Finest" the next time you need to buy a bar of milk chocolate?
Q2. How sure are you with your purchase intention of "Our Finest"?
Q3. How much do you trust the government's regulation of food safety in Canada?
Q4. How much do you trust the retailer's regulation of food safety in Canada?

97
Q5. Given a choice to buy a bar of milk chocolate, which brand would you pick?
Q6. When was the last time you purchased a bar of milk chocolate like "Our Finest"?
4.5 High equity, utilitarian product category and recall condition

98
Q1. How likely is it that you would purchase "Activia" the next time you need to buy plain yogurt?
Q2. How sure are you with your purchase intention of "Activia"?
Q3. How much do you trust the government's regulation of food safety in Canada?

99
Q4. How much do you trust the retailer's regulation of food safety in Canada?
Q5. Given a choice to buy a brand of plain yogurt, which brand would you pick?
Q6. When was the last time you purchased a yogurt like "Activia"?
Q7. If you are not planning to buy "Activia" now given this recall, once the issue is resolved, when are you next likely to buy "Activia"?

100
4.6 Low equity, utilitarian product category and recall condition
Q1. How likely is it that you would purchase "Astro" the next time you need to buy plain yogurt?
Q2. How sure are you with your purchase intention of "Astro"?

101
Q3. How much do you trust the government's regulation of food safety in Canada?
Q4. How much do you trust the retailer's regulation of food safety in Canada?
Q5. Given a choice to buy a brand of plain yogurt, which brand would you pick?
Q6. When was the last time you purchased a yogurt like "Astro"?

102
Q7. If you are not planning to buy "Astro" now given this recall, once the issue is resolved, when are you next likely to buy "Astro"?
4.7 High equity, hedonic product category and recall condition
Q1. How likely is it that you would purchase "Lindt" the next time you need to buy a bar of milk chocolate?

103
Q2. How sure are you with your purchase intention of "Lindt"?
Q3. How much do you trust the government's regulation of food safety in Canada?
Q4. How much do you trust the retailer's regulation of food safety in Canada?
Q5. Given a choice to buy a bar of milk chocolate, which brand would you pick?

104
Q6. When was the last time you purchased a bar of milk chocolate like "Lindt"?
Q7. If you are not planning to buy "Lindt" now given this recall, once the issue is resolved, when are you next likely to buy "Lindt"?
4.8 Low equity, hedonic product category and recall condition

105
Q1. How likely is it that you would purchase "Our Finest" the next time you need to buy a bar of milk chocolate?
Q2. How sure are you with your purchase intention of "Our Finest"?
Q3. How much do you trust the government's regulation of food safety in Canada?
Q4. How much do you trust the retailer's regulation of food safety in Canada?

106
Q5. Given a choice to buy a bar of milk chocolate, which brand would you pick?
Q6. When was the last time you purchased a bar of milk chocolate like "Our Finest"?
Q7. If you are not planning to buy "Our Finest" now given this recall, once the issue is resolved, when are you next likely to buy "Our Finest"?
Appendix 5: Main study demographic question
Q. Your gender?

107
Appendix 6: Frequency table of demographics

108
Appendix 7: Pre-test mean hedonic and utilitarian scores

109
Appendix 8: Paired differences of utilitarian and hedonic means
Appendix 9: Pre-test brand equity scores

110

111
Appendix 10: Main study table of demographics

112
Appendix 11: Main study frequency table of the treatment conditions
Appendix 12: Box plot for outlier assumption

113
Appendix 13: Normality plot and test for ANOVA assumption

114
Appendix 14: Levene’s test for equality of variances for ANOVA assumption

115
Appendix 15: Main study ANOVA output

116
Appendix 16: ANOVA pairwise comparisons
16.1 Equity
16.2 Category

117
16.3 Recall

118
16.4 Equity * Category
16.5 Equity * Recall

119
16.5 Category * Recall
16.6 Equity * Category * Recall