a study of ageing and playing effects on violins: the...
TRANSCRIPT

A study of ageing and playing
effects on violins: the first three
years
R. Inta, J. Smith and J. Wolfe
Music Acoustics Laboratory
School of Physics, University of New South Wales,
Sydney

Is a Violin like Wine?

Physics and Music?

Musicians will go to extraordinary lengths to improve their
instruments!

A common question asked by
violinists
Do violins ‘play in’?
Giovanni Francesco Barbieri (Guercino):
“St Francis with an Angel Playing Violin”
Hutchins, C.M.: “A Measurable Effect of Long-Term
Playing on Violin Family Instruments,” Catgut
Acoustical Society Journal, 3 (series II), (May 1998)
Turner, R: “Instant Vintage: Can a Vibration Machine
Make a New Guitar Sound Like an Old Guitar?”
Acoustic Guitar Magazine, 36-41 (Feb. 1997)

Do violins improve with age?
Lack an ideal reference or control violin
(Image from fotservis.typepad.com/.../ 2004/08/)
Another common question asked
by violinists

The ‘Powerhouse Twins’

Project Goals
•Material properties of wood used
•Vibro-acoustic parameters at various
construction phases
•Responses of listening/playing tests
(psychoacoustics)
Attempt to address possible ageing and playing effects by
measuring:

Wood Characterisation
High quality violin wood
•The finest Picea excelsa (top-plate) and
Acer pseudoplatanus (back-plate)
•From the same wood block
•Seasoned for 80 years
But, even so… (Image from www.violin.ch/work_a.htm)

)5(41.054.11 LE
)3(96.089.1 RE )2(05.070.0 RE
)24(8465 )14(114513mkg 3mkg
(Moisture content: 11.6%)
GPa
Violin 1
)5(53.067.12 LE
Violin 2
GPa
GPa
GPa

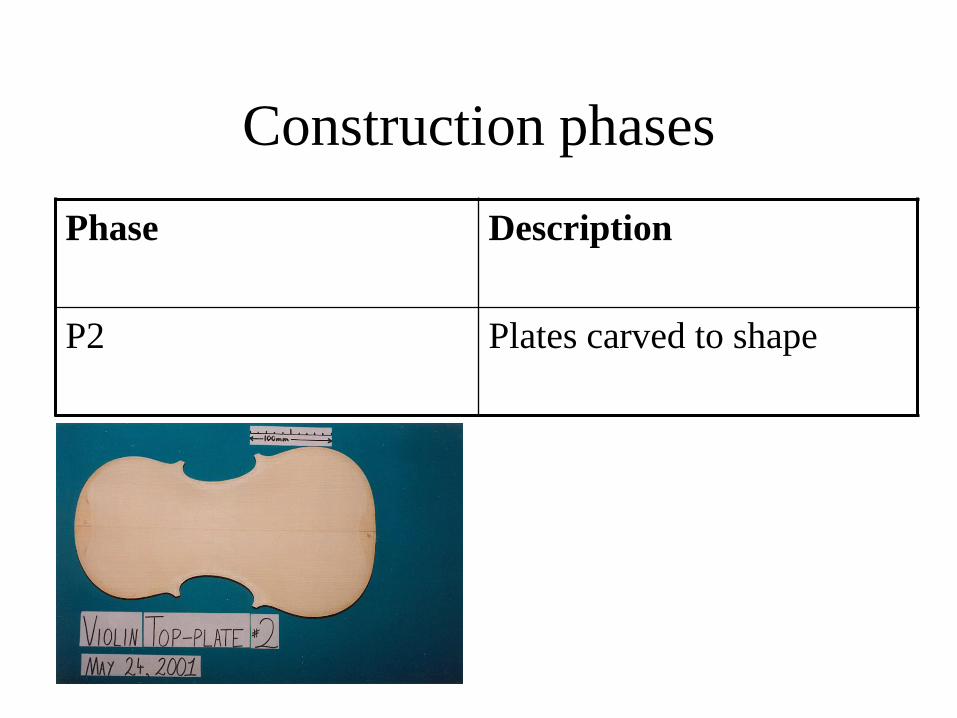
Construction phases
Phase Description
P1 Properties of raw wood
Construction phases
Phase Description
P2 Plates carved to shape

Construction phases
Phase Description
P3 f-holes and bass-bar
installed
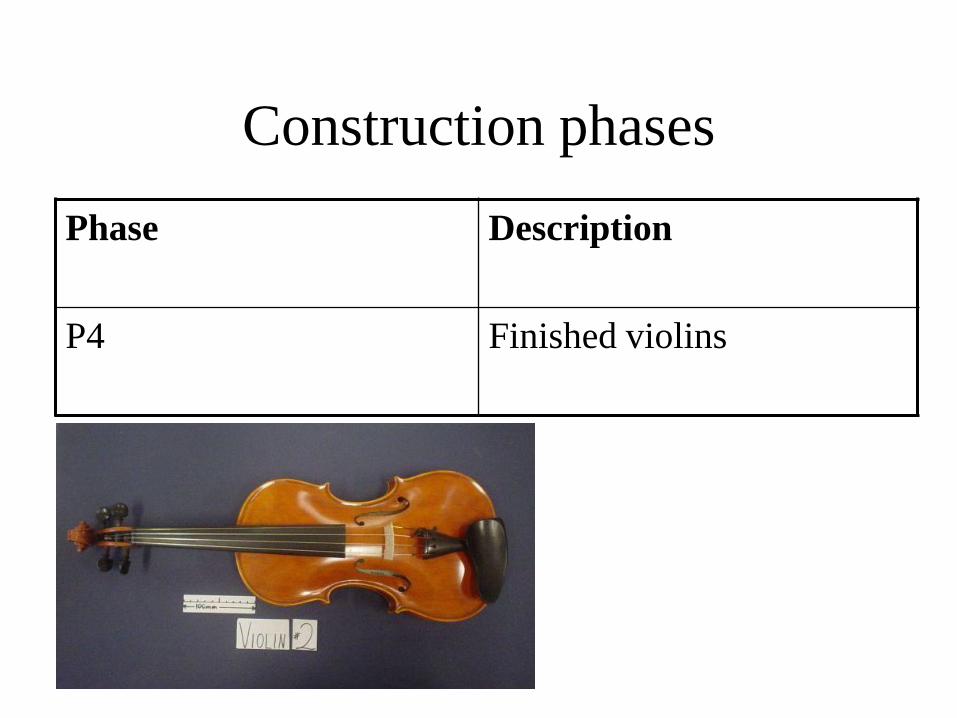
Construction phases
Phase Description
P4 Finished violins

Construction phases
Phase Description
P5 Three years after finishing

Construction phases
Phase Description
P6 Three years after finishing:
played instrument altered
(3 days after P5)

Vibro-acoustic tests
Are there any physically measurable
differences between the two instruments?


Impact Measurements


Comparison of Violin Pressure Spectrograms
Newly finished One year later
Played
Unplayed

Listening/Playing tests
Are competent humans able to distinguish
between the two instruments?

Subjects: Most proficient violinists from UNSW Orchestra
(7th grade-Licentiate)
Venue: Large concert hall (Clancy Auditorium, UNSW)

Procedure
•Live players
•Violins presented in
pseudorandom order
from behind a screen
•Each played 3 trials of
a set piece
•Participants were left
unaware of the nature
of the test

Responses Players Listeners Data type
Warmth Evenness Ordinal(1-10)
Evenness Clarity Ordinal(1-10)
Brightness Projection Ordinal(1-10)
Speaking ability Character Ordinal(1-10)
Playability Warmth Ordinal(1-10)
Responsiveness Ordinal(1-10)
Character Ordinal(1-10)
Dynamic range Ordinal(1-10)
Preference (sound) Preference Ranking
Preference (playing) Ranking

P4: Violins newly finished
P5: Three years after P4
P6: Three days after P5 (with adjustments to the played violin)

P4: Violins newly finished
P5: Three years after P4
P6: Three days after P5 (with adjustments to
the played violin)

Probability of no false positives in all 48 comparisons
at the 95% confidence level:
Probability of no false positives in all 48 comparisons
at the 98% confidence level:
085.0)95.0( 48
379.0)98.0( 48
Therefore these results are not inconsistent with the
hypothesis that the violins are indistinguishable
Statistics (or just a lie?)
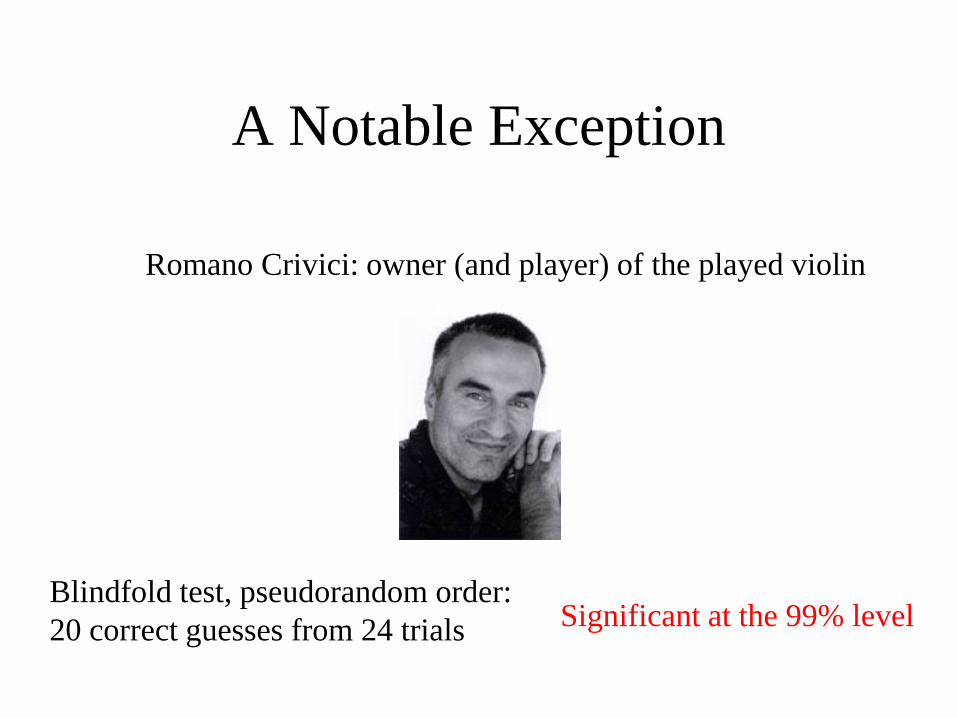
A Notable Exception
Romano Crivici: owner (and player) of the played violin
Blindfold test, pseudorandom order:
20 correct guesses from 24 trials Significant at the 99% level
Conclusion •Some measurable differences in properties of wood and free
plates
•Some measurable differences in the physical responses of
the instruments
•A panel of expert listeners did not distinguish between the two,
directly after finishing the instruments or three years later
•A panel of expert players did not distinguish between the two,
directly after finishing the instruments or three years later
•The owner of the played violin could distinguish between the
two, well above chance levels
BBC radio’s conclusion

Future Work
•May be able to separate potential effects due to
playing and ageing
•A long-term study (decades?)
•May be able to establish a relationship between changes
in wood and changes in the instrument

Acknowledgements
•Michael Lea
•Romano Crivici
•Harry Vatiliotis
•John Tann
•Boris Blankleider and the South Australian
Branch of the Australian Institute of Physics

http://www.phys.unsw.edu.au/~jw/powerhousetwins.html
More information:
Thank you, Adelaide!


Comparison of Violin Spectrograms: V1 and V2

Comparison of Violin Spectrograms: Lark Comparison

Results: Listening/Playing
Players: P4 Players: P5 Players: P6
Category P(T<=t) df Category P(T<=t) df Category P(T<=t) df
Warmth 78.8 40 Warmth 54.6 43 Warmth 46.1 37
Evenness 10.8 37 Evenness 72.9 43 Evenness 65.1 37
Brightness 8.5 40 Brightness 49.9 43 Brightness 68.0 37
Speaking Ability 4.1 40 Speaking Ability 51.3 43 Speaking Ability 32.4 37
Playability 61.5 40 Playing 42.0 43 Playing 80.0 37
Responsiveness 22.7 40 Responsiveness 96.9 43 Responsiveness 92.6 37
Character 52.2 40 Character 92.4 43 Character 54.3 37
Dynamic Range 12.4 40 Dynamic Range 77.4 43 Dynamic Range 84.5 37
Preference (Sound) 22.9 34 Preference (Sound) 7.0 43 Preference (Sound) 44.2 37
Preference (Playing) 69.2 34 Preference (Playing) 15.1 43 Preference (Playing) 44.2 37
Listeners: P4 Listeners: P5 Listeners: P6
Category P(T<=t) df Category P(T<=t) df Category P(T<=t) df
Evenness 36.2 232 Evenness 73.6 106 Evenness 78.4 175
Clarity 73.9 230 Clarity 77.2 106 Clarity 82.0 175
Projection 82.1 232 Projection 45.5 106 Projection 45.5 175
Character 98.8 229 Character 95.3 106 Character 75.3 176
Warmth 37.8 231 Warmth 76.1 106 Warmth 57.5 175
Preference 29.4 223 Preference 41.7 106 Preference 5.8 166
(95% level)