a study of awareness, attitude and factors influencing ... patel - thesis - 129990992002.pdf ·...
TRANSCRIPT

A Study of Awareness, Attitude and Factors
influencing Personal Financial Planning for
Residents of Gujarat
A Thesis submitted to Gujarat Technological University
for the Award of
Doctor of Philosophy
in
Management
By
Avni Tejas Patel
Enrollment No: 129990992002
Under supervision of
Dr. Satendra Kumar
GUJARAT TECHNOLOGICAL UNIVERSITY
AHMEDABAD
November - 2017

i
© [Avni Tejas Patel]

ii
DECLARATION
I declare that the thesis entitled “A Study of Awareness, Attitude and Factors
influencing Personal Financial Planning for Residents of Gujarat” submitted by me
for the degree of Doctor of Philosophy is the record of research work carried out by me
during the period from November 2012 to June 2017 under the supervision of Dr.
Satendra Kumar and this has not formed the basis for the award of any degree, diploma,
associate ship, fellowship, titles in this or any other University or other institution of
higher learning.
I further declare that the material obtained from other sources has been duly
acknowledged in the thesis. I shall be solely responsible for any plagiarism or other
irregularities, if noticed in the thesis.
Signature of the Research Scholar : …………………………… Date:
Name of Research Scholar: Avni Tejas Patel
Place : Ahmedabad

iii
CERTIFICATE
I certify that the work incorporated in the thesis “A Study of Awareness, Attitude
and Factors influencing Personal Financial Planning for Residents of Gujarat”
submitted by Smt. Avni Tejas Patel was carried out by the candidate under my
supervision/guidance. To the best of my knowledge: (i) the candidate has not submitted
the same research work to any other institution for any degree/diploma, Associateship,
Fellowship or other similar titles (ii) the thesis submitted is a record of original
research work done by the Research Scholar during the period of study under my
supervision, and (iii) the thesis represents independent research work on the part of the
Research Scholar.
Signature of Supervisor: ……………………………… Date:
Name of Supervisor: Dr. Satendra Kumar
Place: CKSVIM, Vadodara

iv
Originality Report Certificate
It is certified that PhD Thesis titled “A Study of Awareness, Attitude and Factors
influencing Personal Financial Planning for Residents of Gujarat” by Avni Tejas
Patel has been examined by us. We
undertake the following:
a. Thesis has significant new work / knowledge as compared already published or are
under consideration to be published elsewhere. No sentence, equation, diagram,
table, paragraph or section has been copied verbatim from previous work unless it
is placed under quotation marks and duly referenced.
b. The work presented is original and own work of the author (i.e. there is no
plagiarism). No ideas, processes, results or words of others have been presented as
Author own work.
c. There is no fabrication of data or results which have been compiled / analysed.
d. There is no falsification by manipulating research materials, equipment or
processes, or changing or omitting data or results such that the research is not
accurately represented in the research record.
e. The thesis has been checked using turnitin (copy of originality report attached) and
found within limits as per GTU Plagiarism Policy and instructions issued from time
to time (i.e. permitted similarity index <=25%).
Signature of the Research Scholar: …………………………… Date:
Name of Research Scholar: Avni Tejas Patel
Place : Ahmedabad
Signature of Supervisor: ……………………………… Date:
Name of Supervisor: Dr. Satendra Kumar
Place: CKSVIM, Vadodara.

v

vi

vii
PhD THESIS Non-Exclusive License to GUJARAT TECHNOLOGICAL UNIVERSITY
In consideration of being a PhD Research Scholar at GTU and in the interests of the
facilitation of research at GTU and elsewhere, I, Avni Tejas Patel having Enrollment No.
129990992002 hereby grant a non-exclusive, royalty free and perpetual license to GTU on
the following terms:
a) GTU is permitted to archive, reproduce and distribute my thesis, in whole or in
part, and/or my abstract, in whole or in part ( referred to collectively as the
―Work‖) anywhere in the world, for non-commercial purposes, in all forms of
media;
b) GTU is permitted to authorize, sub-lease, sub-contract or procure any of the acts
mentioned in paragraph (a);
c) GTU is authorized to submit the Work at any National / International Library,
under the authority of their ―Thesis Non-Exclusive License‖;
d) The Universal Copyright Notice (©) shall appear on all copies made under the
authority of this license;
e) I undertake to submit my thesis, through my University, to any Library and
Archives. Any abstract submitted with the thesis will be considered to form part of
the thesis.
f) I represent that my thesis is my original work, does not infringe any rights of
others, including privacy rights, and that I have the right to make the grant
conferred by this non-exclusive license.
g) If third party copyrighted material was included in my thesis for which, under the
terms of the Copyright Act, written permission from the copyright owners is
required, I have

viii
obtained such permission from the copyright owners to do the acts mentioned in
paragraph (a) above for the full term of copyright protection.
h) I retain copyright ownership and moral rights in my thesis, and may deal with the
copyright in my thesis, in any way consistent with rights granted by me to my
University in this non-exclusive license.
i) I further promise to inform any person to whom I may hereafter assign or license my
copyright in my thesis of the rights granted by me to my University in this non-
exclusive license.
j) I am aware of and agree to accept the conditions and regulations of PhD including all
policy matters related to authorship and plagiarism.
Signature of the Research Scholar:
Name of Research Scholar: Avni Tejas Patel
Date: Place: Ahmedabad Signature of Supervisor:
Name of Supervisor: Dr. Satendra Kumar
Date: Place: CKSVIM, Vadodara
Seal:

ix
Thesis Approval Form The viva-voce of the PhD Thesis submitted by Smt. Avni Tejas
Patel (Enrollment No. 129990992002) entitled “A Study of Awareness, Attitude and
Factors influencing Personal Financial Planning for Residents of Gujarat” was
conducted on………………… at Gujarat Technological University.
(Please tick any one of the following option)
The performance of the candidate was satisfactory. We recommend that he/she be
awarded the PhD degree.
Any further modifications in research work recommended by the panel after 3
months from the date of first viva-voce upon request of the Supervisor or request of
Independent Research Scholar after which viva-voce can be re-conducted by the
same panel again.
(briefly specify the modifications suggested by the panel)
The performance of the candidate was unsatisfactory. We recommend that he/she
should not be awarded the PhD degree.
(The panel must give justifications for rejecting the research work)
----------------------------------------------------- ----------------------------------------------------- Name and Signature of Supervisor with Seal 1) (External Examiner 1) Name and Signature
------------------------------------------------------- ------------------------------------------------------- 2) (External Examiner 2) Name and Signature 3) (External Examiner 3) Name and Signature

x
ABSTRACT
Purpose
Post Liberalization India has undergone many socioeconomic changes. Increase in per
capita income, increase in life span of an average person, changing social structure from
joint family to nuclear ones and lack of robust social security system; ask for a change in
management of personal finance of an individual. According to latest surveys and recent
researches suggest that Indians are good at savings, but then they save only in traditional
investment avenues with minimum risk. Awareness and preferences for new age
investment avenues are too less amongst Indians. As financial well-being of any individual
depends upon how well they manage their personal finance, to assess the overall
awareness of Personal Financial Planning and its components has prime importance. The
study has tried to assess the financial literacy awareness and attitude towards Personal
Financial Planning of the residents of Gujarat.
Research Methodology
Descriptive research was conducted to study the respondent‘s awareness and attitude
towards Personal Financial Planning in state of Gujarat. Secondary data which was
collected from various books, Journals, websites, articles laid foundation for the study.
Primary data was collected with quota sampling technique. 600 salaried employees from
four major cities of Gujarat: Ahmedabad, Baroda, Rajkot, Surat were selected. 600 salaried
employees were further bifurcated as 200 Government Employees, 200 Pvt. Sector and
200 Public Sector employees. Chi Square, Mann Whitney U test, Kruskal Wallis, Factor
Analysis and Structural Equation Modeling technique have been used to analyze the data.
Findings
Present study has tried to assess the financial literacy of the respondents of Gujarat. For
that, respondents were asked eight questions based on financial numeracy and concepts.
Results suggest that respondents possess fair financial literacy. Respondents are aware

xi
about all traditional Investment Avenues. Awareness Related to Non-Conventional
Avenues like derivatives, Money Market etc. is less. Attitude towards Overall PFP is
Positive. Awareness for Retirement Planning & Estate Planning is little low and
respondents possess little negative attitude towards them. Respondents feel that their
Personal Financial Plan is not balanced and they require expert to manage the same.
Implications
There are very few studies done in the area of comprehensive Personal Financial Planning
in India and especially in the state of Gujarat. This study will help individual to better
understand process and components of PFP. Apart from them it will help financial
institutions, Financial Planners and Investment Advisors to understand the attitude of their
customers and help them in a better manner. The study has created base for the future
detailed study to be done in the area of PFP.
Research Limitations and Future Scope of the Study
The study is limited to 600 salaried employees of state of Gujarat; further study can be
extended towards other state too. Further research can be carried out on businessmen and
professionals also. The present study has focused on awareness and attitude as independent
components. Further model showing linkages between Financial Awareness, Attitude,
Behavior and Financial Well-being can be established.

xii
ACKNOWLEDGEMENT
At the outset, I would like to express my heartfelt gratitude towards my guide and mentor
Professor (Dr.) Satendra Kumar, Professor and Head, Research Center, C K Shah
Vijapurwala Institute of Management, Vadodara for guiding me throughout the journey of
the doctoral research. He has been the continuous source of motivation and inspiration.
Thank you will be the very small word against the knowledge and compassion he
bestowed throughout.
I also like to express my deepest gratitude towards the DPC Members, Dr. P.G.K.
Murthy, Dean, PhD Program, Faculty of Management, Parul University, Vadodara & Dr.
Dhaval Maheta, Department of Business & Industrial Management, VNSGU, Surat for
their constant guidance throughout all the DPC and Research Weeks. Their feedback and
endless support helped me to work much better.
I will like to express my sincere gratitude towards Dr. Hitesh Ruparel, Director General,
GLS University and Dean, Faculty of Management, GLS University for providing all the
support and encouragement to complete my study on time.
Next, I will like to thank Dr. Rajesh Khajuria and entire team of C K Shah
Vijapurwala Institute of Management, Vadodara for conducting all my DPC and
provided me all the support and resources required during all these years. I will also like to
extend the thanks towards entire team of Gujarat Technological University for all their
support.
Again I like to mention the special thanks to Dr. Dhaval Maheta & Dr. Hitesh Parmar
for helping me understand technical concepts of Statistical Analysis through the
workshops they have conducted and assisted me whenever I required.
I will like to thank few people from the industry, who helped me to prepare my
questionnaire and collecting primary data. My sincere thanks goes to Mr. Jagat Parikh,
Mrs. Parul Shah & Ms. Khushma Kanuga, Director, KGMS Broking & Research (P)
Ltd. Who had been my mentors during my corporate life and have laid the foundation for
my research work in the area of Financial Planning.

xiii
Journey of this research would not have been possible without the blessings and endless
support of my family members. I will like to express my gratitude towards My loving
Parents for all their efforts and encouragement they have given throughout my life.
Thank you Mom & Dad for encouraging me and providing endless support.
Tejas, My husband, who always stood by me, for everything I need. One who always tried
to come up with the solution of any problem I faced throughout this tenure. A thank you
will be the very small word for him. He has been continuous source of motivation for me.
Special love to my adorable daughter Jiya, for all the maturity she demonstrated through
the tenure.
Lastly, I thank Almighty God and Guruji for being with me all the time and guiding me
with their divine light.
Avni Patel
Research Scholar
Gujarat Technological University

xiv
Table of Contents
DECLARATION ......................................................................................................................... ii
ABSTRACT.................................................................................................................................. x
ACKNOWLEDGEMENT ...........................................................................................................xii
List of Abbreviations ................................................................................................................xviii
List of Figures ............................................................................................................................. xx
List of Tables ............................................................................................................................. xxi
List of Appendices .................................................................................................................... xxiv
CHAPTER - 1 .............................................................................................................................. 1
INTRODUCTION ....................................................................................................................... 1
1.1 Definition of Personal Financial Planning ....................................................................... 1
1.2 Need for Personal Financial Planning ............................................................................. 1
1.3 Components of Personal Financial Plan (PFP) ................................................................. 3
1.4 Process of PFP ............................................................................................................... 3
1.5 Definitions and Concept of Financial Literacy ................................................................ 4
1.6 Need of Financial Literacy ............................................................................................. 4
1.7 Approaches to Calculate Financial Literacy .................................................................... 5
1.8 Rationale of the Study .................................................................................................... 6
1.9 Organization of Thesis ................................................................................................... 6
1.10 Personal Financial Planning Process ............................................................................... 9
1.11 Components of PFP in details ....................................................................................... 10
1.11.1Money Management ................................................................................................... 10
1.11.2 Insurance Planning .................................................................................................... 11
1.11.3 Investment Planning .................................................................................................. 14
1.11.4 Retirement Planning .................................................................................................. 24
1.11.5 Estate Planning.......................................................................................................... 26
1.12 Financial Planning Strategies based on Life Cycle Stage ................................................ 27
CHAPTER - 2 ............................................................................................................................ 30
Literature Review ...................................................................................................................... 30
2.1 Prelude .............................................................................................................................. 30
2.2 Literature Review – Financial Literacy & Overall Personal Financial Planning ................. 30
2.2.1 Importance of Financial Literacy and Financial Planning ............................................. 30

xv
2.2.2 Researches done on Financial Literacy and Financial Planning across the world .......... 32
2.2.3 Researches done in India ............................................................................................. 41
2.3 Literature Review Related to various Components of Personal Financial Planning ........... 47
2.3.1 Money Management ................................................................................................... 47
2.3.2 Investment Management ............................................................................................. 48
2.3.3 Mutual Funds ............................................................................................................. 50
2.3.4 Insurance.................................................................................................................... 51
2.3.5 Retirement & Estate Planning ..................................................................................... 53
2.4 Research Gap ................................................................................................................... 56
Chapter 3 ................................................................................................................................... 57
Research Methodology .............................................................................................................. 57
3.1 A Brief Overview .............................................................................................................. 57
3.2 Objectives of the Study ...................................................................................................... 57
3.3 Research Questions ............................................................................................................ 57
3.4 Research Hypotheses ......................................................................................................... 58
3.5 Scope of the Study ............................................................................................................. 60
3.6 Research Design ................................................................................................................ 60
3.7 Sample Design ................................................................................................................... 61
3.7.1 Sampling unit .............................................................................................................. 61
3.7.2 Sampling Technique .................................................................................................... 61
3.7.3 The Sample size .......................................................................................................... 61
3.8 Data Sources ...................................................................................................................... 62
3.8.1 Secondary Data ........................................................................................................... 62
3.8.2 Primary Data ............................................................................................................... 62
3.9 Planning of Data Collection ............................................................................................... 62
3.10 Overview of Variables, Scaling Technique and Data collection Instrument – Structured
Questionnaire .......................................................................................................................... 63
3.10.1 Variables Identified for the study ............................................................................... 63
3.10.2 Overview of Questionnaire ........................................................................................ 64
3.10.3 Details of the Pilot Study ........................................................................................... 65
3.10.4 Reliability Test .......................................................................................................... 65
3.11 Various Statistical Tests and Tools Used .......................................................................... 65
CHAPTER - 4 ............................................................................................................................ 67
Analysis & Interpretation ......................................................................................................... 67
4.1 Introduction ....................................................................................................................... 67
4.2. Demographic Profile of the respondents ............................................................................ 67
xvi
4.2.1. Location ..................................................................................................................... 67
4.2.2. Job Type .................................................................................................................... 68
4.2.3. Age ............................................................................................................................ 68
4.2.4. Gender ....................................................................................................................... 69
4.2.5. Education ................................................................................................................... 70
4.2.6. Experience ................................................................................................................. 71
4.2.7. Income ....................................................................................................................... 72
4.2.8. Marital Status ............................................................................................................. 73
4.2.9. Savings ...................................................................................................................... 74
4.3 Financial Literacy .............................................................................................................. 76
4.3.1. Frequency Analysis .................................................................................................... 76
4.3.2. Non Parametric Tests: Chi-Square Test ...................................................................... 81
4.4 Awareness- level for various Investment Avenues ............................................................. 88
4.4.1 Frequency Analysis ..................................................................................................... 88
4.4.2 Inferential Statistics Pertaining to Awareness of Different Investment Avenues .......... 95
4.5 Attitude towards Personal Financial Planning................................................................... 117
4.6 Factor Analysis – I ........................................................................................................... 123
4.7 Factor Analysis - II – Overall Financial Planning ............................................................. 131
4.8 Confirmatory Factor Analysis - I ................................................................................ 135
4.9 Confirmatory Factor Analysis – II .............................................................................. 141
4.10 Structural Equation Modeling..................................................................................... 145
4.10.1 The Base Model ...................................................................................................... 145
4.10.2 First Modification (e47↔ e48) ................................................................................ 152
4.11 Association between Different Demographic Factors and Attitude of Personal Financial
Planning. ............................................................................................................................... 154
4.12 Linkages between Financial Literacy and Awareness related to different Investment
Avenues. ............................................................................................................................... 170
CHAPTER – 5 ......................................................................................................................... 173
Findings & Discussions............................................................................................................ 173
5.1 Introduction ..................................................................................................................... 173
5.2 General Findings.............................................................................................................. 173
5.3 Findings related to Financial Literacy .............................................................................. 174
5.3.1 Association between different demographic factors and financial literacy .................. 175
5.4 Findings related to Awareness of different Investment Avenues ....................................... 177
5.4.1 Inferential Statistics Pertaining to Awareness of Different Investment Avenues ......... 178
5.5 Findings related to Attitude and Factors Influencing PFP ................................................. 180

xvii
5.5.1 Inferential Statistics with regards to Attitude towards PFP ......................................... 182
CHAPTER - 6 .......................................................................................................................... 189
Conclusion & Scope of Future Research ................................................................................ 189
6.1 Conclusion....................................................................................................................... 189
6.2 Limitations of the Study ................................................................................................... 190
6.3 Implications of the Study ................................................................................................. 190
6.4 Scope of the Future Research ........................................................................................... 191
List of References...................................................................................................................... 192
APPENDIX A ........................................................................................................................... 203
Copy of Questionnaire ............................................................................................................... 203
APPENDIX B ........................................................................................................................... 208
List of Publications .................................................................................................................... 208

xviii
List of Abbreviations
CFA Confirmatory Factor Analysis
CSO Central Statistics Office
ELSS Equity Linked Saving Schemes
EFA Exploratory Factor Analysis
EPF Employee Provident Fund
ETF Exchange Traded Funds
FD Fixed Deposits
FMP Fixed Maturity Plans
F & O Futures & Options
GDP Gross Domestic Product
G- Sec Government Securities
KVP Kisan Vikas Patra
MCX Multi Commodity Exchange of India Ltd.
MF Mutual Funds
MIP Monthly Income Plans
MMMF Money Market Mutual Funds
NCA Non Conventional Avenues
NCD Non Convertible Debentures
NCDEX National Commodity & Derivatives Exchange Ltd.
NPS National Pension System
NSC National Savings Certificate
PACFL Presidents Advisory Council on Financial Literacy
PFP Personal Financial Planning
PFRDA Pension Fund Regulatory and Development Authority

xix
PPF Public Provident Fund
RBI Reserve Bank of India
SEBI Securities and Exchange Board of India
SEM Structural Equation Modeling
ULIP Unit Linked Insurance Plan

xx
List of Figures
FIGURE 2. 1 - Possible Causes of Financial Behaviour ............................................................... 32
FIGURE 2. 2 - Research Model on Financial Literacy ................................................................. 38
FIGURE 4. 1 - Age of the Respondents ....................................................................................... 69
FIGURE 4. 2 - Gender of the respondents .................................................................................... 70
FIGURE 4. 3 - Education of the Respondents .............................................................................. 71
FIGURE 4. 4 – Experience of the respondents ............................................................................. 72
FIGURE 4. 5 – Income of the respondents ................................................................................... 73
FIGURE 4. 6 – Marital Status of the respondents ......................................................................... 74
FIGURE 4. 7 – Savings of the respondents .................................................................................. 75
FIGURE 4. 8 - Scree Plot ......................................................................................................... 126
FIGURE 4. 9 - Scree Plot a ....................................................................................................... 132
FIGURE 4. 10 – Factor Model ................................................................................................... 136
FIGURE 4. 11 – Factor Model a ................................................................................................. 141
FIGURE 4. 12 – SEM Base Model ............................................................................................ 145
FIGURE 4. 13 – SEM Modified Model ..................................................................................... 152
FIGURE 5. 1 – Association between Demographic Factors and Financial Literacy .................... 177

xxi
List of Tables
TABLE 1. 1 - Financial Planning Strategies Based on Life Cycle Stage ..................................... 29
TABLE 3. 1 – Sample Profile ...................................................................................................... 62
TABLE 4. 1 - Location of the respondents ................................................................................... 68
TABLE 4. 2 - Job Type of the respondents .................................................................................. 68
TABLE 4. 3 - Age of the respondents .......................................................................................... 69
TABLE 4. 4 – Gender of the respondents..................................................................................... 69
TABLE 4. 5 - Education of the respondents ................................................................................. 70
TABLE 4. 6 – Experience of the respondents ............................................................................... 71
TABLE 4. 7 – Income of the respondents .................................................................................... 72
TABLE 4. 8 – Marital Status of the respondents .......................................................................... 73
TABLE 4. 9 – Savings of the respondents .................................................................................... 74
TABLE 4. 10 – Literacy for Savings Bank Account ..................................................................... 76
TABLE 4. 11 – Literacy regarding concept of Inflation ............................................................... 77
TABLE 4. 12 – Literacy regarding concept of Time Value of Money........................................... 77
TABLE 4. 13 – Literacy regarding concept of Diversifications .................................................... 77
TABLE 4. 14 – Literacy regarding basics of Financial Planning .................................................. 78
TABLE 4. 15 – Literacy regarding basics of Risk & Returns Relationships .................................. 78
TABLE 4. 16 – Literacy regarding relationship of Bond Price & Interest Rates............................ 79
TABLE 4. 17 – Literacy regarding returns generated by financial assets in long run..................... 79
TABLE 4. 18 – Overall summary for Financial Literacy .............................................................. 80
TABLE 4. 19 – Financial Literacy of Respondents ...................................................................... 81
TABLE 4. 20 – Cross Tabulation - Age and Financial Literacy of the Respondent ....................... 81
TABLE 4. 21 - Chi-Square Tests – Age and Financial Literacy of the Respondent ....................... 82
TABLE 4. 22 – Cross Tabulation - Gender and Financial Literacy of the Respondent .................. 82
TABLE 4. 23 - Chi-Square Tests – Gender and Financial Literacy of the Respondent .................. 82
TABLE 4. 24 – Cross Tabulation - Education and Financial Literacy of the Respondent .............. 83
TABLE 4. 25 - Chi-Square Tests – Education and Financial Literacy of the Respondent .............. 83
TABLE 4. 26 – Cross Tabulation - Experience and Financial Literacy of the Respondent ............ 84
TABLE 4. 27 - Chi-Square Tests – Experience and Financial Literacy of the Respondent ........... 84
TABLE 4. 28 – Cross Tabulation – Job Type and Financial Literacy of the Respondent............... 85
TABLE 4. 29 - Chi-Square Tests – Job Type and Financial Literacy of the Respondent ............... 85
TABLE 4. 30 – Cross Tabulation - Income and Financial Literacy of the Respondent .................. 86
TABLE 4. 31 - Chi-Square Tests – Income and Financial Literacy of the Respondent .................. 86
TABLE 4. 32 – Cross Tabulation – Marital Status and Financial Literacy of the Respondent ....... 87
TABLE 4. 33 - Chi-Square Tests – Marital Status and Financial Literacy of the Respondent ........ 87
TABLE 4. 34 – Cross Tabulation - Location and Financial Literacy of the Respondent ................ 88
TABLE 4. 35 - Chi-Square Tests – Location and Financial Literacy of the Respondent ................ 88
TABLE 4. 36 - Awareness of Savings Account ............................................................................ 89
TABLE 4. 37 - Awareness of Fixed Deposit ............................................................................... 89

xxii
TABLE 4. 38 - Awareness of Equity Shares ............................................................................... 90
TABLE 4. 39 - Awareness of Bonds ........................................................................................... 90
TABLE 4. 40 - Awareness of Derivatives .................................................................................... 90
TABLE 4. 41 - Awareness of Mutual Funds ................................................................................ 91
TABLE 4. 42 - Awareness of PPF .............................................................................................. 91
TABLE 4. 43 - Awareness of Other Post Office Schemes ............................................................ 92
TABLE 4. 44 - Awareness of Life Insurance ............................................................................... 92
TABLE 4. 45 - Awareness of Money Market ............................................................................... 93
TABLE 4. 46 - Awareness of Tax Saving Scheme ....................................................................... 93
TABLE 4. 47 - Awareness of Real Estate .................................................................................... 94
TABLE 4. 48 - Awareness of Non-Conventional Avenues ........................................................... 94
TABLE 4. 49 - Descriptive Statistics for Awareness of Financial Products .................................. 95
TABLE 4. 50 - Mann-Whitney U test – Gender and Awareness of Investment Avenues............... 96
TABLE 4. 51 – Mean Rank of Awareness with Age of the respondents ....................................... 97
TABLE 4. 52 – Test Statisticsa,b - Kruskal Wallis Test – Awareness Different Investment Avenues
among Age of the respondents ..................................................................................................... 99
TABLE 4. 53 – Mean Rank of Awareness with Education of the respondents ............................ 100
TABLE 4. 54 – Test Statisticsa,b - Kruskal Wallis Test – Awareness Different Investment Avenues
among Education of the respondents. ......................................................................................... 101
TABLE 4. 55 – Mean Rank of Awareness with Job Type of the respondents.............................. 102
TABLE 4. 56: Test Statisticsa,b - Kruskal Wallis Test – Awareness Different Investment
Avenues among Job Type of the respondents. ........................................................................... 104
TABLE 4. 57 – Mean Rank of Awareness with Experience of the respondents .......................... 105
TABLE 4. 58 : Test Statisticsa,b - Kruskal Wallis Test – Awareness Different Investment Avenues
among Experience of the respondents. ....................................................................................... 107
TABLE 4. 59 – Mean Rank of Awareness with Income of the respondents ................................ 108
TABLE 4. 60 – Test Statisticsa,b - Kruskal Wallis Test – Awareness Different Investment Avenues
among Income of the respondents. ............................................................................................. 109
TABLE 4. 61 – Mean Rank of Awareness with Marital Status of the respondents ...................... 110
TABLE 4. 62 – Test Statisticsa,b - Kruskal Wallis Test – Awareness Different Investment Avenues
among Marital Status of the respondents. ................................................................................... 112
TABLE 4. 63 – Mean Rank of Awareness with Location of the respondents .............................. 113
TABLE 4. 64 – Test Statisticsa,b - Kruskal Wallis Test – Awareness Different Investment Avenues
among Location of the respondents. ........................................................................................... 115
TABLE 4. 65 - Descriptive Statistics for Attitude of Personal Financial Planning ...................... 117
TABLE 4. 66 - Components wise Attitude regarding PFP .......................................................... 122
TABLE 4. 67 - KMO and Bartlett‘s Test ................................................................................... 123
TABLE 4. 68 - Communalities .................................................................................................. 124
TABLE 4. 69 – Total Variance Explained.................................................................................. 125
TABLE 4. 70- – Component Matrix .......................................................................................... 127
TABLE 4. 71 - Rotated Component Matrix ............................................................................... 128
TABLE 4. 72 – Labeling of Factors ........................................................................................... 129
TABLE 4. 73 – KMO and Bartlett's Test .................................................................................. 131
TABLE 4. 74 – Communalities.................................................................................................. 131
TABLE 4. 75 – Total Variance Explained ................................................................................. 132
TABLE 4. 76 – Component Matrixa........................................................................................... 133
TABLE 4. 77 – Rotated Component Matrixa .............................................................................. 133
TABLE 4. 78 – Labeling of Factors ........................................................................................... 134
xxiii
TABLE 4. 79 - Standardized Regression Weights: (Group number 1 - Default model) .............. 136
TABLE 4. 80 - Correlations: (Group number 1 - Default model) ................................................ 137
TABLE 4. 81 - Model Fit Indexes ............................................................................................. 138
TABLE 4. 82 - Standardized Regression Weights: (Group number 1 - Default model) ............... 142
TABLE 4. 83 - Correlations: (Group number 1 - Default model) ................................................ 142
TABLE 4. 84 Model Fit Index - 2 .............................................................................................. 142
TABLE 4. 85 - Regression Weights: (Group number 1 - Default model) .................................... 146
TABLE 4. 86 - Standardized Regression Weights: (Group number 1 - Default model) ............... 147
TABLE 4. 87 - Model Fit Index for SEM .................................................................................. 149
TABLE 4. 88 - Model Fit Index for SEM ( First Modification) .................................................. 153
TABLE 4. 89 - Mann-Whitney U test – Gender and Attitude towards PFP ................................. 154
TABLE 4. 90 – Mean Rank of Attitude with Location of the respondents .................................. 155
TABLE 4. 91 – Kruskal Wallis Test – Attitude towards PFP among Location of the respondents
.................................................................................................................................................. 157
TABLE 4. 92 – Mean Rank of Attitude with Age of the respondents.......................................... 157
TABLE 4. 93 – Kruskal Wallis Test – Attitude towards PFP among Age of the respondents ...... 159
TABLE 4. 94 – Mean Rank of Attitude with Education of the respondents ................................ 160
TABLE 4. 95 – Kruskal Wallis Test – Attitude towards PFP among Education of the respondents
.................................................................................................................................................. 161
TABLE 4. 96 – Mean Rank of Attitude with Job Type of the respondents .................................. 162
TABLE 4. 97 – Kruskal Wallis Test – Attitude towards PFP among Job Type of the respondents
.................................................................................................................................................. 163
TABLE 4. 98 – Mean Rank of Attitude with Experience of the respondents ............................... 164
TABLE 4. 99 – Kruskal Wallis Test – Attitude towards PFP among Experience of the respondents
.................................................................................................................................................. 165
TABLE 4. 100 – Mean Rank of Attitude with Income of the respondents................................... 166
TABLE 4. 101 – Kruskal Wallis Test – Attitude towards PFP among Income of the respondents
.................................................................................................................................................. 167
TABLE 4. 102 – Mean Rank of Attitude with Marital Status of the respondents ........................ 168
TABLE 4. 103 – Kruskal Wallis Test – Attitude towards PFP among Marital of the respondents169
TABLE 4. 104 – Mean Rank of Financial Literacy with Awareness of Different Investment
Avenues .................................................................................................................................... 170
TABLE 4. 105 – Kruskal Wallis Test – Financial Literacy with Awareness of Different Investment
Avenues .................................................................................................................................... 171
TABLE 5. 1 - Summary of Major Findings ................................................................................ 184

xxiv
List of Appendices
Appendix A : Questionnaire
Appendix B : List of Publications

1
CHAPTER - 1
INTRODUCTION
1.1 Definition of Personal Financial Planning
―Financial Planning is the process of meeting one‘s life goals through the proper management
of personal finances.‖ ( Kapoor, 2008). Proper Personal Financial Planning leads to Financial
Satisfaction and Well– being. As Every person, family, or household has a unique needs and
financial position , their financial planning must also be carefully planned to meet specific
needs and goals.
According to Hallman and Rosenbloom, Personal Financial Planning is ―The development
and implementation of total coordinated plans for the achievement of one's overall financial
objectives.‖ Individuals and families have many goals or objectives in life to fulfil. For the
same they will have to save, accumulate and grow their money. The common life goals of
individuals are: Education and Marriage of Children, Buying a house and a Comfortable
Retirement. Other short term goals may include funding vacations, purchasing a car and fulfil
debt (home loan, car loan), etc. For achievement of short term or long term goals, proper
management of Personal Finance is essential. Financial Planning is all about managing
finances of an individual or a family. It means Proper Management of Income, Expenses,
Assets, Liabilities, Insurance, Taxation and Estate, so that one can successfully achieve all
their desired goals and enjoy financial well-being and hence financial satisfaction.
1.2 Need for Personal Financial Planning
India, post liberalization has experienced much change in terms of Economic Growth and
Social Structure. Basically, it serves as a base for the need of robust Personal Financial
Planning. Major factors which are relevant and important for the need of Personal Financial
Planning are discussed below.

2
• Longer life span and lack of social security
According to economic survey 2012-13, the average life expectancy which was around 60
years in 1980-81, has increased to 64.6 (for males) and 67.6(for females in 2010-11). People
live longer now as compared to the earlier generations. Few generations ago, someone would
start earning by the time one reached the age of 20 years, work till the age of 58 years and
live till around 65 years. In such a case, one earns for 38 years and lives off the retirement
savings for the next 7 years. In recent times, one starts working at 25 years of age. Retire at
age of 60 years and life span of 80 years. So an individual works and earns for 35 years to
support post retirement life of 20 years. Government of India has withdrawn Pension Plans
for government employees and introduced New Pension Scheme (NPS), which is defined
contribution plan.
• Proliferation of numerous products
Post 1991, after implementation of LPG, many new products and services have been
introduced by the Life Insurance Industry, Banking industry and other NBFCs. New financial
products like Mutual Funds, Derivatives, Commodities, Portfolio Management Schemes,
Non-Convertible Debentures and Unit Linked Insurance Plans have been introduced for the
investors. It is difficult for investors to select financial product to tailor their needs.
• Increasing income and savings levels
Indian Economy has been growing at a 6% - 9% rate of GDP growth driven mainly by
domestic consumption. According to data, average Gross Domestic Saving was Rs.1067.30
Billion in 1980-81 which has increased to 24819.31 in 2010-11 (RBI). Per Capita Personal
Disposable Income was Rs. 23712 in 2004-05 which has increased to Rs. 66281 in 2012-13
(CSO). The educated and urban middle class has experienced increase in income levels. At
the same time, unlike our counterparts in many of the developed countries, Asians, and
especially Indians believe in saving money. India has a considerable household savings ratio
which is more than 25%. Here again investors need guidance to channelize their savings.
• Increasing level of borrowings
In today‘s financial markets, there is an easy access to loans resulting in increased levels of
borrowings by people. If not managed carefully, this may lead to a serious mismatch in
earnings and repayment leading to problems in cash flow. Leveraging the low interest rates is
a critical aspect which needs to be explained to the borrowers.

3
• Inflation
Indians are wise savers but poor investors (Visa 2012). Indians save money into traditional
risk free products like Bank FD, Saving Bank Account, Insurance. This may not be sufficient
to overcome the impact of increase in inflation. Therefore, a well balanced Financial Plan is
required to protect the investors from the impact of inflation.
• Nuclear families & Change in Life Style
Traditional Indian social system of Joint families provided great safety net for most
individuals as it shared the resources and difficulties. Growing urbanisation during the past
decades have led to the birth of nuclear families. These smaller families have a need to plan
better. They can no longer depend on the support of the larger family since they might be
geographically distant. So, one needs a comprehensive financial plan to meet the
contingencies and to attain the short term and long term goals.
1.3 Components of Personal Financial Plan (PFP)
According to Garman and Forgue (1988) & CPFA – NISM (2009), Personal Financial
Plan is the balance of following components:
Planning Personal Finances
Managing Personal Finances
Managing Expenditure
Protecting Income & Assets
Managing Tax Planning
Planning Investments
Retirement Planning
Estate Planning
1.4 Process of PFP
According to Gitman & Joehenk ( 1990) The financial planning process is a logical, six-step
procedure. The steps involved are listed below:
determining your current financial situation
developing financial goals

4
identifying alternative courses of action
evaluating alternatives
creating and implementing a financial action plan, and
re-evaluating and revising the plan.
1.5 Definitions and Concept of Financial Literacy
Various researchers and organizations have provided different definitions of financial
literacy. Some of the definitions are discussed here. Financial Literacy is a combination of
awareness, knowledge, skill, attitude and behaviour necessary to make sound financial
decisions and ultimately achieve individual financial well-being. (OECD INFE, 2011).
Financial Literacy is concerned with the understandings of basic financial concepts,
principles, skills and ability to understand key financial products to make good financial
choices. (Jariwala H., 2013). According to PACFL, ―Financial Literacy is the ability to use
knowledge and skills to manage financial resources effectively for a lifetime of financial
well-being‖. Lusardi & Mitchell (2007) have defined it as the most basic economic concepts
needed to make sensible savings and investment decisions. ANZ Bank (2008) has defined it
as the ability to make informed judgements and to take effective decisions regarding the use
and management of money.
1.6 Need of Financial Literacy
Need of financial literacy is increasing significantly with deregulation and globalization of
financial markets. More choices are available for investment avenues with easy access to
credit cards and personal loan. According to one survey ―Indians are wise saver but poor
investors.‖ Saving rate in the country is increasing year by year and on the other hand
increase in spending on consumption and change of life style have led to increase in personal
and household debt levels. Countries like India with almost nil social security system
provided by government, corpus saved by investors are not sufficient enough to meet the
expenses and maintain same life style post retirement. The one reason for the same is, though
there are many diversified options available for investors to invest their money, Indian
investors still prefer safe options like Bank FD, Post office schemes. Returns generated by
these instruments do not beat the increasing rate of inflation. So investors‘ financial well-
being is hampered. So it is required that investors should not only be aware about financial

5
market and its different components and be more informed about economic variables
impacting their financial decisions, they should be able to plan their finances carefully,
keeping into mind their own financial goals and objectives. Beal and Delpachitra (2003) had
stated that, ―the need for financial literacy has grown rapidly over the last decade because
financial markets have been deregulated and credit has become easier to obtain, as financial
institutions compete strongly with each other for market share.‖ Financial literacy is
important because well informed, well-educated consumers should make better decisions for
their families; increase their economic security and well-being; contribute to vital thriving
communities; and foster community economic development‖.(Hogarth, 2002)
1.7 Approaches to Calculate Financial Literacy
As discussed, financial literacy is associated with financial well-being and financial
satisfaction of an individual. Increase in Financial Literacy will help investors to make
informed choices, which, in turn, helps nation to build strong financial system and will help
to achieve goal of Financial Inclusion. Many government bodies like SEBI & RBI has
realized the value of financial literacy and to increase that, they have started various financial
education programmes. To design the program for investors, one really needs to know what is
the current level of financial literacy that investors possess and then course can be designed
to suit their literacy level.
There are different methods adopted by researchers and certain organizations to measure the
current level of financial literacy of the investors. Definitions on Financial Literacy provided
by different researchers serve as the basis for items to be included in research instrument to
measure the financial literacy. Some researchers have developed the scale for Self-
Assessment of Respondents and some have given performance test. Basic items covered in
different researches are Time value of Money, Calculation of Interest Rate, Relation between
Risk & Return, Inflation, Diversification etc.
Scale used in the present study is adopted from Lusardi & Mitschell ( 2008) and modified
according to Indian context.
6
1.8 Rationale of the Study
Financial well-being of the individual depends upon Financial Attitude and Financial
Behavior which, in turn, depends upon Financial Literacy of an Individual. Many researches
have been done in area of Financial Literacy and some of the aspects of investment decision
making in India, but there is no comprehensive study so far that deals in the overall personal
financial planning aspects of the individual decision making process and/or which has
attempted to measure the awareness of overall personal financial plan, attitude of the
respondents for the same and factors influencing personal financial planning of an Individual.
The present study attempts to fill this gap in the current research.
1.9 Organization of Thesis
Chapter – 1 Introduction
The chapter is divided in two major sections. First Section introduces concept of Financial
Planning, Process of Financial Planning, Overview of Components of Financial Plan, and
Financial Literacy. Second section gives details on different components of Personal
Financial Plan.
Chapter – 2 Literature Review
The chapter discusses various research studies reported in Journals, periodicals, thesis on
Financial Literacy and Financial Plan, need for the same and literature related to various
components of Personal Financial Planning. After reviewing these research studies, the
research gap was identified at the end of this Chapter.
Chapter - 3 Research Methodology
The chapter discusses the research methodology adopted for the present study, which
includes objectives of the study, hypotheses, scope, research design, sampling plan, overview
of questionnaire, pilot test, sources of the data, and data analysis tools & techniques.
Chapter – 4 Analysis & Interpretation
The Chapter discusses various tools and test applied on data to obtain the objectives of the
research. It discusses descriptive statistics as well as inferential statistics.

7
Chapter – 5 Findings
The Chapter discusses overall study and highlights the major findings which have been
derived from the analysis of data.
Chapter – 6 Conclusions, Major Contribution and Scope for the Future Research
The chapter discusses overall conclusion of the study, beneficiaries and contribution of the
study. It also discusses limitation of the present study and provides scope for the future
research work.

8
Part – II
Personal Financial Planning

9
1.10 Personal Financial Planning Process
Personal Financial Planning is the management of Personal Finance of Households. It
includes management of Debt, i.e., Personal Loan, Credit Card etc., Money Management,
maintaining liquidity for emergency; obtain short term & long term goals through proper
investments (keeping into mind the taxation, i.e., Tax Planning), managing risk of life with
Insurance, Planning for safe/comfortable retirement and proper planning of transference of
one‘s assets after the death. Steps for Personal Financial Planning are listed below:
(1) Determine your current financial position.
(2) Identify financial goals.
(3) Evaluate all the alternatives available.
(4) Create financial plan and make it into action.
(5) Revaluate it periodically and revise, if necessary.
Step 1: Determine Your Current Financial Position
This step includes preparing a personal financial budget. One will list down all their income
and expenses, savings, investments and debts. This will create a base to prepare your
financial plan.
Step 2: Identify financial goals
Next step involves identifying financial goals of the life. One should remember that goals
should be realistic and quantifiable in terms of money. Also attach timelines to the goals.
Some of the major and minor goals in an individual‘s life are listed below.
Major Long Term Goals in Life can be
• Children‘s Education, Children‘s Marriage, Purchasing a House, An Independent
Retirement
Short Term Goals in Life can be
• Vacations, Purchasing a Car, Purchasing electronic gadgets, paying off the loans.
Step 3: Evaluate all the alternatives available
Taking into consideration one‘s current financial position and objectives to attain; one needs
to decide the allocation of money in to various alternatives available. There are different

10
investment vehicles available in Indian Capital Market, like equity shares, FD, Bonds, Mutual
Funds, Futures & Options, etc. One can choose the investment vehicle according to once
objective, tenure of investment and risk profile of the individual. One should also consider
opportunity cost of selecting a particular alternative. Opportunity cost is what you give up by
making another choice.
Step 4: Create financial plan and make it into action
Next step is to prepare a written Financial Plan. Here, the allocation of money will have to be
spelled and written clearly. To implement financial plan, one can take help of Investment
brokers, agents or certified financial planners to purchase stocks, mutual funds, insurance etc.
Step 5: Revaluate it periodically and revise, if necessary
Financial planning is a dynamic process that does not end when you take a particular action.
One need to regularly assess their plan and check whether it is aligned with objectives or not.
Changing personal, social, and economic factors may require more frequent assessments.
1.11 Components of PFP in details
1.11.1 Money Management
Money management is the day-to-day financial activities needed to manage personal
economic resources, while working toward long-term financial security.(Kapoor J., 2008).
Money Management includes:
Storing and maintaining personal financial records and documents.
One can prepare home file. In that, one can maintain the records which are often
required and can be referred when needed. For example, employment records, tax
returns, financial services records, investment statements, copy of insurance policies,
bills of consumer purchase, statement of loans etc. Some documents can be kept at
Safe deposit lockers, e.g., Birth Certificate, Marriage Certificate, Mortgage Papers,
Wills, Insurance policy, Certificate of investments. One can also keep computerized
records of personal budget, bank statements, investment statements, tax returns, etc.
Creating a personal balanced sheet and cash flow statements
Personal balanced sheet will include: List of Assets one has, like, liquid assets, real
estate, investment assets; Liabilities one has, like, Personal loans, credit card, debts,

11
Home loans etc. Net worth is difference of one‘s assets and liabilities. Personal
balanced sheet determines your current financial position. Cash flow statements will
record inflow of income through various sources like salary, dividends etc. and
outflow of income like fixed and variable expenses.
Creating a personal budget
Budget is a plan for spending in the future, such as for the next month, next quarter or
next year. Budgeting helps a person to live within their income, reach their financial
goals, prepare for financial emergencies, and develop positive attitude towards
financial management. Effective budget will help one to achieve their financial goals.
Steps to prepare personal financial budget:
1. One can list all their future financial goals.
2. Estimate Income from all the sources.
3. Calculate the amount required for emergency purpose, periodic expenses and
financial goals.
4. Calculate the amount required for fixed expenses like home loan installments and
variable expenses like normal household expenses.
5. Set budget for savings.
6. Compare budgeted amount of inflow and outflow with actual amount, and
determine variance. Take necessary corrective actions in spending pattern to
reduce the variance.
1.11.2 Insurance Planning
Insurance Planning is determining the amount of insurance cover required by the individual
to cover the risk associated with one‘s life, medical emergencies and assets.
In case of pre-mature death of the primary earner of the family, the family‘s income will stop.
In that case, the family will need some source of money which can generate income to cover
the expenses and liabilities for the rest of their life. One can purchase Life Insurance policy to
protect their family in the event of death of primary earner. One need to calculate amount
required for Insurance Coverage.

12
One can take up health insurance popularly known as Mediclaim to meet with medical
emergency. Assets like house, automobiles and other assets can be protected under Property
Insurance. Health & Property Insurance are covered under General Insurance.
Different Types of Life Insurance Products
1.11.2.1 Endowment Plan
It is a policy with a savings feature. At maturity or in case of death of policy holder, a lump
sum amount is paid equal to the sum assured and bonuses. It is considered as more expensive
than whole life or term plan. One can choose the term from 5 to 30 years. Endowment
insurance is a popular policy, which provides protection to self and family. It also acts as a
good tool for retirement planning.
1.11.2.2 Whole Life insurance
It is designed to provide life insurance cover for the entire life of the insured. Insured person
pay the premium throughout the lifetime. Generally premium amount remains the same
throughout the tenure. It is generally used when the need of the life insurance is life- long.
The benefits of whole life policies are guaranteed death benefits, fixed annual premiums. The
drawback of the same is that, the internal rate of return generated by the policy may not be
competitive with other investment options available.
1.11.2.3 Money Back Insurance
Under this policy certain percentage of sum assured is returned to policy holder on regular
interval. At the maturity the remaining amount is paid as the maturity amount. It is a savings
plan with the added advantage of life cover and regular cash inflow.
1.11.2.4 Children’s Plans
Children‘s plans are taken on life of parents for benefit of children. It ensures that, in case of
death of the parents, the child gets the sum assured and the insurance company may fund
future premiums so that the child can get the value accumulated at the end of the term.
Children‘s plans are suitable for passing on a financial asset to a child.

13
1.11.2.5 Pension Plans
Pension Plans or annuities are Plans used for Retirement benefits. An individual can invest as
a lump sum amount or periodical amount till age of retirement. Maturity amount can be taken
as a monthly payment (annuity) from the accumulated funds. One can also withdraw one
third of total accumulated amount once the person has retired. There are two types of
Annuities: Immediate and Deferred. In Immediate Annuity Plan, one pays premium in Lump
sum mode and retirement benefits starts soon after the retirement. In Deferred Annuity
Policy, insurer regularly pays premiums to Insurance Company till the vesting age or date.
Annuity starts after the age of retirement.
1.11.2.6 ULIP
It is a combination of investment and insurance. Corpus of ULIP is invested in a basket of
market linked securities. The major advantages of market-linked plans are that they leave the
asset allocation decision in the hands of investors themselves. They are in control of how to
distribute the funds among the broad class of instruments. ULIPs are little expensive than
pure term plans or endowment plans. There are charges like Premium Allocation charges,
fund management charge, policy administration charge, and mortality charge etc. which are
levied to insurers. One should consider their own risk appetite, tenure for investment before
purchasing ULIP plan.
1.11.2.7 Term Insurance
Term insurance is an insurance product, which covers only risk there is no element of
investment associated with it. It pays the sum assured only when the policy holder dies during
the period for which is determined. Term insurance is the cheapest form of life insurance.
Term life insurance provides for life insurance coverage for a specified term of years for a
specified premium. If insurer survives the tenure then he receives nothing.
Different Types of Non-Life Insurance Products
1.11.2.8 Property
Insuring property means insurance of buildings, machinery, stocks etc. against risks to fire,
theft etc. It covers the protection of building against natural and man-made disasters.

14
Property insurance covers Fire Insurance, Burglary Insurance, and Marine Insurance etc.
Things which are not covered in property insurance are wilful destruction of property,
damage due to wear and tear and Art and antiques.
1.11.2.9 Health – Medi-claim policy
Health insurance / Medi-claim protect insurer and their family members against any financial
contingency arising due to a medical emergency. This policy provides for reimbursement
(Many policy have cashless options also these days) of hospitalisation/ domiciliary treatment
expenses for illness/ disease or accidental injury. Medical expenses incurred during period of
30 days prior to and period of 60 days after hospitalisation are covered. Normal exclusions
include all diseases/ injuries which are pre-existing at the time of taking the cover. There are
many variants and riders available on simple health insurance plan. Facility like group health
insurance and family floaters are also available, which cover the group of employees and all
the family members respectively.
1.11.2.10 Motor Insurance
Under this Insurance, the company indemnifies the insured in the event of accident caused by
or arising out of the use of the motor vehicle anywhere in India against all sums including
claimant‘s cost and expenses which the insured shall become legally liable to pay in respect
of (i) death or bodily injury to any person, (ii) damage to the property other than property
belonging to the insured or held in trust or custody or control of the insured. The insurance of
motor vehicles against damage is not made compulsory but the insurance of third party
liability arising out of the use of motor vehicles in public places is made compulsory.
1.11.3 Investment Planning
Investment Planning defines optimum asset allocation of funds based on risk appetite,
financial objectives and time horizon of investor. Plethora of investment options are
available today to park surplus money. There are many different financial products available
under different asset class; one should carefully choose the Financial Products so that they
can achieve their financial goals within stipulated time. Things to be considered while
choosing the investment products are discussed below:

15
Returns generated by the product
The Rate of return generated by the investment product can be in the form of capital gains, or
regular cash flows, or both. A retired person may be more interested in regular cash flows to
cater for his day to day needs, where as a younger person in accumulation phase may be more
concerned with growth of his investment for creating a corpus for his retirement.
Capital Protection
Protecting the capital is the important criteria while selecting an investment avenue. Each
investment avenue has risk and return associated with it. Risk and Return goes hand in hand.
Higher the risk, more is the expected return . One must understand risk and return associated
with any product before investing his money in any of the investment products.
Inflation
Inflation is the rise in general price levels of goods and services in an economy over a period
of time. Inflation erodes purchasing power of money. The objective of investment is to get
returns in order to increase the value of the money. Investment product should be able to beat
inflation.
Taxation
Return generated from investment assets is liable to taxation. The real return from any
investment product would be the return after taxation.
Liquidity
Liquidity is the ability to convert an investment product into cash quickly. The amount
needed for any emergency should be invested in instruments having higher liquidity.
Different Investment Avenues
Investment Avenues can be classified as Financial Assets and Non- Financial Assets.
Financial Assets
Financial Assets can further be classified into Cash instruments, Equity Instruments and Debt
Instruments.
Cash Instruments
Money in the Cash is the most Liquid asset available. But the cash in hand can‘t generate any
return so over a period of time because of inflation value of money can be eroded. One can
keep money in cash form for the purpose of emergency expenses. On an average three to six
months of our average monthly expenses should be kept in cash instruments.
Various cash instruments could be:

16
i) Cash in Hand
ii) Cash in Bank
Debt Instruments
Investing money in debt instrument is like one lends their money. One may get stipulated
interest periodically on the capital invested. The capital is returned after the designated
period. Capital is relatively protected than equity instruments; returns are normally lower
than equity. Different debt instruments are: Small Saving Schemes, Government and
Corporate Debt Securities, Bank Fixed Deposits.
Small Saving Schemes can be further classified as:
1. Public Provident Fund
2. National Savings Certificates
3. Post office Monthly Income Scheme
4. Senior Citizen Saving Scheme
5. Post Office term deposit
6. Post office savings Accounts
7. Post office recurring deposit
8. Kisan Vikas Patra
9. Sukanya Samriddhi Account
1.11.3.1 Public Provident Fund (PPF)
The PPF account can be opened in branches of State Bank of India, Some Nationalized banks
and Post Offices. It can be opened by an individual for himself/herself, and or on behalf of a
minor of whom he/she is a guardian. Tenure of the PPF is 15 years. One can invest minimum
amount of Rs.500/- in the account maximum of Rs. 1, 50,000/-. One can invest a lump sum
amount or can invest in instalments not exceeding 12 per year. Amount invested in PPF per
year is eligible for deduction under sec 80C of Income tax Act 1961. The interest earned by
PPF is completely tax free in hand of investors. Interest rate is notified by the Central
Government in official gazette from time to time. Loan facility is also available on PPF.
Though maturity period is of 15 Years, one can partially withdraw the amount from 7th year
and every year thereafter. An account holder can withdraw 50% of his balance at the end of
the 4th or the 1st previous financial year, whichever is lower. Main benefit of PPF is that it is

17
not subject to attachment (seizure of the account by Court order) under any order or decree of
a court. A person can have only one account in his name. Two accounts even at different
places anywhere in India are not permitted.
1.11.3.2 National Saving Certificates
NSC has a Five year term with tax benefits under section 80-C of Income Tax Act, 1961.
Minimum investment is Rs.500/- and there is no maximum limit for investment. It can be
bought by an individual or jointly. NRI, HUF, Companies, trusts, societies, or any other
institutions are not allowed to purchase the National Saving Certificates. Certificates can be
used as collateral to get loan from banks. Current interest rate is 7.9% p.a. One can avail NSC
from Post office.
1.11.3.3 Kisan Vikas Patra
One can invest minimum Rs.1000/- in KVP and it doesn‘t have any maximum limit on
investment. Amount will be matured in 113 months. Current Interest Rate on KVP is 7.6%.
Tax will not be deducted at source and one can withdraw the amount after two and a half
years of investment. It can be used as a collateral security for raising money. It can be
purchased from any departmental Post office.
1.11.3.4 Senior Citizen Savings Scheme
Investor age of 60 years and above is eligible for the same. It has 5 years maturity period.
NRIs and HUF are not eligible to invest in this scheme. Maximum limit on investment is
Rs.15, 00,000/-(Rupees fifteen Lac only. Any Post Office in India having the facility of
savings bank account, or an office or banking company or institution authorized by Central
Government, can operate this scheme. An investor can open more than one account subject
to the condition, that amount in all accounts taken together does not at any point of time
exceed Rs.15 Lac. The current interest rate is 8.4 % p.a. payable quarterly. The benefit of
section 80C is available on investment but interest is taxable at source.
1.11.3.5 Post Office Monthly Income Scheme (POMIS)
This scheme provides a regular monthly income to the depositors and has a term of 5 years.
18
Minimum investment amount of investment is Rs.1500/- and maximum amount in case of
single account is Rs.4,50,000/-, and in case of joint account is Rs.9, 00,000/-. Current
Interest rate is 7.6 % p.a. payable monthly. Nomination facility is also available.
1.11.3.6 Post Office Time Deposits (POTD)
This is similar to FD of Banks. It can be opened at Post office by an individual. Any amount
of account can be opened by any individual in any of the post office. It can be open for 1
Year, 2 Years, 3 Years and 5 Years. Investment in 5 Years TD qualifies for deduction under
Section 80 C of Income Tax Act‘ 1961. Interest rates are calculated half yearly and
withdrawals are permitted after six months. Accounts can be pledged as a security for
availing a loan. Also nomination facility is available for this account.
1.11.3.7 Sukanya Samriddhi Account
It is a small deposit scheme, which can be opened in Post office. It has started in 2015 with
the objective of accumulating fund for Girl Child for her marriage and education purpose.
Amount invested in scheme is exempted under sec 80 C of Income Tax Act‘1961. A legal /
Natural guardian can open the account in name of the Girl Child. Account can be opened
upto the Age of 10 Years and mature at the age of 21 years. Minimum Investment amount is
Rs 1000 per year and Maximum is Rs. 1,50,000 per year. Current rate of interest is 8.4% p.a.
The Government and Corporate Debt securities include Government Securities, Treasury
Bills, Commercial Papers, Certificate of Deposits, Government Bonds, and Non-Convertible
Debenture etc.
Equity Instruments
1.11.3.8 Mutual Funds
Mutual Fund is a financial intermediary, which mobilise money from investors to various
avenues like equity, Bonds, G –Sec etc., in line with the investment objectives of the scheme.
Through mutual funds, one can invest in different class of assets. The fund mobilized through
Mutual Funds is handled by professional fund managers and they are parked in diversified
assets. The investor gets units of full amount they have invested. There is much transperacy
in the process and no hidden charges. One can transfer their money from one scheme to

19
another scheme also. And Mutual Fund units can be redeemed easily so it provides
reasonable liquidity too.
Different types of Mutual Funds are described below:
Money Market / Liquid Funds
These categories of funds invest the corpus in Money Market instruments like T- Bills,
Certificates of deposit, Commercial papers etc. As these instruments are highly liquid funds
invested in MMMF, these can be redeemed at a very short notice. As money is invested in the
debt instruments capital is safe and so returns are low. But returns can be higher than Savings
Bank Account. These are suitable for investors looking to invest their short term surplus with
an objective of high liquidity with high safety.
Debt or Income Funds
These schemes invest the money in fixed income generating debt securities, issued by
different agencies like government, private companies, banks, financial institutions, and other
entities such as infrastructure companies/utilities. The main aim of these schemes is to
generate regular income at a low risk. As compared to the Liquid funds, these debt funds
have a higher risk of default by their borrowers and can generate higher return also. There are
varieties of debt funds available. Like Gilt Fund, FMP etc.
Gilt Funds
These funds invest the corpus in G- Sec. As G – Sec is issued by GOI, there is no credit risk
associated with the investments. But returns generated by G – Sec are low, so the returns of
the Gilt Funds are also low. Interest Rate risk is associated with the funds. These funds are
also known as Government Securities Funds or G-Sec Funds.
Fixed Term Plans or Fixed Maturity Plans (FMPs)
FMPs are similar to Bank FDs. They are close ended funds. FMPs have a defined maturity
period; say 3 months, 6 months, 1 year, 3 years, etc. The maturity of the debt securities in
which the fund is invested, and the maturity of the scheme are almost the same. Hence, when
the scheme matures and money has to be returned to the investors, the fund does not have to
sell the bonds in the market, but the bonds themselves mature and the fund gets maturity
proceeds. The units of the FMPs are traded on stock exchange, so it provides liquidity to

20
investors also. These funds are suitable for investors who don‘t want to take much risk and
know the time when they will need the money.
Equity Funds
These schemes invest almost 65% of their corpus in equity market. Depending upon the type
of shares fund have selected, these funds can been classified as, Growth funds, Value funds,
Large Cap funds, Mid Cap or Small Cap funds, Sector funds, Equity Diversified funds,
Index funds. Certain equity diversified funds have tax benefit under section 80C of the
Income-tax Act, 1961 and have a lock in period of three years. These are Equity Linked
Savings Scheme (ELSS).
Growth funds
These funds invest in the money in growth stocks, which are stocks that are expected to earn
above average returns.
Value funds
Value funds invest in value stocks. That is stocks are out of favour with most investors in the
market and the market price is low compared to the value of the business. The value style
managers generally hold the stocks for longer time horizon than their growth style counter
parts.
Large cap funds / Mid. cap funds / Small cap funds
Fund investing in stocks of large companies are called Large Cap Funds and those investing
in stocks of midsized and small sized companies are called Mid Cap and Small Cap Funds.
Speciality / sector funds
These schemes invest money in specific sectors or industry, e.g., Pharma Funds, FMCG
Funds , Infrastructure Fund. High risk is associated with this kind of fund so these are
suitable for aggressive investors.
Diversified equity funds
These funds invest in stocks from across the market irrespective of market capitalization,
Industry or style. The fund manager chooses stocks from a wider selection. As it invests
money in diversified sectors, it is less risky than sector funds.
21
Index funds
It invests the money in stocks which constitute the index. So fund managers don‘t play that
active role. They just replicate the index they have selected.
Hybrid Funds
They are combinations of equity and debt funds. They can be further classified as Balanced
funds, Monthly Income Plans (MIP).
Balanced funds
As the name suggests balanced funds invest equally between equity and Debt securities. To
get an advantage of the provisions of the prevailing tax laws, these funds invest more than
65% of their assets into equity and remaining in Debt securities.
Monthly Income Plans (MIPs)
This scheme invests majority in fixed income securities with marginal exposure to equity.
The Debt securities provide stability to the portfolio and equity provides appreciation of
capital over period of time. Normally 80% of the scheme AUM is invested in fixed income
securities and the balance 20% in equity stocks.
Exchange Traded Funds (ETFs)
The units of these funds are traded on designated stock exchange. It combines features of
open and closed mutual fund schemes, and trade like a single stock on stock exchange. Gold
ETFs are very popular in India.
1.11.3.9 Equities
Investment in equity shares means becoming a shareholder in the particular company. One
also gets the voting rights of his share in the company. Higher risk is associated with higher
potential of returns. If company does well and makes profit, the investor is benefited as he is
part owner of the profit. However, if the business goes in loss, the investor would lose capital
proportionately. Returns from equities can be in the form of capital appreciation and/ or
dividends. One can do all fundamental and technical analysis before investing into direct
equities. One should analyse the market size, business of the company, its competitors,
regulations etc.

22
1.11.3.10 Derivatives
Derivatives are contract between two or more parties, which derive their value form the
underlying assets. Traders in the derivative segments are Hedgers, Speculators, and
Arbitragers.
Hedging is basically protecting assets from losses. It is basically taking reverse position to
protect the funds against any odds in the market. This may compensate for any losses in cash
market from fall of the stock price.
Arbitraging is taking the advantage of difference in prices in different markets and earning
the profits. Say stock price in spot market is lower than the futures price. One can buy the
stock in spot market and sell the same in futures markets and can generate profits. On the day
of expiry, the prices converges. Stock may move in any direction but profit is booked.
Speculation is taking positions in futures markets based on the expectations regarding the
price movements of the underlying assets without having a position in cash markets.
Various derivatives instruments in use are Forwards, Futures, Options and Swaps.
Forwards are tailor made contracts between two parties. They are not standardized contracts
and hence they are not traded on exchange. Normally traders trading in currency market use
forwards contracts to hedge against fluctuations of exchange rate.
Futures are standardized exchange traded contracts. Contracts are available for the period of 3
months, 6 months, 1 year etc. Last Thursday of every month is the expiry of every contract.
Futures are available on single stock, Index and commodities. One needs to keep margin in
the account for the trading purpose. Futures can be traded only in lots.
Options are categorized as Call Option and Put Option. Call option gives the buyer a right to
buy the underlying security at a predetermined price in predetermined period. Call option
gives the buyer a right to buy the shares/underlying asset at a price which is below the market
price and vice versa for seller. Put Option gives the buyer a right to sell the underlying
security at a predetermined price during a predetermined period. Put option gives the buyer

23
the right to sell the shares/ underlying asset at a price which is above the market price. Option
buyer has to pay the price to the seller to buy this option, it is known as Option Premium.
Non-Financial Assets
1.11.3.11 Commodities
Commodities are the real physical assets like, agricultural products, precious metals like
Gold, silver, oil etc. Futures and Options contracts on these products are traded on
commodities exchanges like, MCX and NCDEX in India. The working of the derivative
contracts are discussed in the above segments.
1.11.3.12 Real Estate
The rapid rise in the price of the property in recent years, have made the real estate as one of
the most lucrative investment avenue. The benefits of investing in real estate can be
appreciation of capital, rental income, safety etc. Investment in Real estate can take following
modes:
a) Residential Property.
b) Commercial property.
c) Industrial real estate
d) Agricultural land.
e) Semi urban land.
f) Time share in a holiday resort.
Residential Property
This investment provides return in the form of rental income and appreciation in capital. Tax
shelters are available on interest paid and principal repayment, provided the investment is
done through the route of a loan.
Commercial property
Buying a shop or office in a commercial complex may offer rental income and capital
appreciation over a time period.

24
Agricultural land
Agricultural income from agricultural land is not taxable. Further, agricultural land is exempt
from wealth tax too.
1.11.3.13 Other Non-Conventional Investment Avenues
Investments in Precious Metals, coins and other collectibles and Art objects are illiquid
investments. They are the most risky investment avenues. As organized exchanges are not
available for these instruments, one should be very careful while investing in these
instruments.
1.11.4 Retirement Planning
Changing Family structure from Join to Nuclear, increase in life expectancy and absence of
robust Social Security system have increased the importance of Retirement Planning.
Retirement Planning is determining how much amount will be required to fund the expenses
during the retirement years and how that amount can be accumulated during the pre-
retirement tenure. Ideally, one should start retirement planning with the starting of their first
job. One can invest their money in employer initiated schemes like Employee Provident Fund
(EPF), gratuity, superannuation, etc. Apart from that, there are other alternatives available
like; PPF Account, NPS, Pension & Annuity Plans, and Reverse Mortgage etc. in which one
can invest as a part of Retirement Planning.
According to CPFA- NISM (2012) there are two methods to calculate Retirement Corpus.
They are Expense Protection method and Income Replacement Method. In Expense
protection method, one lists down his/ her total monthly or annually expenses, then, those
amounts are adjusted for inflation. Amount which then arrives, indicates the corpus required
by person post retirement, which will be generating regular income equal to calculated
expenses. Income Replacement Method calculates person‘s income just before retirement.
Tools for Retirement Planning
1.11.4.1 Provident Fund
Provident Fund (PF) is the traditional and most popular product for Retirement Planning. A
certain amount is deducted from employee‘s salary every month and invested in Provident
Fund by their employers. Provident fund is a debt instrument, pool generated by employees

25
are invested in debt products. Employers also contribute their share in the employee‘s
account. On maturity investor gets total amount invested by him and his employer and
interest earned on that.
1.11.4.2 National Pension System (NPS)
NPS is a Defined Contribution Scheme and it is regulated by PFRDA (Pension Fund
Regulatory and Development Authority). The investment in NPS is to be maintained until the
age of sixty. On retirement, a part of the corpus can be withdrawn as lump sum, and the
balance would be paid as annuity. Government of India has started this scheme in 2004 for
Government Employees. From 2009, it was made available to all citizens of age group 18 –
60 Years, except individuals who are covered under Provident Fund and Miscellaneous
Provisions Act, 1952, Government employees who have joined services before Jan ‘2004,
Employees of Armed forces. It offers various investment options and choice of fund
managers to their investors. Investors also have flexibility to switch over from one fund
manager to another. Returns on this scheme are not definite; it is market linked product so
return varies with performance of underlying assets. Amount invested under this scheme get
exemption from income tax under Sec 80 C.
1.11.4.3 Reverse Mortgage
A reverse mortgage is a kind of Home loan. Any senior citizen having own house can avail it.
Basically working of Reverse Mortgage is opposite to Home Loan. Loan Amount is divided
in small monthly / quarterly / yearly instalments and paid to the lender by Bank. The loan is
typically settled after the death of the owner/co-owners. Some additional features of NPS are
discussed below:
1. The maximum tenure of the loan is 20 years.
2. Normally the owner of the property and spouse are borrowers in this scheme. If one of
the borrowers dies then other may continue to avail the instalments.
3. The maximum monthly payments under the scheme is Rs.50, 000/-.
4. Settlement of loan after tenure will be done in two ways. If legal heirs settle the full
amount of loan then property will be transferred to them, and if they don‘t, then Bank
will sell the house property mortgaged will settle the loan amount and if any amount
is remaining then it will be passed on to legal heirs.
5. Facility of early repayment of loan is also available.

26
Normally senior citizens who don‘t have steady inflow of income post retirement can opt for
the same.
Apart from these schemes, plans discussed earlier like annuity, Pension Funds are also used
for Retirement Planning purpose.
1.11.5 Estate Planning
The next stage in Personal Financial Planning is Estate Planning. Estate can be defined as all
assets a person owns. Basic objective behind estate planning is to protect, preserve and
manage one‘s assets during and post one‘s life. Estate of the estate owner should be passed
on to estate owner‘s intended beneficiaries. (C. Jayaram, 2007). For the purpose of Estate
Planning, one can create their will or they can take route of trusts also.
1.11.5.1 Wills
It is a declaration made by a person clearly mentioning the manner in which one likes his or
her property to be distributed after the death. It is a legal written document. It comes in power
only after the death of the person. So till then it can be changed according to situation. As a
part of Estate Planning, one should create their wills at early age only. This is to avoid any
hardships to the family in case of death of the owner of the property.
1.11.5.2 Trusts
Trusts is a mechanism by which owner of property can pass the legal title of that property to
another person to hold on trust for the benefit of the beneficiary. They are used as
mechanisms to hold asset for present or /and future needs of legal heirs and other family
members and designed in a manner to reduce the burden of tax. Trusts are used to
accumulation of income and capital for specified children. Some terminologies related to
trusts are discussed below.
Grantor
It is the person who creates the trust. One who is an owner of the property.
27
Trustee
This is the person or an institution that will follow wishes of grantor as per the legal
document to manage the trust upon the death of the grantor.
Beneficiaries
They are persons who will be benefited by the trust property.
There are many financial institutions and Professionals, who work as a trustee for the fees.
1.12 Financial Planning Strategies based on Life Cycle Stage
Financial Planning of an individual depends upon his/her financial goals – short term & long
term, number of dependants, stage of Lifecycle, risk appetite and many more. It is assumed
that persons in the similar stage of life cycle have almost common financial goals. Life cycle
of the individual can be divided in following four segments. Stage of the life cycle determines
their future goals and risk taking capabilities. Depending on these factors, their financial
planning strategy can be determined.
Young Unmarried Investor
Young Couple with small children
Mature Couple with grown up children
Post Retirement Stage
• Young Unmarried Investor
Any one, who is young and single may have goal of wealth creation with long term
investment horizon. He needs to give more importance on capital appreciation because he has
to fund for all future responsibilities along with planning for healthy retirement. As the
person is not married, he may not have much of the family responsibilities and his risk taking
capability can be on peak at this stage. So one‘s focus can be the pay- offs for any loans
which he has and start investing aggressively into Equity and very small portion into fixed
income asset class. If there are no dependants, then taking Insurance cannot be of paramount
Importance. Also one can start investing into PPF, NPS, Annuity Plans or other Retirement
Planning tool for Comfortable Retirement. It is advisable that one should start Retirement
Planning from the first job itself.

28
Young Couple with small children
Any one, who is married and has small children has long term focus and capital growth is of
utmost importance for him. A person in this stage, may start thinking about buying his home.
As the person has dependants on him, he may start taking good Life insurance policies, which
may give protection to his dependants in case of any eventuality. One should take health
insurance of own and family members. Investment should be done majorly into Blue Chip
equity stocks which are not too volatile or they may take root of Mutual Funds to get
advantage of diversification and Professional management, as also they can save tax by
investing into ELSS. Contributions towards Fixed Income Securities should also be
increased to balance their portfolio.
Mature Couple with grown up children
A person in their mid-aged with grown up children have responsibilities towards higher
education of their children or marriages. As their responsibilities are higher with years to
retirement are less, they will have low risk appetite and objective will be maximum wealth
creation before retirement. Portfolio should be revised in a manner to have exact balance
between equity and fixed income securities. One can invest in balanced fund of Mutual Funds
which is combination of Equity and Fixed Income Securities. Also as a part of Estate
Planning, one can create a legal will or can create a trust to transfer the asset to their intended
beneficiaries in event of death.
Post Retirement Stage
In this stage, a person may not have a salaried income, at the same time, their children are
independent and settled. His responsibility towards his children has decreased. One needs to
have fixed flow of income to fund their routine household expense, healthcare expense and
expenses towards leisure. Capital preservation with fixed flow of Income is their prime
importance. A little holding in equity with higher exposure in fixed income securities like
bond, Post office MIS, Post Office Senior Citizen Schemes are desirable. One can also take
route of Reverse Mortgage for fund their post retirement expenses.
Every individual has different risk appetite and different goals, according to their own life
conditions. Therefore, the strategy and asset allocation will change accordingly. One may
take help of Certified Financial Planners and Advisors to create a balanced Financial Plan.

29
After implementation of it, one should periodically review the same and make changes if it is
necessary.
TABLE 1. 1 - Financial Planning Strategies Based on Life Cycle Stage
Stage of the
Life Cycle
Age Group Risk Capacity Strategy Recommended
Young Single
Investor
22 – 25 Years Very High Payoff the debt, Invest into
Aggressive Equity Stocks,
start planning for
Retirement
Young Couple
with small
children
30 - 45 Years High Payoff the Debt, Take up
Life Insurance Policy &
Mediclaim Policy,
Investment into Blue chip
stocks or Mutual Funds,
Increase allocation in
Fixed Income Securities.
Mature Couple
with Grown up
children
45 -58 Years Medium to Low Portfolio should be
balanced of equity and
fixed income security.
Post Retirement 58 Years &
Above
Very Low A very little holding in
equity with more
investment in Debt
Securities like, Post office
MIS, Post office Senior
citizen scheme, Govt.
Bonds are desirable.
Reverse Mortgage can also
be availed.
Source: Primary Data

30
CHAPTER - 2
Literature Review
2.1 Prelude
A review of prior literature is an essential feature of any academic research. An effective
review lays foundation for advanced research. It facilitates new theory development and
uncovers the areas where research is needed (Jane, 2002). The chapter has been divided in
two parts. In the First Part, the literature on Financial Literacy and Personal Financial
Planning has been discussed and in the Second one, Literature related to components of
Personal Financial Planning has been reported.
2.2 Literature Review – Financial Literacy & Overall Personal Financial
Planning
The section is divided in three major parts. First part is related to importance of Financial
Literacy and Personal Financial Planning, Second Part is related to researches done on the
same across the world. Third part is related to research done in India.
2.2.1 Importance of Financial Literacy and Financial Planning
According to Hung A. et. al. (2012), there is a positive impact of financial literacy on
financial attitude, behaviour and financial well-being. Financially literate people do better at
budgeting, saving money and spending, handling mortgages, participating in other financial
markets, do better at retirement planning and successfully accumulate wealth. Higher
financial literacy leads to greater financial well-being and less financial concerns. (Taft M,
2013)
Capuano, A., & Ramsay, I. (2011) had done project in Australia on Financial Literacy.
According to them Financially Literate consumers can have more savings, they can actively
manage debt, they can be realistic regarding their future goals, they can be more financially

31
confident, can be more active in financial markets, they can choose more carefully financial
products that are suitable to their needs, they can plan their finances, budget and know how to
be financially efficient. They have also stated that in a way financially literate people benefit
financial system and economy too. They can help in achieving the target for Financial
Inclusion in the economy. Financially literate people can better understand the Financial
policies framed by any government.
Andreas Oehler & Christina Werner ( 2008) has stated that financial literacy is important
in life stages when some important decisions are made, and financial education at this stage
may alter the behavior related to Retirement Planning & Saving.
Lusardi A. (2009) in her paper stated that Financial Literacy has positive causal impact on
wealth holdings and saving behaviour. From this research, it has been found that financial
literacy increases the awareness for importance of savings and planning for retirement.
Nag R. (2007) in his speech delivered at CITI- FT Financial Education summit at Delhi has
stated that Financial Literacy allows people to increase and manage their earnings and so
they can better manage their life events like education , retirement, loss of job , illness etc.
There are many studies done which establishes link between financial literacy and Positive
Financial Behaviour. Borden L. (2008) stated that there is a causal link from financial
knowledge to healthy attitudes about money which in turn influences the behaviour.
Martin M. (2007) has discussed variables which influence Financial Behaviour. They are
Financial Knowledge, Attitude, Income, and Financial Safety.
Gallery N, Newton C.& Palm C ( 2010) had presented the model on variables which
influences Financial Well Being. It is evident from model that Financial Well- Being is
dependent on Personal Financial Behaviour which in turn depends upon Financial Literacy.

32
FIGURE 2. 1 - Possible Causes of Financial Behaviour
(Source: 18th Annual Colloquium of Superannuation Researchers, UNSW, Sydney, Australia, 12-13 July 2010).
Zakaria, R. et. al ( 2012) has tried to find factors affecting financial position or financial
well-being of the Malaysians. Study was done in Klang Valley region in Malaysia. Data was
collected with survey method from Urban Household and then analyzed with help of
Structural Equation Modeling. Study revealed that Positive Financial behavior is most
dominant factor of having good financial position. Also financial behavior is strongly related
to sound financial knowledge or Financial Literacy. From paper, it is evident that Financial
well-being of the respondents is related with their financial literacy.
2.2.2 Researches done on Financial Literacy and Financial Planning across the world
Following section discusses studies conducted worldwide to assess financial literacy,
financial awareness, attitude towards PFP and Factors influencing the same.
Parrotta, J. L., & Johnson, P. J. (1998) in their study examined impact of financial attitude
and financial knowledge on financial management and financial satisfaction. Study was
conducted in Canada in which 194 recently married couples were selected. Questionnaire was
designed to assess financial attitude, financial knowledge and financial management.
Financial Management was assessed using 35 items on five point Likert scale. To identify the
satisfaction level 10 items on 5 point Likert scale was used. Descriptive Analysis,
Correlation and regression were used to analyze the data. Important findings of the study
were financial management is better predicted by financial attitude than financial knowledge.
Age didn‘t have any significant impact on financial satisfaction. Income had significant
impact on financial satisfaction. Financial management was the best predictor for financial
satisfaction. In turn, Financial Attitude predicts Financial Management and Financial
Management predicts Financial Satisfaction.

33
Vople, Chen, & Liu (2006) in their paper have tried to identify issues which are important to
respondents regarding personal financial planning. Along with it, researchers have also tried
to probe the knowledge regarding this aspects which are considered to be important by
respondents. Survey took place in US; around 212 companies participated in it. Respondents
have given greater importance to retirement planning but the results showed that there is the
large gap between importance given to this variable and actual knowledge possessed by them.
Similar is the result for Basics of Personal Financial Planning. The Gap which was identified
is that in future, more focus can be given to the areas which are considered important but
lacking in knowledge. Financial Educational programs can be designed by looking into these
aspects.
Stendardi E .et.al (2006) had done literature survey on impact of gender on Personal
Financial Planning process. From the study it was concluded that gender has significant
impact on PFP process. Researcher also explained steps involved in PFP. These are:
gathering data, establishing financial goals and objectives, process and analyze the
information, recommend a comprehensive financial plan, Implement the plan and monitor the
plan.
Williams A. ( 2008 ) has explained the importance of financial planning and literacy in
college students. Objective of the study was to identify the common mistakes done by the
students when first starting to deal with their financials. Study found that mistakes done by
majority of the students who graduate are due to lack of financial knowledge; they delay the
repayment of student loans, accumulation of unnecessary debt, high credit card debts and
their failure to save. Other objective was to outline the essentials of financial planning for
college graduates. Study has thrown light to various concepts like principle of investing,
power of compounding, investment avenues like equity, bonds, Mutual Funds, ETFs,
Concept of diversification, Retirement planning, and Real Estate. This study serves as a
theoretical background for further studies.
Ming Lei, wei- Khong Tan ( 2009 ) has examined attitudes of Malaysians towards Financial
Planning. The study encompasses money management, insurance planning, investment
planning, retirement planning and estate planning. Study showed that people manages money
seriously. They spend money carefully and manage them very well. Study also revealed that
Chinese scores high on money management as compared to Indians and Malay respondents.
Study revealed that the job status of respondent is the primary factor for influencing the

34
attitudes towards personal financial planning and frequency in managing for various aspect of
financial planning. Demographic characteristics such as age, race, gender, marital status,
educational level are the secondary factors which influence personal financial planning. Lack
of their active participation in personal financial planning indicates that there is a need to
create awareness regarding overall personal financial planning.
Ford, M. W., & Kent, D. W. (2009) in their study attempted to find attitudes and awareness
of students for financial markets. Their sample consisted of 157 undergraduate business
school students. Age group of sample was 20 – 25 years. Their objective was to find
intimidation, Interest and awareness of students with respect to financial markets. Study
indicates significantly higher mean values for market intimidation and lower mean values of
market interest among female participants. Females had exhibited lower level of market
awareness, less understanding of current market context and less familiarity of market related
terms than their male counter parts. Study indicates that gender has significant impact on
attitudes and awareness of students with respect to financial markets.
Fünfgeld, B., & Wang, M. (2009) had conducted a study to analyze impact of demographic
variables on financial attitude and behavior. Study was conducted in German speaking part of
Switzerland. 1252 respondents were selected with convenience sampling method. Factor
analysis was used to analyze the data. Result of the factor analysis showed five dimensions of
financial attitude. They are: anxiety, interests in financial issues, decision styles, need for
precautionary savings, spending tendency. Apart from these factors, demographic variables
such as gender, age and education were found to have significant impact on financial attitude.
Yun Zhang; Li Xiuzhen (2010) gave theoretical base for financial planning which is helpful
to the people who lack knowledge regarding the same. The researcher has tried to analyze
three major factors for investment planning which are family life cycle, investment principles
and risk appetite. Researcher has also analyzed steps and approaches for risk management as
a part of Financial Planning. Family life cycle can be divided in stages of forming, growing,
mature and aging. Risk appetite normally reduces in later stages and savings for retirement
and medical expenses increase. In the section on principles of investment, the researcher has
explained that there is inverse relationship between return of the instruments and risk
associated with that. Higher the yield of the instrument more risky it is. Investor will always
try to take rational decision by weighing yield and risk associated with it. In the section on
principles of risk dispersion, the researcher has explained theory of Markowitz mean variance
35
theory for reducing nonsystematic risk of portfolio, which suggests for the diversification of
investments in different stocks to reduce the variance of entire portfolio. Approaches for Risk
Management are Risk Avoidance, Risk Control, Risk retention, Risk diversification and Risk
transfer. One has to re assess the risk as the changes occur in ones individual or family life
cycle. Thus risk management is a dynamic process.
Mohamad R. (2010) found that there are significant differences in financial literacy between
Gender and Working Sector. Study was conducted in Malaysia. Researcher stated that there
is a significant impact of Gender on frequency of managing Financial Planning, but working
sector didn‘t have any impact on frequency for managing personal financial planning.
Murphy D & Yetmar S., (2010): Their study is about ―Personal financial planning attitudes: a
preliminary study of graduate students‖. Tthe purpose of this paper is to report the Personal
Financial Planning attitudes of MBA students in USA. Participants were asked about the
level of their knowledge, their preparation regarding components of financial plan, their
confidence in their plan to meet their long term needs, and their likelihood for
implementation of such plan. Findings revealed that most of the respondents feel that
Financial Planning is important and they are interested to develop the Financial Plan, very
few feels that they have necessary skills and knowledge to develop their own financial plan
and majority of the students had not prepared their comprehensive financial plan. Study also
indicated there is strong need of Financial Planner to manage their financials.
Nga J et.al. (2010) had done study on financial awareness. Study was conducted in Malaysia
on 280 respondents. Study aimed to find level of general financial awareness and product
awareness among youth of Malaysia. Study revealed that level of education and
specialization had a major impact on general financial awareness and product awareness.
Study also revealed that Male had higher awareness than females.
Boon T. (2011) in his study has tried to relate financial literacy with financial planning.
Study was done in commercial city of Malaysia. Researcher has asked questions related to
basic knowledge of financial planning .Study revealed that respondents generally were aware
about amount of money they need for retirement purpose, they are also aware that
contribution towards EPF is not sufficient to meet the requirement, still they did not engage
in any active retirement planning. Study also revealed that respondents are not much aware

36
with various concepts of Estate planning, and as such they did not feel it as important aspect
too. Study revealed that individuals who are more financially literate focus more on financial
planning. This confirms that financial literacy is a useful indicator of individual‘s financial
planning decision.
Altintas, K. M. (2011) in his study tried to find variables that significantly affect the
financial literacy of the respondents. Study was carried in Turkey on University Students.
Independent variable was financial literacy score and dependent variables tested were Age,
Rank in class, Gender, Academic Discipline, Family Income, Education level of Father,
Education level of Mother and Participants‘ discussion with their parents about Financial
Matters. Multiple Regression method was used to find out factors affecting Financial Literacy
score. The most important variables that affect the financial literacy are Class Rank, Age,
Education level of Father and Participants‘ discussion with their parents regarding financial
Matters and Family Income.
Rajna. A et. al. (2011) had done survey in Malaysia to find financial attitude and practices of
Medical practitioners in Public & Private Medical practices. Sample size was 400. Primary
data was collected with the help of questionnaire. Financial attitude and practices were
measured with five point Liker scale. Major findings of the study are, more than 75 % of the
doctors have shown positive attitude towards personal finance but only 35% of the doctors
practice active money management. Almost 90% of the respondents have shown positive
attitude towards Retirement Planning but 60% of these respondent didn‘t know that how
much money they will require to fund post retirement expenses. Age, gender, marital status,
work experience didn‘t have any effect on financial attitude of doctors. Only ethnicity has
significant impact on the same. Chinese Doctors had shown more positive attitude than
Malay & Indian Doctors.
Leora Claper, Annamaria Lusardi (2012) has examined the relation between financial
literacy and Financial Crisis. The survey was conducted in Russia. In the survey questions
were asked on financial literacy, consumer borrowing and spending behavior. Paper revealed
that though consumer borrowings have been increasing, hardly 41% of them knew how
interest has been calculated on their borrowings and only 46% people could answer about
inflation. Survey found that financial literacy is positively related with participation in
Financial Markets and negatively related with the use of informal source of borrowing.
Individuals having higher financial literacy are significantly more likely to report higher

37
unspent income at the end of the month, and hence higher spending capacity. Study showed
that better financial literacy may equip individuals to deal with macroeconomic shocks.
Pillai, Carlo, & D'souza(2012) have tried to study youth of Asia regarding their financial
literacy, their spending behavior and approach towards Personal Financial Planning. Study
was carried out in Asia through judgmental and Quota sampling. Study comprised to check
four major areas of financial prudence of youth covering financial literacy, spending and
saving behavior, credit card usage and borrowing and Financial Planning. Study revealed that
respondents had considerable level of financial literacy but they did not have prudent
Personal Financial Plan to work for them. This is the gap identified by the study that youth of
Asia possess financial literacy but do not take an extra effort to work for their financial
future.
Yoong, F.et.al. (2012) had conducted study in Malaysia to assess impact of financial literacy
on Retirement well-being. 750 respondents were selected in Klang Valley area of Malaysia.
Study found that financial learning had significant impact on financial literacy. Financial
literacy has significant contribution in economic well-being. Financial literacy plays a
mediating role between financial literacy and financial well-being.
Taft M. et.al. (2013) had done study to find association between financial literacy, financial
well-being and financial concerns. Study was conducted in Iran and a sample of 300
respondents were selected with convenience sampling technique. Data was analyzed using t -
test, correlation test and regression. Results showed that age and education are positively
correlated with financial literacy and financial well-being and higher financial literacy leads
to higher financial well-being and lesser financial concerns.
Ali, A., Rahman, M. S., & Bakar, A. (2013) had done research to find factors contributing
to level of financial literacy and its relation with financial satisfaction. Study was done in
Malaysia. Researcher had hypothesized model on financial literacy. Model postulated that
financial literacy of the person can determine financial satisfaction of the person. To measure
the financial literacy, five different aspects were assessed. They were: Basic money
management, financial planning, investment know how, attitude to money and financial
activities. Model hypothesized by researcher is shown in Figure 2.2.

38
FIGURE 2. 2 - Research Model on Financial Literacy
(Source: Financial Literacy and Satisfaction in Malaysia: A Pilot Study. International Journal of Trade,
Economics and Finance, Vol. 4, No. 5, October 2013)
Ibrahim, M. E., & Alqaydi, F. R. (2013) in their paper examined financial literacy among
individuals residing in UAE, and tried to find association of the same with types of personal
debt obtained by them. Forms of personal debt included loans from Bank, money borrowed
from friends / relatives and borrowing through credit cards. With the help of convenience
sampling method 412 respondents were selected to fill the questionnaire. There were eight
variables used in the paper. Personal Debt as an independent variable and Dependent
Variables are Financial Literacy, Financial Attitude, Gender, Age, Nationality, Education and
Marital Status. Data were analyzed with help of descriptive statistics and t- test. Results
indicated that level of financial literacy was low in respondents compared to stated level of
literacy in previous literature. Financial Attitude is positive in respondents. Important
derivation from study was that there is a strong negative correlation between personal
financial attitude and borrowing with the help of credit card.
Jalil, M. et.al (2013) has explored the critical factors that influence Personal Financial
Planning after retirement. Study was conducted in Malaysia in Klang Valley region. Survey
method was used to take data from 170 Malaysian citizens. From Exploratory Factor
Analysis, Confirmatory Factor Analysis and Structural Equation Modeling, three factors were
found which influence PFP after retirement. These are: Income / Salary, Culture and Attitude.
Income / Salary have the highest influence on PFP followed by attitude and culture.
Ramasawmy, D. et.al (2013) has done study in Mauritius on students of Management to
assess their level of awareness regarding financial literacy. Primary data was collected with
the help of questionnaire. Questionnaire was designed to collect the information related to

39
level and importance of financial literacy, definitions and theories, constrains and measures to
improve the financial literacy. Study was also aimed to identify any significance of
association between demographic variables and level of awareness. Chi square test of
association and factor analyses were used for analysis of the data. Results of Chi square test
suggest that Age group has significant association with level of importance attached with
Financial literacy, other variables like Gender, Income Level did not have any association
with the same. Factor analysis was run to measure perception of respondents with regards to
definition of Financial Literacy, sources of Financial Information and financial education.
Four factors were extracted with help of Principal Component Analysis. They were
Analytical skills, Awareness of financial issues, Ability to make financial decisions, and
Awareness of financial risks.
Arrondel. L et. Al. (2014) has done research on financial literacy and Financial Planning in
France. Financial literacy was assessed with the tool developed by Lusardi & Mitchell
(2011). Overall financial literacy score obtained was in line with other developed countries of
the world. Important finding from the research is respondents with higher financial literacy
are more likely to be engaged in preparation of well-defined financial plan for long term.
Onyango, O. (2014) had presented research report on Effect of Financial Literacy on
Management of Personal Finances. Study was conducted on Commercial Bank Employees of
Kenya. Simple random sampling was used to select 100 bank employees of five commercial
banks in Nairobi. Main objectives of the study were: to assess the financial literacy of the
respondents and to evaluate influence of financial literacy on management of personal
finance. Multiple Regression technique was used to establish relation between financial
literacy and financial management. Financial Management score was used as dependent
variable. Gender, Age, Level of Education, Saving Plan Index, Investment Plan Index were
used as Independent variables in Regression model. Major findings of the study are Age,
gender, education level, work experience is positively related with investment plan, saving
plan and thus positively related with personal financial management.
Krajnakova E. et. Al. (2014) had done online survey in Lithuania to assess financial literacy
of the youth of Lithuania. Respondents of Age group between 18- 30 were selected in the
sample. Main objective of the study was to find association of financial literacy with personal
financial management. Financial literacy was assessed through online survey and major cities

40
of Lithuania were covered for the same. Personal Financial Management practices of the
Lithuanian citizens were studied with the help of Literature survey. With the help of
comparative analysis of literature and survey of Lithuanian Population, it was found that
influence of financial literacy on personal financial management is very high.
Ciumora T. (2014) has done excessive literature survey to identify factors influencing
individual financial decisions. From the literature survey, the researcher divided factors in
two parts. Internal Factors affecting financial decisions and External Factors affecting
financial decisions. Internal Factors are Financial Education & Literacy, Age or Positioning
in a life cycle, Focus on Financial matters, cognitive functioning, Family dynamics,
Household structures, Psychological elements, Gender and health. External Factors are
National Culture, Religion, Stereotype threats, Income uncertainty, Access to financial
advice, Geography, Demographics, Financial system development, and Economic
environment.
Mien, N. T., & Thao, T. P. (2015) has done study to investigate Personal Financial
Management Behavior. Study was conducted in Vietnam; around 400 respondents of Age
group of 18 – 30 were selected for the same. With the help of Exploratory Factor Analysis,
Confirmatory Factor Analysis and SEM, they have derived a model that Personal Financial
Management Behavior depends upon Financial Knowledge and Financial Attitude and locus
of control. Financial Attitude was checked with respect to Financial Attitude towards Saving
Plan, daily Financial Behavior, Financial Management and Future Financial Ability.
Financial Attitude and Financial Knowledge were significantly positively related to Financial
Behavior whereas external locus of control is negatively related to Financial Behavior.
Mehmet I. (2015) in his study has tried to investigate factors which may influence individual
investor behavior. Study was conducted in Turkey; data for study were collected through
survey methods from 277 bankers. Researcher had used Exploratory and Confirmatory Factor
Analysis to identify the factors influencing investor behavior. Study revealed that Factors
affecting individual Investment Decision Making behavior are level of Income, Past
Investment Experience, Expert and other Investors‘ opinion and Financial Stability.
Kebede, M., & Kuar, J. (2015) has done literature survey to find association of financial
literacy with Personal Finance behavior. Survey suggested that developed and developing
both the worlds lack in financial literacy. Study even suggested that low level of financial

41
literacy is related with Gender, Age, employment status, education level, Income and area of
residence (Urban or Rural). Study suggested from previous literatures that there is an impact
of financial literacy on financial behavior and financial inclusion.
2.2.3 Researches done in India
There are many surveys conducted by various agencies to assess the level of financial literacy
and planning in India. Some of them are discussed here.
NCAER (2011) in association with SEBI has done survey on how households save and
invest. 38412 households were chosen from 44 cities and 40 villages. Survey showed that
percentage of investors is 20 in urban area and it is as low as 6 percent in rural area, eleven to
twenty five percent of households save in post office scheme. Allocation doesn‘t even change
with relaxation in budget constrain; it stuck to traditional avenues only. People with higher
level of education choose pension plans. Only twenty one percent of urban investors invest in
secondary markets. Majority of surveyed households (53%) falls in least risk taker capacity.
Educational level plays an important role to determine risk appetite of a person. Majority of
the respondents while applying in IPO use only Newspaper as the source of information. For
participation in secondary market and mutual funds, investors relies more on advisors and
friends.
Visa’s international financial literacy survey (2012) found that India stands 23 out of 28
countries on which survey was carried out regarding financial literacy. Survey showed only
35% of respondent in India possessed financial literacy. This survey covered issues like
follow up of household budget, emergency fund for financial crisis, time people talk to their
children regarding money management issues and extent till they understand basics of money
management.
Life Freedom Index Survey for Women (2012) revealed that financial freedom of majority
of Indian Women is very low and needs improvement. Survey also showed that Indian Urban
women scores low on financial awareness regarding future financial events and risks. She
scores good on awareness regarding different financial products available. This is the gap
between product knowledge and event awareness, which causes misalignment in her financial
plans. So products she opt for are not according to their financial needs.
42
The next section is regarding various empirical studies conducted on status of financial
literacy, Personal Financial planning awareness and attitude towards personal financial
planning in India.
Sundarajan S. (1997) had presented his thesis on Personal Financial Planning and Income
Tax Saving devices commonly employed. Major finding of the study were individuals
overwhelmingly employed tax shelters to reduce their tax liabilities. Investors preferred LIC
vis-à-vis ULIP plans. Investors preferred ELSS and PPF than NSC and Annuity Plans to park
their money to save the tax. Interesting fact noticed here that majority of the respondents
sought tax shelters late in the financial year, especially in PPF. Hhence, they forgo the benefit
of tax free interest early in the year.
Agrwal S. (2010) had done survey to check financial literacy and financial planning of
Indian investors. Study found that majority of the respondents replied correctly for question
related to numeracy, inflation and diversification. But there were many variations with
different demographic variables. Males tend to know better than the females, educational
level also had a positive relation with financial literacy, and people with more goals are well
informed compared with people with less number of goals. As the number of goals increases,
there is increase in financial instruments, that means increase in insurance, number of
investments and liabilities too. Male tends to take more risk than females. Aggressive growth
individual have more insurance policies, which contradicts with previous study which found
that insurance are preferred by conservative investors. More aggressive the investor more
financially literate he is.
Seth et al. (2010) tried to assess the level of financial literacy among investors of Delhi and
NCR. Study revealed that financial literacy of the respondents was different for different
investment alternatives. Almost all the respondents were aware about saving bank account,
but awareness for other investment alternatives was relatively lower. Life Insurance policies
were highly preferred avenue followed by fixed deposits. Study also revealed Age, Income
and education level had significant impact on financial literacy.
Ranjani K. & Chpora A. (2011) have done empirical study to find financial awareness of
working women of Mumbai City. 225 women were selected from the age group of 21- 55
years. Primary data was collected with the help of questionnaire. Questionnaire was designed

43
to collect the data on parameters like financial awareness, perception towards investments,
preference for various investment avenues, self-assessment as an investor and perception
regarding riskier investments. The findings of the research were: respondents accepted that
they don‘t have expertise in financial knowledge; they have only basic financial knowledge.
Majority of the respondents have assertive attitude towards investing their money. Female
Respondents preferred Investment avenues with lower risk & higher liquidity. Majority of the
respondents have stated that they have not adequately planned for their retirement.
Pravin Mahmuni (2011) has done study on Personal Financial Planning for IT sector in
Pune, India. Objectives of the research were to study interest of investors towards financial
planning and to study preference of financial products on magnitude of age. 150 Samples
were collected from IT sector in Pune using convenience sampling method. Study finds that
awareness of financial products amongst sample is good but investors are not much aware
about non-conventional investment avenues. Inclination of people is towards saving rather
than investing. One very interesting finding of the researcher is that respondents are confused
about tax planning and financial planning. Main focus of investors is on tax planning and not
overall personal financial planning. From study, it is also found that there is positive relation
with age and investment in FD and negative relation with age and investment in stock market.
Preeti Kulkarni ( 2012 ) has written in Economic Times , based on the survey done by
HDFC and Value Notes. According to survey, Young India ( age group of 20 – 30 ) years
score low on financial awareness and Planning. There is lack of awareness of financial
planning, and also points that their financial planning is not aligned with their financial goals.
This is a result of poor awareness about financial events.
Noel Maye – CEO FPSB USA (2012) in his interview cited that financial awareness in India
is very low and it leads to poor financial planning. Consumers do not know as to what
financial planning is and hence do not value it. So according to him for a normal resident who
is not much aware about financial planning needs a financial Planner to plan his financials.
Agarwalla S. et. Al ( 2013) have done survey in India on 1000 samples to assess their
financial literacy, financial attitude and financial behavior. Study had focused on working
youth in Urban India. Data was collected from sox major cities of India. OECD approach was
used to measure the financial knowledge of the respondents. Around 24 % of the respondents

44
had scored high financial knowledge, which was lower than OECD study done on 13
countries earlier. Family Income, Gender had significant impact on financial literacy. Around
68 % of the respondents possessed positive financial behavior; the particular result was in
line with OECD survey. Around half of the respondents have shown positive attitude toward
financial management, which was again in line with results obtained in OECD survey.
Gender, Family Income and decision making by self has significant impact on the financial
attitude.
Jariwala H. (2013) had done her study to assess the financial literacy of the investors of
Gujarat State. Sample of 385 investors were collected across Gujarat state with the help of
convenience sampling technique. Data were analyzed with the help of descriptive analysis,
chi square, logistic regression and factor analysis. Results showed that 56% of the
respondents are financially literate and 44% are financially illiterate. Females possess lower
financial literacy then males. Study also found that age and income also has significant
impact on financial literacy.
Altaf N. (2014) had done study to assess the financial literacy of the students studying in the
Central University of Kashmir. Samples size was 100 students of different post graduate
courses. Primary data was collected with the help of structured questionnaire designed with
balanced five point Likert scale. Financial literacy was assessed in four parts, first part was
measurement of perception towards definition and theories, second part was measuring the
ability of respondents to manage personal finance, third part was related to measurement of
constraints of financial literacy, and fourth part was on measurement of respondents view
towards way to improve financial literacy. Mean analysis was used to analyze the data. From
the results, it is evident that students don‘t have the satisfactory level of financial literacy.
Aggarwal M. & Gupta M. (2014) have tried to find out awareness regarding financial
literacy among college students and also tried to find association of demographic variables on
financial literacy. Primary data was collected with the help of questionnaire; sample size was
180 students of private and government higher educational institutes of Chandigarh. Students
were of the age group of 18 – 25 years. Financial literacy was assessed in three parts: Basic,
average and advanced. With the help of descriptive statistics and ANOVA, association of
different variables were tested with levels of financial literacy. Result showed that Commerce
students‘ literacy score was better than non-commerce students. ANOVA indicated that there

45
is a significant difference of gender in case of different level of financial literacy. Males tend
to have higher financial literacy than females. From study it is found that Education
discipline (commerce, non- commerce) and gender have the significant impact on financial
literacy.
Bhushan, P. (2014) in his paper has examined awareness level and investment behavior of
salaried employees towards financial products. Study was conducted in Himachal Pradesh
and employees from both, Government and non Government organizations were selected in
the sample. Sample size was 516 employees. Awareness of different financial products was
assessed with five point Likert scale. Based on the mean score, financial products were given
rank from 1 to 14. It was found from the results that highest awareness was observed for
fixed deposits followed by saving accounts, PPF, NSCs, KVPs, Pension funds, mutual funds,
stock market, bonds, debenture, commodity market and forex market. It was evident that
respondents were quite aware about the products having safe returns, while awareness about
new age financial products was very low among respondents. In another study researcher had
tried to link financial literacy with awareness and preference of investment avenues.
Researcher found that respondents with high financial literacy tend to be more aware and
prefer risky investment avenues. Respondents with low financial literacy tend to be less
aware and prefer traditionally safe investment avenues.
Vasagadekar P. (2014) in her paper tried to find investment awareness among working
women. Study was conducted in Pune. Eighty working women of different sectors were
selected as sample. Primary data was collected through structured questionnaire and with the
help of in depth interviews. Results of the study were: 85% of the respondents were aware
about investments. Out of this 85% of the aware investors, only 65% of the investors were
ready to park their money in traditional safe products. Only 20% of the respondents were
ready to park their money in risky assets. Interesting result was that 90% of the respondents
were dependents on their husbands to take up the investment related decisions.
Shingla P. & Shrivstava A. (2014) had done survey in Bihar on working women to analyze
knowledge and practice of their personal financial planning. Data were collected from 300
respondents of Patna town with the help of personal interview and mailed questionnaire.
Respondents were asked questions pertaining to saving plan, approach towards tax, financial
emergency and retirement planning. Interesting findings were: only 31% of females had

46
created their short term or long term financial goals, 61% of the females use their savings to
buy durable goods or gold, 26% of the respondents got their saving deposited in fixed
deposits and the rest 13% of the respondents invested their savings in stock market or mutual
funds. 27% of the respondents were not actively planning for tax benefits mainly because of
lack of financial literacy. Only 30% of the respondents had created fund for financial
emergency. Only 20% respondents have estimated the retirement corpus required for them.
Overall this survey reports very low awareness of personal financial planning among
respondents.
Mane S. & Bhandari R. (2014) in their research paper tried to find awareness level of
investors for different investment avenues and their preference for the same. A sample of
784 respondents from Pune city were selected with convenience sampling method. Primary
data was collected with help of questionnaire. Data was analyzed with help of descriptive
analysis, Chi square and correlation tests. Major findings of the study were: respondents of
Pune city preferred safe investment avenues like saving bank account and Fixed Deposits.
Preference towards risky investment avenues was very low. Women had highly preferred
gold as their investment avenue.
Mishra, L. (2015) had done survey on 590 educated middle class respondents to assess the
awareness regarding Personal Financial Planning in India. Survey had reported that 93%
respondents, irrespective of age, educational background, Income level and family status had
stated that they need financial planning. Only 63% of the respondents clearly understood
benefits of financial planning. Only 38% of the respondents understood investment planning
and 39% of the respondents clearly understood the benefits of retirement planning. Majority
of the respondents lack awareness regarding liability planning and estate planning.
Interesting revelation was that only 11% respondents reported that there father had written a
will, which shows very low awareness regarding estate planning.
Khan K. (2015) had done similar study in city of Kampala, Uganda. Study was done to
assess financial awareness of the working women in Kampala and to study the correlation
between financial awareness and their investment preferences. Sample was selected with
convenience sampling method and 200 working women were selected in the sample. Primary
data was collected with the help of structured questionnaire. Study revealed that women of
Kampala city are highly aware about Saving Bank Account, Insurance, and Bank Fixed

47
Deposits. Awareness related to stock market is considerably low amongst them. From the
correlation test, it was found that there is a strong correlation between financial awareness
and investment preference of the respondents.
Kamugundu A. & Rajmohan P. (2016) in their paper reported that existing macro-
economic variables, funds available for investments besides all level of financial literacy
determine willingness of investors to undertake investments in high risk financial products.
So, selecting a financial products depends upon the level of financial literacy which a person
has.
2.3 Literature Review Related to various Components of Personal
Financial Planning
In this section, Literature review related to different components of Personal Financial
Planning i.e. Money Management, Insurance Management, Investment Management,
Retirement Planning and Estate Planning has been discussed.
2.3.1 Money Management
Kidwell, B., Brinberg, D., & Turrisi, R. (2003) in their research paper attepmted to found
out determinants of money management behavior. Study was conducted on 250 students of
Northwestern University, USA. Regression Analysis was used to analyze the data. From the
results, it was evident that factors which influence money management behavior are:
cognitive, affective, past behavior and perceived budgetary control. Attitude, past behavior
and perceived ability were positively related with behavior while Affect was negatively
related to behavior.
Joji Alex. N , P.T. Raveendran ( 2007) have done single cross sectional study on credit card
holders to find whether there is any compulsive buying behaviour possessed by them , and
whether there are any chances of default lead by personality trait of individuals. The study
revealed that respondents moderately agree that they are enhanced credit card users but they
rarely indicate compulsive buying behaviour, which was a positive sign.
Wang, L. et. al. (2011) had done study on Chinese credit card holders to study consumer
credit card behavior in correlation with demographics, attitude, personality and credit card

48
features. Study revealed that credit card features and demographic variables have little
explaining power on credit card behavior compared to attitude of card holders and personality
variables. Interesting finding was that some features of credit card have easily led to illusion
of income, which affected consumer credit card behavior.
Jusoh, Z., & Lin, L. Y. (2012) had tried to analyze Personal Financial Management
awareness & attitude regarding credit card practices in Malaysia. Study was conducted on
100 respondents. All the respondents were working adults having at least one credit card.
Descriptive statistics, t test and ANOVA were used to analyze the data. Results suggested
that Gender, Monthly income, financial knowledge and financial attitude don‘t have any
significant impact on credit card practices. Only education level has significant impact on
credit card practices.
Rekha Attri ( 2012) has done survey in Indore to analyze spending and saving behavior of
youths in the age group of 14 -30 years. In western country, normally this age group is
emotionally and financially free while in India, children are dependent on their parents till the
age of 24 – 25. Still it has been observed from the study that youth doesn‘t believe much in
saving. Rather, they spend more on entertainment, gadgets, eating out and personal
grooming. There is huge influence of peer group while taking purchase decision on youth
below age of 19 years.
R. Mathivanan and K. Mohanranjani (2013) had tried to analyze the gap between financial
literacy and saving behavior of working women in Coimbatore city. Objectives of the study
were to determine financial decision making capacity & financial literacy of women, and to
analyze gap between financial literacy and actual saving practices. Study revealed that
women are shifting their asset allocation from traditional avenues to more risky avenues.
With the help of t- test researcher has concluded that there exist a close relationship between
financial literacy and saving / investment practices.
2.3.2 Investment Management
Felton James et al. (2003) examined the role of gender and optimism on the risky
investment and concluded that males make more riskier investment choices than females.
Verma (2008) has tried to find out impact of demographic variables and personality types for
choice of investment avenues. Mix of judgmental and quota sampling were used for the
study. Study was conducted in Jaipur and around 500 respondents were interviewed. Results
49
showed that choice of investment is dependent upon demographic variables such as age,
gender, occupation, income, education and also personality type like conservative, medium
conservative, moderate, medium aggressive and aggressive.
Chatterjee S (2008) has analyzed the survey done by NCAER that Indians are wise savers
but poor investors. Article show that people in India do not invest for long term, they plan
for long term goals, but they rather save it not invest it, i.e., people in India majorly use
traditional savings instruments like Bank FDs, PPF, and post office saving schemes rather
than investing in equities and mutual funds which are considered to be riskier avenues.
Ajmi Jasim ( 2008 ) investigated the determinants of risk tolerance of individual investors.
Study concluded that men with higher level of education, wealth and having less financial
commitment are more likely to take risk.
Manish Sitlani, Geeta Sharma, Bhoomi Sitlani (2010) found that there exists a direct
relation between demographic factors (like age, gender, profession, qualification, marital
status of occupants) and investment choice of Investors.
N. Geetha and M. Ramesh (2010) have done study on peoples preference regarding their
investments. Study was done in Kurumbalur town and 210 respondents were chosen by
convenience sampling technique. The objectives of the study were: to study factors
influencing investment choice and attitude of respondents towards different investment
avenues. Study revealed that respondents prefer insurance, PPF, Post office schemes, Bank
F.Ds rather than investing into equities and mutual funds. They are less aware about these
instruments. Safety, liquidity, returns are important factors that determine their portfolio
allocation.
Gaur A. et. al.(2011) had done gender based survey to identify the difference in Investment
Decision making process between Males and Females. The data was collected with structured
questionnaire from 200 respondents of Hyderabad city. Convenience sampling technique was
used to select the sample. Findings of the study were: Males were comparatively more aware
then females for Investment Avenues. Female respondents had low confidence level in their
investment decisions. So, they had lower financial satisfaction than their male counterparts.
Das Sanjay (2012) has examined investment attitude, preference and knowledge about
capital market. Study revealed that High income class people invest in capital market and low

50
and middle income class people prefer more of insurance and Banks. Majority of the
respondents prefer insurance policies for the reason of tax benefits, life protection and
average profitable investment avenue.
Bashir T. (2013) had done study on Pakistani Investors to find factors influencing individual
investor decision making behavior. Sample size was 125 investors. Study revealed that
factors influencing individual investor‘s decision making behavior are Firm‘s Image,
Accounting Information, Neutral Information, Advocate Recommendations and Personal
Financial needs.
Rani R. (2014) had done literature survey on factors affecting decisions related to investment
in stock market. According to the findings of this research, factors which play major role for
investor‘s behavior in stock market are: herding, over reaction, cognitive bias, confidence,
age, income, education, risk factor, dividends, influence of people, past performance of the
company, accounting information, ownership structure and expected corporate earnings.
2.3.3 Mutual Funds
Simran Soni, Dr. Anjum, Ramandeep Saini (2011) have tried to analyze Mutual Fund
investments in relation to investor‘s behavior. Investor‘s perception and opinion have been
studied relating to various issues like, type of Mutual Fund schemes, Main objectives behind
investing into Mutual Funds, deficiencies in the services provided by managers, role of
financial advisors and brokers, factors affecting investment in mutual funds, and sources of
information. Study concluded that main objective behind investing in Mutual Fund is for
gaining tax benefits, followed by High Returns. Main feature which attracts investor for
investing in a particular scheme is the past performance and the stability of the scheme.
Rao K. ( 2011) in her article ― Analysis of Investors‘ perception towards Mutual Fund
scheme‖ has tried to explore investors‘ awareness & adoption towards mutual fund schemes.
Study concluded that there is an effect of age of investor on their awareness and adoption of
mutual fund schemes. Other socio economic factors like number of family members,
Residence of Investors also influence awareness and adoption of mutual fund schemes.
N.S. Santhi, K.Balanga Gurunathan (2011) has tried to analyze investor‘s attitude towards
tax saving mutual funds. Study finds that participants in tax saving mutual fund is less than
51
other safer investment areas like, insurance, postal deposit schemes, and fixed income
schemes. The study also revealed that majority of the investors do not have knowledge
regarding schemes of mutual funds and regulating authorities. They are satisfied with overall
benefits of tax saving mutual funds.
Dr. Bernadette D’silva, Miss. Roshni Bhuptani ( 2012) in their article ― A study on factor
influencing Mutual Fund Investment in India‖ has revealed the factors which influence
investment decision for selection of mutual funds. Investors prefer those schemes of mutual
fund which give maximum attention to their needs and requirements. Educational
background of investors influences the pattern of investment in mutual fund. There exists a
vast difference of purpose of investment in investors with different academic background.
Purpose of an investor behind investing in Mutual fund influence the selection of the mutual
fund scheme.
A.Venilla, R. Nandhagopal (2012) in their article ―Investors‘ preference towards Mutual
Funds in Coimbatore City‖ have observed attitude of investors investing in Mutual funds.
Study concluded that most of the investors rely on investment consultant to choose the right
fund for them. They monitor their investment periodically.
Joshi, J. R. (2013) had tried to find out perception of Investors for their investments in
Mutual Funds. Objectives of the study were to find investment preference of the investors
and identifying factors motivating investors to invest in Mutual funds. The study was
conducted in Anand city of Gujarat, India and 100 investors were selected with the help of
convenience sampling method. 34 % of the respondents do invest in Mutual funds. While
choosing investment avenues, respondents look at higher returns, and tax benefits provided
by the products. Respondents preferred open ended mutual funds than close ended one.
Factors motivating investors to invest in Mutual funds are portfolio diversification, lower
risk, higher liquidity and better return provided by Mutual funds.
2.3.4 Insurance
Sabhya R and Panwala M ( 2011) have done study on factors affecting buying decision for
Life Insurance. The other objective of the study was to find preference for insurance
company, i.e., investors preferred LIC or private insurance company. Study found that
investors prefer LIC over private insurance company. Age, income, awareness of insurer,
type of insurer are most affective factors for buying life insurance in Surat city.

52
Bava S and Ruchita (2011) have done empirical research on health insurance. Main
objectives of the study were to find awareness regarding health insurance policy in Punjab,
study has also attempted to find various factors which act as barriers for subscribing health
insurance and to check willingness for subscribing it by non health insurance holders. The
Study revealed that there is low level of awareness and willingness to pay for health
insurance and that there is significant relationship between age, education, income,
occupation of respondents and their willingness to pay for health insurance. Interesting
results were drawn from the study, that is, there are mainly seven key factors which act as a
barrier for subscription of the same. These factors are: lack of funds to meet costly affairs,
lack of awareness, lack of intermediaries outreach and capabilities, lack of reliability and
comprehensive coverage, lack of availability and accessibility of service, and narrow policy
options.
Madhukumar S. et.al. (2012) had done study to identify awareness and adaption of health
insurance policy and to identify the factors that works as barrier for subscription of health
insurance policy. Village near Bengaluru was selected as sample area. 343 households with
systematic random sampling were selected as samples. Results revealed that: one third of the
population were aware about health insurance but only 22 % had the policy. Not all the
family members were covered with health insurance. Almost one third of the respondents in
the sample said that they were willing to pay Rs.500 per annum as premium. Study also
found that low income, uncertainty of income and low awareness regarding health insurance
act as main barriers for non-subscription of the same.
Yadav B. & Tiwari. A (2012) in their research paper tried to find factors affecting
customers investment towards Life Insurance Policies. Primary data was collected with the
help of structured questionnaire. Study was conducted in Jabalpur, sample size was 150
policyholders. Chi- Square and correlation test were used to analyze the data. From the
analysis, it is inferred that Age plays major role in buying life insurance. Respondents
between Age group of 30 – 40 years are more interested in buying life insurance than
respondents of other Age groups. Respondents prefer LIC than any other private insurance
company. While selecting company for insurance, respondents look for trusted name, good
plans, friendly service and accessibility. While selecting policy, respondents look for
company reputation, money back guarantee, risk coverage, low premium and easy access to
agents.

53
Deb B. (2013) had done study on consumer‘s preference towards Life Insurance Companies.
Study was conducted in Guwahati. Main objectives of the study were to assess client‘s
perception, purchase behavior and awareness regarding Life Insurance Industry in Guwahati.
To identify factors affecting choice of Life Insurance Policy. A sample of300 respondents
were selected with non-random sampling. Findings of the study were, 30 % of the
respondents did not have any life insurance policy. Factors which motivate respondents to
purchase policy is to cover the future risk. 53% of the respondents had preferred LIC over
any other life insurance company. Respondents considered low premium and high risk
coverage while selecting a particular policy.
2.3.5 Retirement & Estate Planning
Raghani, V. & Singhi N.K. (1970) found that problems faced by retirees is shortage of
money, too much free time, widowhood, feeling physically weak , mental tension, feeling
of social neglect by family members. Annamria Lusardi, Olivia Mitchell (2005) had
reported in their paper regarding financial planning and literacy level of Americans and how
these impact their retirement wellbeing. Study found that majority of the respondent had high
level of financial illiteracy and that led them to poor retirement planning. Majority of the
respondent didn‘t even have worked out the amount they might require for retirement
planning.
Shyodan Singh & Paramjeet K. Dhillon (2006) have done research to understand
adjustments of retirees. Study found that retirees in India and abroad have problems in
adjustments to retirement and due to sudden loss of work they suffer from mental depression.
But people with constructive attitude prepare and plan for retirement, they involve their self
in community, remain physically fit and adjust well to retirement.
Hira & Rock (2009) have established study related to retirement planning behavior and
determinants of the behavior. Survey took place in US involving around 911 individuals to
check impact of socio demographic variables on ownership of Retirement Account and
maximizing contribution towards them. Study found that there is a significant relationship
between age, sources of financial information on ownership of Retirement account and that
employment, income, saving activity, review of investment performance have significant
impact on maximization of retirement contribution

54
Petkoska J.& Earl J.(2009) had tried to understand demographic and psychological
variables influencing retirement planning. Study was conducted in Australia. A sample of 377
respondents with age 50 years or more were selected to participate in online survey. Study
revealed that out of all demographic factors like age, gender, education level, only age is the
predictor of the financial planning. Goals, positive attitude towards retirement are major
predictor for the financial planning.
Noone, J. H. (2010) had presented thesis on psychological and socioeconomic factors
influencing Retirement planning. Study suggested that physical health and psychological
health are major predictors for retirement satisfaction. Study also suggested that men tend to
have better psychological health than women. Thus, gender is predictive of well-being
whereas education, ethnicity, age, job satisfaction are not predictors of well-being.
Singhal & Jain (2010) in conference of actuaries have presented a research paper regarding
basics of Reverse Mortgage and how it is related to Indian market today. Study also had
thrown light on risks associated with offering this product and means to mitigate those risks.
According to them, Reverse mortgage is defined as “A reverse mortgage is a loan available to
seniors and is used to release the home equity in the property as one lump sum or multiple
payments. The homeowner's obligation to repay the loan is deferred until the owner dies, the
home is sold, or the owner leaves (e.g., into aged care)‖. Borrower has to keep into
consideration many points while charging the price, some of them are age of borrower, value
of property, expected interest rates etc. Social Security system in India does not have any
provision to provide support to retired people. In that case, reverse mortgage is the system
which will provide them cash flows till they live. Researchers have also suggested that life
insurance players can contribute more towards this product because of their experience of
better understanding of mortality/ longevity trends, they are also long term players and RM is
also long term product.
Dr. Levy (2011) did the survey of resident of New York for their attitude and efforts they put
forward their entire financial planning. Survey showed that majority of the respondent said
they have not contributed money for their retirement. Only few residents were there, who
responded that they are better off financially today than previous year. Majority of the
respondents replied that their quality of life would be worst than those who are already

55
retired. For majority of the respondents, retirement benefits will come out from Social
Security System.
Gallery.N et. Al (2011) did literature survey on financial literacy & Superannuation
Investment choice decision. Study was conducted in Australian context and Superannuation
choices available in Australia are linked with financial literacy of the Australians. The
researcher had identified series of factors that influence financial literacy and which, in turn,
had impact on decision making related to investment choices. The factors which influence
financial literacy are demographic factors such as Age, Gender, Educational Attainment,
work type & status, household income and socio economic factors such as sources of advice
and information. Risk preference of individuals had impact on their investment choices.
Researcher also found that respondents who were financially literate, actively sought for the
other options available for their superannuation investments, while respondents with low
level of financial literacy generally choose default options which are available.
Pant G. (2013) had done study to assess the level of awareness and attitude of female
faculties towards Retirement Planning. For the study, 50 female faculties of Bansathali
University were selected. Study revealed that marital status of the samples was major
determinant towards awareness and preparedness of retirement. Married females were more
aware & prepared for retirement than unmarried females.
56
2.4 Research Gap
The current Researches show that Financial Literacy is associated with financial attitude and
behaviour which, in turn, is associated with financial well - being and satisfaction. To attain
the objective of financial inclusion and strengthening of financial system and financial
markets in any country, financial literacy of the investors is quite important. Many researches
have been done in developed countries to assess the financial literacy. Majority of the studies
are done on graduate or Post Graduate Students. Researches done in past are confined to
measurement of financial literacy, where in scales developed by OECD and /or Lusardi &
Mitschell had been used. These scales normally assess numeracy skills and knowledge of
individuals regarding saving, inflation, diversification related concepts & assess awareness
related to investment choices available. But very few studies have been done to assess
awareness related to overall Personal Financial Planning. i.e. not only Investment avenues but
also awareness related to Money management, Insurance, Tax Planning, Retirement Planning
& Estate Planning.
From the literature review it is evident that majority of the studies in the area of financial
literacy and Personal Financial Planning have been done in western countries, and in
countries like Malaysia has contributed a lot in the same field. But in India and particularly
in Gujarat, very few comprehensive studies have been done on Personal Financial Planning.
This provides the researcher with the opportunity to take up the comprehensive study that
will assess the financial literacy and awareness related to personal financial planning,
measure the attitude of the investors related to same, and will also find association between
financial literacy and awareness amongst Investors of Gujarat.

57
Chapter 3
Research Methodology
3.1 A Brief Overview
This chapter basically describes the objectives of study. It also focuses on how study has been
conducted, the research design used for the study, methods of selecting and approaching the
samples, sources used for the collection of data. It also describes hypothesis used to identify
the relationship between variables and tests applied with the help of statistical tools. Five
research objectives were identified from the research gap obtained from literature review.
They are as follow
3.2 Objectives of the Study
To assess the financial literacy among residents of Gujarat.
To study and to analyze the awareness of Personal Financial Planning among
residents of Gujarat.
To study and to analyze the attitude regarding Personal Financial Planning among
residents of Gujarat.
To identify the factors influencing personal financial planning behavior.
To examine the need of Financial Planner by investors.
3.3 Research Questions
What is the level of financial literacy of residents of Gujarat State?
Is there any impact of demographic variables on financial literacy of the respondents?
Are respondents aware about different Investment avenues available for Personal
Financial Planning (PFP)?
Do respondents have positive attitude towards PFP?
Is there any impact of demographic variables on attitude towards PFP?

58
Is there any association between financial literacy and attitude towards PFP?
Which are the factors influencing PFP?
3.4 Research Hypotheses
H01: There is no significant association between Age and financial literacy of the respondents.
H02: There is no significant association between Gender and financial literacy of the
respondents.
H03: There is no significant association between Education and financial literacy of the
respondents.
H04: There is no significant association between Experience and financial literacy of the
respondents.
H05: There is no significant association between Job Type and financial literacy of the
respondents.
H06: There is no significant association between Income and financial literacy of the
respondents.
H07: There is no significant association between Marital Status and financial literacy of the
respondents.
H08: There is no significant association between Location and financial literacy of the
respondents.
Ho9: Awareness of different Investment avenues does not differ significantly with respect to
gender of the respondents.
H010: Awareness of different Investment avenues does not differ significantly with respect to
Age of the respondents.
H011: Awareness of different Investment avenues does not differ significantly with respect to
Education of the respondents.
H012: Awareness of different Investment avenues does not differ significantly with respect to
Job Type of the respondents.

59
H013: Awareness of different Investment avenues does not differ significantly with respect to
Experience of the respondents.
H014: Awareness of different Investment avenues does not differ significantly with respect to
Income of the respondents.
H015: Awareness of different Investment avenues does not differ significantly with respect to
Marital Status of the respondents.
H016: Awareness of different Investment avenues does not differ significantly with respect to
Location of the respondents.
H017: Attitude towards PFP does not differ significantly with respect to gender of the
respondents.
H018: Attitude towards PFP does not differ significantly with respect to Location of the
respondents.
H019: Attitude towards PFP does not differ significantly with respect to Age of the
respondents.
H020: Attitude towards PFP does not differ significantly with respect to Education of the
respondents.
H021: Attitude towards PFP does not differ significantly with respect to Job Type of the
respondents.
H022: Attitude towards PFP does not differ significantly with respect to Experience of the
respondents.
H023: Attitude towards PFP does not differ significantly with respect to Income of the
respondents.
H024: Attitude towards PFP does not differ significantly with respect to Marital Status of the
respondents.
H025: Awareness of different Investment Avenues does not differ significantly with respect to
Financial Literacy of the respondents.

60
3.5 Scope of the Study
Study is designed to find awareness and attitude of investors for Personal Financial Planning.
Study also tries to identify factors influencing Personal Financial Planning for investors. To
conduct the study, a sample of 600 respondents has been chosen from four major cities from
the State of Gujarat. These are: Ahmedabad, Baroda, Rajkot and Surat. Scope of the study
was limited to Urban Salaried Employees of the State of Gujarat.
3.6 Research Design
(Parahoo, 2006) describes a research design as ―a plan that describes how, when and where
data are to be collected and analyzed‖. It basically shows how study will be conducted to
fulfill the defined objectives. Malhotra and Dash ( 2009) states that there are major two ways
in which research design is identified, Exploratory Research and Descriptive Research.
Exploratory research is useful when researcher doesn‘t have enough idea about how to
proceed with the research problem. If any formal research methods or protocol are not
employed in particular area then researcher may use Exploratory Research Design.
Descriptive Research helps to identify characteristics of groups or individuals. The major
purpose of descriptive research is description of the state of affairs as it exists at present.
( C R Kothari, 2004)
Descriptive research is gathering of information about prevailing conditions or situations for
the purpose of description and interpretation. This type of research method is not simply
amassing and tabulating facts but includes proper analyses, interpretation, comparisons,
identification of trends and relationships. (Dr. Y.P. Aggarwal, 2008)
Research Design Selected
For purpose of fulfilling the objectives defined earlier Descriptive Research Design was most
suitable. Hence it has been adopted for conducting study.

61
3.7 Sample Design
A sample design is the roadmap or framework which serves as the basis for selecting sample
for survey. It will include Sampling Unit, Sampling Technique and Sample Size.
3.7.1 Sampling unit
Main objective of the research is to assess level of financial literacy, awareness related to PFP
in Gujarat. Sampling Unit of the research is salaried employees of Government, Public Sector
and Private Sector.
3.7.2 Sampling Technique
Sampling technique can be broadly classified as Non Probability and Probability Sampling.
Non Probability technique of selecting sample has been used for the study. Samples were
divided in quota according to their job types: Public sector employees, private sector
employees and Government employees. Hence, Quota sampling technique has been used
under non probability method.
3.7.3 The Sample size
Sample size determination in empirical research is very important. Sample size should be
carefully selected so inference for entire population can be done from it. Aim of the study is
to find financial literacy, attitude and awareness of PFP of the respondents in Gujarat State.
Therefore, for the purpose of study, samples were selected from four Major cities of Gujarat:
Ahmedabad, Vadodara, Rajkot & Surat. From each City 150 salaried employees were
selected. Again they were divided into: 50 Government Employees, 50 Public Sector
Employees and 50 Private Sector Employees. So Sample size for the present study is 600
Employees of Gujarat state. Profile of the samples are tabulated in Table 3.1.

62
TABLE 3. 1 – Sample Profile
150 Residents of Ahmedabad City 50 Govt. Employees+ 50 Public
Sector Employees + 50 Private
Sector Employees
150 Residents of Baroda City 50 Govt. Employees+ 50 Public
Sector Employees + 50 Private
Sector Employees
150 Residents of Rajkot City 50 Govt. Employees+ 50 Public
Sector Employees + 50 Private
Sector Employees
150 Residents of Surat City 50 Govt. Employees+ 50 Public
Sector Employees + 50 Private
Sector Employees
Source: Primary Data
3.8 Data Sources
3.8.1 Secondary Data
Secondary Data are the data already collected and published. For the study, secondary data
were collected from various Books, journals, thesis, periodicals, magazines, newspapers and
Websites.
3.8.2 Primary Data
Primary data are the data originated by researcher to meet certain objectives. For the study
primary data has been collected through structured questionnaire. Questionnaires were filled
by respondents through one to one approach.
3.9 Planning of Data Collection
For the purpose of Primary Data collection, survey technique has been adopted, in which
close ended questions are asked with the help of structured questionnaire. In this study, data
were collected from 600 salaried employees of Gujarat State by using Survey Method. Any
salaried employee can be a sampling unit for the survey. Planning was done to select

63
employees from diversified industries, so that the result may not get skewed. For the purpose
of collecting data, employees of different government bodies, Public Sector Units and Private
Sector were contacted with convenience sampling and with referrals methods. Government
employees selected for the study were employees of different municipal corporations, GIDC
Class I & II officers, Custom & Excise officers, Public School teachers. Public Sector
employees were selected from various PSUs like ONGC, Public Sector Banks etc. Data of
Private Sector employees were collected from different industries like Banking, IT, Heavy
Engineering, Education, FMCG etc.
3.10 Overview of Variables, Scaling Technique and Data collection
Instrument – Structured Questionnaire
A questionnaire is a written list of questions, the answers to which are recorded by
respondents. The respondents read the questions from the questionnaire, interpret what is
expected and then write down the answers.( Ranjit Kumar, 2011). Questionnaire may have
questions which are classified as Open ended and Closed ended questions. Open ended
questions gives respondents‘ liberty to think and narrate answers in their own language of
understanding. It may get difficult to code and analyze the response given in open ended
questionnaire. Closed ended questions, because they provide ―ready-made‖ categories within
which respondents reply to the questions asked by researcher, help to ensure that the
information needed by the researcher is collected. In this study, close ended questions were
used to record the responses from the respondents. Data collected through closed ended
questions include Nominal Data, Categorical Data and data on Likert Scale. For some
sections, Three Point and Five Point Likert scale has been used by the researcher. Five Point
Likert scale is easy to construct and administer and respondents easily understand how to use
the particular scale.( Malhotra N., 2009)
3.10.1 Variables Identified for the study
Dependent Variables: Financial Literacy, Financial Attitude & Personal Financial Planning
are the dependent variables identified for the present research.
Independent Variables: From the literature review, demographic variables like; Age,
Gender, Education, Job Type, Work Experience, Income, Marital Status, Location have been

64
identified as independent variables, and these variables may have impact on financial literacy
and financial attitude. So the different demographic variables are independent variables of the
study.
3.10.2 Overview of Questionnaire
Questionnaire was divided mainly in four sections. First section was designed to assess
Financial Literacy; Second section was designed to assess awareness of respondents
regarding various Investment Avenues. Third section was designed to analyze attitude of
respondents regarding Personal Financial Planning and Factors influencing the same. Fourth
section of questionnaire was pertaining to collection of Demographic profile of respondents.
To check the content validity of questionnaire, views of academicians and industry experts
were sought to check the validity of the content of the questionnaire. Their opinions &
suggestions were incorporated in the questionnaire.
To assess the financial literacy of the respondents, questions to assess knowledge for basic
financial terms were asked. Respondents had to choose one correct answers from four options
given to them. The first three questions were asked to assess basic financial literacy and the
remaining five questions were asked to assess advanced financial literacy. Questions asked
were adopted from the scale developed by Lusardi & Mitschell (2011).
Different study has shown that awareness related to different investment avenues are very
low among the Indian Investors. So present study aims at finding out awareness of different
investment avenues in Investors of Gujarat. To identify the awareness for some thirteen
different investment avenues, respondents were asked to assess their awareness on three point
Likert scale. Where ‗1 is unaware, 2 is moderately aware and 3 is completely aware‘. Next
Section of the questionnaire is for analyzing attitude towards Personal Financial Planning and
Factors influencing the same. Lai M. & Tan W. (2009) performed similar study in Malaysia
to analyze attitude and identify factors influencing PFP. Five point Scale developed by them
was referred and modified according to present Indian context. Attitude related to all the
components of Personal Financial Planning i.e. Money Management, Investments, Risk
(Insurance) Management, Tax Management, Retirement Planning, Estate Planning & Overall
PFP was assessed. For the purpose, statements related to all the components and Overall PFP
were asked and their agreeableness on Five Point Likert scale has been checked. Where ‗1
being strongly disagree to 5 being Strongly Agree‘. Some negatively worded questions were
also asked and then inverted coding had been done for them. From various literature, factors
which may influence Personal Financial Planning were identified. Responses were taken on

65
five point Likert scale for respondents agreeableness of the factors influencing their financial
planning decisions.
3.10.3 Details of the Pilot Study
Pilot survey is in fact the replica and rehearsal of the main survey. Such a survey, being
conducted by experts, brings to the light the weaknesses (if any) of the questionnaires and
also of the survey techniques. From the experience gained in this way, improvement can be
effected.
(C R Kothari, 2004)
Pilot study was conducted on 100 respondents of Ahmedabad City to check appropriateness
of the questions, content & sequence of the questions. Pilot Study was done using one to one
approach, so researcher can gauge the problems faced by respondents while filling it up.
There were some items in the questionnaire which were difficult to understand for a layman.
Those items were modified in a simple language so that respondents can easily understand
the same. After data collected for Pilot Study, data were analyzed to check whether
questionnaire is designed according to objectives and researcher is getting proper response or
not. Analysis on Pilot Data suggested that proper responses have been obtained. There after
the data was collected for the entire sample using the questionnaire.
3.10.4 Reliability Test
Reliability is consistency of measurement (Bollen, 1989), or stability of measurement over a
variety of conditions in which basically the same results should be obtained (Nunnally,
1975).
Cronbach Alpha is the measure to check reliability of the instrument. According to some
previous researches done in the area Alpha value above 0.7 is acceptable.
With the help of SPSS 20, Reliability test has been performed on Likert Scale items. For
attitudinal scale used in questionnaire, the Cronbach Alpha value obtained was 0.7.
Therefore, the research instrument used was considered as reliable.
3.11 Various Statistical Tests and Tools Used
Microsoft – Excel was used for data entry stage. Later that data was exported to SPSS.
Microsoft Excel was also used to find some descriptive analysis. Data collected on Likert
Scale is an ordinal data. Normality of ordinal data can‘t be checked, so for the present study

66
only non-parametric test have been used. SPSS 20 has been used to perform various tests like
Chi- Square, Mann Whitney U Test, Krushkal Wallis Test, Factor Analysis etc. AMOS is
normally used for building, validating and presenting a hypothesized model. For this study,
AMOS 18 software was used for Confirmatory Factor Analysis and Structural Equation
Modeling.

67
CHAPTER - 4
Analysis & Interpretation
4.1 Introduction
This Chapter deals with the Descriptive and inferential statistical analysis of data collected
from 4 major cities of Gujarat State, namely; Ahmedabad, Baroda, Surat and Rajkot. Data
were collected from 600 respondents from these cities.
Analysis of the data has been divided in four major sections
Section I: Demographic Profile of the respondents.
Section II: Financial Literacy of the respondents
Section III: Awareness of Financial Products within respondents
Sections IV: Attitude and Factors influencing Personal Financial Planning
4.2. Demographic Profile of the respondents
4.2.1. Location
The Table below shows the responses obtained from four major cities of Gujarat State.The
data from 150 respondents from each city (Ahmedabad, Baroda, Rajkot and Surat) have been
obtained for analysis purpose.

68
TABLE 4. 1 - Location of the respondents
Frequency Percent
Cumulative
Percent
Valid
Ahmedabad 150 25.0 25.0
Baroda 150 25.0 50.0
Rajkot 150 25.0 75.0
Surat 150 25.0 100.0
Total 600 100.0
Source : Primary Data
4.2.2. Job Type
The Table 4.2 shows the job type of the respondents. For the purpose of the study, only
salaried employees of Public Sector, Private Sector and Government employees were chosen.
From each city, 50 respondents under each category had been selected. Thus, 200
respondents from Public Sector, 200 respondents from Private Sector and 200 Government
employees have been selected for the study.
TABLE 4. 2 - Job Type of the respondents
Frequency Percent
Cumulative
Percent
Valid
Public Sector 200 33.3 33.3
Private Sector 200 33.3 66.7
Government 200 33.3 100.0
Total 600 100.0
Source : Primary Data
4.2.3. Age
The Table 4.3 and Figure 4.1 show the Age of the respondents. Age categories are classified
as : under 20-35, 36-58 and 59 and above. 35.5 percent of the respondents belong to 20-35
age group, 46 percent of the respondents belong to 36-58 age group and remaining 18.5
percent of the respondents belong to 59 and above age group.

69
TABLE 4. 3 - Age of the respondents
Frequency Percent
Cumulative
Percent
Valid
20-35 213 35.5 35.5
36-58 276 46.0 81.5
59 and above 111 18.5 100.0
Total 600 100.0
Source : Primary Data
FIGURE 4. 1 - Age of the Respondents
4.2.4. Gender
From Table 4.4 and Figure 4.2, it is evident that there are 59.7 Percent Male and 40.3 Percent
Female respondents.
TABLE 4. 4 – Gender of the respondents
Frequency Percent
Cumulative
Percent
Valid
Male 358 59.7 59.7
Female 242 40.3 100.0
Total 600 100.0
Source : Primary Data

70
FIGURE 4. 2 - Gender of the respondents
4.2.5. Education
It can be seen from Table 4.5 (Figure 4.3 ) that about 52.5 % of the respondents were
Graduates, 29.5 % of the respondents were Post Graduate and 18% of the respondents were
High School pass.
TABLE 4. 5 - Education of the respondents
Frequency Percent
Cumulative
Percent
Valid
High school 108 18.0 18.0
Graduation 315 52.5 70.5
Post Graduation 177 29.5 100.0
Total 600 100.0
Source : Primary Data

71
FIGURE 4. 3 - Education of the Respondents
4.2.6. Experience
Table 4.6 ( Figure 4.4) shows that 49.3% respondents had 5 – 15 years of experience, around
29.5% respondents had 16 -25 years of experience, around 17.5 % respondents had
experience of 25 years and above and 3.7 % respondents had less than 5 years of experience.
TABLE 4. 6 – Experience of the respondents
Frequency Percent
Cumulative
Percent
Valid
Less Than 5 Years 22 3.7 3.7
5-15 years 296 49.3 53.0
16-25 Years 177 29.5 82.5
25 and Above 105 17.5 100.0
Total 600 100.0
Source: Primary Data

72
FIGURE 4. 4 – Experience of the respondents
4.2.7. Income
From Table 4.7 ( Figure 4.5), one can observe that 55.7% of the respondents had income
between 5 – 10 Lakhs, 23.3 % of the respondents had income between 10 -15 Lakhs, 14% of
the respondents had income less than 5 Lakhs and 7% of the respondents had income more
than 15 Lakhs.
TABLE 4. 7 – Income of the respondents
Frequency Percent
Cumulative
Percent
Valid
Less Than 5 Lakhs 84 14.0 14.0
5-10 Lakh 334 55.7 69.7
10-15 lakhs 140 23.3 93.0
More Than 15 lakh 42 7.0 100.0
Total 600 100.0
Source: Primary Data

73
FIGURE 4. 5 – Income of the respondents
4.2.8. Marital Status
Table 4.8 ( Figure 4.6) shows that 62.7 % of the respondents were married, 34.7 %
respondents were unmarried, 1 % were widow/ widower and 1.7 % were divorcee.
TABLE 4. 8 – Marital Status of the respondents
Frequency Percent
Cumulative
Percent
Valid
Married 376 62.7 62.7
Unmarried 208 34.7 97.3
Widow/Widower 6 1.0 98.3
Divorcee 10 1.7 100.0
Total 600 100.0
Source: Primary Data
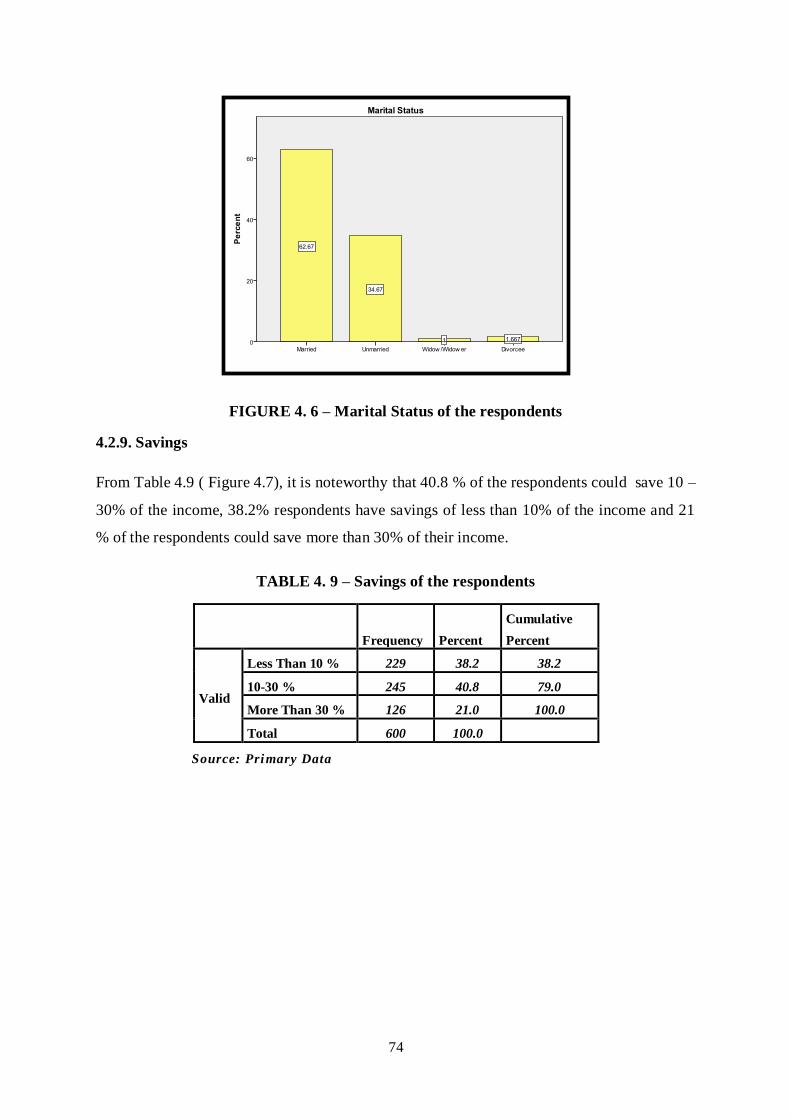
74
FIGURE 4. 6 – Marital Status of the respondents
4.2.9. Savings
From Table 4.9 ( Figure 4.7), it is noteworthy that 40.8 % of the respondents could save 10 –
30% of the income, 38.2% respondents have savings of less than 10% of the income and 21
% of the respondents could save more than 30% of their income.
TABLE 4. 9 – Savings of the respondents
Frequency Percent
Cumulative
Percent
Valid
Less Than 10 % 229 38.2 38.2
10-30 % 245 40.8 79.0
More Than 30 % 126 21.0 100.0
Total 600 100.0
Source: Primary Data

75
FIGURE 4. 7 – Savings of the respondents
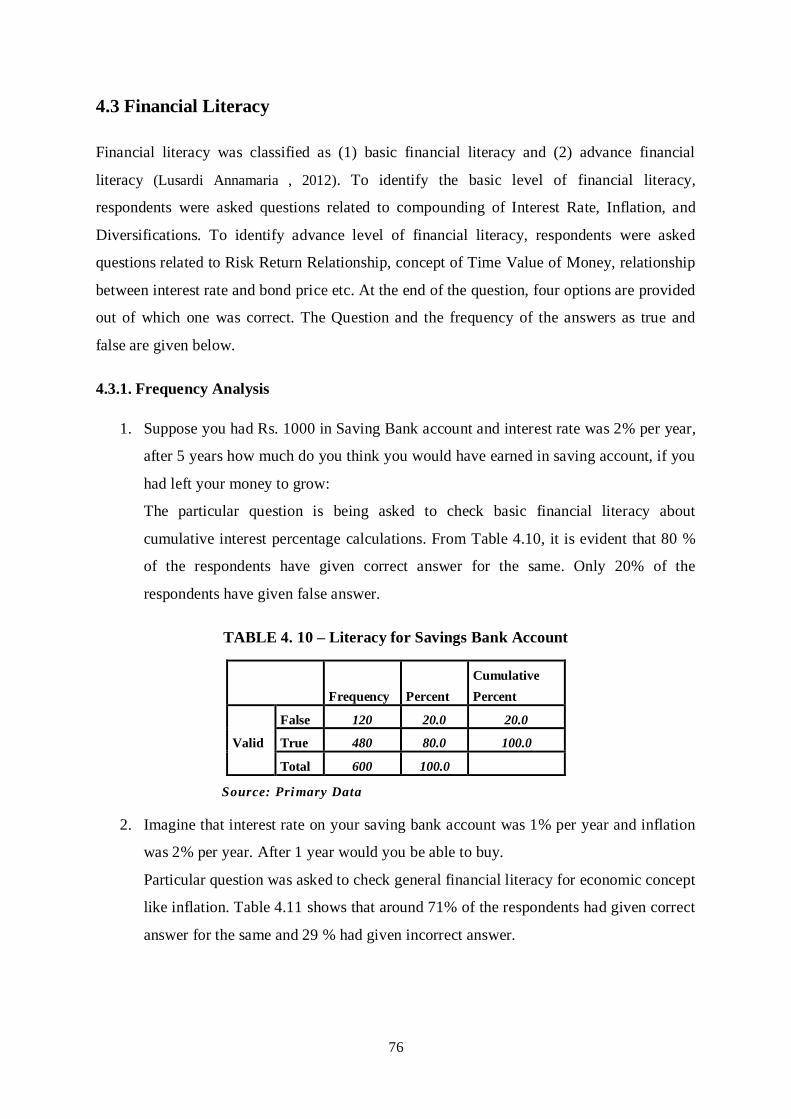
76
4.3 Financial Literacy
Financial literacy was classified as (1) basic financial literacy and (2) advance financial
literacy (Lusardi Annamaria , 2012). To identify the basic level of financial literacy,
respondents were asked questions related to compounding of Interest Rate, Inflation, and
Diversifications. To identify advance level of financial literacy, respondents were asked
questions related to Risk Return Relationship, concept of Time Value of Money, relationship
between interest rate and bond price etc. At the end of the question, four options are provided
out of which one was correct. The Question and the frequency of the answers as true and
false are given below.
4.3.1. Frequency Analysis
1. Suppose you had Rs. 1000 in Saving Bank account and interest rate was 2% per year,
after 5 years how much do you think you would have earned in saving account, if you
had left your money to grow:
The particular question is being asked to check basic financial literacy about
cumulative interest percentage calculations. From Table 4.10, it is evident that 80 %
of the respondents have given correct answer for the same. Only 20% of the
respondents have given false answer.
TABLE 4. 10 – Literacy for Savings Bank Account
Frequency Percent
Cumulative
Percent
Valid
False 120 20.0 20.0
True 480 80.0 100.0
Total 600 100.0
Source: Primary Data
2. Imagine that interest rate on your saving bank account was 1% per year and inflation
was 2% per year. After 1 year would you be able to buy.
Particular question was asked to check general financial literacy for economic concept
like inflation. Table 4.11 shows that around 71% of the respondents had given correct
answer for the same and 29 % had given incorrect answer.

77
TABLE 4. 11 – Literacy regarding concept of Inflation
Frequency Percent
Cumulative
Percent
False 174 29.0 29.0
True 426 71.0 100.0
Total 600 100.0
Source: Primary Data
3. Assume that a friend inherits Rs. 10000 today and his sibling inherits Rs. 10000, 3
years from now. Who is richer because of Time Value of Money?
Question was asked to check the knowledge regarding time value of money. From
Table 4.12, it is evident that 64% of the respondents possess fair knowledge of time
value of money. Only 36% of the respondents had given incorrect answer.
TABLE 4. 12 – Literacy regarding concept of Time Value of Money
Frequency Percent
Cumulative
Percent
False 216 36.0 36.0
True 384 64.0 100.0
Total 600 100.0
Source: Primary Data
4. Buying a single company stock usually provide safer return than a stock mutual fund.
As a part to check the knowledge regarding concept of diversification, the particular
question was asked. The answers have been classified as either True or False and are
tabulated in Table 4.13. From the Table, it is evident that 72% of the respondents
gave correct answer that Mutual funds give safer return than a single company stock.
28 % of the respondents failed to give correct answer.
TABLE 4. 13 – Literacy regarding concept of Diversifications
Frequency Percent
Cumulative
Percent
Valid
False 168 28.0 28.0
True 432 72.0 100.0
Total 600 100.0
Source: Primary Data

78
5. Financial Planning is all about buying enough insurance.
The question is asked to check basic awareness regarding Financial Planning. It is
generally observed that people conceptualize Financial Planning as investing only
into insurance. Whereas, a Balanced Financial Plan is composed of Insurance,
Investments, Debt, Retirement, Taxation and Estate Planning. From Table 4.14, it is
evident that 80 % of the respondents have given correct answer for the same while 20
% of the respondents gave incorrect answers.
TABLE 4. 14 – Literacy regarding basics of Financial Planning
Frequency Percent
Cumulative
Percent
Valid
False 120 20.0 20.0
True 480 80.0 100.0
Total 600 100.0
Source: Primary Data
6. Any investment opportunity which claims higher returns usually carries lower risk.
From Table 4.15, it is evident that 80% of the respondents have given correct answer
for the same. 20 % of the respondents failed to give correct answer.
TABLE 4. 15 – Literacy regarding basics of Risk & Returns Relationships
Frequency Percent
Cumulative
Percent
Valid
False 120 20.0 20.0
True 480 80.0 100.0
Total 600 100.0
Source: Primary Data
7. If interest rate falls, what will happen to price of the bond?
Particular question deals with economy‘s concept of relationship between price of the
bond and interest rate in the market. If interest rate in economy will go down, the
price of bond will go high and vice-a versa. Table 4.16 shows that majority i.e. 60 %
of the respondents fails to give correct answer, only 40% of the respondents were
aware about the relationship between interest rate in economy and price of bond.

79
TABLE 4. 16 – Literacy regarding relationship of Bond Price & Interest Rates
Frequency Percent
Cumulative
Percent
Valid
False 360 60.0 60.0
True 240 40.0 100.0
Total 600 100.0
Source: Primary Data
8. Considering the long term tenure (10 to 20 Years), which assets normally gives the
highest return?
Particular question was asked to check awareness regarding different financial
instruments available in the economy and their normal features. From Table 4.17, it is
evident that 54 % of the respondents failed to give correct answer, which is equity
which generates higher return in the long run. 46 % of the respondents gave correct
answer. It is interesting to note that majority of the respondents have chosen bond as
an instruments which provides higher return in the long run.
TABLE 4. 17 – Literacy regarding returns generated by financial assets in long run
Frequency Percent
Cumulative
Percent
Valid
False 324 54.0 54.0
True 276 46.0 100.0
Total 600 100.0
Source: Primary Data
Table 4.18 shows the overall summary for financial literacy. Respondents possessed fairly
good knowledge of basic financial literacy. Only two questions pertaining to advanced
financial literacy were such where more incorrect answers were observed. To check the
overall performance of the respondents pertaining to correct answers given by individual
respondents, Modal value of the responses was calculated with the help of excel sheet. Mode
of the responses came out to be 6. Which shows that out of 8 questions, majority of the
respondents have given 6 correct answers. It can be summarized through the Table that
overall people possessed fairly good knowledge of financial literacy regarding all the
parameters.

80
TABLE 4. 18 – Overall summary for Financial Literacy
Levels Sr. No Parameters on which literacy has
been checked
Frequency
(%)
Interpretation
Basic
Literacy
1 Saving Bank Interest 80 From the above data it is
observed that respondents
possessed fair literacy
regarding all the
parameters asked. Only 2
parameters: Working of
Bond and Returns on
Long Term Investments
has shown little low
literacy.
2 Inflation 71
3 Time Value of Money 64
Advanced
Literacy
4 Concept of Diversifications 72
5 Basics of Financial Planning 80
6 Relation between Risk & Return 80
7 Relationship of Bond Price &
Interest Rates
40
8 Returns generated by financial
assets in long run
46
Source: Primary Data
Jariwala H. (2013) in her thesis had stated that median can be used to find out the status of
financial literacy of the respondent. One can take overall score of correct answers given by
respondents, and then median of the score is found. Respondents scoring above median score
are known to be financially literate while those with score below that are financially illiterate.
The same method is adopted in the present study to find out whether respondent is financially
literate or not. In the present research, 8 questions pertaining to financial literacy were asked.
With the help of Microsoft Excel score of each respondent in terms of correct answers
provided by them was found. Median of these scores was found to be 6. So, respondents who
gave 6 or more than 6 correct answers are financially literate and those with less than 6 are
financially illiterate. Table 4.19 shows the frequency of Financially Literate and Illiterate
Respondents.

81
TABLE 4. 19 – Financial Literacy of Respondents
Frequency Percent Cumulative
Percent
Valid
Financial
Illiterate 282 47.0 47.0
Financial Literate 318 53.0 100.0
Total 600 100.0
Source: Primary Data
Table 4.19 depicts that 47 % of the respondent are financially illiterate and 53% of the
respondents are financially literate.
4.3.2. Non Parametric Tests: Chi-Square Test
To find association between different demographic factors and financial literacy Chi –square
test has been performed. Various hypotheses are formed as under.
H01: There is no significant association between Age and financial literacy of the
respondents.
The Table below shows the result of the Chi-square test of association. Age and Financial
Literacy of the respondent were tested for association.
TABLE 4. 20 – Cross Tabulation - Age and Financial Literacy of the Respondent
Financial Literacy Total
Financial
Illiterate
Financial
Literate
Age
20-35 53 160 213
36-58 144 132 276
59 and above 85 26 111
Total 282 318 600
Source: Primary Data
The Table below shows the result of test statistics. As the P Value is less than 0.05, we reject
the null hypothesis. Therefore, it can be concluded that Age and Financial Literacy of the
respondents are related with each other, Chi-Square at 2 degree of freedom = 83.775, P <
0.05.

82
TABLE 4. 21 - Chi-Square Tests – Age and Financial Literacy of the Respondent
Value Df Asymp. Sig. (2-
sided)
Pearson Chi-Square 83.775a 2 .000
a. 0 cells (0.0%) have expected count less than 5. The minimum expected count
is 52.17.
Source: Primary Data
H02: There is no significant association between Gender and financial literacy of the
respondents.
The Table below shows the result of the Chi-square test of association. Gender and Financial
Literacy of the respondent were tested for association.
TABLE 4. 22 – Cross Tabulation - Gender and Financial Literacy of the Respondent
Financial Literacy Total
Financial
Illiterate
Financial
Literate
Gender Male 124 234 358
Female 158 84 242
Total 282 318 600
Source: Primary Data
The Table below shows the result of test statistics. As the P Value is less than 0.05, we reject
the null hypothesis. So, it can be concluded that Gender and Financial Literacy of the
respondents are related with each other, Chi-Square at 1 degree of freedom = 54.463, P <
0.05.
TABLE 4. 23 - Chi-Square Tests – Gender and Financial Literacy of the
Respondent
Value Df Asymp. Sig. (2-
sided)
Pearson Chi-Square 54.463a 1 .000
a. 0 cells (0.0%) have expected count less than 5. The minimum expected count
is 113.74.
Source: Primary Data

83
H03: There is no significant association between Education and financial literacy of the
respondents.
The Table below shows the result of the Chi-square test of association. Education and
Financial Literacy of the respondent were tested for association.
TABLE 4. 24 – Cross Tabulation - Education and Financial Literacy of the Respondent
Financial Literacy Total
Financial
Illiterate
Financial
Illiterate
Education
High school 45 63 108
Graduation 188 127 315
Post Graduation 49 128 177
Total 282 318 600
Source: Primary Data
The Table below shows the result of test statistics. As the P Value is less than 0.05, we reject
the null hypothesis. So, it can be concluded that Education and Financial Literacy of the
respondents are related with each other. Chi-Square at 2 degree of freedom = 48.086, P <
0.05.
TABLE 4. 25 - Chi-Square Tests – Education and Financial Literacy of the Respondent
Value Df Asymp. Sig. (2-
sided)
Pearson Chi-Square 48.086a 2 .000
a. 0 cells (0.0%) have expected count less than 5. The minimum expected count
is 50.76.
Source: Primary Data
H04: There is no significant association between Experience and financial literacy of the
respondents.
The Table below shows the result of the chi-square test of association. Experience and
Financial Literacy of the respondent were tested for association.

84
TABLE 4. 26 – Cross Tabulation - Experience and Financial Literacy of the
Respondent
Financial Literacy Total
Financial
Illiterate
Financial
Illiterate
Experience
Less Than 5 Years 16 6 22
5-15 years 91 205 296
16-25 Years 88 89 177
25 and Above 87 18 105
Total 282 318 600
Source: Primary Data
The Table below shows the result of test statistics. As the P Value is less than 0.05, we reject
the null hypothesis. So, it can be concluded that Experience and Financial Literacy of the
respondents are related with each other, Chi-Square at 3 degree of freedom = 91.970, P <
0.05.
TABLE 4. 27 - Chi-Square Tests – Experience and Financial Literacy of the
Respondent
Value df Asymp. Sig. (2-
sided)
Pearson Chi-Square 91.970a 3 .000
a. 0 cells (0.0%) have expected count less than 5. The minimum expected count
is 10.34.
Source: Primary Data
H05: There is no significant association between Job Type and financial literacy of the
respondents.
The Table below shows the result of the chi-square test of association. Job Type and
Financial Literacy of the respondent were tested for association.

85
TABLE 4. 28 – Cross Tabulation – Job Type and Financial Literacy of the Respondent
Financial Literacy Total
Financial
Illiterate
Financial
Illiterate
Job
type
Public Sector 109 91 200
Private Sector 96 104 200
Government 77 123 200
Total 282 318 600
Source: Primary Data
The Table below shows the result of test statistics. As the P Value is less than 0.05, we reject
the null hypothesis. So, it can be concluded that Job Type and Financial Literacy of the
respondents are related with each other. Chi-Square at 2 degree of freedom = 10.397, P <
0.05.
TABLE 4. 29 - Chi-Square Tests – Job Type and Financial Literacy of the Respondent
Value Df Asymp. Sig. (2-
sided)
Pearson Chi-Square 10.397a 2 .006
a. 0 cells (0.0%) have expected count less than 5. The minimum expected count
is 94.00.
Source: Primary Data
H06: There is no significant association between Income and financial literacy of the
respondents.
The Table below shows the result of the chi-square test of association. Income and Financial
Literacy of the respondent were tested for association.

86
TABLE 4. 30 – Cross Tabulation - Income and Financial Literacy of the Respondent
Financial Literacy Total
Financial
Illiterate
Financial
Illiterate
Income
Less Than 5 Lakhs 37 47 84
5-10 Lakh 148 186 334
10-15 lakhs 69 71 140
More Than 15 lakh 28 14 42
Total 282 318 600
Source: Primary Data
The Table below shows the result of test statistics. As the P Value is less than 0.05, we reject
the null hypothesis. So, it can be concluded that Income and Financial Literacy of the
respondents are related with each other, Chi-Square at 3 degree of freedom = 8.078, P <
0.05.
TABLE 4. 31 - Chi-Square Tests – Income and Financial Literacy of the Respondent
Value Df Asymp. Sig. (2-
sided)
Pearson Chi-Square 8.078a 3 .044
a. 0 cells (0.0%) have expected count less than 5. The minimum expected count
is 19.74.
Source: Primary Data
H07: There is no significant association between Marital Status and financial literacy of
the respondents.
The Table below shows the result of the chi-square test of association. Marital Status and
Financial Literacy of the respondent were tested for association.

87
TABLE 4. 32 – Cross Tabulation – Marital Status and Financial Literacy of the
Respondent
Financial Literacy Total
Financial
Illiterate
Financial
Illiterate
Marital
Status
Married 144 232 376
Unmarried 130 78 208
Widow/Widower 3 3 6
Divorcee 5 5 10
Total 282 318 600
Source: Primary Data
The Table below shows the result of test statistics. As the P Value is less than 0.05, we reject
the null hypothesis. So, it can be concluded that Marital Status and Financial Literacy of the
respondents are related with each other, Chi-Square at 3 degree of freedom = 31.549, P <
0.05.
TABLE 4. 33 - Chi-Square Tests – Marital Status and Financial Literacy of the
Respondent
Value df Asymp. Sig. (2-
sided)
Pearson Chi-Square 31.549a 3 .000
a. 3 cells (37.5%) have expected count less than 5. The minimum expected
count is 2.82.
Source: Primary Data
H08: There is no significant association between Location and financial literacy of the
respondents.
The Table below shows the result of the Chi-square test of association. Location and
Financial Literacy of the respondent were tested for association.

88
TABLE 4. 34 – Cross Tabulation - Location and Financial Literacy of the Respondent
Financial Literacy Total
Financial
Illiterate
Financial
Illiterate
Location
Ahmedabad 71 79 150
Baroda 70 80 150
Rajkot 72 78 150
Surat 69 81 150
Total 282 318 600
Source: Primary Data
The Table below shows the result of test statistics. As the P Value is more than 0.05, we fail
to reject the null hypothesis. Therefore, we may infer that Location and Financial Literacy of
the respondents are not related with each other.
TABLE 4. 35 - Chi-Square Tests – Location and Financial Literacy of the Respondent
Value Df Asymp. Sig. (2-
sided)
Pearson Chi-Square .134a 3 .987
a. 0 cells (0.0%) have expected count less than 5. The minimum expected count
is 70.50.
Source: Primary Data
4.4 Awareness- level for various Investment Avenues
The respondents were asked to select their level of awareness pertaining to various
Investment Avenues. The awareness level was measured in 3 point scale where 3 indicate
completely aware, 2 indicates moderately aware and 1 indicates unaware regarding
Investment Avenue. The result is shown below.
4.4.1 Frequency Analysis
The following section discusses the frequency analysis of different investment avenues.
1. Saving Account
The Table below shows the frequency and its percentage regarding the awareness about the
Savings account. 70 percent of the respondents are completely aware about the Savings

89
Account. 15 percent of the respondents are moderately aware regarding the Savings Account
and remaining 15 percent of the respondents are not aware about savings account.
TABLE 4. 36 - Awareness of Savings Account
Frequency Percent
Cumulative
Percent
Valid
Unaware 90 15.0 15.0
Moderately Aware 90 15.0 30.0
Completely Aware 420 70.0 100.0
Total 600 100.0
Source: Primary Data
2. Fixed Deposit
The Table below shows the frequency and its percentage regarding the awareness about the
Fixed Deposit. 70 percent of the respondents are completely aware about the Fixed Deposit.
10 percent of the respondents are moderately aware regarding the Fixed Deposit and
remaining 20 percent of the respondents are not aware about Fixed Deposit.
TABLE 4. 37 - Awareness of Fixed Deposit
Frequency Percent
Cumulative
Percent
Valid
Unaware 120 20.0 20.0
Moderately Aware 60 10.0 30.0
Completely Aware 420 70.0 100.0
Total 600 100.0
Source: Primary Data
3. Equity Shares
The Table below shows the frequency and its percentage regarding the awareness about the
Equity Shares. 37 percent of the respondents are completely aware about the Equity Shares.
23 percent of the respondents are moderately aware regarding the Equity Shares and
remaining 40 percent of the respondents are not aware about Equity Shares.

90
TABLE 4. 38 - Awareness of Equity Shares
Frequency Percent
Cumulative
Percent
Valid
Unaware 240 40.0 40.0
Moderately Aware 138 23.0 63.0
Completely Aware 222 37.0 100.0
Total 600 100.0
Source: Primary Data
4. Bonds
The Table below shows the frequency and its percentage regarding the awareness about the
Bonds. 54 percent of the respondents are completely aware about the Bonds. 23 percent of
the respondents are moderately aware regarding the Bonds and remaining 23 percent of the
respondents are not aware about Bonds.
TABLE 4. 39 - Awareness of Bonds
Frequency Percent
Cumulative
Percent
Valid
Unaware 138 23.0 23.0
Moderately Aware 138 23.0 46.0
Completely Aware 324 54.0 100.0
Total 600 100.0
Source: Primary Data
5. Derivatives
The Table below shows the frequency and its percentage regarding the awareness about the
Derivatives. 17 percent of the respondents are completely aware about the Derivatives. 23
percent of the respondents are moderately aware regarding the Derivatives and remaining 60
percent of the respondents are not aware about Derivatives.
TABLE 4. 40 - Awareness of Derivatives
Frequency Percent
Cumulative
Percent
Valid
Unaware 360 60.0 60.0
Moderately Aware 138 23.0 83.0
Completely Aware 102 17.0 100.0
Total 600 100.0

91
6. Mutual Funds
The Table 4.41 shows the frequency and its percentage regarding the awareness about the
Mutual Funds. 62 percent of the respondents are completely aware about the Mutual Funds.
18 percent of the respondents are moderately aware regarding the Mutual Funds and
remaining 20 percent of the respondents are not aware about Mutual Funds.
TABLE 4. 41 - Awareness of Mutual Funds
Frequency Percent
Cumulative
Percent
Valid
Unaware 120 20.0 20.0
Moderately Aware 108 18.0 38.0
Completely Aware 372 62.0 100.0
Total 600 100.0
Source: Primary Data
7. PPF
The Table 4.42 shows the frequency and its percentage regarding the awareness about the
Public Provident Fund. 65 percent of the respondents are completely aware about the PPF. 25
percent of the respondents are moderately aware regarding the PPF and remaining 10 percent
of the respondents are not aware about PPF.
TABLE 4. 42 - Awareness of PPF
Frequency Percent
Cumulative
Percent
Valid
Unaware 60 10.0 10.0
Moderately Aware 150 25.0 35.0
Completely Aware 390 65.0 100.0
Total 600 100.0
Source: Primary Data
8. Other Post Office Schemes
The Table 4.43 shows the frequency and its percentage regarding the awareness about the
Other Post Office Schemes. 66 percent of the respondents are completely aware about the
Other Post Office Schemes. 34 percent of the respondents are moderately aware regarding it.
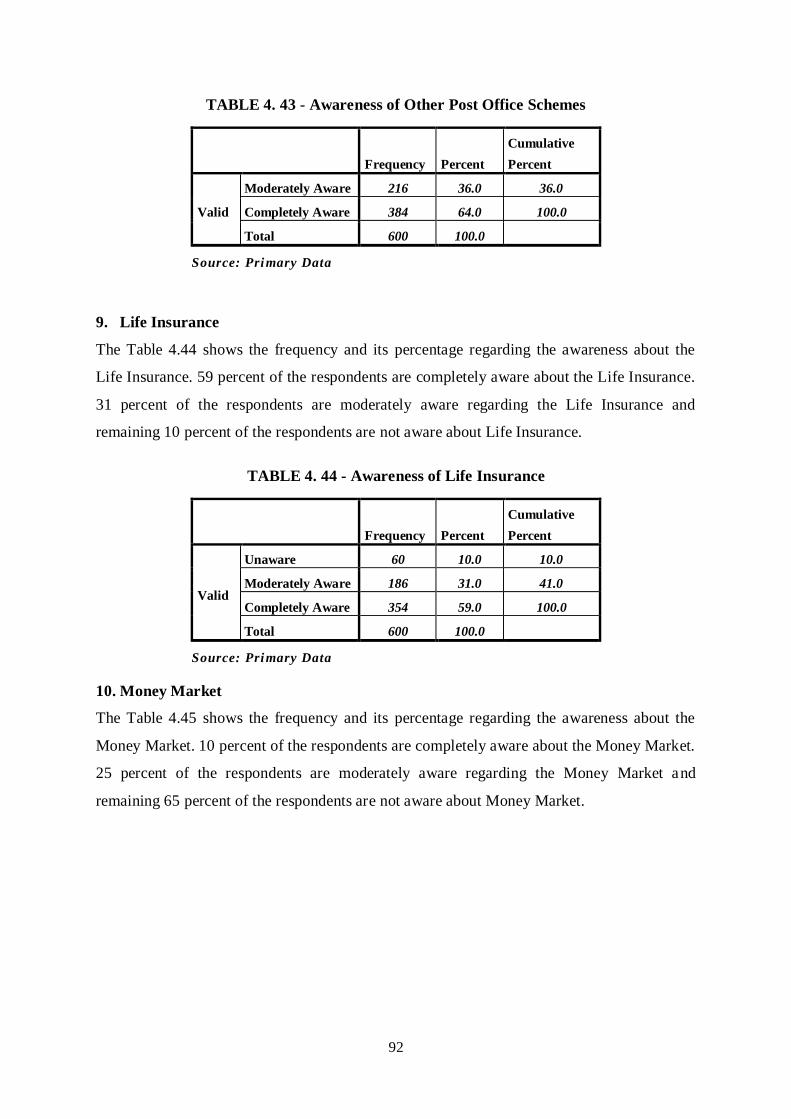
92
TABLE 4. 43 - Awareness of Other Post Office Schemes
Frequency Percent
Cumulative
Percent
Valid
Moderately Aware 216 36.0 36.0
Completely Aware 384 64.0 100.0
Total 600 100.0
Source: Primary Data
9. Life Insurance
The Table 4.44 shows the frequency and its percentage regarding the awareness about the
Life Insurance. 59 percent of the respondents are completely aware about the Life Insurance.
31 percent of the respondents are moderately aware regarding the Life Insurance and
remaining 10 percent of the respondents are not aware about Life Insurance.
TABLE 4. 44 - Awareness of Life Insurance
Frequency Percent
Cumulative
Percent
Valid
Unaware 60 10.0 10.0
Moderately Aware 186 31.0 41.0
Completely Aware 354 59.0 100.0
Total 600 100.0
Source: Primary Data
10. Money Market
The Table 4.45 shows the frequency and its percentage regarding the awareness about the
Money Market. 10 percent of the respondents are completely aware about the Money Market.
25 percent of the respondents are moderately aware regarding the Money Market and
remaining 65 percent of the respondents are not aware about Money Market.

93
TABLE 4. 45 - Awareness of Money Market
Frequency Percent
Cumulative
Percent
Valid
Unaware 390 65.0 65.0
Moderately Aware 150 25.0 90.0
Completely Aware 60 10.0 100.0
Total 600 100.0
Source: Primary Data
11. Tax Saving Scheme
The Table 4.46 shows the frequency and its percentage regarding the awareness about the
Tax Saving Schemes. 62 percent of the respondents are completely aware about the Tax
Saving Schemes. 18 percent of the respondents are moderately aware regarding the Tax
Saving Schemes and remaining 20 percent of the respondents are not aware about Tax Saving
Schemes.
TABLE 4. 46 - Awareness of Tax Saving Scheme
Frequency Percent
Cumulative
Percent
Valid
Unaware 120 20.0 20.0
Moderately Aware 108 18.0 38.0
Completely Aware 372 62.0 100.0
Total 600 100.0
Source: Primary Data
12. Real Estate
The Table 4.47 shows the frequency and its percentage regarding the awareness about the
Real Estate. 25 percent of the respondents are completely aware about the Real Estate. 48
percent of the respondents are moderately aware regarding the Real Estate and remaining 27
percent of the respondents are not aware about Real Estate.

94
TABLE 4. 47 - Awareness of Real Estate
Frequency Percent
Cumulative
Percent
Valid
Unaware 162 27.0 27.0
Moderately Aware 288 48.0 75.0
Completely Aware 150 25.0 100.0
Total 600 100.0
Source: Primary Data
13. Non-Conventional Avenues
The Table 4.48 shows the frequency and its percentage regarding the awareness about the
Non-Conventional Avenues. 15.3 percent of the respondents are completely aware about the
Non-Conventional Avenues. 30 percent of the respondents are moderately aware regarding
the Savings Account and remaining 54.7 percent of the respondents are not aware about Non-
Conventional Avenues.
TABLE 4. 48 - Awareness of Non-Conventional Avenues
Frequency Percent
Cumulative
Percent
Valid
Unaware 328 54.7 54.7
Moderately Aware 180 30.0 84.7
Completely Aware 92 15.3 100.0
Total 600 100.0
Source: Primary Data
From Table 4.49, one can see that highest awareness has been observed for Post Office
schemes, PPF , Life Insurance and Saving Bank Account. Lowest awareness has been
observed for Money Market, Derivatives and Non- Conventional Avenues like precious
coins, paintings etc. Thus one can infer that respondents possess fair awareness regarding
conventional products like FD, PPF, Saving Account, Life Insurance, while awareness
regarding non-conventional products like Real estate, Money Market, NCA, Derivatives is
very low.

95
TABLE 4. 49 - Descriptive Statistics for Awareness of Financial Products
Sr. No. Financial Products Descriptive Statistics
(Mode)
1 Saving Account 3
2 Fixed Deposits 3
3 Equity Shares 1
4 Bonds 3
5 Derivatives 1
6 Mutual Funds 3
7 PPF 3
8 Other Post Office Schemes 3
9 Life Insurance 3
10 Money Market 1
11 Tax Saving Schemes 3
12 Real Estate 2
13 Non - Conventional Avenues 1
Source: Primary Data
4.4.2 Inferential Statistics Pertaining to Awareness of Different Investment Avenues
To find association between Awareness level of respondents towards various investment
avenues and different demographic variables, Mann Whitney U Test and Kruskal Wallis Test
had been used.
Ho9: Awareness of different Investment avenues does not differ significantly with
respect to gender of the respondents.
To test this hypothesis, Mann Whitney U test has been applied. Result of test is shown in the
Table 4.50.

96
TABLE 4. 50 - Mann-Whitney U test – Gender and Awareness of Investment Avenues
Gender N Mean Rank Sum of Ranks Asymp. Sig. (2-
tailed)
Saving Account
Male 358 327.32 117179.00
0.000 Female 242 260.83 63121.00
Total 600
FD
Male 358 342.90 122759.00
0.000 Female 242 237.77 57541.00
Total 600
Shares
Male 358 322.62 115499.00
0.000 Female 242 267.77 64801.00
Total 600
Bonds
Male 358 309.84 110921.00
0.000 Female 242 286.69 69379.00
Total 600
Derivatives
Male 358 297.76 106598.00
0.000 Female 242 304.55 73702.00
Total 600
Mutual Funds
Male 358 331.51 118679.00
0.000 Female 242 254.63 61621.00
Total 600
PPF
Male 358 346.42 124019.00
0.000 Female 242 232.57 56281.00
Total 600
Other Post Office Schemes
Male 358 339.78 121643.00
0.001 Female 242 242.38 58657.00
Total 600
Life Insurance
Male 358 323.44 115793.00
0.076 Female 242 266.56 64507.00
Total 600
Money Market
Male 358 283.66 101549.00
0.591 Female 242 325.42 78751.00
Total 600
Tax Saving Scheme
Male 358 320.54 114755.00
0.000 Female 242 270.85 65545.00
Total 600
Real Estate
Male 358 314.88 112727.00
0.007 Female 242 279.23 67573.00
Total 600

97
Non-Conventional
Avenues
Male 358 267.97 95935.00
0.000 Female 242 348.62 84365.00
Total 600
Source: Primary Data
From Table 4.50, it can be interpreted that overall significant value for all the investment
avenues except Money Market is less than 0.05. So we reject the null hypothesis for all the
other investment avenues except Money Market. Awareness regarding Money Market
doesn‘t differ significantly with Gender.
H010: Awareness of different Investment avenues does not differ significantly with
respect to Age of the respondents.
Kruskal Wallis Test has been performed to test the results. The Table 4.51 shows the Mean
Rank of Percentage of Age of the respondents and Awareness of different Investment
Avenues.
TABLE 4. 51 – Mean Rank of Awareness with Age of the respondents
Age N Mean Rank
Saving Account
20-35 213 303.88
36-58 276 314.14
59 and above 111 260.09
Total 600
FD
20-35 213 306.56
36-58 276 323.22
59 and above 111 232.39
Total 600
Shares
20-35 213 371.78
36-58 276 246.86
59 and above 111 297.09
Total 600
Bonds
20-35 213 301.33
36-58 276 337.33
59 and above 111 207.34
Total 600
Derivatives 20-35 213 345.44
36-58 276 239.35
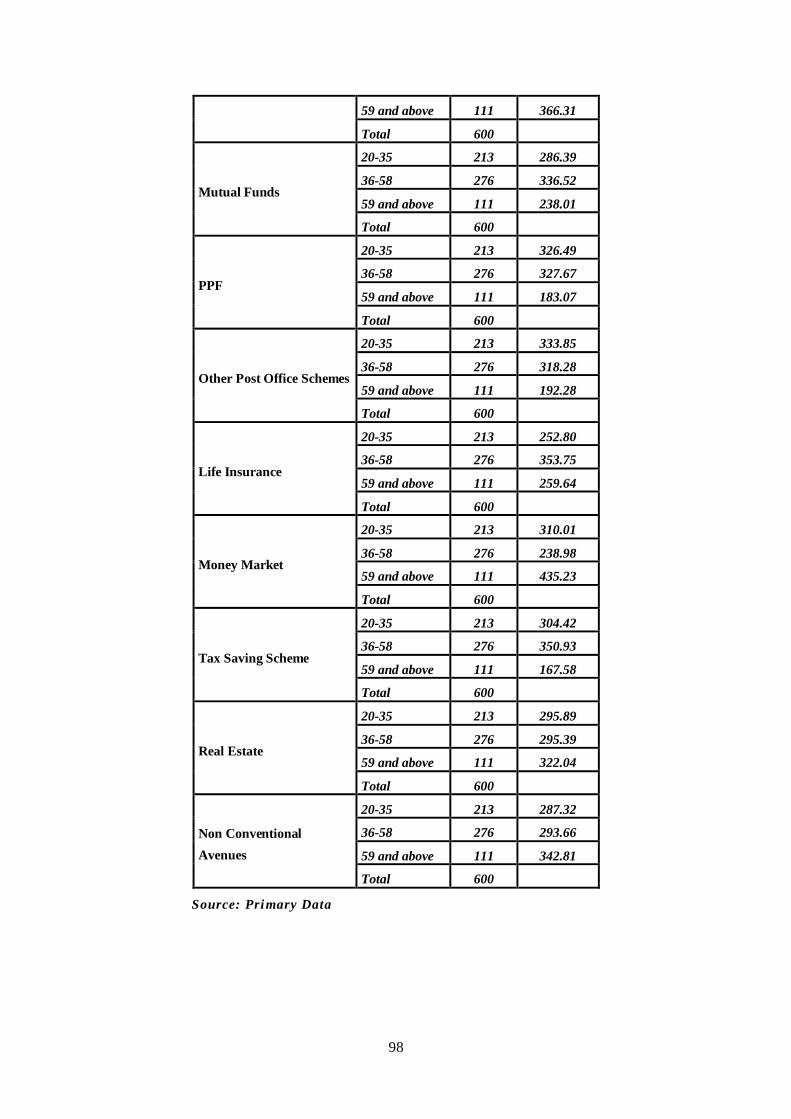
98
59 and above 111 366.31
Total 600
Mutual Funds
20-35 213 286.39
36-58 276 336.52
59 and above 111 238.01
Total 600
PPF
20-35 213 326.49
36-58 276 327.67
59 and above 111 183.07
Total 600
Other Post Office Schemes
20-35 213 333.85
36-58 276 318.28
59 and above 111 192.28
Total 600
Life Insurance
20-35 213 252.80
36-58 276 353.75
59 and above 111 259.64
Total 600
Money Market
20-35 213 310.01
36-58 276 238.98
59 and above 111 435.23
Total 600
Tax Saving Scheme
20-35 213 304.42
36-58 276 350.93
59 and above 111 167.58
Total 600
Real Estate
20-35 213 295.89
36-58 276 295.39
59 and above 111 322.04
Total 600
Non Conventional
Avenues
20-35 213 287.32
36-58 276 293.66
59 and above 111 342.81
Total 600
Source: Primary Data

99
TABLE 4. 52 – Test Statisticsa,b - Kruskal Wallis Test – Awareness Different
Investment Avenues among Age of the respondents
Investment Avenues Chi-Square df Asymp.
Sig.
Saving Account 12.027 2 .002
FD 34.158 2 .000
Shares 71.562 2 .000
Bonds 54.412 2 .000
Derivatives 84.315 2 .000
Mutual Funds 37.110 2 .000
PPF 88.195 2 .000
Other Post Office Schemes 78.192 2 .000
Life Insurance 63.290 2 .000
Money Market 144.557 2 .000
Tax Saving Scheme 118.651 2 .000
Real Estate 2.463 2 .292
Non Conventional
Avenues 10.264 2 .006
a. Kruskal Wallis Test
b. Grouping Variable: Age
Source: Primary Data
Table 4.52 shows the calculated Chi-Square, degree of freedom, and significant value. For
Awareness regarding Saving Account, FD, Shares, Bonds, Derivatives, Mutual Funds, PPF,
Post Office Schemes, Life Insurance, Money Market, Tax Saving Schemes and Non-
Conventional Avenues – P Value is less than 0.05 , so we reject the null hypothesis for these
factors. For Real Estate, P- Value is more than 0.05. So, for Real Estate, we fail to reject the
Null Hypothesis. Hence it, can be concluded that for Saving Account, FD, Shares, Bonds,
Derivatives, Mutual Funds, PPF, Post Office Schemes, Life Insurance, Money Market, Tax
Saving Schemes and Non-Conventional Avenues there is significant difference in Awareness
and Age of the respondents. There is no significant difference in Awareness regarding Real
Estate and Age of the respondents.

100
H011: Awareness of different Investment avenues does not differ significantly with
respect to Education of the respondents.
Kruskal Wallis Test has been performed to test the results. The Table 4.53 shows the Mean
Rank of Percentage of Education of the respondents and Awareness of different Investment
Avenues.
TABLE 4. 53 – Mean Rank of Awareness with Education of the respondents
Education N Mean Rank
Saving Account
High school 108 303.83
Graduation 315 291.50
Post Graduation 177 314.48
Total 600
FD
High school 108 292.72
Graduation 315 277.83
Post Graduation 177 345.58
Total 600
Shares
High school 108 320.08
Graduation 315 280.59
Post Graduation 177 323.99
Total 600
Bonds
High school 108 290.61
Graduation 315 280.28
Post Graduation 177 342.52
Total 600
Derivatives
High school 108 321.25
Graduation 315 282.58
Post Graduation 177 319.74
Total 600
Mutual Funds
High school 108 289.61
Graduation 315 266.25
Post Graduation 177 368.09
Total 600
PPF
High school 108 298.42
Graduation 315 284.17
Post Graduation 177 330.84
Total 600
Other Post Office Schemes High school 108 325.17
Graduation 315 312.31

101
Post Graduation 177 264.43
Total 600
Life Insurance
High school 108 305.06
Graduation 315 266.53
Post Graduation 177 358.18
Total 600
Money Market
High school 108 287.86
Graduation 315 288.40
Post Graduation 177 329.74
Total 600
Tax Saving Scheme
High school 108 291.17
Graduation 315 270.06
Post Graduation 177 360.36
Total 600
Real Estate
High school 108 288.39
Graduation 315 275.03
Post Graduation 177 353.21
Total 600
Non Conventional
Avenues
High school 108 359.85
Graduation 315 286.65
Post Graduation 177 288.93
Total 600
Source: Primary Data
TABLE 4. 54 – Test Statisticsa,b - Kruskal Wallis Test – Awareness Different
Investment Avenues among Education of the respondents.
Investment Avenues Chi-Square Df Asymp.
Sig.
Saving Account 3.138 2 .208
FD 27.123 2 .000
Shares 10.062 2 .007
Bonds 18.376 2 .000
Derivatives 9.251 2 .010
Mutual Funds 52.996 2 .000
PPF 11.617 2 .003
Other Post Office Schemes 16.364 2 .000
Life Insurance 41.589 2 .000
Money Market 10.078 2 .006
Tax Saving Scheme 41.632 2 .000

102
Real Estate 27.739 2 .000
Non Conventional
Avenues 19.179 2 .000
a. Kruskal Wallis Test
b. Grouping Variable: Education
Source: Primary Data
Table 4.54 depicts the calculated Chi-Square, degree of freedom, and significance value. P -
Value is less than 0.05 for Awareness regarding FD, Shares, Bonds, Derivatives, Mutual
Funds, PPF, Post Office Schemes, Life Insurance, Money Market, Tax Saving Schemes, Real
Estate and Non-Conventional Avenues. So, we reject the null hypothesis for them. For
Saving Bank Account, P- Value is more than 0.05. So, we fail to reject the Null Hypothesis
for this factor. Hence it can be concluded that for factors of FD, Shares, Bonds, Derivatives,
Mutual Funds, PPF, Post Office Schemes, Life Insurance, Money Market, Tax Saving
Schemes, Real Estate and Non-Conventional Avenues, there is significant difference between
Awareness and Education of the respondents. But, there is no significant difference in
Awareness regarding Saving Bank Account and Education of the respondents.
H012: Awareness of different Investment avenues does not differ significantly with
respect to Job Type of the respondents.
Kruskal Wallis Test has been performed to test the results. The Table 4.55 shows the Mean
Rank of Percentage of Job Type of the respondents and Awareness of different Investment
Avenues.
TABLE 4. 55 – Mean Rank of Awareness with Job Type of the respondents
Job Type N Mean Rank
Saving Account
Public Sector 200 286.70
Private Sector 200 308.15
Government 200 306.65
Total 600
FD
Public Sector 200 252.65
Private Sector 200 312.05
Government 200 336.80
Total 600
Shares Public Sector 200 311.26
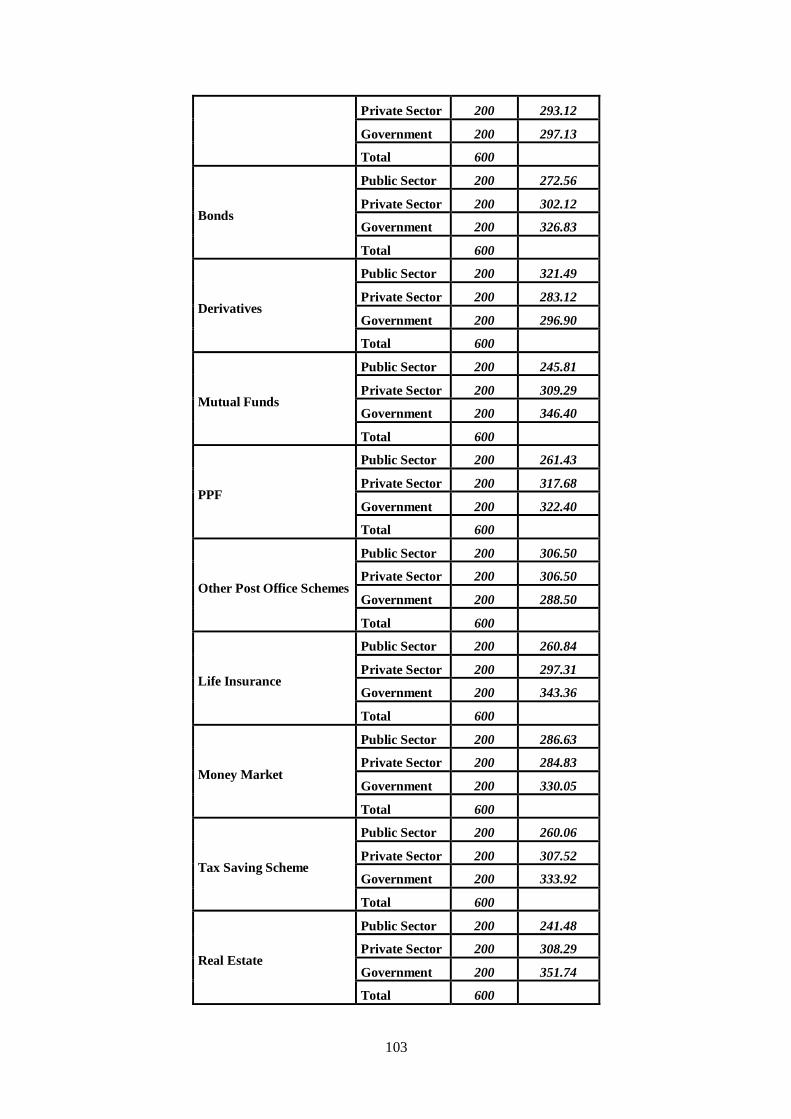
103
Private Sector 200 293.12
Government 200 297.13
Total 600
Bonds
Public Sector 200 272.56
Private Sector 200 302.12
Government 200 326.83
Total 600
Derivatives
Public Sector 200 321.49
Private Sector 200 283.12
Government 200 296.90
Total 600
Mutual Funds
Public Sector 200 245.81
Private Sector 200 309.29
Government 200 346.40
Total 600
PPF
Public Sector 200 261.43
Private Sector 200 317.68
Government 200 322.40
Total 600
Other Post Office Schemes
Public Sector 200 306.50
Private Sector 200 306.50
Government 200 288.50
Total 600
Life Insurance
Public Sector 200 260.84
Private Sector 200 297.31
Government 200 343.36
Total 600
Money Market
Public Sector 200 286.63
Private Sector 200 284.83
Government 200 330.05
Total 600
Tax Saving Scheme
Public Sector 200 260.06
Private Sector 200 307.52
Government 200 333.92
Total 600
Real Estate
Public Sector 200 241.48
Private Sector 200 308.29
Government 200 351.74
Total 600

104
Non Conventional
Avenues
Public Sector 200 254.98
Private Sector 200 286.09
Government 200 360.43
Total 600
Source: Primary Data
TABLE 4. 56: Test Statisticsa,b - Kruskal Wallis Test – Awareness Different
Investment Avenues among Job Type of the respondents.
Investment Avenue Chi-Square df Asymp.
Sig.
Saving Account 2.935 2 .230
FD 38.421 2 .000
Shares 1.384 2 .501
Bonds 12.011 2 .002
Derivatives 6.557 2 .038
Mutual Funds 46.057 2 .000
PPF 21.612 2 .000
Other Post Office Schemes 2.080 2 .353
Life Insurance 29.797 2 .000
Money Market 12.315 2 .002
Tax Saving Scheme 24.933 2 .000
Real Estate 48.080 2 .000
Non Conventional
Avenues 48.481 2 .000
a. Kruskal Wallis Test
b. Grouping Variable: Job Type
Source: Primary Data
Table 4.56 shows the calculated Chi-Square, degree of freedom, and significance value. P -
Value is less than 0.05 for Awareness regarding FD, Bonds, Derivatives, Mutual Funds, PPF,
Life Insurance, Money Market, Tax Saving Schemes, Real Estate and Non-Conventional
Avenues. So, we reject the null hypothesis for them. For Saving Bank Account, Shares and
Post Office Schemes, P- Value is more than 0.05. So, we fail to reject the Null Hypothesis.
Hence, it can be concluded that for FD, Bonds, Derivatives, Mutual Funds, PPF, Life
Insurance, Money Market, Tax Saving Schemes, Real Estate and Non-Conventional
Avenues, there is significant difference in Awareness and Job Type of the respondents.

105
However, there is no significant difference in Awareness regarding Saving Bank Account,
Shares and Post Office Schemes and Job Type of the respondents.
H013: Awareness of different Investment avenues does not differ significantly with
respect to Experience of the respondents. Kruskal Wallis Test has been performed to test
the results. The Table 4.57 shows the Mean Rank of Percentage of Experience of the
respondents and Awareness of different Investment Avenues.
TABLE 4. 57 – Mean Rank of Awareness with Experience of the respondents
Experience N Mean Rank
Saving Account
Less Than 5 Years 22 179.14
5-15 years 296 316.41
16-25 Years 177 291.77
25 and Above 105 295.79
Total 600
FD
Less Than 5 Years 22 180.50
5-15 years 296 326.04
16-25 Years 177 305.42
25 and Above 105 245.36
Total 600
Shares
Less Than 5 Years 22 299.68
5-15 years 296 341.70
16-25 Years 177 251.53
25 and Above 105 267.07
Total 600
Bonds
Less Than 5 Years 22 268.45
5-15 years 296 325.63
16-25 Years 177 282.55
25 and Above 105 266.64
Total 600
Derivatives
Less Than 5 Years 22 427.05
5-15 years 296 300.03
16-25 Years 177 266.74
25 and Above 105 332.21
Total 600
Mutual Funds
Less Than 5 Years 22 178.32
5-15 years 296 313.88
16-25 Years 177 322.09

106
25 and Above 105 251.99
Total 600
PPF
Less Than 5 Years 22 228.91
5-15 years 296 335.16
16-25 Years 177 294.14
25 and Above 105 228.50
Total 600
Other Post Office
Schemes
Less Than 5 Years 22 381.23
5-15 years 296 327.42
16-25 Years 177 274.60
25 and Above 105 251.36
Total 600
Life Insurance
Less Than 5 Years 22 160.05
5-15 years 296 298.68
16-25 Years 177 339.58
25 and Above 105 269.19
Total 600
Money Market
Less Than 5 Years 22 244.59
5-15 years 296 289.86
16-25 Years 177 299.06
25 and Above 105 344.64
Total 600
Tax Saving Scheme
Less Than 5 Years 22 245.68
5-15 years 296 332.24
16-25 Years 177 298.09
25 and Above 105 226.56
Total 600
Real Estate
Less Than 5 Years 22 275.27
5-15 years 296 299.26
16-25 Years 177 352.64
25 and Above 105 221.39
Total 600
Non Conventional
Avenues
Less Than 5 Years 22 371.05
5-15 years 296 326.00
16-25 Years 177 262.84
25 and Above 105 277.32
Total 600
Source: Primary Data

107
TABLE 4. 58 : Test Statisticsa,b - Kruskal Wallis Test – Awareness Different Investment
Avenues among Experience of the respondents.
Investment Avenues Chi-Square df Asymp.
Sig.
Saving Account 21.229 3 .000
FD 42.801 3 .000
Shares 39.794 3 .000
Bonds 15.733 3 .001
Derivatives 28.627 3 .000
Mutual Funds 31.641 3 .000
PPF 47.885 3 .000
Other Post Office Schemes 35.153 3 .000
Life Insurance 35.217 3 .000
Money Market 14.427 3 .002
Tax Saving Scheme 41.806 3 .000
Real Estate 44.914 3 .000
Non-Conventional
Avenues 25.161 3 .000
a. Kruskal Wallis Test
b. Grouping Variable: Experience
Source: Primary Data
Table 4.58 shows the calculated Chi-Square, degree of freedom, and significance value. P -
Value is less than 0.05 for Awareness regarding Saving Bank Account, FD, Bonds, Shares,
Derivatives, Mutual Funds, PPF, Post Office Schemes, Life Insurance, Money Market, Tax
Saving Schemes, Real Estate and Non-Conventional Avenues. So, we reject the null
hypothesis for them. Hence, it can be concluded that for Saving Bank Account, FD, Bonds,
Shares, Derivatives, Mutual Funds, PPF, Post Office Schemes, Life Insurance, Money
Market, Tax Saving Schemes, Real Estate and Non-Conventional Avenues, there is
significant difference in Awareness and Experience of the respondents.
H014: Awareness of different Investment avenues does not differ significantly with
respect to Income of the respondents.
Kruskal Wallis Test has been performed to test the results. The Table 4.59 shows the Mean
Rank of Percentage of Income of the respondents and Awareness of different Investment
Avenues.

108
TABLE 4. 59 – Mean Rank of Awareness with Income of the respondents
Income N Mean Rank
Saving Account
Less Than 5 Lakhs 84 240.14
5-10 Lakh 334 315.41
10-15 lakhs 140 284.00
More Than 15 lakh 42 357.64
Total 600
FD
Less Than 5 Lakhs 84 246.21
5-10 Lakh 334 313.70
10-15 lakhs 140 293.43
More Than 15 lakh 42 327.64
Total 600
Shares
Less Than 5 Lakhs 84 346.46
5-10 Lakh 334 288.91
10-15 lakhs 140 299.15
More Than 15 lakh 42 305.21
Total 600
Bonds
Less Than 5 Lakhs 84 285.75
5-10 Lakh 334 299.24
10-15 lakhs 140 311.86
More Than 15 lakh 42 302.14
Total 600
Derivatives
Less Than 5 Lakhs 84 384.71
5-10 Lakh 334 285.50
10-15 lakhs 140 295.34
More Than 15 lakh 42 268.57
Total 600
Mutual Funds
Less Than 5 Lakhs 84 259.93
5-10 Lakh 334 300.70
10-15 lakhs 140 310.40
More Than 15 lakh 42 347.07
Total 600
PPF
Less Than 5 Lakhs 84 254.43
5-10 Lakh 334 316.62
10-15 lakhs 140 282.71
More Than 15 lakh 42 323.71
Total 600
Other Post Office Schemes Less Than 5 Lakhs 84 222.79
5-10 Lakh 334 322.27

109
10-15 lakhs 140 309.93
More Than 15 lakh 42 251.36
Total 600
Life Insurance
Less Than 5 Lakhs 84 185.86
5-10 Lakh 334 299.06
10-15 lakhs 140 353.00
More Than 15 lakh 42 366.21
Total 600
Money Market
Less Than 5 Lakhs 84 334.25
5-10 Lakh 334 302.16
10-15 lakhs 140 288.93
More Than 15 lakh 42 258.36
Total 600
Tax Saving Scheme
Less Than 5 Lakhs 84 274.57
5-10 Lakh 334 297.09
10-15 lakhs 140 314.47
More Than 15 lakh 42 332.93
Total 600
Real Estate
Less Than 5 Lakhs 84 273.71
5-10 Lakh 334 292.10
10-15 lakhs 140 332.24
More Than 15 lakh 42 315.07
Total 600
Non Conventional
Avenues
Less Than 5 Lakhs 84 369.24
5-10 Lakh 334 290.46
10-15 lakhs 140 319.41
More Than 15 lakh 42 179.83
Total 600
Source: Primary Data
TABLE 4. 60 – Test Statisticsa,b - Kruskal Wallis Test – Awareness Different
Investment Avenues among Income of the respondents.
Investment Avenues Chi-Square df Asymp.
Sig.
Saving Account 28.430 3 .000
FD 17.651 3 .001
Shares 8.518 3 .036
Bonds 1.504 3 .681
Derivatives 31.130 3 .000

110
Mutual Funds 10.817 3 .013
PPF 15.590 3 .001
Other Post Office Schemes 37.530 3 .000
Life Insurance 72.842 3 .000
Money Market 8.918 3 .030
Tax Saving Scheme 5.868 3 .118
Real Estate 9.107 3 .028
Non Conventional
Avenues 45.093 3 .000
a. Kruskal Wallis Test
b. Grouping Variable: Income
Source: Primary Data
Table 4.60 shows the calculated Chi-Square, degree of freedom, and significance value. P -
Value is less than 0.05 for Awareness regarding Saving Account, FD, Shares, Derivatives,
Mutual Funds, PPF, Post office Schemes, Life Insurance, Money Market, Real Estate and
Non-Conventional Avenues. So, we reject the null hypothesis for them. For Bonds and Tax
Saving Schemes, P- Value is more than 0.05. So, we fail to reject the Null Hypothesis.
Hence, it can be concluded that for Saving Account, FD, Shares, Derivatives, Mutual Funds,
PPF, Life Insurance, Post office schemes, Money Market, Real Estate and Non-Conventional
Avenues there is significant difference in Awareness and Income of the respondents. There is
no significant difference in Awareness regarding Bonds, Tax Saving schemes and Income of
the respondents.
H015: Awareness of different Investment avenues does not differ significantly with
respect to Marital Status of the respondents.
Kruskal Wallis Test has been performed to test the results. The Table 4.61 shows the Mean
Rank of Percentage of Marital Status of the respondents and Awareness of different
Investment Avenues.
TABLE 4. 61 – Mean Rank of Awareness with Marital Status of the respondents
Marital Status N Mean Rank
Saving Account
Married 376 318.53
Unmarried 208 268.41
Widow/Widower 6 248.00
Divorcee 10 321.50
Total 600

111
FD
Married 376 337.52
Unmarried 208 230.55
Widow/Widower 6 255.50
Divorcee 10 390.50
Total 600
Shares
Married 376 316.73
Unmarried 208 269.91
Widow/Widower 6 336.50
Divorcee 10 305.00
Total 600
Bonds
Married 376 319.43
Unmarried 208 263.20
Widow/Widower 6 338.50
Divorcee 10 341.60
Total 600
Derivatives
Married 376 298.03
Unmarried 208 302.94
Widow/Widower 6 242.00
Divorcee 10 377.90
Total 600
Mutual Funds
Married 376 339.31
Unmarried 208 225.59
Widow/Widower 6 275.50
Divorcee 10 414.50
Total 600
PPF
Married 376 340.39
Unmarried 208 226.80
Widow/Widower 6 270.50
Divorcee 10 351.50
Total 600
Other Post Office Schemes
Married 376 303.98
Unmarried 208 291.67
Widow/Widower 6 358.50
Divorcee 10 318.50
Total 600
Life Insurance
Married 376 312.63
Unmarried 208 272.30
Widow/Widower 6 313.00
Divorcee 10 423.50

112
Total 600
Money Market
Married 376 295.19
Unmarried 208 307.57
Widow/Widower 6 258.00
Divorcee 10 378.50
Total 600
Tax Saving Scheme
Married 376 330.01
Unmarried 208 244.65
Widow/Widower 6 315.50
Divorcee 10 343.70
Total 600
Real Estate
Married 376 325.15
Unmarried 208 244.94
Widow/Widower 6 343.00
Divorcee 10 503.60
Total 600
Non Conventional
Avenues
Married 376 282.15
Unmarried 208 318.70
Widow/Widower 6 418.50
Divorcee 10 540.90
Total 600
Source: Primary Data
TABLE 4. 62 – Test Statisticsa,b - Kruskal Wallis Test – Awareness Different
Investment Avenues among Marital Status of the respondents.
Investment Avenues Chi-Square Df Asymp.
Sig.
Saving Account 18.291 3 .000
FD 83.517 3 .000
Shares 11.497 3 .009
Bonds 18.290 3 .000
Derivatives 3.644 3 .303
Mutual Funds 83.092 3 .000
PPF 82.621 3 .000
Other Post Office Schemes 2.127 3 .546
Life Insurance 16.246 3 .001
Money Market 4.350 3 .226
Tax Saving Scheme 44.323 3 .000

113
Real Estate 50.414 3 .000
Non Conventional
Avenues 35.379 3 .000
a. Kruskal Wallis Test
b. Grouping Variable: Marital Status
Source: Primary Data
Table 4.62 shows the calculated Chi-Square, degree of freedom, and significance value. P -
Value is less than 0.05 for Awareness regarding Saving Account, FD, Shares, Bonds, Mutual
Funds, PPF, Life Insurance, Tax Saving Schemes, Real Estate and Non-Conventional
Avenues. So, we reject the null hypothesis for them. For Derivatives, Post office Schemes
and Money Market, P- Value is more than 0.05. So, we fail to reject the Null Hypothesis.
Hence it can be concluded that for Saving Account, FD, Shares, Bonds, Mutual Funds, PPF,
Life Insurance, Tax Saving Schemes, Real Estate and Non-Conventional Avenues, there is
significant difference in Awareness and Marital Status of the respondents. There is no
significant difference in Awareness regarding Derivatives, Post office Schemes and Money
Market and Marital Status of the respondents.
H016: Awareness of different Investment avenues does not differ significantly with
respect to Location of the respondents.
Kruskal Wallis Test has been performed to test the results. The Table 4.63 shows the Mean
Rank of Percentage of Location of the respondents and Awareness of different Investment
Avenues.
TABLE 4. 63 – Mean Rank of Awareness with Location of the respondents
Location N Mean Rank
Saving Account
Ahmedabad 150 300.20
Baroda 150 300.80
Rajkot 150 298.50
Surat 150 302.50
Total 600
FD
Ahmedabad 150 298.30
Baroda 150 302.70
Rajkot 150 296.70
Surat 150 304.30
Total 600
Shares Ahmedabad 150 302.36

114
Baroda 150 298.64
Rajkot 150 299.90
Surat 150 301.10
Total 600
Bonds
Ahmedabad 150 298.50
Baroda 150 302.50
Rajkot 150 298.50
Surat 150 302.50
Total 600
Derivatives
Ahmedabad 150 303.36
Baroda 150 297.64
Rajkot 150 303.36
Surat 150 297.64
Total 600
Mutual Funds
Ahmedabad 150 298.14
Baroda 150 302.86
Rajkot 150 296.54
Surat 150 304.46
Total 600
PPF
Ahmedabad 150 298.90
Baroda 150 302.10
Rajkot 150 297.10
Surat 150 303.90
Total 600
Other Post Office Schemes
Ahmedabad 150 298.50
Baroda 150 302.50
Rajkot 150 298.50
Surat 150 302.50
Total 600
Life Insurance
Ahmedabad 150 296.98
Baroda 150 304.02
Rajkot 150 296.98
Surat 150 304.02
Total 600
Money Market
Ahmedabad 150 301.40
Baroda 150 299.60
Rajkot 150 301.40
Surat 150 299.60
Total 600
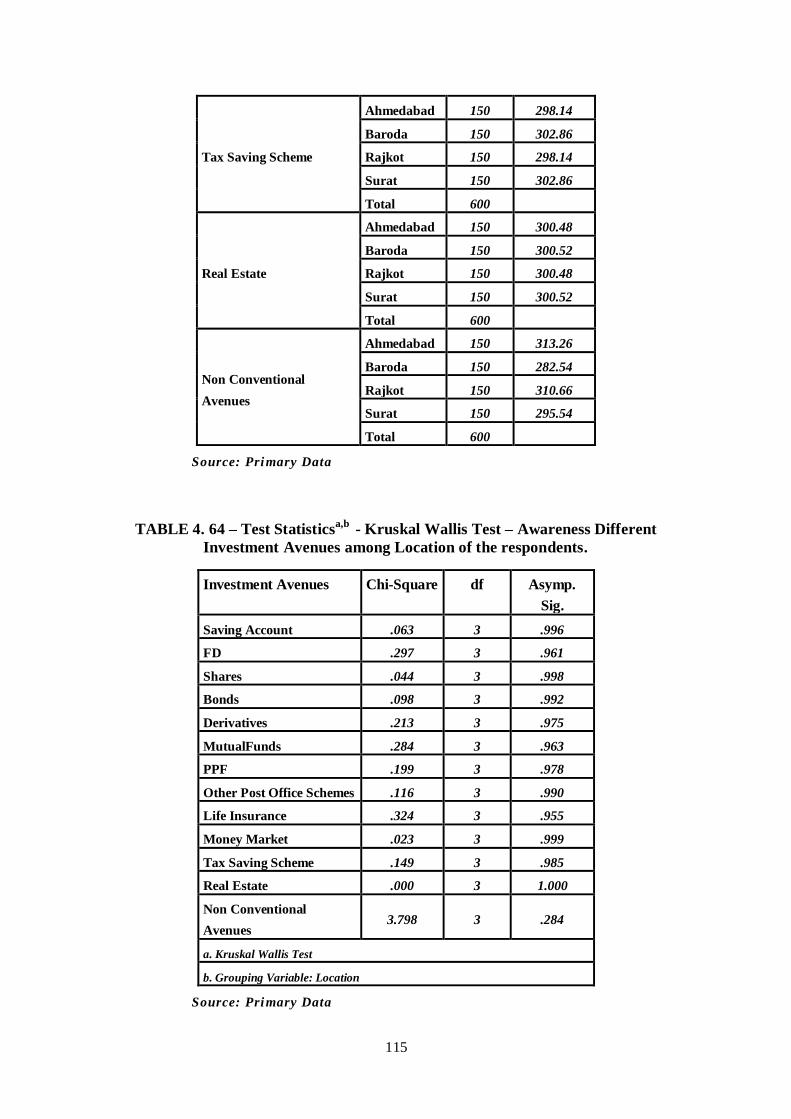
115
Tax Saving Scheme
Ahmedabad 150 298.14
Baroda 150 302.86
Rajkot 150 298.14
Surat 150 302.86
Total 600
Real Estate
Ahmedabad 150 300.48
Baroda 150 300.52
Rajkot 150 300.48
Surat 150 300.52
Total 600
Non Conventional
Avenues
Ahmedabad 150 313.26
Baroda 150 282.54
Rajkot 150 310.66
Surat 150 295.54
Total 600
Source: Primary Data
TABLE 4. 64 – Test Statisticsa,b - Kruskal Wallis Test – Awareness Different
Investment Avenues among Location of the respondents.
Investment Avenues Chi-Square df Asymp.
Sig.
Saving Account .063 3 .996
FD .297 3 .961
Shares .044 3 .998
Bonds .098 3 .992
Derivatives .213 3 .975
MutualFunds .284 3 .963
PPF .199 3 .978
Other Post Office Schemes .116 3 .990
Life Insurance .324 3 .955
Money Market .023 3 .999
Tax Saving Scheme .149 3 .985
Real Estate .000 3 1.000
Non Conventional
Avenues 3.798 3 .284
a. Kruskal Wallis Test
b. Grouping Variable: Location
Source: Primary Data

116
Table 4.64 shows the calculated Chi-Square, degree of freedom, and significance value. P -
Value is more than 0.05 for Awareness regarding Saving Account, FD, Shares, Bonds,
Mutual Funds, Derivatives, Post office schemes, PPF, Life Insurance, Money Market, Tax
Saving Schemes, Real Estate and Non-Conventional Avenues. So, we fail to reject the Null
Hypothesis. Hence, we may infer that for Saving Account, FD, Shares, Bonds, Mutual
Funds, Derivatives, Post office schemes, PPF, Life Insurance, Money Market, Tax Saving
Schemes, Real Estate and Non-Conventional Avenues, there is no significant difference
between Awareness and Location of the respondents.

117
4.5 Attitude towards Personal Financial Planning
To analyze the attitude of the respondents for Personal Financial Planning, the statements
related to Personal Financial Planning pertaining to various components were presented
before the respondents and they were asked to rate these statements on a Five Point Scale.
The different components were: Money Management, Insurance Planning, Investments,
Retirement planning, Taxation Planning, Estate Planning and overall PFP. Attitude for each
individual component and Overall attitude of PFP had been checked. The descriptive
statistics of the statements are given below. The number in each cell indicates the frequency
of responses for each statement. Along with that Mean for every item is tabulated.
Where 1 -Strongly Disagree , 2 – Disagree, 3 –Neither Agree or Disagree , 4 – Agree, 5 – Strongly Agree
TABLE 4. 65 - Descriptive Statistics for Attitude of Personal Financial Planning
Sr.
No
Particulars 1 2 3 4 5 Mean
1 Budgeting and keeping financial records are
very essential
210 60 54 36 240 3.06
2 I should save more before spending the
balance.
48 60 78 120 294 3.92
3 I spend my money very carefully 30 66 90 240 174 3.77
4 I payoff the full credit card outstanding amount
every month
60 60 84 228 168 3.64
5 I spend more when I use a credit card 84 120 72 180 144 3.30
6 Insurance is a forced saving to ensure that
family gets continue stream of flow of income
to your family in event of death or accident
90 168 72 108 162 3.14
7 I have an adequate insurance to ensure that if I
were to passes away or become sick or
disabled, my family and I will not suffer
financially.
72 138 72 126 192 3.38
8 I have Life Insurance but no other type of
insurance i.e Health, Personal accident,
Property etc.
102 156 60 174 108 3.05
9 I do not have any Insurance 162 180 42 108 108 2.70
10 I consult an insurance agent for purchase of an
insurance
150 168 30 162 90 2.79

118
11 I take advise of my family, friends before
investing into insurance
72 204 48 174 102 3.05
12 I consider the coverage offered by insurance
company before purchasing it.
54 132 72 216 126 3.38
13 I often feel difficulty for purchasing financial
products
42 150 84 240 84 3.29
14 Long term savings with a regular saving
pattern is important
48 108 84 192 168 3.54
15 Investing is becoming important nowadays 24 30 108 168 270 4.05
16 Investment is commitment of funds to achieve
long term goals or objectives
18 30 132 186 234 3.98
17 I understand my risk profile- high risk taker,
medium risk taker, or low risk taker
60 30 90 180 240 3.85
18 I invest in different investment instruments i.e
shares, mutual fund, real estate, bonds with
minimal knowledge and research on it.
54 120 90 168 168 3.46
19 If I were given an amount of equal to six
month salary to invest, I would know exactly
what to do with it.
18 162 78 252 90 3.39
20 I know how taxes would be applied on my
different investments avenues
18 108 60 312 102 3.62
21 I utilize the various tax rebates that I‘m entitled
to when filing my tax returns.
12 48 90 324 126 3.84
22 I know the amount I need to fund a
comfortable retirement.
18 114 90 276 102 3.55
23 I have started planning for my retirement. 30 192 96 192 90 3.20
24 Retirement planning should be started at early
working age
30
126 78 240 126 3.51
25 My Retirement plan provides for inflation and
standard of living changes that will occur over
a period of time
30 96 90 252 132 3.60
26 I have a will 144 168 66 156 66 2.72
27 I understand what a trust is. 192 120 96 102 90 2.63
28 I know what income my family would receive
from proceeds of my estate
174 60 78 174 114 2.99
29 Estate planning is important to me. 90 102 78 228 102 3.25
30 I am aware about overall financial planning: i.e
Money Management, Investments, Insurance,
30 120 138 228 84 3.36

119
Retirement planning, estate planning, tax
planning
31 I feel that my financial plan is well balanced,
keeping into the mind all aspects: Money
Management, Investments, Insurance,
Retirement planning, estate planning, tax
planning
30 120 102 258 90 3.43
32 I set financial goals and objectives in my life. 30 132 114 234 90 3.37
33 I gather relevant data and analyze my current
financial position before I make financial
decision.
30 114 114 270 72 3.40
34 I freely discuss with others ,regarding financial
planning
42 108 102 264 84 3.40
35 I need expert for planning my finances. 66 120 90 216 108 3.30
36 I am actively involved in managing my
Financial Plan, I review my plan periodically
after the implementation.
30 216 96 168 90 3.12
37 I need to keep cash reserve in case of an
emergency
18 120 90 156 216 3.72
38
My willingness to take risk is factor I consider
before planning my finances.
30 78 54 252 186 3.81
39 I try to take information from all authenticated
sources and then invest my money.
30 78 60 306 126 3.70
40 I get influenced by my friends and relatives
while taking financial decisions.
90 162 78 138 132 3.10
41 I look at Economic factors such as prevailing
inflation and interest rates for financial
planning.
54 228 78 108 132 3.06
42 I look for Service provided by the company
before investing into that.
42 138 144 156 120 3.29
43 My decisions on planning also depend upon
knowledge of the representative of the
particular company.
90 108 126 216 60 3.08
44 I consider Future Responsibilities- Like
purchasing home, child‘s education, marriage
etc.
42 84 90 318 66 3.47
45 Expected Return on investment products is
important to me.
00 24 96 324 156 4.02

120
46 I consider Tax benefits linked with the
products
00 00 102 294 204 4.17
47 I look for Liquidity provided by the products 42 108 126 186 138 3.45
48 I consider stage of my life cycle before taking
any financial decisions.
48 132 78 264 78 3.32
49 Regular Cash flow for managing my routine
expenses is important factor to me.
54 60 48 252 186 3.76
50 Objective behind my planning is to minimize
inconvenience to my family members in case
of my death.
30 12 42 222 294 4.23
Source: Primary Data
Table 4.65 shows the results of the responses of the respondents for various factors of
Personal Financial Planning. First five statements denote Money Management Attitude of the
respondents. The mean score of first five statements show that respondents demonstrated
positive attitude towards Money Management. This is in consistent with Lai & Tan (2009) &
Tang et al. (2002a) in which people have positive attitude towards Money Management.
Respondents feel that budgeting and keeping financial records are important to them; they
also give importance to ‗savings and think before spending money‘. This shows the
responsible behavior of the respondents as far as money management is considered.
Interesting to note here that respondents confess that they spend more when they use credit
card, although they don‘t carry forward the bill payments, they pay full credit card bill each
month. As per table 4.66, respondents possess overall positive attitude towards Money
Management.
In Table 4.65 - Statements No. 6 to 12 pertain to Attitude towards Insurance Planning.
Respondents feel that they should have enough Insurance for which they take Life Insurance
Policies but they have agreed that they don‘t invest in General Insurance which is also
equally important. They don‘t consult or seek advice of Financial Planner but they rely upon
suggestions of the peer group while purchasing Insurance. From Table 4.66, total Mean score
of Insurance Planning is 3.08 which indicates that the respondents have positive attitude
towards Insurance.
Statements No. 13 to 21 in Table 4.65 are related to Investment Management. Respondents
have shown positive attitude towards Investment Management. They feel that the Investments

121
are long term commitments. They are of the opinion that though Investments are very
important, they invest without prior research and that they face difficulty while purchasing
financial products. This shows that investments are important to them but they require experts
who can help them to invest.
Table 4.66 suggests that overall attitude towards investment planning is 3.71 which indicates
positive attitude of respondents towards Investment Management.
Table 4.65 – Statements No.22 to 25 are for Retirement Planning. Respondents have agreed
that Retirement Planning should start at early age and that the Retirement amount should be
such so as to maintain the similar lifestyle after retirement. However, majority of the
respondents have not started saving the funds as a part of Retirement Planning. Overall mean
for Retirement Planning comes to 3.46, which shows that respondents have fairly positive
attitude towards it.
Statements No. 26 to 29 in Table 4.65 are for Estate Planning. Respondents have agreed that
it is important for them but majority of them have not prepared well and they have agreed
that they don‘t know what a ‗trust‘ is? It indicates that respondents are not aware about
working of Estate Management. We find from Table 4.66 that overall mean score of Estate
Management is 2.89. This is lower than all other components of Personal Financial Planning.
Statement No. 30 -37 in Table 4.65 are for Overall Personal Financial Planning. Out of 600
respondents only 312 are aware about all the components of Financial Planning. This shows
that respondents don‘t have fair awareness of all the components of Financial Plan and hence
their Plan cannot be a balanced one. It might be possible that their plan may not be linked
with their financial goals. Mean score of the statement ‗I need experts for planning my
finances‘ is 3.6. This shows that the respondents feel that they should have experts for their
Financial Planning. They also freely discuss regarding their Financial Plans, which also
shows the positive attitude of the respondents for Financial Planning. When asked to
respondents if an efficient Financial Plan should be reviewed periodically, the mean score
was found to be 3.12. That shows that they are not reviewing their plans periodically. Overall
Mean score from Table 4.66 is 3.34, which shows that respondents have positive attitude
towards Overall Personal Financial Planning.
Statements No. 38 to 50 are factors which are important while making financial decisions.
Out of 600 respondents 252 have agreed and 186 respondents have completely agreed that

122
that they consider their own risk profile before taking any financial decision. Respondents,
while taking financial decisions, gather information from different sources and used to
authenticate one. Mean score of the statement comes to 3.70 showing that it is the important
factor which influences financial planning. Respondents were asked about Economic factors
like prevailing interest rate, rate of inflation and that whether these factors influence their
financial planning. For economic factors, mean score turns out to be 3.08, which is little
low. It shows that respondents do not give more importance to Economic factors for financial
planning. Statements No. 42 – 47 are Company related and Product related factors that may
influence financial plan of the respondents. Mean score for service provided by the company
turns to be 3.29. Mean score for knowledge of the representative of the company is 3.08; it
shows that respondents do consider services provided by the company and knowledge level
of employees representing the company before taking financial decision. Mean score for the
expected return & tax benefits linked to the product are 4.02 and 4.17 respectively. It shows
that they influence Financial Planning of the respondents. Mean score for the liquidity
provided by the product is 3.45; it shows that respondents consider liquidity of the product
before investing into it. Out of 600 respondents, 264 had agreed & 78 had strongly agreed
that their stage in life cycle is important parameter for them and that it influences their
financial planning. Mean score for the same is 3.32. Out of 600 respondents 318 had agreed
and 66 had strongly agreed that they consider their future responsibilities while planning their
finances. Minimizing inconvenience to their family in their absence is the factor which highly
influence the respondents. Mean score of the statement is 4.23, suggesting the highest score
amongst all the factors described here.
Overall mean score of all the 50 statements which were asked to analyze attitude of
respondents towards Financial Planning is 3.29. Which is higher than 2.5, which suggests
that on the whole the respondents of Gujarat have positive attitude towards Personal
Financial Planning.
TABLE 4. 66 - Components wise Attitude regarding PFP
Component Mean Score Attitude
Money Management 3.3 Positive
Insurance 3.09 Positive
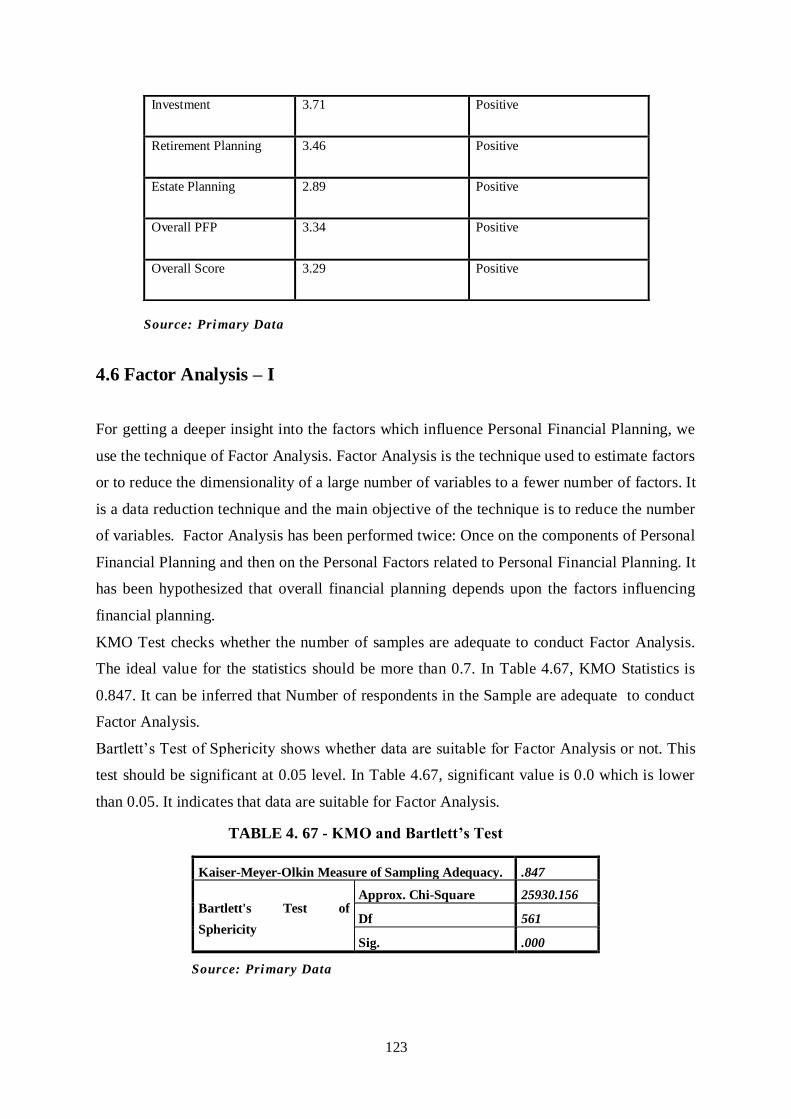
123
Source: Primary Data
4.6 Factor Analysis – I
For getting a deeper insight into the factors which influence Personal Financial Planning, we
use the technique of Factor Analysis. Factor Analysis is the technique used to estimate factors
or to reduce the dimensionality of a large number of variables to a fewer number of factors. It
is a data reduction technique and the main objective of the technique is to reduce the number
of variables. Factor Analysis has been performed twice: Once on the components of Personal
Financial Planning and then on the Personal Factors related to Personal Financial Planning. It
has been hypothesized that overall financial planning depends upon the factors influencing
financial planning.
KMO Test checks whether the number of samples are adequate to conduct Factor Analysis.
The ideal value for the statistics should be more than 0.7. In Table 4.67, KMO Statistics is
0.847. It can be inferred that Number of respondents in the Sample are adequate to conduct
Factor Analysis.
Bartlett‘s Test of Sphericity shows whether data are suitable for Factor Analysis or not. This
test should be significant at 0.05 level. In Table 4.67, significant value is 0.0 which is lower
than 0.05. It indicates that data are suitable for Factor Analysis.
TABLE 4. 67 - KMO and Bartlett’s Test
Kaiser-Meyer-Olkin Measure of Sampling Adequacy. .847
Bartlett's Test of
Sphericity
Approx. Chi-Square 25930.156
Df 561
Sig. .000
Source: Primary Data
Investment 3.71 Positive
Retirement Planning 3.46 Positive
Estate Planning 2.89 Positive
Overall PFP 3.34 Positive
Overall Score 3.29 Positive

124
Table 4.68 shows the communalities values of the variables. It is the regression value of each
variable in the scale, which is shared by all the other variables. The cut off value for variable
is 0.4. Variables above 0.4 value are considered for the further studies. In this case all the
variables have the value above 0.4, so all variables will be considered further for Factor
Analysis.
TABLE 4. 68 - Communalities
Initial Extraction
Insurance is a forced Saving 1.000 .662
Enough Insurance 1.000 .914
Only Life Insurance 1.000 .910
No Insurance 1.000 .897
Insurance agent 1.000 .897
Advise for Insurance 1.000 .894
Coverage 1.000 .876
Long term saving 1.000 .678
InvImp 1.000 .682
Invcommitment 1.000 .750
RiskProfile 1.000 .675
Diversification 1.000 .598
SixMonthSalary 1.000 .820
BalancedFP 1.000 .713
FinGoals 1.000 .688
CrntFinPosition 1.000 .735
DiscussFP 1.000 .738
NeedExpert 1.000 .701
FPReview 1.000 .669
Budget 1.000 .970
SavingbeforeSpending 1.000 .948
Spend 1.000 .968
CreditSpendbill 1.000 .972
CreditSpend 1.000 .932
Will 1.000 .783
Trust 1.000 .811
EstateProceed 1.000 .773
EstateImp 1.000 .808
AmtRetirement 1.000 .828
Planning Retirement 1.000 .816
RetEarlyAge 1.000 .782

125
RetInflationProof 1.000 .642
Taxtreatment 1.000 .783
Taxrebates 1.000 .773
Extraction Method: Principal Component Analysis.
Source: Primary Data
TABLE 4. 69 – Total Variance Explained
Compone
nt
Initial Eigenvalues Extraction Sums of Squared Loadings Rotation Sums of Squared Loadings
Total
% of
Variance
Cumulative
% Total
% of
Variance
Cumulative
% Total
% of
Variance
Cumulative
%
1 10.829 31.850 31.850 10.829 31.850 31.850 6.086 17.899 17.899
2 6.590 19.382 51.233 6.590 19.382 51.233 4.714 13.866 31.765
3 3.223 9.480 60.713 3.223 9.480 60.713 4.035 11.868 43.632
4 2.234 6.570 67.283 2.234 6.570 67.283 4.018 11.818 55.450
5 2.047 6.020 73.303 2.047 6.020 73.303 3.114 9.158 64.608
6 1.121 3.298 76.602 1.121 3.298 76.602 3.046 8.960 73.568
7 1.040 3.060 79.662 1.040 3.060 79.662 2.072 6.093 79.662
8 .720 2.118 81.780
9 .653 1.922 83.702
10 .622 1.830 85.532
11 .531 1.562 87.094
12 .508 1.493 88.587
13 .434 1.276 89.863
14 .400 1.177 91.040
15 .361 1.062 92.102
16 .350 1.030 93.132
17 .310 .912 94.044
18 .298 .877 94.921
19 .275 .809 95.729
20 .249 .733 96.463
21 .198 .582 97.045
22 .175 .516 97.560
23 .150 .440 98.001
24 .147 .432 98.432
25 .122 .358 98.790
26 .106 .311 99.102
27 .088 .259 99.361
28 .076 .224 99.585
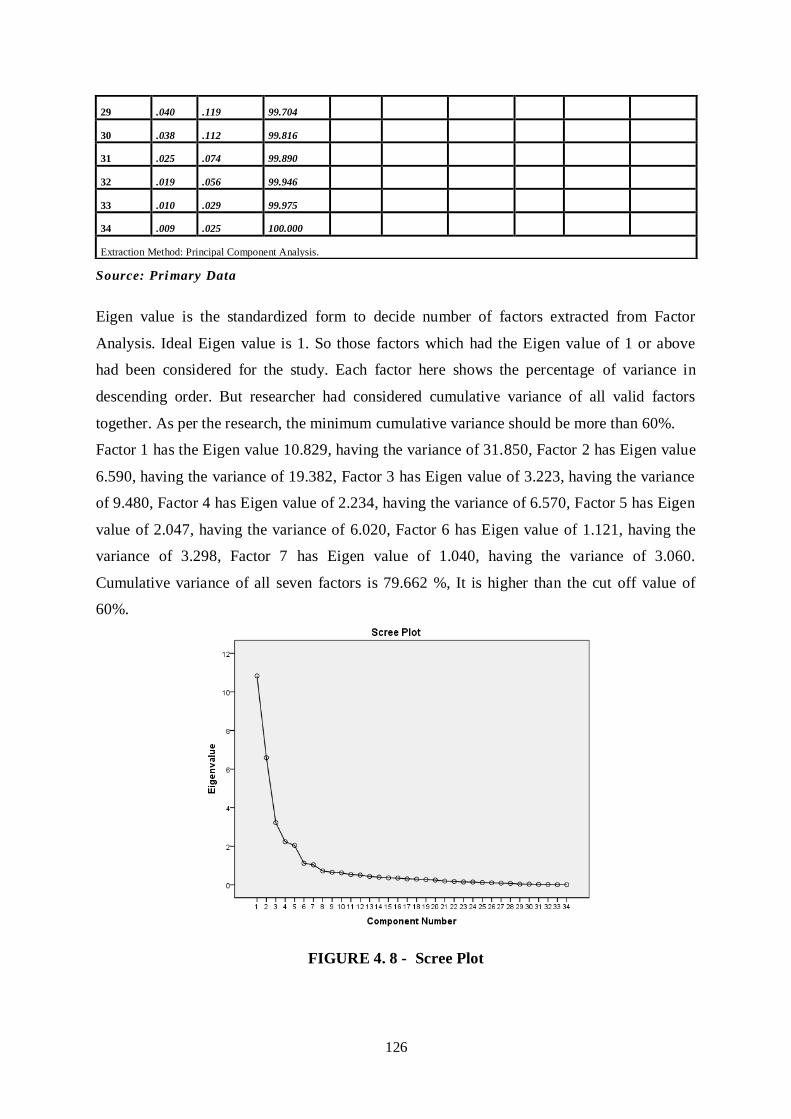
126
Source: Primary Data
Eigen value is the standardized form to decide number of factors extracted from Factor
Analysis. Ideal Eigen value is 1. So those factors which had the Eigen value of 1 or above
had been considered for the study. Each factor here shows the percentage of variance in
descending order. But researcher had considered cumulative variance of all valid factors
together. As per the research, the minimum cumulative variance should be more than 60%.
Factor 1 has the Eigen value 10.829, having the variance of 31.850, Factor 2 has Eigen value
6.590, having the variance of 19.382, Factor 3 has Eigen value of 3.223, having the variance
of 9.480, Factor 4 has Eigen value of 2.234, having the variance of 6.570, Factor 5 has Eigen
value of 2.047, having the variance of 6.020, Factor 6 has Eigen value of 1.121, having the
variance of 3.298, Factor 7 has Eigen value of 1.040, having the variance of 3.060.
Cumulative variance of all seven factors is 79.662 %, It is higher than the cut off value of
60%.
FIGURE 4. 8 - Scree Plot
29 .040 .119 99.704
30 .038 .112 99.816
31 .025 .074 99.890
32 .019 .056 99.946
33 .010 .029 99.975
34 .009 .025 100.000
Extraction Method: Principal Component Analysis.

127
Scree Plot is the graphical method to determine the number of factors. The Eigen Value are
plotted in the sequence of Principal Factors. Above scree plot also suggest that there are 7
factors whose Eigen Value are greater than 1 and considered for the further study.
TABLE 4. 70- – Component Matrix
Component
1 2 3 4 5 6 7
InsForced .692
CreditSpendbill .677 -.515
Budget .672 -.509
Spend .672 -.510
SavingbeforeSpending .666
CreditSpend .662
Trust .659
Coverage .654 -.609
EstateImp .645
FinGoals .633
EstateProceed .627
AdviseforInsurance .619 -.575
Insuranceagent .618 -.570
Longtermsav .608
Will .607
CrntFinPosition .605
Taxrebates .594
BalancedFP .588
RiskProfile .580
InvImp .562
Taxtreatment .556
DiscussFP .552
Diversification .514
SixMonthSalary
OnlyLifeInsurance .612 -.653
NoInsurance .602 -.652
EnoughInsurance .561 -.641
RetEarlyAge .839
AmtRetirement .834
PlanningRetirement .803
RetInflationProof .747

128
FPReview
NeedExpert
Invcommitment
Extraction Method: Principal Component Analysis.
a. 7 components extracted.
Source: Primary Data
Table 4.71 shows the Rotated Component Matrix. It depicts the pattern of the factors that are
grouped together based on their regression weight and degree of correlation. For the purpose
of extraction, Principal Component Analysis method had been used and for Rotation –
Varimax with Kaiser Normalization had been used. The table helps to understand the variable
grouped together to form a factor.
TABLE 4. 71 - Rotated Component Matrix
Component
1 2 3 4 5 6 7
EnoughInsurance .939
Insuranceagent .925
AdviseforInsurance .920
OnlyLifeInsurance .909
NoInsurance .904
Coverage .872
InsForced .685
CreditSpendbill .921
Budget .919
Spend .919
SavingbeforeSpending .904
CreditSpend .897
Invcommitment .844
SixMonthSalary .792
RiskProfile .710
Diversification .670
Longtermsav .640
InvImp .638
NeedExpert .816
FPReview .792
DiscussFP .735
BalancedFP .728

129
FinGoals .586
CrntFinPosition .586 .550
AmtRetirement .902
PlanningRetirement .895
RetEarlyAge .869
RetInflationProof .787
EstateProceed .744
Will .734
EstateImp .708
Trust .706
Taxrebates .717
Taxtreatment .678
Extraction Method: Principal Component Analysis.
Rotation Method: Varimax with Kaiser Normalization.
a. Rotation converged in 7 iterations.
Source: Primary Data
Table 4.72 shows the different variables under the same factor as well as labeling of the
factors. The Seven Factors were identified and labeled as : Insurance , Spending Behavior,
Investment, Overall view of PFP, Retirement Planning, Taxation Planning and Estate
Planning.
TABLE 4. 72 – Labeling of Factors
Sr.
No
Name of Factor Variables No of
Items
Reliability
(Cronbach’s
Alpha)
1 Insurance Enough Insurance
Insurance Agent
Advise for Insurance
Only Life Insurance
No Insurance
Coverage
Insurance is forced Saving
07 0.94
2 Spending Behavior Credit Card Spend Bill
Budget
Spend
Saving Before Spending
Credit Spend
05 0.91

130
3 Investment Investment Commitment
Six Month Salary
Risk Profile
Diversification
Long Term Saving
Investment is Important
06 0.93
4 Overall view of PFP Need Expert
FP Review
Discuss FP
Balanced FP
Financial Goals
Current Financial Position
06 0.92
5 Retirement Planning Amount Retirement
Planning Retirement
Retirement Early Age
Retirement Plan Inflation proof
04 0.89
6 Estate Planning Estate Proceed
Will
Estate Important
Trust
04 0.88
7 Tax Planning Tax Rebates
Tax Treatments
02 0.78
Source: Primary Data

131
4.7 Factor Analysis - II – Overall Financial Planning
In Table 4.73 KMO Statistics is 0.903. It can be inferred that Number of Samples are
adequate enough to conduct Factor Analysis.
Bartlett‘s Test of Sphericity shows whether data are suitable for Factor Analysis or not. This
test should be significant at 0.05 level. In Table 4.73 significant value is 0.0 which is lower
than 0.05. It indicates that data are suitable for Factor Analysis.
TABLE 4. 73 – KMO and Bartlett's Test
Kaiser-Meyer-Olkin Measure of Sampling Adequacy. .903
Bartlett's Test of
Sphericity
Approx. Chi-Square 8935.126
Df 91
Sig. .000
Source: Primary Data
Table 4.74 shows the communalities values of the variables. It is the regression value of each
variable in the scale, which is shared by all the other variables. The cut off value for variable
is 0.4. Variables above 0.4 value are considered for the further studies. In this case all the
variables have the value above 0.4, so all variables will be considered further for Factor
Analysis.
TABLE 4. 74 – Communalities
Initial Extraction
CashReserve 1.000 .743
Risk 1.000 .745
Information 1.000 .744
Influencedbyfriends 1.000 .625
EcoVar 1.000 .623
Service 1.000 .625
KnowledgeRepresentative 1.000 .802
FutRespo 1.000 .801
ExpectedReturn 1.000 .820
Taxbenefits 1.000 .806
Liquidity 1.000 .772
LifeCycle 1.000 .735
RegCashFlow 1.000 .711
Inconvenience 1.000 .729
Extraction Method: Principal Component Analysis.
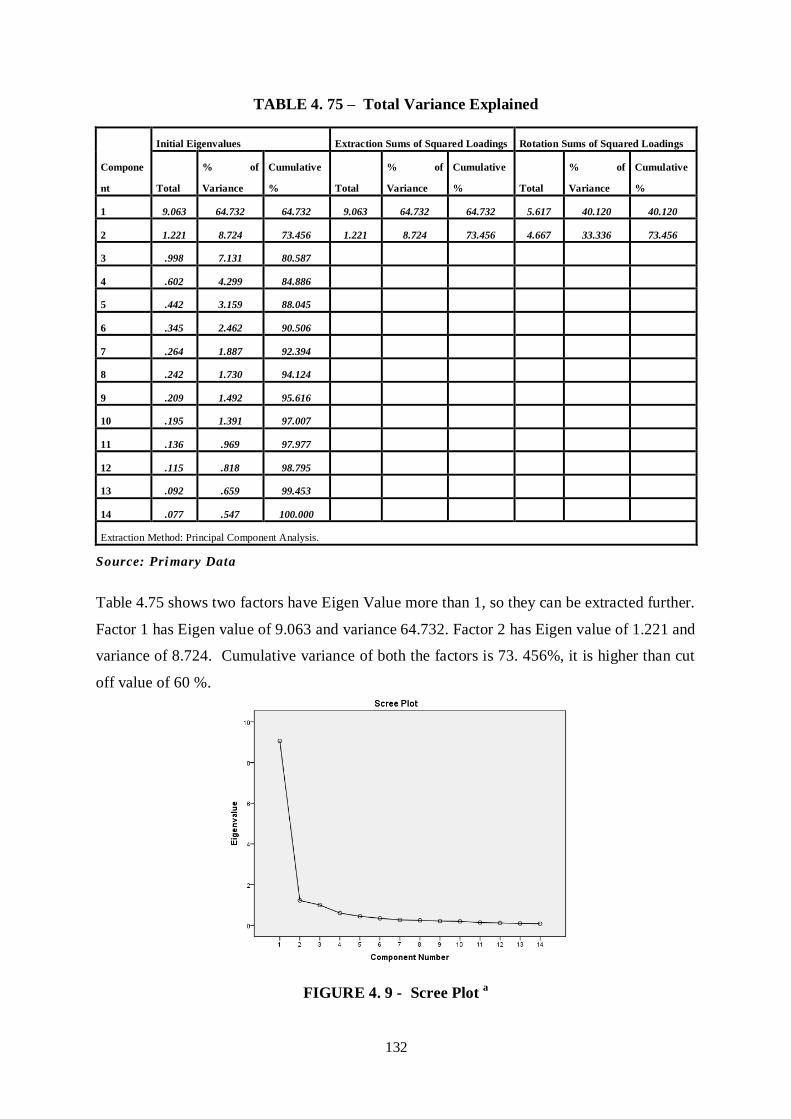
132
TABLE 4. 75 – Total Variance Explained
Compone
nt
Initial Eigenvalues Extraction Sums of Squared Loadings Rotation Sums of Squared Loadings
Total
% of
Variance
Cumulative
% Total
% of
Variance
Cumulative
% Total
% of
Variance
Cumulative
%
1 9.063 64.732 64.732 9.063 64.732 64.732 5.617 40.120 40.120
2 1.221 8.724 73.456 1.221 8.724 73.456 4.667 33.336 73.456
3 .998 7.131 80.587
4 .602 4.299 84.886
5 .442 3.159 88.045
6 .345 2.462 90.506
7 .264 1.887 92.394
8 .242 1.730 94.124
9 .209 1.492 95.616
10 .195 1.391 97.007
11 .136 .969 97.977
12 .115 .818 98.795
13 .092 .659 99.453
14 .077 .547 100.000
Extraction Method: Principal Component Analysis.
Source: Primary Data
Table 4.75 shows two factors have Eigen Value more than 1, so they can be extracted further.
Factor 1 has Eigen value of 9.063 and variance 64.732. Factor 2 has Eigen value of 1.221 and
variance of 8.724. Cumulative variance of both the factors is 73. 456%, it is higher than cut
off value of 60 %.
FIGURE 4. 9 - Scree Plot a

133
Scree plot also suggest that there are two factors having more than 1 Eigen value. So they can
be extracted further.
TABLE 4. 76 – Component Matrixa
Component
1 2
Risk .855
CashReserve .854
Information .851
LifeCycle .824
KnowledgeRepresentative .815
Taxbenefits .813
Inconvenience .810
Service .791
Influencedbyfriends .790
ExpectedReturn .786
EcoVar .785
Liquidity .779
FutRespo .761
RegCashFlow .740
Extraction Method: Principal Component Analysis.
a. 2 components extracted.
Source: Primary Data
Table 4.77 shows the Rotated Component Matrix. It depicts the pattern of the factors that are
grouped together based on their regression weight and degree of correlation. For the purpose
of extraction Principal Component Analysis method had been used and for Rotation –
Varimax with Kaiser Normalization had been used. The table helps to understand the variable
grouped together to form a factor.
TABLE 4. 77 – Rotated Component Matrixa
Component
1 2
Liquidity .853
RegCashFlow .822
Inconvenience .785
LifeCycle .774
Information .730

134
Risk .719
CashReserve .717
Influencedbyfriends .619
Service .518 .598
ExpectedReturn .858
FutRespo .858
Taxbenefits .825
KnowledgeRepresentative .818
EcoVar .582 .523
Extraction Method: Principal Component Analysis.
Rotation Method: Varimax with Kaiser
Normalization.
a. Rotation converged in 3 iterations.
Source: Primary Data
Table 4.78 shows the different variables under the same factor as well as labeling of the
factors. The Two Factors were identified and labeled as : Personal Factors and Company /
Scheme related factors.
TABLE 4. 78 – Labeling of Factors
Sr. No Name of Factor Variables No of
Items
Reliability
(Cronbach‘s Alpha)
1 Personal Factors Liquidity 09 0.96
Reg Cash Flow
Inconvenience
Life Cycle
Information
Risk
Cash Reserve
Influenced by friends
Eco Var
2 Company / scheme Related
Factors
Expected Return 05 0.85
Fut Respo
Tax benefits
Knowledge Representative
Service
Source: Primary Data
135
4.8 Confirmatory Factor Analysis - I
Confirmatory Factor Analysis ( CFA) is a way of testing how well measured variables
represent a smaller number of construct. The result of exploratory factor analysis is
confirmed by using the confirmatory factor analysis. The figure below shows the structure of
the confirmatory Factor analysis.
Many different fit statistics are used to check model fit for the data. The first is the Chi
Square Test with degrees of freedom less than two. Chi Square value close to zero and p
value above 0.05 is the indicator of good fit of data. Root Mean Square Error Approximation
(RMSEA) method is related to residuals in models. RMSEA value ranges from 0 to 1.
RMSEA value less than 0.10 is acceptable. CFI – Comparative Fit Index is an incremental fit
index, which assesses overall improvement of a proposed model over an independence model
where the observed variables are uncorrelated (Byrne, 2006). CFI value ranges from 0 to 1.
Value above 0.95 is recommended for model fit. The Normal Fit Index (NFI) is also another
measure for model fit. Larger value specifies better model fit. Values above 0.90 are
recommended for the model fit. Apart from this, Relative Fit Index (RFI) and Incremental Fit
Index (IFI) also indicate model fit. Value above 0.90 is recommended in both the cases.
The model is to be tested for Seven Factor model comprising of Insurance Planning,
Spending Behavior, Investment, Overall view of Personal Financial Planning, Retirement
Planning, Estate Planning, and Tax Planning. The Personal Financial Planning Model is 34
item instrument structured on a 5 point Likert scale. The component parts of the model are as
follow.
The seven factors are inter correlated, as indicated by the two-headed arrows.
There are 34 observed variables, as indicated by the 34 rectangles (From MM 1 to T2)
The observed variables load on the factors in the following pattern:
MM 1 to MM 5 load on Money Management (Spending Behavior), IN 1 to IN 7 load
on Insurance, INV 1 to INV 6 load on Investment, PF 1 to PF 6 load on Overall view
of PFP, RTM 1 to RTM 4 load on Retirement Planning, EP 1 to EP 4 load on Estate
Planning and T1 to T2 load on Tax planning.
Each observed variable loads on one and only one factor.

136
Modeling with AMOS Graphics
The hypothesized seven -factor model of Personal Financial Planning (Figure – 4.10)
provided the specification input for analyses using AMOS Graphics
FIGURE 4. 10 – Factor Model
The table below shows the standardized regression weights. The value above 0.7 indicates
reasonable amount of variance can be extracted from the variable. Majority of the regression
weights are greater than 0.7.
TABLE 4. 79 - Standardized Regression Weights: (Group number 1 - Default model)
Estimate
MM5 <--- Money_mgmt .926
MM4 <--- Money_mgmt .994
MM3 <--- Money_mgmt .994

137
Estimate
MM2 <--- Money_mgmt .937
MM1 <--- Money_mgmt .994
IN7 <--- Insurance .888
IN6 <--- Insurance .890
IN5 <--- Insurance .899
IN4 <--- Insurance .965
IN3 <--- Insurance .975
IN2 <--- Insurance .962
IN1 <--- Insurance .699
INV6 <--- Investment .746
INV5 <--- Investment .724
INV4 <--- Investment .783
INV3 <--- Investment .740
INV2 <--- Investment .705
INV1 <--- Investment .754
PF1 <--- Personnel_Factors .794
PF2 <--- Personnel_Factors .783
PF3 <--- Personnel_Factors .819
PF4 <--- Personnel_Factors .827
PF5 <--- Personnel_Factors .619
PF6 <--- Personnel_Factors .553
RTM1 <--- Retirement .906
RTM2 <--- Retirement .853
RTM3 <--- Retirement .836
RTM4 <--- Retirement .701
EP1 <--- Estate_Planning .790
EP2 <--- Estate_Planning .888
EP3 <--- Estate_Planning .840
EP4 <--- Estate_Planning .809
T1 <--- Tax .775
T2 <--- Tax .821
Source: Primary Data
TABLE 4. 80 - Correlations: (Group number 1 - Default model)
Estimate
Money_mgmt <--> Insurance .570
Money_mgmt <--> Investment .197
Money_mgmt <--> Personnel_Factors .226
Money_mgmt <--> Retirement .081
Money_mgmt <--> Estate_Planning .248
Money_mgmt <--> Tax .209
Insurance <--> Investment .128
Insurance <--> Personnel_Factors .150
Insurance <--> Retirement -.003
Insurance <--> Estate_Planning .130

138
Estimate
Insurance <--> Tax .141
Investment <--> Personnel_Factors .562
Investment <--> Retirement .255
Investment <--> Estate_Planning .721
Investment <--> Tax .708
Personnel_Factors <--> Retirement .044
Personnel_Factors <--> Estate_Planning .763
Retirement <--> Estate_Planning .081
Retirement <--> Tax .084
Estate_Planning <--> Tax .766
Personnel_Factors <--> Tax .773
Source: Primary Data
Model Fit Summary: The Table 4.81 shows the Model Fit Indexes.
TABLE 4. 81 - Model Fit Indexes
Absolute Fit Measures Fit Measures
Test Recommended Value Reporting Model
χ2 p> 0.05 .000
CMIN/DF < 5 2.87
RMSEA <0.10 0.07
R Relative Fit Measures elative Fit Measures
Test Recommended Value Reporting Model
CFI >0.90 0.91
NFI >0.90 0.90
RFI >0.90 0.90
IFI >0.90 0.90

139
Parsimonious Fit Measures Parsimonious Fit Measures
Test Recommended Value Reporting Model
PCFI >0.50 0.79
PNFI >0.50 0.79
Note : All Recommended values are based on Hair et al.( 2000), Ullman ( 1996) recommended CMIN/DF < 5
χ2 = Chi- Square Test , CMIN/DF = Chi square test / Degree of freedom ,
RMSEA = Root Mean Square Error of Approximation, CFI = Comparative Fit Index
NFI = Normed Fit Index, RFI = Relative Fit Index , IFI = Incremental Fit Index,
PCFI= parsimony Comparative Fit Index , PNFI= Parsimony Normed Fit Index
Source: Primary Data
Findings of well-fitting hypothesized models, where the χ2 value approximates the degrees of
freedom, have proven to be unrealistic in most SEM empirical research. More common are
findings of a large χ2 relative to degrees of freedom, thereby indicating a need to modify the
model in order to better fit the data (Joreskog & Sorbom, 1993). Thus, results related to the
test of hypothesized model are not unexpected. Indeed, given this problematic aspect of the
Likelihood Ratio Test, and the fact that postulated models (no matter how good) can only
ever fit real-world data approximately and never exactly.
One of the first fit statistics to address the problem was the χ2/degrees of freedom ratio
(Wheaton, Muthen, Alwin, & Summers, 1977), which appears as CMIN/DF is 2. 87
(Standard Recommended value is <= 5).
The next set of goodness-of-fit statistics (baseline comparisons), which can be classified as
incremental or comparative indices of fit (Hu & Bentler, 1995; Marsh et al., 1988).
However, addressing evidence that the NFI has shown a tendency to underestimate fit in
small samples. Bentler (1990) revised the NFI to take sample size into account and proposed
the Comparative Fit Index (CFI). Values for both the NFI and CFI range from zero to 1.00
and are derived from the comparison of a hypothesized model with the independence (or null)
model. As such, each provides a measure of complete covariation in the data. Value > .90 is
considered representative of a well-fitting model (Bentler, 1992). In this case the value is
0.91which indicates that the fit of the model is good.
The Relative Fit Index (RFI; Bollen, 1986) represents a derivative of the NFI; as with both
the NFI and CFI, the RFI coefficient values range from zero to 1.00, with values close to .95

140
indicating superior fit (Hu &Bentler, 1999). In this case the value is 0.90 indicating the
moderate fit of the model.
The next set of fit statistics focuses on the root mean square error of approximation
(RMSEA). Although this index, and the conceptual framework within which it is embedded,
was first proposed by Steiger and Lind in 1980, it has only recently been recognized as one of
the most informative criteria in covariance structure modeling. The RMSEA takes into
account the error of approximation in the population and asks the question ―How well would
the model, with unknown but optimally chosen parameter values, fit the population
covariance matrix if it were available?‖ (Browne & Cudeck, 1993, pp. 137–138). This
discrepancy, as measured by the RMSEA, is expressed as per the degree of freedom, thus
making it sensitive to the number of estimated parameters in the model (i.e., the complexity
of the model); values less than .05 indicate good fit, and values as high as .08 represent
reasonable errors of approximation in the population (Browne & Cudeck, 1993). MacCallum
et al. (1996) have recently elaborated on these cut points and noted that RMSEA values
ranging from .08 to .10 indicate mediocre fit, and those greater than .10 indicate poor fit.
Although Hu and Bentler (1999) have suggested a value of .06 to be indicative of good fit
between the hypothesized model and the observed data, they cautioned that, when sample
size is small, the RMSEA (and TLI) tend to over reject true population models. In this case
the value of RMSEA is 0.07 indicating good fit of model.
Thus, on the basis of our goodness-of-fit results, it can be concluded that the hypothesized
Seven-factor CFA model fit the sample data.

141
4.9 Confirmatory Factor Analysis – II
The model to be tested is Two Factor model composed of Personal Factors and Company /
Scheme related factors. The Personal Financial Planning Model is 14 item instrument
structured on a 5 point Likert scale. The component parts of the model are as follow.
The Two factors are inter correlated, as indicated by the two-headed arrows.
There are 14 observed variables, as indicated by the 14 rectangles (From OFP2 _1 to
OFP 9)
The observed variables load on the factors in the following pattern:
OFP2_1 to OFP2_5 load on Company / Scheme related factors, OFP1 to OFP 9 load
on Personal Factors.
Each observed variable loads on one and only one factor.
Modeling with AMOS Graphics
The hypothesized two -factor model of Personal Financial Planning (Figure – 4.11) provided
the specification input for analyses using AMOS Graphics
FIGURE 4. 11 – Factor Model a

142
The table 4.82 shows the standardized regression weights. The value above 0.7 indicates
reasonable amount of variance can be extracted from the variable. Majority of the regression
weights are greater than 0.7.
TABLE 4. 82 - Standardized Regression Weights: (Group number 1 - Default model)
Estimate
OFP2_5 <--- Overall_Financial_Planning_2 .884
OFP2_4 <--- Overall_Financial_Planning_2 .851
OFP2_3 <--- Overall_Financial_Planning_2 .895
OFP2_2 <--- Overall_Financial_Planning_2 .898
OFP2_1 <--- Overall_Financial_Planning_2 .694
OFP9 <--- Overall_Financial_Planning_1 .790
OFP8 <--- Overall_Financial_Planning_1 .780
OFP7 <--- Overall_Financial_Planning_1 .730
OFP6 <--- Overall_Financial_Planning_1 .788
OFP5 <--- Overall_Financial_Planning_1 .776
OFP4 <--- Overall_Financial_Planning_1 .786
OFP3 <--- Overall_Financial_Planning_1 .881
OFP2 <--- Overall_Financial_Planning_1 .883
OFP1 <--- Overall_Financial_Planning_1 .882
Source: Primary Data
TABLE 4. 83 - Correlations: (Group number 1 - Default model)
Estimate
Overall_Financial_Planning_2 <--> Overall_Financial_Planning_1 .793
Source: Primary Data
Model Fit Summary: The Table 4.84 shows the Model Fit.
TABLE 4. 84 Model Fit Index - 2
Absolute Fit Measures it Measures
Test Recommended Value Reporting Model
χ2 p> 0.05 .000
CMIN/DF < 5 2.87
RMSEA <0.10 0.09

143
Relative Fit Measures
Test Recommended Value Reporting Model
CFI >0.90 0.91
NFI >0.90 0.90
RFI >0.90 0.90
IFI >0.90 0.90
Parsimonious Fit Measures
Test Recommended Value Reporting Model
PCFI >0.50 0.69
PNFI >0.50 0.69
Note : All Recommended values are based on Hair et al.( 2000), Ullman ( 1996) recommended CMIN/DF < 5
χ2 = Chi- Square Test , CMIN/DF = Chi square test / Degree of freedom ,
RMSEA = Root Mean Square Error of Approximation, CFI = Comparative Fit Index
NFI = Normed Fit Index, RFI = Relative Fit Index , IFI = Incremental Fit Index,
PCFI= parsimony Comparative Fit Index , PNFI= Parsimony Normed Fit Index
Source: Primary Data
Findings of well-fitting hypothesized models, where the χ2 value approximates the degrees of
freedom, have proven to be unrealistic in most SEM empirical research. More common are
findings of a large χ2 relative to degrees of freedom, thereby indicating a need to modify the
model in order to better fit the data (Joreskog & Sorbom, 1993). Thus, results related to the
test of hypothesized model are not unexpected. Indeed, given this problematic aspect of the
Likelihood Ratio Test, and the fact that postulated models (no matter how good) can only
ever fit real-world data approximately and never exactly.
One of the first fit statistics to address the problem was the χ2/degrees of freedom ratio
(Wheaton, Muthen, Alwin, & Summers, 1977), which appears as CMIN/DF is 2. 87
(Standard Recommended value is <= 5).
The next set of goodness-of-fit statistics (baseline comparisons), which can be classified as
incremental or comparative indices of fit (Hu & Bentler, 1995; Marsh et al., 1988).

144
However, addressing evidence that the NFI has shown a tendency to underestimate fit in
small samples, Bentler (1990) revised the NFI to take sample size into account and proposed
the Comparative Fit Index (CFI). Values for both the NFI and CFI range from zero to 1.00
and are derived from the comparison of a hypothesized model with the independence (or null)
model. As such, each provides a measure of complete covariation in the data. Value > .90 is
considered representative of a well-fitting model (Bentler, 1992). In this case the value is
0.91 indicates the fit of the model.
The Relative Fit Index (RFI; Bollen, 1986) represents a derivative of the NFI; as with both
the NFI and CFI, the RFI coefficient values range from zero to 1.00, with values close to .95
indicating superior fit (Hu &Bentler, 1999). In this case the value is 0.90 indicating the
moderate fit of the model.
The next set of fit statistics focuses on the root mean square error of approximation
(RMSEA). Although this index, and the conceptual framework within which it is embedded,
was first proposed by Steiger and Lind in 1980, it has only recently been recognized as one of
the most informative criteria in covariance structure modeling. The
RMSEA takes into account the error of approximation in the population and asks the question
―How well would the model, with unknown but optimally chosen parameter values, fit the
population covariance matrix if it were available?‖ (Browne & Cudeck, 1993, pp. 137–138).
This discrepancy, as measured by the RMSEA, is expressed per degree of freedom, thus
making it sensitive to the number of estimated parameters in the model (i.e., the complexity
of the model); values less than .05 indicate good fit, and values as high as .08 represent
reasonable errors of approximation in the population (Browne & Cudeck, 1993). MacCallum
et al. (1996) have recently elaborated on these cutpoints and noted that RMSEA values
ranging from .08 to .10 indicate mediocre fit, and those greater than .10 indicate poor fit.
Although Hu and Bentler (1999) have suggested a value of .06 to be indicative of good fit
between the hypothesized model and the observed data, they cautioned that, when sample
size is small, the RMSEA (and TLI) tend to over reject true population models. In this case
the value of RMSEA is 0.09 indicating mediocre fit of model.
Thus, on the basis of our goodness-of-fit results, it can be concluded that the hypothesized
two-factor CFA model moderately fit the sample data.

145
4.10 Structural Equation Modeling
SEM is a methodology for representing, estimating, and testing a theoretical network of
(mostly) linear relations between variables (Rigdon, 1998). Basic goal of SEM is to
understand the pattern of correlations/ covariance among a set of variables and to explain as
much of their variance as possible with model specified. (Kline, 1998). Basically it is a
multivariate statistical analysis technique which is combination of factor analysis and
multiple regression techniques. It is used to analyze the relationship between observed
variables and latent constructs. Observed variables are the variables which can be measured
and latent are the unobserved variables or variables which cannot directly be measured.
4.10.1 The Base Model
The following model was tested using Structural Equation Modeling. It has been
hypothesized that Overall Financial Planning depends upon the seven factors named as
Money Management, Insurance, Investment, Overall View of PFP, Retirement, Estate
Planning and Tax Planning.
FIGURE 4. 12 – SEM Base Model

146
TABLE 4. 85 - Regression Weights: (Group number 1 - Default model)
Estimate S.E. C.R. P Label
Overall_Fin_Plan_1 <--- Money_mgmt .089 .023 3.827 ***
Overall_Fin_Plan_2 <--- Money_mgmt .164 .025 6.659 ***
Overall_Fin_Plan_1 <--- Insurance .335 .025 13.663 ***
Overall_Fin_Plan_2 <--- Insurance .448 .025 17.643 ***
Overall_Fin_Plan_2 <--- Investment -.049 .038 -1.290 .197
Overall_Fin_Plan_1 <--- Investment .060 .036 1.663 .096
Overall_Fin_Plan_2 <--- Personal_ Factors .260 .050 5.148 ***
Overall_Fin_Plan_1 <--- Personal_ Factors .120 .048 2.513 .012
Overall_Fin_Plan_2 <--- Retirement -.030 .044 -.670 .503
Overall_Fin_Plan_1 <--- Retirement -.015 .042 -.351 .726
Overall_Fin_Plan_2 <--- Estate_Planning -.167 .045 -3.742 ***
Overall_Fin_Plan_1 <--- Estate_Planning .135 .043 3.158 .002
Overall_Fin_Plan_2 <--- Tax .162 .056 2.875 .004
Overall_Fin_Plan_1 <--- Tax .056 .040 1.420 .156
MM5 <--- Money_mgmt 1.000
MM4 <--- Money_mgmt 1.041 .018 57.657 ***
MM3 <--- Money_mgmt 1.045 .018 57.695 ***
MM2 <--- Money_mgmt 1.011 .023 44.141 ***
MM1 <--- Money_mgmt 1.036 .018 57.849 ***
IN7 <--- Insurance 1.000
IN6 <--- Insurance .893 .026 33.721 ***
IN5 <--- Insurance .903 .026 34.684 ***
IN4 <--- Insurance .991 .024 40.841 ***
IN3 <--- Insurance .977 .023 42.189 ***
IN2 <--- Insurance .941 .023 41.092 ***
IN1 <--- Insurance .720 .033 21.715 ***
INV6 <--- Investment 1.000
INV5 <--- Investment .588 .034 17.367 ***
INV4 <--- Investment .841 .045 18.875 ***
INV3 <--- Investment .852 .046 18.562 ***
INV2 <--- Investment .583 .035 16.630 ***
INV1 <--- Investment .682 .038 17.868 ***
PF1 <--- Personal_ Factors 1.000
PF2 <--- Personal_ Factors .947 .049 19.405 ***
PF3 <--- Personal_ Factors 1.065 .051 20.915 ***
PF4 <--- Personal_ Factors 1.149 .051 22.435 ***
PF5 <--- Personal_ Factors 1.004 .058 17.332 ***
PF6 <--- Personal_ Factors .673 .044 15.412 ***
RTM1 <--- Retirement 1.000
RTM2 <--- Retirement .898 .032 28.086 ***
RTM3 <--- Retirement .959 .036 26.804 ***
RTM4 <--- Retirement .888 .044 20.153 ***
EP1 <--- Estate_Planning 1.000
EP2 <--- Estate_Planning 1.118 .048 23.302 ***

147
Estimate S.E. C.R. P Label
EP3 <--- Estate_Planning 1.148 .051 22.627 ***
EP4 <--- Estate_Planning 1.156 .055 20.889 ***
T1 <--- Tax 1.000
T2 <--- Tax .689 .183 3.774 ***
OFP2_5 <--- Overall_Fin_Plan_2 1.000
OFP2_4 <--- Overall_Fin_Plan_2 1.032 .039 26.760 ***
OFP2_3 <--- Overall_Fin_Plan_2 .987 .033 29.643 ***
OFP2_2 <--- Overall_Fin_Plan_2 1.123 .037 30.296 ***
OFP2_1 <--- Overall_Fin_Plan_2 .726 .041 17.809 ***
OFP9 <--- Overall_Fin_Plan_1 1.000
OFP8 <--- Overall_Fin_Plan_1 .820 .042 19.480 ***
OFP7 <--- Overall_Fin_Plan_1 .760 .042 18.075 ***
OFP6 <--- Overall_Fin_Plan_1 .843 .043 19.719 ***
OFP5 <--- Overall_Fin_Plan_1 .830 .042 19.598 ***
OFP4 <--- Overall_Fin_Plan_1 .886 .045 19.503 ***
OFP3 <--- Overall_Fin_Plan_1 1.112 .048 23.138 ***
OFP2 <--- Overall_Fin_Plan_1 1.060 .046 23.093 ***
OFP1 <--- Overall_Fin_Plan_1 1.048 .046 23.020 ***
Source: Primary Data
TABLE 4. 86 - Standardized Regression Weights: (Group number 1 - Default model)
Estimate
Overall_Fin_Plan_1 <--- Money_mgmt .133
Overall_Fin_Plan_2 <--- Money_mgmt .208
Overall_Fin_Plan_1 <--- Insurance .564
Overall_Fin_Plan_2 <--- Insurance .644
Overall_Fin_Plan_2 <--- Investment -.042
Overall_Fin_Plan_1 <--- Investment .061
Overall_Fin_Plan_2 <--- Personal_ Factors .170
Overall_Fin_Plan_1 <--- Personal_ Factors .092
Overall_Fin_Plan_2 <--- Retirement -.022
Overall_Fin_Plan_1 <--- Retirement -.013
Overall_Fin_Plan_2 <--- Estate_Planning -.122
Overall_Fin_Plan_1 <--- Estate_Planning .115
Overall_Fin_Plan_2 <--- Tax .131
Overall_Fin_Plan_1 <--- Tax .054
MM5 <--- Money_mgmt .926
MM4 <--- Money_mgmt .994
MM3 <--- Money_mgmt .994
MM2 <--- Money_mgmt .937
MM1 <--- Money_mgmt .994
IN7 <--- Insurance .888
IN6 <--- Insurance .895
IN5 <--- Insurance .905
IN4 <--- Insurance .961
IN3 <--- Insurance .971

148
Estimate
IN2 <--- Insurance .963
IN1 <--- Insurance .711
INV6 <--- Investment .761
INV5 <--- Investment .719
INV4 <--- Investment .777
INV3 <--- Investment .765
INV2 <--- Investment .691
INV1 <--- Investment .738
PF1 <--- Personal_ Factors .801
PF2 <--- Personal_ Factors .746
PF3 <--- Personal_ Factors .793
PF4 <--- Personal_ Factors .840
PF5 <--- Personal_ Factors .680
PF6 <--- Personal_ Factors .616
RTM1 <--- Retirement .906
RTM2 <--- Retirement .857
RTM3 <--- Retirement .833
RTM4 <--- Retirement .699
EP1 <--- Estate_Planning .783
EP2 <--- Estate_Planning .883
EP3 <--- Estate_Planning .858
EP4 <--- Estate_Planning .802
T1 <--- Tax .975
T2 <--- Tax .652
OFP2_5 <--- Overall_Fin_Plan_2 .868
OFP2_4 <--- Overall_Fin_Plan_2 .837
OFP2_3 <--- Overall_Fin_Plan_2 .884
OFP2_2 <--- Overall_Fin_Plan_2 .895
OFP2_1 <--- Overall_Fin_Plan_2 .643
OFP9 <--- Overall_Fin_Plan_1 .765
OFP8 <--- Overall_Fin_Plan_1 .752
OFP7 <--- Overall_Fin_Plan_1 .705
OFP6 <--- Overall_Fin_Plan_1 .760
OFP5 <--- Overall_Fin_Plan_1 .756
OFP4 <--- Overall_Fin_Plan_1 .753
OFP3 <--- Overall_Fin_Plan_1 .867
OFP2 <--- Overall_Fin_Plan_1 .865
OFP1 <--- Overall_Fin_Plan_1 .863
Source: Primary Data
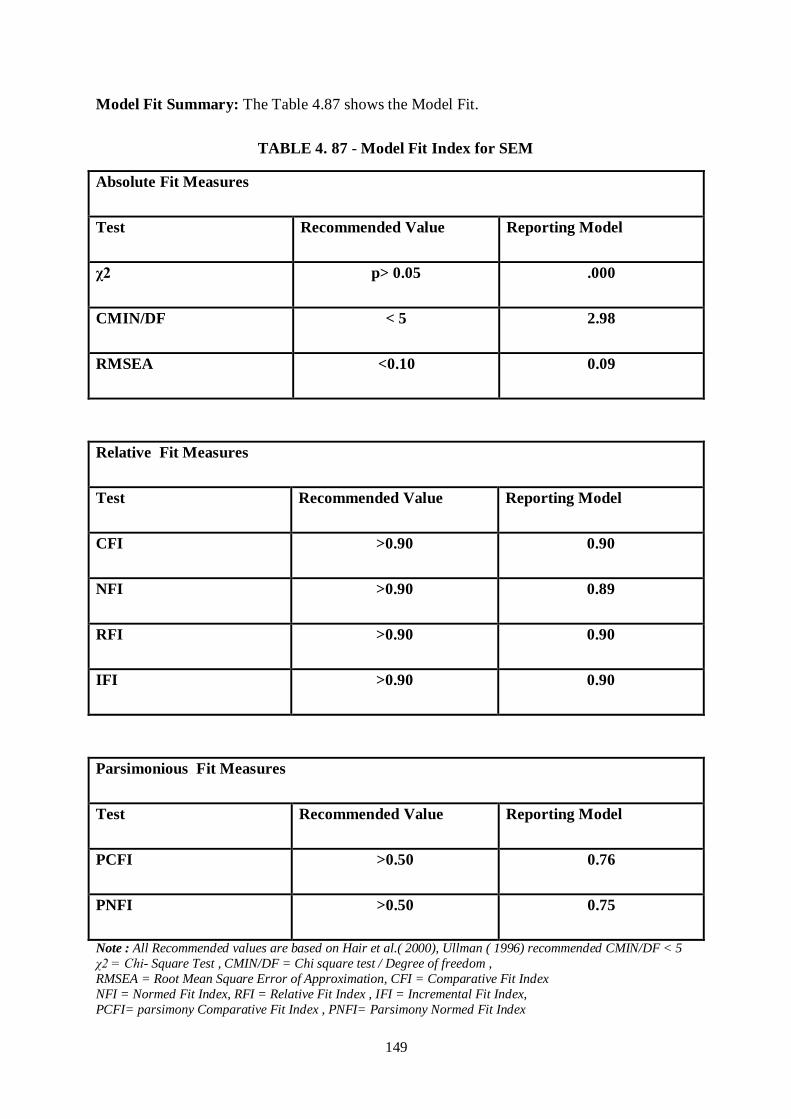
149
Model Fit Summary: The Table 4.87 shows the Model Fit.
TABLE 4. 87 - Model Fit Index for SEM
Absolute Fit Measures Measures
Test Recommended Value Reporting Model
χ2 p> 0.05 .000
CMIN/DF < 5 2.98
RMSEA <0.10 0.09
Relative Fit Measures Measures
Test Recommended Value Reporting Model
CFI >0.90 0.90
NFI >0.90 0.89
RFI >0.90 0.90
IFI >0.90 0.90
Parsimonious Fit Measures Parsimonious Fit Measures
Test Recommended Value Reporting Model
PCFI >0.50 0.76
PNFI >0.50 0.75
Note : All Recommended values are based on Hair et al.( 2000), Ullman ( 1996) recommended CMIN/DF < 5
χ2 = Chi- Square Test , CMIN/DF = Chi square test / Degree of freedom ,
RMSEA = Root Mean Square Error of Approximation, CFI = Comparative Fit Index
NFI = Normed Fit Index, RFI = Relative Fit Index , IFI = Incremental Fit Index,
PCFI= parsimony Comparative Fit Index , PNFI= Parsimony Normed Fit Index

150
Findings of well-fitting hypothesized models, where the χ2 value approximates the degrees of
freedom, have proven to be unrealistic in most SEM empirical research. More common are
findings of a large χ2 relative to degrees of freedom, thereby indicating a need to modify the
model in order to better fit the data (Joreskog & Sorbom, 1993). Thus, results related to the
test of hypothesized model are not unexpected. Indeed, given this problematic aspect of the
Likelihood Ratio Test, and the fact that postulated models (no matter how good) can only
ever fit real-world data approximately and never exactly.
One of the first fit statistics to address the problem of problem was the χ2/degrees of freedom
ratio (Wheaton, Muthen, Alwin, & Summers, 1977), which appears as CMIN/DF is 2. 98
(Standard Recommended value is <= 5).
The next set of goodness-of-fit statistics (baseline comparisons), which can be classified as
incremental or comparative indices of fit (Hu & Bentler, 1995; Marsh et al., 1988).
However, addressing evidence that the NFI has shown a tendency to underestimate fit in
small samples, Bentler (1990) revised the NFI to take sample size into account and proposed
the Comparative Fit Index (CFI). Values for both the NFI and CFI range from zero to 1.00
and are derived from the comparison of a hypothesized model with the independence (or null)
model. As such, each provides a measure of complete covariation in the data. value > .90 is
considered representative of a well-fitting model (Bentler, 1992). In this case the value of CFI
is 0.90 and NFI is 0.91 . Value of NFI is above the cut off value of 0.90.
The Relative Fit Index (RFI; Bollen, 1986) represents a derivative of the NFI; as with both
the NFI and CFI, the RFI coefficient values range from zero to 1.00, with values close to .95
indicating superior fit (Hu &Bentler, 1999). In this case the value is 0.90 indicating the
moderate fit of the model.
The next set of fit statistics focuses on the root mean square error of approximation
(RMSEA). Although this index, and the conceptual framework within which it is embedded,
was first proposed by Steiger and Lind in 1980, it has only recently been recognized as one of
the most informative criteria in covariance structure modeling. The
RMSEA takes into account the error of approximation in the population and asks the question
―How well would the model, with unknown but optimally chosen parameter values, fit the
population covariance matrix if it were available?‖ (Browne & Cudeck, 1993, pp. 137–138).
This discrepancy, as measured by the RMSEA, is expressed per degree of freedom, thus
making it sensitive to the number of estimated parameters in the model (i.e., the complexity
of the model); values less than .05 indicate good fit, and values as high as .08 represent
reasonable errors of approximation in the population (Browne & Cudeck, 1993). MacCallum

151
et al. (1996) have recently elaborated on these cutpoints and noted that RMSEA values
ranging from .08 to .10 indicate mediocre fit, and those greater than .10 indicate poor fit.
Although Hu and Bentler (1999) have suggested a value of .06 to be indicative of good fit
between the hypothesized model and the observed data, they cautioned that, when sample
size is small, the RMSEA (and TLI) tend to over reject true population models. In this case
the value of RMSEA is 0.09 indicate mediocre fit of model.
Thus, on the basis of our goodness-of-fit results, it can be concluded that the hypothesized
structural equation model moderate fit the sample data.

152
4.10.2 First Modification (e47↔ e48)
After running the Modification Indices, The improved values and diagram is presented below. Errors
e47 and 48 are correlated.
FIGURE 4. 13 – SEM Modified Model

153
Model Fit Summary: The table below shows the Model Fit. It can be concluded that all the
values are above the standard cut off values.
TABLE 4. 88 - Model Fit Index for SEM ( First Modification)
Absolute Fit Measures TABLE – 4.88 Absolute Fit Measures
Test Recommended Value Reporting Model
χ2 p> 0.05 .000
CMIN/DF < 5 2.89
RMSEA <0.10 0.08
Relative Fit Measures Relative Fit Measures
Test Recommended Value Reporting Model
CFI >0.90 0.91
NFI >0.90 0.90
RFI >0.90 0.91
IFI >0.90 0.91
Parsimonious Fit Measures Parsimonious Fit Measures
Test Recommended Value Reporting Model
PCFI >0.50 0.79
PNFI >0.50 0.79
Note : All Recommended values are based on Hair et al.( 2000), Ullman ( 1996) recommended CMIN/DF < 5
χ2 = Chi- Square Test , CMIN/DF = Chi square test / Degree of freedom ,
RMSEA = Root Mean Square Error of Approximation, CFI = Comparative Fit Index
NFI = Normed Fit Index, RFI = Relative Fit Index , IFI = Incremental Fit Index,
PCFI= parsimony Comparative Fit Index , PNFI= Parsimony Normed Fit Index

154
4.11 Association between Different Demographic Factors and Attitude of
Personal Financial Planning.
The Factor scores obtained by exploratory factor analysis are used to study the significant
difference between the Demographic profile of the respondents and Major factors which
shows the attitude towards the financial planning.
H017: Attitude towards PFP does not differ significantly with respect to gender of the
respondents.
The Table 4.89 shows the result of the Mann- Whitney U test.
TABLE 4. 89 - Mann-Whitney U test – Gender and Attitude towards PFP
Gender N Mean Rank Sum of Ranks
Asymp. Sig. (2-
tailed)
Investment
Male 358 366.89 131345.00 0.000
Female 242 202.29 48955.00
Total 600
Insurance
Male 358 294.34 105374.00 0.284
Female 242 309.61 74926.00
Total 600
Overall PFP
Male 358 350.49 125477.00 0.000
Female 242 226.54 54823.00
Total 600
Tax
Male 358 338.61 121223.00 0.000
Female 242 244.12 59077.00
Total 600
Money_mgmt
Male 358 322.27 115373.00 0.000
Female 242 268.29 64927.00
Total 600
Retirement
Male 358 349.51 125126.00 0.000
Female 242 227.99 55174.00
Total 600
Estate
Male 358 325.56 116552.00 0.000
Female 242 263.42 63748.00
Total 600
Company/Product Male 358 304.04 108845.00 0.536

155
related Factors Female 242 295.27 71455.00
Total 600
Personal Factors
Male 358 313.71 112307.00 0.022
Female 242 280.96 67993.00
Total 600
Source: Primary Data
From Table 4.89 it can be interpreted that P- value for the factors Investment, Overall PFP,
Tax, Retirement, Money Management, Estate Planning, and Personal Factors is less than
0.05. So we reject the null hypothesis for them. For Insurance and Company related factors
P- value is more than 0.05, so we fail to reject the null hypothesis for them. Attitude towards
Investment Management, Overall PFP, Retirement Planning, Money Management, Estate
Planning and Personal Factors differ with Gender.
H018: Attitude towards PFP does not differ significantly with respect to Location of the
respondents.
Kruskal Wallis Test has been performed to test the results. The Table 4.90 shows the Mean
Rank of Location and attitude towards PFP.
TABLE 4. 90 – Mean Rank of Attitude with Location of the respondents
Location N Mean Rank
Investment
Ahmedabad 150 286.28
Baroda 150 314.72
Rajkot 150 285.08
Surat 150 315.92
Total 600
Insurance
Ahmedabad 150 295.60
Baroda 150 305.40
Rajkot 150 295.86
Surat 150 305.14
Total 600
Overall PFP
Ahmedabad 150 293.16
Baroda 150 307.84
Rajkot 150 291.62
Surat 150 309.38
Total 600
Tax Ahmedabad 150 291.38

156
Baroda 150 309.62
Rajkot 150 290.42
Surat 150 310.58
Total 600
Money_mgmt
Ahmedabad 150 311.04
Baroda 150 289.96
Rajkot 150 311.04
Surat 150 289.96
Total 600
Retirement
Ahmedabad 150 293.44
Baroda 150 307.56
Rajkot 150 292.74
Surat 150 308.26
Total 600
Estate
Ahmedabad 150 289.96
Baroda 150 311.04
Rajkot 150 290.42
Surat 150 310.58
Total 600
Company/Product
related Factors
Ahmedabad 150 281.88
Baroda 150 319.12
Rajkot 150 281.08
Surat 150 319.92
Total 600
Personal Factors
Ahmedabad 150 309.38
Baroda 150 291.62
Rajkot 150 309.92
Surat 150 291.08
Total 600
Source: Primary Data

157
TABLE 4. 91 – Kruskal Wallis Test – Attitude towards PFP among Location of the
respondents
Investme
nt
Insuranc
e
Overall
PFP Tax
Money_mg
mt
Retireme
nt Estate
Comp
/Product
related
factors
Personal
Factors
Chi-
Square
4.431 .465 1.345 1.959 2.241 1.115 2.193 7.502 1.713
Df 3 3 3 3 3 3 3 3 3
Asymp.
Sig.
.218 .927 .718 .581 .524 .773 .533 .058 .634
a. Kruskal Wallis Test
b. Grouping Variable: Location
Source: Primary Data
From the Table 4.91, the calculated Chi-Square, degree of freedom, and significant value is
given. For all the factors P – Value is more than 0.05, so we fail to reject the null hypothesis
for the same. There is no significance difference among Personal Financial Planning attitude
and Location of the respondents.
H019: Attitude towards PFP does not differ significantly with respect to Age of the
respondents.
Kruskal Wallis Test has been performed to test the results. The Table 4.92 shows the Mean
Rank of Age and attitude towards PFP.
TABLE 4. 92 – Mean Rank of Attitude with Age of the respondents
Age N Mean Rank
Investment
20-35 213 353.56
36-58 276 306.98
59 and above 111 182.58
Total 600
Insurance
20-35 213 270.57
36-58 276 349.50
59 and above 111 236.09
Total 600
Overall PFP 20-35 213 327.49

158
36-58 276 327.73
59 and above 111 181.01
Total 600
Tax
20-35 213 311.67
36-58 276 296.37
59 and above 111 289.34
Total 600
Money_mgmt
20-35 213 281.33
36-58 276 310.89
59 and above 111 311.45
Total 600
Retirement
20-35 213 364.74
36-58 276 259.17
59 and above 111 279.99
Total 600
Estate
20-35 213 315.20
36-58 276 282.08
59 and above 111 318.09
Total 600
Company /
Product Related
Factors
20-35 213 319.26
36-58 276 300.86
59 and above 111 263.61
Total 600
Personal Factors
20-35 213 318.16
36-58 276 292.54
59 and above 111 286.39
Total 600
Source: Primary Data

159
TABLE 4. 93 – Kruskal Wallis Test – Attitude towards PFP among Age of the
respondents
Investme
nt
Insuranc
e
Overall
PFP Tax
Money_mg
mt
Retireme
nt Estate
Comp /
Product
Related
Factors
Personal
Factors
Chi-
Square
72.336 44.713 65.691 1.594 4.080 47.187 5.983 7.810 3.612
Df 2 2 2 2 2 2 2 2 2
Asymp.
Sig.
.000 .000 .000 .451 .130 .000 .050 .020 .164
a. Kruskal Wallis Test
b. Grouping Variable: Age
Source: Primary Data
From the table 4.93, the calculated Chi-Square, degree of freedom, and significant value is
given. For Investment, Insurance, Overall View of PFP, Retirement Planning, Estate
Planning, Company / Product related factors, P- value is less than 0.05. So, we reject the null
hypothesis for the same. For Tax Planning and Personal Factors P – Value is more than 0.05,
so we fail to reject the null hypothesis for the same. Hence it can be concluded that Attitude
for Investment, Insurance, Overall View of PFP, Retirement Planning, Estate Planning,
Company / Product related factors differs with Age. Attitude towards Tax Planning and
Personal Factors doesn‘t differ with Age.
Ho20: Attitude towards PFP does not differ significantly with respect to Education of the
respondents.
Kruskal Wallis Test has been performed to test the results. The Table 4.94 shows the Mean
Rank of Education and attitude towards PFP.

160
TABLE 4. 94 – Mean Rank of Attitude with Education of the respondents
Education N Mean Rank
Investment
High school 108 233.36
Graduation 315 305.06
Post Graduation 177 333.35
Total 600
Insurance
High school 108 327.19
Graduation 315 324.47
Post Graduation 177 241.55
Total 600
Overall PFP
High school 108 293.31
Graduation 315 271.65
Post Graduation 177 356.23
Total 600
Tax
High School 108 277.56
Graduation 315 282.15
Post Graduation 177 347.16
Total 600
Money_mgmt
High School 108 362.92
Graduation 315 301.48
Post Graduation 177 260.67
Total 600
Retirement
High School 108 297.17
Graduation 315 314.70
Post Graduation 177 277.26
Total 600
Estate
High School 108 244.08
Graduation 315 288.76
Post Graduation 177 355.82
Total 600
Product/
Company Related
Factors
High School 108 289.06
Graduation 315 277.11
Post Graduation 177 349.11
Total 600
Personal Factors
High School 108 329.97
Graduation 315 329.96
Post Graduation 177 230.09
Total 600
Source: Primary Data

161
TABLE 4. 95 – Kruskal Wallis Test – Attitude towards PFP among Education of the
respondents
Investme
nt
Insuranc
e Overall PFP Tax
Money_mg
mt
Retireme
nt Estate
Product /
Company
Related
Factors
Personal
Factors
Chi-
Square
22.976 29.710 27.616 19.374 23.596 5.414 31.920 20.892 42.401
Df 2 2 2 2 2 2 2 2 2
Asymp.
Sig.
.000 .000 .000 .000 .000 .067 .000 .000 .000
a. Kruskal Wallis Test
b. Grouping Variable: Education
Source: Primary Data
From the table 4.95, the calculated Chi-Square, degree of freedom, and significant value is
given. For Investment, Insurance, Overall View of PFP, Tax Planning, Money Management,
Estate Planning, Company / Product related factors, P- value is less than 0.05. So, we reject
the null hypothesis for the same. For Retirement Planning, P – Value is more than 0.05, so we
fail to reject the null hypothesis for the same. Hence it can be concluded that Attitude for
Investment, Insurance, Overall View of PFP, Estate Planning, Company / Product related
factors differs with Education. Attitude towards Retirement Planning doesn‘t differ with
Education.
Ho21: Attitude towards PFP does not differ significantly with respect to Job Type of the
respondents.
Kruskal Wallis Test has been performed to test the results. The Table 4.96 shows the Mean
Rank of Job Type and attitude towards PFP.

162
TABLE 4. 96 – Mean Rank of Attitude with Job Type of the respondents
Job type N Mean Rank
Investment
Public Sector 200 274.77
Private Sector 200 326.18
Government 200 300.55
Total 600
Insurance
Public Sector 200 321.74
Private Sector 200 316.55
Government 200 263.21
Total 600
Overall PFP
Public Sector 200 266.92
Private Sector 200 309.56
Government 200 325.02
Total 600
Tax
Public Sector 200 290.29
Private Sector 200 298.96
Government 200 312.26
Total 600
Money_mgmt
Public Sector 200 302.62
Private Sector 200 275.71
Government 200 323.18
Total 600
Retirement
Public Sector 200 320.50
Private Sector 200 324.26
Government 200 256.75
Total 600
Estate
Public Sector 200 259.93
Private Sector 200 307.63
Government 200 333.95
Total 600
Company
/Product Related
Factors
Public Sector 200 333.58
Private Sector 200 328.57
Government 200 239.36
Total 600
Personal Factors
Public Sector 200 242.30
Private Sector 200 274.19
Government 200 385.01
Total 600
Source: Primary Data

163
TABLE 4. 97 – Kruskal Wallis Test – Attitude towards PFP among Job Type of the
respondents
Investme
nt
Insuranc
e
Overall
PFP Tax
Money_mg
mt
Retireme
nt Estate
Compan
y
/Product
Related
Factors
Personal
Factors
Chi-
Square
8.872 14.288 12.240 1.732 7.622 19.447 19.354 38.829 76.460
Df 2 2 2 2 2 2 2 2 2
Asymp.
Sig.
.012 .001 .002 .421 .022 .000 .000 .000 .000
a. Kruskal Wallis Test
b. Grouping Variable: Job type
Source: Primary Data
From the table 4.97, the calculated Chi-Square, degree of freedom, and significant value is
given. For Investment, Insurance, Overall View of PFP, Money Management, Retirement
Planning, Estate Planning, Company / Product related factors, P- value is less than 0.05. So,
we reject the null hypothesis for the same. For Tax Planning, P – Value is more than 0.05, so
we fail to reject the null hypothesis for the same. Hence it can be concluded that Attitude for
Investment, Insurance, Overall View of PFP, Retirement Planning, Estate Planning,
Company / Product related factors differs with Education. Attitude towards Tax Planning
doesn‘t differ with Education.
Ho22: Attitude towards PFP does not differ significantly with respect to Experience of
the respondents.
Kruskal Wallis Test has been performed to test the results. The Table 4.98 shows the Mean
Rank of Experience and attitude towards PFP.

164
TABLE 4. 98 – Mean Rank of Attitude with Experience of the respondents
Experience N Mean Rank
Investment
Less Than 5 Years 22 278.82
5-15 years 296 331.86
16-25 Years 177 281.60
25 and Above 105 248.50
Total 600
Insurance
Less Than 5 Years 22 322.86
5-15 years 296 276.80
16-25 Years 177 329.92
25 and Above 105 313.01
Total 600
Overall PFP
Less Than 5 Years 22 239.82
5-15 years 296 339.29
16-25 Years 177 268.48
25 and Above 105 257.84
Total 600
Tax
Less Than 5 Years 22 210.09
5-15 years 296 303.95
16-25 Years 177 296.25
25 and Above 105 316.90
Total 600
Money_mgmt
Less Than 5 Years 22 280.18
5-15 years 296 330.94
16-25 Years 177 224.45
25 and Above 105 347.16
Total 600
Retirement
Less Than 5 Years 22 441.09
5-15 years 296 303.94
16-25 Years 177 277.18
25 and Above 105 300.67
Total 600
Estate
Less Than 5 Years 22 133.59
5-15 years 296 337.75
16-25 Years 177 278.55
25 and Above 105 267.47
Total 600
Company/Product
Related Factors
Less Than 5 Years 22 311.82
5-15 years 296 278.79
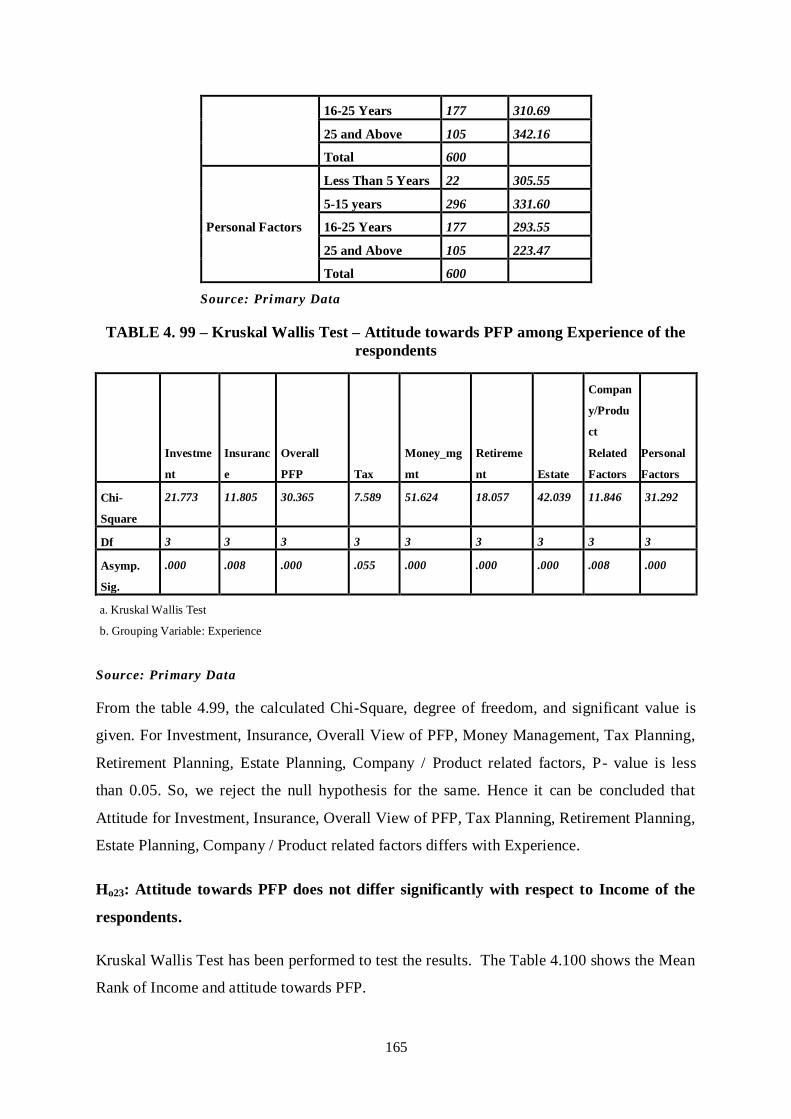
165
16-25 Years 177 310.69
25 and Above 105 342.16
Total 600
Personal Factors
Less Than 5 Years 22 305.55
5-15 years 296 331.60
16-25 Years 177 293.55
25 and Above 105 223.47
Total 600
Source: Primary Data
TABLE 4. 99 – Kruskal Wallis Test – Attitude towards PFP among Experience of the
respondents
Investme
nt
Insuranc
e
Overall
PFP Tax
Money_mg
mt
Retireme
nt Estate
Compan
y/Produ
ct
Related
Factors
Personal
Factors
Chi-
Square
21.773 11.805 30.365 7.589 51.624 18.057 42.039 11.846 31.292
Df 3 3 3 3 3 3 3 3 3
Asymp.
Sig.
.000 .008 .000 .055 .000 .000 .000 .008 .000
a. Kruskal Wallis Test
b. Grouping Variable: Experience
Source: Primary Data
From the table 4.99, the calculated Chi-Square, degree of freedom, and significant value is
given. For Investment, Insurance, Overall View of PFP, Money Management, Tax Planning,
Retirement Planning, Estate Planning, Company / Product related factors, P- value is less
than 0.05. So, we reject the null hypothesis for the same. Hence it can be concluded that
Attitude for Investment, Insurance, Overall View of PFP, Tax Planning, Retirement Planning,
Estate Planning, Company / Product related factors differs with Experience.
Ho23: Attitude towards PFP does not differ significantly with respect to Income of the
respondents.
Kruskal Wallis Test has been performed to test the results. The Table 4.100 shows the Mean
Rank of Income and attitude towards PFP.

166
TABLE 4. 100 – Mean Rank of Attitude with Income of the respondents
Income N Mean Rank
Investment
Less Than 5 Lakhs 84 252.86
5-10 Lakh 334 324.08
10-15 lakhs 140 279.31
More Than 15 lakh 42 278.93
Total 600
Insurance
Less Than 5 Lakhs 84 255.29
5-10 Lakh 334 304.43
10-15 lakhs 140 316.36
More Than 15 lakh 42 306.79
Total 600
Overall PFP
Less Than 5 Lakhs 84 217.00
5-10 Lakh 334 324.53
10-15 lakhs 140 308.75
More Than 15 lakh 42 248.93
Total 600
Tax
Less Than 5 Lakhs 84 265.64
5-10 Lakh 334 302.03
10-15 lakhs 140 302.02
More Than 15 lakh 42 353.00
Total 600
Money_mgmt
Less Than 5 Lakhs 84 135.64
5-10 Lakh 334 332.68
10-15 lakhs 140 322.94
More Than 15 lakh 42 299.50
Total 600
Retirement
Less Than 5 Lakhs 84 213.79
5-10 Lakh 334 341.04
10-15 lakhs 140 279.07
More Than 15 lakh 42 222.93
Total 600
Estate
Less Than 5 Lakhs 84 260.04
5-10 Lakh 334 328.90
10-15 lakhs 140 276.63
More Than 15 lakh 42 235.14
Total 600
Company / Less Than 5 Lakhs 84 380.07

167
Product Related
Factors
5-10 Lakh 334 291.53
10-15 lakhs 140 281.60
More Than 15 lakh 42 275.71
Total 600
Personal Factors
Less Than 5 Lakhs 84 222.89
5-10 Lakh 334 322.10
10-15 lakhs 140 315.44
More Than 15 lakh 42 234.14
Total 600
Source: Primary Data
TABLE 4. 101 – Kruskal Wallis Test – Attitude towards PFP among Income of the
respondents
Investme
nt
Insuranc
e
Overall
PFP Tax
Money_mg
mt
Retireme
nt Estate
Compan
y /
Product
Related
Factors
Personal
Factors
Chi-
Square
15.402 7.274 30.395 7.735 90.750 50.586 22.891 21.922 29.911
Df 3 3 3 3 3 3 3 3 3
Asymp.
Sig.
.002 .064 .000 .050 .000 .000 .000 .000 .000
a. Kruskal Wallis Test
b. Grouping Variable: Income
Source: Primary Data
From the table 4.101, the calculated Chi-Square, degree of freedom, and significant value is
given. For Investment, Insurance, Overall View of PFP, Money Management, Tax Planning,
Retirement Planning, Estate Planning, Company / Product related factors, P- value is less
than 0.05. So, we reject the null hypothesis for the same. Hence it can be concluded that
Attitude for Investment, Insurance, Overall View of PFP, Tax Planning, Retirement Planning,
Estate Planning, Company / Product related factors differs with Income.
Ho24: Attitude towards PFP does not differ significantly with respect to Marital Status
of the respondents.
Kruskal Wallis Test has been performed to test the results. The Table 4.102 shows the Mean
Rank of Marital Status and attitude towards PFP.

168
TABLE 4. 102 – Mean Rank of Attitude with Marital Status of the respondents
MarStat N Mean Rank
Investment
Married 376 359.89
Unmarried 208 194.97
Widow/Widower 6 269.00
Divorcee 10 281.60
Total 600
Insurance
Married 376 281.71
Unmarried 208 336.40
Widow/Widower 6 349.50
Divorcee 10 230.90
Total 600
Overall PFP
Married 376 326.92
Unmarried 208 253.25
Widow/Widower 6 321.00
Divorcee 10 277.70
Total 600
Tax
Married 376 336.16
Unmarried 208 232.45
Widow/Widower 6 274.50
Divorcee 10 390.50
Total 600
Money_mgmt
Married 376 270.60
Unmarried 208 348.56
Widow/Widower 6 375.00
Divorcee 10 380.30
Total 600
Retirement
Married 376 309.32
Unmarried 208 288.33
Widow/Widower 6 255.00
Divorcee 10 249.50
Total 600
Estate
Married 376 314.07
Unmarried 208 275.87
Widow/Widower 6 417.00
Divorcee 10 232.70

169
Total 600
Product/Company
Related Factors
Married 376 315.61
Unmarried 208 278.19
Widow/Widower 6 272.00
Divorcee 10 213.50
Total 600
Personal Factors
Married 376 290.23
Unmarried 208 316.75
Widow/Widower 6 249.50
Divorcee 10 379.10
Total 600
Source: Primary Data
TABLE 4. 103 – Kruskal Wallis Test – Attitude towards PFP among Marital of the
respondents
Investme
nt
Insuranc
e
Overall
PFP Tax
Money_mg
mt
Retireme
nt Estate
Product/
Compan
y
Related
Factors
Personal
Factors
Chi-
Square
122.612 15.778 24.814 53.935 30.708 3.326 11.096 9.327 5.860
Df 3 3 3 3 3 3 3 3 3
Asymp.
Sig.
.000 .001 .000 .000 .000 .344 .011 .025 .119
a. Kruskal Wallis Test
b. Grouping Variable: MarStat
Source: Primary Data
From the table 4.103, the calculated Chi-Square, degree of freedom, and significant value is
given. For Investment, Insurance, Overall View of PFP, Tax Planning, Money Management,
Estate Planning, Company / Product related factors, P- value is less than 0.05. So, we reject
the null hypothesis for the same. For Retirement Planning, P – Value is more than 0.05, so we
fail to reject the null hypothesis for the same. Hence it can be concluded that Attitude for
Investment, Insurance, Overall View of PFP, Tax Planning, Estate Planning, Company /
Product related factors differs with Marital Status. Attitude towards Retirement Planning
doesn‘t differ with Marital Status.

170
4.12 Linkages between Financial Literacy and Awareness related to
different Investment Avenues.
Bhushan P. (2014) in his thesis stated that respondents with high literacy level tend to have high level
of awareness of financial products except for Post office saving schemes. Present study also has
attempted to find the association between financial literacy and Awareness of Financial Products. To
find this association following hypothesis had been formulated.
Ho25: Awareness of different Investment Avenues does not differ significantly with
respect to Financial Literacy of the respondents.
To find out association between financial literacy of the respondent and their awareness
regarding different Investment Avenues, Mann Whitney –U test has been applied. The Table
4.104 shows the Mean Rank of Financial Literacy with Awareness of Different Investment
Avenues.
TABLE 4. 104 – Mean Rank of Financial Literacy with Awareness of Different
Investment Avenues
Financial
Literacy
N Mean Rank Sum of Ranks
Saving Account
Financial Illiterate 282 226.14 63771.00
Financial Literate 318 366.44 116529.00
Total 600
FD
Financial Illiterate 282 234.12 66021.00
Financial Literate 318 359.37 114279.00
Total 600
Shares
Financial Illiterate 282 199.97 56391.00
Financial Literate 318 389.65 123909.00
Total 600
Bonds
Financial Illiterate 282 271.59 76587.00
Financial Literate 318 326.14 103713.00
Total 600
Derivatives
Financial Illiterate 282 311.99 87981.00
Financial Literate 318 290.31 92319.00
Total 600
MutualFunds
Financial Illiterate 282 250.46 70629.00
Financial Literate 318 344.88 109671.00
Total 600

171
PPF
Financial Illiterate 282 210.82 59451.00
Financial Literate 318 380.03 120849.00
Total 600
Other Post Office Services
Financial Illiterate 282 280.84 79197.00
Financial Literate 318 317.93 101103.00
Total 600
Life Insurance
Financial Illiterate 282 282.44 79647.00
Financial Literate 318 316.52 100653.00
Total 600
Money Market
Financial Illiterate 282 304.01 85731.00
Financial Literate 318 297.39 94569.00
Total 600
Tax Saving Scheme
Financial Illiterate 282 238.33 67209.00
Financial Literate 318 355.63 113091.00
Total 600
Real Estate
Financial Illiterate 282 299.41 84435.00
Financial Literate 318 301.46 95865.00
Total 600
Non Conventional
Avenues
Financial Illiterate 282 323.65 91269.00
Financial Literate 318 279.97 89031.00
Total 600
Source: Primary Data
TABLE 4. 105 – Kruskal Wallis Test – Financial Literacy with Awareness of Different
Investment Avenues
Mann-Whitney
U
Wilcoxon W Z Asymp. Sig. (2-
tailed)
Saving Account 23868.000 63771.000 -12.271 .000
FD 26118.000 66021.000 -10.973 .000
Shares 16488.000 56391.000 -14.316 .000
Bonds 36684.000 76587.000 -4.254 .000
Derivatives 41598.000 92319.000 -1.746 .081
Mutual Funds 30726.000 70629.000 -7.700 .000
PPF 19548.000 59451.000 -14.175 .000
Other Post Office Services 39294.000 79197.000 -3.147 .002
Life Insurance 39744.000 79647.000 -2.750 .006
Money Market 43848.000 94569.000 -.555 .579
Tax Saving Scheme 27306.000 67209.000 -9.566 .000

172
Real Estate 44532.000 84435.000 -.156 .876
Non Conventional
Avenues 38310.000 89031.000 -3.431 .001
a. Grouping Variable: Fin Literacy
Source: Primary Data
From the table 4.105, the calculated Chi-Square, degree of freedom, and significant value is
given. For Saving Account, FD, Shares, Bonds, Mutual Funds, PPF, Post Office Schemes,
Life Insurance, Tax Saving Scheme and Non-Conventional Avenues, P- value is less than
0.05. So, we reject the null hypothesis for the same. For, Derivatives, Money Market and
Real Estate, P – Value is more than 0.05, so we fail to reject the null hypothesis for the same.
Hence it can be concluded that Awareness for Saving Account, FD, Shares, Bonds, Mutual
Funds, PPF, Post Office Schemes, Life Insurance, Tax Saving Scheme and Non-
Conventional Avenues differs with Financial Literacy. Awareness towards Derivatives,
Money Market and Real Estate doesn‘t differ with Financial Literacy.

173
CHAPTER – 5
Findings & Discussions
5.1 Introduction
This Chapter discusses Objective-wise major findings of the study based on the analysis of
data collected from 600 respondents across four major cities of Gujarat.
5.2 General Findings
Out of 600 respondents,
Four major cities of Gujarat, namely; Ahmedabad, Baroda, Surat and Rajkot have
been covered for the present study and 150 respondents were interviewed from each
of the above cities for collection of data using the structured questionnaires.
From 150 respondents in each city, 50 respondents were government employees, 50
respondents were Public Sector and 50 were Private Sector employees.
Around 35.5% respondents were from age group of 20 – 35 years, 46% from age
group 36 – 58 years and 18.5% were from age group 59 years and above.
59.7 % respondents were male and 40.3% were female.
52.5 % respondents were Graduates, 29.5 % were Post- graduates and 18% were High
School passed out.
49.3% respondents have 5 – 15 years of experience, 29.5% respondents have 16 -25
years of experience, 17.5 % respondents have experience of 25 years and above and
3.7 % respondents have less than 5 years of experience.
55.7% of the respondents have income between 5 – 10 Lakhs, 23.3 % of the
respondents have income between 10 -15 Lakhs, 14% of the respondents have income
less than 5 Lakhs and 7% of the respondents have income more than 15 Lakhs.
62.7 % of the respondents are married, 34.7 % respondents are unmarried, 1 % are
widow/ widower and 1.7 % are divorcee.
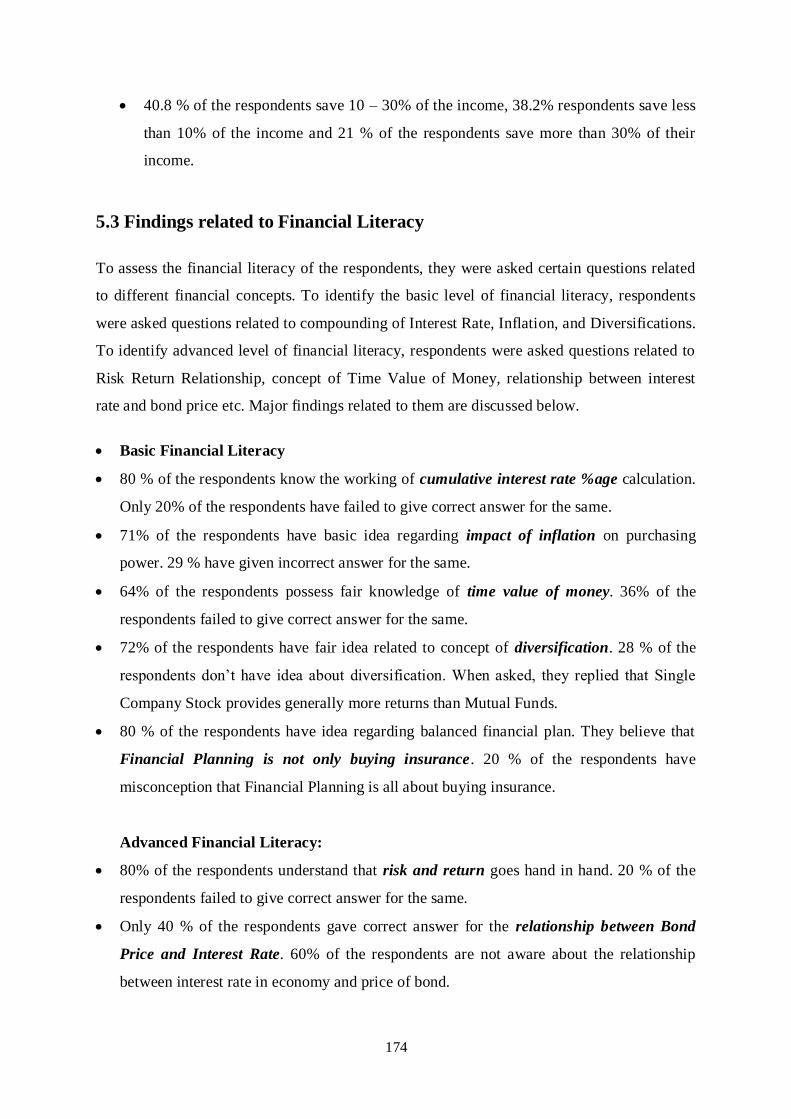
174
40.8 % of the respondents save 10 – 30% of the income, 38.2% respondents save less
than 10% of the income and 21 % of the respondents save more than 30% of their
income.
5.3 Findings related to Financial Literacy
To assess the financial literacy of the respondents, they were asked certain questions related
to different financial concepts. To identify the basic level of financial literacy, respondents
were asked questions related to compounding of Interest Rate, Inflation, and Diversifications.
To identify advanced level of financial literacy, respondents were asked questions related to
Risk Return Relationship, concept of Time Value of Money, relationship between interest
rate and bond price etc. Major findings related to them are discussed below.
Basic Financial Literacy
80 % of the respondents know the working of cumulative interest rate %age calculation.
Only 20% of the respondents have failed to give correct answer for the same.
71% of the respondents have basic idea regarding impact of inflation on purchasing
power. 29 % have given incorrect answer for the same.
64% of the respondents possess fair knowledge of time value of money. 36% of the
respondents failed to give correct answer for the same.
72% of the respondents have fair idea related to concept of diversification. 28 % of the
respondents don‘t have idea about diversification. When asked, they replied that Single
Company Stock provides generally more returns than Mutual Funds.
80 % of the respondents have idea regarding balanced financial plan. They believe that
Financial Planning is not only buying insurance. 20 % of the respondents have
misconception that Financial Planning is all about buying insurance.
Advanced Financial Literacy:
80% of the respondents understand that risk and return goes hand in hand. 20 % of the
respondents failed to give correct answer for the same.
Only 40 % of the respondents gave correct answer for the relationship between Bond
Price and Interest Rate. 60% of the respondents are not aware about the relationship
between interest rate in economy and price of bond.

175
46 % of the respondents have idea regarding financial literacy related to awareness of
financial products and returns generated by them. 54 % of the respondents failed to give
correct answer.
Overall Financial Literacy:
It has been observed from the frequency analysis that, respondents possessed Fair
knowledge of basic financial literacy. There were more incorrect answers than correct for
only two questions pertaining to advanced financial literacy,
Median of Respondents‘ financial literacy score comes to 6 out of 8. With the help of
median score, it has been found that 47 % of the respondents are financially illiterate and
53% of the respondents are financially literate.
5.3.1 Association between different demographic factors and financial literacy
H01: There is no significant association between Age and financial literacy of the
respondents.
From the result of Chi Square test, P Value is less than 0.05. So, we reject the null
hypothesis. It can be concluded that there is a significant association between Age and
Financial Literacy of the respondents.
H02: There is no significant association between Gender and financial literacy of the
respondents.
From the result of Chi Square test, P Value is less than 0.05. So, we reject the null
hypothesis. It can be concluded that, there is a significant association between Gender and
Financial Literacy of the respondents.
H03: There is no significant association between Education and financial literacy of the
respondents.
From the result of Chi Square test, P Value is less than 0.05. Therefore, we reject the null
hypothesis. It can be concluded that, there is a significant association between Education
and Financial Literacy of the respondents.
H04: There is no significant association between Experience and financial literacy of the
respondents.

176
From the result of Chi Square test, P Value is less than 0.05. We, therefore, reject the null
hypothesis and may conclude that, there is a significant association between Experience
and Financial Literacy of the respondents.
H05: There is no significant association between Job Type and financial literacy of the
respondents.
From the result of Chi Square test, P Value is less than 0.05. Therefore, we reject the null
hypothesis and may conclude that, there is a significant association between Job Type and
Financial Literacy of the respondents.
H06: There is no significant association between Income and financial literacy of the
respondents.
From the result of Chi Square test, P Value is less than 0.05. We, therefore, reject the null
hypothesis and may conclude that, there is a significant association between Income and
Financial Literacy of the respondents.
H07: There is no significant association between Marital Status and financial literacy of
the respondents.
From the result of Chi Square test, P Value is less than 0.05. We, therefore, reject the null
hypothesis and conclude that, there is a significant association between Marital Status and
Financial Literacy of the respondents.
H08: There is no significant association between Location and financial literacy of the
respondents.
From the result of Chi Square test, P Value is more than 0.05. We, therefore fail to reject the
null hypothesis and may conclude that, there seems to be no association between Location
and Financial Literacy of the respondents. So, whether the respondents belong to
Ahmedabad, Baroda , Rajkot or Surat, they don‘t differ in Financial Literacy.
It can, therefore, be concluded that Financial Literacy of the respondents gets affected by
Age, Gender, Income, Experience, Marital Status, and Job Type of the respondents, it is not
dependent on the Location of the respondents.

177
FIGURE 5. 1 – Association between Demographic Factors and Financial Literacy
5.4 Findings related to Awareness of different Investment Avenues
70% of the respondents are completely aware about the Savings Account. 15 % of the
respondents are moderately aware regarding the Savings Account and remaining 15 % of
the respondents are not aware about savings account.
70 % of the respondents are completely aware about the Fixed Deposit. 10 % of the
respondents are moderately aware regarding the Fixed Deposit and remaining 20 % of the
respondents are not aware about Fixed Deposit.
37 % of the respondents are completely aware about the Equity Shares. 23 % of the
respondents are moderately aware regarding the Equity Shares and remaining 40 % of the
respondents are not aware about Equity Shares.
54 % of the respondents are completely aware about the Bonds. 23 % of the respondents
are moderately aware regarding the Bonds and remaining 23 % of the respondents are not
aware about Bonds.
17 % of the respondents are completely aware about the Derivatives. 23 % of the
respondents are moderately aware regarding the Derivatives and remaining 60 % of the
respondents are not aware about Derivatives.
62 % of the respondents are completely aware about the Mutual Funds. 18 % of the
respondents are moderately aware regarding the Mutual Funds and remaining 20 % of the
respondents are not aware about Mutual Funds.
Age
Gender
Income
Experience
Marital Status
Job Type
Financial
Literacy
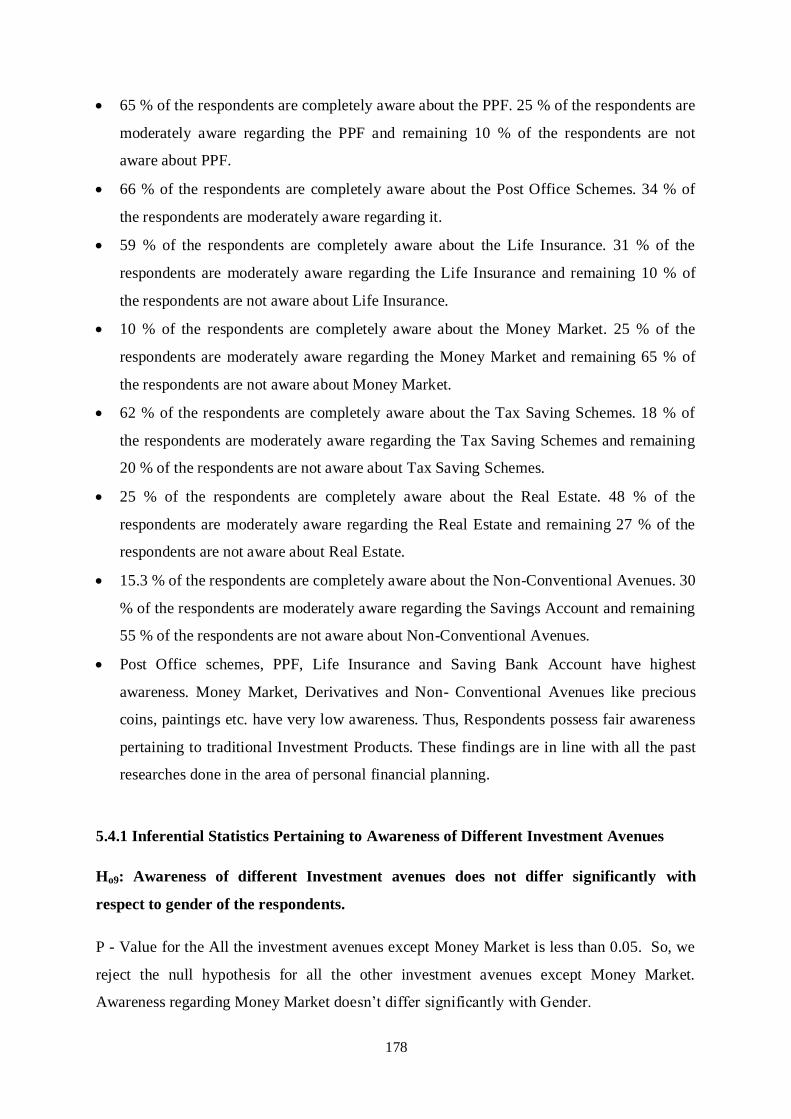
178
65 % of the respondents are completely aware about the PPF. 25 % of the respondents are
moderately aware regarding the PPF and remaining 10 % of the respondents are not
aware about PPF.
66 % of the respondents are completely aware about the Post Office Schemes. 34 % of
the respondents are moderately aware regarding it.
59 % of the respondents are completely aware about the Life Insurance. 31 % of the
respondents are moderately aware regarding the Life Insurance and remaining 10 % of
the respondents are not aware about Life Insurance.
10 % of the respondents are completely aware about the Money Market. 25 % of the
respondents are moderately aware regarding the Money Market and remaining 65 % of
the respondents are not aware about Money Market.
62 % of the respondents are completely aware about the Tax Saving Schemes. 18 % of
the respondents are moderately aware regarding the Tax Saving Schemes and remaining
20 % of the respondents are not aware about Tax Saving Schemes.
25 % of the respondents are completely aware about the Real Estate. 48 % of the
respondents are moderately aware regarding the Real Estate and remaining 27 % of the
respondents are not aware about Real Estate.
15.3 % of the respondents are completely aware about the Non-Conventional Avenues. 30
% of the respondents are moderately aware regarding the Savings Account and remaining
55 % of the respondents are not aware about Non-Conventional Avenues.
Post Office schemes, PPF, Life Insurance and Saving Bank Account have highest
awareness. Money Market, Derivatives and Non- Conventional Avenues like precious
coins, paintings etc. have very low awareness. Thus, Respondents possess fair awareness
pertaining to traditional Investment Products. These findings are in line with all the past
researches done in the area of personal financial planning.
5.4.1 Inferential Statistics Pertaining to Awareness of Different Investment Avenues
Ho9: Awareness of different Investment avenues does not differ significantly with
respect to gender of the respondents.
P - Value for the All the investment avenues except Money Market is less than 0.05. So, we
reject the null hypothesis for all the other investment avenues except Money Market.
Awareness regarding Money Market doesn‘t differ significantly with Gender.
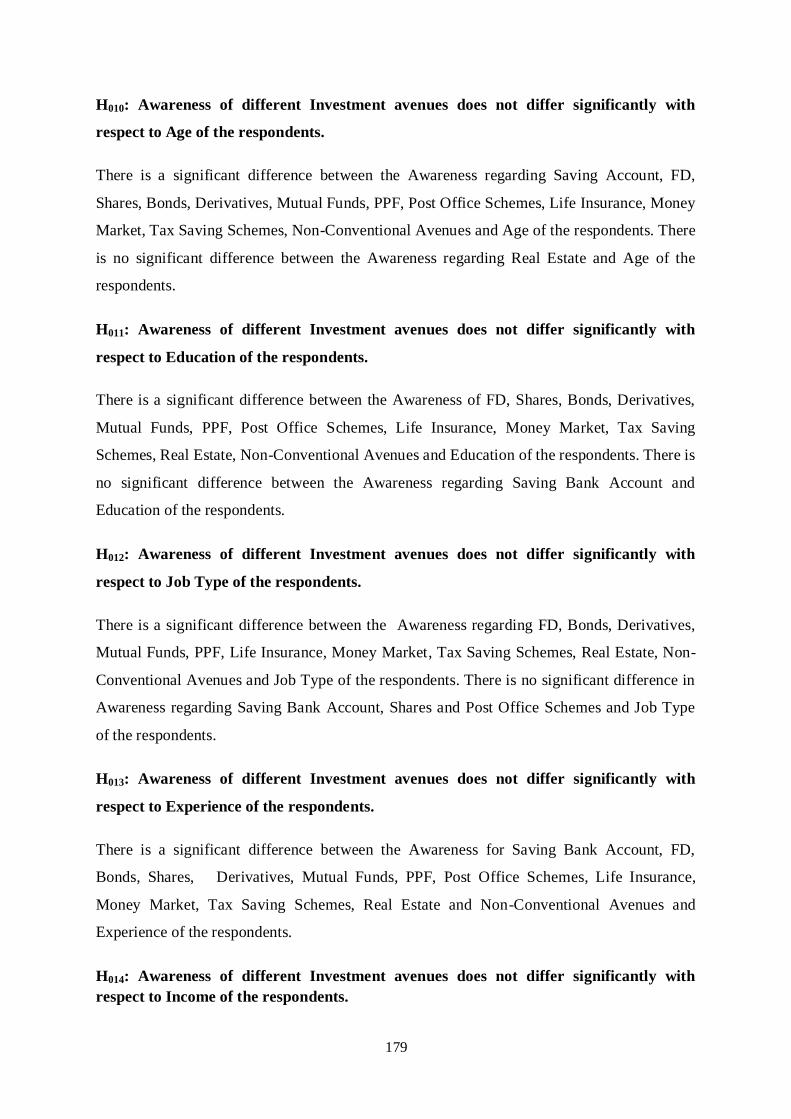
179
H010: Awareness of different Investment avenues does not differ significantly with
respect to Age of the respondents.
There is a significant difference between the Awareness regarding Saving Account, FD,
Shares, Bonds, Derivatives, Mutual Funds, PPF, Post Office Schemes, Life Insurance, Money
Market, Tax Saving Schemes, Non-Conventional Avenues and Age of the respondents. There
is no significant difference between the Awareness regarding Real Estate and Age of the
respondents.
H011: Awareness of different Investment avenues does not differ significantly with
respect to Education of the respondents.
There is a significant difference between the Awareness of FD, Shares, Bonds, Derivatives,
Mutual Funds, PPF, Post Office Schemes, Life Insurance, Money Market, Tax Saving
Schemes, Real Estate, Non-Conventional Avenues and Education of the respondents. There is
no significant difference between the Awareness regarding Saving Bank Account and
Education of the respondents.
H012: Awareness of different Investment avenues does not differ significantly with
respect to Job Type of the respondents.
There is a significant difference between the Awareness regarding FD, Bonds, Derivatives,
Mutual Funds, PPF, Life Insurance, Money Market, Tax Saving Schemes, Real Estate, Non-
Conventional Avenues and Job Type of the respondents. There is no significant difference in
Awareness regarding Saving Bank Account, Shares and Post Office Schemes and Job Type
of the respondents.
H013: Awareness of different Investment avenues does not differ significantly with
respect to Experience of the respondents.
There is a significant difference between the Awareness for Saving Bank Account, FD,
Bonds, Shares, Derivatives, Mutual Funds, PPF, Post Office Schemes, Life Insurance,
Money Market, Tax Saving Schemes, Real Estate and Non-Conventional Avenues and
Experience of the respondents.
H014: Awareness of different Investment avenues does not differ significantly with
respect to Income of the respondents.

180
There is a significant difference between the Awareness regarding Saving Account, FD,
Shares, Derivatives, Mutual Funds, PPF, Post office Schemes, Life Insurance, Money
Market, Real Estate, Non-Conventional Avenues and Income of the respondents. There is no
significant difference between the Awareness regarding Bonds, Tax Saving schemes and
Income of the respondents.
H015: Awareness of different Investment avenues does not differ significantly with
respect to Marital Status of the respondents.
There is a significant difference between the Awareness regarding Saving Account, FD,
Shares, Bonds, Mutual Funds, PPF, Life Insurance, Tax Saving Schemes, Real Estate, Non-
Conventional Avenues and Marital Status of the respondents. There is no significant
difference between the Awareness regarding Derivatives, Post office Schemes and Money
Market and Marital Status of the respondents.
H016: Awareness of different Investment avenues does not differ significantly with
respect to Location of the respondents.
There is no significant difference between the Awareness regarding Saving Account, FD,
Shares, Bonds, Mutual Funds, Derivatives, Post office schemes, PPF, Life Insurance, Money
Market, Tax Saving Schemes, Real Estate, Non-Conventional Avenues and Location of the
respondents.
5.5 Findings related to Attitude and Factors Influencing PFP
Attitude of the respondents towards PFP was measured on five point scale. The mean
score for Money Management comes to 3.54. This shows positive attitude towards Money
Management. This is in consistent with Lai & Tan (2009) & Tang et al. (2002a) in which
respondents have positive attitude towards Money Management.
Respondents have stated that they spend more when they use credit card, although they
don‘t carry forward the bill payments, they pay full credit card bill each month.
Mean score for attitude towards Insurance Planning is 3.08 which indicates positive
attitude of the respondents towards Insurance Planning.
Mean Score for investment planning is 3.71 which indicates positive attitude of
respondents towards Investment Management.

181
Respondents have agreed that Retirement Planning should start at early age and that the
Retirement amount should be such so as to maintain the similar lifestyle after retirement.
Majority of the respondents have not started saving the funds as a part of Retirement
Planning.
Overall mean for Retirement Planning comes to 3.46, which shows that respondents have
fairly positive attitude towards it.
Respondents have agreed that it is important for them but majority of them have not
prepared well and they have agreed that they don‘t have any idea about trust under the
head of Estate Planning. Awareness about Estate Management is low.
Mean score of Estate Management is 2.89. This is lower than all other components of
Personal Financial Planning.
Out of 600 respondents only 312 are aware about all the components of Financial
Planning. This shows that respondents don’t have fairly awareness of Overall PFP and
hence their Financial Plan cannot be a balanced one.
Mean score of the statement ‗I need experts for planning my finances‘ is 3.6. Therefore,
we may infer that respondents need experts for their Financial Planning.
Mean score for overall PFP is 3.34. This shows that respondents have positive attitude
towards Overall Personal Financial Planning.
Mean score for economic factors is 3.08, which is little low. It shows that respondents do
not give more importance to Economic factors while planning their finances.
Mean score for Risk Profile comes to 3.81. It shows that respondents give much
importance to their own risk appetite while planning their finances.
Mean score for the expected return & tax benefits linked to the product are 4.02 and 4.17
respectively. It shows that these factors highly influence Financial Planning of the
respondents.
Mean score for service provided by the company is 3.29 and mean score regarding
knowledge about the representative of the company is 3.08; it shows that respondents do
consider services provided by the company and knowledge level of employees
representing the company before taking financial decisions .
Mean score for the liquidity provided by the product is 3.45; it shows that respondents
consider liquidity of the product before investing into it.

182
Overall mean score of all the statements used to analyze attitude & factors influencing
PFP is 3.29. It suggests that the respondents of Gujarat have positive attitude towards
Personal Financial Planning.
Factors influencing PFP were identified with the help of Exploratory Factor Analysis
(EFA). They are Insurance Planning, Spending Behavior, Investment, Overall view of
PFP, Retirement Planning, Taxation Planning and Estate Planning, Personal Factors and
Company / Scheme related factors. The same had been confirmed with Confirmatory
Factor Analysis (CFA) also.
With the help of SEM technique hypothesized model was tested. It has been hypothesized
that Overall Financial Planning depends upon the seven factors named as Money
Management, Insurance, Investment, Overall View of PFP, Retirement, Estate Planning
and Tax. Different Model Fit indices suggest that, Data fit the Hypothesized model.
5.5.1 Inferential Statistics with regards to Attitude towards PFP
H017: Attitude towards PFP does not differ significantly with respect to gender of the
respondents. Attitude towards Investment Management, Overall PFP, Retirement Planning, Money
Management, Estate Planning differs with Gender.
H018: Attitude towards PFP does not differ significantly with respect to Location of
the respondents.
There is no significant difference between Personal Financial Planning Attitude and
Location of the respondents.
H019: Attitude towards PFP does not differ significantly with respect to Age of the
respondents.
Attitude for Investment, Insurance, Overall View of PFP, Retirement Planning, and Estate
Planning, Company / Product related factors differs with Age. Attitude towards Tax
Planning doesn‘t differ with Age.
Ho20: Attitude towards PFP does not differ significantly with respect to Education of
the respondents.
Attitude for Investment, Insurance, Overall View of PFP, Estate Planning, Company /
Product related factors differs with Education. Attitude towards Retirement Planning
doesn‘t differ with Education.

183
Ho21: Attitude towards PFP does not differ significantly with respect to Job Type of
the respondents.
Attitude for Investment, Insurance, Overall View of PFP, Retirement Planning, Estate
Planning, Company / Product related factors differs with Education. Attitude towards Tax
Planning doesn‘t differ with Education.
Ho22: Attitude towards PFP does not differ significantly with respect to Experience
of the respondents.
Attitude for Investment, Insurance, Overall View of PFP, Tax Planning, Retirement
Planning, Estate Planning, Company / Product related factors differs with Experience.
Ho23: Attitude towards PFP does not differ significantly with respect to Income of
the respondents.
Attitude for Investment, Insurance, Overall View of PFP, Tax Planning, Retirement
Planning, Estate Planning, Company / Product related factors differs with Income.
Ho24: Attitude towards PFP does not differ significantly with respect to Marital
Status of the respondents.
Attitude for Investment, Insurance, Overall View of PFP, Tax Planning, Estate Planning,
Company / Product related factors differs with Marital Status. Attitude towards
Retirement Planning doesn‘t differ with Marital Status.
Ho25: Awareness of different Investment Avenues does not differ significantly with
respect to Financial Literacy of the respondents.
Awareness for Saving Account, FD, Shares, Bonds, Mutual Funds, PPF, Post Office
Schemes, Life Insurance, Tax Saving Scheme and Non-Conventional Avenues differs
with Financial Literacy. Awareness towards Derivatives, Money Market and Real Estate
doesn‘t differ with Financial Literacy.
Overall Findings indicate that, Respondents of Gujarat State possess basic financial
literacy. Respondents are aware about all traditional Investment Avenues. Awareness
Related to Non-Conventional Avenues is less. Attitude towards Overall PFP is Positive.
Attitude towards Retirement Planning & Estate Planning is low. Respondents feel that
their Personal Financial Plan is not balanced and they require expert to manage the same.

184
TABLE 5. 1 - Summary of Major Findings
No Hypotheses Test P – Value Null Hyp. Findings
1 There is no significant
association between Age and
financial literacy of the
respondents.
Chi Square Less than
0.05
Rejected Significant association
between Age and
Financial Literacy of the
respondents.
2 There is no significant
association between Gender
and financial literacy of the
respondents
Chi Square Less than
0.05
Rejected Significant association
between Gender and
Financial Literacy of the
respondents.
3 There is no significant
association between
Education and financial
literacy of the respondents.
Chi Square Less than
0.05
Rejected Significant association
between Education and
Financial Literacy of the
respondents.
4 There is no significant
association between
Experience and financial
literacy of the respondents.
Chi Square Less than
0.05
Rejected Significant association
between Experience and
Financial Literacy of the
respondents.
5 There is no significant
association between Job Type
and financial literacy of the
respondents.
Chi Square Less than
0.05
Rejected Significant association
between Job Type and
Financial Literacy of the
respondents.
6 There is no significant
association between Income
and financial literacy of the
respondents.
Chi Square Less than
0.05
Rejected Significant association
between Income and
Financial Literacy of the
respondents.
7 There is no significant
association between Marital
Status and financial literacy
of the respondents
Chi Square Less than
0.05
Rejected Significant association
between Marital Status
and Financial Literacy of
the respondents.
8 There is no significant
association between Location
and financial literacy of the
Chi Square More than
0.05
Fail to
Reject
No significant association
between Location and
Financial Literacy of the

185
respondents respondents.
9 Awareness of different
Investment avenues does not
differ significantly with
respect to gender of the
respondents.
Mann
Whitney U
Test
Less than
0.05
Rejected Gender influence
awareness related to
saving account, FD,
Bonds, Shares,
Derivatives, Mutual
Funds, Post Office
Schemes, Life Insurance,
Tax Saving Schemes,
Real Estate, NCA
10 Awareness of different
Investment avenues does not
differ significantly with
respect to Age of the
respondents
Kruskal
Wallis
Less than
0.05
Rejected Significance difference in
Awareness of Saving
Account, FD, Shares,
Bonds, Derivatives,
Mutual Funds, PPF, Post
Office Schemes, Life
Insurance, Money Market,
Tax Saving Schemes,
Non-Conventional
Avenues and Age of the
respondents.
11 Awareness of different
Investment avenues does not
differ significantly with
respect to Education of the
respondents
Kruskal
Wallis
Less than
0.05
Rejected Significance difference in
Awareness of FD, Shares,
Bonds, Derivatives,
Mutual Funds, PPF, Post
Office Schemes, Life
Insurance, Money Market,
Tax Saving Schemes,
Real Estate, Non-
Conventional Avenues
and Education of the
respondents.
12 Awareness of different
Investment avenues does not
differ significantly with
respect to Job Type of the
Kruskal
Wallis
Less than
0.05
Rejected Significance difference in
Awareness FD, Bonds,
Derivatives, Mutual
Funds, PPF, Life
Insurance, Money Market,

186
respondents Tax Saving Schemes,
Real Estate, Non-
Conventional Avenues
and Job Type of the
respondents.
13 Awareness of different
Investment avenues does not
differ significantly with
respect to Experience of the
respondents.
Kruskal
Wallis
Less than
0.05
Rejected Significance difference in
Awareness for Saving
Bank Account, FD,
Bonds, Shares,
Derivatives, Mutual
Funds, PPF, Post Office
Schemes, Life Insurance,
Money Market, Tax
Saving Schemes, Real
Estate and Non-
Conventional Avenues
and Experience of the
respondents.
14 Awareness of different
Investment avenues does not
differ significantly with
respect to Income of the
respondents
Kruskal
Wallis
Less than
0.05
Rejected Significance difference in
Awareness regarding
Saving Account, FD,
Shares, Derivatives,
Mutual Funds, PPF, Post
office Schemes, Life
Insurance, Money Market,
Real Estate, Non-
Conventional Avenues
and Income of the
respondents.
15 Awareness of different
Investment avenues does not
differ significantly with
respect to Marital Status of
the respondents.
Kruskal
Wallis
Less than
0.05
Rejected Significance difference in
Awareness Saving
Account, FD, Shares,
Bonds, Mutual Funds,
PPF, Life Insurance, Tax
Saving Schemes, Real
Estate, Non-Conventional
Avenues and Marital

187
Status of the respondents
16 Awareness of different
Investment avenues does not
differ significantly with
respect to Location of the
respondents
Kruskal
Wallis
More than
0.05
Fail to
Reject
There is no significance
difference among
Awareness of Investment
Avenues and Location of
the respondents.
17 Attitude towards PFP does
not differ significantly with
respect to gender of the
respondents.
Mann
Whiteny U
Test
Less than
0.05
Rejected Attitude towards
Investment Management,
Overall PFP, Retirement
Planning, Money
Management, Estate
Planning differ with
Gender.
18 Attitude towards PFP does
not differ significantly with
respect to Location of the
respondents.
Kruskal
Wallis
More than
0.05
Fail to
Reject
There is no significance
difference among
Personal Financial
Planning attitude and
Location of the
respondents.
19 Attitude towards PFP does
not differ significantly with
respect to Age of the
respondents.
Kruskal
Wallis
Less than
0.05
Rejected Attitude for Investment,
Insurance, Overall View
of PFP, Retirement
Planning, and Estate
Planning, Company /
Product related factors
differs with Age.
20 Attitude towards PFP does
not differ significantly with
respect to Education of the
respondents.
Kruskal
Wallis
Less than
0.05
Rejected Attitude for Investment,
Insurance, Overall View
of PFP, Estate Planning,
Company / Product
related factors differs with
Education.
21 Attitude towards PFP does
not differ significantly with
respect to Job Type of the
Kruskal
Wallis
Less than
0.05
Rejected Attitude for Investment,
Insurance, Overall View
of PFP, Retirement
Planning, Estate Planning,

188
respondents. Company / Product
related factors differs with
Job Type.
22 Attitude towards PFP does
not differ significantly with
respect to Experience of the
respondents.
Kruskal
Wallis
Less than
0.05
Rejected Attitude for Investment,
Insurance, Overall View
of PFP, Tax Planning,
Retirement Planning,
Estate Planning, Company
/ Product related factors
differs with Experience.
23 Attitude towards PFP does
not differ significantly with
respect to Income of the
respondents.
Kruskal
Wallis
Less than
0.05
Rejected Attitude for Investment,
Insurance, Overall View
of PFP, Tax Planning,
Retirement Planning,
Estate Planning, Company
/ Product related factors
differs with Income.
24 Attitude towards PFP does
not differ significantly with
respect to Marital Status of
the respondents.
Kruskal
Wallis
Less than
0.05
Rejected Attitude for Investment,
Insurance, Overall View
of PFP, Tax Planning,
Estate Planning, Company
/ Product related factors
differs with Marital Status
25 Awareness of different
Investment Avenues does not
differ significantly with
respect to Financial Literacy
of the respondents.
Mann
Whitney U
test
Less than
0.05
Reject Awareness for Saving
Account, FD, Shares,
Bonds, Mutual Funds,
PPF, Post Office
Schemes, Life Insurance,
Tax Saving Scheme
differs with Financial
Literacy
Source: Primary Data

189
CHAPTER - 6
Conclusion & Scope of Future Research
6.1 Conclusion
Strengthening of any economy depends upon the financial well-being of the residents of the
country. Past researches show that financial well-being of an individual depends upon their
financial behaviour, which in turn depends upon attitude towards personal financial planning
and the Financial Literacy of an individual. Balanced Personal Financial Plan also plays vital
role for Financial Well Being of an individual. Many studies have been done in the area of
financial literacy in Indian context but very few studies have been conducted on Overall
Personal Financial Planning, especially in the state of Gujarat. The present study had focused
on Financial Literacy, Awareness of overall PFP and Attitude of the respondents towards
PFP.
600 Salaried employees from four major cities of Gujarat had been selected for the purpose
of the study. Study revealed that Respondents possess fair financial literacy. This shows that
respondents are quite informed and aware about financial terms, concepts and its working.
Awareness related to traditional Investment Avenues like FD, Saving Bank Account, Post
Office Schemes and PPF is quite high. Still awareness of new age Investment Avenues like
Derivatives, Non-Conventional Avenues - Precious Coins, Paintings is still very low among
respondents, so they are not able to reap advantages associated with these products.
Interesting finding of the research is: though awareness of all the components of PFP is not
that high, attitude towards PFP is positive among the respondents. They understand the
importance of balanced Financial Plan and they feel that they require an expert to help them
in sketching a Financial Plan. Overall, the study has created a base for the future detailed
research to be done in the field of Personal Finance.
190
6.2 Limitations of the Study
Following are limitations and constraints of the present research.
The present study was confined to the state of Gujarat. Sample Size was 600 and only
salaried employees were considered for the research purpose. So, Findings of the present
study can‘t be generalized for the entire Nation.
The study was all about the Financial Planning of the respondents, there may be the
possibility of biasness in the responses given by them.
There were abundant literatures available in the area of Financial Literacy and Awareness
of Investment Avenues. But there was absence of studies specifically in the area of
Awareness of overall PFP, Attitude and Factors influencing PFP. There was absence of
some model or developed scale in the particular area. If some published research study
had been available, it would have helped the current study to gauge still better results.
Some of the findings of the study suggest that there may be chance of lack of
understanding of some of the concepts by respondents.
6.3 Implications of the Study
The current study suggests that Respondents possess Basic Financial Literacy.
Respondents are lacking awareness regarding new investment avenues, Retirement
Planning and Estate Planning. So, SEBI, RBI and Other Government Agencies, Banks &
Other financial Institutions may focus on increasing literacy regarding advanced financial
concepts.
Study will help financial planners and Investment Advisors, to better understand attitude
of investors regarding Personal Financial Planning and Factors which may influence the
decision for PFP.
Study provides comprehensive idea about Personal Financial Planning concept, Process
and the different components of the same. Study also provides idea about how to plan
finances through different stages of life cycle. So, it can be used as a ready reckoner by
normal investor for understanding concepts of PFP.

191
6.4 Scope of the Future Research
As present study was confined to state of Gujarat, scope of the study can be extended
towards other states.
The present study has focused only on salaried employees. The same can also be
extended towards responses of Businessmen and Professionals.
Linkages between Financial Literacy and Awareness of different Investment Avenues
have been established in the present study. Further linkages can be established between
Financial Literacy and Attitude. Past Researches suggest that Financial Well-being
depends upon the Financial Attitude of the respondents. So further studies can be done to
establish the linkage between Financial Attitude and Financial Well-being of the
respondents.

192
List of References
Journals / Thesis / Surveys
Agarwal, S., Amromin, G., Ben-David, I., Chomsisengphet, S., & Evanoff, D. D.
(2015). Financial literacy and financial planning: Evidence from India. Journal of
Housing Economics, 27, 4-21.
Aggarwal, M., & Gupta, M. (2014). Awareness of financial literacy among college
students. Journal of Management Sciences and Technology, 2(1), 1-13.
Agarwalla, S. K., Barua, S., Jacob, J., & Varma, J. R. (2012). A survey of financial
literacy among students, young employees and the retired in India. Retrieved
February, 26, 2013.
Al-Ajmi, J. Y. (2008). Risk tolerance of individual investors in an
emergingmarket. International Research Journal of Finance and Economics, 17(1),
15-26.
Altaf, N. (2014). Measuring the level of financial literacy among management
graduates. Abhinav National Monthly Refereed Journal of Research in Commerce &
Management,3(6).
Ali, A., Rahman, M. S., & Bakar, A. (2013). Financial Literacy and Satisfaction in
Malaysia: A Pilot Study. International Journal of Trade, Economics and
Finance, 4(5), 319.
Altintas, K. M. (2011). The dynamics of financial literacy within the framework of
personal finance: An analyses among Turkish University Students. African Journal of
Business Management, 5(26), 10483.
Arrondel, L., Debbich, M., & Savignac, F. (2014). Financial literacy and financial
planning in France. Numeracy: Vol. 6 : Iss. 2 , Article 8.
Atkinson, A., & Messy, F. (2012). Measuring Financial Literacy: Results of the
OECD/International Network on Financial Education. OECD Working Papers on
Finance, Insurance and Private Pensions, (15).

193
Attri. R (2012), ―Spending and Saving habits of youth in city of Indore‖, Bauddhik,
Vol. 3, Issue.2, Pp 8 -15
Vennila, R. Nandhagopal (2012) ―Investors‘ Preference towards Mutual Funds in
Coimbatore City‖, European Journal of Social Sciences ISSN 1450-2267 Vol.29 No.1
(2012), pp. 115-125
Bank, A. N. Z. (2008). ANZ survey of adult financial literacy in Australia. Accessed
March, 11, 2009.
Bashir, T., Javed, A., Butt, A. A., Azam, N., Tanveer, A., & Ansar, I. (2013). An
Assessment Study on the ‗‘Factors Influencing the Individual Investor Decision
Making Behavior‖. Journal of Business and Management, 9(5).
Bawa, S and Ruchita (2011) Awareness and willingness to Pay for Health Insurance :
An Empirical Study with Reference to Punjab India, International Journal of
Humanities and Social Science ,Vol 1 No. 7 .
Bhushan, P. (2014). Relationship between Financial Literacy and Investment
Behavior of Salaried Individuals. Journal of Business Management & Social Sciences
Research, ISSN, (2319-5614), 82-87.
Bollen, K. A. (1986). Sample size and Bentler and Bonett's nonnormed fit
index. Psychometrika, 51(3), 375-377.
Boon, T. H., Yee, H. S., & Ting, H. W. (2011). Financial literacy and personal
financial planning in Klang Valley, Malaysia. International Journal of Economics and
Management, 5(1), 149-168.
Borden, L. M., Lee, S. A., Serido, J., & Collins, D. (2008). Changing college
students‘ financial knowledge, attitudes, and behavior through seminar
participation. Journal of family and economic issues, 29(1), 23-40.
Browne, M. W., & Cudeck, R. (1993). Alternative ways of assessing model fit. Sage
focus editions, 154, 137-138.
Byrne, B. M. (2006). Structural equation modeling with EQS: Basic concepts,
applications, and programming (2nd ed.). Mahwah, NJ: Erlbaum
Capuano, A., & Ramsay, I. (2011). What causes suboptimal financial behaviour? An
exploration of financial literacy, social influences and behavioural economics.
Chatterjee Surojit, Indians are wise savers but poor investors: Survey, International
Business Times, posted on 11 feb2008.

194
Chen, H., & Volpe, R. P. (1998). An analysis of personal financial literacy among
college students. Financial services review, 7(2), 107-128.
Ciumora T. (2014) FACTORS INFLUENCING INDIVIDUAL FINANCIAL
DECISIONS: A LITERATURE REVIEW, PhD, ―Victor Slăvescu‖ Centre for
Financial and Monetary Research, Bucharest
Das. S (2012), ― Investment habits among the Households: An empirical analysis‖
Asian Journal of Research in Banking and Finance, Vol. 2, Issue 6, pp 70 – 84
Deb, B. (2013). Consumer preference in Life Insurance-A case study of Guwahati.
Indian Journal of applied research, 3(2), 173-177, ISSN 2249-555X
Delpachitra, S., & Beal, D. (2002). Factors influencing planning for
retirement. Economic Papers: A journal of applied economics and policy, 21(3), 1-13.
D’Silva, B., Bhuptani, R., Menon, S., & D’Silva, S. (2011). Influence of Social Media
Marketing on Brand Choice Behaviour among Youth in India: An Empirical Study,
presented in International Conference on Technology and Business Management, March
28-30, 756-763.
Felton, J., Gibson, B., & Sanbonmatsu, D. M. (2003). Preference for risk in investing
as a function of trait optimism and gender. The journal of behavioral finance, 4(1),
33-40.
Ford, M. W., & Kent, D. W. (2009). Gender differences in student financial market
attitudes and awareness: An exploratory study. Journal of Education for
Business, 85(1), 7-12.
Fünfgeld, B., & Wang, M. (2009). Attitudes and behaviour in everyday finance:
evidence from Switzerland. International Journal of Bank Marketing, 27(2), 108-128.
Gallery, N., Newton, C., & Palm, C. (2011). Framework for assessing financial
literacy and superannuation investment choice decisions. Australasian Accounting
Business & Finance Journal, 5(2), 3.
Gargi Pant, W. I. S. D. O. M. (2013). Retirement Planning of Female Faculty
Members-An Expense or Saving for the Future. Global Journal of Management and
Business Studies, 3(5), 541-544.
Geetha. N. and Ramesh.M, 2011, A Study on People s Preference in Investment
Behaviour , Indian Journal of Exclusive Management Research, Vol.1, Issue.6
HDFC Life Value Notes ( 2012) . ‗Life Freedom Index Survey for Women.
Downloaded from https://www.hdfclife.com/iwov-

195
resources/pdf/media/press/2012/Life_Freedom_Index-Urban-women-
Press_Release.pdf on 27 August, 2013
Hira, T. K., Rock, W. L., & Loibl, C. (2009). Determinants of retirement planning
behaviour and differences by age. International Journal of Consumer Studies, 33(3),
293-301.
Hogarth, J. M. (2002). Financial literary and family & consumer scences. Journal of
Family and Consumer Sciences, 94(1), 14.
Hung, A., Yoong, J., & Brown, E. (2012). Empowering women through financial
awareness and education. OECD Working Papers on Finance, Insurance and Private
Pensions, (14), 1.
Hung, A., Parker, A. M., & Yoong, J. (2009). Defining and measuring financial
literacy.
Hu, L. T., & Bentler, P. M. (1998). Fit indices in covariance structure modeling:
Sensitivity to underparameterized model misspecification. Psychological
methods, 3(4), 424.
Ibrahim, M. E., & Alqaydi, F. R. (2013). Financial literacy, personal financial
attitude, and forms of personal debt among residents of the UAE. International
Journal of Economics and Finance, 5(7), 126.
INFE, O. (2011). Measuring financial literacy: Core questionnaire in measuring
financial literacy: Questionnaire and guidance notes for conducting an internationally
comparable survey of financial literacy. Pariz: OECD.
Jalil, M., Abdul Razak, D., & Azam, F. (2013). Exploring factors influencing
financial planning after retirement: structural equation modeling approach. American
Journal of Applied Sciences, 10(3), 270-279.
Jariwala, H. (2013). To Study the Level of Financial Literacy and its Impact on
Investment Decision – An in-Depth Analysis of Investors in Gujarat State.
Unpublished Ph.D Thesis. Ganpat: V. M. Patel Institute of Management Ganpat
University, Ganpat Vidyanagar
Joji, N. A., & Raveendran, P. T. (2008). Does Compulsive Buying Affect Credit Card
Defaults?. Vision, 12(4), 23-32.
Joreskog, K. and Sorbom, D. (1993), LISREL 8: Structural Equation Modeling with
the SIMPLIS Command Language. Chicago, IL: Scientific Software International Inc.

196
Joshi, J. R. (2013). Mutual Funds: An Investment Option from Investors' Point of
View. IBMRD's Journal of Management & Research, 2(1), 124-134.
Jusoh, Z., & Lin, L. Y. (2012). Personal financial knowledge and attitude towards
credit card practices among working adults in Malaysia. International Journal of
Business and Social Science, 3(7).
Kamugundu, A. R. (2016). Factors influencing the adoption of high risk financial
products. IJEMR , 6 (11).
Kebede, M., & Kuar, J. Financial Literacy and Management of Personal Finance: A
Review of Recent Literatures.
Khan, K. A. (2015). Financial Awareness & Investment Prefernece of Working
Women in Kampala, Uganda. International Journal in Management & Social Science
, 3 (09), 62-70.
Kidwell, B., Brinberg, D., & Turrisi, R. (2003). Determinants of money management
behavior. Journal of Applied Social Psychology, 33(6), 1244-1260.
Krajnakova, E., Navickas, M., & Gudaitis, T. (2014). Influence of financial literacy
on management of personal finances in a young household. Verslas: teorija ir
praktika, (1), 32-40.
Kulkarni P. (2012), ―Young India low on Financial Awareness‖, ET Bureau, April 27,
2012.
K.S Ranjani and Anjali Chopra,(2012), An empirical study on financial awareness of
working women in india ,the international journal‘s research journal of social science
& management,01, (06), 268-280
Lai, M. M., & Tan, W. K. (2009). An empirical analysis of personal financial
planning in an emerging economy. European Journal of Economics, Finance and
Administrative Sciences, 16, 99-111.
Leora Klapper Annamaria Lusardi Georgios A. Panos ( 2012), ―Financial Literacy
and the Financial Crisis‖, World Bank Research Development Group, Policy
Research Working Paper 5980.
Lusardi, Annamaria and Mitchell, Olivia S.( 2007),‖ Financial Literacy and
Retirement Preparedness: Evidence and Implications for Financial Education
Programs‖. Michigan Retirement Research Center Research Paper No. WP 2006-144.
Lusardi, A., & Mitchell, Olivia S. (2008). Planning and financial literacy: How do
women fare? (No. w13750). National Bureau of Economic Research.

197
MacCallum, R.C., Browne, M.W., and Sugawara, H., M. (1996), "Power Analysis
and Determination of Sample Size for Covariance Structure Modeling," Psychological
Methods, 1 (2), 130-49
Madhukumar, S., Sudeepa, D., & Gaikwad, V. (2012). Awareness and perception
regarding health insurance in Bangalore rural population. International Journal of
Medicine and Public Health, 2(2), 18-22.
Mahamuni P., Apte S., Jumle A. ( 2011), ― A study on PFP for IT sector investor in
Pune‖, International journal of Management, IT, Engineering, Vol. 1, Issue 5, pp. 74 -
89.
Mane, S., & Bhandari, R. (2014). A Study of Investor‘s Awareness and Selection of
Different Financial Investment Avenues for the Investor in Pune City. International
Research Journal of Business and Management, 4, 45-51.
Marsh HW. 1988. Multitrait multimethod analysis. In Educational Research
Methodology, Measurement and Evaluation: An International Handbook, ed. JP
Keeves, pp. 570–80. Oxford, UK: Pergamon.
Martin, M. (2007). A literature review on the effectiveness of financial education.
Mehmet, I., Apan, M., & Ayval, A. (2015). Determination of Factors Affecting
Individual Investor Behaviours: A Study on Bankers. International Journal of
Economics and Financial Issues, 5(2).
Mien, N. T., & Thao, T. P. (2015). Factors affecting personal financial management
behaviors: evidence from vietnam. In Proceedings of the Second Asia-Pacific
Conference on Global Business, Economics, Finance and Social Sciences AP15,
Danang-Vietnem (pp. 1-16).
Mishra, L. (2015). Financial Planning for Educated Young Women in
India. Financial Planning, 6(3).
Mohamad R. ( 2010), ― Gender and Working sector comparison in Personal Financial
Planning‖, thesis submitted to University of Utara Malaysia.
Murphy, D. S., & Yetmar, S. (2010). Personal financial planning attitudes: a
preliminary study of graduate students. Management Research Review, 33(8), 811-
817.
Nag R. (2007), Financial Education for Inclusive Development‘ Key note Address at
the CITI-FT Financial Education Summit, New Delhi, India, Managing Director
ADB.

198
Nash, D. R. (2012). Financial literacy: an Indian scenario. Asian Journal of Research
in Banking and Finance, 2(4), 79-84.
National Council of Applied Economic Research (NCAER) (2011), ‗How Households
Save & Invest‘,SEBI.
Nga, J. K., Yong, L. H., & Sellappan, R. D. (2010). A study of financial awareness
among youths. Young Consumers, 11(4), 277-290.
Noone, J. H. (2010). Psychological and socioeconomic factors influencing men and
women's planning for retirement: a thesis presented in partial fulfilment of the
requirements for the degree of Doctor of Philosophy in Psychology at Massey
University, Turitea, New Zealand (Doctoral dissertation, Massey University).
Nunnally, J. C., & Durham, R. L. (1975). Validity, reliability, and special problems of
measurement in evaluation research. Handbook of evaluation research, 1, 289-352.
Obago, S. O. (2014). Effect of financial literacy on management of personal finances
among employees of commercial Banks in Kenya (Doctoral dissertation).
Oehler, A., & Werner, C. (2008). Saving for retirement—a case for financial
education in Germany and UK? An economic perspective. Journal of Consumer
Policy, 31(3), 253-283.
Parrotta, J. L., & Johnson, P. J. (1998). The impact of financial attitudes and
knowledge on financial management and satisfaction of recently married
individuals. Journal of Financial Counseling and Planning, 9(2), 59.
Petkoska, J., & Earl, J. K. (2009). Understanding the influence of demographic and
psychological variables on retirement planning. Psychology and aging, 24(1), 245.
Pillai, K. R., Carlo, R., & D'souza, R. (2012). Financial prudence among
youth. Journal of Contemporary Management Research, 6(2), 52.
Raghani, V. & Singhi N.K. (1970), ― Adjustment Problems of Retirement‖, Indian
Journal of Gerontology, Vol. 2, Pp. 34-37.
Registrar General, I. (2011). Census of India 2011: provisional population totals-India
data sheet. Office of the Registrar General Census Commissioner, India. Indian
Census Bureau.
Rajna, A., Ezat, W. S., Al Junid, S., & Moshiri, H. (2011). Financial management
attitude and practice among the medical practitioners in public and private medical
service in Malaysia. International Journal of Business and Management, 6(8), 105.

199
Ramasawmy, D., Thapermall, S., Dowlut, S. A., & Ramen, M. (2013, February). A
study of the level of awareness of financial literacy among management
undergraduates. In Proceedings of 3rd Asia-Pacific Business Research
Conference (pp. 25-26).
Rani, R. (2014). Factors affecting investors decision making behavior in the stock
market: An analytical review. Indian Journal of Applied Research, 4(9), 118-120.
R.Mathivanan, K. Mohanranjani ( 2013),‖Existing gap between Financial Literacy
and the Saving . Investment behavior amongst Indian Women: An empirical study
with special reference to Coimbatore City‖,International Journal of Research in
Commerce, Economics & Management, Vol.3, Issue 04 (APRIL) ,Pp.20 -25
Rao, K. L. (2011). Analysis of Consumers perception towards mutual fund
schemes. Zenith International Journal of Multidisciplinary Research, 1(8), 175-192.
Sabhya R., Panwala M. ( 2012) ― Study on Factors affecting buying decision of Life
Insurance Policy(With special reference to Surat City of Gujarat in India)‖, GJAM
Vol.1 , Issue 3, Pp. 6-10.
Santhi N.S., K.Balanga Gurunathan (2011) ―An analysis of Investors‘ attitude towards
tax saving mutual funds in India‖, European journal of economics, Finance and
Administrative Science, Issue 41, ISSN 1450- 2275.
Seth, P., Patel, G., & Krishnan, K. K. (2010). Financial Literacy & Investment
Decisions of Indian Investors–A Case of Delhi & NCR. Birla Institute of
Management Technology.
Singhal. S, Jain. A, ― Reverse Mortgage- Growing Market in India‖,10th Global
Conference of Actuaries.
Saini Simran, Dr Anjum Bimal, Saini Ramandeep (2011) Investors‟ awareness and
perception about mutual funds, Journal of Banking Financial Services and Insurance
Research, Volume : 1, Issue : 1, page 92-107
Singh, Shyodhan, Dhillon, Paramjeet K.(2006).Understanding Adjustment of
Retirees. Help Age India – Research & Development Journal, 12(1),14-25.
Sitlani, M., Sharma, G., & Sitlani, B. (2011). Investment Choice of Occupants of
Financial Services Industry: A Demographic Study. IUP Journal of Behavioral
Finance, 8(1), 29.

200
Steiger, J. H., & Lind, J. C. (1980, May). Statistically based tests for the number of
common factors. In annual meeting of the Psychometric Society, Iowa City, IA (Vol.
758, pp. 424-453).
Stendardi, E. J., Graham, J. F., & O‘Reilly, M. (2006). The impact of gender on the
personal financial planning process: Should financial advisors tailor their process to
the gender of the client?. Humanomics, 22(4), 223-238.
Sundarajan, S.( 1997) Personal Financial Planning : An analysis of the Income Tax
Saving Devices commonly employed, Maharaja Sayajirao University, Baroda, 1997,
Management.
Taft, M. K., Hosein, Z. Z., Mehrizi, S. M. T., & Roshan, A. (2013). The relation
between financial literacy, financial wellbeing and financial concerns. International
Journal of Business and Management, 8(11), 63.
Vasagadekar, P. (2014). Investment awareness among Indian Working Women with
reference to Pune Region. International Journal of Scientific & Engineering Research
, 5 (6), 1334-1350.
Verma, M.(2008).Wealth management and behavioral finance: The effect of
demographics and personality on investment choice among Indian investors. The
ICFAI University Journal of Behavioral Finance 5 (4): 31-57.
VISA (2012). Visa‘s international financial literacy barometer, 2012. Downloaded
from http://www.practicalmoneyskills.com/resources/pdfs/FL_ Barometer_Final.pdf
on 25 August, 2013
Volpe, R. P., Chen, H., & Liu, S. (2006). An analysis of the importance of personal
finance topics and the level of knowledge possessed by working adults. Financial
services review, 15(1), 81.
Waliszewski, K. (2014). Personal financial planning in Poland against the background
of international experience. Nauki o Finansach, (21), 111-134.
Wang, L., Lu, W., & Malhotra, N. K. (2011). Demographics, attitude, personality and
credit card features correlate with credit card debt: A view from China. Journal of
economic psychology, 32(1), 179-193.
Widayat, W., Wahjoedi, W., & Idrus, M. S. I. (2011). MODELLING THE
BEHAVIOUR OF HOUSEHOLD‘S INVESTMENT. Economic Journal of Emerging
Markets, 3(2), 165-177.

201
Wheaton, B., Muthén, B., Alwin, D. F., & Summers, G. F. (1977). Assessing
reliability and stability in panel models. In D. R. Heise (Ed.), Sociological
methodology (pp. 84–136). San Francisco: Jossey-Bass
Williams, A. E. (2008). The Essentials of Financial Planning for College
Graduates. Senior Honors Papers, 54.
Yadav, B., & Tiwari, A. (2012). A study on factors affecting customers investment
towards life insurance policies. International Journal of Marketing, Financial
Services & Management Research, 1(7), 55-61.
Yoong, F. J., See, B. L., & Baronovich, D. L. (2012). Financial literacy key to
retirement planning in Malaysia. Journal of Management and Sustainability, 2(1), 75.
Yun Zhang; Li Xiuzhen ( 2010), "Investment Planning Factors and Risk Management
in Personal Financial Planning," International Conference on Management and
Service Science.
Zakaria, R. H., Jaafar, N. I. M., & Marican, S. (2012). Financial behavior and
financial position: A structural equation modelling approach. Middle-East Journal of
Scientific Research, 12(10), 1396-1402.
Books
Aggarwal, Y.P.(2008). Statistics of Education.( 2nd
Edition) Delhi: Sterling.
CPFA – NISM Handbook (2009).
Forgue, R. E., & Garman, E. T. (1988). Personal Finance. Houghton Mifflin.
Gitman Lawrence J. and Michael D. Johenk. Fundamentals of Investing, Fourth
Edition, Harper and Row Publishers, New York, 1990.
Hallman, G.V., & Rosenbloom, J.S. (1987). Personal Financial Planning (4th ed.).
New York: McGraw Hill Book Company
Kapoor, J. R., Dlabay, L. R., & Hughes, R. J. (2009). Personal finance. Boston, MA:
McGraw-Hill Irwin.
Kothari, C. R. (2004). Research methodology: Methods and techniques. New Age
International.
Kumar, R. (2014). Research methodology: A step-by-step guide for beginners. Sage.
Malhotra and Dash (2009), ―Marketing Research – An Applied Orientation‖, 5th
Edition, Pearson Education Inc.

202
Nunnally, J.C. (1978), ―Psychometric Theory‖, 2nd ed., McGraw-Hill Book
Company, New York, NY.
Parahoo K (2006) Nursing Research: Principles, Process and Issues. 2nd edn.
Palgrave Macmillan, Houndmills Basingstoke
Websites
https://nse-india.com/content/ncfm/Revised_workbook_SMBM.pdf
https://www.indiapost.gov.in/Financial/Pages/.../Post-Office-Saving-Schemes.aspx
http://www.fpsbindia.org/Scripts/FinancialPlanning
https://www.valueresearchonline.com/funds/
http://investor.sebi.gov.in/sebiweb/investors/financial_literacy.jsp
https://www.rbi.org.in/scripts/FS_Overview.aspx?fn=2754
http://indiabudget.nic.in/es2012-13/estat1.pdf. Retrieved December 13, 2013
http://mospi.nic.in/central-statistics-office-cso-0

203
APPENDIX A
Copy of Questionnaire
Dear Respondent, you are requested to participate in research study on Personal Financial Planning.
Your responses and views are very important for the success of the study. Please note that all data
provided by you will be used for academic purpose only and shall not be divulged to anyone else.
Section A:
Kindly select appropriate answer:
1. Suppose you had Rs. 1000 in saving Bank account and interest rate was 2% per year, after 5
years how much do you think you would have earn in saving account, if you have left your
money to grow:
More than Rs. 1020 Exact Rs. 1020 Less than Rs. 1020 Don’t Know
2. Imagine that interest rate on your saving bank account was 1% per year and inflation was 2%
per year. After 1 year would you be able to buy
More than today Less than today exactly the same Don’t Know
3. Assume a friend inherits Rs. 10000 today and his sibling inherits Rs. 10000, 3 years from
now. Who is richer because of inheritance?
Friend His sibling they are equally rich Don’t Know
4. Buying a single company stock usually provide safer return than a stock mutual fund.
True False Don’t Know
5. Financial Planning is all about buying enough insurance.
True False Don’t Know
6. Any investment opportunity which claims higher returns usually carries lower risk.
True False Don’t Know
7. If interest rate falls what will happen to price of the bond?
Rise Fall Not Change Don’t Know

204
8. Considering the long term tenure (10 to 20 Years), which assets normally gives the highest
return?
Saving Account Stocks Bonds Don’t Know
Sec B : Several investment avenues are listed below, select appropriate column according to level
of awareness where : 1= Unaware , 2= Moderately aware , 3= Completely Aware
Sr. No
Particulars 1 2 3
1 Saving Account
2 Bank FD 3 Equity Shares
4 Govt. Bonds / Debentures/ NCDs
5 Derivatives ( Futures and Options Markets) / Commodity Market/ Currency Market
6 Mutual Funds 7 PPF
8 Other Post Office Products ( NSC, MIP )
9 Life Insurance
10 Money Market ( Call, T Bill, Liquid Funds)
11 Tax Saving Schemes 12 Real Estate
13 Non Conventional Avenues (precious Coins, Paintings etc.)
Section C:
Kindly rate your opinion for the following statements:
Where 1 -Strongly Disagree , 2 – Disagree, 3 –Neither Agree or Disagree , 4 – Agree, 5 – Strongly
Agree
Sr. No
Particulars 1 2 3 4 5
1 Budgeting and keeping financial records are very essential
2 I should save more before spending the balance.
3 I spend my money very carefully
4 I payoff the full credit card outstanding amount every month
5 I spend more when I use a credit card

205
6 Insurance is a forced saving to ensure that family gets continue stream of flow of income to your family in event of death or accident
7 I have an adequate insurance to ensure that if I were to passes away or become sick or disabled, my family and I will not suffer financially.
8 I have Life Insurance but no other type of insurance i.e Health, Personal accident, Property etc.
9 I do not have any Insurance
10 I consult an insurance agent for purchase of an insurance
11 I take advise of my family, friends before investing into insurance
12 I consider the coverage offered by insurance company before purchasing it.
13 I often feel difficulty for purchasing financial products
14 Long term savings with a regular saving pattern is important
15 Investing is becoming important nowadays
16 Investment is commitment of funds to achieve long term goals or objectives
17 I understand my risk profile- high risk taker, medium risk taker, or low risk taker
18 I invest in different investment instruments i.e shares, mutual fund, real estate, bonds with minimal knowledge and research on it.
19 If I were given an amount of equal to six month salary to invest, I would know exactly what to do with it.
20 I know how taxes would be applied on my different investments avenues
21 I utilize the various tax rebates that I’m entitled to when filing my tax returns.
22 I know the amount I need to fund a comfortable retirement.
23 I have started planning for my retirement.
24 Retirement planning should be started at early working age
25 My Retirement plan provides for inflation and standard of living changes that will occur over a period of time
26 I have a will
27 I understand what a trust is.
28 I know what income my family would receive from proceeds of my estate
29 Estate planning is important to me. 30 I am aware about overall financial planning: i.e
Money Management, Investments, Insurance,

206
Retirement planning, estate planning, tax planning
31 I feel that my financial plan is well balanced, keeping into the mind all aspects: Money Management, Investments, Insurance, Retirement planning, estate planning, tax planning
32 I set financial goals and objectives in my life. 33 I gather relevant data and analyze my current
financial position before I make financial decision.
34 I freely discuss with others ,regarding financial planning
35 I need expert for planning my finances.
36 I am actively involved in managing my Financial Plan, I review my plan periodically after the implementation.
37 I need to keep cash reserve in case of an emergency
38
My willingness to take risk is factor I consider before planning my finances.
39 I try to take information from all authenticated sources and then invest my money.
40 I get influenced by my friends and relatives while taking financial decisions.
41 I look at Economic factors such as prevailing inflation and interest rates for financial planning.
42 I look for Service provided by the company before investing into that.
43 My decisions on planning also depend upon knowledge of the representative of the particular company.
44 I consider Future Responsibilities- Like purchasing home, child’s education, marriage etc
45 Expected Return on investment products is important to me.
46 I consider Tax benefits linked with the products
47 I look for Liquidity provided by the products 48 I consider stage of my life cycle before taking any
financial decisions.
49 Regular Cash flow for managing my routine expenses is important factor to me.
50 Objective behind my planning is to minimize inconvenience to my family members in case of my death.

207
Section D: Demographic Profile
Age in Years: 20-35 36-58 59 and above
Gender: Male Female
Education: High School Graduation Post Graduation
Others______
Job Type: Public Sector Private Sector Government
Work Experience:
Less than 5 years 5 years to 15 years 16 years to 25 years 25 years and
above
Income per annum: Less than 5 Lacs 5 Lacs to 10 Lacs 10 Lac to 15 Lacs
15 Lacs and above t
Marital Status: Married Unmarried widow/widower Divorcee
Location: Ahmedabad Baroda Rajkot Surat
How much percent of your income you save regularly: Less than 10% 10 % to 30%
30% and above
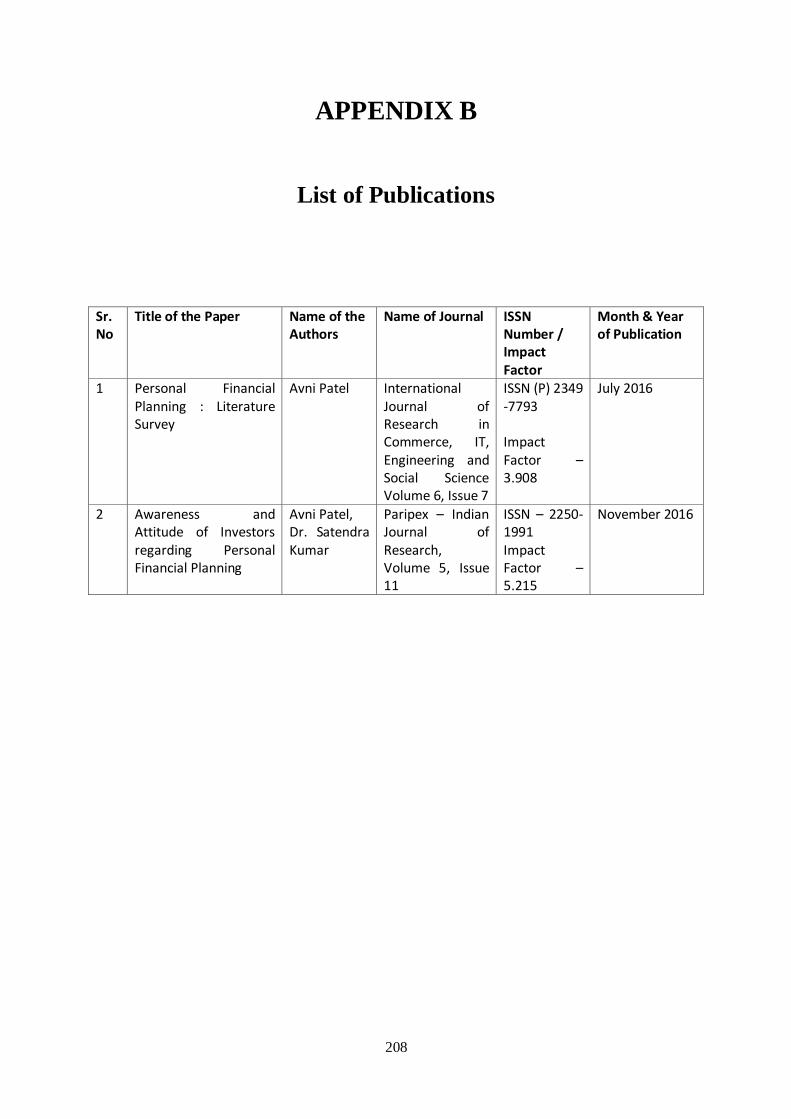
208
APPENDIX B
List of Publications
Sr. No
Title of the Paper Name of the Authors
Name of Journal ISSN Number / Impact Factor
Month & Year of Publication
1 Personal Financial Planning : Literature Survey
Avni Patel International Journal of Research in Commerce, IT, Engineering and Social Science Volume 6, Issue 7
ISSN (P) 2349 -7793 Impact Factor – 3.908
July 2016
2 Awareness and Attitude of Investors regarding Personal Financial Planning
Avni Patel, Dr. Satendra Kumar
Paripex – Indian Journal of Research, Volume 5, Issue 11
ISSN – 2250-1991 Impact Factor – 5.215
November 2016