a study of bird and bat collision fatalities at the
TRANSCRIPT

A Study of Bird and Bat Collision Fatalities at the Mountaineer Wind Energy Center, Tucker County, West Virginia: Annual Report for 2003 February 14, 2004 Prepared for: FPL Energy and Mountaineer Wind Energy Center Technical Review Committee Prepared by: Curry & Kerlinger, LLC Jessica Kerns, M.S. and Paul Kerlinger, Ph.D. Center for Environmental Science Curry & Kerlinger, LLC Appalachian Laboratory, UMCES P.O. Box 453 Frostburg, MD 21532 Cape May Point, NJ 08212 301-689-7178 609-884-2842, fax 884-4569 [email protected] [email protected]

2003 Mountaineer WEC Annual Rpt. – Avian and Bat Fatalities 2
TABLE OF CONTENTS Executive Summary……………………………………………………………………….5 Acknowledgements…………..……………………………………………………………6 Introduction………………………………………………………………………………..7 Methods……………………………………………………………………………………8
Study Area….……………..………………...…………………………….8 Field Methods….……………….……………………………..…….……..8
Estimation of Avian and Bat Fatalities at the MWEC…..…….…………..9 Searcher Efficiency Study…….……..….………………….….…………..9 Carcass Removal Study………………….…………………….…………10 Technical Review Committee (TRC)………….…………………………11
Results…………………………………………………………………..………………11 Summary of Search Effort……..….………………..…….…...…………11
Avian Fatalities Summary of Fatalities of Birds…………………………………….…….12
Event of May 23, 2003…………………………………………..………12 Detection Probability and Carcass Removal Rate………………..……...13
Estimates of Total Avian Fatalities………………………………………13 Location of Carcasses……………………………………………………14 FAA Lighting and Avian Fatalities………………………………………14 Bat Fatalities Summary of Fatalities of Bats……….…………………………….……..15 Estimate of Total Bat Fatalities………………………………………..…15 Location of Carcasses………………………………………………..…..15
Arrival and Departure Dates of Bat Species at the MWEC……………....16 Weather Conditions during Fall Migration……………………………….16
FAA Lighting and Bat Fatalities……………………………………..…..17
Discussion………………………………………………………………………….…….18 2003 MWEC Avian and Bat Fatalities……….…………………………..18
Carcass Removal and Searcher Efficiency…..……………………………18 Search Effort – Frequency and Seasonal Timing of Searches……………19
Weather Conditions and Bat Fatalities during Fall Migration…….………19 FAA Lighting and Avian/Bat Fatalities…………………………….…….20 Presentation of Results at a Scientific Meeting……………………..…….20
Literature Cited…………………………………………………………………………..21
Curry & Kerlinger, LLC –2-14-04

2003 Mountaineer WEC Annual Rpt. – Avian and Bat Fatalities 3
LIST OF TABLES Table 1. Summary of rounds of fatality searches by month during 2003……………….23 Table 2. Bird carcasses found at the Mountaineer Wind Energy Center, Tucker
County, West Virginia…………………………………………………………...24 Table 3. Avian and bat mortality estimates at the Mountaineer Wind Energy Center in 2003…………………………………………………………………………...25 Table 4. Number and percentage of nocturnal migrant bird carcasses in each of 8
cardinal directions from the turbine tower base found during the May fatality event and at other times………………………………………………………….26
Table 5. Summary of bat fatalities by species during 2003 at the Mountaineer
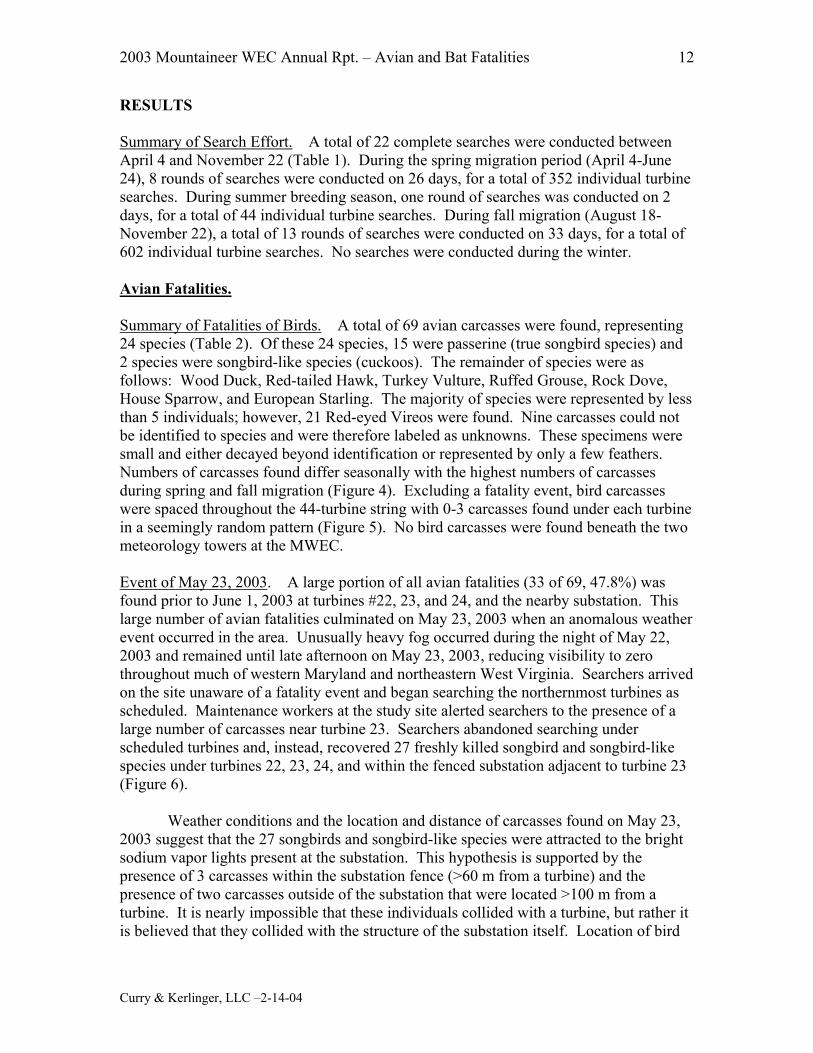
Wind Energy Facility, Tucker County, West Virginia…………………………..27 Table 6. Number and percentage of the 475 bats killed at the Mountaineer Wind Energy
Center during 2003 in each of 8 cardinal directions from the turbine tower base………………………………………………………………………..28 Table 7. Dates of the first and last recorded carcass by species found at the
Mountaineer Wind Energy Center in spring and fall 2003...…………………….29 Table 8. Wind direction, wind speed, temperature, and inclement weather conditions for mornings in which fresh bats were found during fall migration at the
MWEC…………………………………………………………………….....…..30
Curry & Kerlinger, LLC –2-14-04

2003 Mountaineer WEC Annual Rpt. – Avian and Bat Fatalities 4
LIST OF FIGURES Figure 1. Location of turbine area for the Mountaineer Wind Energy Center,
Tucker County, WV, on Backbone Mountain……………………………...……31 Figure 2. Data sheet used to record data collected for each field day at the
Mountaineer Wind Energy Center, Tucker County, WV…………………..……32 Figure 3. Data sheet used to record bird and bat fatality information for each
carcass found at the Mountaineer Wind Energy Center, Tucker County, West Virginia…………………………………………………………………………..33
Figure 4. Number of (a) bird and (b) bat carcasses found per two-week interval………34 Figure 5. Number of bird carcasses found per turbine and substation…………………..35 Figure 6. Location of turbines and substation involved in the May event………………36 Figure 7. Distances of (a) nocturnal migrant songbirds and (b) bat carcasses from the turbine base (in meters)…………………………..………………………………37 Figure 8. Number of bat carcasses found per turbine and substation…………………...38 Figure 9. Average distance (+ SE) of bat species from the base of the turbine…………39
Curry & Kerlinger, LLC –2-14-04

2003 Mountaineer WEC Annual Rpt. – Avian and Bat Fatalities 5
EXECUTIVE SUMMARY
A post-construction bird and bat collision fatality study was conducted between April 4 and November 11, 2003, at the Mountaineer Wind Energy Center (MWEC), Tucker County, West Virginia. Searches were conducted at the 44 turbines and 2 meteorology towers (1 guyed, 1 freestanding). Twenty-two rounds of surveys (8 in spring [26 days], 1 in summer [2 days], and 13 in fall [33 days]) were conducted at all turbines, amounting to 954 individual turbine searches. Turbines were searched for approximately 30 minutes each, to 60 m from the turbine base using a concentric circle-searching pattern. Two days (or more partial days) were required to search all turbines and the two meteorology towers at the Mountaineer Wind Energy Center. A carcass removal and searcher efficiency study was conducted in October.
A total of 69 avian carcasses representing 24 known species were found beneath turbines and at an electrical substation adjacent to turbine number 23. The majority of the carcasses (17 of 24 species, 70.8%) were nocturnal migrant songbirds or songbird-like species. The remainder of the carcasses were represented by 8 individuals and included larger species (Red-tailed Hawk, Turkey Vulture, Wood Duck, and Ruffed Grouse), as well as 3 species not protected by the Migratory Bird Treaty Act. Nine carcasses were not identifiable to species. Most species were represented by 1-5 individuals, although 21 Red-eyed Vireos were found (30.4% of 69). The majority of the carcasses were found during the spring and fall searches; only one bird carcass was found during summer searches. No searches were conducted during the winter.
Of the 69 total fatalities, 33 (47.8%) were found on May 23, 2003 at turbines
number 22, 23, and 24, as well as the substation. This multiple fatality event was determined to have been caused by the combination of heavy fog and the presence of several sodium vapor lights at a substation located near turbine 23. Attraction by this type of lights has been reported repeatedly from sites in West Virginia and elsewhere. No multiple avian fatality events occurred at the site after the sodium vapor lights were extinguished.
Estimates of total avian fatalities were calculated excluding the fatalities from the May event. Mean carcass removal rate was 6.7 days and the detection probability for carcasses was 0.276. The estimated total number of fatalities for all types of birds at the MWEC during the search period was 178 birds (4.04 birds/turbine) + 33 birds found on May 23, 2003, with nocturnal migrant songbirds accounting for a majority of this estimate. This estimate is greater than the reported average of 2 birds/turbine/year at most wind energy facilities, but lower than the mortality estimate reported at another eastern US wind energy facility (Buffalo Mountain, TN).
A total of 475 bat carcasses representing 7 species were detected, mostly between
August 18 and September 30 (92.5%). Red bats were most numerous, accounting for 42.1% of all carcasses found, with hoary (18.5%), eastern pipistrelle (18.3%), little brown (12.6%), silver-haired (5.9%), northern long-eared (1.3%), big brown (0.4%), and unidentified (0.8%) bats accounting for the remainder.
Curry & Kerlinger, LLC –2-14-04

2003 Mountaineer WEC Annual Rpt. – Avian and Bat Fatalities 6
Estimates of total bat fatalities were calculated in a similar fashion to avian estimates. The estimated total number of bats killed at the site during the study period was 2092 bats (47.53 bats/turbine). Strict interpretation of these estimates is tentative, as the rates of detection and scavenging for bat carcasses may not be the same as rates for bird carcasses. The unique coloration of bats and their location closer to the turbine base may increase their likelihood of detection by searchers. Based on the observed patterns of decomposition and decay of carcasses at this study site, we believe that bats are not scavenged as quickly as birds.
Correlations between weather during fall migration and freshly killed bat fatalities
reveal no strong relation between wind speed, wind direction, temperature, or fog/precipitation at the site and bat fatalities. Increases in bat fatalities did not occur during inclement weather conditions. The highest numbers of freshly killed carcasses were found during periods of calm winds, high temperatures, and no precipitation.
No difference in numbers of birds or bat fatalities was found at lit versus unlit
turbines. This suggests that FAA lighting (L-864 red strobes) did not attract nocturnal migrants, unlike the lighting on communication towers (which include steady burning red, L-810 lights). Conversely, the multiple-fatality event on May 23, 2003 suggests that sodium vapor lighting attracts nocturnal migrants and should never be used at or near wind power facilities or other structures where collisions could result. The location of these lights and their use should be considered before beginning operation of wind power facilities.
We recommend that searches at wind facilities in the eastern United States be
conducted on a weekly basis, particularly during avian migration. The larger numbers of bat fatalities at the MWEC suggest that searches should be conducted weekly during fall bat migration, commencing in mid-July. Ideally, daily searches of all turbines or a random subset of turbines during fall migration should be conducted to examine correlations between weather conditions and bat fatalities. Searches should be increased adaptively when searchers suspect large numbers of migrant bats are moving through the study site. This will increase the likelihood of recovering bats on the ground that were not killed after colliding with the turbines, thus decreasing the number of available carcasses. Additionally, we suggest that carcass removal and searcher efficiency studies using birds and bats be conducted several times during spring, summer, and fall to increase sample size and allow for seasonal comparisons.
Acknowledgements. We wish to thank Wallace Erickson (Western EcoSystems Technology, Inc.) and Peter Shoenfeld (West Virginia Highlands Conservancy) for conducting independent calculations of numbers of fatalities based on carcass removal and searcher efficiency. Their input was invaluable. Keith Lott participated in all aspects of carcass searches. Jim Webb, FPL Plant Manger, and FPL and NEG-Micon workers provided logistical assistance during the 2003 field season, including reporting of the May fatality event and initial summer bat fatalities.
Curry & Kerlinger, LLC –2-14-04

2003 Mountaineer WEC Annual Rpt. – Avian and Bat Fatalities 7
INTRODUCTION Since the late 1980s and early 1990s, environmentalists and wildlife agencies have raised concern over bird and bat fatalities at wind power facilities. Post-construction studies have now been completed at more than 15 different wind power plants in the United States (Erickson et al. 2001) and a similar number of sites in Europe.
Concern regarding bird fatalities at the Mountaineer Wind Energy Center (MWEC) was voiced by various environmental organizations and wildlife agencies as part of the West Virginia Public Service Commission permitting process for that project. An avian risk assessment and diurnal migration study for the MWEC, conducted by Kerlinger (2000a, 2000b) prior to permitting, suggested that risk to birds was not likely to be biologically significant. This conclusion was based upon the absence of literature that indicated that the site experienced a large concentration of migrants and that wind turbines rarely impact large numbers of birds at a particular site. Additionally, the diurnal study of migration did not reveal that Backbone Mountain was a major migration corridor for hawks or songbirds (Kerlinger 2000a, 2000b).
This report details a post-construction study of avian and bat collision fatalities
conducted in 2003 at the Mountaineer Wind Energy Center, Tucker County, WV. The objective of the study was to determine the magnitude, species composition, and other details regarding fatalities of bats and birds at the 44 wind turbines and 2 meteorology towers that were erected in 2002 along the top of Backbone Mountain.
Curry & Kerlinger, LLC –2-14-04

2003 Mountaineer WEC Annual Rpt. – Avian and Bat Fatalities 8
METHODS Study Area. The MWEC consists of 44 wind turbines and 2 meteorology towers in Tucker County, near Thomas, West Virginia (Figure 1). The turbines occupy the ridge top of Backbone Mountain from just south of the Maryland border to a site 8 km to the south where Route 219 traverses Backbone Mountain. Each turbine is approximately 116 m in height and the two meteorology towers (1 guyed and 1 free-standing) are approximately 50 m in height. Twelve of the turbines are lit with L-864 red strobes at the top of nacelle. One of two meteorology towers is lit. The turbines are located in clearings within the forest along the spine of the Backbone Mountain ridge. Gravel roads connect the turbines, making access relatively easy. Field Methods. Twenty-two complete rounds of searches of all 44 turbines and 2 meteorology towers were conducted during 2003. Twenty rounds were planned for the 2003 study; however, rounds of searches were increased during fall migration to insure complete coverage when bat mortality was high. Searchers were scheduled to examine 11 turbines per day per researcher, facilitating all turbines being searched in two days. Searches were conducted when weather and other conditions permitted. Searches were abandoned when heavy rain and lightning created unsafe conditions on the ridge, a condition that occurred frequently during spring 2003. Those turbines not searched on days of inclement weather were searched on the first weather-permitting day following inclement weather. On occasion, maintenance work at a turbine precluded conducting searches such that those turbines were searched after maintenance work was completed. Two meteorology towers were searched following similar protocol as used for the turbine searches. Area beneath the meteorology towers was searched to guy wire termination or to 40 m for the unguyed tower.
Searches commenced at or slightly after sunrise. The time required to search individual turbines was approximately 30 minutes. Each turbine was searched via slow walking of concentric circles outwards from the base of the turbine. Concentric rings were located at 15 m intervals and turbines were searched to a distance of 60 m from the base of the towers. Variation in search pattern was often necessary due to rough terrain beneath the turbines. Dense forest, brush piles, downed trees, large rocks, and extreme slopes made it difficult to traverse under some turbines, though efforts were made to search these areas with equal intensity.
Data were recorded on 2 data sheets. Daily search information, including weather, date, turbines searched, and weather on the previous night, was recorded on a Daily Data sheet (Figure 2). Carcass information was recorded on the Carcass Data sheet (Figure 3). For each carcass, the following information was recorded: species (when able to be determined), date/time, observer name, identification number, turbine number, distance from turbine (m), cardinal direction from turbine, and condition of the carcass (scavenged, entire, partial, duration of time on ground, etc.). Each carcass was collected and individually placed in a plastic, zip-lock bag. Bird carcasses were taken to freezers at the Center for Environmental Science, Appalachian Laboratory, Frostburg, MD. Bat carcasses were taken to the West Virginia Department of Natural Resources either
Curry & Kerlinger, LLC –2-14-04

2003 Mountaineer WEC Annual Rpt. – Avian and Bat Fatalities 9
immediately following collection or after temporary storage with bird carcasses. Bat carcasses were examined and identified to species by Craig Stihler, West Virginia Department of Natural Resources. Several carcasses were sent for DNA analysis to determine if any were endangered Indiana bats. No bat carcasses found at the Mountaineer Wind Energy Center were identified as an Indiana bat. Estimation of Avian and Bat Fatalities at the MWEC. Mortality estimates were calculated for (1) all birds found at the MWEC, excluding the May event, (2) all birds, excluding species not protected by the Migratory Bird Treaty Act and the May event, (3) nocturnal migrants, excluding the May event and unknowns, and (4) bats. The estimations of avian and bat fatalities at the MWEC were calculated using the actual number of carcasses found during carcass searches, the detection probability defined as the estimated proportion of detectable carcasses found by observers during a single search, the mean carcass removal rate expressed as the number of days that a carcass remains under the turbine before being removed from the study area by scavengers, and the seasonal interval between searches in days. Birds killed during the event on May 23, 2003 were added to the estimated total number of birds killed after calculations.
To calculate the total number of fatalities at the Mountaineer Wind Energy Center for the period of time in which searches were conducted (spring, summer, fall), we used the estimator proposed in Shoenfeld (2004), which gives equivalent results to the estimator provided in Erickson et al. (2003), but it is in a simpler form. The point estimates for the fatality rates were calculated for each season by the formula:
−+−
=
11
***
/
/
tI
tI
epe
ptkCNm ,
where N is equal to the total number of turbines, C is the total number of carcasses detected for the period of study, I is the interval between searches (in days), t is the mean carcass removal time (in days), p is the detection probability, and k is the number of turbines sampled. This formula assumes correctness of the estimates for t and p, i.e., sampling error in those estimates is not considered. Fatality estimates for the entire period of study (April 4 through November 22) were calculated by summing the seasonal estimates. Standard errors and associated confidence intervals were calculated by parametric bootstrapping (Manly 1997). This method does account for sampling error in estimation of t and p.
Searcher Efficiency Study. The objective of a searcher efficiency study is to estimate the proportion of carcasses that a searcher is able to find from the total number of carcasses that may be present beneath a turbine. A detection probability was calculated to estimate the total numbers of birds killed by the wind turbines when corrected for detection bias.
A total of 30 avian carcasses were used in the carcass removal and efficiency
study. Fifteen avian carcasses were placed randomly beneath the wind turbines on the evening of September 31, 2003. The remaining 15 carcasses were placed randomly on
Curry & Kerlinger, LLC –2-14-04

2003 Mountaineer WEC Annual Rpt. – Avian and Bat Fatalities 10
the evening of October 1, 2003. A variety of road and window-killed, as well as turbine-killed birds were used. Most carcasses were songbirds (Magnolia Warbler, American Redstart, Red-eyed Vireo, Northern Waterthrush, Blackpoll Warbler, Wood Thrush, Tree Swallow, etc.) or other small-medium birds (Virginia Rail, Clapper Rail, American Woodcock, Northern Saw-whet Owl). The species composition of these birds corresponds with species that migrate in the eastern United States and that are known to collide with communication towers (Shire et al. 2000). The numbers of carcasses placed at the turbines ranged from 0 to 2 in an attempt to simulate what had been found during the previous months. Direction and distance of placement were randomly determined for each carcass prior to the carcass removal study. Carcasses were tossed behind the back of the tester at each of these locations and were left in the position in which they landed – an attempt to simulate carcass condition following collision with a wind turbine. Test birds were discreetly marked with dental floss through the nares so that they could be identified as test birds upon recovery. Searchers were not told that they were being tested; however, searchers were aware of the test once the first test bird was recovered. The direction and distance of each test bird found was found. Test birds were not removed from the study site and remained in place for the carcass removal study.
Detection probability (p) was defined as the estimated proportion of detectable
carcasses (n = 29) found by observers. This probability was not estimated by size of bird carcass due to small sample size. No bat carcasses were used in the searcher efficiency study.
Carcass Removal Study. The objective of a carcass removal study is to determine the average length of time that an avian carcass remains under the turbine before being removed from the study area by scavengers. A carcass removal rate was used to adjust for removal bias when estimating the total number of carcasses present.
Carcasses used in the searcher efficiency study were also used in the carcass
removal study. Randomly placed carcasses were comprised of the species as listed under the section on searcher efficiency. Carcasses were checked 1, 2, 3, and 4 days after they were placed out, and then were checked weekly for the remainder of the season or until the carcass was removed or decomposed. Presence/absence for each carcass was recorded as well as body condition (lightly scavenged, heavily scavenged, etc).
The length of time that a carcass remained in the study area (ti) was calculated for
each experimental carcass. Mean carcass removal time (t) was calculated by summing ti for each carcass and dividing the sum by n = 30. Large and small birds were not differentiated in calculating the carcass removal rate. No bat carcasses were used in the carcass removal study. Technical Review Committee (TRC). A TRC, consisting of stakeholders from industry, environmental organizations, academia, and government agencies was established in early 2003 to provide transparency and a degree of oversight for the post-construction study described in this report. The technical review committee was established as part of the conditions set forth by the West Virginia Public Service Committee’s granting of a
Curry & Kerlinger, LLC –2-14-04

2003 Mountaineer WEC Annual Rpt. – Avian and Bat Fatalities 11
Certificate of Necessity and Convenience to the Mountaineer project developer, Atlantic Renewable Energy Corporation. During 2003, several conference calls were conducted involving all or a portion of the TRC. During those calls, the committee was apprised of research efforts and progress, problems encountered, news of fatality events, transparency of the process, and other matters relevant to the process. In addition, members of the TRC contacted the research team on many occasions via email and phone to ask questions about the research or other aspects of the process.
Members of the TRC included the following individuals. An asterisk indicates that the individual was not an official member of the TRC, but had an interest or a technical role in conducting or evaluating the research. (Dr. J. Buckelew, Bethany College, WV, was a member of the committee until March 2003, when he withdrew.)
Greg Eddy, Brooks Bird Club Sam Enfield, Atlantic Renewable Energy Corporation Jim Lindsay, FPL Energy Wayne Perdue, WV Public Service Commission Peter Shoenfeld*, WV Highlands Conservancy Linda Smith, US Fish and Wildlife Service Craig Stihler*, WV DNR Rob Tallman, WV DNR Frank Young, WV Highlands Conservancy
Curry & Kerlinger, LLC –2-14-04
2003 Mountaineer WEC Annual Rpt. – Avian and Bat Fatalities 12
RESULTS Summary of Search Effort. A total of 22 complete searches were conducted between April 4 and November 22 (Table 1). During the spring migration period (April 4-June 24), 8 rounds of searches were conducted on 26 days, for a total of 352 individual turbine searches. During summer breeding season, one round of searches was conducted on 2 days, for a total of 44 individual turbine searches. During fall migration (August 18-November 22), a total of 13 rounds of searches were conducted on 33 days, for a total of 602 individual turbine searches. No searches were conducted during the winter. Avian Fatalities. Summary of Fatalities of Birds. A total of 69 avian carcasses were found, representing 24 species (Table 2). Of these 24 species, 15 were passerine (true songbird species) and 2 species were songbird-like species (cuckoos). The remainder of species were as follows: Wood Duck, Red-tailed Hawk, Turkey Vulture, Ruffed Grouse, Rock Dove, House Sparrow, and European Starling. The majority of species were represented by less than 5 individuals; however, 21 Red-eyed Vireos were found. Nine carcasses could not be identified to species and were therefore labeled as unknowns. These specimens were small and either decayed beyond identification or represented by only a few feathers. Numbers of carcasses found differ seasonally with the highest numbers of carcasses during spring and fall migration (Figure 4). Excluding a fatality event, bird carcasses were spaced throughout the 44-turbine string with 0-3 carcasses found under each turbine in a seemingly random pattern (Figure 5). No bird carcasses were found beneath the two meteorology towers at the MWEC. Event of May 23, 2003. A large portion of all avian fatalities (33 of 69, 47.8%) was found prior to June 1, 2003 at turbines #22, 23, and 24, and the nearby substation. This large number of avian fatalities culminated on May 23, 2003 when an anomalous weather event occurred in the area. Unusually heavy fog occurred during the night of May 22, 2003 and remained until late afternoon on May 23, 2003, reducing visibility to zero throughout much of western Maryland and northeastern West Virginia. Searchers arrived on the site unaware of a fatality event and began searching the northernmost turbines as scheduled. Maintenance workers at the study site alerted searchers to the presence of a large number of carcasses near turbine 23. Searchers abandoned searching under scheduled turbines and, instead, recovered 27 freshly killed songbird and songbird-like species under turbines 22, 23, 24, and within the fenced substation adjacent to turbine 23 (Figure 6).
Weather conditions and the location and distance of carcasses found on May 23, 2003 suggest that the 27 songbirds and songbird-like species were attracted to the bright sodium vapor lights present at the substation. This hypothesis is supported by the presence of 3 carcasses within the substation fence (>60 m from a turbine) and the presence of two carcasses outside of the substation that were located >100 m from a turbine. It is nearly impossible that these individuals collided with a turbine, but rather it is believed that they collided with the structure of the substation itself. Location of bird
Curry & Kerlinger, LLC –2-14-04

2003 Mountaineer WEC Annual Rpt. – Avian and Bat Fatalities 13
carcasses caused searchers to be suspicious of the role of the sodium vapor lights in the death of the songbirds on May 23, 2003 and provisions were made to extinguish these lights at night. After the lights were turned off on May 24, 2003, no further events occurred at the substation or adjacent turbines.
Analysis of the data collected before May 23, 2003, revealed three carcasses
found at turbines 22 and 23 on May 17 and 18, 2003 and one carcass found by a maintenance worker within the substation fence on May 19, 2003. Following the event on May 23, 2003, two badly decomposed carcasses were recovered at turbine 23 on June 1, 2003. It is believed that these carcasses were missed during the search on May 23, 2003 and were likely to have been part of the group killed during that event. The inclusion of these individuals to the group killed on May 23, 2003 brings the total number of carcasses killed at those turbines while the sodium vapor lights were illuminated to 33.
We believe this event to be an anomaly in the annual data and therefore these
carcasses are not included in the annual estimates of avian mortality. Carcass removal rate for this event would be different than the rate reported for the site as a whole. Additionally, detection probability would be much higher during the event, as searchers spent > 6 hours at turbines 22, 23, 24, and the substation on May 23, 2003. These differences between the May event and the rest of the site would tend to overestimate the number of birds killed at the site using the mortality estimator. Therefore, the actual number of carcasses found during the May event was added to the estimate for avian mortality after calculations were completed. Detection Probability and Carcass Removal Rate. Thirty carcasses were placed for searcher efficiency and carcass removal study. A scavenger removed one carcass on the night of October 1, 2003. Therefore, the total number of carcasses available for detection was 29.
Searchers detected eight carcasses on October 1 and 2, 2003. The detection probability (p) was 0.276. Mean carcass removal time (t) at the study site was 6.7 + 1.212 SE (90% CI = 4.858, 8.751). Potential scavengers at the site included raptors, turkey vultures, common ravens, coyotes, black bears, bobcats, rodents, and insects. A high proportion of bird carcasses were not removed from the site, but exhibited scavenging by rodents. During August and September, the main scavengers of bats were insects.
Estimates of Total Avian Fatalities. Seasonal estimates of total avian fatalities were calculated for each season that searches were conducted. Seasonal point estimates, standard errors, and 90% confidence intervals are reported in Table 3. The total number of avian fatalities at the study site excluding the May event was estimated to be 178 birds (4.04 birds/turbine) during the search period. When adding the May event, we arrive at an estimate of 211 birds killed at the site (178 estimated avian fatalities + 33 actual fatalities during the May event). This may be a slight overestimation of the total number of avian fatalities at the site due to the inclusion of large bird species and species not protected by the Migratory Bird Treaty Act (MBTA). Larger birds have a higher
Curry & Kerlinger, LLC –2-14-04

2003 Mountaineer WEC Annual Rpt. – Avian and Bat Fatalities 14
detection rate among searchers (Morrison 2002) and maintenance workers at the site. Also, these larger individuals are less likely to be entirely removed from the site by scavengers (Morrison 2002). The estimate generated for the search period when we exclude birds not protected by the MBTA was 160 birds (3.63 birds/turbine; Table 3), and the estimate would be still lower if lower detection and scavenging rates had been found for larger birds.
Several of the fatalities found at the study site were species not protected by the
Migratory Bird Treaty Act (n = 3) and larger bird species (n = 5). To determine the effects of wind turbine collisions specifically on nocturnal migrating songbirds at this site, we calculated the estimated number of nocturnal migrant fatalities using the number of songbird carcasses found, excluding the May event and unknowns (Table 3). The estimated total number of nocturnal migrants killed at the Mountaineer Wind Energy Center during search periods in 2003 was 101 migrants (2.9 migrants/turbine). Location of Carcasses. Small nocturnal migrants (songbirds and songbird-like species) were analyzed to determine direction and distance from turbines. Those birds found during the May event were analyzed separately from the birds not found during the May event. Few large birds were found during the study and were therefore excluded from direction/distance analyses. Unknown carcasses were also not included in these analyses.
Twenty-two nocturnal migrants were found that were not associated with the May event. Those individuals averaged 20.8 m + 11.1 m SD from the turbine bases with the majority of carcasses located between 16–30 m (Figure 7). The direction of these 22 nocturnal migrants was predominantly to the east with 64% of individuals (14 of 23) being found in easterly directions (SE, E, and NE; Table 4). Only 5 of the 22 carcasses were found in a westerly direction (SW, W, and NW).
Twenty-three carcasses of nocturnal migrants were recovered during the May
event. Those individuals found at the substation were not included in these analyses as it is likely that they collided with the substation itself and not the turbine. The 23 nocturnal migrants found during the May event averaged 37.8 m + 11.3 m SD from the base of the turbines with the majority of carcasses located between 31-45 m (Figure 7). Of those 23 carcasses, 17 (74%) were found predominantly to the west (SW, W, and NW; Table 4). It is interesting to note that during the May event, the majority of carcasses were found to the west of turbines 22 and 23 while only 6 birds were found to the east of the turbine bases. This further substantiates our contention that sodium vapor lights at the substation, located to the north/northwest of turbine 23, were responsible for the collision of nocturnal migrants with the adjacent turbines.
FAA Lighting and Avian Fatalities. To further test the hypothesis that there is no difference in fatality rates at turbines lit with FAA, L-864 red strobes and turbines that are not lit, a comparison was made of the numbers of nocturnal migrants killed at lit and unlit turbines. Birds involved in the May 17-23 event at turbines 22, 23, 24, and the substation were not included. Nine carcasses (29.0%) were found at the 12-lit turbines as
Curry & Kerlinger, LLC –2-14-04

2003 Mountaineer WEC Annual Rpt. – Avian and Bat Fatalities 15
opposed to 22 at the 31-unlit turbines. The percentage of carcasses found at lit turbines is not different from the expected 27.3% of turbines with lights.
The collision of birds with turbines 22, 23, and, 24, as well as the substation (fences and other structures) during the May Event, when there was significant fog and poor visibility, strongly suggests that the sodium vapor lights at the substation attracted the migrants. The fact that very few birds collided with the other turbines during this time lends further support to this contention. Moreover, no carcasses were found under turbines 22, 23, 24, and the substation after the May event. Bat Fatalities. Summary of Fatalities of Bats. A total 475 bat carcasses of 7 species were found during the 23 rounds of searches at the MWEC (Table 5). Red bats were most numerous, accounting for 42.1% of all carcasses found, with hoary (18.5%), eastern pipistrelle (18.3%), little brown (12.6%), silver-haired (5.9%), northern long-eared (1.3%), big brown (0.4%), and unidentified (0.8%) bats accounting for the remainder.
In spring, 17 carcasses were detected, whereas the remaining carcasses were detected between August 18 and November (Figure 4). A majority of bat carcasses were found between August 18 and September 30 (92.5%). Numbers tapered off dramatically in October, with 94% found before October 16, 2003. Only two bat carcasses were found in November and they were in advanced states of decomposition. In the 44-turbine string, numbers of bat carcasses found per turbine range from 1 carcass (Turbine 13) to 34 carcasses (Turbine 1) with an average of 10.6 bats + 5.8 SD per turbine (Figure 8). No bat carcasses were found beneath the two meteorology towers at the MWEC. Estimates of Total Bat Fatalities. Estimates of total bat fatalities at the Mountaineer Wind Energy Center were calculated in a similar fashion to avian fatalities (n = 475). We estimate 2092 bats (47.53 bats/turbine) were killed at the study site during the search period (Table 3).
We caution against strict interpretation of these bat fatality estimates, as detection probability and carcass removal for bats has not been shown to be similar to the rates for avian carcasses. Searcher efficiency is likely to be different for bats than birds due to bats’ unique coloration. Bats are also more frequently located within 30 m of the turbine base making it more likely that searchers would detect them. Additionally, our data suggest that bats are scavenged less than birds, which would increase their carcass removal rate to greater than 6.7 days. Location of Carcasses. Bats were analyzed for direction and distance from turbines. All bat carcasses found (including unidentified carcasses) were included in this analysis (n = 475). Bats were then separated by species to investigate whether bats vary in distance to turbine by species (n = 471). Unknown bat carcasses were not included in the species- specific analyses.
Curry & Kerlinger, LLC –2-14-04

2003 Mountaineer WEC Annual Rpt. – Avian and Bat Fatalities 16
Most bat carcasses were found within 30 m of turbines, despite searches that extended to greater than 60 m from the turbines. The average distance of carcasses from the turbine tower base was 18.87 + 10.1 SD with the majority of bat carcasses found between 16-30 m (Figure 7). Location of bats was evenly spread in all cardinal directions from the turbines (Table 6). The maximum percentage for the eight cardinal directions was 15.2% (South) of all carcasses and the minimum percentage was 11.1% (both SE and NW). Bat carcasses exhibited no directional tendency, as was the case for birds found at the site.
Seven species of bats were involved in collisions with turbines at the MWEC.
Body size and weight vary greatly among those 7 bat species. We speculated that larger species (hoary bat, 19-28 g; big brown bat, 13-18 g; and red bat, 9-15 g) might be located more closely to the base of the turbine, while smaller bats (eastern pipistrelle bat, 6 g; long-eared bat, 5-7 g; and little brown bat, 4-9 g) might be projected further from the turbine due to their small size. Our data show no difference among species of bats from the average distance to the base of the turbine (Figure 9). The largest species of bat, the hoary bat, was found on average 1 m further from the base of the turbine than the smallest species, the eastern pipistrelle bat (19.1 m + 9.9 m SD). Big brown bats were located the furthest from the base of the turbine (24.5 m + 14.8 m SD); however only two individuals represented this species. Long-eared bats were found closest on average to the base of the turbine (11.7 + 7.4 SD). Arrival and Departure Dates of Bat Species at the MWEC. The large number of bats of several different species found at the Mountaineer Wind Energy Center allows for an analysis of timing of bat species presence at the site and general area. Unknown individuals were not included in the analysis. Dates listed for each species represents the first date that a specimen of that species was found beneath a wind turbine at the MWEC. In some instances, the first specimen of that species found was not a freshly killed specimen and, therefore, some species may arrive in the area earlier than indicated by our bat carcasses. This is particularly evident with fall migration. Bat carcasses were first reported on August 18, 2003; however, a few of the carcasses found on that date were older decomposed specimens. Red bats were the first species to be recorded during spring migration, followed two weeks later by hoary bats (Table 7). Little brown bat carcasses did not appear during spring migration at the MWEC until June 2, 2003. No bats were found during spring migration after June 4, 2003. During fall migration, five bat species (hoary bat, red bat, little brown bat, long-eared bat, and eastern pipistrelle bat) were first reported in collisions with wind turbines on August 18, 2003; however, a few of these carcasses were in varying states of decomposition and believed to be approximately 1-2 weeks old. Big brown bats were not found on site until September 18, 2003. The last bat carcasses of fall (big brown bat and red bat) were found during the first week of November; however, these specimens were approximately one week old. Weather Conditions during Fall Migration. Weather data (wind direction, wind speed, and temperature) from a meteorology tower on site was obtained for the months of
Curry & Kerlinger, LLC –2-14-04

2003 Mountaineer WEC Annual Rpt. – Avian and Bat Fatalities 17
August and October of 2003. Missing data for the month of September 2003 was provided by an adjacent wind turbine on site and from weather data provided by searchers. Wind speed and direction were gathered every 10 minutes by the met tower and wind turbine. Daily averages of wind speed and wind direction were calculated for these variables. Searchers found 280 bat carcasses in the month of August. Wind speeds during August averaged 4.2 m/s (8.6 mph); wind direction, on average, was from the southwest. Temperatures averaged 21.5 ° C. It is important to note that the largest numbers of bat carcasses were found in August when wind speed was considerably lower in comparison to wind speeds recorded during late fall at the MWEC. In fact, the highest numbers of bats were found on nights/mornings when turbine rotors were feathered (very slow rotation of blades to optimize wind collection during periods of low wind speed). During September, 158 bat carcasses were found at the MWEC. Wind speed during September averaged 6.9 m/s (14.1 mph) with prevailing winds from the southwest. The majority of the bat fatalities in September (84.8%) occurred from September 4 – September 18. During this period, winds prevailed from the south and wind speeds averaged 6.7 m/s (13.7 mph). Eighteen bats were found in October; however, wind speed increased only slightly (7.2 m/s; 14.7 mph) from conditions in September. Winds in October came predominantly from the west. During fall migration, searchers found 162 freshly killed bat carcasses on 17 days of searching, indicating that bats migrated through the site during the night/early morning of those days. Bats were determined to be freshly killed (in many cases within a few hours) by the presence of wet blood, warm bodies, non-sunken eyes, and, in some cases, the presence of live bats found beneath turbines. Weather conditions (wind speed, wind direction, temperature, and presence of fog/precipitation) were analyzed on the days that freshly killed bats were found.
There was no correlation between numbers of freshly killed bat carcasses and wind speed, wind direction, or temperature (Table 8). 64% of freshly killed bats were found on foggy mornings; however, freshly killed bats were also found following nights of clear skies. On the 17 days when freshly killed bats were found in August, September, and October, wind speeds during the night/morning ranged from 2.0 to 12.1 m/s; temperature ranged from 5.7°C to 22.8°C. Morning fog was present on the ridge top on 58.8% of those days. FAA Lighting and Bat Fatalities. There was not a large difference in the number of bats killed at turbines with FAA lighting as opposed to turbines with no lighting. An average of 12.92 bats were killed at the 12 turbines with FAA lighting, whereas 10.0 bats were killed at the turbines without lighting. In addition, there was only one dead bat found in May at turbine 23 and no bats were ever found at the substation. Unlike birds at this study site, large numbers of bats were not found at turbines #22, 23, and 24 at any time during the year. These three turbines account for 6.8% of all turbines, and they accounted for a similar percentage of bat fatalities (7.4%).
Curry & Kerlinger, LLC –2-14-04

2003 Mountaineer WEC Annual Rpt. – Avian and Bat Fatalities 18
DISCUSSION This report summarizes the results of fatality monitoring at the Mountaineer Wind Energy Center for one year following construction. These results are preliminary, as this study is part of a two-year, post-construction monitoring program. Upon completion of monitoring in 2004, data will be subjected to rigorous statistical analysis and results for all years of monitoring will be compiled for publication. We expect two years of fatality data will provide a more robust view of trends in fatalities at the MWEC than are available after one year of searches. 2003 MWEC Avian and Bat Fatalities. The mortality estimate at the MWEC of approximately 4.04 birds per turbine per search period is greater than the national average of 2 birds per turbine per year. The MWEC avian mortality estimate, however, was lower than the estimate reported from the 3-turbine Tennessee site (7.7 birds/turbine/year; Nicholson 2003).
The types of birds killed at the MWEC during 2003 were somewhat different from those reported from most western studies in the United States, but similar to the findings of studies from Minnesota and Tennessee (Erickson et al. 2001). With respect to species composition, nocturnal migrants and other small birds predominated at the MWEC, as they did at these two other sites. The single Red-tailed Hawk that was killed late in the year suggests that raptors are probably not at great risk from the turbines at the MWEC.
The large number of bats killed at the Mountaineer Wind Energy Center, as
compared to other wind energy sites, is of concern. The wind energy site in TN reported an estimated mortality rate of 28.5 bats/turbine/year (Nicholson 2003). Species composition of bats is similar between sites, as is distance of bat carcasses to turbines (C. Nicholson, personal communication). These similarities exist despite differences in study location (ie: elevation, landscape, number of turbines). It is our hope that the continuation of post-construction searches at the MWEC will contribute to the growing knowledge of bat migration and help to decrease the number of bat fatalities occurring at this and other sites. Carcass Removal and Searcher Efficiency. The carcass removal rate for birds at the MWEC was similar to the rates reported from most wind power facilities, although lower than those reported at some studies of tall communication towers (Avise and Crawford 1981). Morrison (2002) reviewed carcass removal rates for wind power studies conducted in several states and reported varying rates, with small to medium sized birds being removed at a rate of about 50-75% within the first week to two weeks. Morrison (2002) also reported that bats showed a lower carcass removal rate, with average removal time being 50% greater than birds at some sites. These findings are similar to the findings for both bird and bat carcass removal at the MWEC. The detection probability at the MWEC was lower than reported for many other mortality studies. We believe that the rough terrain surrounding the majority of the
Curry & Kerlinger, LLC –2-14-04

2003 Mountaineer WEC Annual Rpt. – Avian and Bat Fatalities 19
turbines presents unique searching conditions that may become more pronounced as vegetation cover increases in the disturbed areas under the turbines. Additionally, only one test of searcher efficiency was conducted at the study site. The timing of the searcher efficiency test in October coincided with the first frost of the year creating difficult searching conditions on one of two mornings. Searchers were unaccustomed to searching the ground with frost cover and carcasses were camouflaged with their surroundings. We anticipate that the more intensive searcher efficiency/carcass removal studies (spring, summer, and fall) planned for the second year of searches will reveal a more robust estimate of detection probability and allow for seasonal variations in carcass removal. Search Effort – Frequency and Seasonal Timing of Searches. The intensity of carcass searches at the MWEC for assessing post-construction mortality to birds and bats exceeded that used at almost all other wind turbine projects in the United States. For most studies, searches are conducted once per month or at two-week intervals (Erickson et al. 2001). The more frequent search rate at the MWEC seems justified because the species impacted are primarily small songbirds, rather than large species like hawks. Once per week during the migration seasons appears to be adequate for assessing mortality, based on the rate of disappearance of carcasses. For future studies in the northeastern United States, where songbird migrants are the primary focus, a weekly search interval would be a reliable means of determining fatality rates, especially if carcass removal rates are similar to those found at the MWEC. With respect to bat fatalities, it is recommended that searches be conducted at least once a week during migration. This frequency should be adaptively adjusted when searchers suspect large numbers of migrants are moving through the study site and colliding with wind turbines. Ideally, all turbines or a random subset of turbines at the MWEC should be searched daily during fall migration to allow correlates of wind speed, wind direction, and timing of bat migration. It is also worthy to note that, at the MWEC, three bats were found alive on the ground beneath turbines during the fall migration. One bat was successfully rehabilitated and released; the other two died shortly after being found. These findings suggest that some bats may not die immediately following collision with the turbines and, instead, may die on the ground of exposure or vehicle kills. Increased frequency of searches during migration may increase the numbers of bats that survive following collisions with the turbines.
The early commencement of bat fatalities at the MWEC suggests that a majority
of bat migration at the study site begins earlier than bird migration in the fall. We therefore recommend that searches commence in mid-July when bat fatalities may commence, rather than starting in late August. It is possible that some bat fatalities were overlooked in this study because fall migration fatality searches did not commence until mid-August. However, the fact that the FPL Energy maintenance crews noticed the large number of bat carcasses in mid-August, prior to the research team, suggests that the numbers of bats that may have died before August 18, 2003 were not likely to be great. Weather Conditions and Bat Fatalities during Fall Migration. Weekly searches at wind turbines often make correlations of bird/bat fatalities with weather difficult due to the
Curry & Kerlinger, LLC –2-14-04

2003 Mountaineer WEC Annual Rpt. – Avian and Bat Fatalities 20
unknown time of death. The large number of fresh bat carcasses at the site and the increase in searches during the fall (some intervals between searches were <4 days) allow us to correlate weather conditions more closely than other studies conducted at wind energy facilities. It has been suggested that inclement weather may increase the likelihood with which birds and bats collide with wind turbines (Young et al. 2003). No strong correlations were seen between wind speed, wind direction, or temperature and bat carcasses; however, 64% of the freshly killed bats were found on foggy mornings. While the presence of fog may increase collision risk with the turbines, large numbers of freshly killed bats were found on clear mornings with no fog. In fact, the majority of bats killed at the site occurred in August, which was characterized by periods of calm winds, high temperatures, and very few instances of fog/precipitation. Speculation has been made that bats killed at the MWEC collided with the turbine tower itself, either while migrating or foraging, rather than the turbine blades. More research is needed to determine location of bat collision with the turbine/tower and the cause of death. FAA Lighting and Avian/Bat Fatalities. A review by Kerlinger and Kerns (2003) of numbers of birds killed at wind power facilities with red, mostly blinking (mostly L-864 red strobe) lighting, revealed no large-scale fatality events have occurred at any wind plants in the United States. At the MWEC, the red strobes did not appear to attract nocturnal migrants. Similarly, although the average number of bats killed at the 12-lit turbines ( x = 13) was slightly greater than those killed at the 32-unlit turbines ( x = 10), the difference is likely not to be significant and does not yet suggest attraction of bats to lighted turbines. In contrast, the multiple-fatality event that occurred at the MWEC on May 23, 2003 suggests that sodium vapor lights should never be used at or near wind power facilities. These lights have commonly been shown to attract birds to hotels, ski lifts, water towers, and communication towers in West Virginia as demonstrated by several researchers and the WV DNR. The location of sodium vapor and other non-FAA lighting at or near wind power facilities should be assessed and managed before the wind power facility begins operation. Presentation of Results at a Scientific Meeting. Plans are being made for the authors of this report to present results of the 2003 fieldwork at a professional ornithological (American Ornithologists Union in August 2004) or wildlife meeting. The importance of presenting the findings of the present study to professional ornithologists and wildlife biologists is critical to establishing a transparent and fair process. By doing so, research methodology and study results will be made available to professionals in the field, thus allowing review of the process by peers. Such presentations will also help to disseminate information about the general impacts of wind turbines to the scientific community.
Curry & Kerlinger, LLC –2-14-04

2003 Mountaineer WEC Annual Rpt. – Avian and Bat Fatalities 21
LITERATURE CITED Avise, J.C., and R.L. Crawford. 1981. A matter of lights and death. Natural History
90:6-14. Erickson, W.P., M. Dale Strickland, G.D. Johnson, and J.W. Kern. 2000. Examples of
statistical methods to assess risks of impacts to birds from wind plants. Proceedings of the Avian-Wind Power Planning Meeteing III. National Wind Coordinating Committee Meeting, May 1998, San Diego, CA. Washington, DC.
Erickson, W.P., G.D. Johnson, M.D. Strickland, D.P. Young, K.J. Sernka, and R.E.
Good. 2001. Avian collisions with wind turbines: a summary of existing studies and comparisons of other sources of avian collision mortality in the United States. National Wind Coordinating Committee, Washington, DC.
Erickson, W.P., J. Jeffrey, K. Kronner, and K. Bay. 2003. Stateline Wind Project
Wildlife Monitoring Annual Report, Results for the Period July 2001 – December 2002. Technical report submitted to FPL Energy, the Oregon Office of Energy, and the Stateline Technical Advisory Committee.
Kerlinger, P. 2000a. Phase I avian risk assessment a wind power facility propsed for
Backbone Mountain, Tucker County, West Virginia. Report to Atlantic Renewable Energy Corporation and the West Virginia Public Service Commission.
Kerlinger, P. 2000b. Migration study at the Backbone Mountain Wind Project site,
Tucker County, West Virginia. Report to Atlantic Renewable Energy Corporation and the West Virginia Public Service Commission.
Kerlinger, P., and J. Kerns. 2003. FAA lighting of wind turbines and bird collisions.
Paper presented at the November 18, 2003, National Wind Coordinating Committee –Wildlife Working Group Meeting, Washington, DC.
Manly, B.F. 1997. Randomization, Bootstrap, and Monte Carlo Methods in Biology.
2nd edition. Chapman and Hall, New York. Morrison, M. 2002. Searcher bias and scavenging rates in bird/wind energy studies. US
DOE - National Renewable Energy Laboratory NREL/SR-500-30876, Golden, CO.
Nicholson, C.P. 2003. Buffalo Mountain Windfarm bird and bat mortality monitoring
report: October 2001 – September 2002. Tennessee Valley Authority, Knoxville. Shoenfeld, P. 2004. Suggestions regarding avian mortality extrapolation. Prepared for
the Mountaineer Wind Energy Center Technical Review Committee.
Curry & Kerlinger, LLC –2-14-04

2003 Mountaineer WEC Annual Rpt. – Avian and Bat Fatalities 22
Shire, G.G., K. Brown, and G. Winegrad. 2000. Communication towers: a deadly hazard to birds. American Bird Conservancy, Washington, DC.
Young, D.P. Jr., Johnson, G.D., W.P. Erickson, M.D. Strickland, R.E. Good and P.
Becker. 2003. Avian and bat mortality associated with the initial phase of the Foote Creek Rim Wind Power Project, Carbon County, Wyoming: November 1998 – June 2002. Tech. Report prepared by WEST, Inc. for Pacific Corp, Inc., SeaWest Windpower Inc., and Bureau of Land Management.
Curry & Kerlinger, LLC –2-14-04

2003 Mountaineer WEC Annual Rpt. – Avian and Bat Fatalities 23
Table 1. Summary of rounds of fatality searches by month during 2003. Dates with asterisks indicate there was fog during the previous night or at dawn when researchers arrived. Spring Migration
Round 1 April 4, 12*, 13 Round 2 April 17, 18, 19, 20 Round 3 April 24, 25, 26, 27 Round 4 May 7, 10, 11 Round 5 May 17, 18, 19 Round 6 May 23*, 24*, 25 Round 7 June 1*, 2, 4*, 7 Round 8 June 22*, 24*
Summer Round 9 July 28*, 29 Fall Migration Round 10 August 18
Round 10a August 21, 22*, 24 Round 11 August 28*, 31* Round 12 September 4*, 5, 6*, 8 Round 13 September 11, 12* Round 14 September 17, 18*, 21* Round 15 September 25*, 26* Round 16 October 2, 3 Round 17 October 9*, 10* Round 18 October 16, 17 Round 19 October 23, 24 Round 20 October 30, 31 Round 21 November 7*, 9* Round 22 November 14, 20, 21, 22 Searches conducted on 61 separate days (1 by wind plant workers; Round 10) 22 total rounds of searches (8 in spring on 26 days, 1 in summer on 2 days, and 13 in fall on 33 days) 954 turbine searches (308 in spring, 44 in summer, 602 in fall)
Curry & Kerlinger, LLC –2-14-04

2003 Mountaineer WEC Annual Rpt. – Avian and Bat Fatalities 24
Table 2. Bird carcasses found at the Mountaineer Wind Energy Center, Tucker County, West Virginia. Asterisks indicate diurnal migrating birds or birds that are not migrants. Species May 17-June 1 Other Dates Total
American Robin 0 1 1
American Redstart 0 2 2
Black-billed Cuckoo 1 1 2
Blackpoll Warbler 2 1 3
Black-throated Blue Warbler 1 0 1
Canada Warbler 1 0 1
Chestnut-sided Warbler 1 0 1
Common Yellowthroat 1 0 1
European Starling* 0 1 1
Hooded Warbler 0 1 1
House Sparrow* 0 1 1
Indigo Bunting 0 1 1
Magnolia Warbler 3 2 5
Red-eyed Vireo 12 9 21
Red-tailed Hawk* 0 1 1
Rock Dove* 0 1 1
Rose-breasted Grosbeak 2 1 3
Ruffed Grouse* 0 1 1
Swamp Sparrow 0 1 1
Turkey Vulture* 0 2 2
Unidentified small bird 4 5 9
Veery 1 0 1
Wood Duck 0 1 1
Wood Thrush 0 3 3
Yellow-billed Cuckoo 4 0 4
Total Number of Carcasses 33 36 69
Total Number of Species 12 19
Curry & Kerlinger, LLC –2-14-04

Table 3. Avian and bat mortality estimates at the Mountaineer Wind Energy Center in 2003. I
(days) No.
Found No./Turbine/Search Period No./Wind Project/Search Period**
50% CI 90% CI 50% CI 90% CI Mean SE ll ul ll ul Total
SE
ll
ul
ll
ul
All birdsSpring 9 11 1.34 0.80 1 1.84 0.61 3.01 59 35 44 81 27 132
Summer 27 1 0.33 0.44 0 0.57 0.00 1.21 15 19 0 25 0 53Fall 7 24 2.37 1.21 1.91 3.14 1.37 4.89 104 53 84 138 60 215
Total 36 4.04 2.03 - - 2.41 8.33 178 89 - - 106 366All birds excluding non-MBTA species
Spring 9 9 1.09 0.71 0.80 1.52 0.47 2.52 48 31 35 67 21 111Summer* 27 0 0.17 0.31 0 0.34 0.00 0.76 7 14 0 15 0 34
Fall 7 24 2.37 1.27 1.91 3.14 1.37 4.97 104 56 84 139 60 219Total 33 3.63 1.93 - - 2.16 7.38 160 85 - - 95 325
Nocturnal migrantsSpring 9 5 0.61 0.47 0.41 0.86 0.18 1.49 27 21 18 38 8 65
Fall 7 17 1.68 0.99 1.32 2.25 0.91 3.58 74 44 58 99 40 158Overall 22 2.29 1.33 - - 1.28 4.84 101 58 - - 57 213
BatsSpring 9 17 2.06 1.17 1.61 2.80 1.09 4.41 91 51 71 123 48 194
Summer* 27 0 0.17 0.30 0 0.34 0 0.77 7 13 0 15 0 34Fall 7 458 45.30 22.07 38.25 58.55 30.14 88.77 1993 971 1683
2576 1326 3918
Total 475 47.53 21.70 - - 31.78 91.62 2092 955 - - 1398 4031
* When 0 birds or bats were found, we conservatively used a 0.02/turbine/search period unadjusted estimate. **Point estimates are based on analyses described in Erickson et al. (2003) and Schoenfeld (2004); standard errors and confidence intervals are from Monte Carlo Simulation.
25

Table 4. Number and percentage of nocturnal migrant bird carcasses in each of eight cardinal directions from turbine tower base found during the May fatality event and at other times. Unknown carcasses were not included in the analysis.
May Event Before/after May Event
Direction No. of carcasses
found
Percentage No. of carcasses
found
Percentage
N 0 0 1 4.3%
NE 3 13.0% 5 21.7%
E 1 4.3% 4 17.4%
SE 2 8.7% 5 22.7%
S 0 0 2 8.7%
SW 6 26.1% 0 0
W 6 26.1% 1 4.3%
NW 5 21.7% 4 17.4%
Total 23 22

2003 Mountaineer WEC Annual Rpt. – Avian and Bat Fatalities 27
Table 5. Summary of bat fatalities by species during 2003 at Mountaineer Wind Energy Facility, Tucker County, West Virginia. Numbers in parentheses represent carcasses found in poor condition that are attributed to that species. Identifications made by Craig Stihler, West Virginia Department of Natural Resources. Species Number of Carcasses
Found
Percentage of Carcasses
Found
Red bat 200 (4) 42.1%
Hoary bat 88 (2) 18.5%
Eastern pipistrelle 87 (2) 18.3%
Little brown bat 60 (4) 12.6%
Silver-haired bat 28 5.9%
Northern long-eared bat 6 1.3%
Big brown bat 2 0.4%
Unidentified 4 0.8%
Curry & Kerlinger, LLC –2-14-04
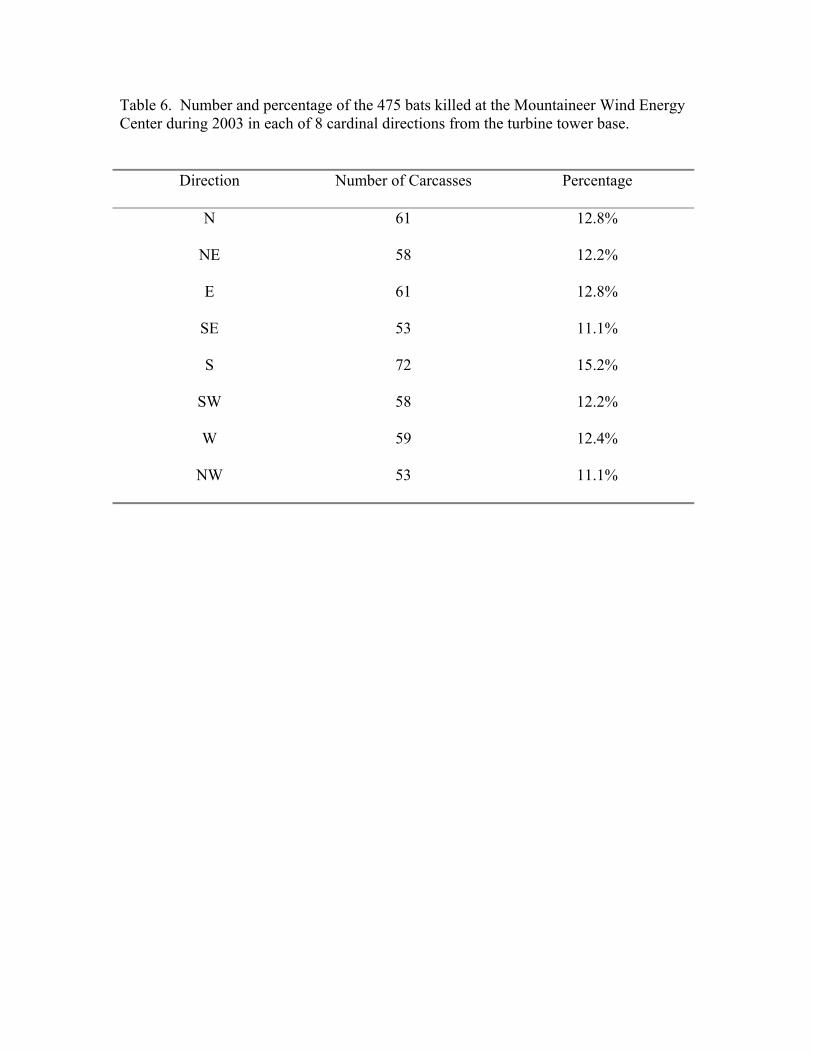
Table 6. Number and percentage of the 475 bats killed at the Mountaineer Wind Energy Center during 2003 in each of 8 cardinal directions from the turbine tower base.
Direction Number of Carcasses Percentage
N 61 12.8%
NE 58 12.2%
E 61 12.8%
SE 53 11.1%
S 72 15.2%
SW 58 12.2%
W 59 12.4%
NW 53 11.1%

2003 Mountaineer WEC Annual Rpt. – Avian and Bat Fatalities 29
Table 7. Dates of first and last recorded carcass by species found at the Mountaineer Wind Energy Center in spring and fall 2003.
Species
Spring
First date Last date recorded recorded
Fall
First date Last date recorded recorded
Hoary Bat May 7 May 23 August 18 October 10
Big Brown Bat - - September 18 November 9
Red Bat April 20 June 4 August 18 November 7
Silver-haired Bat May 23 May 23 August 22 October 17
Little Brown Bat June 2 June 4 August 18 October 10
Long-eared Bat - - August 18 September 8
Eastern Pipistrelle Bat May 24 May 25 August 18 October 10
Curry & Kerlinger, LLC –2-14-04

2003 Mountaineer WEC Annual Rpt. – Avian and Bat Fatalities 30
Table 8. Wind direction, wind speed, temperature, and inclement weather conditions for mornings in which fresh bats were found during fall migration at the MWEC. Asterisks (*) indicate values unavailable from met tower and/or turbine; these values were provided from daily searcher data.
Date No. of Fresh Bats
Found
Avg Wind Direction
Avg Wind Speed (m/s)
Temp (Celsius)
Fog Precip
August 21
6 w 4.4 22.6 No* No*
August 22
5 w 7.5 20.6 Yes* No*
August 24
9 sw 3.7 17.7 No* No*
August 28
1 se 2.0 22.8 Yes* No*
August 31
40 sw* 5* 15* Yes* No*
September 5
15 w 4.3 15* No* No*
September 6
31 se 3.2 18* Yes* No*
September 8
19 e 7.3 15* No* No*
September 11
3 e 8.7 13* No* No*
September 12
1 se 11.2 13* Yes* No*
September 17
5 e 7.5 13* No* No*
September 18
17 e 12.1 13* Yes* Yes*
September 25
5 w 8.3 10* Yes* No*
September 26
1 sw 6.3 7* Yes* Yes*
October 3
1 sw 5.1 5.7 No* No*
October 9
2 se 5.7 15.2 Yes* No*
October 10
1 se 9.0 14.0 Yes* No*
Curry & Kerlinger, LLC –2-14-04
2003 Mountaineer WEC Annual Rpt. – Avian and Bat Fatalities 31
Figure 1. Location of turbine area for the Mountaineer Wind Energy Center, Tucker County, WV, on Backbone Mountain (in redlined area).
Curry & Kerlinger, LLC –2-14-04

2003 Mountaineer WEC Annual Rpt. – Avian and Bat Fatalities 32
Figure 2. Data sheet used to record data collected for each field day at the Mountaineer Wind Energy Center, Tucker County, WV. Mountaineer Wind Energy Center, WV -- Daily Data Sheet Date Start/End Observer Towers Weather # Carcasses
Curry & Kerlinger, LLC –2-14-04

2003 Mountaineer WEC Annual Rpt. – Avian and Bat Fatalities 33
Figure 3. Data sheet used to record bird and bat fatality information for each carcass found at the Mountaineer Wind Energy Center, Tucker County, West Virginia. Mountaineer Carcass Data Sheet Date/Time Carcass # Observer Sp/Age/Sex Turbine # Dir-Dist Conditions/Notes
Curry & Kerlinger, LLC –2-14-04

2003 Mountaineer WEC Annual Rpt. – Avian and Bat Fatalities 34
Figure 4. Number of (a) bird and (b) bat carcasses found per two-week interval. Numbers in parentheses represent the number of days that searchers were in the field within the two-week interval.
0
5
10
15
20
25
30
35
40
April
4-15
(3)
April
16-3
0 (8)
May
1-15
(3)
May
15-3
1 (6)
June
1-15
(4)
June
16-3
0 (2)
July
1-15
(0)
July
16-3
1 (2)
Aug 1
-15 (
0)Au
g 16-
31 (6
)Se
pt 1-
15 (6
)Se
pt 16
-30 (
5)Oc
t 1-1
5 (4)
Oct 1
6-31
(6)
Nov 1
-15 (
4)No
v 16-
22 (3
)
No.
of C
arca
sses
(a)
0
50
100
150
200
250
300
April
4-15
(3)
April
16-3
0 (8)
May
1-15
(3)
May
15-3
1 (6)
June
1-15
(4)
June
16-3
0 (2)
July
1-15
(0)
July
16-3
1 (2)
Aug 1
-15 (
0)Au
g 16-
31 (6
)Se
pt 1-
15 (6
)Se
pt 16
-30 (
5)Oc
t 1-1
5 (4)
Oct 1
6-31
(6)
Nov 1
-15 (
4)No
v 16-
22 (3
)
No.
of C
arca
sses
(b)
Curry & Kerlinger, LLC –2-14-04

2003 Mountaineer WEC Annual Rpt. – Avian and Bat Fatalities 35
Figure 5. Number of bird carcasses found per turbine and substation. Turbines and substation are numbered from south to north, as they exist within the string of turbines.
0
5
10
15
20
25
1 2 3 4 5 6 7 8 9 10 11 12 13 14 15 16 17 18 19 20 21 22 23
No.
of C
arca
sses
Non-May eventMay event
No.
of C
arca
sses
h
Curry &
Sout
0
5
10
15
20
25
Sub 24 25 26 27 28 29 30 31 32 33 34 35 36 37 38 39 40 41 42 43 44
Turbine No. h
Kerlinger, LLC –2-14-04
Nort

2003 Mountaineer WEC Annual Rpt. – Avian and Bat Fatalities 36
Figure 6. Location of turbines and substation involved in the May event (diagram not to scale). Filled triangles represent location of freshly killed carcasses found on May 23, 2003; empty triangles represent carcasses found before/after May 23, 2003 when the sodium vapor lights remained on.
Sodium vapor lights
Substation
~200 m
#24
Gravel Lot #23
#22
Curry & Kerlinger, LLC –2-14-04

2003 Mountaineer WEC Annual Rpt. – Avian and Bat Fatalities 37
Figure 7. Distances of (a) nocturnal migrant songbirds and (b) bat carcasses from the turbine base (in meters).
0
2
4
6
8
10
12
14
0-15 16-30 31-45 46-60
No.
of C
arca
sses
May eventNon-May event
0
50
100
150
200
250
0-15 16-30 31-45 46-60
Distance from turbine (m)
No.
of C
arca
sses
(a)
(b)
Curry & Kerlinger, LLC –2-14-04

2003 Mountaineer WEC Annual Rpt. – Avian and Bat Fatalities 38
Figure 8. Number of bat carcasses found per turbine and substation. Turbines and substation are numbered from south to north, as they exist within the string of turbines.
0
5
10
15
20
25
30
35
40
1 2 3 4 5 6 7 8 9 10 11 12 13 14 15 16 17 18 19 20 21 22 23
No.
of C
arca
sses
0
5
10
15
20
25
30
35
40
Sub 24 25 26 27 28 29 30 31 32 33 34 35 36 37 38 39 40 41 42 43 44
Turbine No.
No.
of C
arca
sses
South
h
Curry & Kerlinger, LLC –2-14-04
Nort

2003 Mountaineer WEC Annual Rpt. – Avian and Bat Fatalities
Curry & Kerlinger, LLC –2-14-04
39
Figure 9. Average distance (+ SE) of bat species from the base of the turbine. Bats are shown from largest (Hoary Bat; 19-28 g) to smallest (Eastern Pipistrelle Bat; 6 g).
0
5
10
15
20
25
30
Hoary BigBrown
Red Silver-haired
LittleBrown
Long-eared
Pipistrelle
Dis
tanc
e fr
om tu
rbin
e ba
se (m
)