a study of computer-assisted learning environments in singapore
TRANSCRIPT
This article was downloaded by: [Universitaetsbibliothek Giessen]On: 18 October 2014, At: 04:18Publisher: RoutledgeInforma Ltd Registered in England and Wales Registered Number: 1072954 Registered office:Mortimer House, 37-41 Mortimer Street, London W1T 3JH, UK
Singapore Journal of EducationPublication details, including instructions for authors and subscriptioninformation:http://www.tandfonline.com/loi/cape19
A Study of Computer-Assisted LearningEnvironments in SingaporeGeorge P.L. Teh & Barry J. FraserPublished online: 13 Mar 2008.
To cite this article: George P.L. Teh & Barry J. Fraser (1994) A Study of Computer-Assisted LearningEnvironments in Singapore, Singapore Journal of Education, 14:2, 26-41, DOI: 10.1080/02188799408547732
To link to this article: http://dx.doi.org/10.1080/02188799408547732
PLEASE SCROLL DOWN FOR ARTICLE
Taylor & Francis makes every effort to ensure the accuracy of all the information (the“Content”) contained in the publications on our platform. However, Taylor & Francis, ouragents, and our licensors make no representations or warranties whatsoever as to theaccuracy, completeness, or suitability for any purpose of the Content. Any opinions and viewsexpressed in this publication are the opinions and views of the authors, and are not the viewsof or endorsed by Taylor & Francis. The accuracy of the Content should not be relied upon andshould be independently verified with primary sources of information. Taylor and Francis shallnot be liable for any losses, actions, claims, proceedings, demands, costs, expenses, damages,and other liabilities whatsoever or howsoever caused arising directly or indirectly in connectionwith, in relation to or arising out of the use of the Content.
This article may be used for research, teaching, and private study purposes. Any substantialor systematic reproduction, redistribution, reselling, loan, sub-licensing, systematic supply, ordistribution in any form to anyone is expressly forbidden. Terms & Conditions of access anduse can be found at http://www.tandfonline.com/page/terms-and-conditions
A Study of Computer-Assisted LearningEnvironments in Singapore
George P.L. Tehand
Barry J. Fraser
Abstract
The present study filled some gaps in past learning environment research in that, first, it involved thedevelopment of a new instrument tailor-made specifically for use in computer-assisted learning (CAL)classrooms and, second, it provided one of the rare examples of an evaluation of computer-assistedlearning based on its impact on the nature of a classroom learning environment as perceived bystudents. In addition, the research was conducted in the unique milieu of the Singapore schoolsystem, and it investigated associations between students' outcomes and the classroom environmentin computer-assisted learning settings.
Descriptors: Computer-assisted learning, learning environment, geographic education
Background
Singapore, educationalapplications of computers were only introducedfairly extensively into the schools in 1980. Thefocus initially was on teaching computer scienceas a subject at the pre-university level and low-level computer literacy courses at the secondaryschool level. There was no extensive computereducation programme at the primary level(Wong, Lim and Low, 1989). Computer-assistedlearning (CAL) was only introduced to theschools in 1986. Currently, schools use CAL inScience, Mathematics and English forremediation and enrichment. No Singaporeanschools develop their own CAL courseware(Wong, Lim and Low, 1989).
However, in Singapore, there is a dearth ofresearch on the effects of CAL. To date, only
three research studies have been conducted (Ongand Lee-Leek, 1986; Low, 1988; Woo-Tan,1989). On the whole, positive effects of CALhave been reported. However, because thesamples in these studies were small and non-random, and because of the short duration ofthe experimental treatment and the narrow scopeof the content selected, their findings should beinterpreted with caution. Furthermore, thesample selected in one of the studies was fromone of the best schools in the country, thuslimiting the generalisability of the resultsobtained. Thus, research data on the use of CALin Singapore is sparse, of questionable validityand of low generalisability. Because of the lackof dependable research information, and in viewof the potential that research conducted in theunique educational context of Singapore has forour understanding of computer-assisted learningenvironments, the present study wasconceptualised and conducted.
26 1994 Vol. 14, No. 2
Dow
nloa
ded
by [
Uni
vers
itaet
sbib
lioth
ek G
iess
en]
at 0
4:18
18
Oct
ober
201
4
SINGAPORE JOURNAL OF EDUCATION
Learning Environment Research
It is now a quarter of a century since the LearningEnvironment Inventory was used as part of theresearch and evaluation activities of HarvardProject Physics (Welch and Walberg, 1972).Around the same time, Moos began developingsocial climate scales for a wide variety of humanenvironments, including the ClassroomEnvironment Scale for use in school settings(Moos and Trickett, 1987). Since that time, newclassroom environment instruments have beendeveloped to assess specific settings, such asthe Individualised Classroom EnvironmentQuestionnaire for open or individualisedclassrooms (Fraser, 1990) and the ScienceLaboratory Environment Inventory for sciencelaboratory classes (Fraser, McRobbie andGiddings, 1993). The present study extendedpast research in another new direction in that itinvolved the development, validation and useof a new instrument for assessing the uniquesetting of the computer-assisted learningclassroom.
The strongest tradition in past classroomenvironment research has involved investigationof associations between student outcomes andtheir perceptions of classroom environment(Fraser and Fisher, 1982). A meta-analysis of734 correlations from 82 classes in 8 subjectareas containing 17,805 students in 4 nationsrevealed that classroom environment perceptionsaccounted for appreciable amounts of variancein cognitive and affective outcomes, oftenbeyond that attributable to background studentcharacteristics (Haertel, Walberg, and Haertel,1981). The practical implication from thisresearch is that student outcomes might beimproved by creating classroom environmentsfound empirically to be conducive to learning.In the present study, one of the major purposeswas to explore associations between students'achievement and attitudes and their perceptionsof their computer-assisted classroom learningenvironments.
Researchers in various countries have usedstudent perceptions of the classroom
environment as criterion variables in studiesaimed at identifying how perceptions vary withsuch factors as class size (Anderson and Walberg,1972), grade level (Welch, 1979), student gender(Lawrenz, 1987), subject matter (Tamir andCaridin, 1993) and type of school (Trickett,1978). Also, students' classroom environmentperceptions have been found to differsystematically from those of their teachers (Fisherand Fraser, 1983) and to provide a tangiblebasis for guiding improvements in classrooms(Fraser and Fisher, 1986).
One promising but largely neglected use ofstudent perceptions is as a source of processcriteria in evaluating educational innovations(Fraser, 1981). For example, an evaluation ofHarvard Project Physics showed that students'perceptions of the classroom environmentdifferentiated revealingly between curricula,even when various outcome measures showednegligible differences (Welch and Walberg,1972). The research reported in this study isdistinctive in that it provides one of the firstevaluations of CAL which investigated thepsychosocial environment of CAL classrooms.
Although there has been a revolution in recentyears in terms of both the scope and variety ofthe roles which computer-assisted learning hasplayed within education, the field of classroomlearning environment (Fraser, 1986,1993; Fraserand Walberg, 1991) has lagged behind in twomajor ways. First, hitherto there has existed nolearning environment instrument which has beentailor-made specifically for use in classroomsusing computer-assisted learning. Second,innovations in computer-assisted learning haverarely been evaluated in terms of their impacton the nature of the classroom learningenvironment as perceived by students (Ellett,1986; MacGregor, 1986). The present study fillssome of the gaps by reporting the evaluation ofan innovation in computer-assisted learning interms of its impact on classroom environment,in addition to reporting on its impact on studentachievement and attitudes, and associationsbetween student outcomes and classroomenvironment.
- | 1994 Vol. 14, No. 2 27
Dow
nloa
ded
by [
Uni
vers
itaet
sbib
lioth
ek G
iess
en]
at 0
4:18
18
Oct
ober
201
4
I SINGAPORE JOURNAL OF EDUCATION |
Purposes of Study
The main purposes of the study were:
(1) to develop and validate a new instrumentfor assessing the unique learningenvironment of computer-assisted learningclassrooms;
(2) to evaluate an innovation in computer-assisted learning, involving the use of micro-PROLOG for teaching the topic of decisionmaking in geography in Singapore schools,in terms of impact upon:• student achievement;• student attitudes;• the classroom environment.
(3) to investigate associations between students'cognitive and affective outcomes and thenature of the learning environment incomputer-assisted classroom settings.
Design
Tlte Innovative Teaching Approach
The innovation in computer-assisted learningwhich formed the focus of this study wasdistinctive in that it made use of micro-PROLOG,the microcomputer version of PROLOG, a high-level fifth-generation declarative language,which was developed for artificial intelligenceresearch and which has been found to be robust,compact and accessible to students in classroomapplications (Chalk, 1987). This CAL coursewarecovered the topic of decision-making ingeography and was designed specifically for asix-week segment in the Singapore schoolgeography syllabus. In order to enhance thevalidity of conclusions from the evaluative study,a control group, which studied the same topicvia the direct expository teaching methodscommon in Singapore, was also included in thestudy.
The CAL approach consisted of a sequenceof instructions consisting of learning activitiesfor the concept of decision-making, followed
by a prescribed set of exercises. During the CALlessons, students were presented with thenecessary information. Also students wereguided with instructions on the computerscreens, were provided with practice exercisesand had their learning assessed. Feedback wasprovided contingent upon correct and incorrectresponding.
Sample
The study involved 12 teachers, each in adifferent randomly selected school. In order toreduce the "teacher effect", each teacher taughtone experimental and one control class. Allschools were coeducational in order to allowan unconfounded test of whether CAL wasdifferentially effective for boys and girls. Thetotal number of students in these 24 classes was671 (348 in the experimental group and 323 inthe control group). Approximately equalnumbers of males and females made up thesample. Students were 8th graders from the lowerend of the ability range in Singapore (referred toas "Secondary 2 Normal" students).
Development of Instruments
Geography Achievement Test (GAT) andSemantic Differential Inventory (SDI)
The instruments used to measure achievementin and attitude towards geography weredeveloped and validated during the study. TheGeography Achievement Test (GAT) is a 30-item multiple-choice test which assesses theconcept of decision-making in geography. TheSemantic Differential Inventory (SDI) is a 20-item semantic differential instrument whichmeasures students' attitudes towards learninggeography. The alpha reliability coefficient forthe whole sample was found to be 0.95 for the30-item GAT and 0.94 for the 20-item SDI.
Tlte Geography Classroom EnvironmentInventory (GCEI)
Description of GCEIThe final version of a new instrument developedfor this study, called the Geography Classroom
28 1994 Vol. 14, No. 2 \-
Dow
nloa
ded
by [
Uni
vers
itaet
sbib
lioth
ek G
iess
en]
at 0
4:18
18
Oct
ober
201
4
S1NGAPG8E JBKEBNftk W €OUCATION
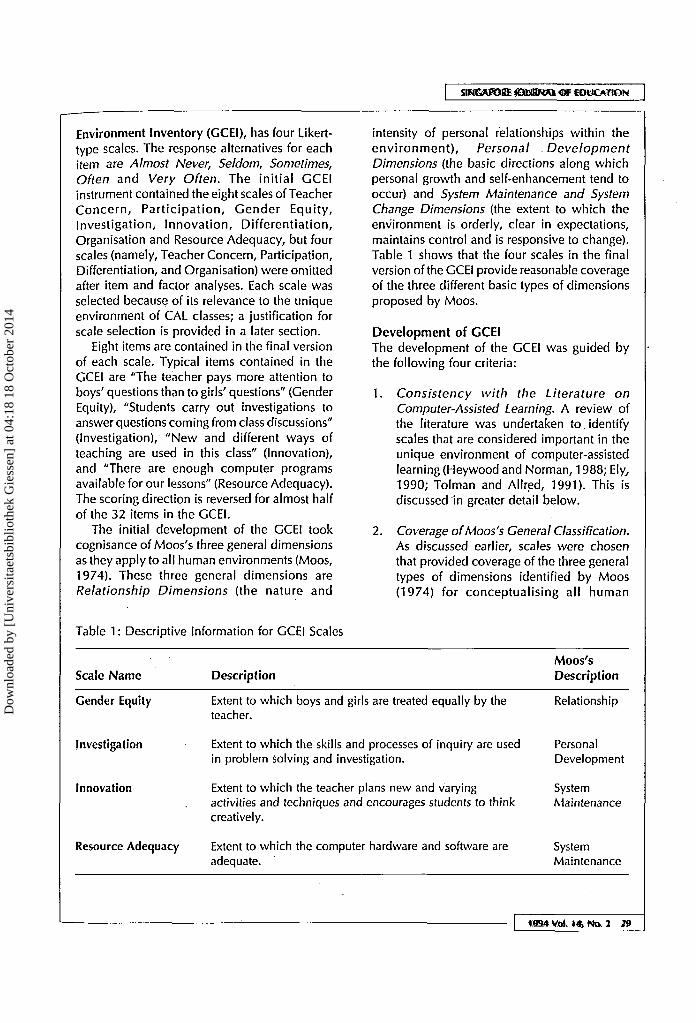
Environment Inventory (GCEI), has four Likert-type scales. The response alternatives for eachitem are Almost Never, Seldom, Sometimes,Often and Very Often. The init ial GCEIinstrument contained the eight scales of TeacherConcern, Part icipation, Gender Equity,Investigation, Innovation, Differentiation,Organisation and Resource Adequacy, but fourscales (namely, Teacher Concern, Participation,Differentiation, and Organisation) were omittedafter item and factor analyses. Each scale wasselected because of its relevance to the uniqueenvironment of CAL classes; a justification forscale selection is provided in a later section.
Eight items are contained in the final versionof each scale. Typical items contained in theGCEI are "The teacher pays more attention toboys' questions than to girls' questions" (GenderEquity), "Students carry out investigations toanswer questions coming from class discussions"(Investigation), "New and different ways ofteaching are used in this class" (Innovation),and "There are enough computer programsavailable for our lessons" (Resource Adequacy).The scoring direction is reversed for almost halfof the 32 items in the GCEI.
The initial development of the GCEI tookcognisance of Moos's three general dimensionsas they apply to all human environments (Moos,1974). These three general dimensions areRelationship Dimensions (the nature and
intensity of personal relationships within theenvironment), Personal DevelopmentDimensions (the basic directions along whichpersonal growth and self-enhancement tend tooccur) and System Maintenance and SystemChange Dimensions (the extent to which theenvironment is orderly, clear in expectations,maintains control and is responsive to change).Table 1 shows that the four scales in the finalversion of the GCEI provide reasonable coverageof the three different basic types of dimensionsproposed by Moos.
Development of GCEIThe development of the GCEI was guided bythe following four criteria:
1. Consistency with the Literature onComputer-Assisted Learning. A review ofthe literature was undertaken to. identifyscales that are considered important in theunique environment of computer-assistedlearning (Heywood and Norman, 1988; Ely,1990; Tolman and Allred, 1991). This isdiscussed in greater detail below.
2. Coverage of Moos's General Classification.As discussed earlier, scales were chosenthat provided coverage of the three generaltypes of dimensions identified by Moos(1974) for conceptualising all human
Table 1: Descriptive Information for GCEI Scales
Scale Name DescriptionMoos'sDescription
Gender Equity
Investigation
Innovation
Resource Adequacy
Extent to which boys and girls are treated equally by the Relationshipteacher.
Extent to which the skills and processes of inquiry are used Personalin problem solving and investigation. Development
Extent to which the teacher plans new and varying Systemactivities and techniques and encourages students to think Maintenancecreatively.
Extent to which the computer hardware and software are Systemadequate. Maintenance
1994 Vol. »* Nft 2 29
Dow
nloa
ded
by [
Uni
vers
itaet
sbib
lioth
ek G
iess
en]
at 0
4:18
18
Oct
ober
201
4
SINGAPORE JOURNAL OF EDUCATION
environments. Because Moos (1974) claimsthat, at minimum, Relationship Dimensions,Personal Development Dimensions andSystem Maintenance and System ChangeDimensions must be included to providean adequate and reasonably completepicture of any environment, dimensions forthe initial GCEI instrument were chosen toinclude scales in each of Moos's threegeneral categories.
3. Salience to Classroom EnvironmentResearchers, Teachers and Students. Bysoliciting comments and feedback fromgeography teachers and students at the"Secondary Two" level in Singapore on draftversions of sets of items, an attempt wasmade to ensure that the initial CCEI's scalesand individual items were considered salientby teachers and students. Additionally, thereactions of several educational researcherswith extensive experience in classroomenvironment research and questionnairedevelopment were sought concerning theadequacy, suitability and relevance of theitems that made up the scales. This led tothe fine-tuning and refinement of the itemsand scales to form a modified version of theGCEI instrument.
4. Salience to Computer Education Experts.Several computer education experts vettedthe items and scales and agreed that theconstructs were relevant.
Justification for Choice of DimensionsThe Gender Equity scale was created andincluded in the GCEI for this study becauseclassroom environment instruments in pastresearch have not included this scale when theywere used as sources of predictor and criterionvariables (Fraser, McRobbie, and Giddings,1993). Although Lawrenz (1987) investigatedgender effects for students' perception of theirscience classroom environment, she used theshorter versions of the Learning EnvironmentInventory developed by Fisher and Fraser (1983)and validated by Fraser and Fisher (1986). But'no gender equity scale was included in these
two instruments. Although Lawrenz's (1987)study does not suggest a cause and effectrelationship, it was found that the perceivedclassroom environment was related to bothteacher and student gender. Despite the factthat Fraser, McRobbie and Giddings' (1993)study had, as one of its major aims, theinvestigation of gender differences in perceptionsof science laboratory classrooms using theScience Laboratory Environment Inventory (SLEI),the SLEI did not include gender equity as one ofits scales. Nevertheless, their findings suggestthat females generally perceived the sciencelaboratory classroom environment morefavourably than did males. A classroomenvironment instrument which includes a genderequity scale is likely to be able to detect gendereffects even more sensitively.
Gender Equity was also included in theinstrument because a decade of research on thistopic in the CAL environment has shown thatthe use of computers maintained andexaggerated inequities, that equity issues arecomplex (Sutton, 1991), and that there aregender differences in achievement and attitudestowards computer usage (Hattie and Fitzgerald,1987; Sutton, 1991).
Previously-developed classroom environmentinstruments have included innovation, resourceadequacy (or "material environment") andinvestigation as dimensions. Innovation wasincluded as one of the dimensions of GCEIbecause the use of microcomputers as aneffective educational innovation has beendiscussed in the computer education literature.The literature suggests that the microcomputerhas been accepted as an educational innovation(Heywood and Norman, 1988), that thegovernment plays an active role in promotingcomputer use in the educational system, andthat the use of microcomputers as an educationalinnovation can affect outcomes (Boyd, 1990).
Resource Adequacy (or "Mater ia lEnvironment") is one of the scales that has beenincluded in past classroom environment research(Fraser, McRobbie and Giddings, 1993). In thecomputer education l iterature, resourceadequacy refers to the use of computer software(sometimes called courseware) or hardware for
30 1994 Vol. 14, No. 2
Dow
nloa
ded
by [
Uni
vers
itaet
sbib
lioth
ek G
iess
en]
at 0
4:18
18
Oct
ober
201
4
SINGAPORE JOURNAL OF EDUCATION
teaching and learning. The need to createsoftware that the teacher can use as a tool inteaching has been discussed widely in theliterature (Plomp and Pelgrum, 1991), as hasthe type and quality of educational software(Gonce-Winder and Walbesser, 1987; OECD-CERI, 1989). Also, some researchers areconcerned about hardware acquisition andutilisation (Boyd, 1990; Plomp and Pelgrum,1991).
Although there has been a strong tradition inCAL research at all school levels to investigatethe effectiveness of the usage of CAL in a specificcognate area (Roblyer, Castine and King, 1988;Kulik and Kulik, 1991), past CAL research hasseldom examined the potential of computerusage in facilitating and promoting studentinvestigation in the classroom. Thereforeinvestigation was another dimension that wasincorporated into the GCEI instrument.
Refinement and Validation of GCEI
A preliminary 80-item version of the GCEI, with10 items in each of 8 scales, was field testedand modified to form a final 32-item version(with 8 items in each of 4 scales). The instrumentrefinement process involved the three stagesdescribed below: interviews with students, itemanalysis of students' responses, and factoranalyses of students' responses.
Preliminary Field Testing andStudent Interviews
In order to improve the initial form of the GCEIprior to its use in the main study, it was fieldtested with two complete classes of lower abilitystudents (38 boys and 32 girls) in SecondaryTwo Normal classes. The two classes wereassigned randomly as experimental and controlgroups, respectively. The experimental class usedthe CAL module, while the control class followedthe lessons via the normal expository mode. Atthe end of the treatment, students responded tothe GCEI and, immediately after administration,students were interviewed and their evaluationswere sought concerning the GCEI in terms of
the appropriateness and level of the languageused, syntax and rubric. In addition to students'evaluations, the comments of the class teachersand Heads of Department were also obtained.
This subjective approach led to theidentification of several sources of ambiguityand misinterpretation. Subsequently, some minorbut important changes were made to selectedGCEI items to overcome those problems priorto its use in the main study as described below.
Item Analysis
Further modifications to the GCEI instrumentwere based on item analyses of the data collectedin the main study from the sample of 24 classesof Secondary 2 Normal students (N = 671).These items analyses were carried out to identifyitems whose removal would enhance eachscale's internal consistency and discriminantvalidity. In particular, internal consistency wasenhanced by removing any item with a lowitem-remainder correlation (ie correlationbetween an item score and the total for theremaining items in that scale), and discriminantvalidity was enhanced by removing any itemwhose correlation with its a priori assigned scalewas lower than its correlation with any otherscale in the GCEI. The application of itemanalysis procedures to the initial version of GCEIled to the deletion of 11 of the 80 items in orderto enhance each scale's internal consistencyand discriminant validity.
Factor Analyses
Next, the same students' responses (N = 671) tothe 69 items in the initial version of the GCEIwhich survived the item analysis procedureswere factor analysed using principal componentsanalysis with varimax rotation to generateorthogonal factors. Several factor analyses usingthe individual as the unit of analysis wereobtained and examined. Four factors, witheigenvalue of 1.0 and above, were found toexplain 55.2% of the total variance in GCEIscores. Items with factor loadings greater thanor equal to the conventionally accepted valueof 0.30 were retained in the analysis. These
1994 Vol. 14, No. 2 31
Dow
nloa
ded
by [
Uni
vers
itaet
sbib
lioth
ek G
iess
en]
at 0
4:18
18
Oct
ober
201
4
SINGAPORE (OURNAi OS EDUCATION
factor analyses led to the deletion of 4 of theoriginal scales, namely, Teacher Concern,Participation, Differentiation and Organisation.The factor analyses also led to the deletion of asmall number of individual items in theremaining scales. With the deletion of somescales and individual items, a final modified 32-item 4-factor version of the GCEI was produced.
Each of the 32 items in the final version ofthe GCEI was allocated to the same scale as theoriginal version. Also every item had a factorloading greater than 0.30 with its a priori scaleand less than 0.30 with each of the other 3scales.
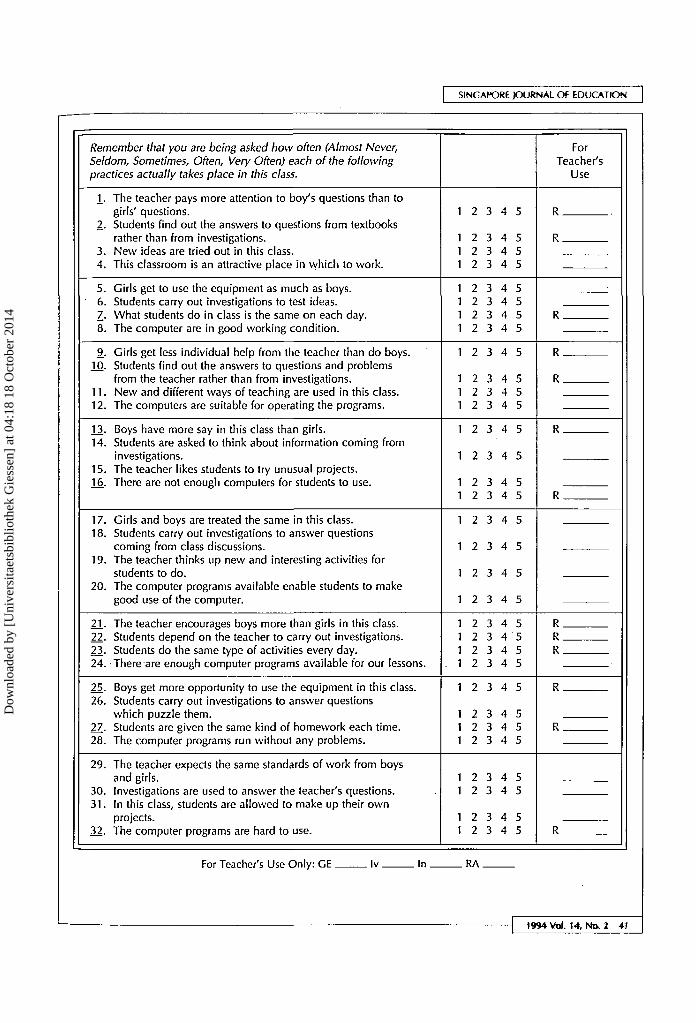
Appendix A contains a copy of the finalversion of the GCEI. The first, second, third andfourth item in each block in Appendix A assesses,respectively, Gender Equity, Investigation,Innovation and Resource Adequacy. The numbercircled represents the score allocated except foritems with R in the for Teacher's Use column;these items are scored in the reverse manner.Items which have been omitted or whoseanswers are invalid are scored as 3.
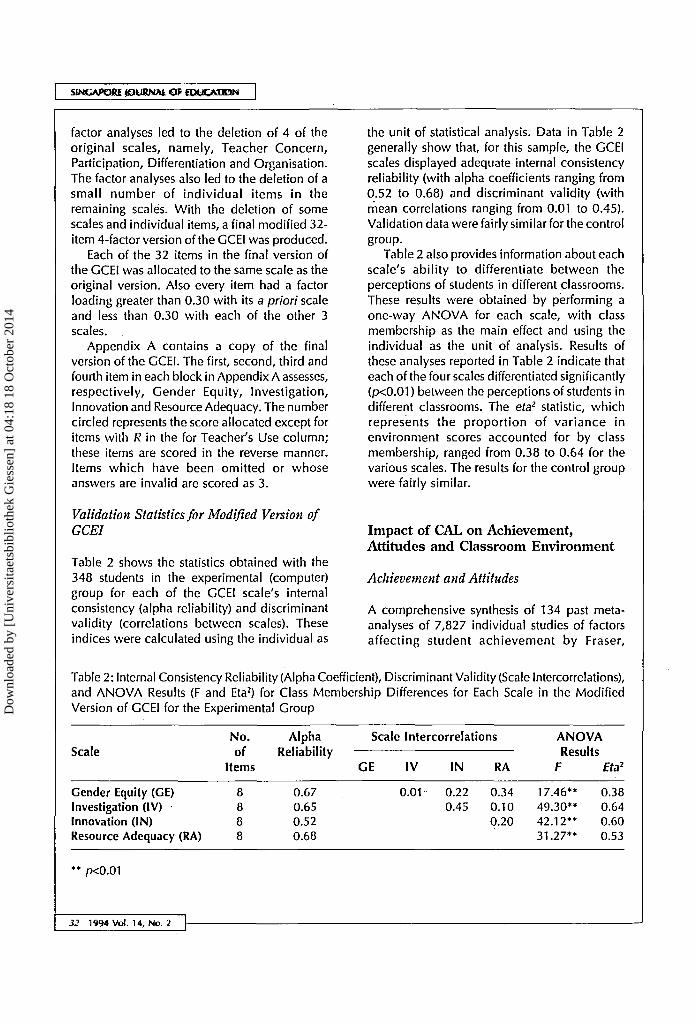
Validation Statistics for Modified Version ofGCEI
Table 2 shows the statistics obtained with the348 students in the experimental (computer)group for each of the GCEI scale's internalconsistency (alpha reliability) and discriminantvalidity (correlations between scales). Theseindices were calculated using the individual as
the unit of statistical analysis. Data in Table 2generally show that, for this sample, the GCEIscales displayed adequate internal consistencyreliability (with alpha coefficients ranging from0.52 to 0.68) and discriminant validity (withmean correlations ranging from 0.01 to 0.45).Validation data were fairly similar for the controlgroup.
Table 2 also provides information about eachscale's ability to differentiate between theperceptions of students in different classrooms.These results were obtained by performing aone-way ANOVA for each scale, with classmembership as the main effect and using theindividual as the unit of analysis. Results ofthese analyses reported in Table 2 indicate thateach of the four scales differentiated significantly(p<0.01) between the perceptions of students indifferent classrooms. The eta2 statistic, whichrepresents the proportion of variance inenvironment scores accounted for by classmembership, ranged from 0.38 to 0.64 for thevarious scales. The results for the control groupwere fairly similar.
Impact of CAL on Achievement,Attitudes and Classroom Environment
Achievement and Attitudes
A comprehensive synthesis of 134 past meta-analyses of 7,827 individual studies of factorsaffecting student achievement by Fraser,
Table 2: Internal Consistency Reliability (Alpha Coefficient), Discriminant Validity (Scale Intercorrelations),and ANOVA Results (F and Eta2) for Class Membership Differences for Each Scale in the ModifiedVersion of GCEI for the Experimental Group
ScaleNo.of
Items
8888
AlphaReliability
0.670.650.520.68
Scale Intercorrelations
GE IV IN RA
ANOVAResults
F Eta2
Gender Equity (GE)Investigation (IV) •Innovation (IN)Resource Adequacy (RA)
0.01 0.220.45
0.340.100.20
17.46**49.30**42.12**31.27**
0.380.640.600.53
p<0.01
32 1994 Vol. 14, No. 2
Dow
nloa
ded
by [
Uni
vers
itaet
sbib
lioth
ek G
iess
en]
at 0
4:18
18
Oct
ober
201
4
I SINGAPORE JOURNAL OF EDUCATION
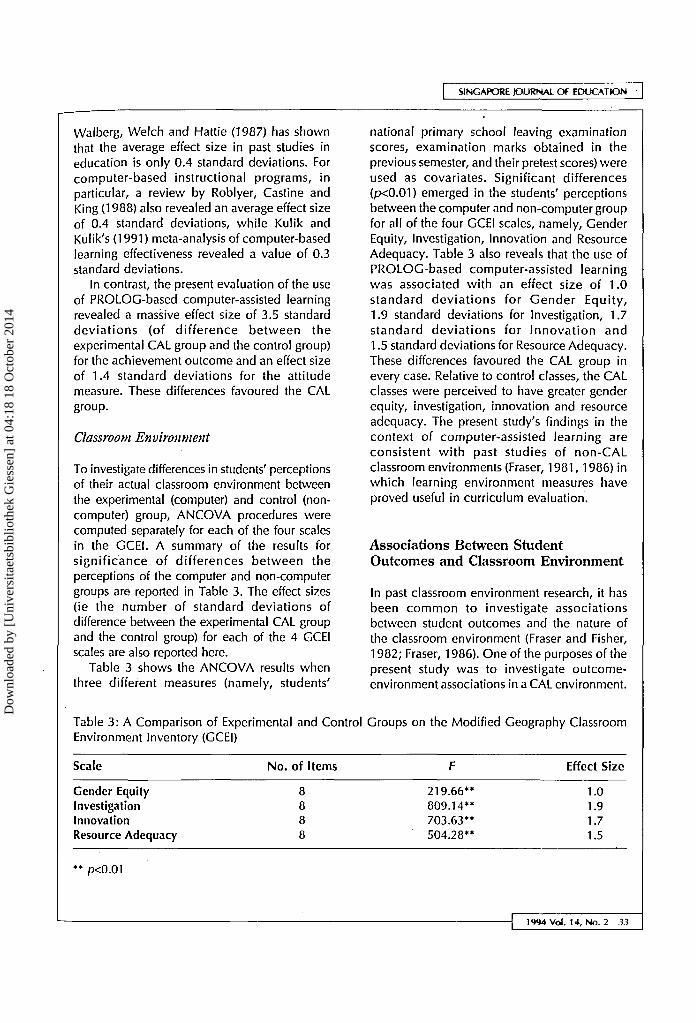
Walberg, Welch and Hattie (1987) has shownthat the average effect size in past studies ineducation is only 0.4 standard deviations. Forcomputer-based instructional programs, inparticular, a review by Roblyer, Castine andKing (1988) also revealed an average effect sizeof 0.4 standard deviations, while Kulik andKulik's (1991) meta-analysis of computer-basedlearning effectiveness revealed a value of 0.3standard deviations.
In contrast, the present evaluation of the useof PROLOG-based computer-assisted learningrevealed a massive effect size of 3.5 standarddeviations (of difference between theexperimental CAL group and the control group)for the achievement outcome and an effect sizeof 1.4 standard deviations for the attitudemeasure. These differences favoured the CALgroup.
Classroom Environment
To investigate differences in students' perceptionsof their actual classroom environment betweenthe experimental (computer) and control (non-computer) group, ANCOVA procedures werecomputed separately for each of the four scalesin the GCEI. A summary of the results forsignificance of differences between theperceptions of the computer and non-computergroups are reported in Table 3. The effect sizes(ie the number of standard deviations ofdifference between the experimental CAL groupand the control group) for each of the 4 GCEIscales are also reported here.
Table 3 shows the ANCOVA results whenthree different measures (namely, students'
national primary school leaving examinationscores, examination marks obtained in theprevious semester, and their pretest scores) wereused as covariates. Significant differences(p<0.01) emerged in the students' perceptionsbetween the computer and non-computer groupfor all of the four GCEI scales, namely, GenderEquity, Investigation, Innovation and ResourceAdequacy. Table 3 also reveals that the use ofPROLOG-based computer-assisted learningwas associated with an effect size of 1.0standard deviations for Gender Equity,1.9 standard deviations for Investigation, 1.7standard deviations for Innovation and1.5 standard deviations for Resource Adequacy.These differences favoured the CAL group inevery case. Relative to control classes, the CALclasses were perceived to have greater genderequity, investigation, innovation and resourceadequacy. The present study's findings in thecontext of computer-assisted learning areconsistent wi th past studies of non-CALclassroom environments (Fraser, 1981,1986) inwhich learning environment measures haveproved useful in curriculum evaluation.
Associations Between StudentOutcomes and Classroom Environment
In past classroom environment research, it hasbeen common to investigate associationsbetween student outcomes and the nature ofthe classroom environment (Fraser and Fisher,1982; Fraser, 1986). One of the purposes of thepresent study was to investigate outcome-environment associations in a CAL environment.
Table 3: A Comparison of Experimental and Control Groups on the Modified Geography ClassroomEnvironment Inventory (GCEI)
Scale No. of Items Effect Size
Gender EquityInvestigationInnovationResource Adequacy
8888
219.66**809.14**703.63**504.28**
1.01.91.71.5
p<0.01
1994 Vol. 14, No. 2 33
Dow
nloa
ded
by [
Uni
vers
itaet
sbib
lioth
ek G
iess
en]
at 0
4:18
18
Oct
ober
201
4
SINGAPORE JOURNAL OF EDUCATION
This involved using data collected for the sampleof 671 geography students to relate their scoreson the geography achievement and attitudeinstruments to scores on the four classroomenvironment scales.
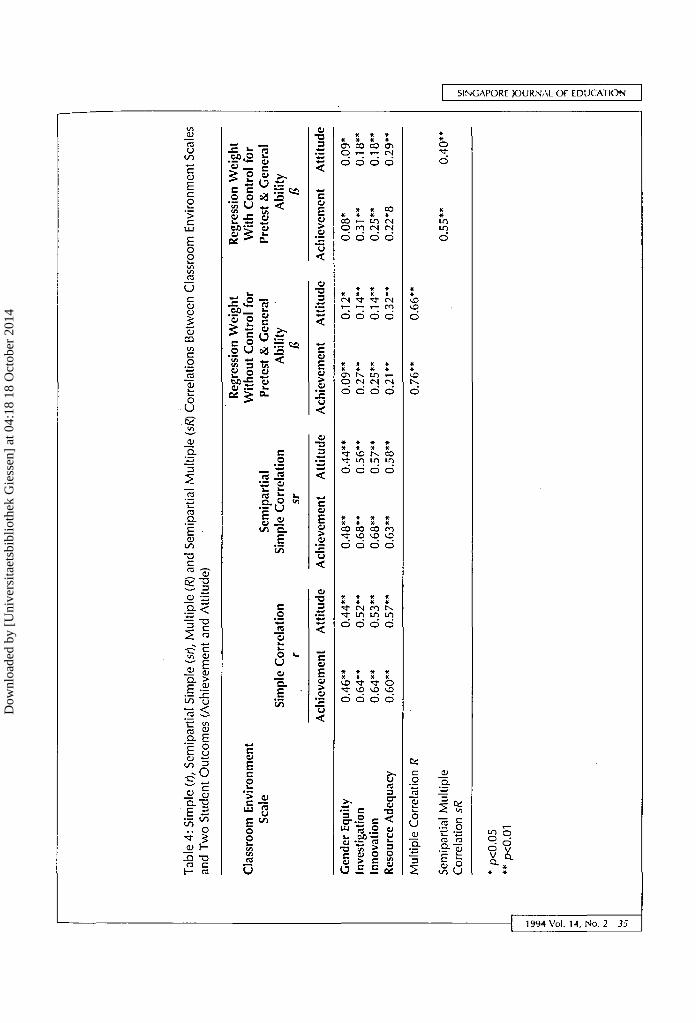
Table 4 reports the results obtained whenoutcome-environment relationships wereinvestigated for the two previously describedoutcomes of achievement (as measured by aGeography Achievement Test) and attitudes(measured by a Semantic Differentialquestionnaire). The four different methods ofdata analysis (involving the use of the individualas the unit of analysis) involved simple,semipartial simple, multiple and semipartialmultiple correlation techniques.
The first type of analysis involved simplecorrelations (r) between an outcome posttestmeasure and each of the four environmentscales, whereas the second type of analysisinvolved the semipartial simple correlationbetween an outcome and each environmentscale with control for corresponding pretest andgeneral ability (assessed by the national primaryschool leaving examination scores and theprevious semester's examination scores).
Past research practice has tended to involvethe performance of a conservative test ofoutcome-environment relationships bystatistically contro l l ing certain studentcharacteristics, especially corresponding pretestand general ability. That is, learning environmentscales have been considered useful predictorsof student learning outcomes only if theyaccounted for different variance from thatattributable to well-established predictors likepretest and general ability (Walberg and Haertel,1980). However, Fraser and Fisher (1982) andFraser (1986) argue that, while conservativeanalyses in which student characteristics arecontrolled have the merit that that they do notoverestimate the variance componentattributable to environment, they might wellunderestimate the importance of theenvironment component because any varianceshared by environment and studentcharacteristics is removed. Hence, the simplecorrelation analysis was computed twice, oncewithout adjustment for corresponding pretest
and general ability and once with adjustmentfor pretest and general ability.
The results in Table 4 show that outcome-environment associations were all significant(p<0.01) for both the simple and semipartialsimple correlation analyses for both theachievement and attitude outcome. A l lsignificant outcome-environment relationshipswere positive. The interpretation of thesesignificant correlations was that greater levels ofthese environment scales were associated withhigher achievement in geography and morepositive attitudes.
The third type of analysis reported in Table 4consists of a multiple correlation analysis (/?)involving the whole set of four classroomenvironment scales and performed for eachoutcome. The multiple correlation analysisprovides a more parsimonious picture of thejoint influence of correlated environment scaleson an outcome and reduces the Type I error rateassociated with the simple correlational analyses.The multiple correlation was found to be 0.76(p<0.01) for the achievement outcome and 0.66(p<0.01) for the attitude outcome. Anexamination of the beta weights (B) (ie, thestandardised regression weights) in Table 4shows that all the environment scales wererelated significantly and positively to both theachievement outcome and the attitude outcomewhen the other three environment scales wereheld constant.
The last line in Table 4 reports the results ofthe fourth type of analyses, namely, a semipartialmultiple correlation analysis between anoutcome and the set of environment scales withpretest and general ability controlled. Significantsemipartial multiple correlations of 0.55 (p<0.01)for achievement and 0.40 (p<0.01) for attitudewere found. The square of the semipartialmultiple correlation (sR) is equal to theproportion of variance in an outcome measureuniquely attributable to the set of GCEI scalesbeyond that accounted for by pretest and generalability scores (Cohen and Cohen, 1983). It canbe concluded that the set of 4 GCEI scales as awhole accounted for a significant amount ofvariance in the achievement outcome measure.
The beta weights in Table 4 suggest the
34 1994 Vol. 14, No. 2
Dow
nloa
ded
by [
Uni
vers
itaet
sbib
lioth
ek G
iess
en]
at 0
4:18
18
Oct
ober
201
4
Tab
le 4
: Sim
ple
(r),
Sem
ipar
tial
Sim
ple
(sr)
, M
ulti
ple
(R
) and
Sem
ipar
tial
Mu
ltip
le (
sR) C
orre
latio
ns B
etw
een
Cla
ssro
om E
nviro
nmen
t S
cale
san
d T
wo
Stu
dent
Out
com
es (
Ach
ieve
men
t an
d A
ttitu
de)
Cla
ssro
om
E
nvi
ron
men
tS
cale
Gen
der
Eq
uity
Inve
stig
atio
nIn
no
vati
on
Res
ourc
e A
deq
uac
y
Mul
tiple
Cor
rela
tion
R
Sem
ipar
tial
Mul
tiple
Cor
rela
tion
sR
* p<
0.05
** p
<0.0
1
Sim
ple
Co
rrel
atio
nr
Ach
ieve
men
t
0.46
**0.
64**
0.64
**0.
60**
Att
itu
de
0.44
**0.
52**
0.53
**0.
57**
Sem
ipar
tial
Sim
ple
Co
rrel
atio
nsr
Ach
ieve
men
t A
ttit
ud
e
0.48
**
0.44
**0.
68**
0.
56**
0.68
**
0.57
**0.
63**
0.
58**
Reg
ress
ion
Wei
gh
tW
ith
ou
t C
on
tro
l fo
rP
rete
st &
Gen
eral
Ab
ility e,
Ach
ieve
men
t A
ttit
ud
e
0.09
**
0.12
*0.
27**
0.
14**
0.25
**
0.14
**0.
21**
0.
32**
0.76
**
0.66
**
Reg
ress
ion
Wei
gh
tW
ith
Con
trol
for
Pre
test
& G
ener
alA
bili
tyli
Ach
ieve
men
t A
ttit
ud
e
0.08
* 0.
09*
0.31
**
0.18
**0.
25**
0.
18**
0.22
*8
0.29
**
0.55
**
0.40
**
q n
Dow
nloa
ded
by [
Uni
vers
itaet
sbib
lioth
ek G
iess
en]
at 0
4:18
18
Oct
ober
201
4
[ SINGAPORE JOURNAL OF EDUCATION
following interpretations for the significantoutcome-environment relationships from boththe multiple and semipartial multiple correlationanalyses: both geography achievement andattitude scores were higher in classes perceivedto practise more gender equity, to give moreemphasis to investigation, to be more innovativeand to have more adequate resources.
On the whole, the results of the differenttypes of analyses reported in Table 4 establishsizeable and statistically significant associationsbetween both achievement and attitude outcomeand students' perceptions of their CAL classroomenvironment. This relationship found betweenstudent outcome and classroom environment isconsistent with past research reported by Fraser(1986, 1991, 1993) and Fraser, McRobbie andGiddings(1993).
Discussion
The study's focus on the learning environmentassociated with the use of computer-assistedlearning in school geography education inSingapore is distinctive because, first, the use ofCAL in geography education has been sparserelative to other disciplines, second, researchon CAL in geography education in Singaporehitherto has been non-existent and third, only avery small amount of classroom environmentresearch has previously been undertaken inSingapore. In addition, the present researchextended learning environment work in a newdirection by developing and using a newinstrument for assessing student perceptions ofCAL classroom environments.
This study shows that appropriately-designedPROLOG-based CAL can be an effectiveinstructional method in the classroom milieu. Italso shows that the educational application ofmicro-PROLOG as a learning tool in socialscience classrooms can be efficacious. While amyriad of studies have examined the effects ofCAL, the number of studies examining the effectof PROLOG-based CAL is meagre at best.Hopefully, this study will serve as a catalyst forfurther research into the use of PROLOG in theclassroom.
No systematic attempts have previously beenmade to examine the effects of CAL on learningenvironment characteristics. Little has beenstudied or is known about the impact ofmicrocomputers on learning climates ineducation (Ellett, 1986). This study responds tothe plea by Ellett (1986) and Lancy (1987) to fillthe lacunae represented by the study ofcomputers and their impact on students. Thisstudy is significant because, in contrast toprevious research, it uses PROLOG-basedcourseware developed by the investigators inassessing computer learning environments inschools.
One of the study's major contributions wasthat a new classroom environment instrumentwas developed and validated specifically forthe unique setting of computer-assisted learning.The scales in this- instrument were found todisplay adequate factorial validity, internalconsistency reliability and discriminant validity.Also, each scale differentiated significantlybetween the perceptions of students in differentclassrooms. It is likely that other researchersmay find this new instrument useful in futurestudies of CAL classroom environments.
Another major finding was that, in contrastto past research, the use of CAL in this study ledto a massive impact in terms of achievement(effect size of 3.5 standard deviations), attitude(1.4 standard deviations) and classroomenvironment (ranging from 1.0 to 1.9 standarddeviations). The large effect sizes arising fromthis study could be attributed to the peculiarsituation inherent in the Singapore educationsystem. That is, the highly meritocratic,technologically-biased, centrally-controlled andachievement-oriented system propels studentsto perform well. The large effect sizes couldalso be attributable to the PROLOG-based CALcourseware developed for this study. This CALcourseware took cognisance of the curriculumobjectives of the schools, the prerequisites offollowing the exact curriculum topics, and theintegration of the courseware with the syllabusrequirements of the schools. The large effectsizes seem to suggest that appropriate computer-based teaching is effective with low aptitudestudents (ie the Normal students). This finding is
36 1994 Vol. 14, No. 2
Dow
nloa
ded
by [
Uni
vers
itaet
sbib
lioth
ek G
iess
en]
at 0
4:18
18
Oct
ober
201
4
SINGAPORE JOURNAL OF EDUCATION
consistent with the meta-analysis of CALeffectiveness reviewed by Kulik and Kulik (1991).But there is a need for replication and furtherrelated research because of the uniqueness ofthe Singapore milieu.
An investigation of associations betweenstudent outcomes and the nature of theclassroom environment replicated past researchin that both achievement and attitudes wereenhanced in classes providing a more positiveenvironment in terms of all of the dimensionsassessed (namely, gender equify, innovation,investigation and resource adequacy). .
There is considerable scope to make use ofthe new instrument for computer-assistedlearning environments in replicating the presentevaluation of innovations in CAL and the presentinvestigation of the effects of CAL classroom
environments on student outcomes. In addition,it is hoped that researchers will make use of thenew questionnaire specifically in CAL settingsin pursuing some of the other lines of classroomenvironment research reviewed by Fraser (1993).These include the use of classroom environmentresearch in school psychology (Burden andFraser, in press), person-environment fitinvestigations of whether students achieve betterin their preferred classroom environment (Fraserand Fisher, 1983), practical attempts to improvethe classroom setting (Fraser and Fisher 1986),studies of links between classroom-level andschool-level climate (Fisher and Fraser, in press)and research which combines qualitative andquantitative methods in the study of learningenvironments (Fraser and Tobin, 1991).
REFERENCES
Anderson, G. J. & Walberg, H. J. (1972). Class size and the social environment of learning: A mixedreplication and extension. Alberta Journal of Educational Research, 18, 277-286.
Boyd, B. O. (1990). Schools' computing policy as state-directed innovation. Educational Studies, 16(2),169-185.
Burden, R. L. & Fraser B. J. (in press). Use of classroom environment assessments in school psychology:A British perspective. Psychology in the Schools.
Chalk, P. (1987). PROLOG-based computer-aided learning environments. Programmed Learning andEducational Technology, 24(2), 102-107.
Cohen, J. & Cohen, P. (1983). Applied Multiple Regression/Correlation for the Behavioral Sciences (2nded.). Hillsdale, NJ: Lawrence Erlbaum.
Ellett, C. D. (1986). Conceptualizing the study of learing environments. In B. J. Fraser (Ed.), The Study ofLearning Environments (pp 34-40). Salem, OR: Assessment Research.
Ely, D. P. (1990). Conditions that facilitate the implementation of educational technology innovations.Journal of Research on Computing in Education, 23(2), 298-305.
Fisher, D. L. & Fraser, B. J. (1983). A comparison of actual and preferred classroom environment asperceived by science teachers and students. Journal of Research in Science Teaching, 20, 55-61.
Fisher, D. L. & Fraser, B. J. (in press). Interpersonal teacher behavior style and school environment. In Th.Wubbels & J. Levy (Eds.), Do You Know What You Look Like: Interpersonal Relationships InEducation. London: Falmer Press.
Fraser, B. J. (1981). Learning Environment in Curriculum Evaluation: A Review. Evaluation in education:An international review series. Oxford, England: Pergamon Press.
Fraser, B. J. (1986). Classroom Environment. London: Croom Helm.
- | 1994 Vol. 14, No. 2 37
Dow
nloa
ded
by [
Uni
vers
itaet
sbib
lioth
ek G
iess
en]
at 0
4:18
18
Oct
ober
201
4
SINGAPORE JOURNAL OF EDUCATION
Fraser, B. J. (1990). Individualised classroom environment questionnaire. Melbourne: Australian Councilfor Educational Research.
Fraser, B. J. (1991). Two decades of classroom environment research. In B. J. Fraser & H. J. Walberg(Eds.), Educational Environments: Evaluation, Antecedents and Consequences (pp 3-27). Oxford,England: Pergamon Press.
Fraser, B. J. (1993). Classroom and school climate. In D. Gabel (Ed.), Handbook of Research on ScienceTeaching and Learning. New York: Macmillan. (in press)
Fraser, B. J. & Fisher, D. L. (1982). Predicting students' outcomes from their perceptions of classroompsychosocial environment. American Educational Research Journal, 19, 498-518.
Fraser, B. J. & Fisher, D. L. (1983). Student achievement as a function of person-environment fit: Aregression surface analysis. British Journal of Educational Psychology, 53, 89-99.
Fraser, B. J. & Fisher, D. L. (1986). Using short forms of classroom climate instruments to assess andimprove classroom psychosocial environment. Journal of Research in Science Teaching, 23, 387-413.
Fraser, B. J., McRobbie, C. J. & Giddings, G. J. (1993). Development and cross-national validation of alaboratory classroom environment instrument for senior high school science. Science Education, 77,1-24.
Fraser, B. J. & Tobin, K. (1991). Combining qualitative and quantitative methods in classroomenvironment research. In B. J. Fraser and H. J. Walberg (Eds.), Educational Environments: Evaluation,Antecedents and Consequences (pp 271-292). Oxford, England: Pergamon Press.
Fraser, B. J. & Walberg, H. J. (1991). (Eds.). Educational environments: Evaluation, antecedents andconsequences. Oxford, England: Pergamon Press.
Fraser, B. J. Waiberg, H. J., Welch, W. W. & Hattie, J. A. (1987). Syntheses of educational productivityresearch. International Journal of Educational Research, 11, 145-252. (whole issue)
Gonce-Winder, C. & Walbesser, H. H. (1987). Toward quality software. Contemporary EducationalPsychology, 12, 261-268.
Haertel, G. D., Walberg, H. J. & Haertel, E. H. (1981). Socio-psychological environments and learning: A.quantitative synthesis, British Educational Research Journal, 7, 17-36.
Hattie, J. & Fitzgerald, D. (1987). Sex differences in attitudes, achievement and use of computers.Australian Journal of Education, 31(1), 3-26.
Heywood, G. & Norman, P. (1988). Problems of educational innovation: The primary teacher's responseto using the microcomputer. Journal of Computer-Assisted Learning, 4(1), 34-43.
Kulik, C. C. & Kulik, J. A. (1991). Effectiveness of computer-based instruction: An updated analysis.Computers in Human Behavior, 7(1-2), 75-94.
Lancy, D. F. (1987). The message is the medium: Studies of computer learning environments in schools.In B. J. Fraser (Ed.), The Study Of Learning Environments, Volume 2 (pp 64-71). Perth: CurtinUniversity.
Lawrenz, F. P. (1987). Gender effects for student perceptions of the classroom psychosocial environment.Journal of Research in Science Teaching, 24, 689-697.
38 1994 Vol. 14, No. 2
Dow
nloa
ded
by [
Uni
vers
itaet
sbib
lioth
ek G
iess
en]
at 0
4:18
18
Oct
ober
201
4
SINGAPORE JOURNAL OF EDUCATION
Low, K. G. (1988). Investigation of various modes of computer-based learning for secondary schools.Singapore Journal of Education, 9(2), 27-32.
MacCregor, S. K. (1986). Research issues in computer-assisted learning environments. In B. J. Fraser (Ed.),The Study of Learning Environments (pp 63-68). Salem, OR: Assessment Research.
Moos, R. H. (1974). The Social Climate Scales: An Overview. Palo Alto, CA: Consulting PsychologistsPress.
Moos, R. H. & Trickett, E. J. (1987). Classroom Environment Scale Manual (2nd ed.). Palo Alto, CA:Consulting Psychologists Press.
OECD-CERI (Organisation for Economic Cooperation and Development Centre for Educational Researchand Innovation) (1989). Information Technologies in Education: The Quest for Quality Software.Paris: OECD.
Ong, S. T. & Lee-Leek, M. K. (1986). The effects of computer-assisted instruction on attitudes andachievement in mathematics on preservice primary school teachers. Selected Proceedings ofEducomp '86: Impact of Microcomputers in Education - Issues and Techniques (pp 196-201).Singapore: Ngee Ann Polytechnic.
Plomp, T. & Pelgrum, W. J. (1991). Introduction of computers in education: State of the art in eightcountries. Computers and Education, 17(3), 249-258.
Roblyer, M. D., Castine, W. H. & King, F. J. (1988). Assessing the impact of computer-based instruction:A review of recent research. Computers in the Schools, 5(3/4), 1-149.
Sutton, R. E. (1991). Equity and computers in the schools: A decade of research. Review of EducationalResearch, 61(4), 475-503.
Tamir, P. & Caridin, H. (1993). Characteristics of the learning environment in biology and chemistryclasses as perceived by Jewish and Arab high school students in Israel. Research in Science andTechnological Education, 11,5-14.
Tolman, M. N. & Allred, R. A. (1991). The Computer and Education. What Research Says to the Teacher(2nd ed.). Washington, DC: National Education Association. (ERIC ED 335 344)
Trickett, E. J. (1978). Toward a social-ecological conception of adolescent socialization: Normative dataon contrasting types of public school classrooms. Child Development, 49, 408^114.
Walberg, H. J. & Haertel, C. D. (1980). Validity and use of educational environment assessments. Studiesin Educational Evaluation, 6, 225-238.
Welch, W. W. (1979). Curricular and longitudinal effects on learning environments. In H. J. Walberg(Ed.), Educational Environments and Effects: Evaluation, Policy and Productivity (pp 167-179).Berkley, CA: McCutchan.
Welch, W. W. & Walberg, H. J. (1972). A national experiment in curriculum evaluation. AmericanEducational Research Journal, 9, 373-383.
Wong, K. Y., Lim, Y. S. & Low, K. G. (1989). SEAMEO-RECSAM computers in education project: Countryreport- Singapore. Penang, Malaysia: Regional Centre for Education in Science and Mathematics(RECSAM).
Woo-Tan, L. B. (1989). Effects of computer-assisted instruction on the learning of transformationgeometry. Unpublished Master's dissertation, National University of Singapore, Singapore.
1994 Vol. 14, No. 2 39
Dow
nloa
ded
by [
Uni
vers
itaet
sbib
lioth
ek G
iess
en]
at 0
4:18
18
Oct
ober
201
4
SINGAPORE JOURNAL OF EDUCATION
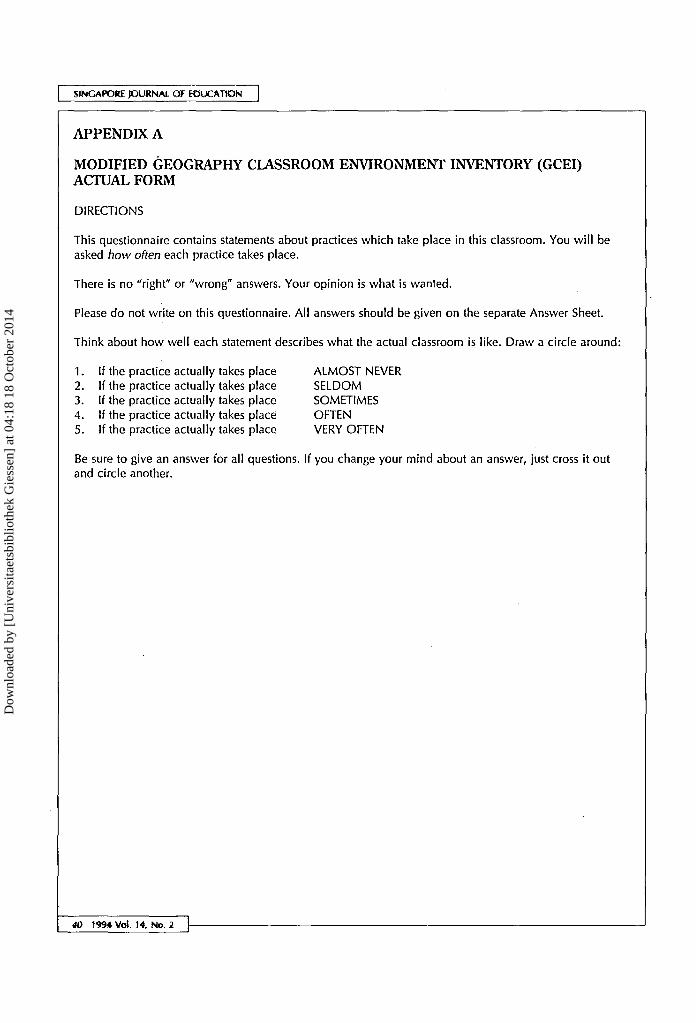
APPENDIX A
MODIFIED GEOGRAPHY CLASSROOM ENVIRONMENT INVENTORY (GCEI)ACTUAL FORM
DIRECTIONS
This questionnaire contains statements about practices which take place in this classroom. You will beasked how often each practice takes place.
There is no "right" or "wrong" answers. Your opinion is what is wanted.
Please do not write on this questionnaire. All answers should be given on the separate Answer Sheet.
Think about how well each statement describes what the actual classroom is like. Draw a circle around:
1. If the practice actually takes place ALMOST NEVER2. If the practice actually takes place SELDOM3. If the practice actually takes place SOMETIMES4. If the practice actually takes place OFTEN5. If the practice actually takes place VERY OFTEN
Be sure to give an answer for all questions. If you change your mind about an answer, just cross it outand circle another.
40 1994 Vol. 14, No. 2
Dow
nloa
ded
by [
Uni
vers
itaet
sbib
lioth
ek G
iess
en]
at 0
4:18
18
Oct
ober
201
4
SINGAPORE JOURNAL OF EDUCATION
Remember that you are being asked how often (Almost Never,Seldom, Sometimes, Often, Very Often) each of the followingpractices actually takes place in this class.
1_. The teacher pays more attention to boy's questions than togirls' questions.
2. Students find out the answers to questions from textbooksrather than from investigations.
3. New ideas are tried out in this class.4. This classroom is an attractive place in which to work.
5. Girls get to use the equipment as much as boys.6. Students carry out investigations to test ideas.7. What students do in class is the same on each day.8. The computer are in good working condition.
9. Girls get less individual help from the teacher than do boys.10. Students find out the answers to questions and problems
from the teacher rather than from investigations.11. New and different ways of teaching are used in this class.12. The computers are suitable for operating the programs.
13. Boys have more say in this class than girls.14. Students are asked to think about information coming from
investigations.15. The teacher likes students to try unusual projects.16. There are not enough computers for students to use.
17. Girls and boys are treated the same in this class.18. Students carry out investigations to answer questions
coming from class discussions.19. The teacher thinks up new and interesting activities for
students to do.20. The computer programs available enable students to make
good use of the computer.
21. The teacher encourages boys more than girls in this class.22. Students depend on the teacher to carry out investigations.23. Students do the same type of activities every day.24. There are enough computer programs available for our lessons.
25. Boys get more opportunity to use the equipment in this class.26. Students carry out investigations to answer questions
which puzzle them.27. Students are given the same kind of homework each time.28. The computer programs run without any problems.
29. The teacher expects the same standards of work from boysand girls.
30. Investigations are used to answer the teacher's questions.31. In this class, students are allowed to make up their own
projects.32. The computer programs are hard to use.
1 2 3 4 5
1 2 3 4 51 2 3 4 51 2 3 4 5
1 2 3 4 51 2 3 4 51 2 3 4 51 2 3 4 5
1 2 3 4 5
1 2 3 4 51 2 3 4 51 2 3 4 5
1 2 3 4 5
1 2 3 4 5
1 2 3 4 51 2 3 4 5
1 2 3 4 5
1 2 3 4 5
1 2 3 4 5
1 2 3 4 5
1 2 3 4 51 2 3 4 51 2 3 4 5
. 1 2 3 4 5
1 2 3 4 5
1 2 3 4 51 2 3 4 51 2 3 4 5
1 2 3 4 51 2 3 4 5
1 2 3 4 51 2 3 4 5
ForTeacher's
Use
R
R
R
R
R
R
R
R
R
R
R
R
R
For Teacher's Use Only: GE . . Iv. . In . . RA.
1994 Vol. 14, No. 2 41
Dow
nloa
ded
by [
Uni
vers
itaet
sbib
lioth
ek G
iess
en]
at 0
4:18
18
Oct
ober
201
4