a study of investor behavior on investment …tarj.in/images/download/ajmmr/ajmmr september 2012...
TRANSCRIPT

TRANS Asian Research Journals
http://www.tarj.in 49
A Publication of TRANS Asian Research Journals
TAJMMR TRANS Asian Journal of Marketing & Management Research
Vol.1 Issue 1, September 2012, ISSN (online) …….
A STUDY OF INVESTOR BEHAVIOR ON INVESTMENT AVENUES IN
MUMBAI FENIL
BRAHMABHATT*; P.S RAGHU KUMARI**; DR. SHAMIRA MALEKAR***
*Student,
Aruna Manharlal Shah Institute of Management and Research
Mumbai University, Mumbai, India.
**Assistant Professor,
Aruna Manharlal Shah Institute of Management and Research,
Mumbai University, Mumbai, India.
***Assistant Professor,
Aruna Manharlal Shah‟s Institute of Management and Research,
Mumbai University, Mumbai, India.
ABSTRACT
This is a project about the study of the analysis is to determine the investment
behavior of investors and investment preferences for the same. The kind of volatility
we witnessed in the asset class (Equity markets) in recent times is unprecedented. It
is true with other asset classes like Gold, Currencies, and Bonds as well. This leaves
the investor baffled at times. If we get into further details, it can be finding that the
continuous volatility is affecting investor behavior in a big way. Therefore, one has
to get into an investor’s mind and experience the upheavals going on there.
In earlier times investor had the option of investing in plain vanilla Bank Deposits,
Government Bonds, Post Office schemes like NSC, Indira Vikas Patra, Kisan Vikas
Patra and Monthly Income Schemes. If he wanted exposure in real estate, he was
buying land primarily. He bought gold mainly for his personal use on occasions like
festival, marriage and never seriously thought of it as an asset class.
The purpose of the analysis is to determine the investment behavior of investors and
investment preferences for the same. Investor’s perception will provide a way to
accurately measure how the investors think about the products and services provided
by the company. Today’s trying economic conditions have forced difficult decision
for companies. Most are making conservative decisions that reflect a survival mode
in the business operation. During these difficult times, understanding what investors
on an ongoing basis is critical for survival. Executives need a third party
understanding on where investor’s loyalties stand.
KEYWORDS: Ability of investment decision, Investors optimism, Investors effort,
Risk appetite, investor’s behavior.
___________________________________________________________________________
TRANS Asian Research Journals
http://www.tarj.in 50
A Publication of TRANS Asian Research Journals
TAJMMR TRANS Asian Journal of Marketing & Management Research
Vol.1 Issue 1, September 2012, ISSN (online) …….
1. INTRODUCTION
In today‟s scenario there has been a major change i.e. economic prosperity all over. The entire
world is talking about the robust growth rates in this part of the world. Higher income levels and
booming stock markets have led to more and more numbers of high net worth investors (HNIs).
This means the availability of huge investible surplus. The investors with higher risk appetite
want to experiment and try new and exotic products in the name of diversification. This has
resulted in emergence of new options within the same or fresh asset classes. There are more
products available within each asset class be it Equity, Mutual Fund, Gold, Real Estate.
The common perception of investors is to buy when the market supports in uptrend and not to
invest in the falling time. They wait for the stabilization in the market; so in this research, we
would like to draw a clear picture on the trends of traders and investors. Markets have
personalities because investors have emotions. Markets are ultimately driven by people and stock
prices are what individuals make them out to be. People have a tendency to see their own actions
and decisions as totally rational, when the truth is they may not be.
Key points on investor behaviors:
• Investments are often thought of as pieces of paper rather than part ownership of a company.
• Investors are often impatient to sell a good stock.
• Investors often make a distinction between money easily made from investments, savings or tax
refunds and hard-earned money – found money is more readily spent or wasted.
• People tend to think in extremes – the highly probable news is considered certain, while the
improbable is considered impossible.
• Investors often take a short-term viewpoint. Recent market losses lead to suspicion and caution,
while recent gains lead to action.
• Investors may overestimate their skills; attributing success to ability they don‟t possess and
seeing order in information or data where it doesn‟t exist.
• Investors follow the crowd, and are heavily influenced by other investors or compelling news;
they fail to check out the real facts.
• Investors become obsessed with prices and trend-watching, rather than solid information.
Taken as a whole, these psychologies really have only one effect, that is - a financial decision is
taken that lacks accuracy. And these errors are strongest when uncertainty, inexperience,
attitudes and market pressures come together to undermine decision-making ability. Each person

TRANS Asian Research Journals
http://www.tarj.in 51
A Publication of TRANS Asian Research Journals
TAJMMR TRANS Asian Journal of Marketing & Management Research
Vol.1 Issue 1, September 2012, ISSN (online) …….
has his own personal psychology and response style. There are three elements that comprise the
essence of success theory:
• The way in which, we as investors deal with loss and failure is just as important, if not more
important, than the way in which we deal with success.
• Effectively controlling and channeling emotions are two very important issues in the equation
for success.
• Those successful continue to be successful as investors, recognize the importance of market
psychology and incorporate it in their work to a certain extent.
Success will tend to take care of itself, if one provides the proper psychological and behavioral
background for it to occur. Goals are wonderful, without them we would be lost. Yet, the road to
success must be paved with behavior, attitude, opinions and visualization. To be successful as an
investor, one needs to develop and maintain similar attitudes, behaviors and opinions.
The main objective of the study was to find out the need of the current and future investors and
to study on investors behavior. The purpose of the analysis is to determine the investment
behavior of investors and investment preferences for the same. Investor‟s perception will provide
a way to accurately measure how the investors think about the products and services provided by
the company. Today‟s trying economic conditions have forced difficult decision for companies.
Most are making conservative decisions that reflect a survival mode in the business operation.
During these difficult times, understanding what investors on an ongoing basis is critical for
survival. Executives need a third party understanding on where investor‟s loyalties stand.
The objective of the study is briefly discussed below:
To understand in depth about different investment avenues available in market.
To understand the pattern of the investors at the time of investing.
To find out the factors that investors consider before investment.
This study will help in gaining a better understanding of what an investors look for in an
investment option. The study could also be used by the financial sector in designing better
financial instrument customized to suit the need of the investors.
2. LITERATURE REVIEW
Many Organizations and individuals conducted several studies on the various aspects of the
capital markets in the past. These studies were mainly related to various instruments of capital
market, shareholding pattern, new issue market and scope, market efficiency, risk and return,
performance and regulation of mutual funds. However, not much of research was done on
investment patterns and investor‟s perceptions. Hence an attempt is made to review some of the
studies relevant to the topic in order to get into in depth details of the chosen study. Jaakko
TRANS Asian Research Journals
http://www.tarj.in 52
A Publication of TRANS Asian Research Journals
TAJMMR TRANS Asian Journal of Marketing & Management Research
Vol.1 Issue 1, September 2012, ISSN (online) …….
(2011) study revealed that most investors had affected based extra motivation to invest in stock,
over and beyond financial return expectations. Zaghlami (2009) study revealed that some
psychological particularities that are not expected by the financial behavioral literature, the study
was conducted on Tunisian investors. Mahendra (2008) study stated that irrational investment
decision making is a widespread phenomenon. They study the perils of irrational decision-
making in investments choice which finally can lead to great risk. Verma, (2008) identified the
demographic profile and investor personality can be the two determinants for making perception
about the investor psychology, which if scientifically studied could help the Wealth Management
professionals to advice their clients better. Commins (2009) in their article discussed the
hedonistic psychology of investors. It cites that the pursuit of happiness becomes hedonistic
when people want to get the most of their investment and gaining wealth is no longer confining
that one becomes overly materialistic.
The study conducted by SCMRD for Ministry of Company affairs (2004) found that majority of
the retail investors do not regard mutual fund equity schemes as a superior investment compared
to direct equity. Kent (19998) developed a theory of securities market under- and overreactions
based on two well-known psychological biases: investor overconfidence about the precision of
private information; and biased self-attribution, which causes asymmetric shifts in investors'
confidence as a function of their investment outcomes. SEBI (1998) survey revealed that Risk
appetite, investment objective of the investor,, income of the investor, funds available for
investment, greatly influences the behavior of the investor in corporate securities at various
levels.
The Institute of company secretaries of India in its Investor Education series III entitled,
“Investment Decision making by a Lay Investor‟ (1991) explained the preconditions for
investment decision making, analysis and evaluating risks.
3. RESEARCH DESIGN
A research design must contain the clear statement of the research problem, procedures and
techniques for gathering information, the population to be studied and the methods used in
processing and analyzing data (Kothari, 1999).
The research used in this study is Exploratory Research. Exploratory research provides insights
into and comprehension of an issue or situation. It should draw definitive conclusions only with
extreme caution. Exploratory research is a type of research conducted because a problem has not
been clearly defined. Exploratory research helps determine the best research design, data
collection method and selection of subjects. Given its fundamental nature, exploratory research
often concludes that a perceived problem does not actually exist.
3.1 DESIGN OF QUESTIONNAIRE
A questionnaire is a reformulated written set of questions to which respondents record their
answers, usually within rather closely defined alternatives. Biases in research can be minimized
if a questionnaire focuses on three areas: the wording of questions, general appearance of
questionnaire and planning of issues of how the variables will be categorized, scaled and coded
TRANS Asian Research Journals
http://www.tarj.in 53
A Publication of TRANS Asian Research Journals
TAJMMR TRANS Asian Journal of Marketing & Management Research
Vol.1 Issue 1, September 2012, ISSN (online) …….
after receipt of the responses. It is important to conduct a thorough measurement analysis on
survey instrument, which is used for research. Measurement analysis provides the audience with
assurance that the findings reflect accurate measures and the results are believable.
Questionnaires are an efficient data collection mechanism when the researcher knows exactly
what is required and how to measure the variables of interest (Sekaran, 2007). A questionnaire is
a reformulated written set of questions to which respondents record their answers, usually within
rather closely defined alternatives. Biases in research can be minimized if a questionnaire
focuses on three areas: the wording of questions, general appearance of questionnaire and
planning of issues of how the variables will be categorized, scaled and coded after receipt of the
responses. It is important to conduct a thorough measurement analysis on survey instrument,
which is used for research. Measurement analysis provides the audience with assurance that the
findings reflect accurate measures and the results are believable.
3.1.1 RELEVANCE
To be successful, questionnaire should be short and simple (Kothari, 1999). Questions should
proceed in a logical sequence moving from easy to more difficult ones. Technical terms and
expression with numerous interpretations should be avoided. Reliable and valid instrument
provides practitioners with a tool for self-assessment and continuous improvement.
Questionnaire approval
The purpose of Questionnaire approvals:
i. To establish the most appropriate questions.
ii. To check whether the questions asked in the questionnaire are easy to understand
iii. To ascertain the effectiveness of the measuring instrument.
3.2 SAMPLING DESIGN
A sampling frame is closely related to the population. A sample is a part of population, which is
selected for obtaining the necessary information.
Methods are classified as either probability or non-probability. In probability samples, each
member of the population has a known non-zero probability of being selected. Probability
methods include random sampling, systematic sampling, and stratified sampling. In non-
probability sampling, members are selected from the population in some non-random manner.
These include convenience sampling, judgment sampling, quota sampling, and snowball
sampling. The advantage of probability sampling is that sampling error can be calculated.
Sampling error is the degree to which a sample might differ from the population. When inferring
to the population, results are reported plus or minus the sampling error. In non-probability
sampling, the degree to which the sample differs from the population remains unknown.
The sample size for this research was 100 investors.

TRANS Asian Research Journals
http://www.tarj.in 54
A Publication of TRANS Asian Research Journals
TAJMMR TRANS Asian Journal of Marketing & Management Research
Vol.1 Issue 1, September 2012, ISSN (online) …….

TRANS Asian Research Journals
http://www.tarj.in 55
A Publication of TRANS Asian Research Journals
TAJMMR TRANS Asian Journal of Marketing & Management Research
Vol.1 Issue 1, September 2012, ISSN (online) …….
3.3 COLLECTION OF DATA
Data Collection helps the team to assess the health of the process. To do so, one must identify the
key quality characteristics one will measure. Data Collection enables a team to formulate and test
working assumptions about a process and develop information that will lead to the improvement
of the key quality characteristics of the product or service. Data Collection improves the
decision-making by helping oneself focus on objective information about what is happening in
the process, rather than subjective opinions. Data collection has been done through Primary Data,
which was done by personal Interviews with the investors.
4. ANALYSIS OF DATA
Analysis of data is a process of inspecting, cleaning, transforming, and modeling data with the
goal of highlighting useful information, suggesting conclusions, and supporting decision making.
Data analysis has multiple facets and approaches, encompassing diverse techniques under a
variety of names, in different business, science, and social science domains.
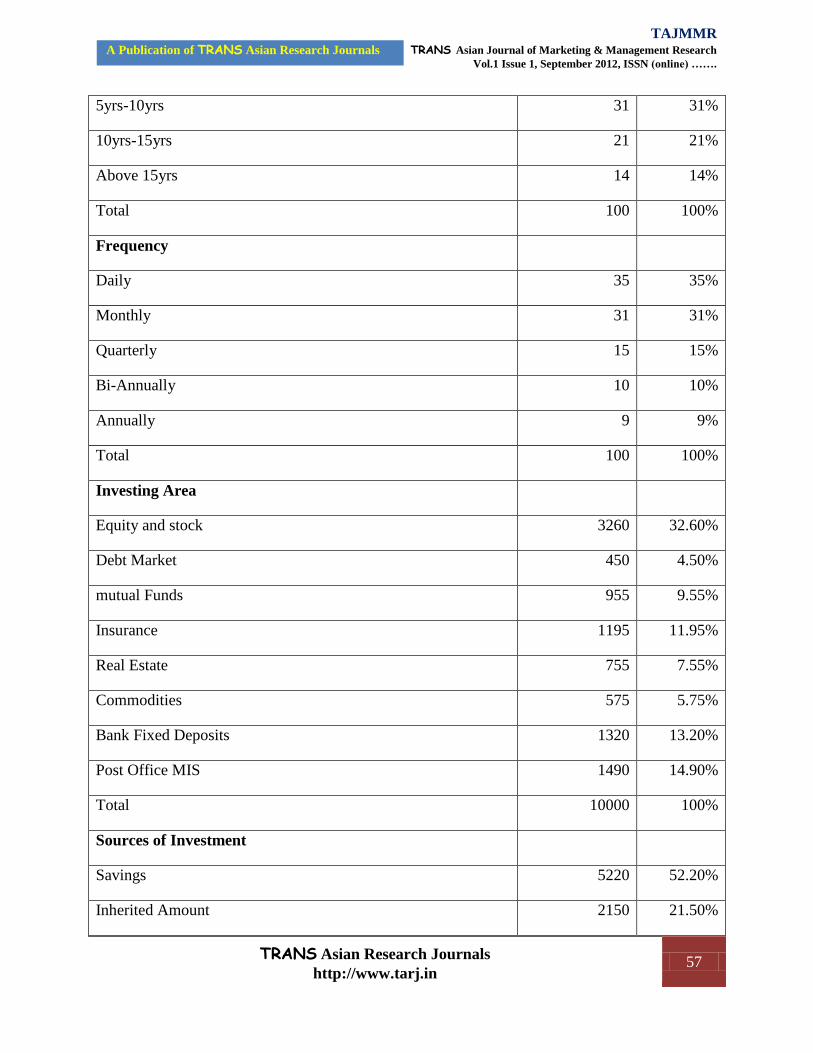
TABLE 1: DESCRIPTIVE STATISTICS
Parameter
No. of
investors
Percentag
e
Gender
Male 76 76%
Female 24 24%
Total 100 100%
Age Group
Below 30 18 18%
30-50 68 68%
Above 50 14 14%
Total 100 100%
Qualification
Under Graduates 16 16%
Graduates 53 53%

TRANS Asian Research Journals
http://www.tarj.in 56
A Publication of TRANS Asian Research Journals
TAJMMR TRANS Asian Journal of Marketing & Management Research
Vol.1 Issue 1, September 2012, ISSN (online) …….
Post Graduates 31 31%
Others 0 0%
Total 100 100%
Marital Status
Single 12 12%
Married 88 88%
Divorced 0 0%
Widowed 0 0%
Total 100 100%
Occupation
Student 4 4%
Retired 13 13%
Self-employed 79 79%
un-employed 4 4%
Total 100 100%
Annual Income
Below 0.5L 7 7%
0.5L-1L 2 2%
1L-3L 36 36%
Above 3L 55 55%
Total 100 100%
Experience in Investment
Below 2yrs 9 9%
2yrs-5yrs 25 25%
TRANS Asian Research Journals
http://www.tarj.in 57
A Publication of TRANS Asian Research Journals
TAJMMR TRANS Asian Journal of Marketing & Management Research
Vol.1 Issue 1, September 2012, ISSN (online) …….
5yrs-10yrs 31 31%
10yrs-15yrs 21 21%
Above 15yrs 14 14%
Total 100 100%
Frequency
Daily 35 35%
Monthly 31 31%
Quarterly 15 15%
Bi-Annually 10 10%
Annually 9 9%
Total 100 100%
Investing Area
Equity and stock 3260 32.60%
Debt Market 450 4.50%
mutual Funds 955 9.55%
Insurance 1195 11.95%
Real Estate 755 7.55%
Commodities 575 5.75%
Bank Fixed Deposits 1320 13.20%
Post Office MIS 1490 14.90%
Total 10000 100%
Sources of Investment
Savings 5220 52.20%
Inherited Amount 2150 21.50%

TRANS Asian Research Journals
http://www.tarj.in 58
A Publication of TRANS Asian Research Journals
TAJMMR TRANS Asian Journal of Marketing & Management Research
Vol.1 Issue 1, September 2012, ISSN (online) …….
Margin Financing 100 1.00%
Money Extracted from Business 2005 20.05%
Personal Borrowing 525 5.25%
Total 10000 100%
Objectives of the Investment
Short Term Profit Seeking 2550 25.50%
Steady Income(Dividends) 3225 32.25%
Long Term Profit Seeking 4225 42.25%
Others 0 0%
Total 10000 100%
Perception For the Losses
Incorrect Recommendation or Advice from
broker/analyst/banker 21 21%
Incorrect Recommendation or Advice from family/friends 13 13%
The market has, in general, performed poorly 46 46%
Committed errors 13 13%
Sheer bad luck 7 7%
Total 100 100%
Perception For the Profits
Professional help 24 24%
Friends advice and support 11 11%
Bullish market 47 47%
Own knowledge 13 13%
Sheer good luck 5 5%

TRANS Asian Research Journals
http://www.tarj.in 59
A Publication of TRANS Asian Research Journals
TAJMMR TRANS Asian Journal of Marketing & Management Research
Vol.1 Issue 1, September 2012, ISSN (online) …….
Total 100 100%
4.1 RELIABILITY ANALYSIS
The concept of reliability has been used to cover several aspects of score consistency. Test
reliability indicates the extent to which individual differences in test scores are attributable to
“true” differences in the characteristics under consideration and the extent to which they are
attributable to chance errors. These errors cannot be avoided or corrected through improved
methodology.
Reliability Coefficients of investor‟s behavior towards investment and its factors was found to be
0 .8723
4.2 ASSESSMENT OF THE DEGREE OF ASSOCIATION OF FACTORS
In order to test the association of Engagement and its factors a detailed set of statistical analysis
was conducted first being a confirmatory Pearson's Correlation as seen in below Table
TABLE 2: CORRELATIONS OF FACTORS TOWARDS INVESTOR’S BEHAVIOR
Investor‟s
optimism Investors effort Risk appetite Investor's Behavior
Ability of inv
decision .403(**) .486(**) .201(*) .732(**)
Investors optimism .454(**) .267(**) .809(**)
Investors effort .202(*) .606(**)
Risk appetite .533(**)
** Correlation is significant at the 0.01 level (2-tailed).
* Correlation is significant at the 0.05 level (2-tailed).
There is a range of correlation coefficients between the factors as described below:
The degree of relation between ability of investment decision and investor‟s behavior is
0.486 which is moderate.
The degree of relation between investor‟s optimism and investor‟s behavior is 0.454
which is also moderate.

TRANS Asian Research Journals
http://www.tarj.in 60
A Publication of TRANS Asian Research Journals
TAJMMR TRANS Asian Journal of Marketing & Management Research
Vol.1 Issue 1, September 2012, ISSN (online) …….
The degree of relation between investor‟s effort and investor‟s behavior is 0.486 which
comparatively moderate levels.
The degree of relation between risk appetite and investor‟s behavior is 0.267 which is
comparatively lower.
4.3 TEST OF REGRESSION
Regression is the determination of a statistical relationship between two or more variables. In
simple regression, there are only two variables; one variable (defined as independent) is the
cause of the behavior of another one (defined as dependent variable). Regression interprets what
exists physically i.e. there must be a physical way in which independent variable can affect
dependent variable.
As the objective of this study is to identify and assess the effect of components on Investor‟s
behavior, the method of multiple regression analysis has been chosen, as it helps in assessing the
individual and the combined effect of independent variables (ability of investment decision,
investor‟s optimism, investor‟s effort, risk appetite) on the dependent variable (investor‟s
behavior).
TABLE 3: REGRESSION ANALYSIS OF INVESTOR’S BEHAVIOR AND ITS
FACTORS
Model R R Square Adjusted R Square
Std. Error of the
Estimate
1 .970(a) .941 .939 4.155
a Predictors: (Constant), Ability of investment decision., Risk appetite, Investor‟s optimism,
Investor‟s effort.
R2
= 0.939, that‟s mean regression is 93.90% of the variance.
TABLE 4: F TABLE ANALYSIS OF INVESTOR’S BEHAVIOR AND ITS FACTORS
Model
Sum of
Squares Df Mean Square F Sig.
1 Regression 26241.992 4 6560.498 379.983 .000(a)
Residual 1640.198 95 17.265
Total 27882.190 99
a Predictors: (Constant), Ability of investment decision., Risk appetite, Investors optimism,
Investors effort.

TRANS Asian Research Journals
http://www.tarj.in 61
A Publication of TRANS Asian Research Journals
TAJMMR TRANS Asian Journal of Marketing & Management Research
Vol.1 Issue 1, September 2012, ISSN (online) …….
b Dependent Variable: Investor's Behavior.
TABLE 5: COEFFICIENTS ANALYSIS OF INVESTOR’S BEHAVIOR AND ITS
FACTORS
Model
Unstandardized
Coefficients
Standardized
Coefficients t Sig.
B Std. Error Beta
1 (Constant) .219 2.201 .100 .921
Investors optimism 1.155 .066 .514 17.606 .000
Investors effort .649 .171 .114 3.789 .000
Risk appetite 1.083 .097 .290 11.158 .000
Ability of inv decision .934 .067 .411 13.999 .000
a Dependent Variable: Investor's Behavior.
In forward stepwise regression the algorithm adds one independent variable at a time – which
explains most of the variation in the dependent variable „Y‟. The next step is of one more
variable X2, then rechecking the model to see that both variables form a good model. The process
continues with addition of a third and more variables if it still adds up to the explanation of „Y‟
(Nargundkar, 2002). The steps used in conducting the regression analysis on the above sample
are as follows:
Y = A + B1X1 + B2 X2 + B3 X3+ B4X4…............ (1)
Y = dependent variable representing the Investor‟s Behavior.
B1, B2, B3, and B4 are the coefficients of the regression equation
X1 = Investors optimism, X2 = Investors effort,
X3 =Risk appetite, X4 = Ability of investment decision,
A = Constant term.
From the above table we can analyze that the regression co-efficient (r) = 0.970 which shows
that the independent factors do have a significant impact on the Investor‟s Behavior.
Investor‟s Behavior (Y) = 0.219 + 0.514 Investor‟s optimism + 0.114 Investor‟s effort+ 0.290
Risk appetite + 0.411 Ability of investment decision………………………………………(2)

TRANS Asian Research Journals
http://www.tarj.in 62
A Publication of TRANS Asian Research Journals
TAJMMR TRANS Asian Journal of Marketing & Management Research
Vol.1 Issue 1, September 2012, ISSN (online) …….
Out of 4 independent variables (Investor‟s optimism, Investor‟s effort, Risk appetite, Ability of
investment decision) all the independent variables have an impact on Investor‟s Behavior
quotient Y as shown in above equation.
4.4 CLUSTER ANALYSIS
Cluster Analysis is a multi-variant procedure (Nargundkar, 2002) is a group of similar objects.
Cluster analysis is an exploratory data analysis tool for solving classification problems. Its
object is to sort cases (people, things, events) into groups, or clusters, so that the degree of
association is strong between members of the same cluster and weak between members of
different clusters. Each cluster thus describes, in terms of the data collected, the class to which
its members belong; and this description may be abstracted through use from the particular to the
general class or type.
Cooper and Schindler (2007) have identified five basic steps:
a. Selection of sample to be clustered.
b. Definition of the variables on which to measure the objects.
c. Computation of the similarities through correlation.
d. Selection of mutually exclusive clusters.
e. Cluster comparison
TABLE 6: NUMBER OF CASES IN EACH CLUSTER
Cluster 1 34.000
2 15.000
3 33.000
4 18.000
Valid 100.000
Missing .000

TRANS Asian Research Journals
http://www.tarj.in 63
A Publication of TRANS Asian Research Journals
TAJMMR TRANS Asian Journal of Marketing & Management Research
Vol.1 Issue 1, September 2012, ISSN (online) …….
TABLE 7: FINAL CLUSTER CENTERS
Cluster
1 2 3 4
GENDER 1 2 1 1
AGE 2 2 2 2
M.S. 2 2 2 2
Occupation 3 3 3 3
Education 2 2 2 2
Income P.A. 4 3 3 3
Ability of investment
decision 22 7 19 26
Investor‟s optimism 17 7 9 25
Investor‟s effort 10 8 8 13
Risk appetite 20 17 20 24
Investor's Behavior 70 37 55 87
Cluster 1: The above table explains that there exists homogeneity in considering the impact of
the components mentioned above and the Investor‟s Behavior between samples in the age range
of 30-50 years and gender of male investors whose marital status is married and qualification is
up to Graduation whose occupation is Self-employed and annual income is above 3 lakhs.
Cluster 2: The above table explains that there exists homogeneity in considering the impact of
the components mentioned above and the Investor‟s Behavior between samples in the age range
of 30-50 years and gender of female investors whose marital status is married and qualification
is up to Graduation whose occupation is Self-employed and annual income is in the range of 1
lakh to 3 lakhs.
Cluster 3: The above table explains that there exists homogeneity in considering the impact of
the components mentioned above and the Investor‟s Behavior between samples in the age range
of 30-50 years and gender of male investors whose marital status is married and qualification is
up to Graduation whose occupation is Self-employed and annual income is in the range of 1
lakh to 3 lakhs.
TRANS Asian Research Journals
http://www.tarj.in 64
A Publication of TRANS Asian Research Journals
TAJMMR TRANS Asian Journal of Marketing & Management Research
Vol.1 Issue 1, September 2012, ISSN (online) …….
Cluster 4: The above table explains that there exists homogeneity in considering the impact of
the components mentioned above and the Investor‟s Behavior between samples in the age range
of 30-50 years and gender of male investors whose marital status is married and qualification is
up to Graduation whose occupation is Self-employed and annual income is in the range of 1
lakh to 3 lakhs.
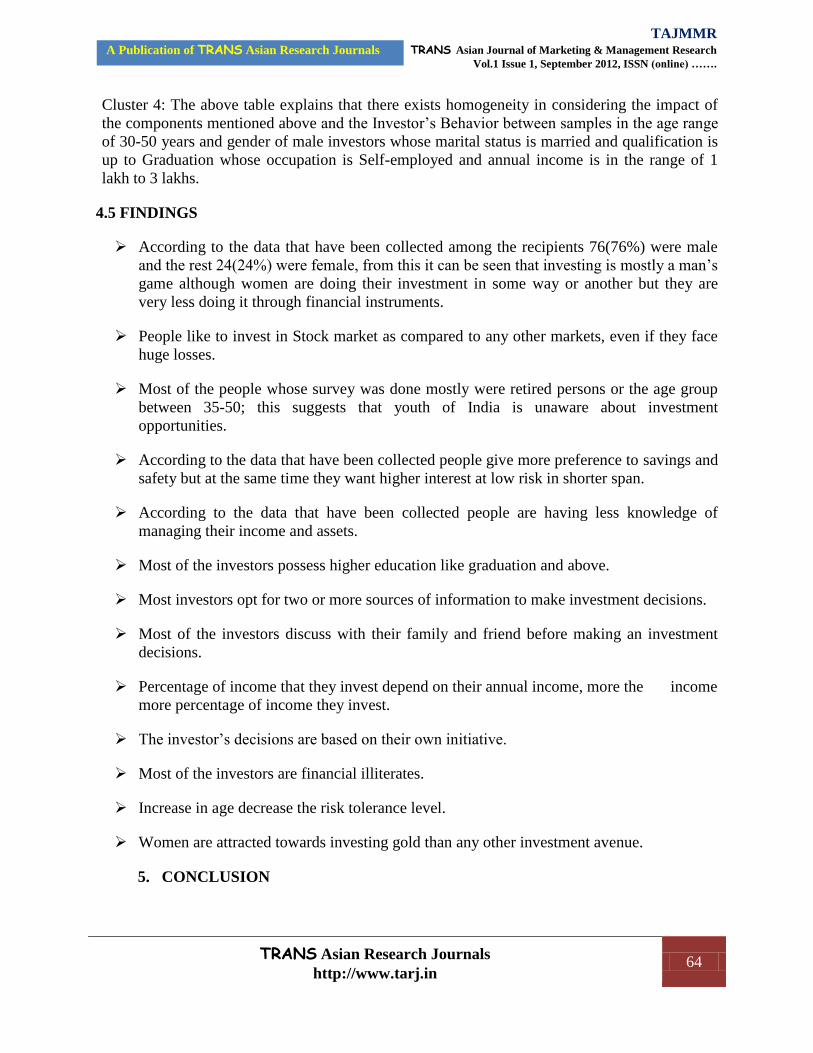
4.5 FINDINGS
According to the data that have been collected among the recipients 76(76%) were male
and the rest 24(24%) were female, from this it can be seen that investing is mostly a man‟s
game although women are doing their investment in some way or another but they are
very less doing it through financial instruments.
People like to invest in Stock market as compared to any other markets, even if they face
huge losses.
Most of the people whose survey was done mostly were retired persons or the age group
between 35-50; this suggests that youth of India is unaware about investment
opportunities.
According to the data that have been collected people give more preference to savings and
safety but at the same time they want higher interest at low risk in shorter span.
According to the data that have been collected people are having less knowledge of
managing their income and assets.
Most of the investors possess higher education like graduation and above.
Most investors opt for two or more sources of information to make investment decisions.
Most of the investors discuss with their family and friend before making an investment
decisions.
Percentage of income that they invest depend on their annual income, more the income
more percentage of income they invest.
The investor‟s decisions are based on their own initiative.
Most of the investors are financial illiterates.
Increase in age decrease the risk tolerance level.
Women are attracted towards investing gold than any other investment avenue.
5. CONCLUSION

TRANS Asian Research Journals
http://www.tarj.in 65
A Publication of TRANS Asian Research Journals
TAJMMR TRANS Asian Journal of Marketing & Management Research
Vol.1 Issue 1, September 2012, ISSN (online) …….
Mumbai is a financial capital of India. Therefore the awareness of investment knowledge,
investment opportunities is quite high. These people are helped by financial portals, financial
news channels, financial newspapers; various markets related T.V. shows, Expert talks,
magazines. For Indian public money is everything. So they are more sensitive about their money.
They will think hundred times before investing in any market and will expect more than that.
They feel that they are having enough money, time, resources and opportunities with them for
investing. Though they are having sound knowledge of financial market and economic condition
of India yet they lack the edge above the others as this field is very unpredictable and vast hence
they must be backed up by a financial planner.
Some of the recommendations are:
Day trading is an addiction which can ultimately prove disastrous. Encouragement
should be given to invest in equity for the long term.
We can encourage participation from household should own PSU shares so that
company will also get customer base and the margin will increase.
We must put up some “financial literacy campaign” as many people are still
unaware of stock market and in India there is youth which is untapped.
The communication should be increased and more personalized service should be
given to investors to earn trust and long run relationship.
The company must also provide more value added services to investors.
People give more importance to savings so as per their likings more opportunities
should be provided.
Many times it may happen that people land up in mess or huge losses due to not proper
information or guidance, and if they want to know where they are going? A financial planner
would do a world of good to them.
REFERENCES
1. V. L. Bajtelsmit and A. Bernasek “Why do women invest differently than men?”
Financial Counseling and Planning, vol. 7, 1996, pp. 1-10
2. H. K. Baker and J. A. Haslem, “The impact of investor socioeconomic characteristics on
risk and return preferences” Journal of Business Research, vol. 2, 1974, pp. 469-476.
3. R. A. Cohn, W. G. Lewellen, R. C. Lease, and G. G. Schlarbaum, “Individual financial
risk aversion and investment portfolio composition” Journal of Finance, vol. 30, 1975,
pp. 605-620.
4. D. Cooper and Schindler, Business research methods, Tata Mcgraw hill, New Delhi,
2007, pp. 138 -170.

TRANS Asian Research Journals
http://www.tarj.in 66
A Publication of TRANS Asian Research Journals
TAJMMR TRANS Asian Journal of Marketing & Management Research
Vol.1 Issue 1, September 2012, ISSN (online) …….
5. R. J. Daitzman, M. Zuckerman, P. H. Sammelwitz, and V. Ganjam, “Sensation seeking
and gonadal hormones”, Journal of Biosocial Science, vol. 10, 1978, pp. 401–408.
6. P. Horvath, and M. Zuckerman, “Sensation seeking, risk appraisal, and risky behavior”,
Personality and Individual Differences, vol. 14, 1993, pp. 41–52.
7. C.R. Kothari, Research methodology: methods and techniques, Vishwa Prakashan, New
Delhi, 1999, pp. 21-151.
8. R. Nargundkar, Marketing Research: Text and Cases, Tata Mcgraw-Hill, New Delhi,
2002, pp. 31 – 215.
9. M. M. Wallach, and N. Kogan, “Aspects of judgment and decision making:
Interrelationships and changes with age” Behavioral Science, vol. 6, 1961, pp. 23-26.
10. W. Zikmund, “Business research methods”, Thomson Asia, 2005, pp. 29 - 75.

TRANS Asian Research Journals
http://www.tarj.in 67
A Publication of TRANS Asian Research Journals
TAJMMR TRANS Asian Journal of Marketing & Management Research
Vol.1 Issue 1, September 2012, ISSN (online) …….
APPENDIX: QUESTIONNAIRE
1. Name: ________________________________________________________
2. Sex: Male Female
3. What is your age? (In years) : <30 30-50 50+
4. Marital Status? Single Married Divorced Widowed
5. Do you have children? Yes No
If yes, please specify: No. of Children > 20 years ____ No. of children < 20 years: ____
6. What is your occupation? Student Retired Self-employed Un-employed
Salaried
Salaried Individual (specify job title/designation) __________________________________
7. What is your level of education? _______________________________________
8. What is your average gross annual income? (In Lakhs)
< 0.5L 0.5L-1L 1L-3L >3L
9. What is the distribution of investment across different financial Instrument? (In %)
Equity and Stock _______ Debt Market _______ Mutual Funds _______
Insurance _______ Real Estate _______ Commodities _______
Bank Fixed Deposits _______ Post office MIS _______
10. What is the source of investment? (In case of more than one source describe their relative
proportions/percentages)
Savings _______ Inherited amount _______ Margin Financing _______
Money extracted from business _______ Personal Borrowing _______
11. What are your investment objectives? (If more than one objective describe relative
proportions/percentages of investment for each)
Short term profit seeking _______ Steady income (Dividends) _______
Long term profit seeking _______ Others _______

TRANS Asian Research Journals
http://www.tarj.in 68
A Publication of TRANS Asian Research Journals
TAJMMR TRANS Asian Journal of Marketing & Management Research
Vol.1 Issue 1, September 2012, ISSN (online) …….
12. I was ________ years old when I started investing in Stock.
13. Total no. of accounts with Brokers: _______
14. Investment experience in stock (In years): _______
15. How many different types of stock do you own on the average? _______
16. What is your total investment (In all types of financial Instrument)? _______
17. How frequently do you monitor your investment?
Daily Monthly Quarterly Bi-Annually Annually
18. DETERMINANTS OF INVESTOR BEHAVIOR
Please rate the following statement from 1(S.DA=strongly disagree) to 7(S.A=strongly Agree).
1 2 3 4 5 6 7
18. 1. Ability Of Investment Decisions:
a. I am confident of my ability to select
financial instruments for investment.
b. I take full responsibility for the
result of my investment decisions.
c. I am confident to manage my
investment.
d. I have complete knowledge of
available financial instruments.
18. 2. Investor Optimism:
a. Presently I will hold my stock in the
stock market.
b. I plan to increase my investment in
the stock market in next 12 months.
c. The price of stock will increase in
next 12 months.
d. If the KES index drops by 3%
tomorrow, I would suggest that it

TRANS Asian Research Journals
http://www.tarj.in 69
A Publication of TRANS Asian Research Journals
TAJMMR TRANS Asian Journal of Marketing & Management Research
Vol.1 Issue 1, September 2012, ISSN (online) …….
will recover most of its losses in a
few days.
18. 3. Investors Effort:
a. I am actively involved in trade
activity and observation of index.
b. I make investment for getting return
quickly.
18. 4. Risk Appetite:
a. I try to invest in risky stock for
better return.
b. I usually invest in companies which
I know and trust.
c. My risk appetite is high.
d. I invest mostly in companies with
stable expected returns.
19. INVESTMENT DECISION PLEASE RATE THE FOLLOWING FACTORS IN
TERMS OF HOW IMPORTANT THEY HAVE BEEN IN YOUR INVESTMENT
SELECTION PROCESS FROM 1(LEAST IMPORTANT) TO 7(MOST IMPORTANT).
1 2 3 4 5 6 7
19. 1. Technical Analysis:
a. Use of past price movement to
predict future price.
b. Daily price fluctuations.
c. Use of charts, Patterns, and trends.
d. Active trading volume/turnover.
19. 2. Fundamental analysis:
a. Use of company‟s annual reports.

TRANS Asian Research Journals
http://www.tarj.in 70
A Publication of TRANS Asian Research Journals
TAJMMR TRANS Asian Journal of Marketing & Management Research
Vol.1 Issue 1, September 2012, ISSN (online) …….
b. Price to earnings ratio.
c. Company‟s dividend ratio.
d. Debt equity ratio of the company.
e. Return on Equity/Ret. On
investment.
f. Government
Regulations/intervention.
g. Quality of top management.
19. 3. Market Psychology:
a. Rum our driven market.
b. News stories in the media.
c. Recommendation/advice of
professional investors/broker.
d. Recommendation/advice of some
friend, family, peer.
e. Major institution and corporations
currently buying the stocks of the
company.
20. If you have incurred losses, according to you, what is your perception for the loss, what is the
responsible factor? (Please tick)
a. Incorrect recommendations or advice from broker/analyst/banker
b. Incorrect recommendations or advice from family/friends
c. The market has, in general, performed poorly
d. Committed errors
e. Sheer Bad luck
TRANS Asian Research Journals
http://www.tarj.in 71
A Publication of TRANS Asian Research Journals
TAJMMR TRANS Asian Journal of Marketing & Management Research
Vol.1 Issue 1, September 2012, ISSN (online) …….
21. If you have earned profits, to what you want attribute it to? (Please tick)
a. Professional help.
b. Friends advice and support
c. bullish market
d. own knowledge
e. sheer Good luck