a study of material properties and relevant microstructure
TRANSCRIPT

University of Tennessee, Knoxville University of Tennessee, Knoxville
TRACE: Tennessee Research and Creative TRACE: Tennessee Research and Creative
Exchange Exchange
Masters Theses Graduate School
12-2005
A Study of Material Properties and Relevant Microstructure A Study of Material Properties and Relevant Microstructure
Parameters that May Influence the VParameters that May Influence the V5050 Ballistic Limit Velocity of Ballistic Limit Velocity of
Composite Ceramics Composite Ceramics
Adolphus McDonald University of Tennessee, Knoxville
Follow this and additional works at: https://trace.tennessee.edu/utk_gradthes
Part of the Engineering Science and Materials Commons
Recommended Citation Recommended Citation McDonald, Adolphus, "A Study of Material Properties and Relevant Microstructure Parameters that May Influence the V50 Ballistic Limit Velocity of Composite Ceramics. " Master's Thesis, University of
Tennessee, 2005. https://trace.tennessee.edu/utk_gradthes/4589
This Thesis is brought to you for free and open access by the Graduate School at TRACE: Tennessee Research and Creative Exchange. It has been accepted for inclusion in Masters Theses by an authorized administrator of TRACE: Tennessee Research and Creative Exchange. For more information, please contact [email protected].

To the Graduate Council:
I am submitting herewith a thesis written by Adolphus McDonald entitled "A Study of Material
Properties and Relevant Microstructure Parameters that May Influence the V50 Ballistic Limit
Velocity of Composite Ceramics." I have examined the final electronic copy of this thesis for
form and content and recommend that it be accepted in partial fulfillment of the requirements
for the degree of Master of Science, with a major in Engineering Science.
Roy J. Schulz, Major Professor
We have read this thesis and recommend its acceptance:
Basil N. Antar, Ahmad D. Vakili
Accepted for the Council:
Carolyn R. Hodges
Vice Provost and Dean of the Graduate School
(Original signatures are on file with official student records.)

To the Graduate Council:
I am submitting herewith a thesis written by Adolphus McDonald entitled "A Study of Material Properties and Relevant Microstructure Parameters that May Influence the V 50
Ballistic Limit Velocity of Composite Ceramics". I have examined the final paper copy of this thesis for form and content and recommend that it be accepted in partial fulfillment of the requirements for the degree of Master of Science, with a major in Engineering Science.
We have read this thesis and recommend its acceptance:
_'S_�_ · -�--&_�r----�-=�--Basil N .An tar
&.�


A STUDY OF MATERIAL PROPERTIES AND
RELEVANT MICROSTRUCTURE PARAMETERS THAT
MAY INFLUENCE THE V so BALLISTIC LIMIT VELOCITY OF COMPOSITE CERAMICS
A Thesis Presented for the Master of Science
Degree The University of Tennessee, Knoxville
Adolphus McDonald December, 2005

Copyright© 2005 by Adolphus McDonald, Jr. All rights reserved.
11

DEDICATION
This thesis is dedicated to my father; Adolphus McDonald, Sr. who recently died of
cancer. He was a role model, loving father, friend, and mentor. In addition, the thesis
is dedicated to my mother Emma Jean McDonald and the rest of the family as well, for
always believing in me, and inspiring me to excel in whatever endeavor or goals I set
for myself.
111

Acknowledgment
I wish to thank all those who helped me complete my Master of Science degree
in Engineering Science. I express my gratitude to my former advisor for the first three
year at University Tennessee Space Institute, Dr. Mary Helen McCay for giving me the
opportunity to start the Masters Program in her group. I would like to specially thank to
my current advisor, Dr. Roy J. Schulz, for all his help and guidance. I would like to
thank Russell Prather of the U.S. Army Research Laboratory for the use of his ballistic
test facility. I would like to thank the A. Boigenzahn, M. Kragness, and Rosalind
Batson of Clear Science, and Al Ingram and Scott Patterson of the U.S. Army Aviation
and Missile Research, Development, and Engineering Center, for assisting me in the
material preparation and analysis. I would like to give special thanks to Tanya Litvinas
of the U.S. Army Research, Development, and Engineering Command, Comparative
Testing Office for providing the funds to support the testing and evaluation of ballistic
armor technology from foreign companies.
V


Abstract
The purpose of this research is to evaluate, compare, and correlate the
microstructure and mechanical properties of a selected group of ceramic armor samples
to the V 50 ballistic limit velocity. This study is to identify any relation between the
desired material properties and the relevant microstructure parameters that significantly
influence the ballistic limit velocity. The ceramic materials, silicon carbide and boron
carbide, were produced and provided by five foreign companies. These companies
were under contract by the United States Anny, Research, Development, and
Engineering Command to provide ceramic armor for comparative testing and material
evaluation.
Ballistic testing was carried out to determine the V 50 ballistic limit velocity for
each ceramic material; mechanical testing of each ceramic material was performed to
obtain material density, microindentation hardness, and flexural strength.
Ceramography analysis of the material was also carried out to characterize the
microstructure for each material.
Results showed that the ranges in these properties of the ceramic materials
properties were determined as follows: Flexural strength ranged from 385 to 683 MPa,
Knoop hardness ranged from 2,200 to 3258 kgtlmm2, density ranged from 3.1659 to
3.2376 g/cm3, grain size ranged from 5 to 15 µm, and porosity ranged from 2 to 10%.
The ballistic limit velocities for these ceramic materials ranged from 292 to 372 mis.
The ballistic limit velocity was well correlate with the ceramic flexural strength.
Other material property such as density, microindentation hardness, and grain size did
not directly correlate with the ballistic performance. The porosity of these ceramic
vu

materials did somewhat correlated with ballistic performance data dispersion or scatter,
with increased scatter occurring at higher porosity levels.
As a note, the ballistic tests were done on the composite laminated ceramic but the
material and microstructure properties in this study only refer to the ceramic materials.
The front and backing fibrous material that comprised of the composite laminated
ceramic was not considered in the material analysis of this study. It is my estimation
and experience from testing and evaluating ballistic armor that the ceramic provides
approximately 90% to 95% in the erosion process and breaking up the steel core
projectile. The fibrous material accounts for approximately 5% to 10% in stopping
residual fragments and absorbing the kinetic energy. Therefore, the main focus was on
the ceramic properties influence on V 50 ballistic limit.
Vlll

Table of Contents
Chapter 1 ........................................................................................................................... 1
Introduction ................................................................................................................... 1
Chapter 2 ........................................................................................................................... 3
Review of Literature ..................................................................................................... 3
Chapter 3 ........................................................................................................................... 7
Methodology ................................................................................................................. 7
3.1 Experimental Setup for Ballistic Testing of Ceramic Armor Samples ........ 7 3.2 Sample Preparation for Characterization of Sample Physical Properties .. IO
Chapter 4 ......................................................................................................................... 15
Results ar1d Discussions .............................................................................................. 15
4.1 Optical Micro graphs .................................................................................. 15 4.2 Scanning Electron Microscopy .................................................................. 16 4.3 X-Ray Diffraction ...................................................................................... 17 4.4 Flexural Tests ............................................................................................. 18 4.5 Micro indentation Measurements ............................................................... 19 4.6 Density Measurements ............................................................................... 20 4.7 Material Comparison ................................................................................. 21 4.8 Ballistic Testing ......................................................................................... 22 4.9 Material ar1d Microstructure Properties vs. V 50 Ballistic Limit ................. 23
Chapter 5 ......................................................................................................................... 2 7
Conclusion .................................................................................................................. 27
Chapter 6 ......................................................................................................................... 29
Recommendations ....................................................................................................... 29
List of Reference ............................................................................................................. 31
Appendices ...................................................................................................................... 35
Appendix A ................................................................................................................. 3 7
Appendix B ................................................................................................................. 5 3
lX
Appendix C ................................................................................................................. 59
Ceratnography Protocols ........................................................................................ 60 X-Ray Diffraction Test Protocol ............................................................................ 61 Flexure Testing Protocol ........................................................................................ 61 Microindentation Measurement Protocol ............................................................... 62 Density Measurements Protocol ............................................................................. 62
Appendix D ................................................................................................................ 63
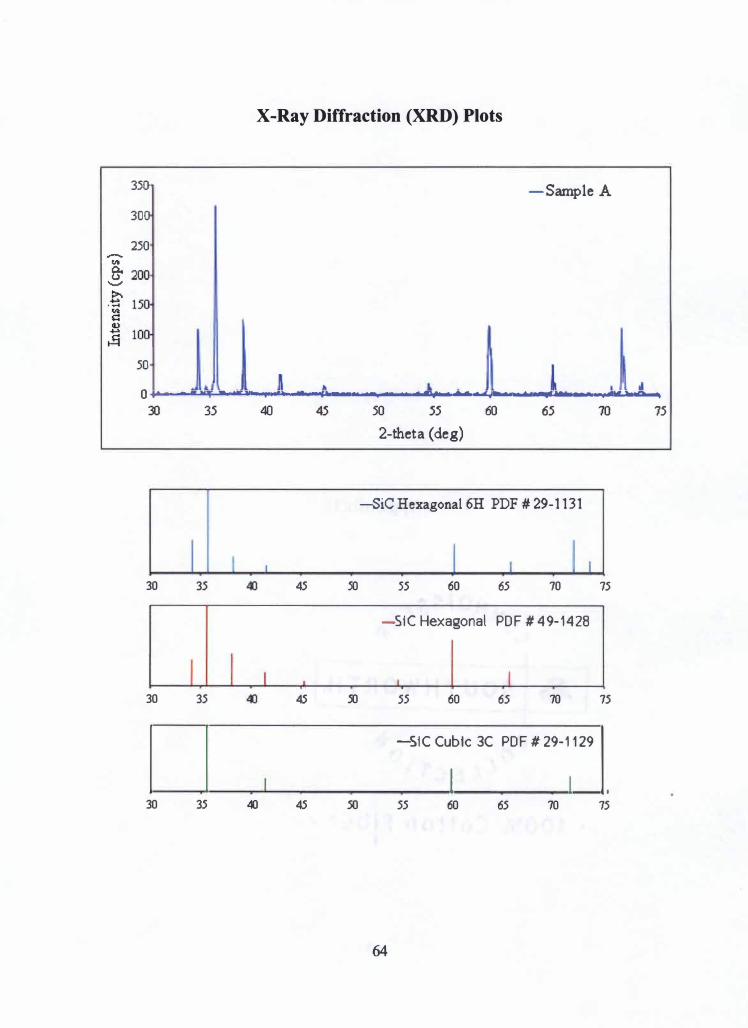
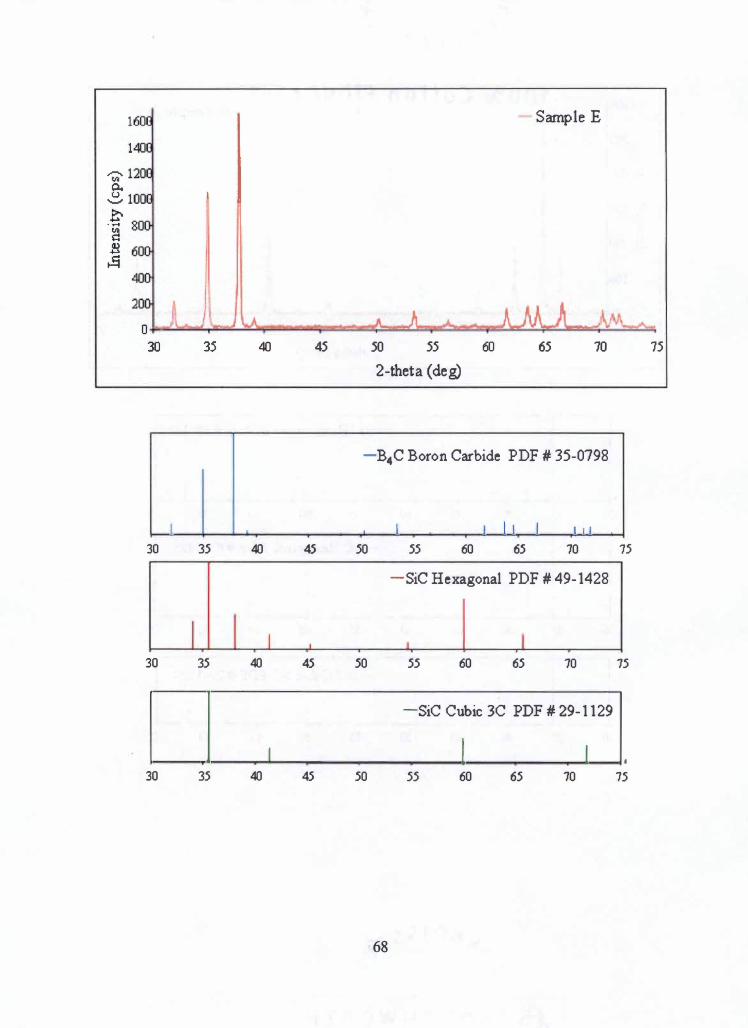
X-Ray Diffraction (XRD) Plots .............................................................................. 64
Vita ................................................................................................................................. 69
X

List of Tables
Table B-1: Summary of Ceramic Composite Ballistic Materials .................................. 54
Table B-2: Summary of Projectile Physical Dimension ................................................ 54
Table B-3: Summary of 3-Point Bending Flexural Strength (MPa) .............................. 54
Table B-4: Summary of Microindentation Hardness Measurements (kgv'mm2) ........... 55
Table B-5: Summary of Density Measurements {g/cm3) ............................................... 55
Table B-6: Ceradyne's Silicon Carbide and Boron Carbide Ceramic Property ............ 56
Table B-7:. Single Shots Ballistic Results of the Ceramic Opaque Composite Armors 57
Table C-1: Polishing Procedure for Silicon Carbide and Boron Carbide ...................... 60
Xl

List of Figures
Figure A-1: Latninate Armor Options ........................................................................... 38
Figure A-2: Penetrator Defeat Mechanism .................................................................... 3 8
Figure A-3: Illustration of Ballistic Test Setup .............................................................. 39
Figure A-4: Steel Fatne Mounting Bracket.. .................................................................. 39
Figure A-5: 12.7 x 108 mm Armor Piercing Incendiary .............................................. . 40
Figure A-6: Etched Microstructures of Ceratnic Materials Analyzed ........................... 41
Figure A-7: Unetched Microstructures ofCeratnic Materials Analyzed ....................... 42
Figure A-8: Grain Size and Porosity of Satnples ........................................................... 43
Figure A-9: Scanning Electron Microscopy of Materials Analyzed at 500x ................. 44
Figure A-10: Scanning Electron Microscopy of Materials Analyzed at 2500x ............. 45
Figure A-11: Flexural Strength (at brittle fracture) from 3-Point Bending of Satnples 46
Figure A-12: Statistical Analysis of Satnples Flexural Strength ................................... 46
Figure A-13: Microindentation Hardness ofSatnples ................................................... 47
Figure A-14: Statistical Analysis of Satnples Microindentation Hardness ................... 47
Figure A-15: Density Measurement of Satnples ............................................................ 48
Figure A-16: Statistical Analysis of Satnples Density ................................................... 48
Figure A-17: Single Shot Ballistic Results of Ceratnic Satnples ................................... 49
Figure A-18: V50 Ballistic Limit Velocity and Flexural Strength .................................. 49
Figure A-19: V 50 Ballistic Limit Velocity and Knoop Hardness ................................... 50
Figure A-20: V 50 Ballistic Limit Velocity and Density ................................................. 50
Figure A-21: V50 Ballistic Limit Velocity and Grain Size ............................................ 51
Figure A-22: V50 Ballistic Limit Velocity and Porosity ................................................ 51
Xlll


cc g
m mm µm g/cm3 kgtlsq. m mis
API ARL CVD CuK.a EDS HK HP Kevlar KOH PDF RDECOM RDE&T SEM Spectra S2 Vso XRD
Nomenclature
cubic centimeter gram meter millimeter micrometer grams/cubic centimeter kilogram/square meter meters/second
Abbreviations
Armor Piercing Incendiary Anny Research Laboratory Chemical Vapor Deposition Copper K alpha Energy Dispersive X-Ray Spectroscopy Knoop hardness number Hot Pressing Aramid Fiber Potassium Hydroxide Powder Diffraction File Research, Development, and Engineering Command Research, Development, Test and Evaluation Scanning Electron Microscopy High Performance Polyethylene (HPPE) High Strength Glass Fiber Ballistic Limit Velocity X-Ray Diffraction
xv


Chapter 1
Introduction
Over the past 45 years, research and development of ceramic materials for armor
applications have been of great interest to the United States Anny. A major initiate for
armor research occurred in the early 1960's during the Vietnam War, when the United
State Anny required protection for helicopter pilots and key components of helicopters
(Matchen, 1996). Forty five years later with the experience of Operation Iraqi Freedom,
there is a major initiate by the U.S. Anny to provide armor protection for ground
vehicles, soldiers, and weapon systems for combat.
The United States Army Research, Development, and Engineering Command
(RDECOM) is developing and evaluating new technologies for lightweight armor
materials and their integration into current and future army aviation platforms, missiles,
launchers, and vehicles. For the material developers to meet a broad range of mission
requirements, future weapon systems are required to do more with less weight and size.
Therefore, development and evaluation of lightweight armor material is critical for
future lightweight armor package systems. The Army's concept for lightweight armor
is important for maneuverability, and weapon systems must be light in order for combat
units to deploy quickly.
Ceramics are well suited for application to lightweight armor because of their
high physical properties and low density. The main requirement for ceramic armor is to
stop small armor-piercing projectiles and high velocity fragments, and also be lighter
than the equivalent metal armor. One of the first lightweight armor systems that
1

provided protection against ballistic projectiles was composed of a sintered aluminum
oxide ceramic tile, approximately one third of an inch thick, bonded to a ductile backing
panel, which was usually aluminum or fiberglass reinforced plastic (Matchen, 1996).
Figure A-1 1 shows several laminate armor options that are of current interest.
The two-component lightweight armor systems are very effective when struck
by a high velocity projectile because the core or penetrator is broken up upon impact or
eroded by the hardened face of the ceramic. Then the backing plate absorbs residual
energy from ballistic impact and also serves as a "catcher's mitf' to catch any residual
fragments. The penetrator-defeat mechanisms are illustrated in Figure A-2.
1 All figures are located in Appendix A.

Chapter 2
Review of Literature
A ballistic limit exists for high velocity projectiles that penetrate into materials,
including ceramics, solely based on the projectile kinetic energy, and it is affected by
many parameters. Among these parameters are the projectile geometry (length,
diameter, and nose shape), hardness, density, yield strength, pitch and yaw angles at
impact. The target parameters include thickness, hardness, density, grain and porosity
characteristics, yield strength, and fracture toughness. The target microstructure
features are the grain size, percent free volume or porosity, grain and porosity cell
shape, surface, and homogeneity which affect the physical and ballistic properties of the
material.
Within the last ten years, research and development of ceramic-based armor has
significantly advanced the understanding of the effects of ceramic microstructure and
mechanical properties on the ceramic ballistic performance. There has been a
considerable amount of work done to correlate ceramic microstructure and mechanical
properties to ceramic ballistic performance. Adams et al. (2001) focused their research
on microstructure control during fabrication and the correlation of microstructure with
mechanical properties and penetration resistance of ceramic composites. Lach (1993)
has studied the ballistic performance of ceramics against kinetic energy projectiles; his
work revealed that flexural strength seems to have a slightly greater influence on the
ballistic performance than other mechanical values. Rozenberg and Yeshurun (1988)
conducted experiments that demonstrated a clear relationship betw�en ballistic
3
· efficiency and the effective compressive strength of ceramics, where ballistic efficiency
( r,) is the slope of the straight line through the experimental points is expressed in terms
of h;, the minimum tile thickness needed to prevent penetration into the backing, P; ,
the penetration depth of the same projectile into a bare metal backing plate, and p8 and
Pc which are the densities of the metal backing plate and the ceramic, respectively:
(2. 1)
The main properties of ceramics which affect the ballistic performance were
examined and analyzed by Medvedovski (2002), who concluded that it was the
combination of microstructure and mechanical properties that influences ballistic
performance. Work by Faber and Meyer (1995) showed from ballistic tests that the
ballistic performance of a ceramic increases with increasing hardness, and the work by
Krell and Blank (1995) demonstrated that the hardness of a ceramic increases with
decreasing grain size which is also true of metals. Krell et al. (2002) did work that
showed that hardness is much more important for ballistic performance than bending
strength. Bartkowski and Spletzer (2001) examined and observed the microstructure of
silicon carbide; from their work they concluded that the elastic constant (Young's
Modulus) increases as the volume fraction of increased.
The primary goal of the present research study is to evaluate, compare, and
correlate microstructure and mechanical properties of a selected group of ceramic armor
samples to the V so ballistic limit. The purpose of the study is to identify any relation
between the desired material properties and the relevant microstructure parameters that
significantly influence the ballistic limit. For this purpose, ballistic armor ceramic
4

samples were provided to the United States Army Research, Development, and
Engineering Command (RDECOM) by companies from the United Kingdom of Great
Britain, Canad� Germany, and Australia for ballistic testing and material analysis.
The results of the material analysis and ballistic testing were obtained by
conducting a ceramography analysis to characterize each sample material by its grain
size, porosity, and density. Mechanical testing was conducted to determine the flexural
strength and microindentation hardness of the materials. And finally, tests of the
samples under ballistic impact were also conducted. A series of plots showing both the
material analysis results and the ballistic testing results were prepared and the material
property of each sample was compared to that material's ballistic performance.
5


Chapter 3
Methodology
3.1 Experimental Setup for Ballistic Testing of Ceramic Armor Samples
3.1.1 Experimental Setup
The experimental ballistic tests were conducted according to the MIL-STD-
666F which describes the general guidelines for procedures, equipment, physical
conditions, and terminology for determining the ballistic resistance of metallic,
nonmetallic and composite armor against small arms projectiles (Military Standard,
1997). The method of the standard is intended for use in ballistic acceptance testing of
armor and for the research and development of new armor material. Shown in Figure
A-3 is the experimental test setup which consisted of a launch weapon, breakscreeens,
yaw card, test samples, mounting bracket, witness panel, and projectile. The test
weapon was positioned at a specified distance from the test samples which were set
perpendicular to line of sight of the gun barrel. Samples were rigidly mounted to a
square test frame shown in Figure A-4. Positioned behind the square test frame at a
distance of 152 millimeters (mm) was a 0.5 mm thick 2024 T3 aluminum witness plate
used to establish whether there was partial or complete penetration of the test projectile.
Projectile impact velocity was measured in front of the samples by the breaking of two
printed, silver-circuit, thin paper screens set 0.5 meters (m) apart. A yaw card was
positioned in front of each test sample to determine whether the projectile had a yaw
7

angle, if any, before it impacted the test samples. Tests were conducted at the United
States Army Research Laboratory (ARL), Aberdeen Proving Ground, Maryland.
3.1.2 Test Samples
Test samples were all of a ceramic composite laminate design. A typical
construction for a composite laminate armor sample consist of a ceramic that is
encapsulated using a fabric (Twaron®, Kevlar®, or Spectra Shield®) with one or more
layers of different types of ballistic materials behind the ceramic material. Kevlar® and
Twaron ® are tradenames for an aramid fiber, composed of aromatic polyamide and
they provide exceptional impact resistance and tensile strength. Spectra Shield® is also
a tradename for a high performance polyethylene (HPPE) fiber and it's impact
resistance and tensile strength is greater than that of Kevlar®. The ceramic surface
preparations, as well as a selection of adhesive and thermal treatments of the glued
ceramics with the backing materials were optimized by the sample supplier. The
detailed manufacturing process of each ceramic armor sample was not provided by the
supplier because the information is proprietary. However, the usual process of
fabricating a ceramic armor plate is by bonding solid particles of a ceramic into a
monolithic structure (the plate), and compacting the particles into an approximate final
shape. This process is known as sintering. Sintering, however, is just one part of the
process, a process of densification that includes both solid-state and liquid phase
sintering, transient liquid phase sintering, and reaction sintering to cause and control an
increase in material density. Chemical vapor deposition (CVD) and hot pressing (HP)
are two other types of densification processes. The type of processing used established
8

both the purity and the porosity of the material. Each of the test samples supplied had
dimensions of 304 x 304 mm in size and different thickness. The areal densities of
sample A, B, C, D, and E can not be provided in this study for security reasons. The
test sample materials used in the experiment are listed in Table B-12•
3.1.3 Test Projectile
The projectile caliber that was used throughout the whole experimental test
program was a 12.7 x 108 mm Armor Piercing Incendiary (API) round. This projectile
was chosen based on a systems threat assessment for a United State Army weapon
system which no longer exists, however, the threat projectile exists for other U.S Army
weapon systems. The purpose of a system threat assessment is to assess the likely
threat or threats that the weapon system would encounter. The results from the
assessment were incorporated into the Operational Requirement Document for this
particular weapon system.
Prior to conducting the experiments, a projectile velocity-propellant charge
curve was determined for this weapon. The curve was required to provide a basis for
selecting a powder charge to bullet weight ratio to achieve a desired ballistic impact
velocity. A list of the projectile physical dimensions is provided in Table B-2 and the
API round shown in Figure A-5.
3.1.4 Ballistic Test Procedure
Before conducting firings of each sample, an estimate was made by the ARL test
engineer, and by each technical advisor associated with each sample, of the projectile
2 All tables are located in Appendix B

velocity that would result in a complete penetration of the sample materials. When the
result yielded a complete penetration, the propellant charge for firing the second round
was set equal to the powder charge of the first round, minus a propellant decrement that
would give a 15 to 30 meters/second (mis) velocity decrease in order to obtain a partial
penetration. However, when the first round firings yielded a partial penetration, the
propellant charge for second round was set equal to the first round plus a propellant
increment for a 15 to 30 mis velocity increase in order to achieve a complete
penetration. The firings were continued until a V 50 ballistic limit was determined. The
V 50 ballistic limit was determined by calculating the average velocity that resulted with
an equal number of the highest partial and the lowest complete penetration impact
velocities, within an allowable velocity span of 38 mis. The reason for determining the
V 50 ballistic limit velocities for each sample material through ballistic testing is to
evaluate, compare, and correlate the microstructure and mechanical properties of a
selected group of ceramic armor samples to the V 50 ballistic limit. The V 50 ballistic
limit is compared against the flexural strength, hardness, density, grain size, and
porosity of each sample ceramic material. The microstructure and mechanical
properties along with the V 50 ballistic limit velocity is graphed to observe trends within
the data that significantly influence the ballistic performance.
3.2 Sample Preparation for Characterization of Sample Physical Properties
3.2.1 Ceramography Preparation
In preparation for ceramography, samples were sectioned parallel to the
thickness plane with a Buehler Isomet 1000 diamond saw. One set of samples was
10

mounted in a low viscosity epoxy that was infused under vacuum. The samples were
polished in a five-step sequence using a Buehler Ecomet IV/ Automet III polishing
system. Four samples were chemically etched in Murkami's reagent and one sample
was electrolytically etched with 1 % potassium hydroxide (KOH) solution (Chinn,
2002). Ceramography protocol is described in detail in Appendix C.
3.2.2 Optical Micrograph
Etched and unetched samples were observed and photographed with a Z_eiss
Axiovert 25CA optical metallograph. Unetched samples were used for porosity
estimation. Representative areas were digitally photographed at 500x original
magnifications and analyzed with an Image tool software package (PAX-it, 2001).
3.2.3 Scanning Electron Microscopy
Etched samples were observed with a digital JEOL 5800L V Scanning Electron
Microscope (SEM). Elemental analysis was done with an attached Oxford Link Isis
Energy Dispersive X-ray Spectroscopy (EDS) system. Samples were surveyed at low
and high magnification with representative areas digitally photographed.
3.2.4 X-Ray Diffraction
Thin slices of each material were mounted onto x-ray sample holders. The X
Ray Diffraction (XRD) scans were performed using a Siemens (Bruker) D5005 X-ray
diffractometer with Copper K alpha (CuKa) radiation. A basic search-match routine
was run on each XRD plot to compare sample patterns to a Powder Diffraction File
11
(PDF) Database (ICDD, 2004). X-Ray Diffraction protocol is described in detail in
Appendix C.
3.2.5 Flexure Testing
ASTM C-1161 (2002) was used as a guide for flexure testing. A diamond saw
was used to trim samples to meet the "B" size sample dimensions for testing. Cut
surfaces were smoothed on successive diamond wheels with 45 micrometer (µm) and
15 µm grit sizes. Testing was done in a 3-point bending mode. The samples of each
material were loaded to failure. The failure load, P, was used in the flexure stress
equation (ASTM C-1161, 20002) to determine the flexural strengths for a simply
supported beam. This equation is given below:
where,
CJ' = 3PL
2bt2
a = Flexural Strength (MPa)
P = Breaking Load (kg)
L = Support Span (m)
b = Samples Width (m)
t = Samples Thickness (m)
(3.1)
Sample span was nominally 38.1 millimeters (mm) and the average width and thickness
of the samples were respectively 5.08 mm and 4.064 mm. Flexure testing protocol is
described in detail in Appendix C.
12

3.2.6 Microindentation Measurements
Microindentation hardness measurements were performed by using an Instron
Hardness Tester. ASTM C 1326 (2003) was used as a guide for microindentation
hardness. A diamond pyramid indenter, with two 136° base angles and a required load
of 500 grams (g), was applied to the SiC samples and a load of 1000 g was applied to
the B4C sample. The hardness measurements were expressed as a Knoop hardness
number (HK) (Chinn, 2002). The measurements were digitally displayed by the Instron
Hardness tester. The microindentation measurements protocol is described in Appendix
C. Note that ten (10) hardness measurements were made on a single test coupon of
each material.
3.2.7 Density Measurements
Density measurements were conducted by using a Micromeritics Accupyc 1330
Helium Pycnometer, which determines sample density by filling a sample chamber of 1
cubic centimeter (cc) with helium gas. The Micromeritics Accupyc 1330 Helium
Pycnometer works by measuring the amount of displaced gas once a sample is inserted
into the 1 cc volume. Once the displaced gas fill the sample chamber, the pressure is
measured. The helium gas is then routed to a second empty chamber of the same
volume and the pressure in both chambers is measured. The sample volume is
calculated based on the pressures, and with the known weight of the sample, the density
is then calculated. In preparation of the density measurements, portions of each of the
five samples were cut to small cubes approximately 0.5 centimeter on a side, and
13

weighed to the nearest 0.0001 g. Density measurement protocol is described in detail in
Appendix C.
14

Chapter 4
Results and Discussions
4.1 Optical Micrographs
The objective of obtaining optical micrographs of each sample material surface
was to observe and characterize the etched and unetched samples and determine their
grain size and porosity. Figures A-6 and A-7 show the etched and unetched
microstructures of the four SiC and one B4C ceramic samples analyzed. The
microstructure of etched sample A in Figure A-6, etched with Murkami's reagent,
revealed a microstructure consisting of coarser, elongated grains estimated at 6 microns.
Figure A-7 of the unetched A sample shows a non-uniform distribution of porosity that
is estimated at 5% based on a single tested sample. The microstructure of etched
sample B in Figure A-6, etched with Murkami's reagent, revealed a fine grain structure
estimated at 5 microns. Lighter grains were observed and presumed to be P-SiC that
was not affected by the etchant. There were also micro cracks observed in the structure
as shown in Figure A-6 (See red arrow). Figure A-7 of the unetched B sample shows a
non-uniform distribution of porosity that is estimated at less than 2%, again based on
only a single test coupon. The microstructure of etched sample C in Figure A-6, etched
with Murkami' s reagent, revealed a microstructure of mostly fine, equiaxed grains
estimated at a mean size of 4 microns. The lighter colored grains were also coarser and
were presumed to be P- SiC. Figure A-7 of the unetched C sample shows a non
uniform distribution of porosity that is estimated to be less than 5% in a single sample.
15

The microstructure of sample D in Figure A-6, etched with Murkami's reagent, revealed
a microstructure consisting of equiaxed, recrystallized grains at approximately 6
microns. Figure A-7 of the unetched D sample shows small pores that were randomly
distributed throughout the material and D is estimated to have a porosity less than 2%
based on a single sample. The microstructure of sample E in Figure A-6,
electrolytically etched with 1 % KOH solution, revealed a microstructure consisting of
equiaxed grains estimated at 15 microns. Figure A-7 of the unetched E sample shows a
continuous network of micro pores throughout the section that is estimated to yield a
porosity of 10% for a single sample. The grain size and porosity are plotted in Figure
A-8 for the silicon carbide and boron carbide samples
4.2 Scanning Electron Microscopy
The results of the SEM are presented in this paper to provide additional
information concerning the microstructure features of the samples. Since the results
relate to the qualitative features of the material, they were not used in correlation of the
material microstructure parameters and mechanical properties with the ballistic limit.
The results of the SEM micro graphs at low and high magnification of the samples are
shown in Figure A-9 and Figure A-10 respectively. The microstructure of sample A in
Figure A-9 and Figure A-10 revealed a severe amount of relief from etching but there
was no evidence at the grain nodes. Relief is a term used to describe the high-resolution
and depth-of-field image of sample surface; it is an indication of the quality of a image,
not an attribute of a microstructure. The microstructure of sample B in Figure A-9 and
Figure A-10 revealed that the grains were not as distinct after etching. There was
16

significantly more of the white aluminum/yttrium deposit between grains. The
microstructure of sample C Figure A-9 and Figure A-10 revealed relief in the bulk grain
structure and some smoothing of pore walls which resulted from etching. There were
small deposits of aluminum and yttrium detected between the grain boundaries. The
microstructure of sample D in Figure A-9 and Figure A-10 revealed grains that were in
sharp relief after etching. The white intergranular deposits contained aluminum but no
yttrium. Finally, the microstructure of sample E in Figure A-9 and Figure A-10
revealed that the electrolytic etch fluid, KOH, selectively leached mate�al at the grain
boundaries. The white particles shown are aluminum-rich.
4.3 X-Ray Diffraction
The X-ray diffraction (XRD) patterns of the samples were observed in detail,
and compared to the standard Powder Diffraction File (PDF) Database (ICDD, 2004-
2005). XRD plots of the sample ceramic materials are provided in Appendix D. The
results are presented in this thesis to provide confirmation of the ceramics type.
Sample A had an XRD pattern that was similar to that of the C sample in that it
was a close match with the 3C �-SiC phase, 6H crystal and other a-SiC phases. The
peaks from the trace phase were not as strong in the A material as they were in the C
sample. Sample B had an XRD pattern that was very similar to that of sample C. The
3C, 6H and additional hexagonal phase of SiC were identified. There was more of the
trace phase, possibly 4H SiC, detected in sample B than in C. For the C sample pattern,
the closest matching pattern to the standard patterns were for the 3C cubic phase, which
for silicon carbides is associated with �-SiC and a-SiC hexagonal phases. One
17

hexagonal phase was identified as a 6H, the other was not identified. There was
evidence of minor amounts of another SiC phase given by the small peaks near
crystallographic directions of 33.2° and 34.5°. These peaks could not be positively
identified due to their low intensity, but there were strong indications they were from
the 4H a-SiC phase. Sample D had an XRD pattern that was very similar to that of A,
B and C. The 3C, 6H and additional hexagonal phase of SiC were present. Also,
sample D had the most significant amount of the unidentified trace phase. Finally, the
sample E XRD pattern did not match with any of the SiC phases. However, it was a
very close match to the standard pattern for boron carbide (B4C). This data, coupled
with the sample E density data positively identified sample E as boron carbide. There
were no trace phases detected in the XRD pattern. In comparing peak positions and
relative peak intensities, sample E was found to have an XRD pattern that was different
from the other samples. The order and intensity of the three main sample E peaks
between 30° and 40° 20 did not compare with the other sample patterns. There was also
a series of smaller peaks that were not accounted for in the other sample patterns. This
was a strong indication that the material was of a different composition. In summary,
samples A, B, C, and D had very similar XRD patterns, all showing the presence of
some trace phases in the patterns.
4.4 Flexural Tests
The reason for doing these test was because Lach ( 1993) and other ballisticians
discovered that the flexural strength of a ceramic material seems to have a slightly
greater influence on the ceramic's armor protection capability than its other mechanical
18

properties. The results of a series of structural failure test done on the ceramic samples
in the present study were based on the 3 point bending, and the results of the tests are
shown in Figure A-11. There were considerable scatter in the data from all samples.
This was believed to be due, in part, to sample preparation and to internal flaws like
cracks. The flexural strength data presented is not enough data to show general trends
in mechanical behavior for correlation with the terminal ballistic behavior of the
materials. There are too few data points to establish the average flexural strengths and
their deviations within reasonable confidence limits or with much precision. According
to ASTM C 1161 (2002) a minimum of ten samples is required for the purpose of
estimating the average. Flexural strength for sample A ranged from 241 to 465 MPa.
The B material flexural strength ranged from 402 to 633 MPa. The C material ranged
from 312 to 656 MPa. The D material flexural strength ranged from 588 to 772 MPa,
and finally the E material flexural strength ranged from 316 to 4 78 MPa. There were
only two bending tests for sample E because of saw blade issues (breaking of the
blades). Table 4.1 summarizes the results of the 3 point bending flexural tests and
shows both the average failure strength as well as the standard deviation for each
ceramic material. Figure A-12 is a bar chart based on Table B-3 showing the average
and standard deviation.
4.5 Microindentation Measurements
As stated in the previous section, some ballisticians believe that flexural strength
seems to have a slightly greater influence on ceramic armor protection capability than
other mechanical properties. However, other ballisticians believe that hardness seems
19

to make a considerable contribution and to correlate best with the ceramic armor
protective power. The results of series of microindentation hardness measurements of
all the material are shown in Figure A-13. There are relatively small variations within
the sample hardness of all the materials. The relatively small amount of the data is
enough to establish the average hardness and their deviations within reasonable
confidence limits or with acceptable precision. Hence, there is enough data to show
general trends in mechanical behavior for correlation with the terminal ballistic
behavior of the materials. According to ASTM C 1326 (2003) a least five and
preferably ten indentations are required for hardness measurements. The hardness
measurements for the silicon carbide samples (A, B, C, and D) ranged from
approximately 2200 to 2450 kgtlmm2• The boron carbide sample E hardness
measurement ranged from 3125 to 3258 kgtlmm2• Table B-4 summarizes the results of
the microindentation measurements and shows both the average hardness as well as
standard deviation for each ceramic material. Figure A-14 is a bar chart showing the
averages and standard deviation.
4.6 Density Measurements
Density measurements are important to establish with accuracy for the measured
samples that are in agreement with accepted published values for these types of
materials. However, for armor application, density is most important because density
should be low to reduce the weight of the armor. Densities for all of the ceramic
materials except sample E fell within normal ranges for silicon carbide materials of 3.15
to 3.20 grams/cubic centimeter (g/cm3) (Ceradyne, Inc., 2003). There are enough data
20

points to establish the average densities and their deviations within reasonable
confidence limits or with acceptable precision. The measured density of E was
significantly lower than those of the other materials, and conformed more closely to that
of boron carbide. The results are shown in Figure A-15. Table B-5 summarizes the
results of the density measurements along with the averages and standard deviations.
Figure A-16 is a bar chart showing the averages and standard deviations.
4.7 Material Comparison
It is of critical importance to know how, or to have a good estimate of how these
materials are made. Materials and processes comprise one of several key technology
areas within the Department of Defense which are essential for achieving the goals and
objectives for the Army Technology Thrusts (Przemieniecki, 1993). The goals can be
met by developing new material and process capabilities or exploiting materials
produced by other countries. Exploiting material produced by other countries provides
a direct and significant Research, Development, Test and Evaluation (RDE&T) cost
savmg.
The samples of ceramic ballistic armor provided by the foreign vendors were
compared to SiC and B4C produced by three different processes by a United States
company, Ceradyne, Inc (Ceradyne, Inc., 2003). From the results of the material
analysis, each foreign sample was grouped in a category based on the measured sample
compositions and properties. By comparing the properties of the foreign ceramics to
materials produced by Ceradyne, Inc., samples B, C, D, and E are believed to have been
processed by using a hot pressing; and sample A material is believed to have been
2 1

processed using a sintering process. Table B-6 provides the properties comparison of
the foreign vendor 's samples to that of ceramic produced by Ceradyne, Inc.
4.8 Ballistic Testing
The ballistic tests are the most significant aspect of this research study because
the results establish the V 50 ballistic limit velocity, the velocity at which one-half of the
tested projectiles will perforate the target and one-half will not, for modem ceramic
armors. The V 50 ballistic limit provides a statistical approximation to the projectile
impact velocity at which complete penetration and incomplete penetration are equally
likely to occur. The impact velocities for complete and partial penetration and the V 50
velocity limits for each of the five samples are shown in Figure A-17 and summarized
in Table B-6.
Also shown in Figure A-17 is the data for AISI 4340 armor steel provided as a
baseline for comparing the ballistic performance of each of the ceramics (Mascianica,
1981 ). The first observation to be made from Figure A-1 7 is that the A sample shows a
very high dispersion in its complete and partial penetration capability. It allowed a
penetration to occur at the lowest recorded impact velocity, 209 mis. It also has the
lowest V 50, at 292 mis. The best material with the smallest dispersion or scatter in its
penetration characteristic, as well as the highest V 50, is the D material. Note that its V 50
was 3 72 mis, which was much better than that of the 4340 armor steel V 50 of 310 mis.
All the other materials ballistic performance V 50' s are comparable in a range from 300
to 325 mis, and have similar dispersion of penetration allowances. As a reminder, recall
that the A material is believed to be manufactured from a sintered silicon carbide
22

material, and the D material appears to be a hot-pressed silicon carbide. Note also that
the D material has higher flexural strength than the A material, Figure A-1 8, but an
apparent lower Knoop hardness, Figure A- 19. The data indicate that the E material,
likely hot-pressed boron carbide, had flexural strength similar to the other silicon
carbide materials that fell between the A and D performance limits but E is considerably
harder, Figure A- 19 and Table B-4. On the other hand, B and C have essentially the
same flexural strength, density, and hardness as the A material, see Table B-4.
Therefore, the success of the D material, compared to the A, B, and C must lie in the
details of its manufacturing process. D's micrographs (Figures A-9 and A- 10) do not
appear fundamentally different from the micrographs ofB, C, and E.
4.9 Material and Microstructure Properties vs. V 50 Ballistic Limit
In an attempt to correlate the ballistic performance of the ceramic armor samples
to their material properties, a series of figures were prepared. Figures A- 18 through
A-22 provides the V 50 ballistic limit for each of the ceramic samples compared to the
different microstructure and the mechanical properties of each material. Again, the
intent of these charts is to identify correlation between the microstructure and the
mechanical properties to the ballistic performance, and to identify those material
properties that are necessary to achieve a high ballistic performance based on a known
or hypothesized manufacturing process. As stated previously, it is clear that the
ballistic performance of the D material is well correlated with its flexural strength,
which is the highest of all the materials shown in Figure A- 1 8. Figure A-19 shows that
hardness does not appear to correlate with ballistic effectiveness, since materials A, B,
23
C, and D all appear to have the same hardness. The E material appears to have a
significantly higher hardness than D, but its V 50 performance is lower.
Figure A-2O compares material density to V5o performance and shows that
density does not appear to correlate with ballistic performance. Materials A, B, C, and
D all have about the same density, with E having a slightly lower density.
Figure A-21 compares mean measured material grain size to V 5o ballistic
performance. Again, there is no apparent correlation ofV5o performance with grain size
observed. Nor can the dispersion of the A results be related to grain size.
Finally, Figure A-22 compares material estimated porosity to V 50 ballistic
performance. Comparing Figure A-17 and A-22, there does seem to be somewhat of a
correlation between increased porosity levels and ballistic performance data dispersion
or scatter, the less porous B and D do appear to have less data scatter and smaller
porosity than A and C. Yet, porosity can't completely explain ballistic limit velocity
scatter because E material has a relatively small amount of V 5o dispersion, but also has
the highest estimated porosity. Therefore, porosity and manufacturing details or
process apparently have intertwined roles in establishing the V 50 ballistic performance
of the ceramic materials. More research along these lines is definitely required to
establish the best combination of materials and processing to establish the highest
possible V 50 ballistic performance, along with a high level of consistent performance.
Also shown in Figure A-18 through A-22 are the yield strength (Air Force Materials
Laboratory, 1964), hardness (MatWeb, 1996-2005), density (MatWeb, 1996-2005),
grain size (Air Force Materials Laboratory, 1964), and porosity (Military Specification -
24
5000E, 1982) for AISI 4340 armor steel provided as a baseline for comparing the
ballistic performance of each of the ceramics.
25


Chapter 5
Conclusion
It was found that the ballistic velocity limit of the foreign ceramic materials
increased as their flexural strength increased. Therefore ballistic limit protection of a
ceramic material appears well correlated with its flexural strength. Other materials
properties such as density, microindentation hardness, and grain size may be important
in determining the ballistic performance but do not directly correlate with the ballistic
performance. The porosity data does seem to show correlation between increased
porosity levels and ballistic performance data dispersion or scatter. As stated by
Medvedovski (2002) no single property appears to have a direct correlation with
ballistic performance, because the fracture mechanism during bullet impact is
complicated, and the crack formation and material rupture is caused by various stress
factors. Crack formation and rupture occurs in an extremely short time.
27


Chapter 6
Recommendations
Future work is needed in order to determine more accurately the correlation
between the ballistic limit velocity and the flexural strength. Other areas of study that
are worth investigating are the effects of different grain size (sub-µm), and lower
volume fraction (porosity), and manufacturing process on V so ballistic limit
performance of ceramic armors, and more samples need to be tested to improve
confidence of results obtained
29

List of Ref ere nee
3 1
Adams, J. W., Gilde, G. A., Burkins, M., and Franks L. (200 1). Microstructure Development of Aluminum/Titanium Diboride Composite for Penetration Resistance. Proceedings of the Ceramic Armor Materials by Design Symposium held at the Pac Rim IV International Conference on Advanced Ceramics and Glass, November 4-8, 2001in Wai/ea, Maui, Hawaii. Ed. James W. McCauley, Andrew Crowson, William A. Gooch, jr., A. M. Rajendran, Stephan J. Bless, Karhryn V. Logan, Michael Nonnandia, and Steven Wax: The American Ceramic Society, 2002. pages 629-634.
Air Force Materials Laboratory ( 1964). Investigation of the Effects of Stress Corrorsion on High-Strength Steel Alloys. Air Force Material Laboratory, Research and Technology Division, Air Force System Command, Wright-Patterson Air Force Base, Ohio, ML-TDR-64-3, February 1964.
Amos, C. W. ( 1990). Lightweight Armor Design Hanbook-Monolithic Armor. U.S. Army Laboratory Command, MTL-TR-90-40, August 1990.
ASTM C-1161 (2002). Standard Test Method for Flexural Strength of Advanced Ceramics at Ambient Temperature. ASTM International. 2002.
ASTM C-1326 (2003). Standard Test Method for Knoop Indentation Hardness of Advanced Ceramics. ASTM International. 2003.
Bartkowski, P., and Spletzer, S. (200 1). Porosity Effects on the Elastic Constants of Five Varieties of Silicon Carbide Ceramic. Army Research Laboratory, ARL-TR-2606, November 200 1.
Ceradyne, Inc (2003). Ceradyne's Boron Carbide and Silicon Carbide Ceramic: Property Comparison. Ceradyne, Inc, 3169 Redhill Costa Mesa, CA 92626, 2003.
Chinn, R. E. (2002). Ceramography: Preparation and Analysis of Ceramic Microstructures. ASM International, 2002.
ICDD (2004-2005). Powder Diffraction File and Related Products. The International Centre for Diffraction Data, 2004-2005.
Faber, K. S., and Meyer, L. W. ( 1995). Correlation between the Mechanical Data of Ceramics and Their Protective Power against Impact Loading. Final Report EB 6/95 (Part 3), Technical University Chemnitz-Zwickau, Department of Engineering Materials.
Krell, A., and Blank, P. ( 1995). Grain Size Dependence of Hardness in Dense Submicrometer Alumina. Journal of American Ceramic Society, Volume 78, No. 4, pages 1 1 18-1 120.
32

Krell, A., Strassburger, E., and Lexow, B., Ceramic Armor with Submicron Alumina against Armor Piercing Projectiles. Proceedings of the Ceramic Armor Materials by Design Symposium held at the Pac Rim IV International Conference on Advanced Ceramics and Glass, November 4-8, 2001in Wai/ea, Maui, Hawaii. Ed. James W. McCauley, Andrew Crowson, William A. Gooch, jr., A. M. Rajendran, Stephan J. Bless, Karhryn V. Logan, Michael Normandia, and Steven Wax: The American Ceramic Society, pages 83-90.
Lach, E. (1993). Mechanical Behavior of Ceramic and their Ballistic Properties. Cfi/Beer. DGK 70 (1993) No. 9, pages 486-490.
Mascianica, F. (1981). Ballistic Technology of Lightweight Armor. AMMRC-TR-81-20
Matchen, B. (1996). Application of Ceramics in Armor Products. Engineering Materials, Volumes 122-124, pages 333-342.
MatWeb (1996-2005). Material Properties Data. http//www.mateweb.com, 4/01/2005.
Medvedovski, E. (2002). Alumina Ceramics for Ballistic Protection. American Ceramic Society Bulletin, Volume 81, No. 4, pages 45-50.
Military Standard (1997). Department of Defense Test Method Standard, V 50 Ballistic Test for Armor. Department of Defense. MIL-STD-666F,
Military Specification (1982). Steel, Chrome-Nickel-Molybdenum (E4340) Bars and Reforging Stock. Department of Defense. Mil-S-5000E.
PAX-it (2001). Imaging System for Science and Industry. MIS, West Grand Avenue, Franklin, Park, IL, Version 3.2, 2001.
Przemienicki, J. S. (1993). Acquisition of Defense Systems. American Institute of Aeronautics and Astronautics, Inc, 1993.
Rozenberg, Z. and Yeshurun, Y. (1 988). The Relation between Ballistic Efficiency and
Compressive Strength of Ceramic Tiles. International Journal of Impact Engineering, Volume 7, No 3, pages 357-362.
33


Appendices
35

Appendix A
37

Metallic Laminates
BI-Metalllcs Metal/Composite Tl/Al Al/Kevlar
Bonded Ceramics
Metal llc Backing Composite Backing
Al, Tl S2, Graphite, Spectra
Figure A-1 : Laminate Armor Options
/ Fracture
Decelerate /.
Figure A-2: Penetrator Defeat Mechanism
38

Breakscreens
Witness Plate
Lawicher Test Sample
'----/ - - - - - - ----· ----·/··- - - --
-Firing
Yaw Card
o.s m-----
2500 mm ---- 1s2 mm
------- A ________ ,
Figure A-3 : Illustration of Ballistic Test Setup
Figure A-4: Steel Fame Mounting Bracket
39

Copper Jacket
Core
Lead
Figure A-5: 12.7 x 108 mm Armor Piercing Incendiary
40

Figure A-6: Etched Microstructures of Ceramic Materials Analyzed
41

• •
sown
.I
E
sown
- -
, . , .
. ..
•
•
Figure A-7: Unetched Microstructures of Ceramic Materials Analyzed
42

16
1.C
12
10
8
.. 2 ·
O ·
A B C
S1mplH
! IEID Grain Size -+- Poro.tty I
D E
Figure A-8: Grain Size and Porosity of Samples
43
16
1.C
12
10
l 8
.. 2
0

Figure A-9: Scanning Electron Microscopy of Materials Analyzed at 500x
44

Figure A-10: Scanning Electron Microscopy of Materials Analyzed at 2500x
45

800
700
600
a. 600 � i C
i 400
: 300
200
100
0 A B C D E
Samples
Figure A-1 1 : Flexural Strength (at brittle fracture) from 3-Point Bending of Samples
700
600
600
i .coo C
"ii 300
200
100
0 A B C
SamplH
i� AVERAGE D STDEV I
0 E
Figure A-12: Statistical Analysis of Samples Flexural St�ength
46

3600
3260
3000
2760
2600
l 2260
c!5. 2000 • • 1760
1500 :I:
0 1260 0
1000
760
500
260
0
3600
3000
- 2600 "'e
� 2000 • •
1600 :I:
1000
600
0
A B C 0
SamplH
Figure A-13: Microindentation Hardness of Samples
A B C
11.'!l AVERAGE a STDEV I
D
E
E
Figure A-14: Statistical Analysis of Samples Microindentation Hardness
47

3.500
3.000
2.600
u :! 2.000
1 .600
1 .000
0.600
0.000
3.600
3.000
2.600
u i 2.000
1 .600 �
1 .000
0.600
0.000
B C Samples
D
Figure A-15: Density Measurement of Samples
B C D
laAVERAGE •STDEVI
E
Figure A-16: Statistical Analysis of Samples Density
48
E

600
460
400
8 § 0 I
-- .... n \�J ll• -
� L� i�, >- iii i•� l1 � •
• •
200 n
160
• 100
A B C D E A!S1 4340
Io Complete • Partial • V60 I
Figure A-17: Single Shot Ballistic Results of Ceramic Samples
-400 1600
360 1400
300 1200
• S 260 1000 !,
i
i 200 800
al 160 600 -l
100 400
60 200
0 0
A B C D E AISl 4340
SamplH
I� V60 Balllttlc Limit -+- Flexural Strength I
Figure A-18: V50 Ballistic Limit Velocity and Flexural Strength
49

400
360
300
260
E
200
'° 1 60
-J
100
60
0
A B C D
SamplH
I� WO Balllltlc Limit -+-- HardnHa I
E AISl 4340
Figure A-19: V50 Ballistic Limit Velocity and Knoop Hardness
360
300
• S 260
E :J u 200
'° 160 I
60
0
A B C D E AISl .f�O
SamplH
I � V60 Balllltlc Limit -+-- Den11ty I
Figure A-20: V so Ballistic Limit Velocity and Density
50
16
14
1 2
10
6
4
2
0

16
14
12
10
8
6
4
2
0
A 8 C S1mplt1
I UZ2.I Grain Size -+-Poro11ty I
D E
Figure A-21 : V50 Ballistic Limit Velocity and Grain Size
16
14
12
10
l 8
6
4
2
0
400.00 ..------------------------------,- 16
360.00
300.00
S 260.00
i 200.00
co 160.00 l
100.00
60.00
0.00 A 8 C 0 E AISl 4340
S1mplt1
i m., V60 Balllatic Limit -+- Porollty I
Figure A-22 : V50 Ballistic Limit Velocity and Porosity
5 1
14
12
10
l 8 i e
:
I 4
2
0


Appendix B
53

Table B-1 : Summary of Ceramic Composite Ballistic Materials
Samples Panels Description
A Polycarbonate/Silicon Carbide/Carbon/ Spectra Shield/Kevlar
B Carbon/Silicon Carbide/Twaron C Twaron/Silicon Carbide/Twaron D Twaron/Silicon Carbide/Twaron E Kevlar/Boron Carbide/Kevlar
Table B-2 : Summary of Projectile Physical Dimension
Projectile Core/Penetrator
Length Diameter Weight Material Length Diameter Weight (mm) (mm) (grains) (mm) (mm) (grains) 64.516 12.979 745 Steel 52.578 10.846 464
Lead 105 Source: Amos, 1990
Table B-3 : Summary of 3-Point Bending Flexural Strength (MPa)
A B C D E
466 626 313 686 478 415 633 604 750 317 438 452 435 772 241 402 598 588 397 455 657 593 352 406 491 709
AVERAGE
385 496 516 683 397
STDEV
± 80 ± 106 ± 129 ± 78 ± 114
54

Table B-4: Summary of Microindentation Hardness Measurements (kg,lmm2)
A B C D E 2310 2174 2326 2257 3233 2365 2301 2318 2352 2855 2269 2261 2444 2297 2976 2249 2217 2229 2209 2564 2348 2141 2408 2163 3068 2356 2167 2269 2326 3249 2233 2326 2273 2426 3221 2395 2356 2213 2261 3258 2360 2205 2152 2277 3125 2213 2186 2190 2257 3176
AVERAGE 2310 2233 2282 2283 3073
STDEV
± 64 ± 74 ± 93 ± 74 ± 222
Table B-5: Summary of Density Measurements (g/cm3)
A B C D E 3.1654 3.2377 3.2366 3.2206 2.5212 3. 1655 3.2376 3.2363 3.2206 2.5205 3.1666 3.2373 3.2357 3.2200 2.5216 3.1660 3.2375 3.2348 3.2205 2.5232 3.1662 3.2377 3.2367 3.2202 2.5209
AVERAGE 3 . 1659 3.2376 3 .2360 3 .2204 2.52 1 5
STDEV ±0.0005 ±0.0002 ±0.0008 ±0.0003 ±0.0010
55

Table B-6: Ceradyne's Silicon Carbide and Boron Carbide Ceramic Property
Process Hot Pressing (SiC) Sintering (SiC) Hot Pressing (B4C)
Purity 98.5% 95% >98.5% Density 3.20 3.20 2.5
Flexural Strength 634 400 410 Knoop Hardness 2300 2600 3200
Samples B, C, & E A E Source: Ceradyne, Inc., 2003
56

Table B-7: Single Shots Ballistic Results of the Ceramic Opaque Composite Armors
Samples Velocity (mis) P/C Vso (mls) Spread (mis) A 381 C 292 24
A 361 C a
A 314 C
A 305 C
A 299 C
A 297 C
A 283 C
A 209 C
A 307 p
A 282 p
A 255 p
A 254 p
A 1 19 p
B 375 C 302 22
B 369 C a
B 347 C
B 334 C
B 327 C
B 3 10 C
B 303 C
B 307 p
B 288 p
C 383 C 321 30
C 350 C a
C 348 C
C 342 C
C 339 C
C 329 C
C 322 C
C 300 C
C 336 p
C 323 p
C 3 10 p
C 309 p
C 291 p
C 265 p
D 387 C 372 29
D 385 C a
D 383 C
D 377 C
D 376 C
D 375 C
D 379 p
D 369 p
D 364 p
D 358 p
D 356 p
D 341 p
E 354 C 314 38
E 337 C a
E 329 C
E 326 C
E 324 C
E 322 C
E 310 p
E 3 10 p
E 290 p
57


Appendix C
59

Sectioning
Equipment:
Settings:
Mounting
Equipment: Settings:
Polishing
Equipment: with
Settings:
Ceramography Protocols
Buehler Isomet 1000 Diamond Saw with 6" diamond blade (medium concentration)
Speed - 975 rpm, Load - 500 grams, and Lubricant - 2% solution of Allied cutting fluid
Buehler 1.25" mounting cups, vacuum mounting chamber 5:3 ratio of Buehler low-viscosity epoxy to hardener, Vacuum applied for 10 minutes, and Mounts cured overnight
Buehler Ecomet IV/ Automet III Automated polishing system;
five-sample holder. See Table A.1
Table C-1 : Polishing Procedure for Silicon Carbide and Boron Carbide
Surface Time Pressure Speed Polishing
Lubricant Direction (legs/sample) (rpm) A2ent
Buehler 45 µm Until
3.628 kgs 1 50 Metadi +
Clockwise Diamond Flat
none tap water
Disc Buehler 1 5
µm 4 3 . 175 kgs 1 50
Metadi + Counterclockwise
Diamond min none
tap water Disc
Buehler 4 3 . 1 75 kgs 1 50
6 µ.m Metadi Counterclockwise
Texmet min Diamond
Buehler 4 3 . 175 kgs 1 50
3 µ.m Metadi Counterclockwise
Texmet min Diamond
Buehler 4 3 . 1 75 kgs 1 50
Masterpolish DI water Clockwise
Microcloth min 2
60

Chemical Etching (Silicon Carbide)
Equipment: Settings:
Hot plate, beakers tongs Murkami 's reagent - 60g potassium ferricyanide, 60g potassium hydroxide, 120 ml H
20, Etchant brought to a boil; samples
immersed 10-15 minutes
Electrolytic Etching (Boron Carbide)
Equipment: Power Supply, plastic test cell, magnetic stirrer Settings: Electrolyte 1 % KOH, 1 OV, 0.2 A/cm2, 30 seconds with agitation
X-Ray Diffraction Test Protocol
Sample Preparation
Samples sectioned to 1 cm2 area and 1.5875 mm thick. Sample surfaces smoothed with 15 µm diamond disc Sample pieces affixed to circular Teflon XRD sample holders with double-sided tape
XRD Test Parameters
Instrument: Power: Count Time: Step Size: Scan Range:
Sample Preparation
Siemens (Bruker) D5005 45kV, 40 mA 1 sec 0.04° 28 30° to 75° 28
Flexure Testing Protocol
Samples sectioned to 4.064 x 3.048 x 45.72 mm in size Sample surfaces smoothed in two stages with 45 µm diamond disc, followed by 45 µm diamond disc
Flexure Test Parameters
Instrument: Load Cell: Bearing Diameters:
Instron Model 1000 453.59 kgs 9.525 mm
61

Load Diameter: Support Span: Crosshead Speed:
9.525 mm 38. 1 mm 0.508 cm/min
Microindentation Measurement Protocol
Sample Preparation
Samples were prepared by polishing as described in Table A. l ; samples were not relief polish or etched. Samples Size: 0.5 cm2
Microindentation Parameters
Load: Dwell Time: Number of Runs:
Sample Preparation
O g
15 seconds 10
Density Measurements Protocol
Samples sectioned to fit in l ee pycnometer cup Samples weighed to nearest 0.0001g
Helium Pycnometry Test Parameters
Instrument: Gas: Number of purges: Number of runs: Run Precision Criteria:
Micromeritics Accupyc 1330 (1 cc) model Ultra high purity helium 15 20 0.02%
62

Appendix D
63
350
300-
250
5D
X-Ray Diffraction (XRD) Plots
- Sample A
0 +r-__..-...ui�i,l;IC.l,l-.���--...... -...,......,......_�....__...._.....__iaflllllllE..Jla� 30 35 40 45
30 3.5 4.5 .50
30 3.5 4.5 .50
I I 30 3.5 40 4.5 .50
50 55 60
2-theta (deg)
65
-SiC Hexagonal 6H PDF # 29- 1 1 3 1
.5.5 60 6.5 70
-5i C Hexagonal PD F # 4 9- 1 4 28
.5.5 60 6.5 70
70
7.5
7.5
-SiC Cubic JC PD F # 29- 1 1 291
I I I
.5.5 60 6.5 70 7.5
64
15

- Sample B
0 +-.-a.iL��� ................. -trl.l ... _...-_--.-;�--�---�---��..lad.:....r..
30
30 35 40 45
30 35 40 45
I I 30 35 40 45
50 55 60
2-theta (deg)
65 10
-SiC Hexagonal 6H PDF # 29- 1 1 3 1
50 55 60 65 70
-SiC Hexagonal PDF # 49- 1428
50 55 60 65 70
15
75
-SiC Cubic 3C PDF # 29- 1 1 291
l I I '
50 55 60 65 70 15
65
15

-Sample C 500
400
300 ..... · -. .:,a
..... 20 .£i 1 00
0
30 35 40 45 50 55 60 65 70 75
2-theta ( deg)
-SiC Hexagonal 6H PDF # 29- 1 13 1
30 35 40 45 50 55 60 65 70 75
-SiC Hexagonal PDF # 49- 1428
30 35 40 45 50 55 60 65 10 15
I I I
-SiC Cubic 3C PDF # 29-;
1291 .
' I I I '
30 35 40 45 50 55 60 65 10 15
66

- Sample D
o...-_....-X.lf�lal:..--.�---.-,.liillla.--------�..m ..... �-..-..lllfLll-..--...,.l....lilll!!Clilloar,
30 35 40 45
30 35 40 45 50
I I I I
30 35 40 45 50
I I 30 3.5 40 4.5 .50
50 55 60
2-theta (deg)
65 70
- SiC Hexagonal 6H PDF # 29- 1 1 3 1
55 60 65 10 15
-SiC Hexagonal PDF # 49-1428
I
55 60 65 70 15
-SiC Cubic 3C PDF # 29- 1 1 29
I . .5.5 60 65 70 15
67
15
40 45
I
30 35 40 45
30 35 40 45
I I I 30 35 40 45
50 55 60
2-theta (deg)
Sample E
65 10
-B4C Boron Carbide PDF # 35-0798
I I I I I l .t I
50 55 60 65 10 15
-SiC Hexagonal PDF # 49- 1428
50 55 60 65 10 15
-SiC Cubic 3C PDF # 29- 1 1 291
I I I
50 55 60 65 10 15
68
15
Vita
Adolphus McDonald, Jr. was born in Syracuse, New York on October 8, 1960.
He grew up on the south side of Syracuse, New York where he went to grade school at
Percy Hughes, and high school at Roosevelt Junior High. He graduated from Christian
Brothers Academy in 1978. From there, he went to Alabama A & M University, at
Normal, Alabama, and received a Bachelor of Science degree in Mechanical
Engineering Technology in 1982. From there he went to the University of Alabama,
Huntsville, and received Bachelor of Science degree in Mechanical Engineering in
1992.
Adolphus will be receiving his Master of Science degree in Engineering Science
at the University of Tennessee, Knoxville, December 2005.
69

7695 2036 48 ('J l3AIVH6 l� '