a study of monetary integration in west africa and its
TRANSCRIPT
A study of monetary integration in West Africa and its implications on trade in Africa
RabnawazKhan1*
1SchoolofFinanceandEconomics,JiangsuUniversity,Zhenjiang,Jiangsu,Zhenjiang212013,People’[email protected]
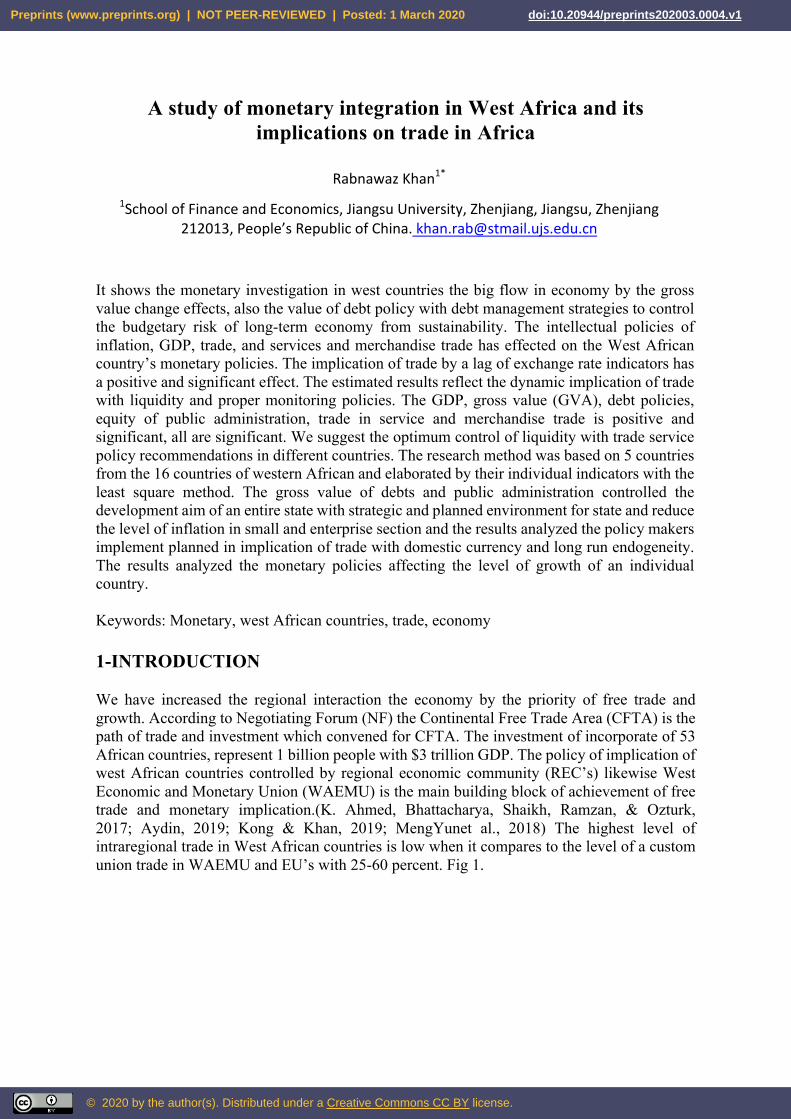
It shows the monetary investigation in west countries the big flow in economy by the gross value change effects, also the value of debt policy with debt management strategies to control the budgetary risk of long-term economy from sustainability. The intellectual policies of inflation, GDP, trade, and services and merchandise trade has effected on the West African country’s monetary policies. The implication of trade by a lag of exchange rate indicators has a positive and significant effect. The estimated results reflect the dynamic implication of trade with liquidity and proper monitoring policies. The GDP, gross value (GVA), debt policies, equity of public administration, trade in service and merchandise trade is positive and significant, all are significant. We suggest the optimum control of liquidity with trade service policy recommendations in different countries. The research method was based on 5 countries from the 16 countries of western African and elaborated by their individual indicators with the least square method. The gross value of debts and public administration controlled the development aim of an entire state with strategic and planned environment for state and reduce the level of inflation in small and enterprise section and the results analyzed the policy makers implement planned in implication of trade with domestic currency and long run endogeneity. The results analyzed the monetary policies affecting the level of growth of an individual country. Keywords: Monetary, west African countries, trade, economy 1-INTRODUCTION We have increased the regional interaction the economy by the priority of free trade and growth. According to Negotiating Forum (NF) the Continental Free Trade Area (CFTA) is the path of trade and investment which convened for CFTA. The investment of incorporate of 53 African countries, represent 1 billion people with $3 trillion GDP. The policy of implication of west African countries controlled by regional economic community (REC’s) likewise West Economic and Monetary Union (WAEMU) is the main building block of achievement of free trade and monetary implication.(K. Ahmed, Bhattacharya, Shaikh, Ramzan, & Ozturk, 2017; Aydin, 2019; Kong & Khan, 2019; MengYunet al., 2018) The highest level of intraregional trade in West African countries is low when it compares to the level of a custom union trade in WAEMU and EU’s with 25-60 percent. Fig 1.
Preprints (www.preprints.org) | NOT PEER-REVIEWED | Posted: 1 March 2020 doi:10.20944/preprints202003.0004.v1
© 2020 by the author(s). Distributed under a Creative Commons CC BY license.
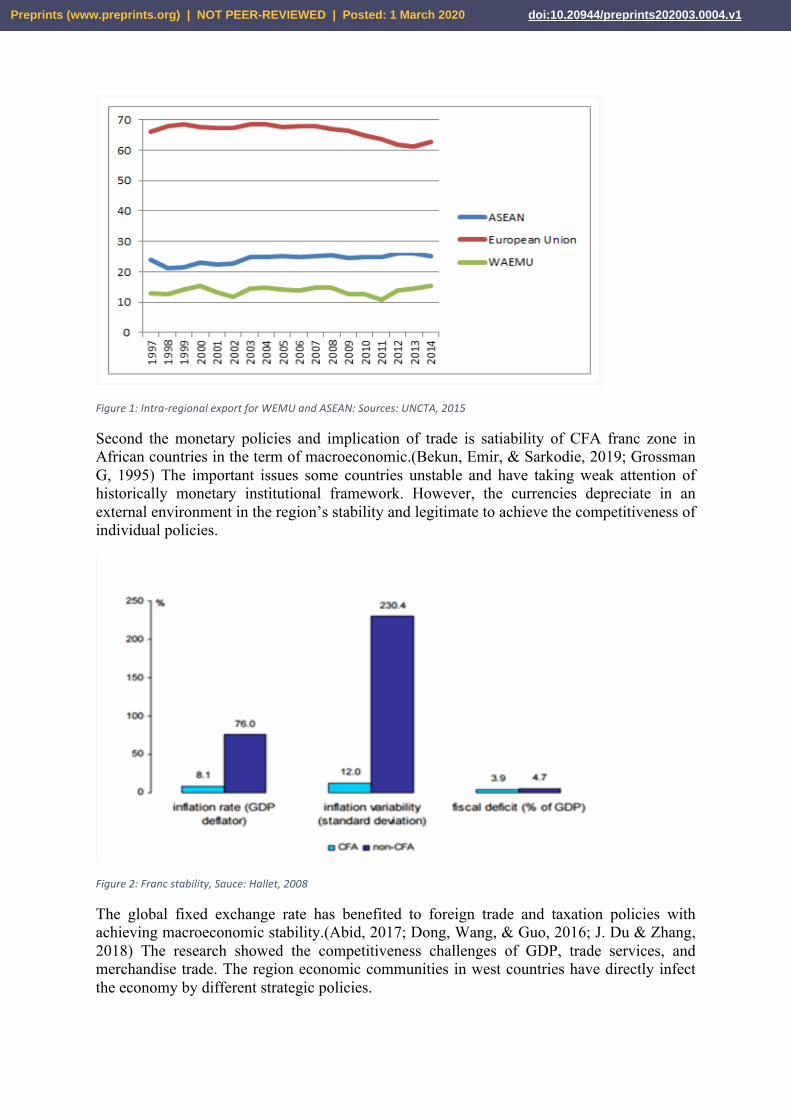
Figure1:Intra-regionalexportforWEMUandASEAN:Sources:UNCTA,2015
Second the monetary policies and implication of trade is satiability of CFA franc zone in African countries in the term of macroeconomic.(Bekun, Emir, & Sarkodie, 2019; Grossman G, 1995) The important issues some countries unstable and have taking weak attention of historically monetary institutional framework. However, the currencies depreciate in an external environment in the region’s stability and legitimate to achieve the competitiveness of individual policies.
Figure2:Francstability,Sauce:Hallet,2008
The global fixed exchange rate has benefited to foreign trade and taxation policies with achieving macroeconomic stability.(Abid, 2017; Dong, Wang, & Guo, 2016; J. Du & Zhang, 2018) The research showed the competitiveness challenges of GDP, trade services, and merchandise trade. The region economic communities in west countries have directly infect the economy by different strategic policies.
Preprints (www.preprints.org) | NOT PEER-REVIEWED | Posted: 1 March 2020 doi:10.20944/preprints202003.0004.v1
The prior research implication based on economic development and south African country’s economic policies and didn’t mention th(Adom & Kwakwa, 2014)e strategic policies regarding individual expect of foreign exchange rate, federal economic development trade and effected issues of GDP by CFA.(Adom & Kwakwa, 2014) Therefore, this research is most import issues weighted and determined the strategic policy with CPIA debt policies, inflation, GDP deflator, trade services, trade (GDP),(G. Du, Liu, Lei, & Huang, 2018; Riaz et al., 2018) merchandise trade and merchandise export. We base the second section of this research on the literature. We base the third section of this research on the method. 4th section showed results and analysis and final section held with recommendation and conclusion. 2. Literature We base prior research on implemented policies and strategic changes in sub-Saharan countries and highlighted the issues of economic development with individual effects. The convergence member of countries showed i.e. inflation, growth, per capita and currency union. (Coleman, 2010; Harvey & Cushing, 2015)The common stock of macroeconomic policies more in under developing countries, which makes a common strategic policy for individual states. Several theories in literature is showing the impact of policy regarding the monitoring policies, which created on asset prices, patents, development and growing of economy. The systematical approach of the theories effects on economics variables.(Button, Martini, Scotti, & Volta, 2019; Osabutey & Jackson, 2019) the first view is liquidity approach emphasized the increasing liquidity, asset prices increase, and it acts as a link in the transmission of liquidity assets on the economic activities with the wide range of development skills and determined policies of an individual government.(Bensassi & Jarreau, 2019; Tsao et al., 2019) the other expects of low and stable inflation cause of lack of monitoring policies in stabilizing the high level of investment.(Keho, 2017; Yaya, Ling, Furuoka, Rose Ezeoke, & Jacob, 2019) 2nd the presented a dynamic equilibrium of monitoring policies based on the bubble in asset prices, in addition poor monetary policy design such as rate rules of sustainable long-term inflation. 3rdthe trend survey of effect on money and monetary policy on asset prices including the exchange rate the monetarist theory effects on uncertainty, government policies and economic growth. The high-quality boom of assets price, growth of monetary supply and investment. (Asongu, Folarin, & Biekpe, 2019; Mikayilov, Hasanov, & Galeotti, 2018; Riaz et al., 2018)Therefore, the prior of research implicated the trade in big rule and hold the effect of a portfolio of a financial institution regarding huge investment and development policies. 4th the policies of investment in a different channel by self-crating the huge gap in monetary policies, where the different price channel has tagging different prices level, credit ratio, exchange rate cause of the intellectual policies of inflation, GDP, trade and services and merchandise trade has effected on the west African countries monetary policies. The rate of a channel determined the effects on price and exchange rate (K. Ahmed, Bhattacharya, M., Shaikh, Z., Ramzan, M., & Ozturk, I 2017; Cham, 2016). The exchange rate channel, other asset price channels, and the credit channel. Since the present study surveys the impact of monetary policy on the exchange rate, it determines the level of intensity in financing. (Al-Mulali, Ozturk, & Solarin, 2016; Apergis & Ozturk, 2015) . The countries competitiveness will need to ensure the macroeconomic stability, which improved the business climate of trade, reduce the hard infrastructure stability and technology with transfer infrastructure gap.(Bo, 2015; Schwerhoff & Sy, 2017; Zhao & Kim, 2009) The investment of trade and strategic policies of economic development such as skills has increased agriculture as well with adept policies, training and extension program and build capabilities
Preprints (www.preprints.org) | NOT PEER-REVIEWED | Posted: 1 March 2020 doi:10.20944/preprints202003.0004.v1
of domestic firms.(Acheampong, 2018 Awad & Abugamos, 2017; Harvey & Cushing, 2015) The structural transformation will require leverage of the ICT sector of productivity, financial tie and domestic macroeconomics frameworks. 3-DATA, MODEL AND RESULTS We base this research paper research method on liner regression between gross value, CPIA debt policies, public administration with regional trade, GDP per capita, service in trade, trade of an individual,(Harding, 2007; Im, Pesaran, & Shin, 2003; Zhang, Liao, & Hao, 2018) merchandise trade and export of low income economy. It shows the stability of model the strategic policies,, so the results conducted by the regression. In a first step unit root is taking for the stationary and non-stationary level of intimal of 5 countries from the 16 west African countries. Table1:Indicators
Indicators (Benin, Burkina Faso, Ghana, Guinea, Guinea-Bissau) Indicator WB Symbol Gross value added at basic prices (GVA) (current US$) NY.GDP.FCST.CD GVA CPIA debt policy rating (1 = low to 6 = high) IQ.CPA.DEBT.XQ CPIAD CPIA quality of public administration rating (1=lowto 6=high) IQ.CPA.PADM.XQ CPIAQ Inflation, GDP deflator (annual %) NY.GDP.DEFL.KD. ZG IGD GDP per capita (current US$) NY.GDP.PCAP.CD GDPPC Trade in services (% of GDP) BG.GSR.NFSV.GD.ZS TS Trade (% of GDP) NE.TRD.GNFS.ZS TR Merchandise trade (% of GDP) TG.VAL.TOTL.GD.ZS MTG Merchandise exports to low- and middle-income economies within region (% of total merchandise exports) TX.VAL.MRCH.WR.ZS MEL
It indicates Table 1 the gross values of different indicators as per indicator codes. The strategic policies have been transit with 9 indicators and individually defined with the period of 1960-2018. However, the export level of merchandise. (Perron, 1988; Sinha & Shahbaz, 2018) 3. RESULTS AND ANALYSIS The results and analysis were analyzed using the liner method. In 1st stage mean deviation of individual variables have been taking by skewness and Kurtosis, and the deviation analyzed by mean and standard deviation. The mean deviation is greater from the standard deviation. The individual indicator shows a significant effect on each individual variable(Cheng, Ren, Wang, & Yan, 2019; Im et al., 2003; Saqib, Ahmad, & Amezcua-Prieto, 2018; Zhao & Kim, 2009).
Preprints (www.preprints.org) | NOT PEER-REVIEWED | Posted: 1 March 2020 doi:10.20944/preprints202003.0004.v1
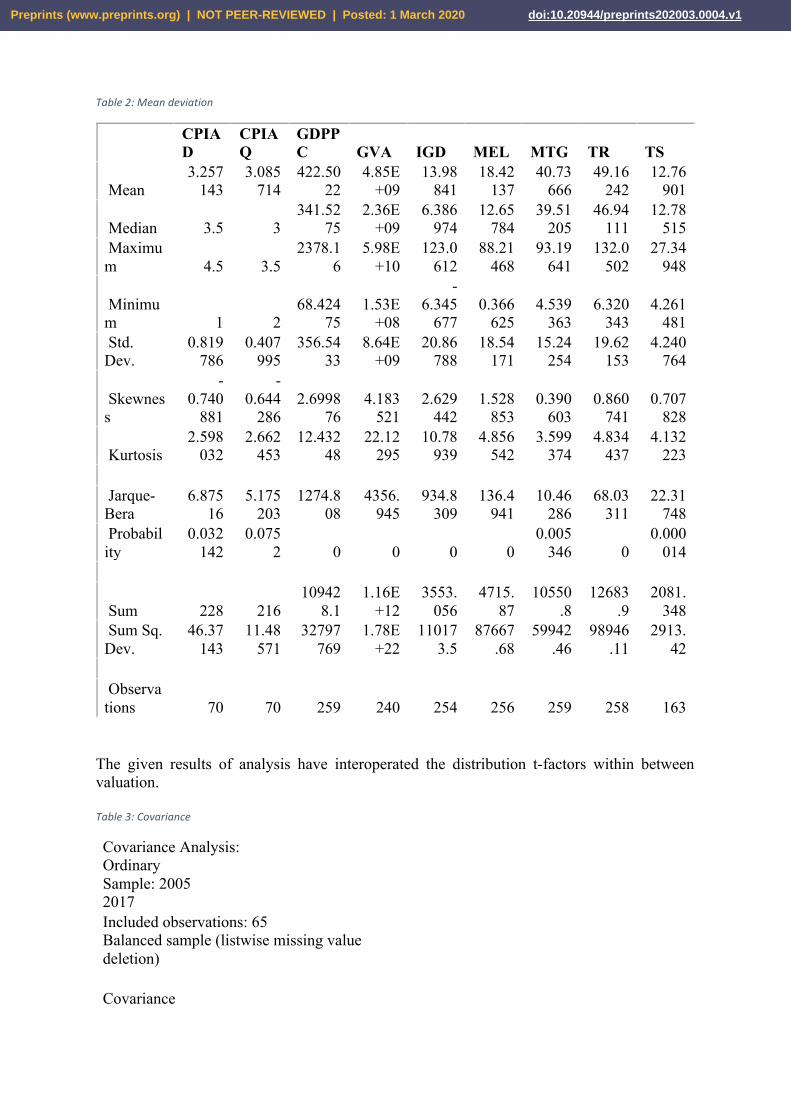
Table2:Meandeviation
CPIAD
CPIAQ
GDPPC GVA IGD MEL MTG TR TS
Mean 3.257
143 3.085
714 422.50
22 4.85E
+09 13.98
841 18.42
137 40.73
666 49.16
242 12.76
901
Median 3.5 3 341.52
75 2.36E
+09 6.386
974 12.65
784 39.51
205 46.94
111 12.78
515 Maximum 4.5 3.5
2378.16
5.98E+10
123.0612
88.21468
93.19641
132.0502
27.34948
Minimum 1 2
68.42475
1.53E+08
-6.345
677 0.366
625 4.539
363 6.320
343 4.261
481 Std. Dev.
0.819786
0.407995
356.5433
8.64E+09
20.86788
18.54171
15.24254
19.62153
4.240764
Skewness
-0.740
881
-0.644
286 2.6998
76 4.183
521 2.629
442 1.528
853 0.390
603 0.860
741 0.707
828
Kurtosis 2.598
032 2.662
453 12.432
48 22.12
295 10.78
939 4.856
542 3.599
374 4.834
437 4.132
223 Jarque-Bera
6.87516
5.175203
1274.808
4356.945
934.8309
136.4941
10.46286
68.03311
22.31748
Probability
0.032142
0.0752 0 0 0 0
0.005346 0
0.000014
Sum 228 216 10942
8.1 1.16E
+12 3553.
056 4715.
87 10550
.8 12683
.9 2081.
348 Sum Sq. Dev.
46.37143
11.48571
32797769
1.78E+22
110173.5
87667.68
59942.46
98946.11
2913.42
Observations 70 70 259 240 254 256 259 258 163
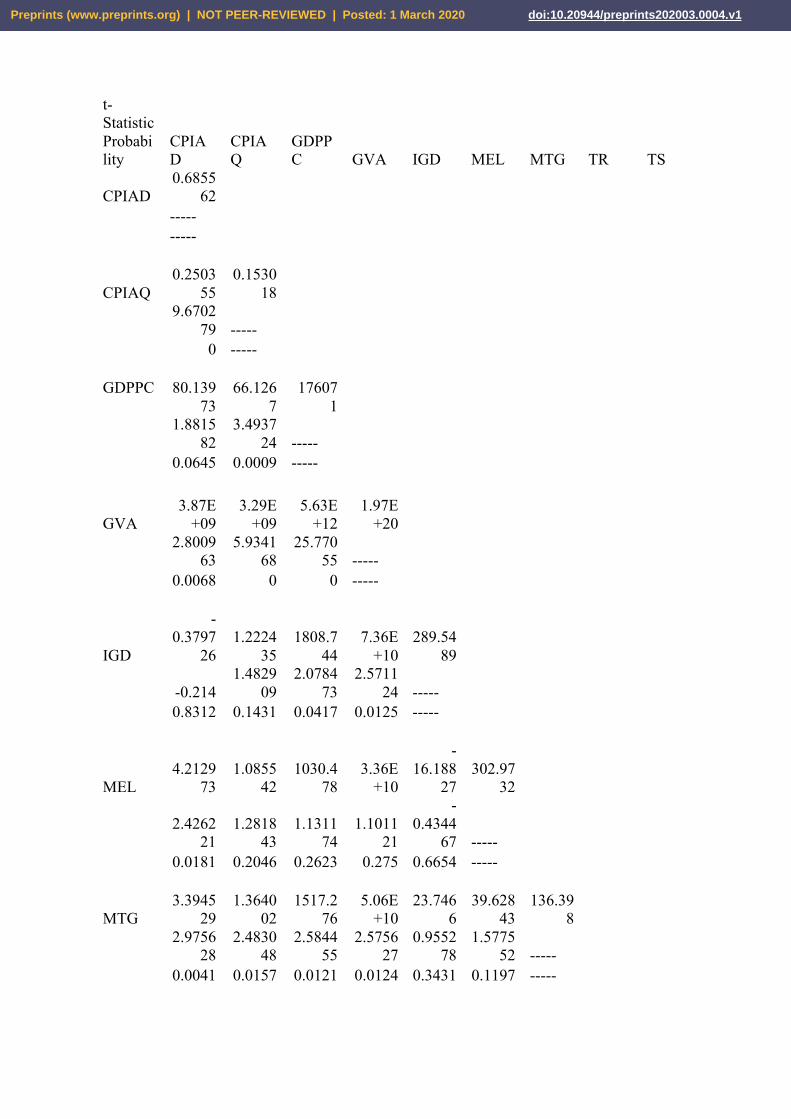
The given results of analysis have interoperated the distribution t-factors within between valuation. Table3:Covariance
Covariance Analysis: Ordinary Sample: 2005 2017 Included observations: 65 Balanced sample (listwise missing value deletion) Covariance
Preprints (www.preprints.org) | NOT PEER-REVIEWED | Posted: 1 March 2020 doi:10.20944/preprints202003.0004.v1
t-Statistic Probability
CPIAD
CPIAQ
GDPPC GVA IGD MEL MTG TR TS
CPIAD 0.6855
62 ----- -----
CPIAQ 0.2503
55 0.1530
18
9.6702
79 ----- 0 ----- GDPPC
80.13973
66.1267
176071
1.8815
82 3.4937
24 ----- 0.0645 0.0009 -----
GVA 3.87E
+09 3.29E
+09 5.63E
+12 1.97E
+20
2.8009
63 5.9341
68 25.770
55 ----- 0.0068 0 0 -----
IGD
-0.3797
26 1.2224
35 1808.7
44 7.36E
+10 289.54
89
-0.214 1.4829
09 2.0784
73 2.5711
24 ----- 0.8312 0.1431 0.0417 0.0125 -----
MEL 4.2129
73 1.0855
42 1030.4
78 3.36E
+10
-16.188
27 302.97
32
2.4262
21 1.2818
43 1.1311
74 1.1011
21
-0.4344
67 ----- 0.0181 0.2046 0.2623 0.275 0.6654 -----
MTG 3.3945
29 1.3640
02 1517.2
76 5.06E
+10 23.746
6 39.628
43 136.39
8
2.9756
28 2.4830
48 2.5844
55 2.5756
27 0.9552
78 1.5775
52 ----- 0.0041 0.0157 0.0121 0.0124 0.3431 0.1197 -----
Preprints (www.preprints.org) | NOT PEER-REVIEWED | Posted: 1 March 2020 doi:10.20944/preprints202003.0004.v1
TR
-0.1203
82 0.8126
54 2488.3
52 7.59E
+10 63.690
64
-17.782
76 152.64
74 272.77
75
-0.0698
75 1.0063
84 3.0535
53 2.7489
93 1.8468
42
-0.4919
21 10.274
79 ----- 0.9445 0.3181 0.0033 0.0078 0.0695 0.6245 0 -----
TS 0.7175
98 0.4617
66 965.82
95 3.52E
+10 3.8742
5 9.6454
11 14.466
73 14.383
65 20.81
71
1.5356
7 2.1259
66 4.6376
05 5.2250
46 0.3965
78 0.9711
93 2.2389
91 1.5434
21 ----- 0.1296 0.0374 0 0 0.693 0.3352 0.0287 0.1277 -----
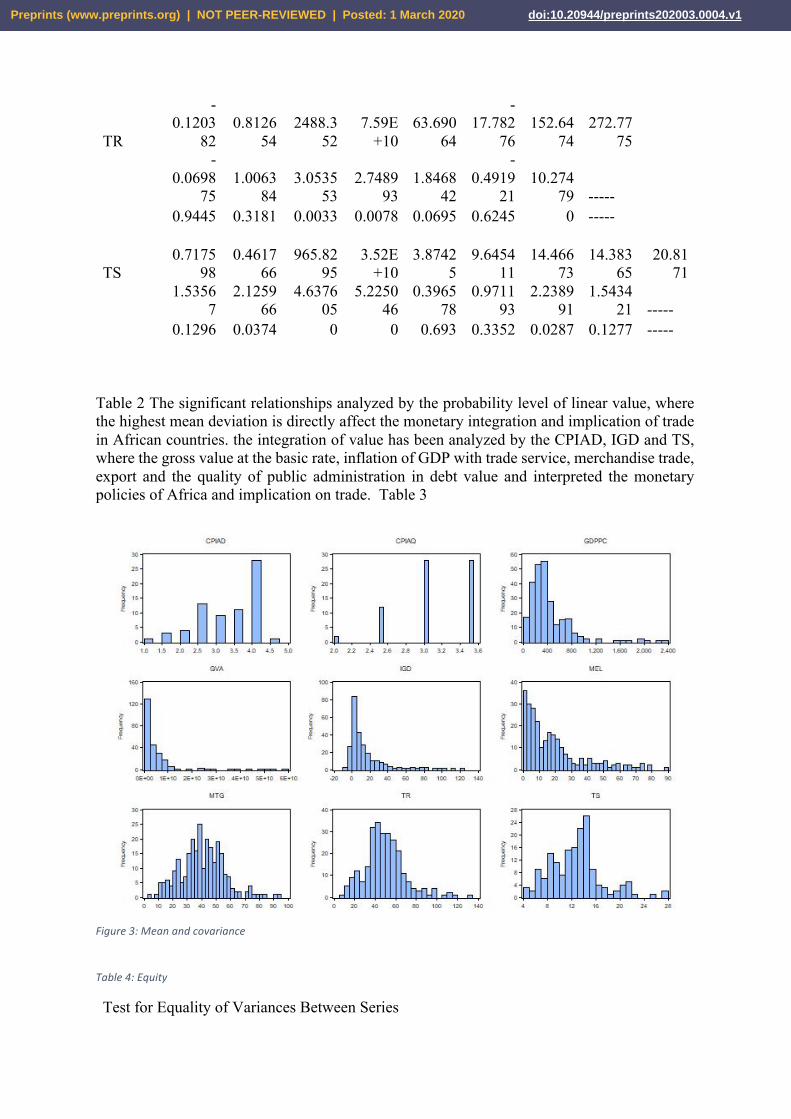
Table 2 The significant relationships analyzed by the probability level of linear value, where the highest mean deviation is directly affect the monetary integration and implication of trade in African countries. the integration of value has been analyzed by the CPIAD, IGD and TS, where the gross value at the basic rate, inflation of GDP with trade service, merchandise trade, export and the quality of public administration in debt value and interpreted the monetary policies of Africa and implication on trade. Table 3
Figure3:Meanandcovariance
Table4:Equity
Test for Equality of Variances Between Series
Preprints (www.preprints.org) | NOT PEER-REVIEWED | Posted: 1 March 2020 doi:10.20944/preprints202003.0004.v1
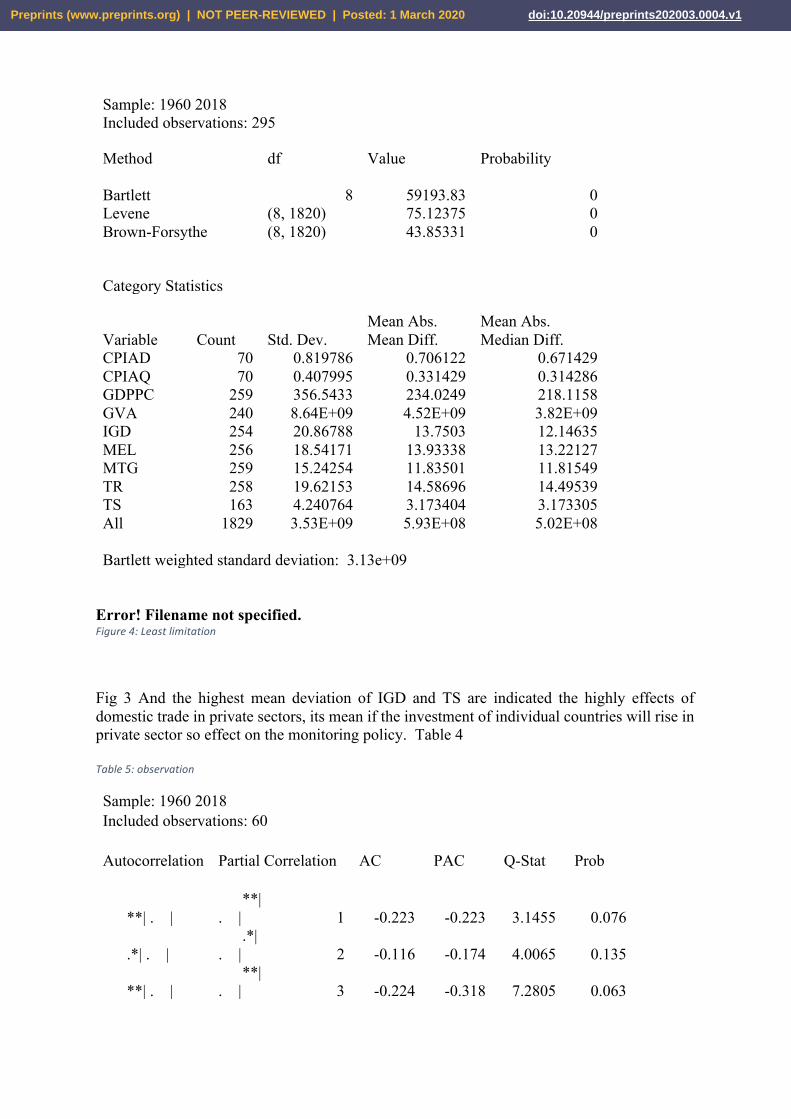
Sample: 1960 2018 Included observations: 295 Method df Value Probability Bartlett 8 59193.83 0 Levene (8, 1820) 75.12375 0 Brown-Forsythe (8, 1820) 43.85331 0 Category Statistics Mean Abs. Mean Abs. Variable Count Std. Dev. Mean Diff. Median Diff. CPIAD 70 0.819786 0.706122 0.671429 CPIAQ 70 0.407995 0.331429 0.314286 GDPPC 259 356.5433 234.0249 218.1158 GVA 240 8.64E+09 4.52E+09 3.82E+09 IGD 254 20.86788 13.7503 12.14635 MEL 256 18.54171 13.93338 13.22127 MTG 259 15.24254 11.83501 11.81549 TR 258 19.62153 14.58696 14.49539 TS 163 4.240764 3.173404 3.173305 All 1829 3.53E+09 5.93E+08 5.02E+08 Bartlett weighted standard deviation: 3.13e+09
Error! Filename not specified. Figure4:Leastlimitation
Fig 3 And the highest mean deviation of IGD and TS are indicated the highly effects of domestic trade in private sectors, its mean if the investment of individual countries will rise in private sector so effect on the monitoring policy. Table 4 Table5:observation
Sample: 1960 2018 Included observations: 60 Autocorrelation Partial Correlation AC PAC Q-Stat Prob
**| . | **| . | 1 -0.223 -0.223 3.1455 0.076
.*| . | .*| . | 2 -0.116 -0.174 4.0065 0.135
**| . | **| . | 3 -0.224 -0.318 7.2805 0.063
Preprints (www.preprints.org) | NOT PEER-REVIEWED | Posted: 1 March 2020 doi:10.20944/preprints202003.0004.v1
. |*. | . | . | 4 0.17 -0.003 9.195 0.056
. | . | .*| . | 5 -0.052 -0.113 9.376 0.095
. | . | .*| . | 6 -0.002 -0.093 9.3762 0.153
. | . | . | . | 7 -0.008 -0.014 9.3805 0.226
. | . | .*| . | 8 -0.006 -0.079 9.3832 0.311
. | . | . | . | 9 -0.003 -0.039 9.3838 0.403
. | . | . | . | 10 0.001 -0.028 9.3838 0.496
. | . | . | . | 11 -0.003 -0.048 9.3847 0.586
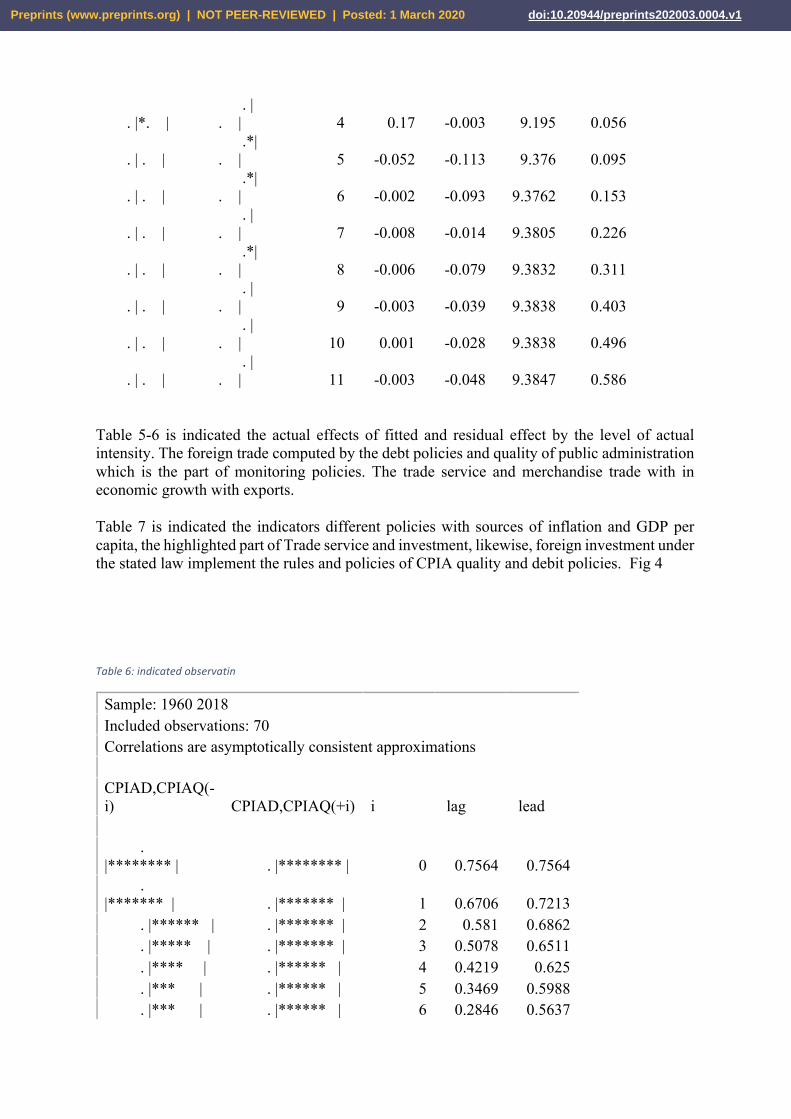
Table 5-6 is indicated the actual effects of fitted and residual effect by the level of actual intensity. The foreign trade computed by the debt policies and quality of public administration which is the part of monitoring policies. The trade service and merchandise trade with in economic growth with exports. Table 7 is indicated the indicators different policies with sources of inflation and GDP per capita, the highlighted part of Trade service and investment, likewise, foreign investment under the stated law implement the rules and policies of CPIA quality and debit policies. Fig 4 Table6:indicatedobservatin
Sample: 1960 2018 Included observations: 70 Correlations are asymptotically consistent approximations CPIAD,CPIAQ(-i) CPIAD,CPIAQ(+i) i lag lead . |******** | . |******** | 0 0.7564 0.7564 . |******* | . |******* | 1 0.6706 0.7213 . |****** | . |******* | 2 0.581 0.6862 . |***** | . |******* | 3 0.5078 0.6511 . |**** | . |****** | 4 0.4219 0.625 . |*** | . |****** | 5 0.3469 0.5988 . |*** | . |****** | 6 0.2846 0.5637
Preprints (www.preprints.org) | NOT PEER-REVIEWED | Posted: 1 March 2020 doi:10.20944/preprints202003.0004.v1
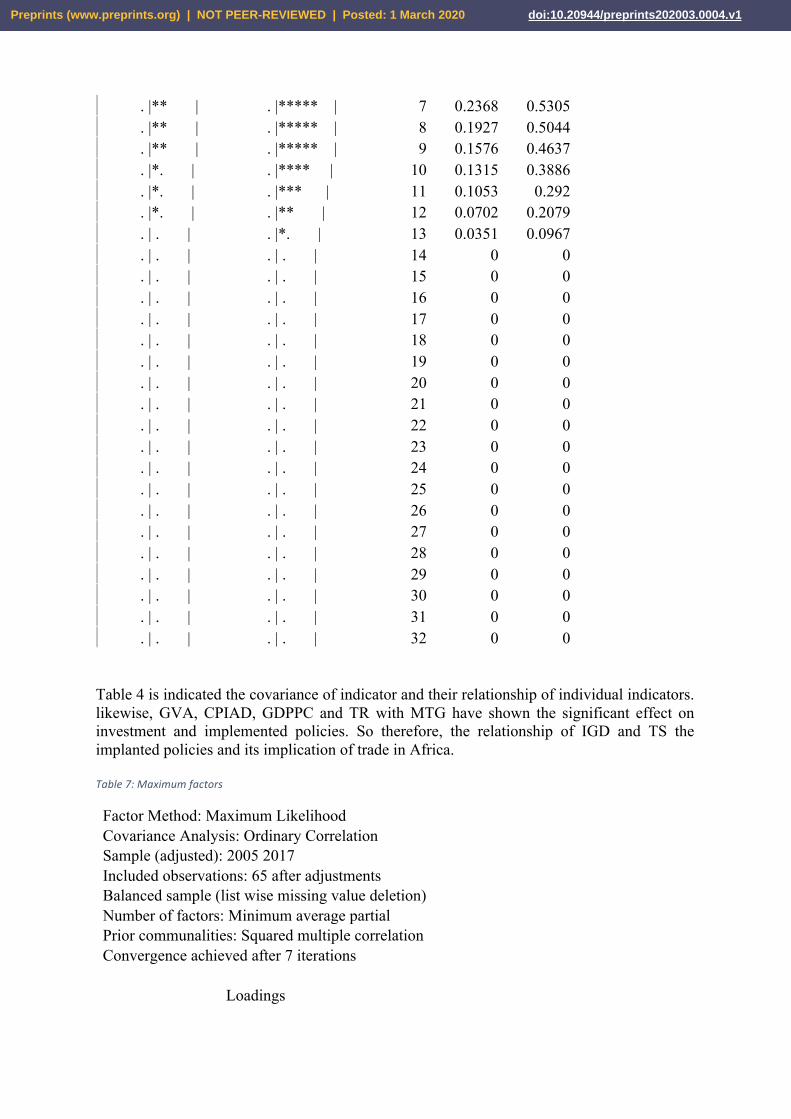
. |** | . |***** | 7 0.2368 0.5305 . |** | . |***** | 8 0.1927 0.5044 . |** | . |***** | 9 0.1576 0.4637 . |*. | . |**** | 10 0.1315 0.3886 . |*. | . |*** | 11 0.1053 0.292 . |*. | . |** | 12 0.0702 0.2079 . | . | . |*. | 13 0.0351 0.0967 . | . | . | . | 14 0 0 . | . | . | . | 15 0 0 . | . | . | . | 16 0 0 . | . | . | . | 17 0 0 . | . | . | . | 18 0 0 . | . | . | . | 19 0 0 . | . | . | . | 20 0 0 . | . | . | . | 21 0 0 . | . | . | . | 22 0 0 . | . | . | . | 23 0 0 . | . | . | . | 24 0 0 . | . | . | . | 25 0 0 . | . | . | . | 26 0 0 . | . | . | . | 27 0 0 . | . | . | . | 28 0 0 . | . | . | . | 29 0 0 . | . | . | . | 30 0 0 . | . | . | . | 31 0 0 . | . | . | . | 32 0 0
Table 4 is indicated the covariance of indicator and their relationship of individual indicators. likewise, GVA, CPIAD, GDPPC and TR with MTG have shown the significant effect on investment and implemented policies. So therefore, the relationship of IGD and TS the implanted policies and its implication of trade in Africa. Table7:Maximumfactors
Factor Method: Maximum Likelihood Covariance Analysis: Ordinary Correlation Sample (adjusted): 2005 2017 Included observations: 65 after adjustments Balanced sample (list wise missing value deletion) Number of factors: Minimum average partial Prior communalities: Squared multiple correlation Convergence achieved after 7 iterations Loadings
Preprints (www.preprints.org) | NOT PEER-REVIEWED | Posted: 1 March 2020 doi:10.20944/preprints202003.0004.v1
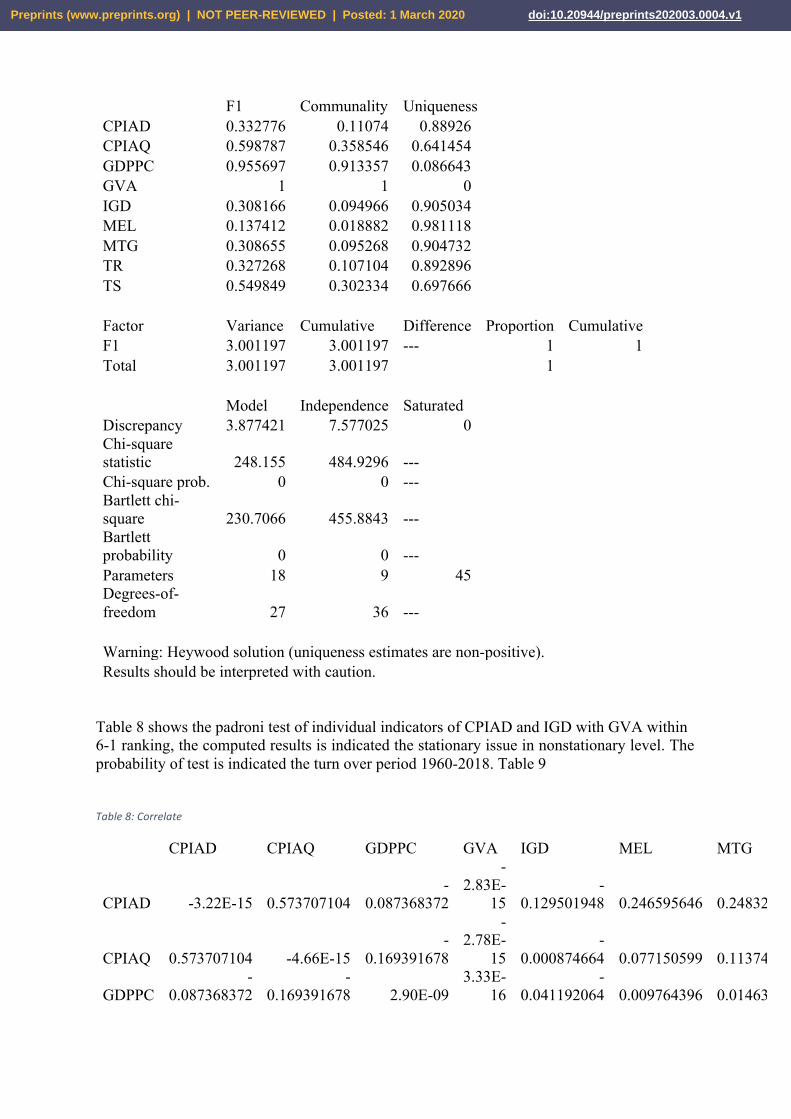
F1 Communality Uniqueness CPIAD 0.332776 0.11074 0.88926 CPIAQ 0.598787 0.358546 0.641454 GDPPC 0.955697 0.913357 0.086643 GVA 1 1 0 IGD 0.308166 0.094966 0.905034 MEL 0.137412 0.018882 0.981118 MTG 0.308655 0.095268 0.904732 TR 0.327268 0.107104 0.892896 TS 0.549849 0.302334 0.697666 Factor Variance Cumulative Difference Proportion Cumulative F1 3.001197 3.001197 --- 1 1 Total 3.001197 3.001197 1 Model Independence Saturated Discrepancy 3.877421 7.577025 0 Chi-square statistic 248.155 484.9296 --- Chi-square prob. 0 0 --- Bartlett chi-square 230.7066 455.8843 --- Bartlett probability 0 0 --- Parameters 18 9 45 Degrees-of-freedom 27 36 --- Warning: Heywood solution (uniqueness estimates are non-positive). Results should be interpreted with caution.
Table 8 shows the padroni test of individual indicators of CPIAD and IGD with GVA within 6-1 ranking, the computed results is indicated the stationary issue in nonstationary level. The probability of test is indicated the turn over period 1960-2018. Table 9 Table8:Correlate
CPIAD CPIAQ GDPPC GVA IGD MEL MTG TR TS
CPIAD -3.22E-15 0.573707104 -
0.087368372
-2.83E-
15 -
0.129501948 0.246595646 0.248323602 -
0.117709958 0.006977153
CPIAQ 0.573707104 -4.66E-15 -
0.169391678
-2.78E-
15 -
0.000874664 0.077150599 0.113747569 -
0.070178457 -
0.070515985
GDPPC -
0.087368372 -
0.169391678 2.90E-09 3.33E-
16 -
0.041192064 0.009764396 0.014630985 0.046287995 -
0.021006338
Preprints (www.preprints.org) | NOT PEER-REVIEWED | Posted: 1 March 2020 doi:10.20944/preprints202003.0004.v1
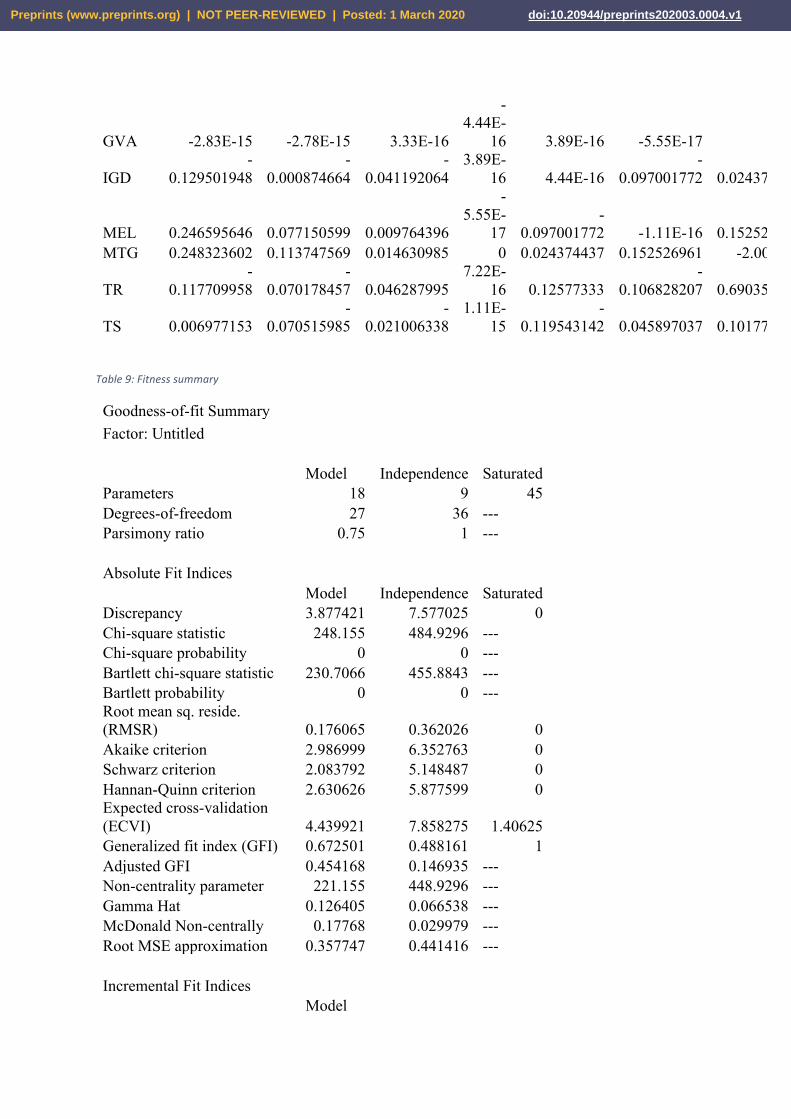
Table9:Fitnesssummary
Goodness-of-fit Summary Factor: Untitled Model Independence Saturated Parameters 18 9 45 Degrees-of-freedom 27 36 --- Parsimony ratio 0.75 1 --- Absolute Fit Indices Model Independence Saturated Discrepancy 3.877421 7.577025 0 Chi-square statistic 248.155 484.9296 --- Chi-square probability 0 0 --- Bartlett chi-square statistic 230.7066 455.8843 --- Bartlett probability 0 0 --- Root mean sq. reside. (RMSR) 0.176065 0.362026 0 Akaike criterion 2.986999 6.352763 0 Schwarz criterion 2.083792 5.148487 0 Hannan-Quinn criterion 2.630626 5.877599 0 Expected cross-validation (ECVI) 4.439921 7.858275 1.40625 Generalized fit index (GFI) 0.672501 0.488161 1 Adjusted GFI 0.454168 0.146935 --- Non-centrality parameter 221.155 448.9296 --- Gamma Hat 0.126405 0.066538 --- McDonald Non-centrally 0.17768 0.029979 --- Root MSE approximation 0.357747 0.441416 --- Incremental Fit Indices Model
GVA -2.83E-15 -2.78E-15 3.33E-16
-4.44E-
16 3.89E-16 -5.55E-17 0 7.22E-16 1.11E-
15
IGD -
0.129501948 -
0.000874664 -
0.041192064 3.89E-
16 4.44E-16 -
0.097001772 0.024374437 0.12577333 -
0.119543142
MEL 0.246595646 0.077150599 0.009764396
-5.55E-
17 -
0.097001772 -1.11E-16 0.152526961 -
0.106828207 0.045897037 MTG 0.248323602 0.113747569 0.014630985 0 0.024374437 0.152526961 -2.00E-15 0.690359979 0.101778013
TR -
0.117709958 -
0.070178457 0.046287995 7.22E-
16 0.12577333 -
0.106828207 0.690359979 -6.66E-16 0.010929393
TS 0.006977153 -
0.070515985 -
0.021006338 1.11E-
15 -
0.119543142 0.045897037 0.101778013 0.010929393 1.55E-15
Preprints (www.preprints.org) | NOT PEER-REVIEWED | Posted: 1 March 2020 doi:10.20944/preprints202003.0004.v1
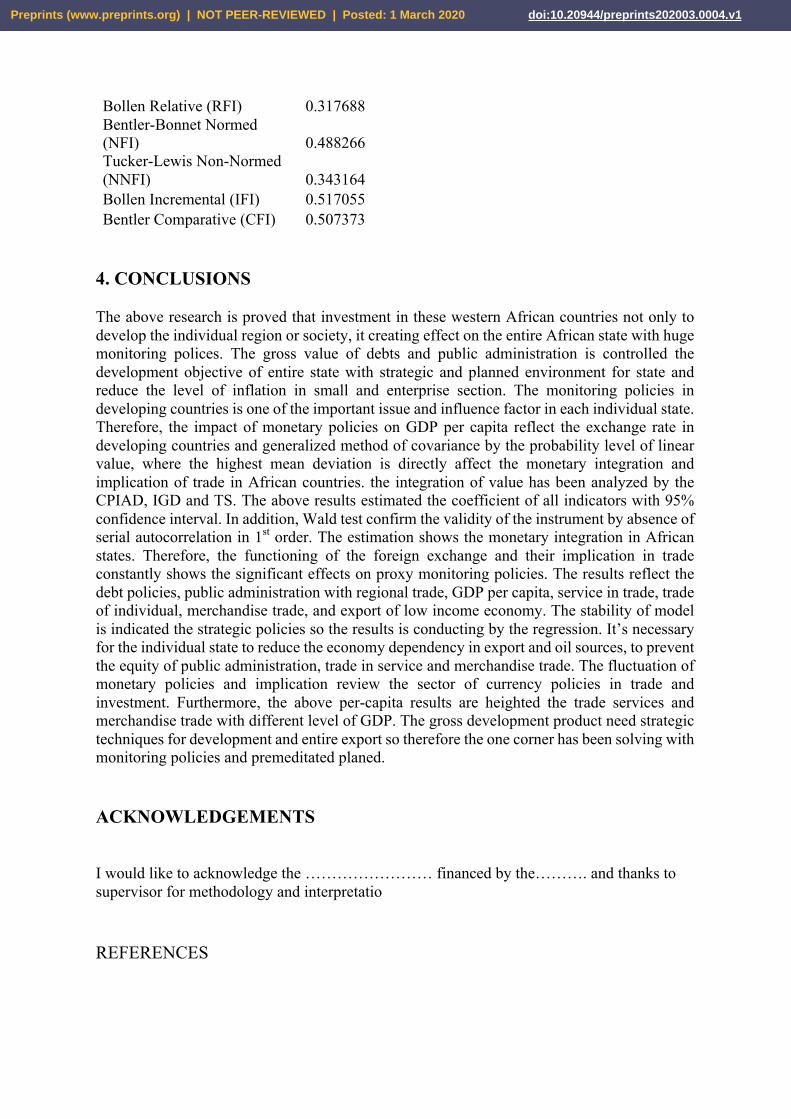
Bollen Relative (RFI) 0.317688 Bentler-Bonnet Normed (NFI) 0.488266 Tucker-Lewis Non-Normed (NNFI) 0.343164 Bollen Incremental (IFI) 0.517055 Bentler Comparative (CFI) 0.507373
4. CONCLUSIONS The above research is proved that investment in these western African countries not only to develop the individual region or society, it creating effect on the entire African state with huge monitoring polices. The gross value of debts and public administration is controlled the development objective of entire state with strategic and planned environment for state and reduce the level of inflation in small and enterprise section. The monitoring policies in developing countries is one of the important issue and influence factor in each individual state. Therefore, the impact of monetary policies on GDP per capita reflect the exchange rate in developing countries and generalized method of covariance by the probability level of linear value, where the highest mean deviation is directly affect the monetary integration and implication of trade in African countries. the integration of value has been analyzed by the CPIAD, IGD and TS. The above results estimated the coefficient of all indicators with 95% confidence interval. In addition, Wald test confirm the validity of the instrument by absence of serial autocorrelation in 1st order. The estimation shows the monetary integration in African states. Therefore, the functioning of the foreign exchange and their implication in trade constantly shows the significant effects on proxy monitoring policies. The results reflect the debt policies, public administration with regional trade, GDP per capita, service in trade, trade of individual, merchandise trade, and export of low income economy. The stability of model is indicated the strategic policies so the results is conducting by the regression. It’s necessary for the individual state to reduce the economy dependency in export and oil sources, to prevent the equity of public administration, trade in service and merchandise trade. The fluctuation of monetary policies and implication review the sector of currency policies in trade and investment. Furthermore, the above per-capita results are heighted the trade services and merchandise trade with different level of GDP. The gross development product need strategic techniques for development and entire export so therefore the one corner has been solving with monitoring policies and premeditated planed. ACKNOWLEDGEMENTS I would like to acknowledge the …………………… financed by the………. and thanks to supervisor for methodology and interpretatio
REFERENCES
Preprints (www.preprints.org) | NOT PEER-REVIEWED | Posted: 1 March 2020 doi:10.20944/preprints202003.0004.v1
Abid,M.(2017).Doeseconomic,financialandinstitutionaldevelopmentsmatterforenvironmentalquality?AcomparativeanalysisofEUandMEAcountries.JournalofEnvironmentalManagement,188,183-194.doi:https://doi.org/10.1016/j.jenvman.2016.12.007
Acheampong,A.O.(2018).Economicgrowth,CO2emissionsandenergyconsumption:Whatcauseswhatandwhere?EnergyEconomics,74,677-692.doi:https://doi.org/10.1016/j.eneco.2018.07.022
Adom,P.K.,&Kwakwa,P.A. (2014).Effectsofchangingtradestructureandtechnicalcharacteristicsof themanufacturingsectoronenergy intensity inGhana.RenewableandSustainableEnergyReviews,35,475-483.doi:https://doi.org/10.1016/j.rser.2014.04.014
Ahmed,K.,Bhattacharya,M.,Shaikh,Z.,Ramzan,M.,&Ozturk,I.(2017).EmissionintensivegrowthandtradeintheeraoftheAssociationofSoutheastAsianNations(ASEAN)integration:Anempiricalinvestigationfrom ASEAN-8. Journal of Cleaner Production, 154, 530-540.doi:https://doi.org/10.1016/j.jclepro.2017.04.008
Ahmed,K.,Bhattacharya,M.,Shaikh,Z.,Ramzan,M.,&Ozturk,I(2017).EmissionintensivegrowthandtradeintheeraoftheAssociationofSoutheastAsianNations(ASEAN)integration:anempiricalinvestigationfrom ASEAN-8. Journal of Cleaner Production, 154, 530-540.doi:https://doi.org/10.1016/j.jclepro.2017.04.008
Al-Mulali,U.,Ozturk, I.,&Solarin, S.A. (2016). Investigating theenvironmentalKuznets curvehypothesis inseven regions: The role of renewable energy. Ecological Indicators, 67, 267-282.doi:https://doi.org/10.1016/j.ecolind.2016.02.059
Apergis,N.,&Ozturk,I.(2015).TestingEnvironmentalKuznetsCurvehypothesisinAsiancountries.EcologicalIndicators,52,16-22.doi:https://doi.org/10.1016/j.ecolind.2014.11.026
Asongu,S.A.,Folarin,O.E.,&Biekpe,N.(2019).ThelongrunstabilityofmoneydemandintheproposedWestAfrican monetary union. Research in International Business and Finance, 48, 483-495.doi:https://doi.org/10.1016/j.ribaf.2018.11.001
Awad,A.,&Abugamos,H.(2017).Income-carbonEmissionsNexusforMiddleEastandNorthAfricaCountries:ASemi-parametricApproach,.InternationalJournalofEnergyEconomicsandPolicy,7(2).
Aydin,M.(2019).TheeffectofbiomassenergyconsumptiononeconomicgrowthinBRICScountries:Acountry-specific panel data analysis. Renewable Energy, 138, 620-627.doi:https://doi.org/10.1016/j.renene.2019.02.001
Bekun,F.V.,Emir,F.,&Sarkodie,S.A.(2019).Anotherlookattherelationshipbetweenenergyconsumption,carbondioxideemissions,andeconomicgrowthinSouthAfrica.ScienceofTheTotalEnvironment,655,759-765.doi:https://doi.org/10.1016/j.scitotenv.2018.11.271
Bensassi,S.,&Jarreau,J.(2019).Pricediscriminationinbribepayments:Evidencefrominformalcross-bordertrade in West Africa. World Development, 122, 462-480.doi:https://doi.org/10.1016/j.worlddev.2019.05.023
Bo, N. A. C. B. P. S. (2015). Factors in the cross-cultural adaptation of African students in Chineseuniversities.JournalofResearchinInternationalEducation,14(2),98-113.
Button,K.,Martini,G.,Scotti,D.,&Volta,N. (2019).Airlineregulationandcommonmarkets inSub-SaharanAfrica. Transportation Research Part E: Logistics and Transportation Review, 129, 81-91.doi:https://doi.org/10.1016/j.tre.2019.07.007
Cham,T.(2016).DoesmonetaryintegrationleadtoanincreaseinFDIflows?Anempiricalinvestigationfromthe West African Monetary Zone (WAMZ). Borsa Istanbul Review, 16(1), 9-20.doi:https://doi.org/10.1016/j.bir.2016.01.002
Cheng,C.,Ren,X.,Wang,Z.,&Yan,C.(2019).HeterogeneousimpactsofrenewableenergyandenvironmentalpatentsonCO2emission-EvidencefromtheBRIICS.ScienceofTheTotalEnvironment,668,1328-1338.doi:https://doi.org/10.1016/j.scitotenv.2019.02.063
Coleman, S. (2010). Inflation persistence in the Franc zone: Evidence from disaggregated prices. Journal ofMacroeconomics,32(1),426-442.doi:https://doi.org/10.1016/j.jmacro.2009.08.002
Dong,B.,Wang,F.,&Guo,Y.(2016).TheglobalEKCs.InternationalReviewofEconomics&Finance,43,210-221.doi:https://doi.org/10.1016/j.iref.2016.02.010
Du,G.,Liu,S.,Lei,N.,&Huang,Y.(2018).AtestofenvironmentalKuznetscurveforhazepollutioninChina:Evidence from the penal data of 27 capital cities. Journal of Cleaner Production, 205, 821-827.doi:https://doi.org/10.1016/j.jclepro.2018.08.330
Du,J.,&Zhang,Y.(2018).DoesOneBeltOneRoadinitiativepromoteChineseoverseasdirectinvestment?ChinaEconomicReview,47,189-205.doi:https://doi.org/10.1016/j.chieco.2017.05.010
GrossmanG,K.A.(1995).Economicgrowthandtheenvironment.QuarterlyJournalofEconomics,100(2),353-377.
Preprints (www.preprints.org) | NOT PEER-REVIEWED | Posted: 1 March 2020 doi:10.20944/preprints202003.0004.v1
Harding,J.W.a.J.M.H.(2007).GeneralizedLinearModelsandExtensions(2nded.).Harvey,S.K.,&Cushing,M.J.(2015).IsWestAfricanMonetaryZone(WAMZ)acommoncurrencyarea?Review
ofDevelopmentFinance,5(1),53-63.doi:https://doi.org/10.1016/j.rdf.2015.05.001Im, K. S., Pesaran, M. H., & Shin, Y. (2003). Testing for unit roots in heterogeneous panels. Journal of
Econometrics,115(1),53-74.doi:https://doi.org/10.1016/S0304-4076(03)00092-7Keho,Y.(2017).RevisitingtheIncome,EnergyConsumptionandCarbonEmissionsNexus:NewEvidencefrom
QuantileRegressionforDifferentCountryGroups.InternationalJournalofEnergyEconomicsandPolicy,7(3),356-363.
Kong,Y.,&Khan,R.(2019).Toexamineenvironmentalpollutionbyeconomicgrowthandtheir impact inanenvironmental Kuznets curve (EKC) among developed and developing countries. PloS one, 14(3).doi:https://doi.org/10.1371/journal.pone.0209532
MengYun,W.,Imran,M.,Zakaria,M.,Linrong,Z.,Farooq,M.U.,&Muhammad,S.K.(2018).Impactofterrorismandpolitical instabilityonequitypremium:EvidencefromPakistan.PhysicaA:StatisticalMechanicsanditsApplications,492,1753-1762.doi:https://doi.org/10.1016/j.physa.2017.11.095
Mikayilov, J. I.,Hasanov, F. J.,&Galeotti,M. (2018).DecouplingofCO2emissions andGDP:A time-varyingcointegration approach. Ecological Indicators, 95, 615-628.doi:https://doi.org/10.1016/j.ecolind.2018.07.051
Osabutey,E.L.C.,&Jackson,T.(2019).TheimpactondevelopmentoftechnologyandknowledgetransferinChineseMNEsinsub-SaharanAfrica:TheGhanaiancase.TechnologicalForecastingandSocialChange,148,119725.doi:https://doi.org/10.1016/j.techfore.2019.119725
Perron,P.(1988).TestingforaUnitRootinTimeSeriesRegression.Biometrika,75(2),335-346.Riaz,A.,Husain,S.,Yousafzai,M.T.,Nisar, I.,Shaheen,F.,Mahesar,W., . . .Ali,A. (2018).Reasons fornon-
vaccination and incomplete vaccinations among children in Pakistan. Vaccine, 36(35), 5288-5293.doi:https://doi.org/10.1016/j.vaccine.2018.07.024
Saqib, S. E., Ahmad, M. M., & Amezcua-Prieto, C. (2018). Economic burden of tuberculosis and its copingmechanism at the household level in Pakistan. The Social Science Journal, 55(3), 313-322.doi:https://doi.org/10.1016/j.soscij.2018.01.001
Schwerhoff, G., & Sy, M. (2017). Financing renewable energy in Africa – Key challenge of the sustainabledevelopment goals. Renewable and Sustainable Energy Reviews, 75, 393-401.doi:https://doi.org/10.1016/j.rser.2016.11.004
Sinha,A.,&Shahbaz,M.(2018).EstimationofEnvironmentalKuznetsCurveforCO2emission:Roleofrenewableenergy generation in India. Renewable Energy, 119, 703-711.doi:https://doi.org/10.1016/j.renene.2017.12.058
Tsao,L.,Slater,S.E.,Doyle,K.P.,Cuong,D.D.,Khanh,Q.T.,Maurer,R.,. . .Krakauer,E.L.(2019).PalliativeCare–RelatedKnowledge,Attitudes,andSelf-AssessmentAmongPhysiciansinVietnam.JournalofPainandSymptomManagement.doi:https://doi.org/10.1016/j.jpainsymman.2019.08.001
Yaya,O.S.,Ling,P.K.,Furuoka,F.,RoseEzeoke,C.M.,&Jacob,R.I.(2019).CanWestAfricancountriescatchupwith Nigeria? Evidence from smooth nonlinearity method in fractional unit rootframework.InternationalEconomics,158,51-63.doi:https://doi.org/10.1016/j.inteco.2019.02.004
Zhang,Q.,Liao,H.,&Hao,Y.(2018).Doesonepathfitall?Anempiricalstudyontherelationshipbetweenenergyconsumption and economic development for individual Chinese provinces. Energy, 150, 527-543.doi:https://doi.org/10.1016/j.energy.2018.02.106
Zhao,X.,&Kim,Y.(2009).IstheCFAFrancZoneanOptimumCurrencyArea?WorldDevelopment,37(12),1877-1886.doi:https://doi.org/10.1016/j.worlddev.2009.03.011
. In the twentieth century, the economists of BIS1
Preprints (www.preprints.org) | NOT PEER-REVIEWED | Posted: 1 March 2020 doi:10.20944/preprints202003.0004.v1