a study of the benefits of public sector procurement from...
TRANSCRIPT

A Study of the Benefits of Public Sector Procurement from Small Businesses
ResearchAugust 2005
A DTI SERVICE

The DTI drives our ambition of ‘prosperity for all’ by working to create the best environment for business success in the UK. We help people and companies become more productive by promoting enterprise, innovation and creativity.
We champion UK business at home and abroad. We invest heavily in world-class science and technology. We protect the rights of working people and consumers. And we stand up for fair and open markets in the UK, Europe and the world.
SMALL BUSINESS SERVICE
A DTI SERVICE
Working with the public, private and voluntary sectors to make the UK the best place to start and grow a business.

A Study of the Benefits of Public Sector Procurement from Small Businesses
Research conducted by:
NERA Economic Consulting
15 Stratford Place
London W1C 1BE
United Kingdom
Tel: +44 20 7659 8500
Fax: +44 20 7659 8501
www.nera.com
Project Team
John Dodgson Michael Spackman Barbara Veronese Martin Siner Nick Latimer
NERA Economic Consulting 15 Stratford Place London W1C 1BE United Kingdom Tel: +44 20 7659 8500 Fax: +44 20 7659 8501 www.nera.com
� �������������
���������
������������������ �
�� ������������� �
1.1. Background and Research Specification 11.2. How We Undertook the Work 21.3. Structure of This Report 31.4. Acknowledgements 3
�� ��������������������� �
2.1. Introduction 42.2. SME Share of Private Sector Turnover and Employment 52.3. Government Consumption by Sector 92.4. SME Sales to Government as a Proportion of Turnover 132.5. SME Sales, SME Output and Government Procurement 22
�� ������������������ ��
3.1. Introduction 263.2. Competition, Productivity and Innovation 273.3. Employment and Economic Growth 293.4. The Business Cycle 303.5. Employment Dynamics 313.6. The UK and European Innovation Surveys 323.7. Conclusions on the Evidence on the Impact of Small Firms 343.8. References for Chapter 3 35
�� ������������������������� ��
4.1. Introduction 384.2. Procurement as an Instrument for Diverse Public Policies 384.3. The Range of Small Businesses 394.4. The Concept of a Level Playing Field 414.5. Direct Benefits Versus External Benefits 424.6. Baselines for Comparison 424.7. Information Needs for Monitoring and Evaluation 434.8. Analytical Principles 434.9. Costs and Benefits of SME Procurement Options 51
�� ������������� ��
5.1. Introduction 525.2. Selection and Development of the Case Studies 525.3. Data Sources 555.4. Categorisation of Small Businesses and the Case Studies 55

� �������������
5.5. What the Case Studies Can and Cannot Tell Us 575.6. The Case Studies 57
�� ����������������������������������� ��
6.1. The Benefits of Procurement from Small Businesses 926.2. The Scope for Wider Use of Small Businesses 956.3. eAuctions 956.4. Analytical Aspects of Procurement 97
�� �������������������������������� ���
7.1. Statistical Data 1017.2. Academic Literature 1017.3. The Case Studies 1027.4. Recommendations 103
����������� ���������������������������������������
���������������� ���
����������� ��������������������� ���
� �������������
������������������
This report examines the statistical data on government (including NHS) procurement from SMEs, the economic literature on the wider benefits of small businesses and some twenty case studies of procurement from small businesses. The statistical data provides useful information on the size and distribution of government procurement and the relative contributions to local and central government of small business suppliers; but information on the absolute magnitude of small business supply to government, in total or by sector, would need comprehensive collection by government of data on the size of its suppliers. The economic literature generally supports the perception that small businesses, especially those in innovative markets, bring wider benefits to the economy. The case studies provide many examples of procurement from small businesses, usually in competition with large businesses, where the characteristics of exceptional commitment and often exceptional specialist skills are strikingly demonstrated. They suggest that, although widening the supplier base to include more small business can demand extra procurement effort and professionalism, it can be rewarding across a very wide spectrum of procurement. The report concludes from the case studies that the greatest scope for improving the use of small businesses in government procurement lies in increasing procurement professionalism.
Introduction
This is a study on the benefits of government (including NHS) procurement from small businesses by NERA Economic Consulting, for the Small Business Service of the Department of Trade and Industry (DTI). The study is to help provide a stronger analytical base for the promotion of government procurement from smaller businesses.
Key objectives in the Research Specification were to:
��Identify the potential costs and benefits from SME (Small and Medium Size Enterprise) involvement in public sector markets;
��Identify key market sectors where there is a significant SME presence and, as far as is possible, the nature and the scale of SME involvement;
��Examine the costs and benefits of SME involvement in public sector markets;
��Identify procurement approaches that have enabled the benefits associated with SMEs to be realised;
��Develop methodologies for quantifying the potential efficiency savings and the overall value for money associated with SME involvement in public sector markets and as far as possible, quantify these costs and benefits;
��Examine the potential contribution of SMEs in sectors where they are currently underrepresented.
i
� �������������
The study involved discussions with key stakeholders including the Small Business Service, the Office of Government Commerce (OGC), the Office of the Deputy Prime Minister (ODPM), the Better Regulation Task Force, and the Federation of Small Businesses (FSB).
Detailed reviews were undertaken of the available statistics on small firms and on government procurement, and of the evidence from the literature on the benefits that smaller firms bring to the economy as a whole. The study also develops a framework for the analysis of the costs and benefits of specific procurements from smaller firms.
A central feature of the study and this report is a series of some twenty case studies, presenting in most cases examples of smaller firms making a substantial contribution to securing value for money, usually in competition with large firms. These case studies were developed with considerable assistance from the suppliers and the procurers involved. At the end of the report we develop general lessons from the case studies and conclusions and recommendations.
Statistical Analysis
There is detailed published information on the role of smaller firms in the economy as a whole, and on central and local government consumption in different sectors of the economy, but no direct information on the breakdown of public procurement by firm size.
As is well known, the role of small firms in the economy as a whole is very substantial. Firms with under 250 employees account for just over 50 per cent of turnover in the economy, and employ nearly 60 per cent of the workforce.
Government procurement of goods and services amounts to only about 5 per cent of total procurement in the economy, but this percentage varies widely between sectors. It is particularly high in defence and health related activities. (The case studies suggest that government is also an exceptionally important procurer in administrative and policy support activities, notably IT.)
Information on the size of its suppliers is not at present collected comprehensively by government. The study thus uses results from a recent survey by the Federation of Small Businesses, which asked member firms how far their total sales were accounted for by sales to local government and central government. These data suggest that, for the responding companies, sales by small businesses to local government account for about twice the level of sales by small businesses to central government.
The study also investigates whether there are sectors where smaller firm involvement in government procurement appears to be proportionately low, given the overall level of government procurement and the presence of smaller firms in that sector. However it concludes that identification of such sectors would require more disaggregated data, such as could be collected by government bodies during the course of procurement. The study concludes however that, in any case, the most rewarding action to improve the use of small suppliers by government procurers is to encourage and enable individual procurers to give due weight to small businesses.
ii

� �������������
Literature Review
There is an extensive economic literature on the benefits that small firms bring to an economy. This literature is not specifically concerned with the role of smaller firms in public procurement. Nevertheless the more general academic literature identifies the types of benefit that smaller firms can provide in a dynamic economy. And some of these benefits may be relevant in specific government procurement decisions.
The main relevant conclusions from the literature review are as follows:
��There is evidence that in today’s advanced economies the share of employment in smaller firms is increasing over time. This suggests that an increasing share of the markets faced by procurers of goods and services is being supplied by smaller firms, and that procurers will benefit from proactively adapting to this.
��UK smaller firms rank more highly than UK larger firms in EU league tables of innovation performance. This implies that the removal of obstacles to smaller firm involvement in public procurement may be especially beneficial in this country.
��Fluctuations in national economic activity are concentrated on larger firms, while smaller firms tend to hire and fire at a more uniform rate. This means that an economy with a higher proportion of employment in smaller firms may be less prone to business cycles.
��There is evidence that the impact of more competition for goods and services and for ideas, and extra movement in and out of employment, both of which are enhanced by smaller firms, increase productivity growth in the economy (as well as benefiting the government procurer). This provides a general argument for encouraging and sustaining firm start-ups.
A Cost Benefit Framework
The report develops a framework for the appraisal or evaluation of comparisons between options of procurement from a small business and procurement from another source. This framework is mainly developed for the assessment of the case studies in the report, though the principles apply equally to any policy, programme, or project analysis in this field.
Government procurement from small firms has been much discussed in several UK Government reports, but there appears to have been little formal analysis, or at least economic analysis, of UK procurement issues, to support the generally sound and useful, but qualitative advocacy of recent documents.
The analytical framework is consistent with the existing government guidance on appraisal and evaluation, including the Treasury Green Book, the 3Rs Guidance, and the OGC/Defra joint note on environmental issues in purchasing.
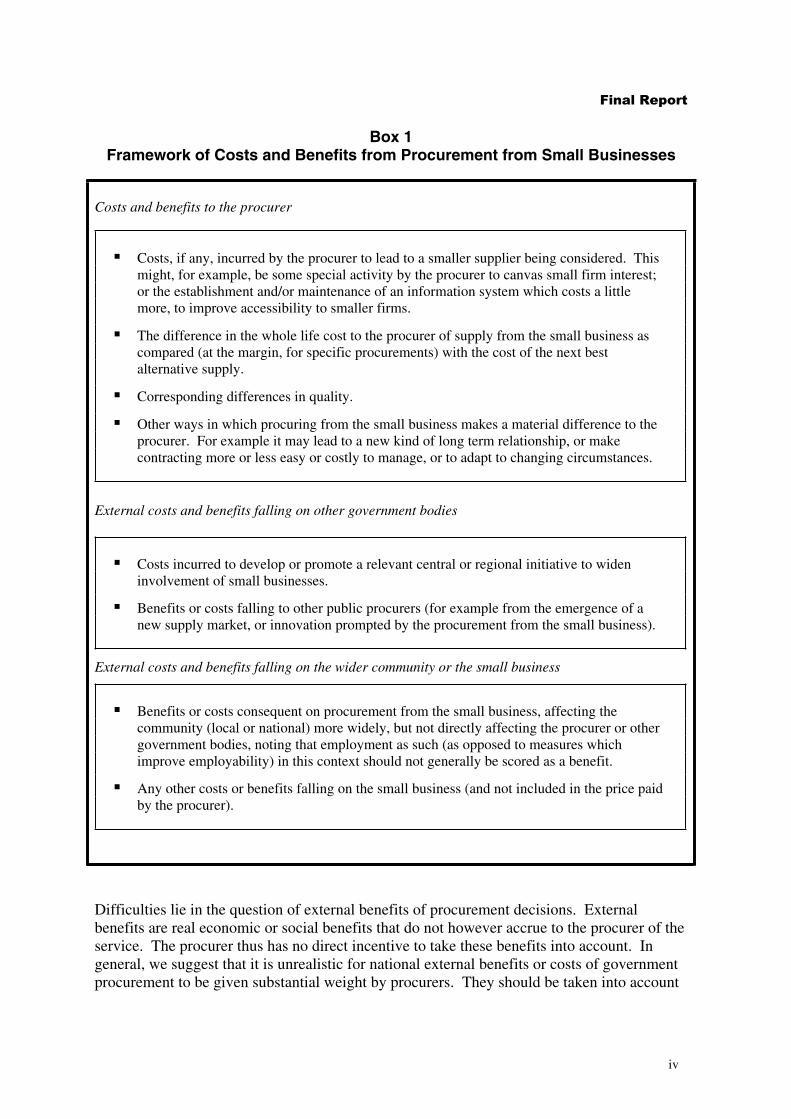
Box 1 records the scope of the costs and benefits that are relevant to the appraisal or evaluation of procurement from small businesses.
iii
� �������������
Box 1 Framework of Costs and Benefits from Procurement from Small Businesses
Costs and benefits to the procurer
��Costs, if any, incurred by the procurer to lead to a smaller supplier being considered. This might, for example, be some special activity by the procurer to canvas small firm interest; or the establishment and/or maintenance of an information system which costs a little more, to improve accessibility to smaller firms.
��The difference in the whole life cost to the procurer of supply from the small business as compared (at the margin, for specific procurements) with the cost of the next best alternative supply.
��Corresponding differences in quality.
��Other ways in which procuring from the small business makes a material difference to the procurer. For example it may lead to a new kind of long term relationship, or make contracting more or less easy or costly to manage, or to adapt to changing circumstances.
External costs and benefits falling on other government bodies
��Costs incurred to develop or promote a relevant central or regional initiative to widen involvement of small businesses.
��Benefits or costs falling to other public procurers (for example from the emergence of a new supply market, or innovation prompted by the procurement from the small business).
External costs and benefits falling on the wider community or the small business
��Benefits or costs consequent on procurement from the small business, affecting the community (local or national) more widely, but not directly affecting the procurer or other government bodies, noting that employment as such (as opposed to measures which improve employability) in this context should not generally be scored as a benefit.
��Any other costs or benefits falling on the small business (and not included in the price paid by the procurer).
Difficulties lie in the question of external benefits of procurement decisions. External benefits are real economic or social benefits that do not however accrue to the procurer of the service. The procurer thus has no direct incentive to take these benefits into account. In general, we suggest that it is unrealistic for national external benefits or costs of government procurement to be given substantial weight by procurers. They should be taken into account
iv

� �������������
through other policy initiatives, such as fiscal policies or subsidised advice or training for smaller firms.
However we have some concerns about the treatment of sustainability and of local employment, especially in procurement at the local level.
While sustainability is an important policy objective, we believe that procurers need to consider the public interest as a whole – albeit, in the case of local government, giving more weight to local concerns. Local procurement (‘buying local’) may contribute significantly to overall value for money, through for example better quality for a given price, or by reinforcing measures to reduce social exclusion in the local community. But we note that ‘buying local’ is sometimes justified simply in terms of its immediate, apparent direct impact on local employment. This appears to be contrary to ODPM guidance and may often be contrary to the local interest (and certainly the national interest).
Case Studies
The case studies are, by construction, nearly all success stories, but they cover a very wide range of procurement. In all the case studies we have spoken both to the supplier and the procurer. It has usually been difficult to establish robustly what would have happened if the contract had not been awarded to the smaller firm, but in many cases informed judgement can be made about how the small firm provided benefits which would not have been expected from a large firm.
Our main conclusions from the case studies are as follows:
��The potential benefits listed by the OGC and the SBS of procurement from small businesses are in practice substantially achieved, over a wide range of procurement.
��Especially conspicuous, across a wide range of markets, is the ability and willingness of small firms to “go the extra mile”, in terms of commitment and service delivery.
��However explicit monetary valuation of such quality benefits is rarely if ever practicable; and there appears to be little prospect of developing quantitative rules of thumb for procurers on “the benefits of using small businesses”. The need is for competence in procurement policies and individual procurements, to recognise fully the value of small businesses as suppliers and how best to use them.
��Procuring from a small firm can expose the procurer to extra risk, especially for a crucial project. Procurer competence is needed both to ensure that this risk is not over- or underestimated and to devise measures to reduce any such risk where appropriate.
��Measures to increase competition by increasing small business participation can be effective in a wide range of procurement markets. However this too requires procurer competence, and may be resource intensive.
��Although the relative strengths of small businesses are similar across many fields, the optimal scope for their contribution varies from zero to 100 per cent. The effectiveness of procurement practices, and of policy initiatives to promote small businesses is not therefore well suited to analytically based targets (as distinct from temporary targets to motivate change in some areas in a particular direction). Practice in each field of
v

� �������������
procurement needs to be assessed on its own merits, case by case, and by comparisons across procurers and sectors.
��The lack of comprehensive monitoring data on the use of small businesses is disappointing, despite efforts by SBS and Treasury to improve data collection.
��There appears to be some lack of analytical input to government procurement, to support the very considerable administrative input. There are many issues on which objective and authoritative analysis might strengthen advice on procurement on issues relevant to small businesses, and to improve consistency with other areas, such as the handling of employment and environmental impacts.
��Our study of eAuctions suggests that, at least for large contracts, they do not discriminate against small businesses. However there appears to be scope for more development of the handling of quality in eAuctions, and the associated impact on ongoing customer-client relationships.
Lessons for Government Procurement
This study has revealed or reinforced a number of lessons for government procurement.
The small firms in our case studies provided all the types of benefit set out in the OGC/SBS publication Smaller supplier … better value? The relative contribution to the different headings in that publication (competition, cost, innovation, responsiveness, flexibility, quality of service, specialism) varies from case to case. However the most striking feature of the studies is the commonality of nearly all the firms in respect of quality of service (for the same or lower cost), in specialism (which is particularly, but not only, relevant in IT and professional services) and in adding to competition for public contracts. Some also provided social or environmental benefits.
None of the work undertaken in this study – statistical analysis, literature review and case studies - suggests that there is any sound basis for deriving an “optimal” level of procurement from smaller firms, either in aggregate or in any specific market. The optimal level varies very widely across markets. It also depends upon the competence of the procurer, both in management of tenders and contracts and in procurement policy design. The case studies do nonetheless suggest that there is scope for achieving net benefits from more use of smaller firms across very wide areas of public procurement.
There is little scope for any generalised quantification of the benefits of procuring from smaller firms. In part this is because circumstances vary so much from case to case. It is also because much of the benefit from procurement from smaller firms often arises from higher quality, both in product and in style of delivery. We doubt whether explicitly valuing such quality impacts is often practicable.
Some government bodies claim benefits from preferring local procurement as a boost for local prosperity, or from reducing the external costs of transport. Neither of these rationales appears to be based on impartial analysis and the former appears not to be consistent with government guidance. It appears that such cases may often in practice achieve, by more use of small firms, better quality for a given cost, but even better value might be expected if procurement decision making were more rigorously based.
vi

� �������������
Benefits in terms of social inclusion are nonetheless important in some small business procurement, where procurement is coordinated with measures directed to drawing people excluded from the labour market into employment.
Many of the case studies describe proactive action by the procurer to widen its supplier base by including more smaller firms. These examples suggest that there is wide scope for imaginative action by procurers to improve value for money in this way.
Conclusions and Recommendations
The study’s main recommendations in regard to public sector procurement from smaller firms are as follows:
��Measures to strengthen professionalism in procurement policy and procedures in government bodies, including the sharing of good practice, should be seen as the primary instrument for achieving a better use of smaller firms in public procurement.
��Measures to remedy the conspicuous absence of comprehensive data to monitor the use of smaller firms in public procurement should be encouraged.
��Progress will best be driven by studies of current practice, and comparing practices and achievements across organisations and sectors. It would not be helpful to emphasise targets for SME procurement, in aggregate or in specific sectors.
��Government procurement, perhaps especially with respect to procurement from small businesses, would benefit from wider analytical support to reinforce the considerable administrative inputs.
vii

� ������������
��� �������������
1.1. Background and Research Specification
This is the Final Report of a study by NERA Economic Consulting for the Small Business Service (SBS) of Department of Trade and Industry (DTI).
The SBS is responsible for promoting small businesses in public sector markets. The Office of Government Commerce (OGC) is responsible for procurement policy, and is working to improve civil government procurement procedures and practices. To help inform the development of government procurement with respect to small business1 the SBS seeks to understand as fully as possible the contribution which is and could be made by such businesses. They note that anecdotal evidence suggests that small businesses can deliver substantial savings to local and central government and that they have a potentially larger role to play. The research specification which this report addresses is designed to examine these issues in more detail, and to develop an evidence base to inform policy development.
Key objectives in the Research Specification were to:
��Identify the potential costs and benefits from SME involvement in public sector markets;
��Identify key market sectors where there is a significant SME presence and, as far as is possible, the nature and the scale of SME involvement;
��Examine the costs and benefits of SME involvement in the public sector markets;
��Identify procurement approaches that have enabled the benefits associated with SMEs to be realised;
��Develop methodologies for quantifying the potential efficiency savings and the overall value for money associated with SME involvement in public sector markets and, as far as possible, quantify these costs and benefits;
��Examine the potential contribution of SMEs in sectors where they are currently underrepresented.
Key research questions underpinning these objectives were identified in the Specification as:
��To what extent are SMEs involved in public sector markets? Are there particular markets in which SME involvement is concentrated?
��What is the nature of SMEs’ contribution in these public sector markets?
��What are the costs and benefits associated with involving SMEs in public sector markets that have been identified or proposed in existing literature?
Defined broadly as SMEs (Small and Medium Size Enterprises), where Small Enterprises are defined as those of less than 50 employees and Medium Size Enterprises as having less than 250 employees. This report follows the common convention of using the terms small business, or small firm, to cover all SMEs, unless otherwise stated.
1
1

� ������������
��Where SMEs have been involved in public sector markets, and more specifically, where they are providing goods and services, have these potential benefits (or costs) materialised and resulted in efficiency savings and overall value for money?
��To what extent can the findings from specific examples of SME involvement in public sector markets be generalised across all SMEs in the same sector, or in other sectors?
��Are there any distinct procurement practices or approaches that have enabled SME involvement in markets and the subsequent benefits to be realised?
��Where SMEs have been perceived to deliver value for money in public markets, can this value for money be quantified? Can it be quantified in a systematic way that could provide purchasers with a useful ‘tool’ to evaluate tenders?
��Does the research evidence gathered in the project suggest that generic indicators of value of money can be established which could potentially be used to guide purchasers in procurement decisions?
A major part of the study is the identification and description of some twenty case studies to illustrate cases where small businesses have demonstrated value for money, often in competition with large businesses.
“Public sector” in this report has been taken to include local and central government, including the NHS, but excluding public enterprises.
1.2. How We Undertook the Work
��We started the project with meetings with key stakeholders. As well as the SBS, this also included other members of the project Steering Group (Office of Government Commerce, and Office of the Deputy Prime Minister), the Better Regulation Task Force, the Federation of Small Businesses, and representative bodies of the IT and printing industries. One major role of these discussions was to identify contacts for potential case studies;
��We have reviewed and analysed data on the role of SMEs in individual sectors of the economy, the extent of government involvement in different sectors, and the available evidence on the relative extent to which SMEs sell their goods and services to local and national government;
��We have reviewed and summarised the relevant economic literature on small firms, and conducted our own analysis of enterprise churn;2
��We have developed a cost benefit framework for analysis of smaller business involvement with public procurement. An initial version was supplied to the SBS, and discussed with them and with the Steering Group;
��We have developed case studies in discussion with a very wide range of suppliers and procurers;
Churn, which may be applied to enterprises or to jobs, is defined as entry rate plus exit rate. Thus a complete change of enterprises or employees in a year, with a constant employment total, would give a figure for churn or turnover of 200 per cent.
2
2

� ������������
��Having examined the case studies and other evidence we present our conclusions.
1.3. Structure of This Report
The rest of this report is structured as follows.
��Chapter 2 reviews the statistical data available on government procurement, on the role of SMEs in the economy, and on SME sales to government.
��Chapter 3 reviews the economic literature on the value of small firms to the economy.
��Chapter 4 develops a cost benefit framework for analysing the costs and benefits of public procurement from smaller businesses.
��Chapter 5 presents our case studies, mainly of successful small business involvement in public procurement;
��Chapter 6 considers how far the results from the case studies provide lessons for public procurement;
��Chapter 7 contains our conclusions and recommendations.
In much of the report we have avoided the acronym SME. However we have retained it where accuracy so requires, as for example in recording our terms of reference, and in Chapter 2 and sometimes in Chapter 3, when statistical data or literature refer explicitly to SMEs.
1.4. Acknowledgements
Much of this report has depended upon help from officials in industry associations, notably the Federation of Small Businesses, the IT industry body Intellect and the British Printing Industries Federation; suppliers and procurers; the Small Business Service, the Better Regulation Task Force, the Office of Government Commerce, the Office of the Deputy Prime Minister and the Office of National Statistics; and others who have provided general advice and steered us towards useful case studies. We are immensely grateful to all these contributors, many of whom have been outstandingly generous and thoughtful.
3
� ������������
��� ���������������������
2.1. Introduction
This chapter addresses the second of the six objectives in the SBS Research Specification, namely “to identify key market sectors where there is a significant SME presence and, as far as is possible, identify the nature and the scale of SME involvement”. It is therefore particularly concerned with the following two key research questions from the Specification:
��To what extent are SMEs involved in public sector markets? Are there particular markets in which SME involvement is concentrated?
��What is the nature of SMEs’ contribution in these public sector markets?
We address these issues using statistical data from three main sources, as follows.
��Data from SBS annual SME UK statistics from 1995 to 2003 to estimate SME shares of turnover and employment in different sectors of the economy. Our analysis of data from this source is set out in Section 2.2.
��Data on government consumption in different sectors of the economy, derived from UK Input-Output Supply and Use Tables for 2002.3 Our analysis of data from this source is set out in Section 2.3.
These first two datasets tell us, respectively, which sectors have particularly high concentrations of small and medium-sized enterprises, and which sectors have particularly high demand from government. However, from them we cannot link SME involvement to government purchase of SME-supplied goods and services. To do this we use a third source of information, namely
��Data supplied to us by the Federation of Small Businesses (FSB) showing the proportions of total SME output supplied to central and local government, derived from the FSB’s survey of their members. Results of this analysis are shown in Section 2.4.
In Section 2.5 we reach overall conclusions about SME involvement in different parts of the public sector.
The precise definitions used by government for statistical purposes are inevitably complex. For example “Public administration” includes most of defence expenditure and includes government administrative activities; but military hospitals, like all other health operational activities, are classified as “Health and Social Work”, and schools are classified as “Education”. The current definitions are set out in UK Standard Industrial Classification of Economic Activities 2003 (UK(SIC)2003), The Stationery Office, 2002.
United Kingdom 2002 Input-Output Analyses, Input-Output Supply and Use Tables (consistent with UK National Accounts Blue Book 2004), published July 2004 and available on line from the National Statistics website http://www.statistics.gov.uk/downloads/theme_economy/Input_output_analyses_2004_Edition.pdf.
4
3

� ������������
2.2. SME Share of Private Sector Turnover and Employment4
In this section we analyse SBS data on SME turnover and employment, within total private sector activity.5 SBS sources provide data by size band of enterprise, which means that we can analyse the share in the economy of small businesses (firms that have from 0 to 49 employees), medium size businesses (firms that have from 50 to 249 employees) and of all SMEs together. The SBS data provide information on total sectoral private sector turnover and employment. We have used these figures to calculate SME shares of turnover and employment in each industry sector. We also examined ONS Annual Business Inquiry (ABI) data on total sectoral turnover but, as there appear to be inconsistencies between the two data sets, we have relied exclusively on the SBS data.6
We have undertaken this analysis at two levels of sectoral decomposition, broad and narrow.
In Section 2.2.1 we look at broad sectoral definitions, namely by Standard Industrial Classification (SIC) Sections A to O. This provides a general overview on the relevance of SMEs in different sectors. Tables in this section include ‘zero employee firms’ or sole traders (this category comprises sole proprietorships and also partnerships comprising only the self-employed owner-manager(s), and businesses comprising only an employee director).
In Section 2.2 we look at the narrower 3-digit sectoral statistics, which however exclude sole traders. In this section, figures are shown only for those sectors where SME share of sectoral turnover is highest. However, these rankings are affected by some data suppression, as data for many industries are unavailable because of confidentiality.7 The analysis in Section 2.2.2 does however indicate niches where SMEs are particularly active.
2.2.1. SME involvement at the broad sectoral level (SIC Sections)
Data in Table 2.1 show the shares of SME turnover and employment in the private sector in 2003 by sector, for both small (0-49 employees) and medium (50-249 employees) size firms.
Table 2.1 shows that in 2003 SMEs accounted for 52 per cent of total private sector turnover and 58 per cent of total employment. The share of SME turnover in agriculture, hunting and
4 “Private sector” is used here as shorthand for “private sector, including public corporation and nationalised bodies, but excluding Government and non-profit organisations”.
5 We have also investigated the share of small and medium term size firms in terms of numbers of firms. However in almost every sector about 99 per cent or more of firms are small firms of 0-49 employees. In only one sector (Manufacturing) do medium size firms (50-249 employees) approach 2 percent of the total number of firms in the sector. Large firms approach 1 per cent only in Manufacturing and Financial Intermediation.
6 The source of the ABI data is the ONS Annual Business Inquiry 2003 which provides data from 1995-2003. There are discrepancies between ABI data (which cover all businesses) and SBS data on total sector turnover. In some cases, using ABI data to calculate SMEs shares led to estimates of SME shares of turnover above 100 per cent.
7 The original data supplied to us by SBS used a more detailed range of size bands than our three categorisations (small, medium and SME). To map these categories to those we used in our analysis, we have aggregated a number of the original size categories for each industry. For example, in our analysis of 3-digit groups, our ‘small’ category includes both the ‘micro’ and ‘small’ categorisations in the SBS datasets. Where data were suppressed for any or all of the original subcategories, the aggregated category was omitted entirely from our analysis; we have not used any partial totals. The impact of suppressed data is greatest for the turnover and employment data at a 3 digit level, with the frequency of industries being omitted increasing with the size of the category. If full data were available a few more SIC sectors might appear in any of the columns of Table 2.3.
5
� ������������
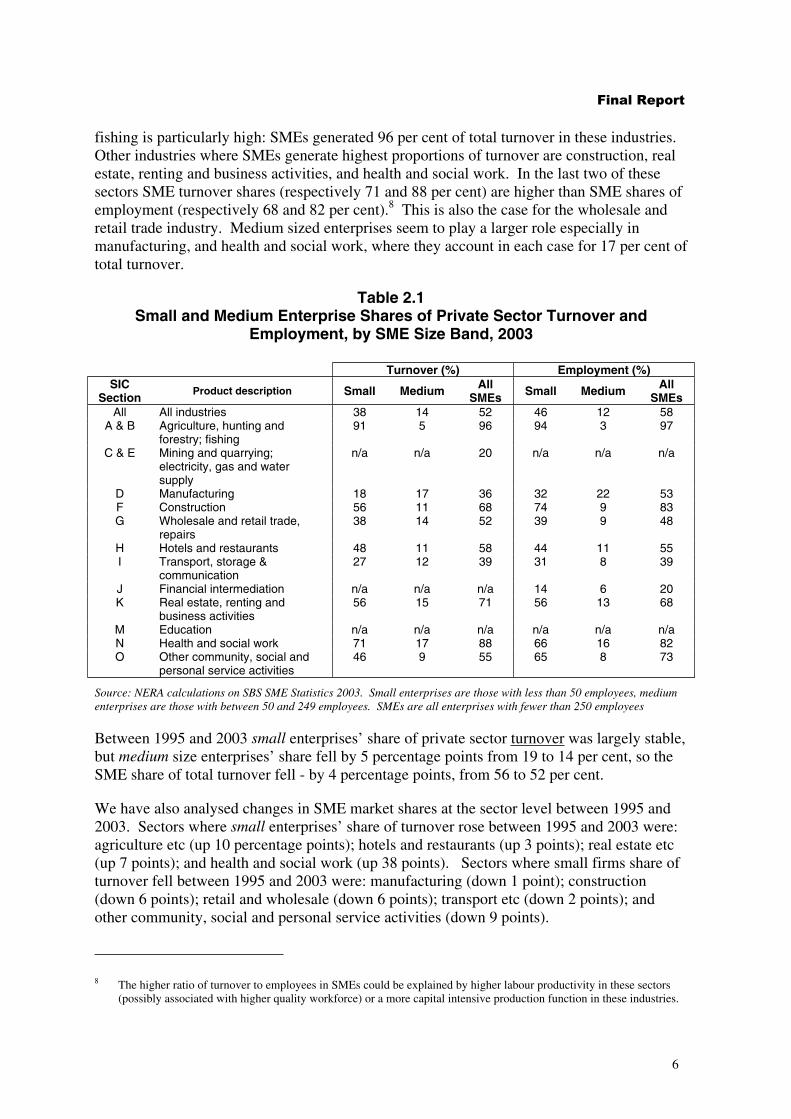
fishing is particularly high: SMEs generated 96 per cent of total turnover in these industries. Other industries where SMEs generate highest proportions of turnover are construction, real estate, renting and business activities, and health and social work. In the last two of these sectors SME turnover shares (respectively 71 and 88 per cent) are higher than SME shares of employment (respectively 68 and 82 per cent).8 This is also the case for the wholesale and retail trade industry. Medium sized enterprises seem to play a larger role especially in manufacturing, and health and social work, where they account in each case for 17 per cent of total turnover.
Table 2.1 Small and Medium Enterprise Shares of Private Sector Turnover and
Employment, by SME Size Band, 2003
Turnover (%) Employment (%) SIC
Section Product description Small Medium All
SMEs Small Medium All SMEs
All All industries 38 14 52 46 12 58 A & B
C & E
D F
Agriculture, hunting and forestry; fishing Mining and quarrying; electricity, gas and water supply Manufacturing Construction
91
n/a
18 56
5
n/a
17 11
96
20
36 68
94 3 97
n/a n/a n/a
32 22 53 74 9 83
G Wholesale and retail trade, 38 14 52 39 9 48
H repairs Hotels and restaurants 48 11 58 44 11 55
I Transport, storage & communication
27 12 39 31 8 39
J K
Financial intermediation Real estate, renting and business activities
n/a 56
n/a 15
n/a 71
14 6 20 56 13 68
M N
Education Health and social work
n/a 71
n/a 17
n/a 88
n/a n/a n/a 66 16 82
O Other community, social and personal service activities
46 9 55 65 8 73
Source: NERA calculations on SBS SME Statistics 2003. Small enterprises are those with less than 50 employees, medium enterprises are those with between 50 and 249 employees. SMEs are all enterprises with fewer than 250 employees
Between 1995 and 2003 small enterprises’ share of private sector turnover was largely stable, but medium size enterprises’ share fell by 5 percentage points from 19 to 14 per cent, so the SME share of total turnover fell - by 4 percentage points, from 56 to 52 per cent.
We have also analysed changes in SME market shares at the sector level between 1995 and 2003. Sectors where small enterprises’ share of turnover rose between 1995 and 2003 were: agriculture etc (up 10 percentage points); hotels and restaurants (up 3 points); real estate etc (up 7 points); and health and social work (up 38 points). Sectors where small firms share of turnover fell between 1995 and 2003 were: manufacturing (down 1 point); construction (down 6 points); retail and wholesale (down 6 points); transport etc (down 2 points); and other community, social and personal service activities (down 9 points).
The higher ratio of turnover to employees in SMEs could be explained by higher labour productivity in these sectors (possibly associated with higher quality workforce) or a more capital intensive production function in these industries.
6
8

� ������������
Small enterprises’ share of total private sector employment fell between 1995 and 2003 from 48 per cent to 46 per cent, while medium firms’ share fell from 13 to 12 per cent. Thus SME share as a whole fell - by 3 percentage points, from 61 to 58 per cent of total private sector employment.
2.2.2. SME involvement at a narrow sectoral level (SIC group data)
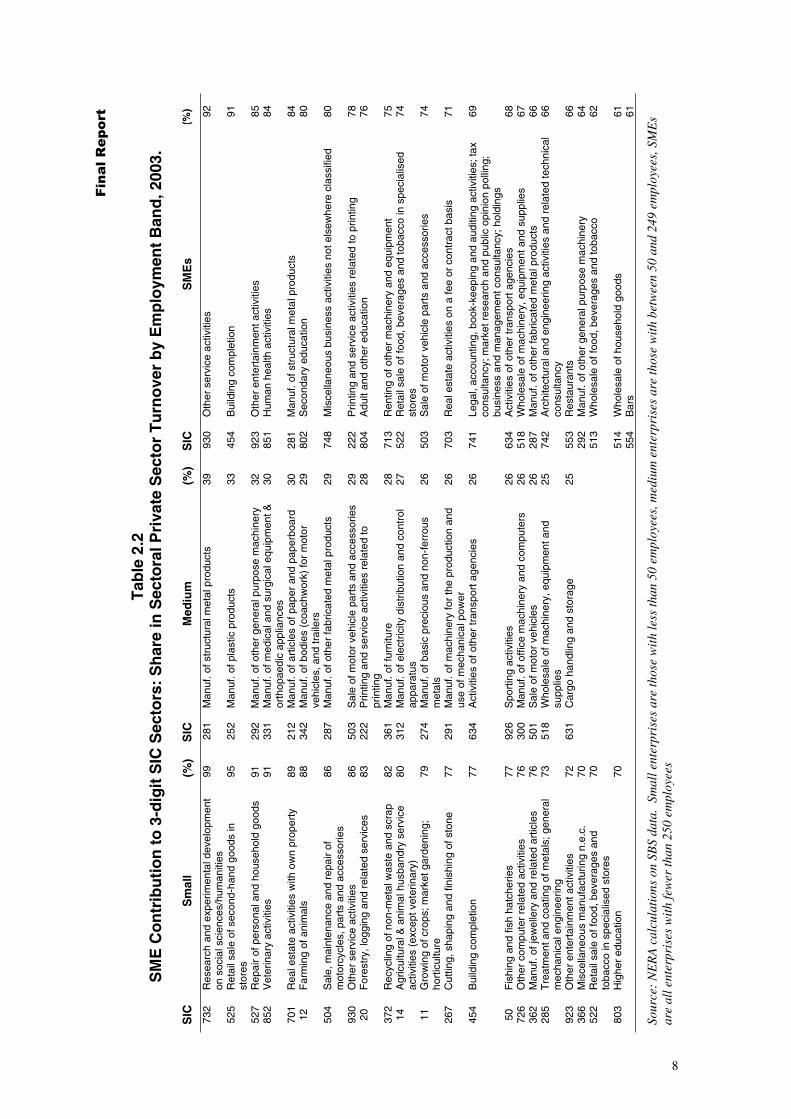
This section highlights those SIC 3-digit sectors where small and/or medium size enterprises provide the largest proportionate contributions to sectoral turnover. Table 2.2 shows figures for all SMEs, and for small and medium size enterprises separately.
Medium size enterprises particularly contribute to manufacturing turnover. The highest shares of medium size enterprises relative to sector turnover are found in the metal, plastics, general purpose machinery, medical and surgical equipment, and paper and paperboard manufacturing sectors.
We also present data on other sectors where small enterprises contribute more than 70 per cent of total turnover. Small enterprises generate around or above 90 per cent of private sector turnover for research in social sciences and humanities, retail sale of second hand goods, repair of personal and household goods, veterinary activity, real estate activities with own property, and farming of animals.
SMEs as a whole are particularly active in other service activities, building completion, other entertainment activities, human health activities, manufacturing of metal products, secondary, adult and other education, and printing.
7
�
�������������
Tab
le 2
.2
SM
E C
on
trib
uti
on
to
3-d
igit
SIC
Sec
tors
: S
har
e in
Sec
tora
l Pri
vate
Sec
tor
Tu
rno
ver
by
Em
plo
ymen
t B
and
, 200
3.
SIC
S
mal
l (%
) S
IC
Med
ium
(%
) S
IC
S
ME
s (%
)
732
R
esea
rch
and
expe
rimen
tal d
evel
opm
ent
99
281
Man
uf. o
f str
uctu
ral m
etal
pro
duct
s 39
93
0 O
ther
ser
vice
act
iviti
es
92
on s
ocia
l sci
ence
s/hu
man
ities
525
R
etai
l sal
e of
sec
ond-
hand
goo
ds in
95
25
2 M
anuf
. of p
last
ic p
rodu
cts
33
454
Bui
ldin
g co
mpl
etio
n 91
st
ores
52
7
Rep
air
of p
erso
nal a
nd h
ouse
hold
goo
ds
91
292
Man
uf. o
f oth
er g
ener
al p
urpo
se m
achi
nery
32
92
3 O
ther
ent
erta
inm
ent a
ctiv
ities
85
85
2
Vet
erin
ary
activ
ities
91
33
1 M
anuf
. of m
edic
al a
nd s
urgi
cal e
quip
men
t &
30
851
Hum
an h
ealth
act
iviti
es
84
orth
opae
dic
appl
ianc
es70
1 R
eal e
stat
e ac
tiviti
es w
ith o
wn
prop
erty
89
21
2 M
anuf
. of a
rtic
les
of p
aper
and
pap
erbo
ard
30
281
Man
uf. o
f str
uctu
ral m
eta
l pro
duct
s 84
12
F
arm
ing
of a
nim
als
88
342
Man
uf. o
f bod
ies
(coa
chw
ork)
for
mot
or
29
802
Sec
onda
ry e
duca
tion
80
vehi
cles
, and
trai
lers
504
Sal
e, m
aint
enan
ce a
nd r
epai
r of
86
28
7 M
anuf
. of o
ther
fabr
icat
ed m
etal
pro
duct
s 29
74
8 M
isce
llane
ous
busi
ness
act
iviti
es n
ot e
lsew
here
cla
ssifi
ed
80
mot
orcy
cles
, par
ts a
nd a
cces
sorie
s93
0 O
ther
ser
vice
act
iviti
es
86
503
Sal
e of
mot
or v
ehic
le p
arts
and
acc
esso
ries
29
222
Prin
ting
and
serv
ice
activ
ities
rel
ated
to p
rintin
g 78
20
F
ores
try,
logg
ing
and
rela
ted
serv
ices
83
22
2 P
rintin
g an
d se
rvic
e ac
tiviti
es r
elat
ed to
28
80
4 A
dult
and
othe
r ed
ucat
ion
76
prin
ting
372
Rec
yclin
g of
non
-met
al w
aste
and
scr
ap
82
361
Man
uf. o
f fur
nitu
re
28
713
Ren
ting
of o
ther
mac
hine
ry a
nd e
quip
men
t 75
14
A
gric
ultu
ral &
ani
mal
hus
band
ry s
ervi
ce
80
312
Man
uf. o
f ele
ctric
ity d
istr
ibut
ion
and
cont
rol
27
522
Ret
ail s
ale
of fo
od, b
ever
ages
and
toba
cco
in s
peci
alis
ed
74
activ
ities
(ex
cept
vet
erin
ary)
ap
para
tus
stor
es
11
Gro
win
g of
cro
ps; m
arke
t gar
deni
ng;
79
274
Man
uf. o
f bas
ic p
reci
ous
and
non-
ferr
ous
26
503
Sal
e of
mot
or v
ehic
le p
arts
and
acc
esso
ries
74
hort
icul
ture
m
etal
s 26
7 C
uttin
g, s
hapi
ng a
nd fi
nish
ing
of s
tone
77
29
1 M
anuf
. of m
achi
nery
for
the
prod
uctio
n an
d 26
70
3 R
eal e
stat
e ac
tiviti
es o
n a
fee
or c
ontr
act b
asis
71
us
e of
mec
hani
cal p
ower
454
Bui
ldin
g co
mpl
etio
n 77
63
4 A
ctiv
ities
of o
ther
tran
spor
t age
ncie
s 26
74
1 Le
gal,
acco
untin
g, b
ook-
keep
ing
and
audi
ting
activ
ities
; tax
69
co
nsul
tanc
y; m
arke
t res
earc
h an
d pu
blic
opi
nion
pol
ling;
busi
ness
and
man
agem
ent c
onsu
ltanc
y; h
oldi
ngs
50
Fis
hing
and
fish
hat
cher
ies
77
926
Spo
rtin
g ac
tiviti
es
26
634
Act
iviti
es o
f oth
er tr
ansp
ort a
genc
ies
68
726
O
ther
com
pute
r re
late
d ac
tiviti
es
76
300
Man
uf. o
f offi
ce m
achi
nery
and
com
pute
rs
26
518
Who
lesa
le o
f mac
hine
ry, e
quip
men
t and
sup
plie
s 67
36
2
Man
uf. o
f jew
elle
ry a
nd r
elat
ed a
rtic
les
76
501
Sal
e of
mot
or v
ehic
les
26
287
Man
uf. o
f oth
er fa
bric
ated
met
al p
rodu
cts
66
285
T
reat
men
t and
coa
ting
of m
etal
s; g
ener
al
73
518
Who
lesa
le o
f mac
hine
ry, e
quip
men
t and
25
74
2 A
rchi
tect
ural
and
eng
inee
ring
activ
ities
and
rel
ated
tech
nica
l 66
m
echa
nica
l eng
inee
ring
supp
lies
cons
ulta
ncy
923
O
ther
ent
erta
inm
ent a
ctiv
ities
72
63
1 C
argo
han
dlin
g an
d st
orag
e 25
55
3 R
esta
uran
ts
66
366
M
isce
llane
ous
man
ufac
turin
g n.
e.c.
70
29
2 M
anuf
. of o
ther
gen
eral
pur
pose
mac
hine
ry
64
522
R
etai
l sal
e of
food
, bev
erag
es a
nd
70
513
Who
lesa
le o
f foo
d, b
ever
ages
and
toba
cco
62
toba
cco
in s
peci
alis
ed s
tore
s80
3 H
ighe
r ed
ucat
ion
70
514
Who
lesa
le o
f hou
seho
ld g
oods
61
55
4 B
ars
61
Sour
ce:
NE
RA
cal
cula
tion
s on
SB
S da
ta.
Smal
l ent
erpr
ises
are
thos
e w
ith
less
than
50
empl
oyee
s, m
ediu
m e
nter
pris
es a
re th
ose
wit
h be
twee
n 50
and
249
em
ploy
ees,
SM
Es
are
all e
nter
pris
es w
ith
few
er th
an 2
50 e
mpl
oyee
s
8
� �������������
2.3. Government Consumption by Sector
In this section we use ONS UK data published in the Input-Output Supply and Use Tables 2002 to analyse the distribution of government expenditure on procurement across sectors. In 2002 government “output” totalled £229 billion, of which 47 per cent represented compensation to public employees, 2 per cent was consumption of capital, and the remaining 49 per cent, or about £110 billion, was purchases of goods and services.
The figure of £110 billion is the figure for “total intermediate consumption”, which is about 5 percent of the corresponding figure (£2,371 billion) for the economy as a whole.9 Thus on average suppliers face a market in which only 5 percent of procurement is by government. However this conceals very wide variations across sectors.
We examine both levels of government purchases and the share of government purchases within each sector. Sectoral classification is based on the 123 sector codes. This classification is compared in Appendix A with the SIC codes defining the data used in Section 2.2. In most cases 123 sectors match exactly the definition of SIC 2-digit or 3-digit industries, or sums thereof. In some cases however, 123 sectors correspond to parts of diverse SIC sectors. When this is the case, as for “Real estate activities with own property; letting of own property, except dwellings” and “Letting of dwellings, including imputed rent” (“123 codes” 103 and 104), we cannot establish a link between detailed SIC based statistics and 123 sector based statistics. It is always possible, however, to aggregate 123 sectors into broad SIC industries, as in Section 2.2.
Data available on government purchases are for purchases from all businesses. There are no comprehensive data on government purchases from SMEs only.
Figures for current government expenditure are available separately for local government (divided by six categories of spend), central government (excluding health and veterinary services), and health and veterinary services provided by central government. Table 2.3 shows figures on total supply of products in each sector at purchasers’ prices, and on consumption by local government, central government (excluding health), and central government health and veterinary services (“123 code” 117), and for total government consumption, which is the sum of all three of these categories.
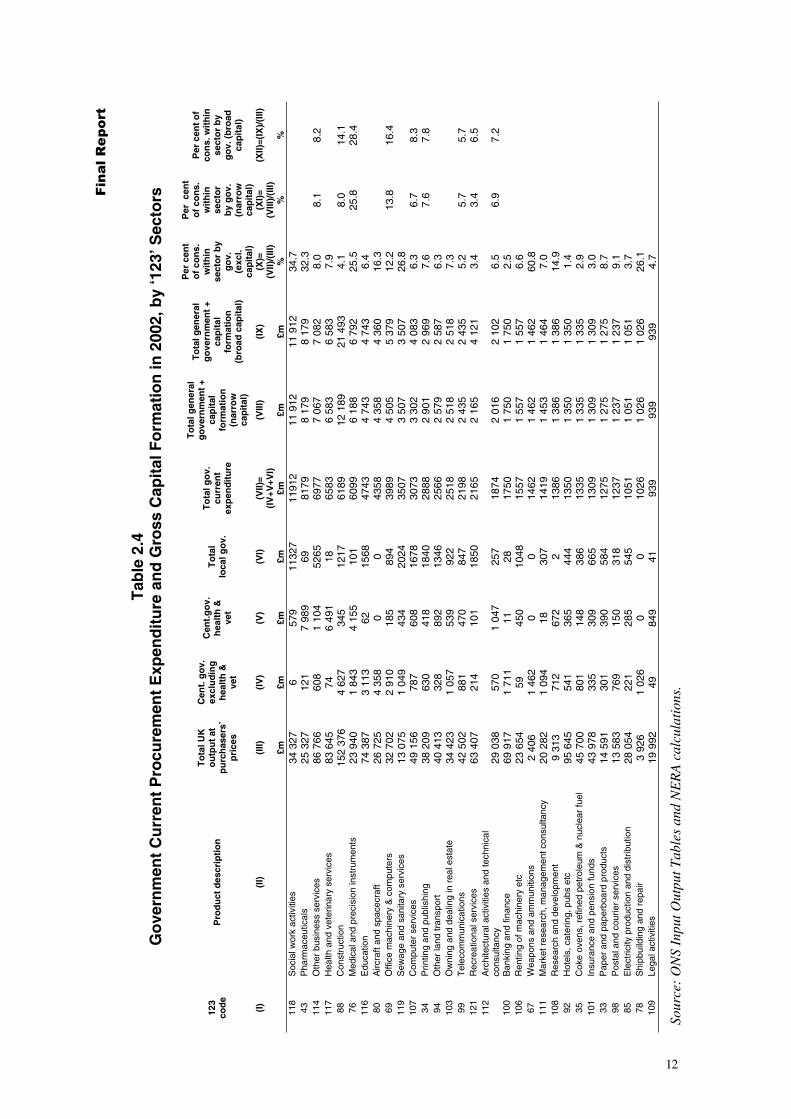
We have calculated the share of government procurement expenditure in each sector’s total output, and ranked sectors accordingly. In Table 2.3 we show data for sectors where the share of government is at least 7 per cent. Government consumption of weapons and ammunitions accounts for 60.8 per cent of the total intermediate output of this sector. As a generalisation, government is a proportionately major procurer in defence and health related
Statistical data in this field can be confusing, because of the inherent complexity of monetary flows in the economy. Thus the figure of over £2000 billion for total intermediate consumption is about twice the level of the much more familiar Gross National Product (GDP), which is a measure of value added. And the figure of about £230 billion for government “output” is much less than the familiar totals for public expenditure and taxation of around 40 per cent of GDP, mainly because it excludes transfer payments such as social benefits, and payments of debt interest. The Byatt Review of local government procurement in England, of June 2001, noted that “estimates of procurement spending vary widely, depending on the definitions used. Total non-pay revenue expenditure by local authorities in England for 1998/99 was £42.2 billion .. and capital expenditure was £6.6 billion.” These figures are broadly consistent with those in this Chapter.
9
9

� �������������
markets and in social work activities. Our case studies suggest that it is also a proportionately major procurer in administration related markets not only under the heading of office machinery and computers, but in markets such as IT systems; however recorded spending on such activities is probably spread thinly over many sectors. The final column in Table 2.3 records the SIC section to which each of the 123 sectors belongs, as shown in Table 2.5. Of the nineteen 123 sectors listed, 11 fall under SIC section D (Manufacturing) and 4 under section K (Real estate, renting and business activities).
Table 2.3 Government Current Expenditure Procurement in 2002, by ‘123’ Sectors
Sector 123
code Product description
Total output at
purchasers ’ prices
Central govt.
excluding health & vet
Central govt.
health & vet
Total local govt.
Total govt.
Per cent of current procurement
expenditure within sector by govt.
SIC Section
(I) (II) (III) (IV) (V) (VI) (VII)= (VIII)=(VII)/(III) (IV+V+VI)
£m £m £m £m %
67 Weapons and 2 406 1 462 0 0 1462 60.8 D
ammunitions 118 Social work activities 34 327 6 579 11327 11912 34.7 N
43 Pharmaceuticals 25 327 121 7 989 69 8179 32.3 D
119 Sewage and sanitary 13 075 1 049 434 2024 3507 26.8 O services
78 Shipbuilding and repair 3 926 1 026 0 0 1026 26.1 D
76 Medical and precision 23 940 1 843 4 155 101 6099 25.5 D instruments
80 Aircraft and spacecraft 26 725 4 358 0 0 4358 16.3 D
108 Research and 9 313 712 672 2 1386 14.9 K development
69 Office machinery & 32 702 2 910 185 894 3989 12.2 D computers
87 Water supply 4 080 178 74 212 464 11.4 E
93 Railway transport 7 509 387 116 340 843 11.2 D
52 Cement, lime and 1 734 0 11 173 184 10.6 D plaster
98 Postal and courier 13 583 769 150 318 1237 9.1 I services
33 Paper and paperboard 14 591 301 390 584 1275 8.7 D products
114 Other business services 86 766 608 1 104 5265 6977 8.0 K
117 Health and veterinary 83 645 74 6 491 18 6583 7.9 D services
34 Printing and publishing 38 209 1462 418 1840 2888 7.6 D
103 Owning and dealing in 34 423 6 539 922 2518 7.3 K real estate
111 Market research, 20 282 121 18 307 1419 7.0 K management consultancy
Source: ONS Input-Output Tables and NERA calculations.
The data in Table 2.3 exclude capital. Input-output data on gross capital formation are provided at a more aggregate level than data on current expenditure, but are not available for exactly the same sectors. We can adopt a narrow definition, and slightly underestimate
10

�
10
�������������
government capital formation by excluding two sectors (119 “Sewage and refuse disposal, sanitation and similar activities”; and 121 “Recreational, cultural and sporting activities”). Alternatively we can adopt a broader definition, and slightly overestimate capital formation by including three sectors that are not included in the definition of current government expenditure (120 “Activities of membership organisation not elsewhere classified”; 122 “Other service activities”; and 123 “Private households with employed persons”).
Table 2.4 demonstrates the impact on the rankings of different definitions of government consumption. In Table 2.4, columns (III) to (IX) rank sectors by levels of government current expenditure. Columns (X), (XI) and (XII) show figures on government procurement percentage shares in each sector including, in columns XI and XII, the two alternative definitions of capital. Where the figures for capital are zero we leave columns XI and XII blank. The table shows that the impact of capital on the evaluation of the role of government is particularly relevant in only a few sectors, with a very large impact on Construction and much smaller impacts on Medical and precision instruments; Office machinery and computers; Computer services; and Recreational services.
Only in the case of Construction would the inclusion of capital have lifted the government share of the market clearly from below to above the 7 per cent threshold used for Table 2.3.
Our results are broadly consistent with figures on average government procurement (including capital formation) from 1997-2001 reported in chapter 7 of the Office of Fair Trading (OFT) 2004 report Assessing the Impact of Public Sector Procurement on Competition. We identified high government shares in all sectors included in the OFT report. However in some sectors the levels of government involvement are noticeably different from those identified in that report. Figures from the 2002 data analysed by NERA indicate government shares significantly higher than OFT report estimates in social work activities, pharmaceuticals, sewage and sanitary services, and medical and precision instruments. Our analysis also shows lower government expenditure on health and veterinary services in 2002 than the OFT report figures for the 1997 to 2001. Government consumption in water supply and railway transport, two sectors that were not included in the OFT report, accounted for more than 11 per cent of output of these two sectors in 2002.10
The OFT report analysis only includes sectors where government consumption exceeds 10 per cent of total output. The government share (excluding capital) in water supply and railway transport ranged below or around 10 per cent from 1997-2001. On average, the whole period mean government share was below 10 per cent for these two industries. There is no such simple explanation for the low figures in the OFT report for social work activities etc and its high figures for health and veterinary services.
11
�
�������������
Tab
le 2
.4G
ove
rnm
ent
Cu
rren
t P
rocu
rem
ent
Exp
end
itu
re a
nd
Gro
ss C
apit
al F
orm
atio
n in
200
2, b
y ‘1
23’ S
ecto
rs
Per
cen
t P
er c
ent
To
tal g
ener
alT
ota
l UK
C
ent.
go
v.
go
vern
men
t +
To
tal g
ener
al
of
con
s.
of
con
s.
Per
cen
t o
f
123
ou
tpu
t at
ex
clu
din
gC
ent.
go
v.T
ota
lT
ota
l go
v.
cap
ital
go
vern
men
t +
wit
hin
wit
hin
con
s. w
ith
in
cod
e P
rod
uct
des
crip
tio
n
pu
rch
aser
s’h
ealt
h &
h
ealt
h &
lo
cal g
ov.
cu
rren
tfo
rmat
ion
cap
ital
sect
or
by
sect
or
sect
or
by
vet
exp
end
itu
re
form
atio
ng
ov.
by
go
v.
go
v. (
bro
adp
rice
s ve
t (n
arro
w(b
road
cap
ital
) (e
xcl.
(nar
row
cap
ital
)ca
pit
al)
cap
ital
) ca
pit
al)
(I)
(II)
(I
II)
(IV
) (V
) (V
I)
(VII)
=(V
III)
(IX
) (X
)=
(XI)
=(X
II)=(
IX)/
(III)
(IV
+V+V
I)
(VII)
/(III
) (V
III)/
(III)
£m
£m
£m
£m
£m
£m
£m
%
%
%
11
8 S
ocia
l wor
k ac
tiviti
es
34 3
27
6 57
9 11
327
1191
2 11
912
11
912
34
.7
43
Pha
rmac
eutic
als
25 3
27
121
7 98
9 69
81
79
8 17
9 8
179
32.3
11
4 O
ther
bus
ines
s se
rvic
es
86 7
66
608
1 10
4 52
65
6977
7
067
7 08
2 8.
0 8.
1 8.
2 11
7 H
ealth
and
vet
erin
ary
serv
ices
83
645
74
6
491
18
6583
6
583
6 58
3 7.
9 88
C
onst
ruct
ion
152
376
4 62
7 34
5 12
17
6189
12
189
21
493
4.
1 8.
0 14
.1
76
Med
ical
and
pre
cisi
on in
stru
men
ts
23 9
40
1 84
3 4
155
101
6099
6
188
6 79
2 25
.5
25.8
28
.4
116
Edu
catio
n 74
387
3
113
62
1568
47
43
4 74
3 4
743
6.4
80
Airc
raft
and
spac
ecra
ft 26
725
4
358
0 0
4358
4
358
4 36
0 16
.3
69
Offi
ce m
achi
nery
& c
ompu
ters
32
702
2
910
185
894
3989
4
505
5 37
9 12
.2
13.8
16
.4
119
Sew
age
and
sani
tary
ser
vice
s 13
075
1
049
434
2024
35
07
3 50
7 3
507
26.8
10
7 C
ompu
ter
serv
ices
49
156
78
7 60
8 16
78
3073
3
302
4 08
3 6.
3 6.
7 8.
3 34
P
rintin
g an
d pu
blis
hing
38
209
63
0 41
8 18
40
2888
2
901
2 96
9 7.
6 7.
6 7.
8 94
O
ther
land
tran
spor
t 40
413
32
8 89
2 13
46
2566
2
579
2 58
7 6.
3 10
3 O
wni
ng a
nd d
ealin
g in
rea
l est
ate
34 4
23
1 05
7 53
9 92
2 25
18
2 51
8 2
518
7.3
99
Tel
ecom
mun
icat
ions
42
502
88
1 47
0 84
7 21
98
2 43
5 2
435
5.2
5.7
5.7
121
Rec
reat
iona
l ser
vice
s 63
407
21
4 10
1 18
50
2165
2
165
4 12
1 3.
4 3.
4 6.
5 11
2 A
rchi
tect
ural
act
iviti
es a
nd te
chni
cal
cons
ulta
ncy
29 0
38
570
1 04
7 25
7 18
74
2 01
6 2
102
6.5
6.9
7.2
100
Ban
king
and
fina
nce
69 9
17
1 71
1 11
28
17
50
1 75
0 1
750
2.5
106
Ren
ting
of m
achi
nery
etc
23
654
59
45
0 10
48
1557
1
557
1 55
7 6.
6 67
W
eapo
ns a
nd a
mm
uniti
ons
2 40
6 1
462
0 0
1462
1
462
1 46
2 60
.8
111
Mar
ket r
esea
rch,
man
agem
ent c
onsu
ltanc
y 20
282
1
094
18
307
1419
1
453
1 46
4 7.
0 10
8 R
esea
rch
and
deve
lopm
ent
9 31
3 71
2 67
2 2
1386
1
386
1 38
6 14
.9
92
Hot
els,
cat
erin
g, p
ubs
etc
95 6
45
541
365
444
1350
1
350
1 35
0 1.
4 35
C
oke
oven
s, r
efin
ed p
etro
leum
& n
ucle
ar fu
el
45 7
00
801
148
386
1335
1
335
1 33
5 2.
9 10
1 In
sura
nce
and
pens
ion
fund
s 43
978
33
5 30
9 66
5 13
09
1 30
9 1
309
3.0
33
Pap
er a
nd p
aper
boar
d pr
oduc
ts
14 5
91
301
390
584
1275
1
275
1 27
5 8.
7 98
P
osta
l and
cou
rier
serv
ices
13
583
76
9 15
0 31
8 12
37
1 23
7 1
237
9.1
85
Ele
ctric
ity p
rodu
ctio
n an
d di
strib
utio
n 28
054
22
1 28
5 54
5 10
51
1 05
1 1
051
3.7
78
Shi
pbui
ldin
g an
d re
pair
3 92
6 1
026
0 0
1026
1
026
1 02
6 26
.1
109
Lega
l act
iviti
es
19 9
92
49
849
41
939
939
939
4.7
Sour
ce:
ON
S In
put O
utpu
t Tab
les
and
NE
RA
cal
cula
tion
s.
12
� �������������
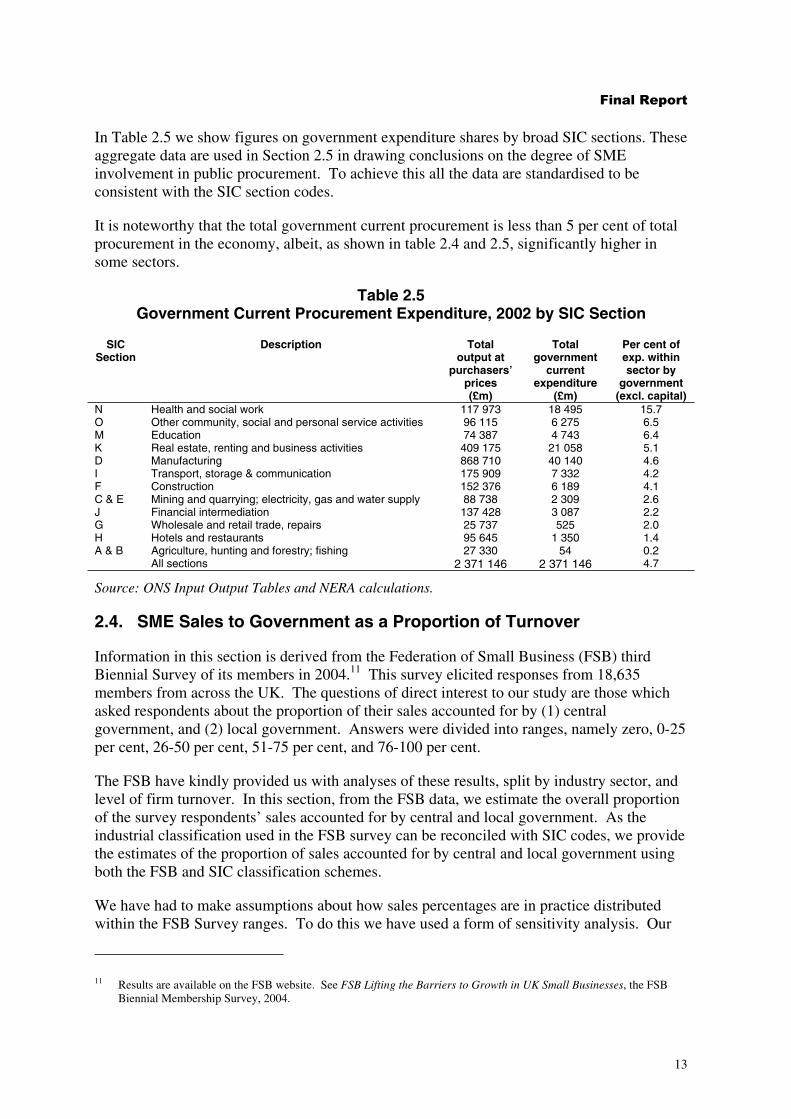
In Table 2.5 we show figures on government expenditure shares by broad SIC sections. These aggregate data are used in Section 2.5 in drawing conclusions on the degree of SME involvement in public procurement. To achieve this all the data are standardised to be consistent with the SIC section codes.
It is noteworthy that the total government current procurement is less than 5 per cent of total procurement in the economy, albeit, as shown in table 2.4 and 2.5, significantly higher in some sectors.
Table 2.5 Government Current Procurement Expenditure, 2002 by SIC Section
SIC Section
Description Total output at
purchasers’ prices (£m)
Total government
current expenditure
(£m)
Per cent of exp. within sector by
government (excl. capital)
N Health and social work 117 973 18 495 15.7 O M
Other community, social and personal service activities Education
96 115 74 387
6 275 4 743
6.5 6.4
K D I F
Real estate, renting and business activities Manufacturing Transport, storage & communication Construction
409 175 868 710 175 909 152 376
21 058 40 140 7 332 6 189
5.1 4.6 4.2 4.1
C & E J
Mining and quarrying; electricity, gas and water supply Financial intermediation
88 738 137 428
2 309 3 087
2.6 2.2
G H
Wholesale and retail trade, repairs Hotels and restaurants
25 737 95 645
525 1 350
2.0 1.4
A & B Agriculture, hunting and forestry; fishing All sections
27 330 2 371 146
54 2 371 146
0.2 4.7
Source: ONS Input Output Tables and NERA calculations.
2.4. SME Sales to Government as a Proportion of Turnover
Information in this section is derived from the Federation of Small Business (FSB) third Biennial Survey of its members in 2004.11 This survey elicited responses from 18,635 members from across the UK. The questions of direct interest to our study are those which asked respondents about the proportion of their sales accounted for by (1) central government, and (2) local government. Answers were divided into ranges, namely zero, 0-25 per cent, 26-50 per cent, 51-75 per cent, and 76-100 per cent.
The FSB have kindly provided us with analyses of these results, split by industry sector, and level of firm turnover. In this section, from the FSB data, we estimate the overall proportion of the survey respondents’ sales accounted for by central and local government. As the industrial classification used in the FSB survey can be reconciled with SIC codes, we provide the estimates of the proportion of sales accounted for by central and local government using both the FSB and SIC classification schemes.
We have had to make assumptions about how sales percentages are in practice distributed within the FSB Survey ranges. To do this we have used a form of sensitivity analysis. Our
Results are available on the FSB website. See FSB Lifting the Barriers to Growth in UK Small Businesses, the FSB Biennial Membership Survey, 2004.
13
11

� �������������
tables of aggregate SME sales (Tables 2.7, 2.9, 2.10, 2.12 and 2.14) show estimates for a baseline case assumption and the average of estimates from five alternative scenarios. The baseline case is very close to an assumption that the distribution of firms by percentage of sales within each range is even. Alternative scenarios test the impact of a skewed distribution within each range towards levels of sales lower than the mean and/or a skewed distribution towards higher levels of sales in the top two ranges.12
A quantitatively more substantial issue is that of how representative the sample of respondents to the FSB survey is of SMEs as a whole. The total response of over 18,000 firms is impressively large. Of these about half completed replies on sales to central or to local government, of whom, in turn, roughly half filed a nil return. We have derived percentages of sales to central and to local government just from those who responded to these specific questions, including the nil returns.
The percentage of sales to government reported by these respondents, if applied to the whole of SME output, would imply aggregate sales greater than total government procurement. Thus (even though the figures reported in the survey are likely to include a considerable amount of subcontracted work for an ultimate government client, as well as direct sales. to government) the high aggregate “sales to government” recorded by respondents implies that businesses that sell to government are strongly over represented among these respondents.13
However these problems with the totals do not prevent the FSB data providing useful insights into the distribution of sales across sectors, which is the main focus of the analysis in this Chapter.
12 In our baseline case we have assumed zero, 0.10, 0.35, 0.60 and 0.85 as average turnover values for the given turnover bands (zero, 1 to 25, 26 to 50, 51 to 75, and 76 to 100). The assumptions in our alternative four scenarios are zero, 0.05, 0.35, 0.60 and 0.85; zero, 0.05, 0.30, 0.60 and 0.85; zero, 0.13, 0.38, 0.63 and 0.88; zero, 0.10, 0.30, 0.63 and 0.88.
13 These comments have been discussed and confirmed with the FSB. They should not be taken as any criticism at all of the content or management of the Survey, which provides a most important source of data and appears to us to be excellently handled by the FSB and their contractors the University of Strathclyde.
14
� �������������
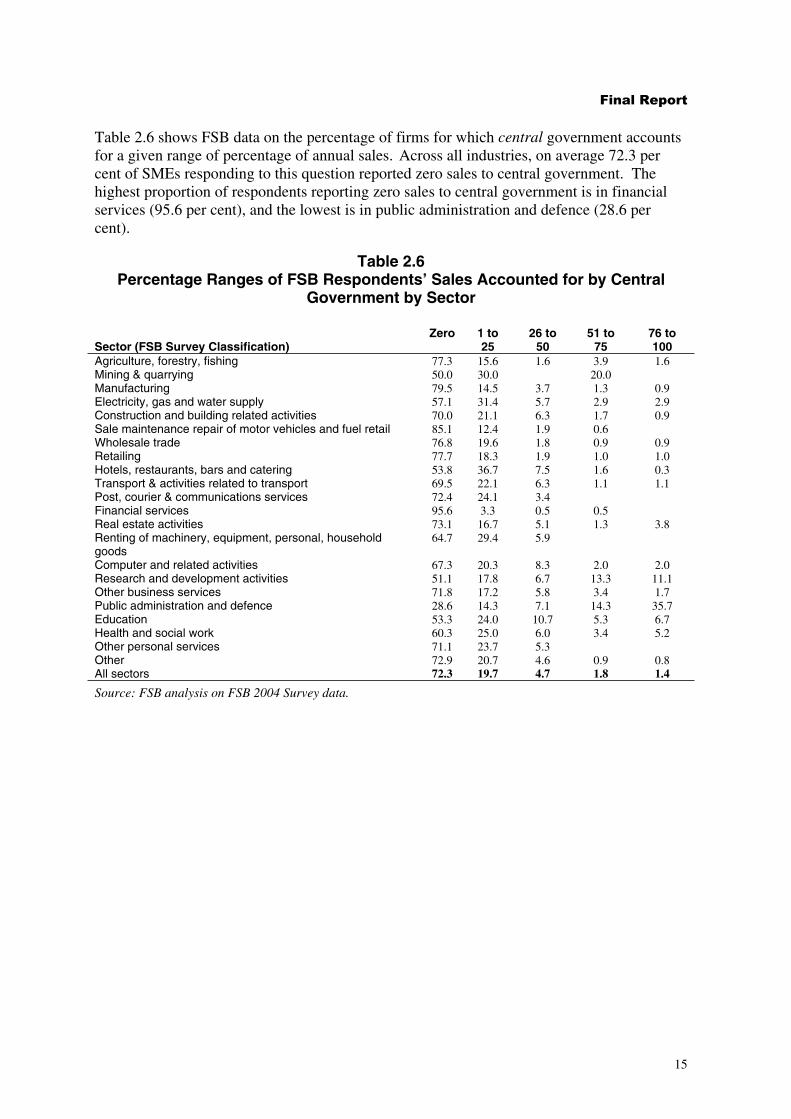
Table 2.6 shows FSB data on the percentage of firms for which central government accounts for a given range of percentage of annual sales. Across all industries, on average 72.3 per cent of SMEs responding to this question reported zero sales to central government. The highest proportion of respondents reporting zero sales to central government is in financial services (95.6 per cent), and the lowest is in public administration and defence (28.6 per cent).
Table 2.6 Percentage Ranges of FSB Respondents’ Sales Accounted for by Central
Government by Sector
Zero 1 to 26 to 51 to 76 to Sector (FSB Survey Classification) 25 50 75 100 Agriculture, forestry, fishing 77.3 15.6 1.6 3.9 1.6 Mining & quarrying 50.0 30.0 20.0 Manufacturing 79.5 14.5 3.7 1.3 0.9 Electricity, gas and water supply 57.1 31.4 5.7 2.9 2.9 Construction and building related activities 70.0 21.1 6.3 1.7 0.9 Sale maintenance repair of motor vehicles and fuel retail 85.1 12.4 1.9 0.6 Wholesale trade 76.8 19.6 1.8 0.9 0.9 Retailing 77.7 18.3 1.9 1.0 1.0 Hotels, restaurants, bars and catering 53.8 36.7 7.5 1.6 0.3 Transport & activities related to transport 69.5 22.1 6.3 1.1 1.1 Post, courier & communications services 72.4 24.1 3.4 Financial services 95.6 3.3 0.5 0.5 Real estate activities 73.1 16.7 5.1 1.3 3.8 Renting of machinery, equipment, personal, household 64.7 29.4 5.9 goods Computer and related activities 67.3 20.3 8.3 2.0 2.0 Research and development activities 51.1 17.8 6.7 13.3 11.1 Other business services 71.8 17.2 5.8 3.4 1.7 Public administration and defence 28.6 14.3 7.1 14.3 35.7 Education 53.3 24.0 10.7 5.3 6.7 Health and social work 60.3 25.0 6.0 3.4 5.2 Other personal services 71.1 23.7 5.3 Other 72.9 20.7 4.6 0.9 0.8 All sectors 72.3 19.7 4.7 1.8 1.4
Source: FSB analysis on FSB 2004 Survey data.
15
� �������������
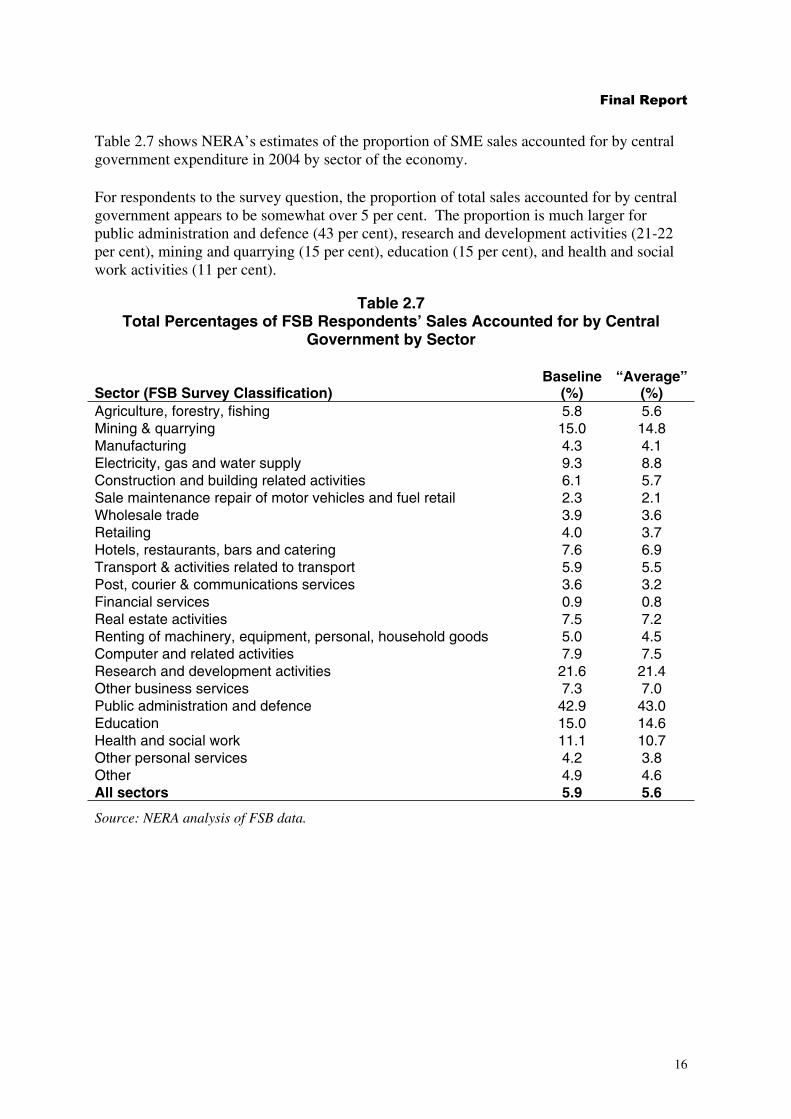
Table 2.7 shows NERA’s estimates of the proportion of SME sales accounted for by central government expenditure in 2004 by sector of the economy.
For respondents to the survey question, the proportion of total sales accounted for by central government appears to be somewhat over 5 per cent. The proportion is much larger for public administration and defence (43 per cent), research and development activities (21-22 per cent), mining and quarrying (15 per cent), education (15 per cent), and health and social work activities (11 per cent).
Table 2.7 Total Percentages of FSB Respondents’ Sales Accounted for by Central
Government by Sector
Baseline “Average” Sector (FSB Survey Classification) (%) (%) Agriculture, forestry, fishing 5.8 5.6 Mining & quarrying 15.0 14.8 Manufacturing 4.3 4.1 Electricity, gas and water supply 9.3 8.8 Construction and building related activities 6.1 5.7 Sale maintenance repair of motor vehicles and fuel retail 2.3 2.1 Wholesale trade 3.9 3.6 Retailing 4.0 3.7 Hotels, restaurants, bars and catering 7.6 6.9 Transport & activities related to transport 5.9 5.5 Post, courier & communications services 3.6 3.2 Financial services 0.9 0.8 Real estate activities 7.5 7.2 Renting of machinery, equipment, personal, household goods 5.0 4.5 Computer and related activities 7.9 7.5 Research and development activities 21.6 21.4 Other business services 7.3 7.0 Public administration and defence 42.9 43.0 Education 15.0 14.6 Health and social work 11.1 10.7 Other personal services 4.2 3.8 Other 4.9 4.6 All sectors 5.9 5.6
Source: NERA analysis of FSB data.
16
� �������������
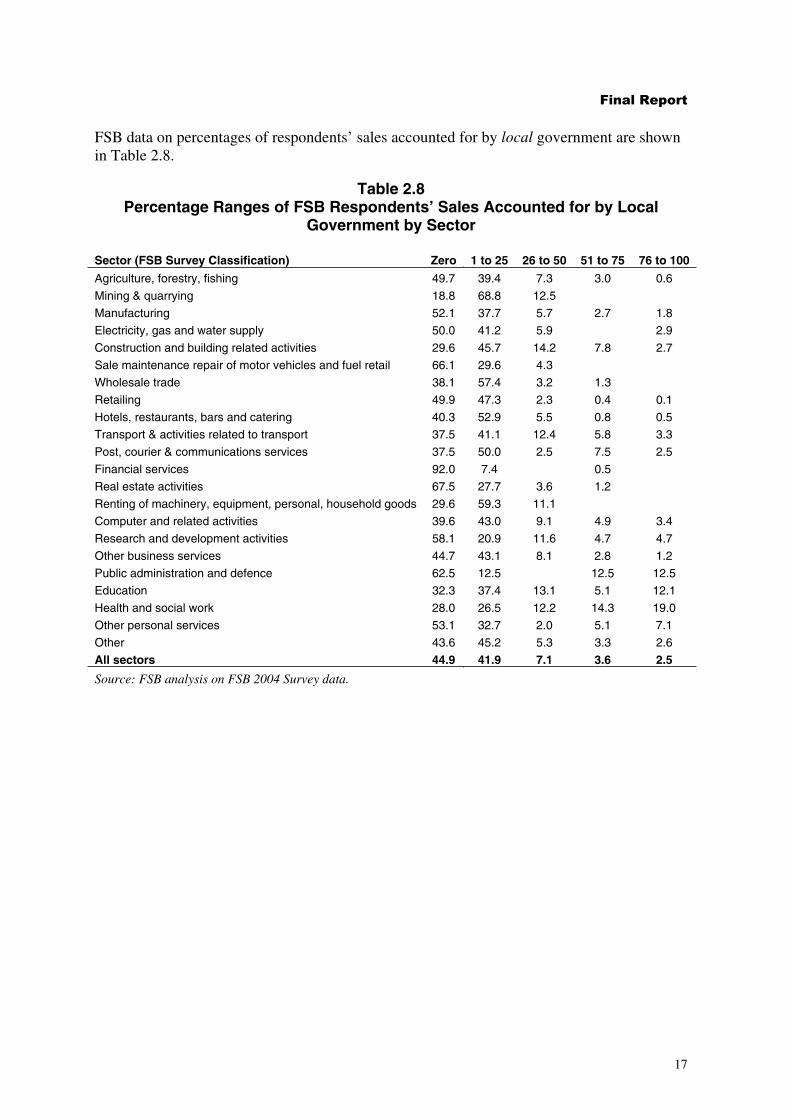
FSB data on percentages of respondents’ sales accounted for by local government are shown in Table 2.8.
Table 2.8 Percentage Ranges of FSB Respondents’ Sales Accounted for by Local
Government by Sector
Sector (FSB Survey Classification) Zero 1 to 25 26 to 50 51 to 75 76 to 100
Agriculture, forestry, fishing 49.7 39.4 7.3 3.0 0.6
Mining & quarrying 18.8 68.8 12.5
Manufacturing 52.1 37.7 5.7 2.7 1.8
Electricity, gas and water supply 50.0 41.2 5.9 2.9
Construction and building related activities 29.6 45.7 14.2 7.8 2.7
Sale maintenance repair of motor vehicles and fuel retail 66.1 29.6 4.3
Wholesale trade 38.1 57.4 3.2 1.3
Retailing 49.9 47.3 2.3 0.4 0.1
Hotels, restaurants, bars and catering 40.3 52.9 5.5 0.8 0.5
Transport & activities related to transport 37.5 41.1 12.4 5.8 3.3
Post, courier & communications services 37.5 50.0 2.5 7.5 2.5
Financial services 92.0 7.4 0.5
Real estate activities 67.5 27.7 3.6 1.2
Renting of machinery, equipment, personal, household goods 29.6 59.3 11.1
Computer and related activities 39.6 43.0 9.1 4.9 3.4
Research and development activities 58.1 20.9 11.6 4.7 4.7
Other business services 44.7 43.1 8.1 2.8 1.2
Public administration and defence 62.5 12.5 12.5 12.5
Education 32.3 37.4 13.1 5.1 12.1
Health and social work 28.0 26.5 12.2 14.3 19.0
Other personal services 53.1 32.7 2.0 5.1 7.1
Other 43.6 45.2 5.3 3.3 2.6
All sectors 44.9 41.9 7.1 3.6 2.5
Source: FSB analysis on FSB 2004 Survey data.
17
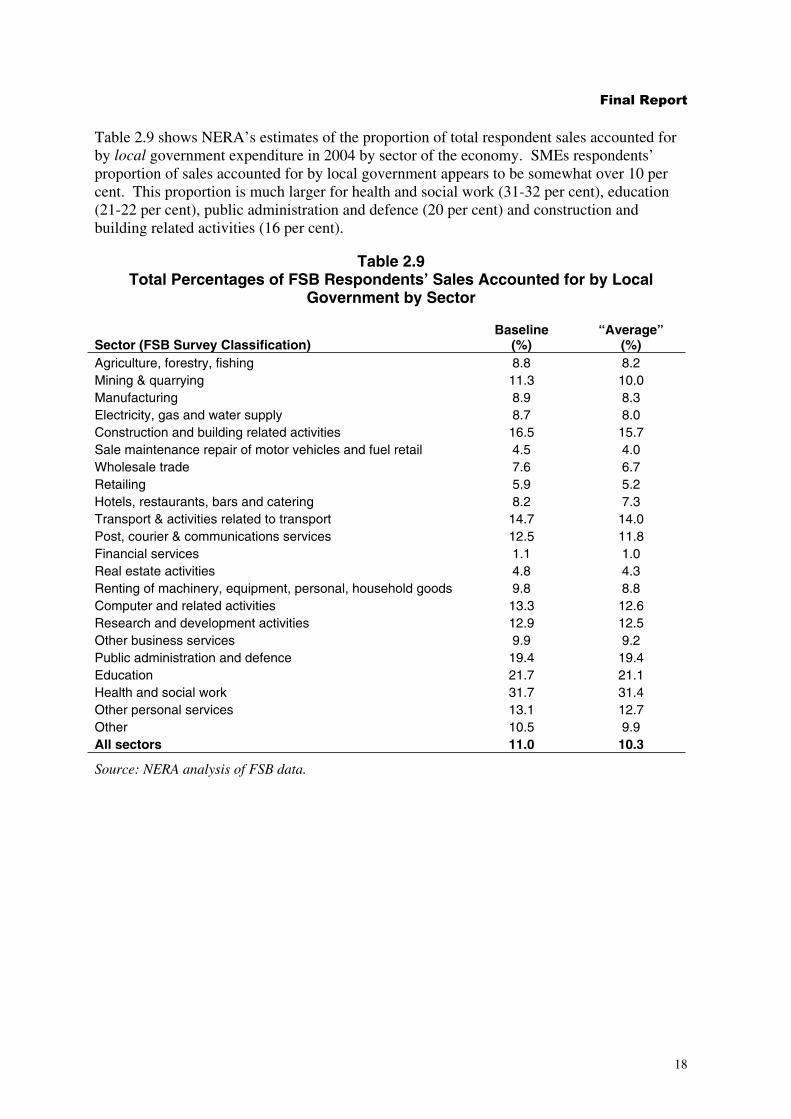
� �������������
Table 2.9 shows NERA’s estimates of the proportion of total respondent sales accounted for by local government expenditure in 2004 by sector of the economy. SMEs respondents’ proportion of sales accounted for by local government appears to be somewhat over 10 per cent. This proportion is much larger for health and social work (31-32 per cent), education (21-22 per cent), public administration and defence (20 per cent) and construction and building related activities (16 per cent).
Table 2.9 Total Percentages of FSB Respondents’ Sales Accounted for by Local
Government by Sector
Baseline “Average” Sector (FSB Survey Classification) (%) (%) Agriculture, forestry, fishing 8.8 8.2 Mining & quarrying 11.3 10.0 Manufacturing 8.9 8.3 Electricity, gas and water supply 8.7 8.0 Construction and building related activities 16.5 15.7 Sale maintenance repair of motor vehicles and fuel retail 4.5 4.0 Wholesale trade 7.6 6.7 Retailing 5.9 5.2 Hotels, restaurants, bars and catering 8.2 7.3 Transport & activities related to transport 14.7 14.0 Post, courier & communications services 12.5 11.8 Financial services 1.1 1.0 Real estate activities 4.8 4.3 Renting of machinery, equipment, personal, household goods 9.8 8.8 Computer and related activities 13.3 12.6 Research and development activities 12.9 12.5 Other business services 9.9 9.2 Public administration and defence 19.4 19.4 Education 21.7 21.1 Health and social work 31.7 31.4 Other personal services 13.1 12.7 Other 10.5 9.9 All sectors 11.0 10.3
Source: NERA analysis of FSB data.
18
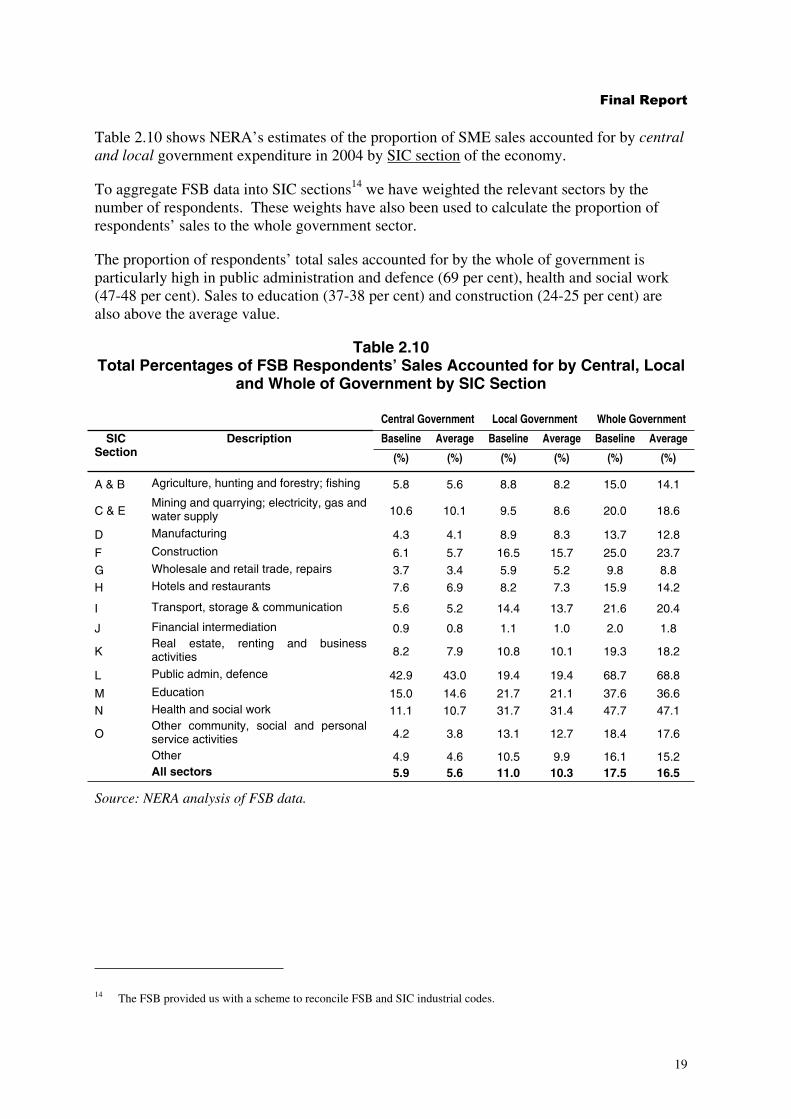
� �������������
Table 2.10 shows NERA’s estimates of the proportion of SME sales accounted for by central and local government expenditure in 2004 by SIC section of the economy.
To aggregate FSB data into SIC sections14 we have weighted the relevant sectors by the number of respondents. These weights have also been used to calculate the proportion of respondents’ sales to the whole government sector.
The proportion of respondents’ total sales accounted for by the whole of government is particularly high in public administration and defence (69 per cent), health and social work (47-48 per cent). Sales to education (37-38 per cent) and construction (24-25 per cent) are also above the average value.
Table 2.10 Total Percentages of FSB Respondents’ Sales Accounted for by Central, Local
and Whole of Government by SIC Section
Central Government Local Government Whole Government
SIC Description Baseline Average Baseline Average Baseline Average Section (%) (%) (%) (%) (%) (%)
A & B Agriculture, hunting and forestry; fishing 5.8 5.6 8.8 8.2 15.0 14.1
C & E Mining and quarrying; electricity, gas and water supply 10.6 10.1 9.5 8.6 20.0 18.6
D Manufacturing 4.3 4.1 8.9 8.3 13.7 12.8
F Construction 6.1 5.7 16.5 15.7 25.0 23.7
G Wholesale and retail trade, repairs 3.7 3.4 5.9 5.2 9.8 8.8
H Hotels and restaurants 7.6 6.9 8.2 7.3 15.9 14.2
I Transport, storage & communication 5.6 5.2 14.4 13.7 21.6 20.4
J Financial intermediation 0.9 0.8 1.1 1.0 2.0 1.8
K Real estate, activities
renting and business 8.2 7.9 10.8 10.1 19.3 18.2
L Public admin, defence 42.9 43.0 19.4 19.4 68.7 68.8
M Education 15.0 14.6 21.7 21.1 37.6 36.6
N Health and social work 11.1 10.7 31.7 31.4 47.7 47.1
O Other community, social and personal service activities 4.2 3.8 13.1 12.7 18.4 17.6
Other 4.9 4.6 10.5 9.9 16.1 15.2 All sectors 5.9 5.6 11.0 10.3 17.5 16.5
Source: NERA analysis of FSB data.
The FSB provided us with a scheme to reconcile FSB and SIC industrial codes.
19
14
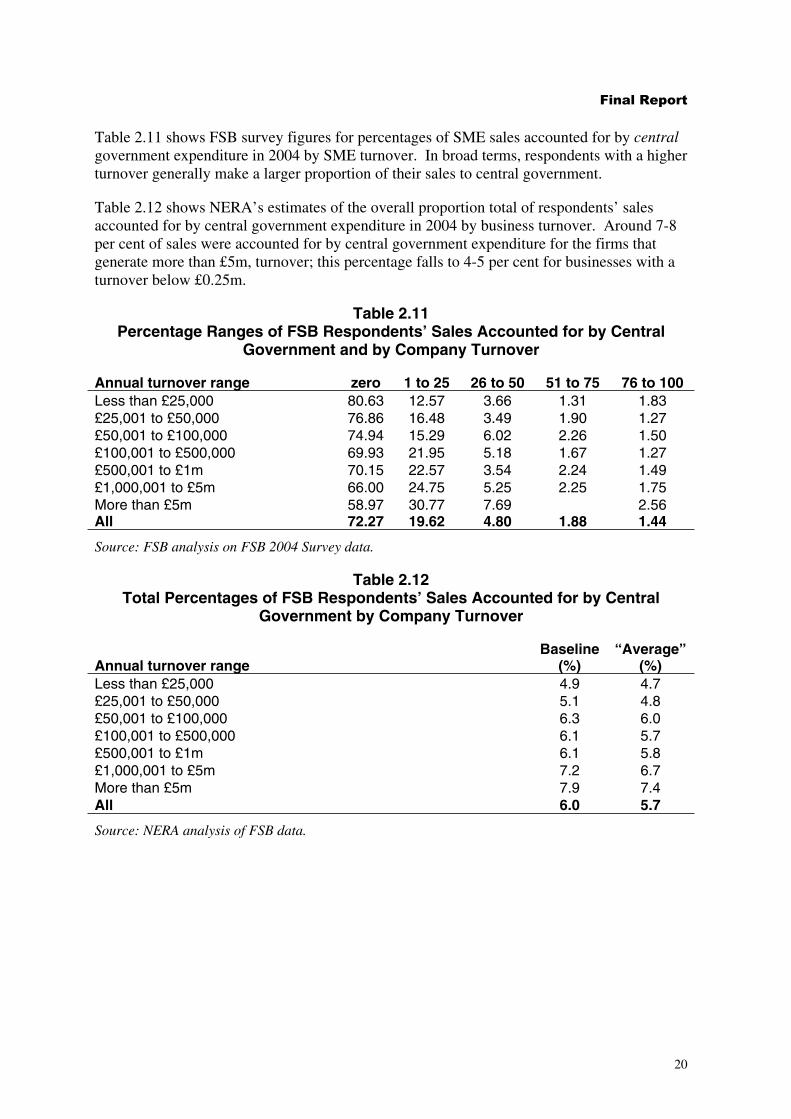
� �������������
Table 2.11 shows FSB survey figures for percentages of SME sales accounted for by central government expenditure in 2004 by SME turnover. In broad terms, respondents with a higher turnover generally make a larger proportion of their sales to central government.
Table 2.12 shows NERA’s estimates of the overall proportion total of respondents’ sales accounted for by central government expenditure in 2004 by business turnover. Around 7-8 per cent of sales were accounted for by central government expenditure for the firms that generate more than £5m, turnover; this percentage falls to 4-5 per cent for businesses with a turnover below £0.25m.
Table 2.11 Percentage Ranges of FSB Respondents’ Sales Accounted for by Central
Government and by Company Turnover
Annual turnover range zero 1 to 25 26 to 50 51 to 75 76 to 100 Less than £25,000 80.63 12.57 3.66 1.31 1.83 £25,001 to £50,000 76.86 16.48 3.49 1.90 1.27 £50,001 to £100,000 74.94 15.29 6.02 2.26 1.50 £100,001 to £500,000 69.93 21.95 5.18 1.67 1.27 £500,001 to £1m 70.15 22.57 3.54 2.24 1.49 £1,000,001 to £5m 66.00 24.75 5.25 2.25 1.75 More than £5m 58.97 30.77 7.69 2.56 All 72.27 19.62 4.80 1.88 1.44
Source: FSB analysis on FSB 2004 Survey data.
Table 2.12 Total Percentages of FSB Respondents’ Sales Accounted for by Central
Government by Company Turnover
Baseline “Average” Annual turnover range (%) (%) Less than £25,000 4.9 4.7 £25,001 to £50,000 5.1 4.8 £50,001 to £100,000 6.3 6.0 £100,001 to £500,000 6.1 5.7 £500,001 to £1m 6.1 5.8 £1,000,001 to £5m 7.2 6.7 More than £5m 7.9 7.4 All 6.0 5.7
Source: NERA analysis of FSB data.
20
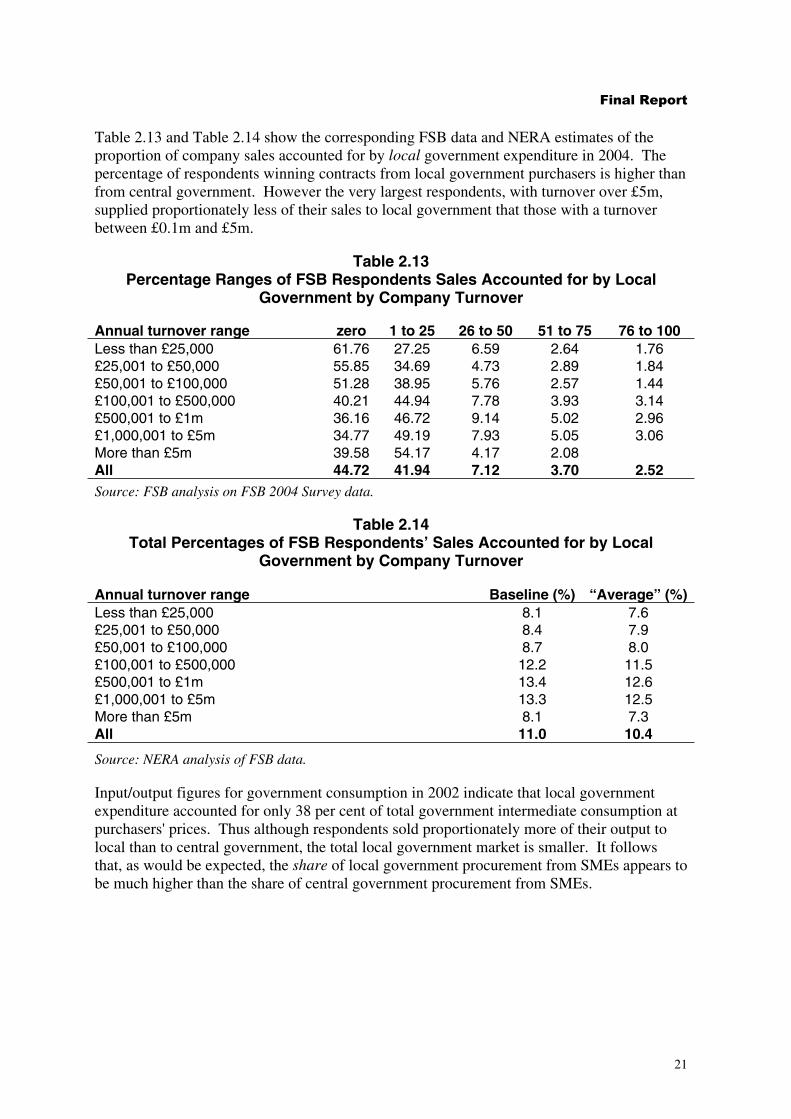
� �������������
Table 2.13 and Table 2.14 show the corresponding FSB data and NERA estimates of the proportion of company sales accounted for by local government expenditure in 2004. The percentage of respondents winning contracts from local government purchasers is higher than from central government. However the very largest respondents, with turnover over £5m, supplied proportionately less of their sales to local government that those with a turnover between £0.1m and £5m.
Table 2.13 Percentage Ranges of FSB Respondents Sales Accounted for by Local
Government by Company Turnover
Annual turnover range zero 1 to 25 26 to 50 51 to 75 76 to 100 Less than £25,000 61.76 27.25 6.59 2.64 1.76 £25,001 to £50,000 55.85 34.69 4.73 2.89 1.84 £50,001 to £100,000 51.28 38.95 5.76 2.57 1.44 £100,001 to £500,000 40.21 44.94 7.78 3.93 3.14 £500,001 to £1m 36.16 46.72 9.14 5.02 2.96 £1,000,001 to £5m 34.77 49.19 7.93 5.05 3.06 More than £5m 39.58 54.17 4.17 2.08 All 44.72 41.94 7.12 3.70 2.52 Source: FSB analysis on FSB 2004 Survey data.
Table 2.14 Total Percentages of FSB Respondents’ Sales Accounted for by Local
Government by Company Turnover
Annual turnover range Baseline (%) “Average” (%) Less than £25,000 8.1 7.6 £25,001 to £50,000 8.4 7.9 £50,001 to £100,000 8.7 8.0 £100,001 to £500,000 12.2 11.5 £500,001 to £1m 13.4 12.6 £1,000,001 to £5m 13.3 12.5 More than £5m 8.1 7.3 All 11.0 10.4
Source: NERA analysis of FSB data.
Input/output figures for government consumption in 2002 indicate that local government expenditure accounted for only 38 per cent of total government intermediate consumption at purchasers' prices. Thus although respondents sold proportionately more of their output to local than to central government, the total local government market is smaller. It follows that, as would be expected, the share of local government procurement from SMEs appears to be much higher than the share of central government procurement from SMEs.
21
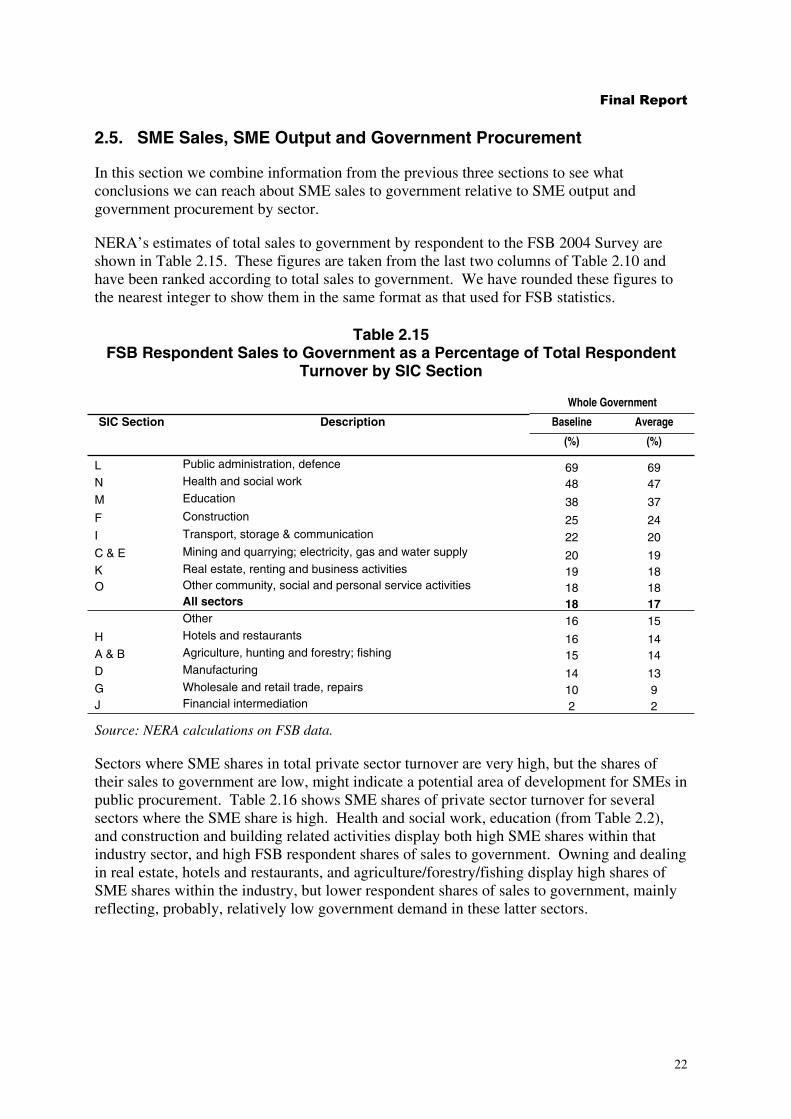
� �������������
2.5. SME Sales, SME Output and Government Procurement
In this section we combine information from the previous three sections to see what conclusions we can reach about SME sales to government relative to SME output and government procurement by sector.
NERA’s estimates of total sales to government by respondent to the FSB 2004 Survey are shown in Table 2.15. These figures are taken from the last two columns of Table 2.10 and have been ranked according to total sales to government. We have rounded these figures to the nearest integer to show them in the same format as that used for FSB statistics.
Table 2.15 FSB Respondent Sales to Government as a Percentage of Total Respondent
Turnover by SIC Section
Whole Government
SIC Section Description Baseline Average
(%) (%)
L Public administration, defence 69 69 N Health and social work 48 47 M Education 38 37 F Construction 25 24 I Transport, storage & communication 22 20 C & E Mining and quarrying; electricity, gas and water supply 20 19 K Real estate, renting and business activities 19 18 O Other community, social and personal service activities 18 18
All sectors 18 17 Other 16 15
H Hotels and restaurants 16 14 A & B Agriculture, hunting and forestry; fishing 15 14 D Manufacturing 14 13 G Wholesale and retail trade, repairs 10 9 J Financial intermediation 2 2
Source: NERA calculations on FSB data.
Sectors where SME shares in total private sector turnover are very high, but the shares of their sales to government are low, might indicate a potential area of development for SMEs in public procurement. Table 2.16 shows SME shares of private sector turnover for several sectors where the SME share is high. Health and social work, education (from Table 2.2), and construction and building related activities display both high SME shares within that industry sector, and high FSB respondent shares of sales to government. Owning and dealing in real estate, hotels and restaurants, and agriculture/forestry/fishing display high shares of SME shares within the industry, but lower respondent shares of sales to government, mainly reflecting, probably, relatively low government demand in these latter sectors.
22
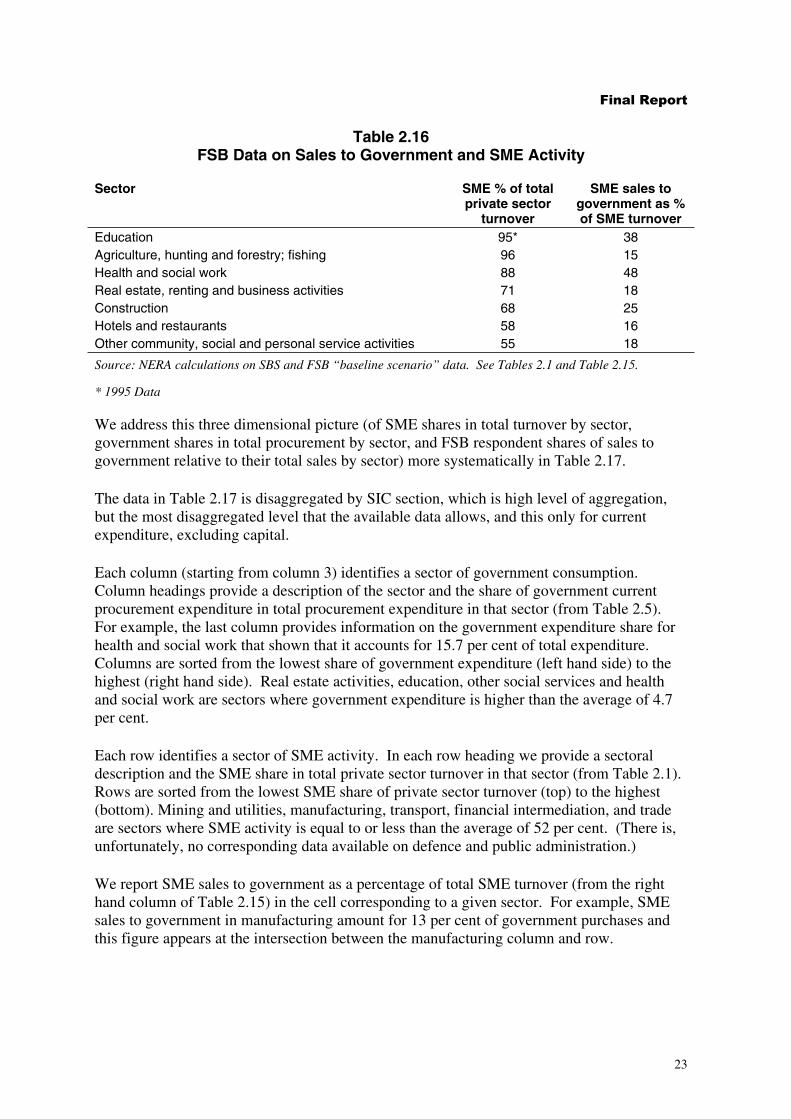
� �������������
Table 2.16 FSB Data on Sales to Government and SME Activity
Sector SME % of total SME sales to private sector government as %
turnover of SME turnover Education 95* 38 Agriculture, hunting and forestry; fishing 96 15 Health and social work 88 48 Real estate, renting and business activities 71 18 Construction 68 25 Hotels and restaurants 58 16 Other community, social and personal service activities 55 18
Source: NERA calculations on SBS and FSB “baseline scenario” data. See Tables 2.1 and Table 2.15.
* 1995 Data
We address this three dimensional picture (of SME shares in total turnover by sector, government shares in total procurement by sector, and FSB respondent shares of sales to government relative to their total sales by sector) more systematically in Table 2.17.
The data in Table 2.17 is disaggregated by SIC section, which is high level of aggregation, but the most disaggregated level that the available data allows, and this only for current expenditure, excluding capital.
Each column (starting from column 3) identifies a sector of government consumption. Column headings provide a description of the sector and the share of government current procurement expenditure in total procurement expenditure in that sector (from Table 2.5). For example, the last column provides information on the government expenditure share for health and social work that shown that it accounts for 15.7 per cent of total expenditure. Columns are sorted from the lowest share of government expenditure (left hand side) to the highest (right hand side). Real estate activities, education, other social services and health and social work are sectors where government expenditure is higher than the average of 4.7 per cent.
Each row identifies a sector of SME activity. In each row heading we provide a sectoral description and the SME share in total private sector turnover in that sector (from Table 2.1). Rows are sorted from the lowest SME share of private sector turnover (top) to the highest (bottom). Mining and utilities, manufacturing, transport, financial intermediation, and trade are sectors where SME activity is equal to or less than the average of 52 per cent. (There is, unfortunately, no corresponding data available on defence and public administration.)
We report SME sales to government as a percentage of total SME turnover (from the right hand column of Table 2.15) in the cell corresponding to a given sector. For example, SME sales to government in manufacturing amount for 13 per cent of government purchases and this figure appears at the intersection between the manufacturing column and row.
23

� �������������
The cells in the South-East quadrant (bottom right corner) are associated with sectors where shares of both government expenditure and SME activity are highest. These are sectors where we might expect to find a substantial share of SME sales to be to government.
The opposite holds for the North-West quadrant, which is associated with both low shares of government expenditure and low SME share in private sector turnover. We might expect these sectors to display the lowest SME shares of sales to government. Moving East through this quadrant the share of SME sales made to government might be expected to increase. Similarly, moving down and into the South-West quadrant might be expected to show sales increases.
Some broad conclusions are as follows.
��Respondents’ sales to government in health and social work activities and education match the ex ante expectation of high sales to government. Similarly, we see as would be expected low reported sales to government in trade related activities and financial intermediation.
��FSB respondents’ sales to government are proportionately more than might be expected (given low levels of government consumption and low share of SMEs in total sales turnover) in mining and quarrying, electricity, water and gas supply, and transport.
��FSB respondents’ sales to government are lower than might be expected from levels of government expenditure and SME activity in other social services and real estate activities.
��A particularly high percentage of respondents’ sales in public administration and defence are to government. However there are no data on the SME share of the total market.
��FSB respondent’s sales to government are proportionately more than might be expected from the level of government current procurement of construction. However this is probably because construction is the one sector, as shown in Table 2.4, where the inclusion of capital leads to a substantially higher government share of the market.
However no firm recommendations on priority areas of procurement can be inferred from these data. The most they can do is to indicate some areas for possible further exploration, and demonstrate the limits, we believe, of what can be inferred for the available data at this level.
We stress again the absence of direct data on public procurement from SMEs and non SMEs, which prevents any direct assessment of the extent to which SMEs are represented in public sector markets. These data would allow a straightforward comparison between levels of procurement from SMEs in a given sector and the level of SME activity in that sector. This comparison could uncover the existence (in some sub-sectors) of discrepancies between SME activity and procurement from SMEs. Industries where these discrepancies emerged would be the obvious candidates for targeted policies to increase the role in procurement of small businesses.
24
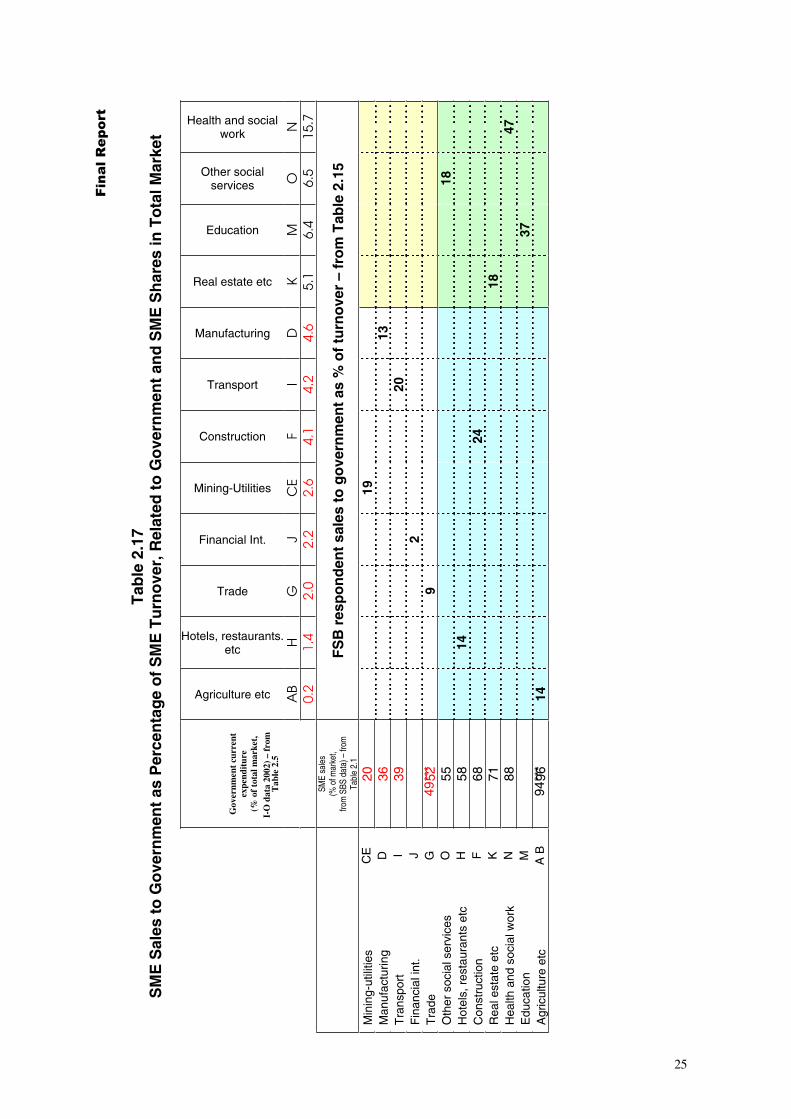
�
�������������
Tab
le 2
.17
SM
E S
ales
to
Go
vern
men
t as
Per
cen
tag
e o
f S
ME
Tu
rno
ver,
Rel
ated
to
Go
vern
men
t an
d S
ME
Sh
ares
in T
ota
l Mar
ket
Health and social work N
15.7
FS
B r
esp
on
den
t sa
les
to g
ove
rnm
ent
as %
of
turn
ove
r –
fro
m T
able
2.1
5
18
18
47
37
Other social services O 6.
5
Education M 6.4
Real estate etc K 5.1
Manufacturing D 4.6
19
13
20
2 9
14
24
14
Transport I 4.2
Construction F 4.1
Mining-Utilities CE
2.6
Financial Int. J 2.2
Trade G 2.0
Hotels, restaurants. etc H 1.
4
Agriculture etc AB
0.2
Gov
ernm
ent
curr
ent
expe
ndit
ure
(% o
f to
tal m
arke
t,
I-O
dat
a 20
02)
– fr
omT
able
2.5
SME
sale
s(%
of m
arke
t, fro
m S
BS d
ata)
– fr
omTa
ble
2.1
20 36 39
49**
*52 55 58 68 71 88
94**
*96
Min
ing-
utili
ties
CE
Man
ufac
turin
g D
Tra
nspo
rt
I
Fin
anci
al in
t. J
Tra
de
G
Oth
er s
ocia
l ser
vice
s O
Hot
els,
res
taur
ants
etc
H
Con
stru
ctio
n F
Rea
l est
ate
etc
K
Hea
lth a
nd s
ocia
l wor
k N
Edu
catio
n M
Agr
icul
ture
etc
A
B
25
� )LQDO�5HSRUW�
��� /LWHUDWXUH�5HYLHZ�
3.1. Introduction
This chapter reviews the economic literature15 on the contribution of smaller businesses to the economy. The literature focuses on theoretical analysis and analysis at a fairly aggregated data, rather than on specific procurement decisions. ��
It complements the statistical analysis in Chapter 2 and the case studies in Chapter 5, by examining the evidence on the distinctive benefits that smaller businesses (specifically in this case SMEs) bring to the UK as a whole. Such evidence, where it is persuasive, reinforces the case for encouraging public procurers to take SMEs more seriously.
Much of the relevant literature, by academics and international agencies such as the OECD, has explored how SMEs contribute to innovation, to productivity growth and (especially) to employment growth, and how they respond in the business cycle.
Several academic authors have also analysed the drivers of survival, success and innovation for small firms - focusing on the factors underlying small firms’ performance, rather than the impact of SMEs’ performance in the economy. We have not included this literature, as our current study is concerned with the net benefits of a higher engagement with SMEs, rather than designing policies that will foster SMEs’ performance.16
In Section 3.2 we consider the importance of SMEs in the economy through the literature on entrepreneurship, competition, productivity, knowledge and innovation. We outline a theoretical framework and the empirical evidence. UK data analysed by Nickell (1996) indicate that the number of competitors in a market is associated with higher productivity growth. Enterprise churn is found by other authors to positively affect labour productivity.
In Section 3.3 we look briefly at the correlation between business ownership and economic growth. Higher levels of entrepreneurship are positively correlated with higher aggregate levels of employment and economic growth.
Section 3.4 examines the issue of SME employment over the business cycle. According to some empirical studies, this differs significantly from that of larger firms, in that SMEs display behaviour that is either uncorrelated to the cycle or somewhat countercyclical.
Section 3.5 looks at employment dynamics and SMEs, by surveying the literature on job turnover at the firm level. This complements the empirical evidence from Section 3.2 by taking a more “micro” perspective. Andersson (1999) suggests a link between larger job turnover and productivity growth. Most authors, however, simply interpret “employment growth” as a measure of “firm performance”, recording that employment growth rates are higher in SMEs.
15 We have also sought literature from other social sciences on, for example, the role of private and social enterprises in areas of social exclusion. However, we were not able to trace any such literature suggesting general conclusions in the areas if concern to this review.
16 The literature on determinants of SME performance does not in any case appear to shed much light on their potential contribution to public procurement.
26

� )LQDO�5HSRUW�
Section 3.6 summarises findings on UK SMEs of the UK Innovation Survey and the European Innovation Survey, with regard to innovation, profitability and international comparisons. These surveys suggest that the productivity shortfall of the UK relative to other European countries is less for SMEs than for larger firms.
Section 3.7 summarises some conclusions implied by the literature.
3.2. Competition, Productivity and Innovation
There is theoretical and empirical evidence that high levels of firm entry and exit, which are associated with SMEs, contribute to competition, innovation and productivity growth.
3.2.1. Theory
A report by ENSR (European Network for SME Research) and EIM Business & Policy (2003), for the European Commission, identifies mechanisms that link the growth of firms to knowledge spillovers and increasing competition for ideas, which are enhanced by SMEs.
Cohen and Levinthal (1989, 1990) suggest that a firm's ability to use its existing knowledge base for further innovation may be undermined by aging, if aging leads to increased rigidity of communication patterns within the firm. The authors also argue that firms invest in R&D not only to generate innovations, but also to develop and maintain the ability to identify, assimilate, and exploit knowledge from the environment.
Furthermore, entry of a new firm to a market may induce incumbent firms to organise work more effectively and to learn through imitation from new entrants who are utilising superior technology or organisational structure (Aghion et al, 2004).
Audretsch (1995) suggests that start-ups have a role in allowing entrepreneurs to appropriate the returns from their knowledge endowment. When this issue emerges within a business there is a potential conflict between the innovator and the decision maker in sharing the value of the innovation. If the innovator’s assessment of the innovation’s potential is high, but the decision maker is not prepared to implement it, the innovator can leave the business and establish a new enterprise if start-up costs are not too high. This “spin-off” process enhances efficiency if it increases the rate of introduction of viable new projects.
This idea is similar to the thrust of Oliver Hart’s seminal book on the theory of the firm Firms, Contracts and Financial Structure (Hart, 1995): if an innovator cannot secure some of the benefits of his or her innovation this can undermine the incentives to innovate or invest efficiently.
Aghion et al (2004) analyse the effect of entry (or entry threats) by new firms on the incentives for incumbents to increase their innovative effort. Industries differ in their initial state of technological development.17 These differences strongly affect the relationship between competition spurred by new entrants, or entry threats, and productivity. The proposed theoretical framework implies that entry threats should encourage innovation by
This is measured by their distance from the world technological frontier.
27
17
� )LQDO�5HSRUW�
incumbent firms most strongly in sectors that are initially close to the technological frontier (incumbents that are initially close to the frontier, i.e. technologically advanced, know they can retain their competitive advantage by innovating); whereas it may discourage innovation in sectors that are technology laggards (incumbents that are further from the frontier cannot win against a potential entrant; and this reduces the private returns from investing in R&D). Aghion and his colleagues estimate however, across all industries, a positive aggregate effect of entry threats on the average productivity growth of incumbents. We discuss the empirical test of this theory further in Section 3.2.3 below.
An alternative rationale postulated for the effect of SMEs on national economic growth is that their effect on the number of firms increases competition for inputs18, including competition for ideas embodied in individual people (Jacobs 1969).19 Porter (1990) suggests that they also increase knowledge externalities, as new technology or human capital acquired or developed within a firm provides benefits to other firms in that industry. Porter reviews international experience, referring also to the development of industrial districts in Italy. He suggests that competition is a driving force behind cluster development. Clusters, in turn, through spatial proximity of upstream or downstream industries, help the exchange of information and promote a continuous exchange of ideas and innovations.
3.2.2. Empirical evidence
Glaeser et al (1992) and Feldman and Audretsch (1999) show that the number of firms in a city is positively correlated with faster growth of employment. Nickell (1996), looking at a sample of around 670 UK companies, showed that competition as measured by the number of competitors is associated with a significantly higher rate of total factor productivity growth. These studies jointly test two hypotheses, namely that a larger number of firms stimulates the development and efficient use of knowledge and innovation (through mechanisms such as those described above), and that innovation and knowledge raise productivity.
Scarpetta (2001) analyses data for the first half of the 1990s, for the US, Canada and ten EU countries including the UK. This suggests that employment turnover, defined as entry rate plus exit rate, is around 20 per cent per year in most of these countries,20 and that, once the sectoral mix is taken into account, the UK has higher employee turnover in manufacturing sectors (in firms of all sizes) than other countries. The evidence also suggests that in every year a large number of firms displace obsolete firms, without significantly affecting total employment or the total number of firms.
The link between firms’ entry and competition is long established in theoretical and empirical microeconomic analysis. Recent empirical work suggests that this can also play a significant role in productivity growth. Scarpetta (2001) looks at the impact of enterprise churn on
18 Low productivity plants may be replaced with higher productivity entrants. This replacement could increase aggregate productivity levels through the reallocation of input and output.
19 Jacobs saw spillovers between industries as important innovation triggers. She argued that the agglomeration of firms in urban regions fosters innovations, through the diversity of knowledge sources located in such regions. The variety of industries and the exchange of complementary knowledge across diverse firms and economic agents leads to increasing returns to new, economically valuable knowledge.
20 With this definition a complete change of employees in a year, in a firm with a constant employment total, would give a turnover of 200 percent.
28

� )LQDO�5HSRUW�
productivity by decomposing labour productivity growth for several OECD countries. 21 His analysis shows that firms’ entry contributes to increases in labour productivity in the UK. This is also the case for Italy and the Netherlands, although the effect is negative or negligible in France, the United States, Finland, Western Germany and Portugal. His OECD data suggest that firm entry generally has a stronger effect on productivity in industries more closely related to information and communication technologies.
ENSR and EIM Business & Policy Research (2003) show that in the EU about 50 per cent of micro firms (i.e. those employing less than 10 workers) are sole proprietors; in the US this figure rises to 89 per cent. This could be explained by higher entry and exit in the US than in Europe. The Japanese pattern is closer to that of Europe.
This picture is confirmed by recent empirical analysis by Bartelsman, Haltiwanger and Scarpetta (2004) of a new dataset at the level of 2-digit industry sectors, for 24 countries over the past decade. All countries experience entry and exit of many firms in all markets, the failure of many newcomers and the expansion of successful ones. This process has a direct impact on productivity, by reallocating resources towards more productive uses, and indirectly increasing market contestability. Entry and exit rates are fairly similar across industrial countries, while post entry performance differs between Europe and the U.S. This is interpreted as suggestive evidence for there being in Europe barriers to firm growth as opposed to barriers to entry.
Aghion et al have analysed the relationship between entry and growth in total factor productivity (TFP) of incumbents in about 200 SIC 4-digit UK manufacturing industries from 1987 and 1993. Controlling for innovation, industry heterogeneity and macroeconomic effects, the authors find that entry impacts positively on growth. They also detect considerable heterogeneity in this effect, as predicted by their theoretical model, on the relationships between entry, innovation and growth. The impact is strong in technologically advanced industries, and weak (or even negative) in technologically laggard industries.
3.3. Employment and Economic Growth
There is some evidence that higher levels of business ownership contribute to higher growth of employment in the economy as a whole.
Thurik (1999) studied 23 OECD countries using cross-section data from 1984 to 1994. This work suggests that higher business ownership rates (expressed as the percentage within the labour force of owner/managers of incorporated and unincorporated businesses) are associated with higher growth of employment in the economy as a whole.
We have also undertaken our own analysis of enterprise churn in UK, using data from VAT registrations for 1995 to 2003 for SIC 3-digit sectors. Although for any given level of churn
This is done by looking separately at the effects of within firm growth and of firms’ entry and exit.
29
21
� )LQDO�5HSRUW�
range of growth rates is very wide, these data confirm a positive correlation between churn and growth.22
Carree, Thurik and Wennekers (2002) find in a sample of 23 OECD economies a correlation between increases in entrepreneurship, national economic growth23 and lower unemployment. The authors suggest that modern economies are now in a phase where the rate of business ownership is likely to increase structurally. Audretsch and Thurik (2002) show that this result is robust to different samples, specifications and entrepreneurship (as measured by the share of the economy accounted for by small enterprises and self-employment).
3.4. The Business Cycle
There is some evidence that small firm employment fluctuates less than the in economy as a whole.
A study of small firms in Dutch manufacturing (Broersma and Gautier, 1997), over the period 1978-1991, showed that new job vacancies in slumps are much higher for small firms than for large firms. The study also suggests that small firms hire and fire in a less lumpy way than larger firms, and that their job turnover is not correlated with the business cycle. This could be explained by small firms adjusting more easily to shifts in economic circumstances, so that, for SMEs, recruiting in a recession can be more advantageous than in a boom.
Davidson, Lindmark and Olofsson (1998) studied Swedish data from 1988 to 1994. The study suggests, in contrast with the countercyclical finding of the Dutch study just described, that in all industry sectors, despite very considerable macroeconomic fluctuations, SMEs’ shares of job gains and losses do not show dramatic changes. They also note that multi-establishment SMEs behave similarly to large firms, while very small, single-site SMEs increase their employment more rapidly than larger SMEs. Thus, overall, SMEs display higher gross and net employment growth than large firms.
ENSR and EIM Business & Policy (2003) show that during 1988-2003, in Europe as whole, over a period of wide macroeconomic fluctuations, SMEs employment increased, whereas in larger firms it decreased. However revenue turnover and value added growth have been greater in larger firms. This implies that, across Europe as a whole, productivity per employee has increased more in larger firms. This difference in productivity growth between large firms and SMEs could be partly explained by SMEs’ over-representation in “personal skill” sectors with relatively low potential for technologically driven productivity growth (from hairdressing and window cleaning to legal services and consultancy). This survey also shows that, in Europe, during recession periods (or economic slowdowns) SMEs laid off proportionally fewer personnel than larger firms.
22 This work, together with a draft final version of the statistical analysis presented in Chapter 2 above, is recorded in a paper published with the Government’s 2005 Budget on the supplyinggovernment website, at http://www.supplyinggovernment.gov.uk/pdf/small%20firm%20data%20analysis.pdf
23 The rate of business ownership is shown to influence economic growth through deviations from the equilibrium rate (which they estimate).
30
� )LQDO�5HSRUW�
A UK survey by Reed (a recruitment group) during the Summer 2004, of 1,500 small businesses, indicated that small firms were then in a hiring boom (9 out of 10 indicated that recruitment was planned in the immediately following few months).24 The survey results also suggested that a smaller proportion of small firms had redundancies than larger firms (5 per cent of firms versus 10 per cent in larger firms).
3.5. Employment Dynamics
SMEs generate higher job turnover and there is some evidence that this enhances productivity growth. Employment growth rates are higher in small companies.
High job flows or turnover (in the sense of changes, up or down, in levels of employment) are considered desirable, but there is little discussion of the evidence on this effect derived from the increase, over the past two decades, of the share of small firm employment in many economies. Andersson (1999) is an exception. He looks at job turnover in all manufacturing firms in Sweden from 1972 to 1996, and identifies a robust correlation between job turnover and productivity growth. He notes that small plants experience higher employment turnover. However he also notes that in Sweden a limited share of the workforce is employed by them, hence in absolute value most employment gains (and losses) arise in larger establishments.
Unfortunately other country level studies on SMEs and employment growth do not test the link between job turnover and productivity changes, to test whether Andersson’s conclusions are apply more widely.
Geroski (1995) analysed a sample of US firms and found that smaller enterprises show consistently higher employment growth rates than their large counterparts.25 Davis, Haltiwanger and Schuh (1996) indicate that in the US from 1972 to 1988 the employment share of SMEs increased.
Heshmati (2001), using Swedish data from 1993 to 1998, also finds that net employment growth is negatively related to firm size among small and micro firms (namely firms that employed from 1 to 100 employees).
Hohti (2002) studies how employment patterns and growth varied with establishment size in the Finnish manufacturing sector during the period 1980-94. He concludes that small establishments gain and lose jobs relatively more than large establishments: in the smallest categories, both the share of gross new employment and the share of gross reduction in employment is high relative to the share of employment. However, no clear relationship between establishment size and net employment change emerges from these data.
Analysis of manufacturing firms in the Netherlands (Broersma and Gautier, 1997) and in Norway (Klette and Mathiassen, 1996) also found higher rates of hiring and firing in small firms than in large ones. The Norwegian study also suggested that net employment loss was more prevalent among larger plants; and that in firms with less than 20 employees
24 BBC news on line, Monday, 26 July 2004, http://news.bbc.co.uk/1/hi/business/3924605.stm.
25 Which is not entirely surprising. Many SMEs are young, and children grow consistently faster than adults.
31
� )LQDO�5HSRUW�
employment increased in the period considered (1976 to 1986), while in larger firms, on average, it fell.26 (No corresponding data appear to be available on output growth.)
Audretsch, Klopm and Thurik (1998) use a longitudinal database, for a set of Dutch firms in the retail and hotel and catering sectors from 1985-1988, to analyse the relationship between firm size and net increase in employment. The authors control for firms’ differences in age, to investigate whether a positive correlation between job creation and small firm size is driven merely by differences in age between the SMEs and other firms. Comparison of job turnover for different size and age classes shows that the highest rate of net employment increase occurs in the smallest and youngest firms. However across firms of all ages they observed no difference in employment growth between small and large firms.
Konings (1995) looked at job turnover in the UK during the 1980s and found that, relative to large plants, gross employment increases were higher in small plants and gross employment decreases were lower.
An OECD study (OECD, 2002) closely analyses high-growth firms. Firm-level data from France, Germany, Greece, Italy, the Netherlands, Spain, Sweden and Canada’s Province of Quebec are used to identify high-growth firms and their differentiating characteristics. Around 8 to 10 per cent of the population of growing firms are characterized as high-growth. The study includes older firms in traditional sectors as well as younger, technology-based ones. It suggests that high-growth firms, as measured by employment expansion rates, are key players in economic growth. Among such high-growth firms, small firms exhibit higher net employment growth rates than large high-growth firms. Especially among small firms, significant gross job gains occur in parallel with large gross job losses. In absolute terms, larger firms also show significant employment growth in the high-growth group. However the rapid growth of large firms often reflects mergers and acquisitions rather than internal growth. Finally, high-growth firms were found to be more R&D-intensive than other growing firms or than “permanent” firms (which were the focus of earlier OECD studies).
3.6. The UK and European Innovation Surveys
Some major surveys have studied innovation in SMEs and larger firms. Across the EU15, innovation increases with firm size; however the innovation ranking of the UK relative to other countries is higher for SMEs than for larger firms. High innovation firms generally have higher profit rates than those of low or moderate innovation firms.
Research by Cosh and Hughes (2001, 2000, 1998) on UK SMEs and innovation provides an overview of the link between entrepreneurship, innovation and business performance. It examines the constraints to innovation and then explores the impact of innovation on growth and profitability. The analysis is based on the CBR/SBRC27 database obtained first in 1995, by a telephone survey of about 2,000 SMEs. The authors record that the report of this survey
26 A study on Germany by Weigand and Audretsch (1999) exploits panel data from 1991-1996 on science-based industries. The paper finds a strong negative correlation between size and employment growth. The upper threshold for the inclusion as a small or medium firm was set for this study at 500 employees.
27 ESRC Centre for Business Research / Small Business Research Centre. (The SBRC was the predecessor to the CBR, also at University of Cambridge.)
32
� )LQDO�5HSRUW�
(SBRC, 1992) provided the first comprehensive view of the UK SME sector since Bolton (1971).
There were two follow-up surveys, the last one drawing on the second harmonised European Community Innovation Survey (CIS) (European Commission, 1999) to provide international comparisons. The timing and scale of these surveys is summarised in Box 3.1.
In terms of growth of firm size, the surveys found that smaller, younger UK firms experience wider variations in growth than larger, more mature ones. Younger firms also grow faster. However, within a cohort of surviving firms, only a few businesses account for the bulk of employment, output and sales growth. Only a small proportion of small firms grow very rapidly.
Box 3.1 The CBR/SBRC Surveys, Timeline and Sample Numbers
��First survey, 1991, by telephone, covering period 1985-91: Approximately 1,000 SMEs in manufacturing and 1,000 in business services – over 2,000 in total.
��Second survey, 1993, of respondents to the original survey, on financing constraints: 1,341 postal and fax responses.
��Third survey, 1995, of the same firms, but based on the EC CIS, on innovation (including a measure of the novelty of innovation): 1,001 responses.
��For the second and third surveys the CBR tracked down non-respondents. By 1995, 390 of the original 2,000 firms had failed or were moribund and a further 219 had been acquired. A separate analysis was made of the characteristics of the 594 firms from the original 2,000 that were still alive but did not respond in 1995. This showed no evidence of “attrition bias”, at least in terms of size, industry sector, age and previous growth performance.
The surveys found that innovation activity in the EU (EU-15) increases with firm size. This holds both in manufacturing and in services. However in 1996, UK small firms’ innovation levels were ranked fourth in manufacturing and fifth in services, whereas the performance of larger firms was ranked somewhat lower. This suggests that helping the development of UK SMEs could improve UK innovation.
1999 CBR data show that non-innovating UK SMEs felt more constrained than innovating UK SMEs with respect to each of many indicators used to measure constraints on ability to meet business objectives.28 Firms that were not innovating suffered in particular from the constraints imposed by lack of management, marketing and sales skills.
The indicators were: increasing competition, overall growth of market demand in principal product markets, marketing and sales skills, management skills, availability and cost of finance for expansion, availability and cost of overdraft finance, acquisition of technology, difficulties in implementing new technology, access to overseas markets, and availability of appropriate premises or site. “Non-innovating” SMEs might include many firms in businesses where the scope for innovation appears to be very limited, such as many personal and professional services and retailing, in contrast to most of manufacturing and nearly all of IT.
33
28
� )LQDO�5HSRUW�
The UK 1999 survey shows that the share of sales of recently introduced products on average (all firms) was 7.4 per cent. The percentage of new product sales was lower in micro firms than in small and medium SMEs, and in services than in manufacturing. Past innovation intensity (measured as the percentage of sales accounted for by new products in 1997) was positively correlated with growth over 1997-1999 in employment and turnover. In medium size firms, high innovation intensity had a positive impact over 1997-1999 on changes in profit margins.
A significantly higher rate of profitability was observed in high innovation than low innovation firms. This was however confined to high innovation firms - there was no systematic increase in the profitability of firms showing moderate innovation.
3.7. Conclusions on the Evidence on the Impact of Small Firms
The empirical studies that we have reviewed in this chapter are not completely consistent, but several themes appear to be established, in particular the following.
��There is evidence that in today’s advanced economies the share of employment in SMEs is progressively increasing over time. This suggests that an increasing share of the markets faced by procurers of goods and services is being supplied by SMEs, and that procurers will benefit from proactively adapting to this.
��In the EU league tables of innovation performance, UK SMEs rank more highly than UK large firms. This implies that the removal of inefficient obstacles to smaller businesses (for example in public procurement) may be especially beneficial in the UK.
��The study of cluster development shows that spatial proximity of upstream or downstream industries promotes a continuous exchange of ideas and innovations, with benefits for productivity. This reinforces the case for emphasising that benefits of this kind sometimes also follow from spatial proximity of procurers and suppliers.
��Fluctuations in national economic activity are concentrated on larger firms. SMEs tend to hire and fire at a more uniform rate. This may imply that an economy with a higher proportion of employment in SMEs tends to be less prone to business cycles.
��The rate of productivity growth in SMEs in aggregate is less than that in large firms in aggregate, but this probably reflects the concentration of small firms in “personal skill” sectors with inherently low potential for technological innovation. There is evidence that the impact of more competition for goods and services and for ideas, and extra turnover in employment, both of which are enhanced by SMEs, increase productivity growth in the economy.
��Enterprise churn is positively correlated with increases in UK labour productivity. This provides a general argument for encouraging and sustaining firm start-ups, and existing firms entering new markets; this might be helped by reducing inefficient obstacles to public procurement.
34
� )LQDO�5HSRUW�
3.8. References for Chapter 3
Aghion, P., R. Blundell, R., Griffith, P., Howitt and S. Prantl (August 2004) Firm Entry, Innovation and Growth: Theory and Micro Evidence, Working Paper, available online at http://post.economics.harvard.edu/faculty/aghion/papers/firm_entry_and_growth.pdf
Andersson, F. (1999) “Job flows in Swedish manufacturing 1972-1996” IFAU - Institute for Labour Market Policy Evaluation, Working Paper Series 1999/4
Audretsch, D. B. and R. Thurik (2002) Linking Entrepreneurship to Growth, OECD STI Working Paper 2081/2
Audretsch, D. B. (1995) Innovation and Industry Evolution, Cambridge: MIT Press
Audretsch, D. B., Klopm, L. and R. Thurik (1998) Do services differ from manufacturing? The post-entry performance of firms in Dutch services, Tinbergen Institute Discussion Papers 98-012/3, Tinbergen Institute
Bartelsman, E. J., Haltiwanger J. & S. Scarpetta (2004) "Microeconomic Evidence of Creative Destruction in Industrial and Developing Countries”, Tinbergen Institute Discussion Papers 04-114/3, Tinbergen Institute
BBC news on line, Monday, 26 July 2004, http://news.bbc.co.uk/1/hi/business/3924605.stm
Bolton, J. E. (1971) Report of the Committee of Inquiry on Small Firms, Cmnd. 4811, HMSO
Broersma, L. and P. A. Gautier (1997) “Job Creation and Job Destruction by Small Firms: An Empirical Investigation for the Dutch Manufacturing Sector”, Small Business Economics 8
Carree, M., van Stel, A., Thurik R. and S. Wennekers (2002) “Economic development and business ownership: an analysis using data of 23 OECD countries in the period 1976-1996”, Small Business Economics 19:271-290
Cohen, W. M. and D. A. Levinthal (1989) “Innovation and learning: the two faces of R&D”, The Economic Journal 99:569-96
Cohen, W. M. and D. A. Levinthal (1990) “Absorptive capacity: a new perspective on learning and innovation”, Administrative Science Quarterly 35:128-52
Cosh, A. D. and Hughes, A. (1998) Enterprise Britain: Growth, Innovation and Public Policy in the Small and Medium Sized Enterprise Sector 1994-1997, ESRC Centre for Business Research, University of Cambridge
Cosh, A. D and Hughes, A. (2000). (eds.) British Enterprise in Transition: Growth Innovation and Public Policy in the Small and Medium Sized Enterprise Sector 1994-1999, ESRC Centre for Business Research, University of Cambridge
Cosh, A. D and Hughes, A. (2001) “Innovation. The Contribution of European SMEs” in Enterprises in Europe: Sixth Report, Eurostat, Luxembourg
35
� )LQDO�5HSRUW�
Cosh, A. D., A. Hughes and E. Wood (1999) “Innovation in UK SMEs: Causes and Consequences for Firm Failure and Acquisition”, published in Acs, Z. J., Carlsson, B.; and Karlsson, C., (eds.) Entrepreneurship, small and medium-sized enterprises and the macroeconomy, Cambridge; New York and Melbourne: Cambridge University Press, 329-66
Davidsson, P., L. Lindmark and C. Olofsson (1998) “The extent of overestimation of small firm job creation - an empirical examination of the regression bias”, Small Business Economics 11
Davis, S. J., J. C. Haltiwanger, and S. Schuh, (1996) Job Creation and Destruction, Cambridge, MA: MIT Press
ENSR (European Network for SME Research) and EIM Business & Policy (2003) “2003 Observatory of European SMEs”, SMEs in Europe 2003/7
European Commission (1999), “Second Harmonised Community Innovation Survey” (CIS2), Eurostat and DG Enterprise
Feldman, M. P. and D. B. Audretsch (1999) “Innovation in Cities: Science-based Diversity, Specialization, and Localized Competition”, European Economic Review 43: 409-429
Geroski, P. A. (1995) “What Do We Know About Entry”, International Journal of Industrial Organization 13(4)
Glaeser, E. L., H. D. Kallal, J. A. Scheinkman and A. Shleifer (1992) “Growth in cities”, Journal of Political Economy 100:1126-1152
Hart, O. (1995) Firms, Contracts and Financial Structure, Clarendon Lectures, Oxford University Press
Heshmati, A. (2001) “On the Growth of Micro and Small Firms: Evidence from Sweden”, Small Business Economics 17(3): 213-228
Hohti, S. (2000) “Job Flows and Job Quality by Establishment Size in the Finnish Manufacturing Sector, 1980- 1994”, Small Business Economics 15(4):265-281
Hughes, Alan (2001) “Innovation and Business Performance: Small Entrepreneurial Firms in the UK and EU” http://www.hm-treasury.gov.uk/media/F76/F3/257.pdf
Jacobs, J. (1969) The Economy of Cities, New York: Vintage Books
Klette, T. and A. Mathiassen (1996) “Job Creation, Job Destruction and Plant Turnover in Norwegian Manufacturing”, Annales d'Economie et de Statistique, 41/42: 97-125
Konings, J. (1995) “Gross Job Flows and the Evolution of Size in U.K. Establishments”, Small Business Economics 7:213-220
Nickell, S. J. (1996) “Competition and corporate performance”, Journal of Political Economy 104:724-746
36

� )LQDO�5HSRUW�
OECD (2002) High-Growth SMEs and Employment
OECD (2004) Promoting Entrepreneurship And Innovative SMEs In A Global Economy
Porter, M. (1990) The Comparative Advantage of Nations, New York: Free Press
SBRC (1992) The State of British Enterprise: Growth, Innovation and Competitive Advantage in Small and Medium Sized Firms, Small Business Research Centre, University of Cambridge
Scarpetta, S. (2001) “Productivity and Firm Dynamics: Evidence From Microdata”, OECD Economic Outlook 69 Chapter VII
Thurik, R. (1999) “Entrepreneurship, Industrial Transformation, and Growth”, published in Gary D. Liebcap (ed.), The Sources of Entrepreneurial Activity, Stamford: JAI Press
37

� )LQDO�5HSRUW�
��� $�&RVW�%HQHILW�)UDPHZRUN�
4.1. Introduction
In this chapter we address the Research Specification requirement of establishing “a cost-benefit framework for SME involvement in public sector markets”.
We develop a framework for the appraisal or evaluation of comparisons between options of procurement from an SME and procurement from another source. We develop it mainly for the assessment of the case studies presented in the next chapter, but the principles apply equally to any policy, programme, or project analysis in this field.
Public procurement from small firms has been much discussed in several UK Government reports. Wider policy on small firms has also been well documented and, as discussed in chapter 3, there is a substantial academic literature on the role of small firms in a dynamic economy. However there appears to have been very little formal analysis, or at least economic analysis, of UK procurement issues, to support the generally sound and useful, but qualitative, advocacy of recent documents.29
Our framework covers questions traditionally perceived as “economic”, and also has due regard to wider social impacts, to the concerns and practicalities of management and of politics, and to institutional structures. We develop however only those issues relevant to this specific comparison, drawing upon but not questioning existing government guidance on appraisal and evaluation, whose main conventions (as summarised below) we take as given.
We first, in sections 4.2 to 4.8, explore a range of underlying institutional and technical issues, leading in section 4.9 to a list of those costs and benefits that may need to be considered in the appraisal or evaluation of SME procurement.
4.2. Procurement as an Instrument for Diverse Public Policies
Government publications that promote increased public procurement from small firms usually emphasise benefits to the nation as a whole – such as increasing innovation and competition and hence general economic growth. Also stressed are the role of SMEs in improving local social cohesion. Alongside these arguments, but rarely distinguished clearly, are claims that an emphasis on small businesses brings direct benefits to public sector procurers.
All of these arguments have merit, but they relate to a wide range of overlapping policy initiatives, in all of which public procurement from SMEs is seen as having a role, but often a relatively minor role. These policy areas include:
��Procurement, led by the OGC;
��Small business, led by the DTI;
An exception is the consultancy report published by the Office of Fair Trading on Assessing the Impact of Public Sector Procurement on Competition, (Reports OFT 742a, b, and c, September 2004), which present an exhaustive theoretical analysis of competition and public procurement, but whose case studies cast little empirical light on small firm issues.
38
29
� )LQDO�5HSRUW�
��Local authority efficiency, led by ODPM;
��Innovation, led by DTI/Treasury;
��Competition, led by DTI/OFT;
��Better Regulation led by the Cabinet Office;
��Sustainable Development, led by Defra;
��Black and ethnic minority (BEM) issues, in particular with respect to ethnic minority businesses (EMBs), and gender policy, led in their business aspects by DTI;30
��General social inclusion, led by ODPM, but with increasing Treasury/DTI input.
Our main focus is the overlap between small business policy and procurement policy (including ODPM’s interest in local authority procurement). This is not however our sole focus. Also of concern are government policies on innovation and competition, social inclusion and “sustainability”.
4.3. The Range of Small Businesses
4.3.1. Small and Medium Size Enterprises
The term “small firm” is used widely in government as a shorthand for Small and Medium Size Enterprise (SME), and also to mean “small enterprise” (up to 50 employees) as distinct from “medium size enterprise” (between 50 and 250 employees). There is no sharp divide between firms that do and do not suffer from the problems of small size in the context of public procurement; and to the extent that there is a divide it depends on the particular market and other firm-specific factors.
The main SBS concern is with small firms in the stricter sense of “small enterprises” (and the smaller end of this range) and problems of size are typically more severe for smaller enterprises. Size problems may nonetheless affect many medium sized businesses and the OGC draw less distinction between small and medium.
4.3.2. Social Enterprises
Social enterprises are one aspect of a theme, perhaps best described as social awareness, which proved to be stronger than we expected in this study, and which we discuss more fully below under the heading of sustainability.
Social enterprises are currently prominent on the international agenda, for example in the EC and the OECD, and on that of the UK Government, where the policy lead is with the SBS Social Enterprise Unit. From our limited experience of such enterprises in this project they appear to be delivering an extremely valuable service, in activities which would be served not at all, or served much less well, by the private sector market economy or by public provision. Social enterprises have no equity funding, and like many institutions of civic society are not owned by any individuals or other institutions. However many are profit making SMEs.
We did not record the EMB or gender status of the SMEs in our case studies.
39
30
� )LQDO�5HSRUW�
Despite the considerable literature on social enterprises there appears to be little that ties them in to mainstream economic analysis – presumably because they are built on the premise that the enterprise’s motivation is that of personal commitment, not financial gain, and this does not fit tidily into conventional textbook economics. There are two facets of these enterprises which may merit more clarification in public and policy debate.
One is the claim sometimes made that the public service motivation and commitment of social enterprises is necessarily greater than that of an enterprise owned by shareholders. We were certainly impressed by the public service motivation, and competence, of the two social enterprises with whom we dealt directly. However we were no less impressed by these characteristics in most of the more conventional small businesses. Our case studies suggest that commitment to the service delivered by many smaller businesses is driven by personal or corporate wish to deliver a first class service, in some cases explicitly directed not only to the client’s interest but also to the wider public interest, much more than by the textbook picture of profit maximisation.31
The other slight, but pervasive misperception is that social enterprises have an inherent social or cost advantage because they have no shareholders, because their surpluses are therefore not diverted at all to dividends and, if invested, do not add to any shareholder value.32
Several factors33 may, for the best of reasons, contribute to lower unit costs for social enterprises, and help to offset the extra financial burdens of working in fields that are not normally commercially viable; but they are distinct from issues of equity financing or ownership.
However there are many areas of social importance, especially those of social exclusion, where social needs can be met only by either public sector provision, which is often severely limited, or action by civic society through social enterprise. The unique strength of social enterprises appears be their application of high motivation to supplying these social needs that, for whatever reason, are not supplied to the extent that society wishes by private sector markets or public sector provision. It is for this, rather than any unique features of their financing or staff quality, that we believe they should be recognised, applauded and promoted.
Many of the problems of public procurement experienced by conventional small businesses also apply to social enterprises. We therefore include one case study where procurement is from a social enterprise and another where social enterprises have a central role.
31 This is illustrated for example in case studies 1 (Histon), 3 (Quest4), 4 (EGS), 5 (EGA) and 6 (Matrix rcl) among others. Very strong commitment is also evident in some public sector operational units, such as those described in case studies 12 (Cornwall), 13 (Northumberland) and especially 14 (Sheffield Homes).
32 This has political appeal, as was illustrated in the Government’s presentation of the launch of the nation’s largest social enterprise – Network Rail – but it glosses over the fact that equity is, among other things, a source of capital. If an enterprise does not have equity capital it must have capital from other sources. In practice, for social enterprises, this is typically a mix of loans, some of which may be soft loans from financiers who wish to contribute to the social objectives, and some from grants, made again in support of these objectives. As a social enterprises are not owned by anyone, any increase in its social value achieved by investment does in a literal sense accrue to society, albeit locked into the enterprise. But this is not in any absolute sense better or worse for society that increases in the value of private sector enterprises; it is just different.
33 Such as a willingness to accept a more parsimonious style, for example in accommodation and pay, than is expected of many more conventional enterprises.
40
� )LQDO�5HSRUW�
We have not however considered voluntary and community organisations other than enterprises.
4.3.3. National Versus International Enterprises
Small businesses supplying to the UK public sector are almost invariably UK enterprises. However small businesses from other countries may occasionally find a UK public sector market and some small enterprises, which are in most senses SMEs, may have associations with some wider international group. The advantages to the procurer, and the national competition advantages, of procurement from a foreign small business would seem to be the same as those from a UK company, whereas the national innovation benefits may not be, if innovation spurred by the contract is less likely to be concentrated in the UK. These issues have not however arisen to a significant degree in any of the cases examined in this report.
4.4. The Concept of a Level Playing Field
Some of the arguments for encouraging procurement from smaller businesses, such as the general promotion of more competition and innovation, imply that public sector procurers should discriminate in their favour. However it is more often argued that public procurement procedures currently discriminate against smaller businesses, and that this should be replaced by a “level playing field”.
Some of the challenges faced by smaller businesses are the natural consequences of economies of scale. A larger enterprise faces extra costs – such as the specialist HR costs of managing a large workforce, some loss of flexibility, and perhaps sometimes some loss of “hunger” for new ideas and new areas of work. It also gains potential savings – most obviously in manufacturing processes that offer large technological economies of scale, but also, perhaps, in access to an especially wide range of expertise. An enterprise that grows beyond a critical size, even while still leaving it well within the definition of an SME, may also enjoy a sufficient depth of orders to commercially justify a distribution system, or make it efficient to develop information management systems, which make it easier to guarantee reliability, or to identify, bid for and manage new public sector contracts, or to provide sufficient security for financing of working capital or new investment. It would not be in the public interest to “offset” such advantages of scale.
On the other hand some of the problems faced by smaller businesses may reflect less than optimal characteristics of public procurement mechanisms themselves. These may be in formal procedures, such as avoidable lack of standardisation or complexity of information requirements, or insufficient curiosity by procurers in widening sources of supply or of product innovation, and limited publicity for invitations to supply. Changes in these areas might be made at minimal cost, to improve the procurement process whatever the supplier, even if the changes may bring proportionately more benefit to smaller suppliers.
Given these several perspectives it is difficult and perhaps misleading to try to operationalise the aspiration of “a level playing field”. To stretch the metaphor, the playing field is already level, but strewn with boulders that make it more difficult for all suppliers, but which some suppliers are more adept at clambering over than others. More useful is the concept of looking for an optimal balance, case by case, between extra procurement effort and the consequent benefits from a wider and better quality supplier base.
41
� )LQDO�5HSRUW�
4.5. Direct Benefits Versus External Benefits
Some of the potential benefits of more bids from smaller businesses, such as lower prices and better service or product quality, accrue to procurers – the short and/or the long run. Others, such as more competition or innovation in the economy more widely, or social impacts on the wider community, accrue to society, but are often “external” benefits, in the sense that they do not accrue to the procurer.
Different bodies have different perspectives on the range of issues that should be taken into account in developing procurement policy and making individual procurement decisions, or establishing its procurement strategy.
The formal term “value for money” is rarely defined clearly enough to make it clear how wide a range of costs or benefits should be considered. The usual implication is that the procurer should consider the direct (whole life) cost and quality of the good or service being procured, without significant regard to external costs and benefits. Indeed it seems generally unrealistic to expect or require those making specific procurement decisions in national public sector bodies to have substantive regard to measures other than their own (short and long term) value for money.34 It is more appropriate for other policy initiatives to take account of external benefits (or costs) that might arise from procurement from smaller businesses (through for example fiscal policies or subsidised advice or training for smaller businesses, or centrally determined environmental targets).
Local authorities face different incentives. They have their own regeneration tasks, which they may choose to integrate in some areas with public procurement. Some central government bodies engaged in local procurement may also choose to investigate local procurement options, not only for value for money as defined above, but also, as a bonus, to satisfy local political preferences for local procurement. Some of our case studies show how these incentives can produce very good outcomes, although they may also pose a danger of local “protectionism”, as we discuss below under employment impacts.
4.6. Baselines for Comparison
Costs and benefits in any analysis are relative to some alternative. Any cost benefit framework thus needs to be explicit about what states of the world and alternative decisions are being compared.
In this report the usual baseline, or counterfactual, to procurement from a small business is procurement from other firms – which may be specific (for example in the case of a previously established supplier) or may be generalised. Less often the relevant alternative option may be procuring the service in-house, or taking no action at all or minimal action.35
34 In the private sector many companies will support activities that in immediate commercial terms are a net cost, but bring rewards in terms of, for example, public image and staff satisfaction. Whether public bodies should build such considerations into their procurement policies is debateable. The danger is the incentives this may create for politically driven preferences that are counter to the public interest.
35 As we note later, in developing the case studies a frequent challenge was to persuade both procurers and suppliers to consider not only the do minimum counterfactual, but also the alternative of procurement from another supplier.
42
� )LQDO�5HSRUW�
4.7. Information Needs for Monitoring and Evaluation
In principle significant procurement decisions, or decisions about procurement policy, should subsequently be monitored and evaluated. This is however currently difficult or impossible to achieve in a systematic way with respect to procurement from SMEs, given the paucity of data to identify which suppliers are SMEs.
There is a case for developing a sounder base for longer term monitoring and evaluation by adding company size to the standard information requirements of tenderers. We support this case, but with the caveat that it carries the danger of generating politically driven targets. While the involvement of SMEs in some areas of procurement does appear to be sub-optimal, we suggest later that procurement markets are so complex and vary so widely that any general targeting would provide unhelpful incentives. The better way forward is case by case at the margin, monitoring but not targeting aggregate statistics.
4.8. Analytical Principles
We here set out the analytical principles which we suggest should underlie the analysis of procurement from smaller businesses. In doing so we identify some areas in which government policy is unclear (with respect to defining the public interest) and some respects in which the benefits claimed from local employment – as distinct from procurement from small firms - seem to be at odds with central policy and sound analysis.
4.8.1. General principles
The principles of appraisal and evaluation set out in existing government guidance36, which we take as given, include the following.
��Public sector appraisal and evaluation should be designed to identify options which best promote the public interest, given the current policy framework;37
��Appraisal and evaluation should follow a cycle of rationale, objectives, appraisal, monitoring, evaluation and feedback – ROAMEF. Especially important are the setting of objectives and identification of a full range of options;
��Costs should be opportunity costs. Thus while using existing staff or physical assets may have no explicit budgetary impact, they should be costed at their value in their next best alternative use.38
36 Notably HM Treasury (2003), The Green Book: Appraisal and Evaluation in Central Government, London, TSO, and, with regard to regeneration and employment, Assessing the Impacts of Spatial Interventions: Regeneration, Renewal and Regional Development - 'The 3Rs Guidance', published by the ODPM in May 2004. We also take as given guidance such as the OGC/Defra Joint Note on Environmental Issues in Purchasing of October 2003.
37 The opening sentence (paragraph 1.1) of the Treasury Green Book is: “All new policies, programmes and projects, whether revenue, capital or regulatory, should be subject to comprehensive but proportionate assessment, wherever it is practicable, so as best to promote the public interest.” Given its importance, the concept of the public interest is surprisingly little discussed. It might be defined in principle as the preferences which people in general would express if they were fully informed, although, of course, such preferences are rarely if ever observable.
38 “Costs should be expressed in terms of relevant opportunity costs… An example of an opportunity is to use land in a different, more valuable, way than in its current use. Another is the alternative use of an employee’s time. Full time
43
� )LQDO�5HSRUW�
��Care is sometimes needed to distinguish between total or average costs and benefits and costs and benefits at the margin if an option is enhanced or reduced. Most important, usually, are costs and benefits at the margin, but the definition of what is marginal may depend upon a clear definition of the comparison being made.
��General economic technicalities, such as the rate of discounting over time and the handling of taxation, should follow Treasury conventions;
��Due account should be taken of risk;
��Due consideration should be given to distributional impacts, across for example geographical areas or individuals of different income.
A concept that has been widely used by DTI, although it has a low profile in current Treasury guidance, is that of “market imperfections” – the concept that government intervention is justified only if there is some imperfection, such as a natural monopoly, or absence or asymmetry of information, which prevents an efficient market solution. There is much virtue in this concept, especially in the appraisal and evaluation of policies and projects which intervene in markets. It is relevant to public procurement insofar as action is aimed at traditional market imperfections, in particular weaknesses in information flows, for example about public procurement opportunities. It is prominent in the OGC’s Kelly programme of procurement reform. However it has limitations where the public sector is a direct market player, and many of the inefficiencies arise from characteristics of internal management within government. These are not well captured by the market imperfection framework, which puts the focus on weaknesses of markets, not weaknesses of government.
In public sector appraisal and evaluation some costs and benefits can usually be valued explicitly in monetary terms. Others cannot, but can still be recorded and described, and sometimes quantified in units other than money. Multi criteria analysis techniques are sometimes appropriate for applying a formal analytical approach to decisions entailing judgements about comparisons of costs or benefits when not all the key features can be valued. We have not however found these to be appropriate to our analysis of case studies.
As noted above, the appropriate handling of external costs and benefits (i.e. that do not directly affect the whole life cost or quality of the goods or services being procured) may depend upon the institutional circumstances. For general policymaking in central or local government, externalities will normally be included. For appraising specific procurement decisions in central government they will normally be excluded. For procurement by a local authority or other local public body, the procuring agency might take into account some local external impacts.
In the course of this study two related issues have assumed unexpected prominence. Both are approached in some contexts from ideological or political perspectives that appear often, from our limited range of case studies, to achieve social outcomes which are beneficial, and in some case very strongly so. However the analysis underlying these perspectives is not always consistent with central government guidance and may sometimes steer decisions towards sub-optimal outcomes. We examine these issues in turn. One is the sustainability
equivalent costs should be used to estimate the costs of employees’ time … and should include pensions, national insurance and allowances, …” (Treasury Green Book, section 5.14)
44

� )LQDO�5HSRUW�
agenda. The other, which is more serious and challenging, is the appraisal of short and long run impacts on employment markets. Both, especially the latter, arise from entwining the issues of procurement from smaller businesses with the attractions of buying locally.
4.8.2. Sustainability
Since “sustainable development” emerged in the 1980s the term sustainable has become politically ever more popular. It has extended widely to, among very many examples, sustainable communities, sustainable food and sustainable procurement. The UK Government, following public consultation, has recently reformulated its sustainable development agenda39, led by Defra, to encompass four “key priority areas”, plus one crosscutting area, all described as follows.
��Sustainable production and consumption - working towards achieving more with less;
��Natural resource protection - protecting the natural resources on which we depend.
��Climate change and energy - confronting the greatest threat;
��From local to global: building sustainable communities - creating places where people want to live and work, now and in the future.
In addition to these four priorities changing behaviour also forms a large part of the Government’s thinking on sustainable development. A cross cutting priority, it provides the rationale and guidance on how Government intend to encourage more sustainable behaviour.
Official posts of sustainability officials and sustainability teams have become widespread. Local authorities tend to use the term to describe their environmental polices, especially on recycling, and sometimes for policies to encourage local procurement. In central government it has become an umbrella term for environmental polices and social inclusion policies. As a political motivator for action, the concept is thus a great success, and the broad environmental and social inclusion objectives which it covers are for the most part uncontroversial.
From an analytical perspective however it poses a problem. This is not so much the oft noted absence of a single operational definition of the term sustainable. It is more the problem that it carries with it the concept of a hierarchy of moral absolutes, to the exclusion of looking for optimal trade-offs between environmental or social costs or benefits and other costs or benefits – in particular impacts on taxation or consumer prices.
This absolute approach is set out obliquely, but unambiguously, by the Sustainable Development Commission, sponsored by Defra, as follows. The opening reference to optimisation would be uncontentious by itself, but its meaning is revealed by the concluding comment that, in effect, only after environmental and social imperatives are met should trade offs against financial costs be considered.
Securing the Future: Delivering UK Sustainable Development Strategy, TSO, March 2005, pp 53-55.
45
39
� )LQDO�5HSRUW�
For policy makers and decision takers, [sustainable development] establishes a clear hierarchy: protect critical natural capital in all circumstances; wherever possible, seek to optimise[i.e. “maximise”?] economic, social and environmental benefits over time; where that is not possible, seek to minimise any potential damage to the environment, people and their communities; only then can one trade off potential economic benefits against unavoidable social and environmental disbenefits.
(Frontispiece to Mainstreaming Sustainable Regeneration: a Call to Action, A report by the UK Sustainable Development Commission, December 2003)
The concept of moral hierarchies is uncontentious in some cases. In many countries slavery, or public execution, are regarded as morally unacceptable, and not an issue to be considered as a trade off between personal freedom or human dignity and anything else. In practical UK policymaking the same applies to exposing workers or members of the public to more than very low levels of risk of death or serious injury, which is normally unacceptable at any cost. However, in areas of UK public policy, the circumstances in which such absolutes are widely accepted are very limited.
In the UK procurement debate, sustainability is prominent as a basis for promoting local procurement by local authorities and by the NHS, which we discuss below. At the national level we note that “sustainable public procurement” is currently defined as a combination of general good procurement practice (especially whole life costing) and the promotion of green procurement in the sense of following central guidance or directions constructed by Defra on a range of products, such as timber, detergents and energy using equipment, including the promotion of certain suppliers. We have not investigated whether or not these environmental procurement initiatives tend to favour smaller firms (although one of our case studies presents a small firm that has capitalised well on the increasing environmental regulation of vehicle disposal).
There remains some underlying hesitation in current policy, as publicly stated, about which and how financial and environmental costs should be traded off when they are in conflict. However the key paragraph, as follows, appears to maintain the principle that costs and benefits should be traded off, rather than seen in terms of absolute hierarchies:
Efficiency is an essential feature of public sector spending: public money must be well spent and not wasted. Better purchasing and the delivery of better services are an essential feature of achieving efficiency gains in economic, environmental and social terms. Improving the professionalism of purchasing activity across the public sector and the more widespread use of whole-life costing will go some way to achieving this. But we also need to examine ways to stimulate and enable whole-life accounting – where expenditure looks to achieve the best outcome for the public overall, irrespective of when or where costs and benefits fall.
(Securing the Future, p 53)
46

� )LQDO�5HSRUW�
We note that in the high level strategies of their sustainable development action plans, two central government departments (although only two) mention procurement.40
4.8.3. The Costs and Benefits of National and Local Employment Impacts
There are political rewards for procuring from local businesses. Local procurement is also often perceived as being in the local economic interest, and is often presented as inherently virtuous on environmental grounds.
In several of our case studies local procurement features strongly, and these particular cases appear to us to be examples of good practice, in the public interest, in some cases strongly so. However we see cause for concern about some of the technical, or quasi-technical arguments which are influential in this field.
In specific cases there can be good reasons for putting an especially high value on local procurement. This might, for example, bring benefits to the procurer in terms of quality and flexibility. Or procurement from a particular locality or category of local people, where it is coordinated with policies to reduce social exclusion, may bring more benefits than would procurement from elsewhere. In a cost benefit framework it would however generally be wrong to count the use of labour in supplying procurement as a national benefit. Even local benefits, because of displacement and other effects, are much less than is widely perceived.
We have discussed this with officials in DTI and the ODPM and our analysis as set out below is we believe consistent with Government policy. Current (2004) central guidance41
replaces the previous “EGRUP” guidance of 1995, but retains the same technical substance on employment impacts. This is to the effect that:
1. “Job creation” in a specific location does not of itself indicate any net increase in national economic activity, unless it improves supply side efficiency (by more than would spending the money elsewhere);
2. There are however distributional reasons for considering the impact of a reduction in unemployment on the social problems experienced by particular areas (health, crime, low educational attainment, family break-up etc.).
Our own discussions with local authorities suggest that these two items might usefully be expanded to include more explicitly measures that directly address both supply side efficiency and distributional improvement, by bringing the socially excluded into the labour market.
40 Securing the Future, pp 146-151. The Home Office includes “Produce a Departmental Sustainable Procurement Strategy by 1 December 2005”. The Treasury includes, more comprehensively, “Continuing to meet relevant sustainable development objectives in public procurement by having a comprehensive and thoughtful approach to value for money and whole life costs of goods and services procured and by building relevant sustainability issues into the procurement process as early as possible.”
41 Assessing the impacts of spatial interventions: regeneration, renewal and regional development - 'The 3Rs guidance', Interdepartmental Group on the EGRUP Review, Office of the Deputy Prime Minister: London, May 2004.
47

� )LQDO�5HSRUW�
We also note the Government’s policy emphasis on local community benefits, notably in the National Procurement Strategy for Local Government42, and see no necessary conflict between these commendable objectives and the 3Rs principles.
However the arguments put forward for local procurement often go well beyond these principles. Two arguments in particular are popular. One, which is fairly muted in government, but prominent in popular debate with regard to food, is that transport carries such serious externalities, for which society is not compensated by transport users, that local procurement should be strongly favoured. The other is that buying local is good for the local economy.
The first of these arguments, which is often expressed in terms of “food miles” – the distance food produce travels from their place of origin to place of consumption - is an empirical argument about transport externalities and well beyond our terms of reference. We rather doubt that the case is material, but it would be good to see some impartial analysis.43
The second, protectionist argument, expresses the intuitive and politically popular perception that, while selling goods and services to others is good for a country or a community, buying them is bad.44
It has been suggested to us that, even if analytically this view of trade is wrong, in political terms it is reflected in national or European Union policies which, in effect, provide job subsidies to regions of chronically higher than average unemployment rates. However while this has some truth, we understand that the amount of public money which can now be described in this way is very small. The main thrust of UK regeneration policy, with regard to employment, is now firmly towards supply side (in particular labour market) improvement.
It appears to be believed, in areas where the unemployment rate is persistently somewhat higher than the national average, that this provides a case for favouring local procurement, even if the procurement costs are somewhat higher and it does not improve labour market efficiency. However while it is easy to see the argument’s intuitive appeal it is less easy to see its technical merit. It would not in general affect the local unemployment rate. It might possibly achieve some slight income distribution to the area, at the cost of a loss of national welfare; or it might reduce local income, because more public money is being used to achieve the same service, or a given budget is providing less service. As noted in the Byatt Report on local government procurement45 (paragraph 3.10), “distorting the procurement process to
42 Produced jointly by central and local government, and published by ODPM in October 2003: http://www.odpm.gov.uk/stellent/groups/odpm_localgov/documents/downloadable/odpm_locgov_024923.pdf
43 It is promoted by for example Professors Petty and Lang, two influential scientists in policy debate on food and the environment - see for example “Buy local produce and save the world: why food cost £4 bn more than we think”, Independent 3 March 2005, p3. They develop “transport accounting”, rather as “energy accounting” of goods and services was developed in the “Limits to Growth” era of the 1970s. The argument is also promoted by the Sustainable Development Commission – as illustrated in the context of a case study below. An impartial analysis would need an objective valuation of the externalities, and an assessment of the extent to which they are not compensated by, for example, fuel taxes, through which those who consume transport in this way compensate the rest of society.
44 EC regulations designed to counter these political pressures appear from our discussions with procurers to be fairly widely seen as an obstacle to be overcome, for example by cunning design of specifications, keeping contracts below the EU limits.
45 A Review of Local Government Procurement in England: Main Report, ODPM, June 2001.
48

� )LQDO�5HSRUW�
favour specific suppliers will often have a cost to the community as a whole which is disproportionate to the benefits derived by a small number of people. Longer term benefits to the local community are usually best served by using procurement to achieve value for money and to support an open and competitive local economy.”
It has also been put to us that even if some of the arguments used to promote local procurement are technically flawed, they are still worth making, because they encourage local officials and politicians to think more imaginatively about procurement, with often beneficial results. This leaves us uncomfortable, not least because it may discourage local procurers from thinking beyond simply buying local, to the complex questions of buying local in a way which is integrated with well designed regeneration policies, including for example training and strong targeting of people excluded from, but wishing to enter the labour market.
A particularly influential instrument to encourage buying local per se is the LM3 model developed and promoted by the New Economics Foundation. Our discussions with the Foundation leave us much impressed both by their social concern and by their technical competence and understanding. However this model, which calculates a local multiplier (without account of effects on the rest of the economy, or of important feedbacks46 within the regional economy), is essentially a political model, albeit designed in good faith to achieve good ends.
The Foundation fairly note for example that few of the many case studies they have developed find authorities paying any more for procurement from local suppliers, and in most cases they obtain a higher quality. They also fairly note that, although employment is often emphasised, because it is “a hot topic” and is easily quantified, regeneration and the local economy are much more than that. They also suggest that important wider social or environmental impacts are often excluded from the analysis. Herein lies the challenge. Wider impacts, where they are material, are of course formally within the remit of public policy analysis – as set out for example in the Treasury Green Book and elsewhere in this Chapter. The issue is whether some external impacts are improperly overlooked, either by oversight or because data is not available.
Important wider impacts (i.e. externalities) are sometimes overlooked or given too little weight. Examples in past have been extreme, such as the failure in the mid 20th century to give enough weight to nuclear clean up costs, or, until far too late, to the environmental impact of flying supersonic Concordes over populated areas. However the issues today, as with the current controversies over wind power, are perhaps more often about differing valuations of externalities than about their oversight.
We do not believe that in this study we have overlooked any material externalities. In our judgement, for example, it is unlikely that procuring food from local rather than more distant sources would have any material impact on the health of schoolchildren, or on the
In particular displacement, since most of the resources employed to supply the public sector contract would otherwise have been active in other ways, and also effects on wage rates and population flows. Local procurement at the same price as procurement from elsewhere may for various reasons give better value for money, but it seems unlikely that it would affect the local unemployment rate beyond the very short term, as this rate depends mainly on the relationship between local costs (in particular wage rates and productivity) and costs elsewhere.
49
46

� )LQDO�5HSRUW�
environmental externalities of agriculture. However if there were reason to expect material externalities for which data is not available it should be noted, and data should be sought.
As is clear from some of the case studies, three of which have been built on information supplied to us by the New Economics Foundation, the buy local motivation can produce good ends. However it may be that even better ends could be obtained with policy drivers based on technically more rigorous foundations.
A wider issue than the magnitude of externalities is that of political responsibilities of local procurers. Local authorities are audited according to the “Best Value” performance framework, introduced in 1999, which requires them to deliver services to clear standards “by the most economic, efficient and effective means available”. However we understand that, unsurprisingly, there is no explicit guidance on the politically delicate question of the extent to which local authorities should be concerned, if at all, with impacts outside their local authority boundaries. We have been told by an authority in this field that Best Value seems to be fading in deference to the Gershon objective of “spending more efficiently (i.e. vfm, also very poorly defined), and more importantly the Audit Commission's CPA (Comprehensive Performance Assessment) rating of each authority.” We note that the new CPA guidance for 2005 gives more importance to meeting the needs of local communities, community leadership and local partnership, focusing on making a difference to local people and place.
It is thus consistent with Government policy (and would we presume be endorsed by local electors) that local authorities should look to the interests of their own communities, generally regardless of the national interest. Our qualification is that, in doing so, it would be unfortunate if their procurement policies were misled by incomplete understanding of the costs and benefits of cross boundary trade.
It is less clear that local prioritising is so defensible by national institutions which happen to be locally based, beyond the level justified by value for money for the procurer, and reasonable concerns to maintain good relationships with local institutions.
50

� )LQDO�5HSRUW�
4.9. Costs and Benefits of SME Procurement Options
The costs and benefits relevant to the appraisal or evaluation of procurement from an SME are generally drawn from the following.
Costs and benefits to the procurer
��Costs, if any, incurred by the procurer to lead to a smaller supplier being considered. This might, for example, be some special activity by the procurer to canvas small firm interest; or the establishment and/or maintenance of an information system which costs a little more, to improve accessibility to smaller firms.
��The difference in the whole life cost to the procurer of supply from the smaller business as compared (at the margin, for specific procurements) with the cost of the next best alternative supply.
��Corresponding differences in quality.
��Other ways in which procuring from the small business makes a material difference to the procurer. For example it may lead to a new kind of long term relationship, or make contracting more or less easy or costly to manage, or to adapt to changing circumstances.
External costs and benefits falling on other government bodies
��Costs incurred to develop or promote a relevant central or regional initiative to widen involvement of small businesses.
��Benefits or costs falling to other government procurers (for example from the emergence of a new supply market, or innovation prompted by the procurement from the small business).
External costs and benefits falling on the wider community or the small business
��Benefits or costs consequent on procurement from the small business, affecting the community (local or national) more widely, but not directly affecting the procurer or other government bodies, noting that employment as such (as opposed to measures which improve employability) in this context should not generally be scored as a benefit.
��Any other costs or benefits falling on the small business (and not included in the price paid by the procurer).
51
� )LQDO�5HSRUW�
��� &DVH�6WXGLHV�
5.1. Introduction
This chapter presents a range of case studies, to address two further key research questions:
��Where SMEs have been involved in public sector markets, and more specifically, where they are providing goods and services, have these potential benefits or costs materialised and resulted in efficiency savings and overall value for money?
��To what extent can the findings from specific examples of SME involvement in public sector markets be generalised across all SMEs in the same sector, or in other sectors?
We first summarise the process of selecting and developing the case studies and then the strengths and limitations of the available data sources. This is followed by a presentation of the case studies themselves, with an accompanying commentary. The implications of the case studies we leave mainly for Chapter 6.
5.2. Selection and Development of the Case Studies
In an ideal world, having constructed a set of criteria, we would have sought cases to fit a range of categories. In the event, although we constructed criteria which excluded inappropriate cases (for example because the supplier was not an SME, or where the procurer was not able to provide the time needed at least to review and endorse a case study), we accepted all the appropriate case studies that became available and could be completed within our time frame. The consequent sample is thus not on any criterion evenly distributed. It does however cover a range wide enough, we believe, to provide both general lessons and lessons of value in specific product or service areas.
The origins of the studies are very diverse. An early, if understandable disappointment was finding that public or private sector bodies based at the national or regional level, almost without exception, are too far from the front line to be able to identify specific cases of the kind required for this study. This was sometimes not for want of trying. We are grateful in particular to the British Printing Industries Federation for a valuable discussion followed by considerable efforts to find appropriate studies. In the event the one case which might have been appropriate from that industry did not proceed because the supplier, who we understand had a full order book and did not wish to expand, did not want the potential publicity. One exception, of a national representative body that led directly to case studies, was the IT industry body Intellect. They arranged a seminar for us in January, out of which a substantial cluster of studies flowed. For this we are much in their debt. Another exception was the NHS Purchasing and Supply Agency (PASA), who provided a cluster of three case studies (and other useful material), involving several staff to whom we are much indebted.
Other case studies emerged after following leads provided in the first place largely by the SBS, the OGC, or the Better Regulation Task Force, but often networking through several successive links. Another cluster of three studies was developed from a set of cases provided
52

� )LQDO�5HSRUW�
by Justin Sacks of the New Economics Foundation, as noted in section 4.8, to whom we are also most grateful. Otherwise the studies arose from very diverse encounters and suggestions. This process meant that the case study portfolio began to build only in late January, imposing a tight schedule.
Many potentially promising leads did not materialise. Sometimes the supplier did not wish to be portrayed as small. One very small enterprise, perceived by itself and probably its customers as a lion in its specialist skills, had no wish to risk being seen as claiming “I’m small and therefore special”. Sometimes the procurer was not willing to contribute; in one unfortunate case a procurer head of IT and the supplier were keen to develop a case study, but the head of procurement, whose approval was needed, eventually had no time for it. Sometimes the chain of responsibility in a large procurer was too daunting. In one case47, illustrating the difficulties of case study development at the low-tech end of the market, a small supplier of cleaning materials providing a most promising draft case study of its supply to a social enterprise. However the procurer reference which we followed led over ten days, with staff who were always friendly but rarely available, to half a dozen references from one staff member to another, ending with the news that the company had now lost the contract, as it had not been able to supply the full range of materials required.
In some cases enthusiasm to follow through earlier promises waned as it became clear that (although we imposed the minimum feasible demands) the study did need more than a few moments of time and thought. In some cases, with perseverance, these survived, but several did not.
In one case – contracting for school and subsidised general bus services - we concluded, after some significant data collection and discussion with stakeholders, that the information, while possibly suggestive that increased competition helps to restrain costs, was too open to alternative interpretations for us to use.48
We enquired into the potential for case studies from the West Midlands and Haringey Pilots, but with limited success as they are so recent, although Haringey provided one case.49
Most of the case studies are of direct procurement by the public sector from a small business. However three are of subcontracting through the major prime contractor EDS. We had hoped to include another example from another major prime contractor, who referred us to a supplier who was keen to contribute. However the prime contractor stressed that it had no
47 This was referred to us by Kemal Ahson, a consultant who is now completing the evaluation of the Haringey Pilot. We are grateful to him for most useful discussions and helpful comments on a draft of this report. He also referred us to Case Study 2 - one of the most interesting of all the studies.
48 Generally more firms compete for school bus services than for general services and the (high) rates of cost increase in both markets in recent years have been somewhat lower for school services. However a factor in these cost increases is the increasing demand by local authorities for easy access buses for general services, which has not generally been applied to school services, and the supplier bases in the two markets are fairly different.
49 We spoke to an official closely involved in the development of the West Midlands portal, who commented that it would be of great value for data to be sought on the numbers of contracts awarded through the portal, the only data now available being on number of bids.
53
� )LQDO�5HSRUW�
interest in firm size, and the supplier concluded that the nature of the large firm made it infeasible in a realistic timeframe.50
A frequent challenge was to persuade suppliers and procurers that what was needed to meet the SBS requirement was not quite the same as what they had immediately to hand. Many suppliers and procurers were keen to explain the merits of the project they had in mind and what benefits it had brought. One local authority wished to provide us simply with a glowing testimonial to an expanding small business in its area. Such studies would however have told no more than that small businesses have on occasion been awarded public sector contracts and have delivered as promised. We had to stress many times that this study is most concerned with the particular benefits of involving small businesses, relative to not involving them. The great majority of the case studies therefore entail some direct comparison with larger firms, although we include a very few others which we believe show useful illustrations of small business and procurer actions that, while not illustrating direct competition between small and large firms, helped to widen the marketplace.
Another challenge, sometimes, has been to understand exactly what service has been procured. In the world of IT in particular, not only the terminology but the nature of many of the services provided has moved far from the language and concepts of the everyday world. We have had to stress that the audience for these case studies (not to mention ourselves) are for the most part not specialists in IT, or in any other specific area of procurement.
In no case did issues arise about the confidentially of specific data. It was always clear that we had no wish to include any facts or figures which were commercially confidential. However the willingness of contributors to share such information with us on a personal basis (for example on bids of competing suppliers) varied very widely. There was also extreme variability in the extent to which contributors felt the need to seek formal clearance of the final documents. Several saw it as a part of their job to propagate their experience and take personal responsibility for how it was recorded. Some, in other cultures, felt the need for formal corporate approval of the final paper. In two case we have had to anonymise the procurer, in one case because a private sector company was unwilling to be named and in the other case, of a large intergovernmental body, because all parties agreed that the cost in time and effort of obtaining such formal (as opposed to informed but informal) clearance would be disproportionate.
Our remit has been to develop cases of successful procurement from small firms, rather than to add to the many catalogues of reported problems, and we have followed this faithfully. However we believe it is right to include in our discussion of lessons in Chapter 6 the essence of some of the comments received during the course of the project, and our own observations, on some key problem areas that might be amenable to reform.
We should mention that we met some concern among small businesses that this exercise was being promoted to produce a “good news” story for government, to illustrate how well things
The small firm’s comment is not untypical of the exasperation sometimes expressed by small organisations in dealing with large ones: “…, this is not going to work within the time frames … one of the problems perhaps which illustrates the headache of dealing with large organisations and getting to the right person who might sign off and take responsibility for allowing us to talk about the case history in question – they just don’t or won’t understand the impact it has on us.”
54
50
� )LQDO�5HSRUW�
were going with public procurement from small businesses. We gave assurances that we were confident that this was not the motivation of the Small Businesses Service in commissioning the work, and in presenting this report we have sought to avoid any deference to spin. In dealing with procurers, in a very few cases there has been some tendency this way that we have sought to mitigate, but in the great majority of cases all those concerned have been more than happy to tell the story as it was.
5.3. Data Sources
The data for specific case studies have been obtained predominantly by telephone and email discussion with suppliers and procurers. Although the work entailed many meetings to establish contacts that sometimes led to case studies, in only a few of the individual studies has it been practicable to arrange face to face meetings. This has not however prevented extensive exchanges, to refine drafts and clarify gaps or puzzles as they emerged.
About half of the case studies are driven by suppliers, keen to exploit a marketing opportunity. We have sometimes had to be firm about casting the text into objective rather than marketing language, but this has been accepted. (We believe that in this particular context an impartial, spin-free account in any case provides better marketing.) A disadvantage of supplier driven sources is that the supplier usually has limited knowledge of the competition in the particular contract, and limited knowledge of how their performance compared with what the procurer would have expected from a large business, and these aspects have sometimes not been as complete as we would wish. However with supplier driven studies we have always required at least endorsement from the procurer, and in several cases this has led to a full and fruitful discussion.
Some studies are driven by procurers, either keen to promote their achievements, or simply interested in sharing their experience. This applies to some cases which have become widely quoted case studies in a range of contexts, such as those in Cornwall and Sheffield. In procurer-driven cases we have generally had no contact with the suppliers.
In some studies there has been a combination of supplier and procurer drive, for example where a procurer has put us in touch with supplier who has taken over the lead (as with the Bluebird case), or a supplier has put us in touch with procurers (as with the Histon case). In some cases the inputs have been truly shared, as in the three cases of procurement from subcontractors by EDS.
5.4. Categorisation of Small Businesses and the Case Studies
The small businesses, and the case studies, could be categorised in many different ways. However the small businesses fall into fairly distinct groups.
The dominant group in these case studies, which may not be close to the popular or usual political image of a small business, is businesses led by a powerful individual (or a small management team) who has moved out of a large organisation to set up the business. Several of these leaders have come from private sector bodies – mainly in IT related systems and other professional services, but also in manufacturing. Others have come from local authorities or from central government. It is not surprising that these SMEs are prominent, since they are the kinds of business which will seek this kind of exposure. They are also
55

� )LQDO�5HSRUW�
likely to be very effective businesses, since those individuals who take such a career step, and then succeed, are likely to among the most able of those in their previous organisations. This is perhaps the most significant imbalance in our sample. These firms do however strikingly demonstrate that small businesses are a force to be reckoned with.
A second group is a diverse range of more conventional small businesses, led by able, hard working managers without previous big business or government experience. We have had very little direct contact with such businesses, because they are desperately pressed for time and they are not into the game of drafting case studies. However they are fairly well represented in the studies, by proxy though procurers.
A prominent sub group of these businesses is food suppliers, in particular because these are a focus of the Government’s Public Sector Food Procurement.
A third group is social enterprises, which we discussed in section 4.3.2. One case study (Green-Works) is based on a social enterprise. In another (Sheffield) social enterprises are part of a complex structure combining housing building works with regeneration.
One case study is of a procurement by a large private sector company, included because of its clear relevance to comparable procurements by government.
Two of the case studies fit into slightly different moulds. One (Defence) describes initiatives in the field of defence to encourage smaller suppliers and, more substantially, to encourage small firms in the development of technologies with both defence and civil applications. The other, requested and helpfully identified by the OGC, is a case of e-auctioning of a professional service, where the main focus is on the auctioning process and its appropriateness to small businesses, and to this kind of service.
A final category of industries which emerged from time to time, but which we generally excluded from the case studies, is those which are essentially SME-only markets. This appears to be the case in, for example, graphic design, and in the supply of wigs to the NHS.
Almost in this category is the ambulance conversion industry, which converts the base vehicle to meet one of several specifications for ambulances. The NHS Purchasing and Supply Agency explained that the NHS has eleven such suppliers, ranging in size from less than 10 to about 400 staff (five with less than 50, four with 50-250, and two slightly larger companies). The market provides no interesting correlations between value for money and size, so it was not adopted as a case study for this project.51
However within the IT market, and some other consultancy markets, many niches are coming to be dominated by small businesses and we have included a few of these.
A full list of the case studies is attached at Appendix B.
It does though appear to offer a potentially useful case, if such were being sought, to illustrate the costs of increasing regulation.
56
51
� )LQDO�5HSRUW�
5.5. What the Case Studies Can and Cannot Tell Us
The cost benefit framework presented in Chapter 4 defines the questions to which we sought answers in developing the case studies. However there were many obstacles – beyond the overriding constraint of time – to constructing fully quantified analyses.
One is the obvious absence of a well defined counterfactual. In very few cases were even competing contract bid prices available. In no case was it realistic to quantify or value with any precision the quality differences that might have been perceived at the time the bids were appraised, or in the subsequent performance.
This is partly because such information is rarely recorded. However this was compounded by the lapse of time. It would not have been sensible to take as case studies very recent contracts, because delivery would not yet have been demonstrated. However by the time the delivery has been demonstrated the individuals concerned in the procuring body have often moved on. In some cases records have been destroyed. Moreover there is often a sharp distinction between the locus of procurer knowledge of delivery and the locus of procurer knowledge of the contracting – in which case both sources need to be sought, with more likelihood that one or other is no longer available and our having to rely of the impressions of a current incumbent.
There are also some costs and benefits, potentially important for this study, for which there appears to have been no previous demand for quantification. This includes for example the costs of the considerable efforts made in some cases by procurers to promote small (or more often, strictly, local) suppliers. Sometimes this may be through the appointment of additional staff, although this we have never been able to establish. In other cases it may entail the opportunity cost of staff time diverted from other tasks. Another such cost is the increase in contract management costs that can arise from multiple contracts where there was previously a single contract. Sometimes there is an understandable reluctance to give exposure to such costs, at least formally. It has not generally been realistic to quantify these impacts, although we note them in qualitative terms.
The case studies therefore cannot, in good conscience, yield headline stories, such as “procuring from small businesses can save up to x per cent”. They do however yield some impressively consistent pictures, in terms of the exceptional skills and quality of service which tend to associated with well motivated small firms, and the scope for procurers, with imagination and effort, to widen the supplier base in very diverse fields, with conspicuous benefits.
5.6. The Case Studies
We here present the case studies, in each case outlining its background and discussing briefly what it has to tell us. As noted above, the wider implications are discussed in Chapter 6.
5.6.1. Two classic cases
We start with straightforward, low-technology cases, which however well illustrate a theme which recurred in most of the case studies – namely the more personalised and committed service, combined with competitive pricing, which is often provided by smaller businesses.
57

� )LQDO�5HSRUW�
We were directed by a consultant to the public sector in East Anglia, Martin Collison, to Case Study 1. The managing director of a small supplier of fresh fruit and vegetables gave us the names of several of his suppliers, to whom we spoke. They provided a picture which was remarkably consistent.52
CASE STUDY 1: FRESH FRUIT AND VEGETABLES
This case illustrates characteristic features of many small business suppliers, stemming from exceptional commitment relative to that normally expected from larger suppliers.
Histon Produce is a chilled food supplier, based near Cambridge, whose primary function is the wholesale supply and preparation of fresh fruit and vegetables. It currently employs about 40 people, and has a turnover between £2 and £3 million. In 2000 it invested £75,000 in a modern production plant and has become a major supplier to a wide range of public and private sector bodies in East Anglia. Its customer base of over 600 includes colleges, care homes, local authorities (school meals), and hospitals. Its expansion has been mainly in competition with larger suppliers, or sometimes replacing the withdrawal of a larger supplier from the market. Much of this expansion has been by recommendation of existing customers.
A typical contract is for three years with a potential for a one year extension, sometimes following a short trial period supplying in parallel with the existing supplier. The contracts are generally below the OJEU limit, but awarded strictly on value for money to the procurer.
Histon’s public sector customers present a consistent picture of the East Anglia fresh food supply market and the particular benefits from procuring from a small business. They note that the market is relatively well suited to fairly small suppliers. Provided that a business has the critical mass to handle the administrative costs of public sector supply, there are only limited opportunities for further economies of scale. Larger businesses in the market typically operate in relatively independent local units. Some of the overheads of a smaller business are lower.
Customers of Histon Produce report competitive pricing, and a quality of product which is equal to or sometimes better than that typically supplied by a large firm. However the most distinctive characteristic emphasised by procurers is flexible, personalised and locally available service. Examples of the benefits which this provides include the immediate delivery, in a manager’s car, of a product the customer forgot to order, the same day rectification of any problem that may arise with a product, knowledge by drivers of back roads if main roads are jammed, and simply the helpfulness of “knowing the voice at the end of phone”.
Some procurers note that building these personalised qualities into the tender specification can be difficult.
The picture of flexible and committed service is repeated in Case Study 2, referred to us, as noted above, by Kemal Ahson, who had shared a conference platform with Tony Sargent of Enfield Council. The Council had invested substantial effort in investigating toner cartridges. This has been well rewarded, but the introduction of a small supplier to the world of public procurement is not straightforward. Work is still needed to enable the small business to cope with the authority’s procurement process before it can hope for a full contract, and any help has to be provided in a way that does not discriminate in its favour. The contrast between the flexibilities of public and typical private sector procurement are in this case especially stark.
In a contrast between this and later food case studies, the issues here are simply those of value for money to the procurers. There were no separate “sustainability” motivations for preferring local produce per se.
58
52

� )LQDO�5HSRUW�
CASE STUDY 2: TONER CARTRIDGES
This is an example of imaginative procurement of a routine item, achieving significant long run financial savings and better service, and of a small business strikingly demonstrating cost savings and flexibly.
Enfield Council, in 2004, examined its procurement of toner cartridges – a market of about £140,000 per year. They researched the product and learnt that they must seek quality cartridges which are remanufactured and not drilled and refilled, but that a saving in the region of 50 per cent could be made with the use of recycled cartridges. The Council’s stationery supplier could supply appropriate toners, but the support response was slow.
The Council checked what methods are used to recycle cartridges and identified their weaknesses. They took samples, monitoring delivery times and comparing weight with like for like branded toners to indicate toner content, and ran some samples to test quality and again toner quantity. After sales support was a major issue, to combat the theory that the printer manufacture’s warranty would be invalidated should a non-branded toner leak. Another hurdle was the rumour that the toner is a serious health hazard; so hazard data sheets were collected and checked by health & safety advisors and the toners found to be safe. They found a local small business, Laserline Imaging International Ltd, that met the Council’s criteria of cost, toner quality, response times and recycling, with the added value of an after sales service tailored to the Council’s needs. A contract was duly placed with Laserline, who offered significantly better value for money than larger competitors. .
The Company delivers promptly, often at short notice, and collects old cartridges for which the Council receives a payment. Furthermore, the Company regularly visits users, getting to know their needs and problems. If a printer fails because of leaking toners it is normally repaired in a few hours with guarantee of a year in case of further problems. The cause is rarely the fault of the remanufactured toner cartridge, but the local supplier still provides a goodwill service.
A further benefit, although never yet used in anger, is that the Head of Procurement knows that he or she can speak to the Managing Director at any time and get a response.
In addition to the cash savings and efficiency improvement the Council enjoys the further benefits of supporting the local economy and contributing to its recycling objectives
The Council sees further potential for the supply of branded toners, recycled inkjet cartridges, repair kits and repair/maintenance of laser printers, all of which could benefit from a local supply.
5.6.2. Five case studies of professional services
We here present one study which bridges IT and management restructuring, followed by two that are more heavily IT, albeit one of them also involving structural change, followed by one of policy evaluation and one of roll out and delivery of a training programme. All the suppliers involved are led by entrepreneurs with previous experience in large organisations.
Case Study 3 arose from a contact provided by Sue Moffatt in the Home Office. However it relates to public sector procurement not in the UK, but by a major intergovernmental body. This is the most fully developed of our case studies, in which the managing director (and founder) links the events to the descriptions in the OGC Supply Chain Management Guide. It is a complex case, which however gives good insights into the interactions, from pre-procurement through procurement and implementation, between a competent procurer and a competent small supplier, with a large company also involved. The concluding procurer comment is noteworthy.
Many of the methods outlined in this case study, to achieve supply chain advantages and mitigate “change challenges” within a public sector institution, are being applied now to work for the Home Office. Quest4 Consulting Limited and other related small business (especially
59

� )LQDO�5HSRUW�
QuatroSystem, a procurement and business change consultancy), are providing direct input to a supplier network optimisation programme initiated by CJIT53 and the Home Office in 2004. Some very large companies are also part of this initiative. Processes and systems, adapted to the IT and related business change programmes for the Criminal Justice organisations and their interfaces, are being developed in line with OGC and SBS best practices.
CASE STUDY 3: BUSINESS CHANGE IN A COMPLEX TECHNOLOGY AND BUSINESS SYSTEM
This well developed case is a striking example of a large procurer putting itself out to consider and take seriously an unfamiliar small supplier, and being rewarded not only by first class delivery of the original contract, but also crucial help in recovery from problems experienced with delivery from a large supplier.
A major intergovernmental body commissioned a business change programme in 2001-2002, to bring about seamless operations between four of its HQ departments, including the improved provision of information to four thousand HQ staff and to other stakeholders in nearly two hundred countries.
Stage 1 of the work, with a budget ceiling equivalent to several hundreds of £’000, was the streamlining, design and recommendations for the implementation of the transformation process. A second, smaller Stage 2, of tens of £’000, was the recovery of a central aspect of the project that was meeting unexpected obstacles.
Quest 4 Consulting Limited is a UK firm specialising in business change and technology strategy. It has a particular focus on ensuring communication between business users and technologists in designing and implementing complex information management and change programmes. Initially Quest4 was not on the list of the intergovernmental body’s registered suppliers, but was invited to bid as a result of the body’s having learnt of its work in the private sector. The Company had at that time no more than six consultants, supplemented by a network of other small consultancies that increased its offering by another twenty consultants. However a combined Quest4-Prime team was eventually shortlisted with one other bidder, who was essentially an incumbent large firm, with whom the intergovernmental body had already done much work. (The intergovernmental body also had substantial in-house expertise, but preferred to commission external independent consultants to mitigate many of the “change challenges” across departments.)
The two shortlisted teams were invited to respond to detailed questions about how the work would be delivered. Questions on the pragmatics of delivery, given the challenges of a public sector culture, were raised and discussed (e.g. time taken for approvals, consensus building, project timetables). This was especially important because most of Quest4’s proposed consulting team were to be based far away from its London operations. The Quest4 bid presented the innovation of a supplier community of several small enterprises (UK and US) working with an international prime (which was similar in profile to the other shortlisted large firm – except that, although well known in the UK, it was not familiar to the client).
The Quest4 proposal was eventually preferred for the following reasons.
��Assurance for the client that the “A” team proposed in the bid would be the same “A” team delivered throughout the assignment. This was a determining factor, not least because, if consultant staff changed, many hours of the client’s own non-IT staff were needed to reiterate data and complex interdepartmental relationships to bring new team members up to speed. It was a key strength that the small business was able to guarantee. The prime partner was not able to commit to this for its own contributions – so Quest4 helped provide assurance there too with a service level agreement.
��A supply chain and service delivery model transparent to the client;
��Engagement with the client, and an account management process for the client, more professional than the client expected of a small business;
��A supply chain model pioneered to provide every skill set and service type the client sought, at a fixed price, using an engagement model that enabled the client to be involved in relationships with all parties on
Criminal Justice Information Technology, established in December 2001 – see www.cjit.gov.uk.
60
53

� )LQDO�5HSRUW�
an equal basis (consistently with Figure 4 of the OGC Guide Supply Chain Management in Public Sector Procurement - draft v2.5, 14 January 2005);
��Professional quality: for example three members of the SME team were involved in a related innovation that won a Smithsonian award in 1998-1999.
��Better value for money (higher total fees, but within the budget ceiling, and a lower average fee rate, with only a tiny proportion on overheads and expenses - so delivering substantially more hours);
��SME supply chain team experience of delivering similar change and technology projects in Europe, North America and Asia; the client was therefore getting best international practice knowledge at first hand. (The non-SME alternative was a much larger firm that had generalist knowledge, but without the experience of international best practices.)
��Risk factors clearly documented in the response to the ITT.
��An explicit willingness to provide uncharged extra hours if necessary, on project support and subject matter expertise hours, to mitigate project risk factors identified in the ITT.
In the event, although Quest4 was initially commissioned as a leading member of a Prime and small business relationship devised and led by Quest4, the Company agreed to be a subcontractor in the first block of work, mainly to satisfy some of the usual concerns that large firms mean lower risk. However Quest4 compiled and led teams of small businesses, and indeed led the entire assignments. In Figure 4 of the OGC Guide it would appear as the 2nd Tier supplier, working with the Prime Contractor in the same diagram, but available to the client for direct intervention for the Stage 1 assignment.
For the much smaller Stage 2 Quest4 services were procured directly with no competitive tender, which was unusual, but considered appropriate in the light of the team’s proven commitment and expertise. It was in any case at a buying level (sub-OJEU) that appeared to be uneconomic for larger firms. Quest4 compiled and led a small team of SMEs. The roles in this case are represented by Figure 5 of the OGC Guide, where Quest4 was the Prime contractor working with other small businesses in a transparent model.
Thus in both Stages Quest4 compiled and led teams of SMEs that provided specialist subject matter expertise on information management, IT architectures, vendor due diligence, business cases, and the business change facilitation, project management and related services needed at the delivery node to keep the project on track. The supply chain structure also enabled the client to combine multiple small businesses on a change management team in a unified way, without having to manage (as in Figure 1 of the OGC Guide) multiple individual small business contracts, or supply chain and vendor relations.
The project was highly successful. Quest4 was described by the Client Side Project Board Executives and key steering group members as fundamental to the success of the project (Stages 1 and 2), returning it to an even keel despite major challenges. Quest4’s work (undertaken throughout the projects) also verified savings, relative to the previous structures, of the order of £500,000 (present value) more than originally predicted.
Quest4 stress some important aspects of the procurement mechanism:
o Access to the key procurement and business managers for initial discussions was central to the decision to submit a tender; this was conducted in a constructive, open-minded and non-adversarial spirit;
o The client has robust and formal procurement processes, which are however coupled with a willingness to procure directly from small businesses to achieve good value and innovation in product and service delivery;
o The client is comfortable with primes and small businesses teaming and this project pioneered a particularly useful level of transparency, which enabled the client’s business users to access key consultants directly, within a coherent reporting and stakeholder management process.
o These aspects were addressed in written communications during the ITT process and the proposed partnering/supply chain suggestion was positively received by the client, enabling the bid to be submitted very quickly.
61
� )LQDO�5HSRUW�
The extra cost to the client of accepting a small enterprise as a serious bidder in this case was probably initially about 8-10 person hours of collaborative effort (i.e. one meeting during the evaluation of the ITTs). This meeting reviewed the material submitted, explaining the partnering, supply chain and delivery models. This is a small figure for a contract valued at about £500,000, which was in danger of being behind schedule - for a programme that was to initiate savings approaching £600,000 per annum, combined with increased efficiencies.
Procurement from a small business in this case delivered nearly all of the benefits which may be achieved by such procurement, namely greater competition, lower cost, innovation, responsiveness, flexibility, quality of service, and specialism. It also illustrates a case where the small business, working with a large prime, in the words of the procurer, “outperformed ‘Goliath’ and showed considerable integrity in doing so.”
Contact: Richard Max-Lino Telephone: 077 4043 5498 Email: [email protected] http://www.quest4.co.uk
Case Study 4 arose from a discussion in the margins of an OGC training strategy meeting in December 2004, when a local authority official who had previously been working for IDeA (the Improvement and Development Agency for Local Government) mentioned that they had let a major IT contract to a small firm, in preference to larger competitors, and had taken some special measures to protect themselves against risk. This eventually led via another authority to the managing director of the company, who took the lead in drafting the study – duly cleared with a procurer.
The case has some distinctive features. As described below, this is a PPP (Public-Private Partnership) as opposed to a conventional procurement. The company’s shareholders invested several £million and the company itself contracts with local authorities (including bodies such as police authorities) for use of the system. Another distinctive feature is the steps taken by IDeA to protect themselves, and users of the system, against the perceived risks of EGS being a small business, in particular the use of escrow.54
Escrow being the process of giving something to a third party, usually an escrow agent, to be delivered or transferred after certain conditions have been met.
62
54

� )LQDO�5HSRUW�
CASE STUDY 4: DESIGN AND IMPLEMENTATION OF IDeA:MARKETPLACE
This case illustrates many of the benefits that can be associated with procurement from smaller rather than larger suppliers, in terms of cost, innovation, specialist skills and experience, responsiveness and flexibility. It also illustrates how flexibility by the public sector in procurement practice can make it possible to reap these benefits.
In early 2002 the Improvement and Development Agency for Local Authorities (IDeA), set up IDeA:marketplace, a PPP between the IDeA and E-Government Solutions Ltd (EGS). At the time, a core mission of the IDeA, a body owned by the Local Government Association and funded by the ODPM, was to facilitate the development of national infrastructure solutions that could be readily adopted by local authorities. IDeA:marketplace was designed as a comprehensive e-trading environment, or eHub, for local government that would support Councils in meeting their e-government targets and in achieving cost savings.
At the time of contract award EGS was a company of about 20 staff, specialising in building and delivering internet-based IT solutions for the public sector. EGS won the IDeA:marketplace PPP in competition with major national and multinational companies.
The PPP, which is a twelve-year arrangement, has been a major success. IDeA:marketplace is the largest public sector e-marketplace and trading hub, currently serving close to 50 public sector buying organisations and providing electronic access to over 10,000 suppliers to the public sector, the majority of which are themselves SMEs. The solution provides local authority buyers with electronic procurement and purchasing tools, and enables suppliers to receive orders and invoice electronically. The solution also connects electronically with other marketplaces such as the OGCbuying.solutions website that holds publicly tendered national contracts with over 600 suppliers.
Under the PPP, the IDeA initially took responsibility for the marketing of the solution to local authorities, while EGS took responsibility for the development and operation of the technical solution and its implementation with Councils and their supplier base. As the initiative is now mature, IDeA has handed over marketing responsibilities to EGS who is now responsible to IDeA and the Local Authority customer base for delivery of the end-to-end service.
EGS, with the support of its venture capital shareholders, has invested several million pounds in the development and roll out of the solution. The solution itself is based on an e-marketplace application developed in the US for NASA and available to EGS to market in Europe through a licensing arrangement with NIC Inc, a niche US e-government company that is also a minority shareholder in EGS. Revenues for the service are charged to local authority customers through subscription fees that relate to an authority’s size. After some three years of operation, the IDeA:marketplace has reached breakeven in that revenues now cover direct operating costs. It is anticipated that the revenues to EGS from IDeA:marketplace and related services will amount to some £5 million per year. Once the initial investment by EGS is recovered, surplus profits are required to be reinvested in IDeA:marketplace to the benefit of local authority users.
The competition for IDeA:marketplace was run in accordance with EU procurement arrangements and was subject to open tender. 50 companies formed 16 consortia to bid to partner IDeA on this venture and EGS was short-listed together with a number of major IT and systems integration companies, including Cap Gemini, BT and Oracle. The decision to award the contract to EGS was based on a best and final offer submitted in competition with MacDonald Detwieler, a Canadian IT company and Hays, a FTSE 100 company at the time.
The decision to award such an important contract to an SME was based on a number of key considerations and required the IDeA to take a carefully balanced judgement over the risks involved and the extent to which such risks could be mitigated.
The IDeA’s view at the time of awarding the PPP contract, and confirmed by experience, was that the EGS proposal offered a number of advantages over those of other competitors. In particular:
��The core software application was also, at the time, supported by NIC Inc in the US;
63

� )LQDO�5HSRUW�
��The e-marketplace software and, equally importantly, the business model, had a track record in the public sector in the USA, including a major implementation for local authorities in the State of Texas. As part of the evaluation process, IDeA took references from US public sector users of the solution;
��EGS’s senior management team had substantial experience of working for the public sector in the UK; working for major companies serving the public sector in the UK; and leading major IT projects and leading major e-procurement projects;
��The pricing and commercial terms offered by EGS were extremely attractive.
In negotiating the contract with EGS, it was also important for IDeA that key risks were addressed:
��It was important that EGS was able to demonstrate to the satisfaction of the IDeA that, although it was a small business, it had shareholders who were prepared to make the necessary investments to achieve the IDeA:marketplace business objectives. This commitment was secured through shareholder guarantees in the contract. Also a joint business plan was produced and included in the contract that identified the level and timing of investment required to deliver the solution and to reach breakeven;
��As EGS was small, there was a proportionately larger risk that the company might fail. Apart from seeking shareholder guarantees, the contract required that the code for the core solution was put in escrow; so that the IDeA had full step in rights to operate the business in the event of EGS’s failure. A cash sum, to enable IDeA to manage the business for an intermediate period with no financial exposure, was also put in escrow.
To provide comfort to local authorities during the initial roll out to early adopters, IDeA signed the initial delivery contracts, backing off performance risk to EGS. Subsequent contracts with local authorities were signed jointly by both IDeA and EGS. Now the project has reached maturity, it has been agreed that EGS will be the sole signatory of contracts with local authorities. However, IDeA still maintains ultimate step in rights in the event of a major breach of contract.
Contact: Ian Busby: [email protected]; telephone: 020 7539 2828; mobile: 07747 048 115; fax: 020 7539 2829 www.egsgroup.com
Another case of IT procurement, this time by central government, was the Treasury’s automation of its Invest to Save Budget. This is the first of several cases which were provided through Intellect. Case Study 5 records the procurer’s strong endorsement of strengths of a very small business, relative to large competitors, with no offsetting disadvantages beyond the possible risk to the procurer of relying upon a small supplier.
64

� )LQDO�5HSRUW�
CASE STUDY 5: DESIGN AND IMPLEMENTATION OF A PROJECT MANAGEMENT SYSTEM
This project is an example of procurement from a small business increasing competition, with the supplier demonstrating specialism and exceptional quality of service, notably in speed of response and flexibility.
The Invest to Save Budget (ISB) is a joint Treasury/ Cabinet Office initiative, to provide pump priming support for innovative ways of delivering public services, especially where these increase joint working between different public bodies. Initially, financial monitoring progress reports were submitted twice a year on a template downloaded from the ISB website, sent to central government department for approval and then forwarded to the ISB Unit. As the programme grew to over three hundred projects the administrative burden of this process, including the costs of retrieving information to respond to the many PQs on the programme, was becoming overwhelming. It was also inflexible in that, for example, only ISB central staff, not individual ISB project managers, had access to projects on the database for updates and reporting, and it allowed only limited scope for disseminating lessons learnt.
In 2002 HM Treasury, following normal procedures for contracts below the OJEU limit, invited a number of companies to tender to develop and implement an automated system that would overcome these problems. EGA Limited was included because they had supplied the previous system to the ISB, following an invitation to participate in a competitive tender under an earlier framework agreement. The other two companies who bid were large companies. There was some concern within HM Treasury when EGA’s tender came in at a significantly lower cost than the other bidders’. EGA tendered on the basis of a total cost of around £65,000 – as compared with approximately £150,000 and £500,0000 from their competitors. HM Treasury went back to earlier work completed by EGA to see if they had delivered quality timely products: it appeared that they had – and had undercut competitors by this margin on more than one occasion previously (including the contract for the initial ISB website). EGA were called in for a further interview – it was agreed that no cost or time overruns (unless the latter were caused by Government) would be allowed under the contract – something that EGA readily agreed to.
EGA, founded in 1990 and incorporated in 1992, has 7 full time employees. The Company specialises in tools and applications for Knowledge Management, Productivity, Workflow and Collaboration. About 50 per cent of its work is for the public sector in the UK. It also supplies systems to major world companies, nationally and internationally; backed up comprehensive support, training and consulting services. The Company is a Microsoft Certified Partner.
The new ISB project management system retains the previous functionality of a central database with access through a web browser, now extending access beyond the ISB team and HM Treasury to user project managers. In addition to updating, it allows vetting, editing and approval of project documentation (work flow and content management), before publication on the publicly accessible ISB website. The system is used by every public body or NGO, national and local, with ISB funded projects. As each body previously had its own systems for handling these project, they all benefit from the automated process. A number of departments, when they had started using the application, asked Treasury to explain the technology to help inform them on similar systems they might be considering.
The project, with a project team of 3 EGA staff and a timescale of 10 weeks, fully met the Treasury specifications. The Treasury welcomed in particular the very good one-to-one relationships, and the instant feedback achieved between itself as the client and the project team, with immediate solutions. This was they believe enhanced by the absence of administrative layers and the personal dedication of the project team.
65
� )LQDO�5HSRUW�
HM Treasury also welcomed the continuity provided by working with EGA – some EGA staff have worked on ISB projects since its inception – something that cannot be said of any member of staff currently in the ISB Unit. HM Treasury staff also felt that whilst EGA, like any company, were committed to making a profit there was also a commitment to public service. EGA would adapt tools and procedures from other projects they had completed for private sector clients, rather than starting from scratch, and would pass on these savings directly to HM Treasury.
Contact: Terry Williams: [email protected]; tel: 01920 860130 EGA Limited, Watton House, Watton Road, Ware, Hertfordshire, SG12 0AE www.ega.co.uk
Case Study 6 moves away from IT, to public service policy evaluation. This case was referred to us by Teresa Graham, Deputy Chair of the Better Regulation Task Force.55
Matrix is larger than the enterprises described in the previous case studies and the client in this case described dealing with them as not being like dealing with a small firm, as they provide support in depth and there is always someone to hand to deal with any issues. However the Company in its own estimation, and in our view, shows the key characteristics of flexibility and exceptional commitment that typify the small firms in our case studies.
CASE STUDY 6: POLICY EVALUATION
This is a case in which procurement from a small to medium size business illustrates almost all of the characteristics that can be associated with procuring from smaller businesses, namely more competition, better value for a given cost, innovation, responsiveness, flexibility and specialism – in this case in the field of civil justice.
In 2003, Matrix Research & Consultancy Limited (Matrix) were commissioned by the Department of Constitutional Affairs (DCA), to undertake a Review of the Community Legal Service (CLS). The CLS was launched in April 2000 as a major policy initiative to improve people’s access to legal advice and guidance in social welfare categories of law. The Review was to assess the impact of the CLS and examine differences in the levels of effectiveness of individual Community Legal Service Partnerships (CLSP) following three years of active operation. The project value was approximately £140k, which rose to just over £150k as a result of variation orders.
Matrix is a mature SME, established initially as a partnership and incorporated in 2001. It provides evidence-based policy analysis services to a range of national and local public sector clients, with an emphasis on quality and independence. Most of its work relates to the health, criminal justice and local government sectors. The Company has a turnover of approximately £4m pa, employing some 60 permanent full time staff, with numerous associate relationships with more specialist academic and private sector partners.
The CLS Review had a political profile. Its conclusions challenged whether some of the key objectives of the policy initiative had been achieved (e.g. greater support for those at risk of social exclusion) and recommended change in a number of areas. The final report was supported by a ministerial introduction, was widely reported in the national and specialist press, and was the subject of several Parliamentary debates. The Review also provided the basis for a wide consultation on ways in which the CLS could be improved.
55 Teresa Graham is also, among many other responsibilities, Non-Executive Chair of Matrix Research & Consultancy Limited.
66

� )LQDO�5HSRUW�
Following the Review, the Department commissioned further studies from Matrix in related areas.
The standard OJEU procurement process began with a call for expressions of interest. Several potential suppliers were subsequently invited to submit fully costed proposals and invited to a briefing session. Written questions were taken from the short listed bidders and written responses were provided to all bidders. Following the submission of full proposals, a short listed bidders were invited to deliver a presentation. Matrix was designated as preferred provider, and a contract was awarded after a series of post tender negotiations. The process began in April 2003 and work on the project commenced some four months later, in August 2003.
The cost to Matrix of the procurement process was some £15k. It is likely that the costs to the DCA were also considerable. It is hard however to assess the extent to which, if at all, this could have been reduced without loss of value for money. Whilst the contract value required the OJEU process, other government departments sometimes find ways around the process (e.g. splitting the project up into smaller bite size chunks and/or using framework agreements) perhaps sometimes with little loss of competitive pressure. On the other hand such short cuts reduce the number of invitations to tender for work, and reduce the opportunities available to companies like Matrix.
Although Matrix had undertaken a considerable amount of work in the areas of criminal justice, they had not previously worked for the DCA. They expect to pick up appropriate projects when they are nationally advertised, but this is considerably more difficult when they are not. By commissioning Matrix through this open process, DCA almost certainly in this case increased the range of potential suppliers, and hence competition on price and quality.
The most likely alternative choice for the DCA for this project would probably have been a much larger consultancy. An academic team was another possibility, but academic sources were seen by the Department as being of high quality but less appropriate for projects to be delivered within a tight time schedule.
Matrix believe that their unit costs are considerably lower than those of large consultancies who operate in the public sector arena, and that while its daily rates are higher than those of academics, they may be comparable when a university overhead is added. They note that a public consultancy project often has a predetermined budget ceiling, so that lower rates will translate mainly into more days. This they believe contributes to a quality of their output comparable with academic departments and higher than that generally provided by the larger consultancies. Its relatively small size and specific focus also facilitates a rewarding working environment for people who, whilst preferring not to work in the public sector and/or academia, have a passion for improving public service provision.
During the procurement process Matrix formed a consortium with two professorial academic partners, both of whom had expressed an interest in undertaking this study. The inclusion of these partners, besides widening the knowledge and evidence base, enabled the Review to tap directly into some of the criticisms that had been aimed at the CLS.
The total cost, while a factor, was not major determinant in the DCA’s choice between bidders in this case. The main determinants were quality, including creativity, of the proposed approach and confidence that it could be delivered. For reassurance on delivery the DCA checked the experiences of other Departments.
After Matrix was awarded preferred provider status, the DCA wished to revise the project brief, partly because it was starting rather later than planned. This was accommodated by involving more (and a different mix of) Matrix staff and changing the number of case studies. Matrix also offered a number of optional research modules as part of this study. Whilst the DCA chose not to commission these, it was apparent early on that a Matrix proposal to make use of focus groups of CLS users was considered by the project steering group to be important. Focus groups were incorporated into the project’s specification as a variation order.
67

� )LQDO�5HSRUW�
During the course of the project Matrix faced several challenges, including undertaking two surveys relating to the performance of CLSPs rather than the proposed single survey, as it was understood early on in the project that two different respondents groups would need to be surveyed to establish the level of insight required; but in close consultation with the DCA these were handled without a major impact on the overall project cost. The DCA found the Company easy to work with and flexible to new ideas and requirements, and they were pleased with the range and depth of work that was covered in the time available.
Matrix has in the past been awarded a listing on the Inner City 100 index (sponsored by HM Treasury) as one of the fastest growing businesses located in a deprived inner city area. While not a factor which would be material to a procurement decision of this kind, this enhancement of a deprived area is a benefit which may be more often associated with a smaller firm than a high status national supplier.
Contact: Andrew Richman, [email protected]; tel: 020 7684 5777; fax: 020 7684 5776 Matrix Research and Consultancy Ltd, Epworth House, 25 City Road, London, EC1Y 1AA www.matrixrcl.co.uk
Case Study 7 also followed, indirectly, from a reference by Teresa Graham, to a consultant acquaintance who referred us to two others, of which one, Redwaters, met our criteria and kindly agreed, with the procurer, to contribute. This case describes a market in which small businesses are dominant; indeed the incumbent who was replaced was itself an SME. However we include it because it illustrates such a striking success, and illustrates several characteristics, in this case especially commitment, high level experience, specialist skills and imagination, which we have found to be associated with professional small businesses.
CASE STUDY 7: MARKETING AND ROLL OUT OF A BEST PRACTICE PROGRAMME
This is an example of a small business, drawing on the previous experience of leading individuals, being able to provide a level of innovation which exceeds that normally available from the mainstream market, combined with the special personal commitment and service which is often associated with such businesses.
In early 2002 the DTI’s Small Business Service (SBS) invited several companies to bid for the publicity, marketing and distribution of the Agency’s CCOONNNNEECCTT programme - a series of interactive award-winning best practice programmes on CD-ROM, made up from ‘real life’ case studies, designed to stimulate business to adopt best practice and undertake change.
The tender, valued at some £0.5 million per year for two years, entailed the on-going promotion and development of twenty four modules, for use one-to-one, in-company, in multi-company seminars, or in networks. The programme was designed to be of special value in providing tools for the use of business advisers, mainly, but not exclusively, in the Business Link operator network. The modules, developed with other Whitehall partners covered topics such as business start ups, finance, e-commerce, marketing, partnerships with people, and some sector-specific modules.
68

� )LQDO�5HSRUW�
The SBS received six proposals. Among those invited was Redwaters Limited, a consultancy then of about 6 employees, because the managing director had a previously established reputation as a project management consultant for similar projects for central government.
In considering the award of the contract, competition on cost was not the prime issue, so long as bids were within the SBS’s budget ceiling. The criteria were focused more around quality, building networks, working relationships and confidence in timely and reliable delivery. Redwaters was awarded the contract even though it was a small business that had been established only the previous year. The associated risk was accepted by the SBS because of the superior quality service and commitment underlying the Redwaters bid and the personal commitment and known abilities of the managing director.
The outcome was a striking success. The proportion of the Business Link network using the CCOONNNNEECCTTprogramme increased from 33 per cent to 90 per cent. The number of viewers per year achieved 30,000, against a target of 9,000. As for the impact of the package on companies, a survey of a hundred companies reported average cost reductions of over £200k and turnover increases of over £250k, attributable to CCOONNNNEECCTT..
Redwaters and the SBS attribute the success in marketing the programme in part to the very close collaboration between them in the development strategy. The outcome was a highly customised programme, tailored to the specific needs of business advisers in the Business Link operator network and other intermediaries.
Contact: Richard Adlington: [email protected]; tel: 01782 557878; www.rewaters.net
5.6.3. Four More Examples of Procurement of Non-professional Goods and Services
We now turn, for a while, away from IT and professional services back to other goods and services, with three cases referred to us by the NHS Purchasing and Supply Agency (NHS PASA) and one obtained as a result of approaching the Haringey SME Procurement Pilot.
First, in Case Study 8, is a procurement from what was then a very new small business, established however by managers with previous senior experience in the industry and known to PASA. Customised trailers are a specialised market with no very large suppliers, but Bluebird is the smallest and newest and displays the distinctive quality characteristics which recur in these studies.
CASE STUDY 8: TRAILERS FOR MEDICAL SCREENING
This is a case in which a small business, albeit in a specialised market with no very large suppliers, entered a normal OJEU competition, to the considerable benefit of the public sector procurer on cost and quality, supported by very good working relationships. Especially conspicuous, of the characteristics which tend to be associated with small businesses, is the supplier’s exceptional flexibility and initiative in respect of design and of timing, to fit the customer’s specific needs.
In 2004, NHS Purchasing and Supply Agency (NHS PASA), working with the Health Protection Agency (HPA), tendered for a vehicle and equipment for screening of high risk groups at homeless hostels and prisons for tuberculosis. The procurement was for one unit in London, but with the possibility of subsequent national roll out if successful. The equipment, supplied by Philips Medical Systems, is a digital chest x-ray unit, with the images stored to an NHS archive.
The unit is expected to screen 300 people per day and to help to reduce cases (the latest annual figure for NHS diagnoses being over 6,500). It is expected that this unit will work with the chest screening programme at Heathrow airport.
69

� )LQDO�5HSRUW�
The specialised trailer market in the UK has a limited number of suppliers. However following an advertisement in OJEU six expressions of interest were received - one from continental Europe. After negotiation on the specification, invitations to tender were issued to two smaller and two larger companies and offers were received from them all. The capital value of the contract was in the broad region of £100,000.
The contract was awarded to Bluebird Vehicles Ltd (then trading as Trailertech Services Ltd), for the following main reasons.
��They offered the lowest price;
��They made the most effort to consider the workflow of the radiographers and the flow of people through the vehicle and develop innovative design proposals to maximise use;
��They were one of only two bidders able to meet the preferred tight delivery schedule, in part because of initiative in seeking sources for the chassis and the cab;
��They were specialists in vehicle conversions, and had a flexible approach.
The Company was established as Trailertech in 2003, the two Directors having experience of working for other vehicle companies. The Company is a manufacturer and is also an agent for the Dutch Company Lamboo. Lamboo are a long established and relatively large supplier, who can provide very high specification vehicles, such as are required for some medical applications. To develop the capacity to provide such extreme high-specification vehicles for the UK market alone would not be cost effective, but the Company contracted in early 2004 to supply an Acute NHS Trust with such a vehicle, manufactured by Lamboo and serviced by Bluebird.
Bluebird Vehicles now has a workforce of about 40 people based near Scarborough. Their premises had previously been used by a vehicle manufacturer for the US market and 17 of the staff previously employed there have transferred to Bluebird. The premises are spacious and the Company has plans for expansion.
PASA and the HPA have found Bluebird to be “a friendly and professional company to deal with”, with the Company keeping them informed on progress of the manufacture and giving suggestions for improvement.
Contact: Rob Miller:[email protected]; tel: 01723 8608i7; mobile: 07802 456 196; fax: 01723 585235. Bluebird Vehicles Ltd, Unit 7, Plaxton Park, Cayton Low Road, Eastfield, Scarborough, North Yorks, YO11 3BY bluebirdvehicles.com
70

� )LQDO�5HSRUW�
A very different field of NHS procurement is that of temporary ancillary staff. Case Study 9 presents a case where many small and some large businesses compete, in a very dense market of relatively small procurements by NHS Trusts.
CASE STUDY 9: TEMPORARY ANCILLARY STAFF
This case illustrates how broadening the market, in this instance at little cost to the procurer, can achieve both very significant, continuing cost savings and improvements in quality.
For the National Health Service in England, NHS PASA has produced national framework agreements with suppliers for staff to fill temporary vacancies. NHS Trusts are not obliged to use these suppliers, but they are widely used as they eliminate the local transactions costs of ensuring the quality of the temporary staff and determining price at each booking.
One framework agreement is for the supply of various categories of temporary ancillary staff, covering catering, driving, maintenance, security, domestic services, stores and portering. This framework has been let for a period of three years, with the potential for a further one year extension. It was tendered during 2004 and began in September that year. PASA decided at that time to create a national specification to provide a more level playing field between national and smaller, local suppliers. They also allowed bids from smaller suppliers to supply only certain regions, or even only certain named Trusts.
The advertisement for expressions of interest was widely disseminated, including advertisements in journals likely to be accessed by smaller suppliers, and 144 expressions of interest were received. Following a pre-qualification questionnaire, which reduced the number of potential tenderers, the subsequent bidding process was fairly complex, involving some six or seven documents, with 66 pages of conditions defining the contract. However PASA gave firms guidance on these where this was requested, specifically in the form of a supplier conference where a walk-through of the documents took place with subsequent clarifications where requested. Throughout the pre-qualification questionnaire and tender process, there were no criteria concerning business size.
The framework agreement was awarded to 33 staffing agencies. Of these several are High Street names, but 22 are SMEs. Many of these SMEs are reaching significantly bigger audiences than before. Revenues from the NHS are increasing and they are providing services to many totally new clients.
PASA records many advantages to the NHS from this widening of the supplier base. The large national companies are still major players in the supply of these services to the NHS, but the wider entry of SMEs has increased competition. Prices have fallen by over 15 per cent on average and up to twice that in some local markets. The NHS Trusts also report that smaller, local firms tend to provide a more personalised service, being more often willing to “go the extra mile” to meet urgent or special staff requirements, and sometimes having more local knowledge than a national supplier. Trusts also say that it reflects well on them that they are utilising local businesses.
71

� )LQDO�5HSRUW�
Lying between the specialised, high value market of trailers for medical equipment and the intensely used, lower value market for ancillary staff, although closer to the latter, is the NHS market for fire fighting equipment. Here again NHS PASA has taken steps to involve more small suppliers, although in this market more effort has been needed to help smaller businesses to adapt to the size and complexity of the NHS.
CASE STUDY 10: FIRE FIGHTING EQUIPMENT
This is a case in which small businesses have been encouraged into an NHS market previously dominated by a single firm. This has required considerable effort by the procurer, initially in attracting SME bidders and then in helping to handle the teething problems which are likely to arise when bringing new firms into such a large and complex market. However the outcome is lower costs with no long term loss of quality.
The market for the supply and maintenance of fire fighting equipment was dominated by one large firm prior to 1999. The Estates team of the NHS Purchasing and Supply Agency (NHS PASA) decided to stimulate competition in the market via a framework agreement, which saw the entry into the market of Cotswold Fire Fighters Ltd, and Walker Fire UK, both of which are small firms, with respectively around 35 and 65 employees. The contract, tendered through OJEU, was renewed in 2003, with some extension of the services offered. This tender, which extends to August 2008 with a possible two year extension, saw the inclusion of another SME, UK Fire International Ltd, with about 75 employees.
The major company in this market is Chubb, which has around 300 service engineers and offers a full range of services.
The framework contract does not guarantee the chosen firms business. Indeed at present only just over a third of NHS organisations use this contract and a study is being made into why this figure is not higher. However the contract is designed for the Trusts’ needs. Prices for generic services are set within the framework, with any other services being separately negotiated by the Trust. The current NHS market share (by value, within the framework contract, which was previously more than 95 per cent with Chubb) is Chubb 48%, Cotswold 33%, Walker 13% and UK Fire 6%, with a total annual contract value of around £1 million.
Broadening the market has increased competition. PASA believe that costs to the NHS have been reduced by about 10 percent for core services such as maintenance of fire extinguishers. NHS Trusts who contracted out to UK Fire prior to 2003 have made substantial cost savings, as the firm’s introduction into the framework saw it reduce its prices by 60 percent.
The substantial entry of smaller companies into the market raises teething problems, as the scale and diversity of needs of the NHS presents a steep learning curve to new suppliers. Becoming familiar with the layout and workings of different Trusts takes time and involves the Trusts themselves taking responsibility for assisting the new firms become more efficient. However these problems represent a process that any new firm would have to go through, be it large or small. Such problems are handled both as they arise and at quarterly contract management reviews.
The smaller companies do not offer the full range of services offered by Chubb. This means that, depending on the needs of individual Trusts, it is sometimes most cost effective to contract with more than one firm, in which case higher transactions cost may partly offset the saving in contract values. Contract awards are however the individual Trust’s decision and data on transactions costs are not held by PASA.
The single large firm now commands a smaller market share and may have lost some economies of scale. However PASA believes that the overall efficiency of the market, and incentives for continuing efficiency gains, have usefully increased.
72

� )LQDO�5HSRUW�
We now turn, in Case Study 11, to a case referred to us by Haringey Council, where we were helped by Liz Holford, Procurement Development Manager of Haringey Council, whom we approached in the context of the Haringey Pilot. This case illustrates an SME, led by managers with previous, closely relevant, large organisation experience, which has developed a strong market position by work on preparing for increasing environmental regulation.
CASE STUDY 11: ABANDONED VEHICLE DISPOSAL
This case illustrates how a small business can provide not only best value for money in delivery and close working relationships, but also exceptional skill in anticipating public sector demands. The small business supplier is ahead of much bigger companies in achieving End of Life Vehicle environmental standards and so offering a complete vehicle disposal package.
Redcorn Ltd was established in 1992 in Tottenham, north London. It specialises in the removal of abandoned vehicles, mainly under contract to local authorities.56 This is now an environmentally demanding service, entailing transport to the Company’s yard, de-pollution in specialist bays, compression of the metal carcass, and collection or recycling of materials by specialist partner-suppliers.
One current client is the Company’s own local Council, Haringey, which in 2003 tendered for a new contract for this service. This was a large contract, of several hundred £’000 over a period of years. It differs from previous, smaller, ad hoc contracts, mainly because of new European regulations, then about to become effective, imposing strict requirements on vehicle disposal. Following expressions of interest, Haringey received bids from Redcorn, which at that time had about 20 employees, and from two other companies.
The contract was awarded to Redcorn in part because they offered the lowest price. They also however submitted the only bid which the Council considered to demonstrate satisfactorily that the End of Life Vehicle Act (2003) standards would be met. The Company also showed an especially good understanding of Haringey’s specific problems and needs. The Council also welcomes the fact that the Company is in its own Borough.
The Council has been very satisfied with the subsequent contract delivery, which has contributed to a complimentary Audit Commission Best Value inspection report. They attribute this success to, among other factors, good communication with top management.
The Company has since doubled in size and now contracts for fifteen local authorities, including six in and around London, and disposes of a total of 40,000 vehicles per year.
Factors on which the Company’s expansion have been built include tendering skills, with care to demonstrate quality as well a price; competitive pricing; development of reputation, with a growing client list and willingness of existing customers to recommend them; local authority background experience in the top management team; and, crucially, an investment of much time and effort in becoming the first London company to achieve Environment Agency accreditation for end of life vehicle disposal. Its London competitors, including the large company NCP, remove vehicles to send to another contractor to be de-polluted.
Contact: Tim Troon: [email protected]; tel: 020 8365 9591; fax: 020 8885 2156 Redcorn Limited, 44 White Hart Lane, Tottenham, London, N17 8DP www.redcorn.co.uk
REDCORN LTD E.L.V & Abandoned Vehicle Specialist
56 Much of the smaller private sector market for this service is provided ad hoc without formal contracts.
73

� )LQDO�5HSRUW�
5.6.4. Four cases with sustainability objectives
We now turn to three cases developed from case studies of the New Economics Foundation, followed by one of central government procurement from a social enterprise.
The first two relate to food procurement, Case Study 12 being by the NHS in Cornwall (a widely quoted case, to which NHS PASA also referred us) and Case Study 13 by Northumberland County Council. Case Study 14 is more complex and describes action by Sheffield Housing to develop the local Council’s policy of using its housing development programme as an instrument for driving social inclusion policies. The outcomes in these three cases we believe are commendable, and just reward for the considerable efforts of the officials concerned. They merit inclusion in this compendium of case studies because they illustrate some sound value for money benefits from seeking potential smaller suppliers.
We do however, as discussed above, see a case for deeper analysis of some of the policy drivers of the food procurement programmes. The Cornwall Healthcare Community, as do NHS PASA, give strong weight to the impact on the local economy and to the reduction in food miles (see section 4.8.3) achieved by local procurement.57 The local dimension is also a politically very important aspect of the Northumberland policy. These cases contrast with that of Sheffield in that, so far as we understand, only the Sheffield initiative aims at improving supply side efficiency by targeted measures such as bringing the long term unemployed back into the market.58
CASE STUDY 12: FOOD FOR NHS TRUSTS
The Cornwall Healthcare Community (CHC) is a consortium of five NHS Trusts. In 2001 the CHC developed the Cornwall Food Programme (CFP), with the dual objectives of improving food quality and involving local producers more closely in direct supply to the NHS. Measures subsequently taken include the development of local supply from SMEs in four markets – ice cream, cheese, yoghurt and fish. (All of these contracts are below the OJEU limit.)
The CHC explain that the issue of procuring from local suppliers, for sustainability objectives, “is the backbone of our work and project motivation”.
The CFP investigated the potential for local supply of higher quality ice cream. Initially no potentially competitive suppliers appeared to emerge, but on further discussion they identified with one small enterprise, Callestick Farm, means of reducing costs. The quality specification was duly changed, when the contract was due for tendering, to put more value on the qualities such as taste, nutritional value, recyclable packaging and rate of melting. (The last was important because the previous supply, which contained a considerable amount of air, often largely melted by the time it had reached the end of its delivery to patients on the wards.) When this was advertised no national supplier chose to bid.
57 Local economic and social impacts and the reduction of carbon dioxide emissions are the only two impacts mentioned in the Sustainable Development Commission’s short case study on Cornwall NHS food procurement.
58 Supply side efficiency gains may of course be achieved by measures such as smoothing the annual flow of work in what is otherwise a seasonal, tourist driven demand, but effects of this kind should be reflected in tender prices, and thus not counted as extra, external benefits.
74

� )LQDO�5HSRUW�
The contract is now with Callestick Farm and the CFP stress the “enormous flexibility” which this brings, with the ability to work with the supplier on issues such as customised packaging and portion sizes, which had not previously been feasible. Comparative costs are difficult to establish precisely. The current supply has for example a much higher nutritional value and portion sizes are slightly larger. However costs are fairly close to the previous supply per unit of weight and very clearly lower per unit of nutrition.
When the contract is retendered there are other suppliers who, following the Callestick Farm contract, are now interested and are expected to provide a local competitive market.
The CFP’s interest in local procurement led them to discussion with Cornish Country Larder, a cheese producer and a medium size business, with two sites each of about 50 employees. This led to a realisation that the CFP and the Company could both benefit from procurement by the NHS of cheese that is slightly outside the tight specifications demanded by supermarkets, to whom most of Country Larder’s output is marketed. Cornish Country Larder was able to tender slightly lower prices than the national supplier. CFP also enjoy other benefits of a greater diversity of product, and the potential to discuss other customised developments with the supplier. Experiments are now being conducted with the use of whey butter, which is a by-product of the cheese manufacture.
Local procurement of yoghurt arose initially from networking with local businesses. The current outcome is the supply by an SME of a product of better taste and lower cost per portion than that the previous supplied by a national supplier through a local wholesaler.
Local supplies of fish were examined proactively, given the local fishing industry, and again the current outcome is supplied at lower cost and with higher quality.
Directing contracts to local business in Cornwall also has the particular benefit of helping to smooth out the seasonal peak demands of tourism. The quality improvements also bring a significant benefit in terms of increasing hospital patients' enjoyment of their mealtimes.
They illustrate marked improvement in value for money at the point of procurement, in terms of product price and quality and from other benefits often provided by SMEs such as flexibility and one-to-one communication on service and product development. These have been achieved, of course, only with some considerable, continuing effort and commitment of the CFP staff, but the CHC is satisfied that this policy implementation activity is well worthwhile.
In the Northumberland case, Case Study 13, the main driving force was a concern to increase local procurement, although this led to imaginative measures to reach out to new suppliers, including small suppliers. The Council also explain that e-business developments, such as self billing modules to reduce invoicing costs, are helping to reduce or eliminate some costs that would previously have been associated with procuring from more suppliers.
75

� )LQDO�5HSRUW�
CASE STUDY 13: FOOD FOR SCHOOLS AND CARE FACILITIES
In the spring of 2004 Northumberland County Council’s food supply contracts of about £3 million per year came up for renewal. The contracts are to supply over two hundred schools and a range of social services, residential and day care establishments and civic catering. It was decided by the Procurement, Regeneration and Catering departments of the County Council to generate market interest and seek to broaden the supplier base for food supply by reaching out to small and local suppliers.
About half of the Council’s food procurement, more than previously, is now from local firms. This includes a contract for bread for which no formal contract had previously existed.
Several measures were taken.
��The Council encouraged many second tier suppliers to achieve approved supplier status by expressing an interest in the tender and completing the required documentation.
��Procurement department liaison with Regional Business Link and the umbrella food supplier organisation Northumbria Larder provided the opportunity for those organisations to advise and help businesses to put tenders together and complete required tender documentation.
��The Council split the contract into lots, allowing businesses to bid for any combination of seven food categories and, for the majority of categories, four geographic areas of the County.
��The tender evaluation criteria were revised to put more weight than before on quality relative to unit price, with a scoring system that allocated a maximum of 60 points to quality factors and 40 points to cost factors. The quality factors included (with a maximum score of 8 points) “ability to assist Catering Services in pursuing a sustainable food procurement strategy”, which requested details of how the supplier “would work in partnership with [the Council] to source and supply locally grown or organic produce”.
Following these measures, four of seven food categories (defined by the Council to encourage development of the supply market59) are now supplied by local SMEs and three by national companies. As would be expected, national sources provide better value for money in the supply of standard volume products, such as groceries, frozen food and beverages, where there is little scope for local and specialised foods, whereas small local companies have advantages in supplying fresh products such as fruit and vegetables, bread, milk and meat.
Establishing and maintaining this new regime has required more focused Council resources during the whole tender process. The greater diversity of suppliers also entails some extra continuing administrative costs. However these costs are perceived by the Council and its departments as justified by the greater partnership achieved with local businesses and the benefits of better quality with greater customer satisfaction from schools and care establishments. This reflects local preferences – for examples schools may specify local produce such as Northumbrian Select Beef or Northumbrian Cheese – and is also perceived to assist with regeneration of the local area through local suppliers and local produce.
The total budget for food is now higher, since the policy has moved from lowest price for an acceptable quality to a regime which puts more weight on quality relative to price. However the Council is satisfied that best value is now achieved.
Broadly similar measures are now being applied and considered by the Council to other areas of procurement and currently include building construction and repairs, transport and verge cutting. A new clause has been inserted into the Council’s Construction Partnership Tender: “Under this procurement exercise the Contractor is required to actively participate in the economic and social regeneration of the locality and surrounding the place of delivery for the provision of the service. Accordingly, contract performance conditions may relate in particular to social and environment considerations”.
59 As fruit & vegetables; groceries; frozen foods, dairy produce; bread; meat; and crisps, nuts & snacks.
76

� )LQDO�5HSRUW�
This is an example of implementation by a County Council of a corporate strategy, led by a strategic procurement unit. The initiative is driven largely by concerns to involve local businesses more in Council procurement, but is leading to more competition, higher quality and the probability of more procurement from smaller businesses.
Case Study 14, from Sheffield, is as noted above more complex and is explicitly devoted to local supply side improvement rather than local procurement per se.
CASE STUDY 14: HOUSING DEVELOPMENT AND REGENERATION
This case study involves social enterprises and many small businesses. The work is inspiring and appears to bring important social benefits in reducing social exclusion, albeit at a significant budgetary cost.
Sheffield City Council is working with major construction companies and local social enterprises and other small businesses, to use development of the Council’s housing stock as means of also achieving local regeneration. Managing this programme is an arms-length organisation, Sheffield Homes.
Councils across the UK were in 2004 given funding and targets to implement the Decent Homes Programme, intended to bring all social housing up to ‘decent’ standards. Sheffield City Council responded by setting up Sheffield Homes to oversee the programme, which is now running at about £150 million per year.
For the delivery of large volumes of work, as needed for this programme, only large companies can compete, and normal contracting arrangements provide little or no incentive for such work to contribute significantly to local regeneration. The Council therefore identified five large construction companies to work within a partnership, which could combine their capacity for the delivery of large projects with the permanent improvement of local skills and employment rates. The companies themselves have welcomed this, both as a way of implementing their own corporate social responsibility concerns and as an arrangement, which, through the work of Sheffield Homes, develops local supply chains that ease some serious labour shortages in the industry. The shortage of trades, such as decorators and plumbers, is particularly severe in Sheffield. The key measure required of the companies is that they are all committed to delivering at least 10 per cent of their work through social enterprises, subject to Sheffield Homes negotiating and developing viable supply chains. The main objective of this is to draw people into employment, many of whom would otherwise be excluded from the labour market, although the large companies may also find a more secure source of labour by working with the social enterprises rather than outsourcing every time.
To deliver the local construction labour Sheffield Homes is working with a large number of SMEs and with two or three of a proposed total of five community building social enterprises. These are based in “areas” of around 3 to 4,000 houses, corresponding broadly to the City’s wards. One of these social enterprises is Sheffield Rebuild, a large and now mature enterprise of about 150 people, set up in 1996. This was initially established with the help of considerable Single Regeneration Budget (SRB) funding, although the Council policy was to tie that money firmly to elements such as training and technical advice that were not considered core to the basic service, so enabling the enterprise to compete under Best Value procurement rules. Now the enterprise receives no funding of that kind through the Council, but makes use of Construction Industry Training Board (CITB) and European Social Fund (ESF) sources to fund training.
The total external public funding for training for the whole of the Council’s construction initiative is about £11 million over three years, or a little over 2 per cent of the cost of the building contracts. The training is directed at 14 to 19 year olds, 18 to 24 year olds and the skilled unemployed, with a special focus on more disadvantaged wards. Where people are trained and work is not available within the Council’s housing programme they are helped into private sector building work.
77

� )LQDO�5HSRUW�
Sheffield Homes try to have single tender contracts where possible, justified by assessment against similar past contracts. This is to make it easier to provide the social enterprises with some assured work over a period of years, enabling them to build up confidence and recruit the right people.
The impact of all these provisions on contract prices is currently being examined by Sheffield Homes. There are still cases where local SMEs are overstretched and, as under the previous regime, a premium has to be paid for essential trades, but in some cases costs are brought down by the greater access to local sources of labour. No quantitative measurement has been attempted of the effect on regeneration programmes of integrating them with the housing development programme with regeneration programmes, but the Council have no doubt that this is strongly positive. The cost of operating Sheffield Homes is approximately £25 million per year.
Sheffield Housing report other benefits following from the increase in local skills, reduction in long term unemployment and stronger local involvement in the building programme. These include a better relationship between the Council and its tenants, and a reduction in vandalism.
Case Study 15 is an example of direct procurement by central government from a social enterprise. We were referred to the social enterprise by the SBS Social Enterprise Unit, and Claudine Piggott, of Green-Works, invited several public sector suppliers to respond to our interest. ODPM had recently contracted out such services to the facilities manager MITIE and the MITIE Sustainability Manager responded.
CASE STUDY 15: DISPOSAL OF OFFICE FURNITURE
This is an example of procuring a service from a small enterprise – in this case a social enterprise - to achieve clear environmental and social benefits, and a contribution to the government’s environmental targets.
The Office of the Deputy Prime Minister (ODPM) disposed of its outdated and unwanted office furniture by conventional means, such as the auctioning of some items or, where items could not be sold, disposal as waste. This often proved time consuming and did not always reflect the Department’s environmental objectives.
In 2004 the Office appointed MITIE as its provider of Integrated Facilities Management services. MITIE appointed Zoë Haseman as their Sustainability Manager who proposed that the Department should approach Green-Works, to seek alternative disposal arrangements for redundant and broken office furniture.
Green-Works is a social enterprise which is registered as a charity. Established in 2000, it re-distributes good quality, low cost office furniture from commercial and public sector organisations for sale to non-profit bodies such as schools, charities and community groups, and to start-up businesses. It currently has between 30 and 40 employees. It operates warehouses in partnership with community groups and not-for-profit organisations across the UK; all of whom provide training and employment for disadvantaged, disabled and long term unemployed people.
Furniture in too poor a condition for further use is broken down to be either recycled or used as fuel, ensuring that nothing goes to landfill.
The ODPM pays an annual fee for the Green-Works service, based on number of employees and the amount of furniture likely to be disposed of, and at-cost collection fees.
The direct financial cost to the Office is estimated to be more than traditional options such as landfill (although as landfill tax increases this may change) and the cost of using the sale by auction method. However working with Green-Works reduces the administrative time required to arrange and manage the service.
The service also offers indirect benefits which contribute to wider social aims. It helps the ODPM to meet the cross government waste targets set out in the Framework for Sustainable Development on the Government Estate. These include reducing overall waste arisings and increasing re-use and recycling rates to reduce the incidence of landfill. The Office also recognises the further social benefits of the furniture serving a continuing useful purpose, and its distribution network helping to reduce social exclusion.
78

� )LQDO�5HSRUW�
Several other central government departments, including the Foreign & Commonwealth Office, Customs & Excise, the DTI, the Highways Agency, the Department of Constitutional Affairs, the Home Office and the Department for International Development, also now use this service.
Contact: Claudine Piggott, Communications Manager: [email protected]; tel 0845 230 2231. www.green-works.co.uk
5.6.5. A further range of cases in IT, including sub-contracting
We here present a set of six IT cases, all of which follow from contacts established through Intellect. Each has distinctive features and they illustrate the very wide range of specialist services developing in this market.
Case Study 16 is an example of procurement by a large private sector client. We include it (after discussion with SBS) because we believe that it is closely relevant to the public sector, not least as an example of outsourcing to improve incentives for efficiency.
CASE STUDY 16: OUTSOURCED PURCHASING AND DISTRIBUTION OF PROMOTIONAL MERCHANDISE
This case, in which the procurer is a large private sector company, illustrates the characteristics found in small firms, including those that may have been only very recently formed (if usually, as in this case, by highly experienced founders), of exceptional flexibility to meet the client’s specific needs, combined with the highest standards of profession skills and experience.
In 2004 a global beverages company, a market leader with many of its brands, chose to outsource the purchasing and distribution of all its point of sale promotional merchandise across Europe to a joint venture between two small, specialist companies, 4C Associates and Xoomworks.
As with all companies in its industry, one of the largest areas of spend is in marketing and particularly promotional materials such as branded T-shirts, beer mats, glasses, dartboards etc. distributed to pubs and off-licences. As part of their overall drive to manage costs effectively, the company was focusing on this area of spend. They wanted to leverage the combined spend across all their brands more effectively to drive cost savings from their suppliers. However, they recognised that in doing this there was a danger that the brand teams would simply buy more items because their budgets would go further, frittering away the savings that had been made. The traditional course of cutting budgets to reflect the cost savings would have been demotivating for the marketing teams, so they looked for a more imaginative solution where the savings could be captured centrally without adversely effecting moral.
The organisation concluded that the most effective way to achieve the results they were looking for would be to outsource the management of the procurement of promotional materials, warehousing and logistics to a single company. The outsourcer would work directly with their brand marketing teams and creative agencies to specify, source and supply all the items that the company required.
An ITT was issued in 2004 for a contract worth several million pounds a year and 4C, a leading procurement consultancy, and Xoomworks, a specialist IT consultancy, put forward a joint bid to take on the outsourcing. This was selected in competition with 30 other bidders, both large and small. 4C and Xoomworks are small (£5£10m turnover), although rapidly growing companies, founded in 2000. Both had track records of working with major organisations, advising on opportunities to reduce cost and deploy technology more effectively within procurement and the supply chain, particularly for complex, service purchases.
79

� )LQDO�5HSRUW�
The 4CXoomworks joint venture was chosen because of the combination of specialist skills and willingness to work flexibly, to create both the right operational vehicle and commercial framework. The commercial framework is one in which 4CXoomworks effectively “rebates” money saved to the organisation, allowing the client company a strategic view of how to use this money, rather than viewing it tactically through savings on individual purchases. It also means that marketing budgets have remained constant so that the motivation within these teams remains high. In addition, by providing a single point of contact for all promotional merchandise, 4CXoomworks has been able to improve the consistency of service the marketing teams receive in identifying and sourcing new promotional items to support marketing campaigns (e.g. linked to current sporting events) and in their delivery to the pubs and off-licences. It also provides easy access to innovations that are happening within the industry.
Having chosen 4CXoomworks as its partner, the client company wanted to implement the solution extremely rapidly. Again, the flexibility of 4C and Xoomworks as small organisations facilitated this, with operations being up and running within a few weeks. 4CXoomworks were able to deliver the technology solutions underpinning the service in a matter of weeks and have consistently exceeded the savings objectives of the service since day one.
The client describes this project as 'one of the highlights of our 2004 GB/IoI procurement strategy', and as a result it is now being rolled out to support the company’s businesses across the rest of Europe.
Contact: Richard Cooper at 4C, Brook House, 229-243 Shepherds Bush Road, London W6 7AN; tel: 0208 741 4441
Case Studies 17, 18 and 19 are cases of sub-contracting to an SME by the major IT supplier EDS. EDS, with over 100,000 employees and more than $20 billion turnover, is a leading provider of outsourced IT services to UK government and has been prepared to be very explicit in listing the distinctive strengths of the SME suppliers in these cases, in terms of the qualities noted in the Smaller supplier … better value?60 The cases illustrate the use of specialist sub-contractors in three strikingly different types of IT application.
CASE STUDY 17: IMPROVEMENT OF BUSINESS SYSTEM PERFORMANCE
This case is an example of large prime contractor procuring, from a small to medium size international business, in direct competition with the products of large multinationals, a highly sophisticated product to improve the performance of its own services to UK government bodies.
Crucial to the services provided by EDS, as a leading provider of outsourced business process services to UK government bodies, are tools for business service management. For this purpose highly sophisticated software systems have been developed in a competitive market.
EDS procured in 2002, and upgraded in 2004, a licence for the Proxima Technology product, Centauri�Business Service Manager™ (Centauri), for maintaining and improving its management of UK government IT and business systems. The overall value of the Centauri licence is over £1 million.
Centauri gathers data from existing systems management tools, to produce real-time service performance visualisation and historical reports. It displays the customer’s IT and business systems performance through a web-based dashboard, and shows how their performance affects the UK government’s operation. It is also designed to focus staff support on tasks that improve the quality of IT service delivery, though inherent ‘Six
“Smaller supplier … better value?” Office of Government Commerce and Small Business Service, May 2002.
80
60

� )LQDO�5HSRUW�
Sigma’ techniques. It enables EDS to proactively fix or improve IT services before any detrimental effect. It reduces downtime and improves reliability.
Centauri is developed, owned and maintained by Proxima Technology, a company founded in the UK in 1996, now with 80 employees, its HQ in Denver, Colorado, and offices in the UK (at Windsor), across North America and in Asia-Pacific.
EDS’s first contact with Proxima Technology was via its Australian office in 2001, instigated by a government contract that required suppliers such as EDS to support innovative Australian companies to export their services globally. Proxima Technology has its Research and Development offices located in Sydney and therefore qualified for the EDS Global Partner Solutions program.
As EDS UK were seeking a solution to meet the specific ‘user-minute downtime’ reporting requirement of a UK government client, Proxima Technology was introduced to EDS UK by EDS Australia. Other business system management vendor alternatives were products of well established vendors such as IBM’s Tivoli, BMC Software’s Patrol, Computer Associates’ Unicenter, or in-house products. EDS therefore ran a live trial, pitting Centauri against products from such multi-billion, multinational software companies. The trial in December 2002 was a conspicuous success for Centauri.
Over time, EDS has gained experience of Centauri and further exploited its features. It has since used the product in supporting several of its other largest global customers and entered into a global purchasing agreement with Proxima Technology, to use economies of scale that financially benefit EDS and its clients.
EDS will obtain a return on their investment in Centauri through offering improved and additional services to its clients. It is very unlikely that an SME such as Proxima Technology would be able to supply its product directly to such clients.
EDS finds several advantages of using Proxima Technology rather than a much larger supplier. These include:
��expertise in addressing EDS’s specific needs for complex IT outsourcing engagements;
��speed of implementation;
��adaptability to changing requirements;
��lower total cost of ownership (TCO).
Centauri is also able to integrate easily with existing systems management tools without replacing any; instead it complements them to provide a broader, end-to-end view of IT services.
This case illustrates many of the benefits that can be associated with procurement from smaller rather than larger suppliers.
��Lower cost: Proxima Technology has smaller administrative overheads and management costs than the larger vendors. (Centauri as a specialised product is also quicker to implement, and easier to maintain than a larger vendors’ offering, which also reduces total costs.)
��Innovation: Proxima Technology brings new technology to the rapidly growing business service management market. This has enabled EDS to be one of the first to see value from implementing business service management in the industry, for example from the transparency if sharing real-time service performance dashboards with its customers. Proxima Technology differentiate themselves from established market players by explicitly addressing the market needs and specialised requirements of IT Outsourced environments. Moreover EDS had the opportunity to directly influence the design of some of the latest features in Centauri v3, by sending some of its engineers to Proxima Technology’s R&D laboratory at the end of 2003. These features provide significant benefits to managed service providers and their clients.
��Responsiveness: Proxima Technology has short management chains and approval routes; therefore they are very quick in responding to EDS’s changing requirements. The Company’s expertise and understanding of
81

� )LQDO�5HSRUW�
the market further helps to make them particularly responsive and adaptable to its clients’ (and EDS’s clients) immediate and future needs.
��Flexibility: Proxima Technology is always willing to address EDS’s requirements, more easily than would be expected of the larger vendors. Moreover, EDS is a member of Proxima Technology’s Customer Advisory Board, which enables EDS to influence the product direction.
��Quality of service: As a consequence of the qualities outlined above, the relationship between Proxima Technology and EDS has evolved over the years from that of supplier to business partner.
Contact: Linh C. Ho, Marketing Manager: [email protected] ; Proxima Technology Ltd. 1 High Street, Windsor, Berkshire, SL4 1LD; tel: 0870 870 0732; fax: 01753 833 753 www.proxima-tech.com
Case Study 18 is an example of sub-contracting from a very specialised market and a nice example of the global economy at work.
CASE STUDY 18: JOBPOINT KIOSKS
This case is about a market for a product which is manufactured only by relatively small firms. However it carries two powerful lessons. It illustrates the familiar, but profoundly important, “going the extra mile” strengths than can be found in smaller firms. It also illustrates the reward that can come from well researched procurement, in this case by EDS, from a small business with, at the time, little or no track record in supplying for the UK public sector.
At the end of the 1990s the traditional method of displaying vacancies on cards in Jobcentres was little changed since the mid-seventies. Jobcentres only had enough space to display local vacancies, and a frequent criticism by jobseekers was that these cards were often out of date. Business process reviews carried out in Jobcentre Plus led to a requirement for the use of touch screen kiosks to search for and display vacancies. “JobPoint” kiosks have since revolutionised the service provided by the Jobcentres, by allowing users to search the whole national database of job vacancies according to their own preferences.
The JobPoint kiosks were delivered as part of the wider Modernising Employment Service (MESS) Programme by EDS, within their framework contract as the sole (outsourced) supplier of IT services to Jobcentre Plus. The rollout of 9000 kiosks was completed in February 2001, to provide the largest managed network of touch screen kiosks in the world. Warranties for five years were also procured.
In 2004 EDS procured a further 32 Pathfinder kiosks to deliver a Customer Internet Access Pilot to Jobcentre Plus. These kiosks, offering a full keyboard option, are being used to assess the value of giving job seekers direct access to the Internet.
The kiosks were procured by EDS from NeoProducts, a company of about 90 employees, and now one of the world’s biggest specialist suppliers of interactive kiosks. Neo started in industrial design in Australia in the late 1980’s and moved into manufacturing in 1988, in Melbourne, when it accepted a small contract for Phillips, and subsequently a major order from the Victoria Sate Government. After further expansion within Australia, the EDS JobPoint contract was the first major contract outside Australia. The Company has since further expanded, opening a manufacturing plant in Birmingham in 2001 and acquiring the UK’s leading kiosk manufacturer, LGC Associates in 2002. That year it was also awarded the Frost & Sullivan "Best Customer Focus Award" in its annual report on the world kiosk market.
82

� )LQDO�5HSRUW�
Research on the impact of JobPoints suggests that they have increased the number of vacancies notified to Jobcentres; improved the effectiveness of Jobcentre Plus facilities for many jobseekers, with greater access to vacancies by a wider variety of people.
EDS ran the JobPoint procurement process according to the principles of open competition, managed by EDS Global Purchasing. A ‘long-list’ of potential suppliers were invited to submit proposals – from which a shortlist was drawn up according to pre-defined criteria. The long-list included specialist companies – many of which were small businesses, but also including large IT and Communication Services providers, who were subcontracting with a specialist kiosk supplier. NeoProducts was selected from the shortlist on the basis of price and quality of offering, and their design expertise.
This is a case in which market specialisation has led to all interactive kiosk supply being provided by relatively small businesses, and EDS confirm that this brings with it many of the special strengths that can be associated with such companies, notably:
��Low administrative and overhead costs, relative to those of the larger companies who bid directly to EDS.
��Innovation: A radically new kiosk design for Jobcentres is an eye-catching design, exceptionally accessible, and very cheap to produce and maintain.
��Flexibility: Jobcentre Plus set up a design group which consisted of accessibility solutions experts, occupational psychologists, end users, IT and business experts. NeoProducts have been extremely responsive to changing requirements and worked with the design group to develop the bespoke product for Jobcentre Plus. In contrast, many of the competitors were offering an established product only.
��Quality of Service: :NeoProducts scored very high on customer service with Jobcentre Plus and EDS. No problem was considered insignificant and their staff were prepared to travel across the UK any time day or night in support of the pilot.
��Social Benefits: In setting up their UK manufacturing base NeoProducts established a strong relationship with Jobcentre Plus to help ensure that their facility contributed effectively to local regeneration.
Subsequently the Prison Service have benefited from the original design, evaluation and procurement exercise, and JobPoints have been used in prisons – to allow inmates to find jobs in advance of their release. NeoProducts also now sells kiosks – albeit a different model – to local authority careers services (Connexions) for the same purpose as the JobPoints – i.e. self-service job search.
Contact: David McCarthy: [email protected]; tel 0121 486 4300; fax 0121 486 4334; NeoProducts (UK) Ltd, 69 Melchett Road, Kings Norton Business Centre, Kings Norton, Birmingham, B30 3HP www.neoproductsgroup.com
83

� )LQDO�5HSRUW�
Case Study 19 is a third example of sub-contracting by EDS, this time to a company which we believe should be seen as an SME in the UK context, although it is part of a larger, French-based international enterprise. It is interesting, and in our view entirely reasonable, that the international company seeks to stress both size and smallness, recognising that both carry benefits. The specific application further illustrates the remarkable diversity – and crucial importance – of specialist IT applications across the public sector.
CASE STUDY 19: IT SUBCONTRACTING FOR OFFENDER MANAGEMENT SYSTEM
In this case the smaller supplier with whom EDS worked, to provide a specialised IT application for HM Prison Service, is in international terms not an SME, but a 1,000 strong, French-based company spread across the world. However the UK company is in most respects a self-standing, medium size enterprise and demonstrated in this case the qualities of exceptional flexibility, innovation, specialism and service quality that can characterise such companies.
In October 2002 HM Prison Service (HMPS) appointed a global IT partner (EDS), working in close partnership with an application software specialist (Valtech), to supply the case management system that is the core component of the new Offender Assessment System (OASys).
OASys is a joint initiative of the HMPS and the Probation Service, to improve offender management and ultimately reduce re-offending. When an offender assessment is initiated, OASys pulls together information such as past offending patterns, analysis of present offences, and factual sources including a sentence planning risk predictor. It also contains pre-sentence reports and a detailed interview with the prisoner. From this input, the system derives scores for risks including self-harm, violence toward staff or fellow prisoners, and re-offence on leaving prison. It is a major new tool for prison staff to assess more accurately offender management needs.
Supply and integration of the case management system was a major IT project, of value over £3 million. It also faced exceptional time constraints, as the Home Secretary had given a commitment to pilot operation by April 2003.
EDS are HMPS’s outsourcing provider for all of their IT systems and had been working to help establish the OASys business case, define the project requirements and conduct user workshops. They had also implemented a software infrastructure that facilitated rapid deployment and rollout.
Valtech is a global IT services company with 1,100 staff across 15 offices in 8 countries with a turnover approaching £70 million. Listed on the French Stock Exchange, the Company claim excellence in a niche market and to be “Small enough to care, Big enough to deliver”, with a strong emphasis on independence, integrity and public sector experience. Within the UK, the company is a medium size enterprise with 90 technical consultants and a turnover exceeding £12 million.
Distinctive characteristics which led to the decision by HMPS and EDS to retain Valtech were the UK Company’s highly specialised skills in respect of:
��Software project delivery – based on the processes described as Java 2 Platform, Enterprise Edition (J2EE) Agile Methodology, and the Unified Process. These processes provide an iterative, customer involved approach, with a record of increasing software productivity and quality;
��The relevant technology – in particular open systems development and java technologies;
��Modern technologies skills transfer – in particular an award-winning Jumpstart reskilling and training program. This included a proposal to deliver a JumpStart for the EDS development team during the construction phase.
These skills were further supported by a suitable track record, including partnering with global systems integrators on several other strategic government modernisation projects and pricing demonstrated to be good value for money. The Company report the EDS Programme Manager, Clive Trounson, as explaining: “Valtech were chosen because of their extensive credentials in Unified Process and J2EE technologies, and their proven ability to work collaboratively with EDS and HM Prisons Services, which would be essential to the success of the OASys project”, and Lauren Gibson, EDS UK North West Solution Centre Manager: “Using the Valtech Jumpstart course alongside Valtech participation in the project allowed our team to get up to productive speed
84

� )LQDO�5HSRUW�
in record time, it proved a great investment and allowed us to make sure we maximised our training time.”
By April 2003 the OASys system had been successfully deployed in Preston prison, closely followed by Wymott prison. It has now been rolled out to 140 prisons for use by up to 30,000 prison staff. The Company report high satisfaction from the Prison Service OASys Implementation Manager, Adrian Scott: “This has been a fantastic achievement by the Valtech-EDS project team. We are delighted with both their efforts and the OASys system, which we believe will be an essential tool in the ongoing battle to reduce re-offending levels.”
Characteristics which EDS found displayed especially strongly in this procurement included the following.
��Responsiveness and flexibility: As is often the case, the project had to be delivered against tight time constraints. EDS, HMPS and a specialist team from Valtech of Unified Process and J2EE technological experts developed very quickly a detailed, four stage plan that could, and did deliver the necessary result by April 2003.
��Innovation: The Company provide specialist knowledge and skills of an exceptionally high order.
��Focused and Effective Skills Transfer: It was critically important that EDS should be able to support the application into the future. OASys will be maintained in the long-term by EDS development and support staff, but these staff needed to be trained on the UP process or J2EE technologies. The JumpStart provided for the EDS development team, with hands-on mentoring from the Valtech project team, enabled the EDS team to feed into the main project during the construction phase, leading by the end of the project to their having the experience and capability to further develop and maintain the system.
��Quality of Service: The relationship between Valtech and EDS has evolved from that of supplier to business partner, to the considerable benefit of both companies and their customers.
Contact: Michael Tomlinson: [email protected] ; tel: 07740 046 893 www.valtech.co.uk
Case Study 20 is another example of exceptional service provided by a medium size IT company, this time in the context of a framework contract rather that a direct competition. Since this work the procurer, Suffolk County Council, following internal restructuring and implementation of a strategic technological partnership with BT, has established a joint venture company, Customer Service Direct, along with Mid Suffolk District Council, to better resource all of their ICT, Finance and HR workload. Further work by other IT businesses will thus normally be contracted by this joint venture company.
85

� )LQDO�5HSRUW�
CASE STUDY 20: INFORMATION SYSTEM FOR SOCIAL CARE
This is an example of a medium size, specialist IT company providing a top class service.
Suffolk County Council (SCC) is a multi-million pound organisation providing a wide range of public services for people who live, work and visit Suffolk. Within the Council, Social Care’s purpose is to help people promote their health, wellbeing, and life chances; with services that enhance independence, protection and inclusion. To this end, Social Care relies on and works in partnership with many other service providers to supply the care services used by their clients. Service providers include other parts of the Council, the local NHS, and voluntary or independent organisations, as well as the Council’s own internal providers. Social Care’s activities are carried out through a range of service providers, from assessment right thorough to process delivery.
The Council is also required to comply with the legislative requirements of the ODPM’s “Supporting People” Performance Framework.61 This framework requires the provision of certain reporting information; including Key Performance Indicators (KPI) for Social Care and other Service Providers.
It is therefore important for executives and managers to have the information needed for integrated working on strategic objectives and priorities, consistently with legislation and regulatory requirements, and for tracking progress against key targets.
Social Care needed in late 2004 a workflow reporting system that was quick to respond with consistent data definitions and common processes, combining data received from Supporting People Service Providers into a single repository, with high-level comparative figures, and with the facility to drill down to more detailed information on trends and performance indicators.
The core COMPASS application that the Social Care staff were using to enter client data was relatively unintuitive. Social Care staff required a system that allowed them to spend minimal time at the keyboard, with an interface that was easy to use and navigate.
This required the data entry to be guided by the application, with relevant pick lists, multiple selections where appropriate, specific key values and strong data validation. To prevent data items being out of date and improve overall quality, including the completeness and consistency of the core data, a need was identified to prompt and direct users to priority cases requiring attention. This would ensure accurate case status and improve team and management reports. As SCC were not in a position to make wholesale systems changes, a solution was required which built on the existing technologies and systems.
Social Care has its own ICT capacity, which however was already overstretched during busy periods. Thus after exploring the options a framework contract was agreed with Smart421 Ltd, a local Company with whom the Council had worked before, with agreed rates a terms of and conditions, to provide development work as when needed.
Smart421 is a company of about 110 staff, formed in 1989 and based in Ipswich. It is a systems integrator and provides managed IT solutions, typically to large European organisations. Its emphasis is on flexible, responsive and sensibly priced solutions, in Business Process and Application Integration, Migration of legacy systems to new platforms, Service Management, and Innovation in wireless monitoring and tracking.
61 The Supporting People programme is designed give vulnerable people the opportunity to improve their quality of life by providing a stable environment, enabling greater independence, by delivering high quality and strategically planned housing-related services that complement existing care services. It is a working partnership of local government, service users and support agencies.
86

� )LQDO�5HSRUW�
Smart421, with a small team over a few months, built and delivered a solution for Social Care that made use of the existing ICT applications including COMPASS. The Data Warehouse was streamlined and retrospective data extracts from the existing Warehouse were used to populate a statistical database on a daily/weekly/monthly basis, as required for each dataset. The newly-structured data repository, with clear visibility of performance raised the importance of data in teams, and encouraged consistent data practices and good performance data management throughout the organisation.
Another aspect of the solution was an intranet ‘portal’, built with simple 'team vs. team' and 'month vs. month' graphical analyses covering all of the required business areas. For each of these a link was provided to an Excel spreadsheet, built using OLAP cubes62 enabling more detailed analysis of the underlying data.
A web based interface for performance indicators was built, with a secure on-line system, to allow providers to enter the required information, with the ability to feed the information back into Care Support and obtain up-todate reports.
These developments have provided major benefits, in terms of a consistent workflow and a clear and consistent view of performance achievement for all those involved.
Suffolk CC describe Smart421’s technical knowledge and performance in this work as exceptional.
Contact details: Beteja Grajqevci, Marketing Officer tel: 01473 408 741 mob: 07980 757358 Email: [email protected]
Another IT case, in Case Study 21, illustrates some different aspects. An SME presented itself to a local authority, who subsequently contracted it to provide a service, satisfied that it could deliver, but also to test whether the company’s level of service would justify its acceptance as a regular addition to its supplier base. This is a niche of the IT market which is dominated by SMEs.
OLAP = On-Line Analytical Processing.
87
62
� )LQDO�5HSRUW�
CASE STUDY 21: INTEGRATION OF SYSTEMS TO NEW SAP BASED PLATFORMS
This is a further example of a small IT supplier providing an excellent service, with an emphasis not only on technical and managerial excellence, but also exceptionally effective working relationships with the client.
Buckinghamshire County Council in 2004 let a major contract, of value about £500,000, for the integration and migration from legacy systems, in a variety of areas including finance, payments, procurement and HR, to SAP based platforms.
The contract was awarded to ION Information Technology (ION-IT), a company set up in 1995-96, initially with two employees, and now with about 50 employees at its UK premises in High Wycombe. The Company has developed alliances with large computer and software manufacturers internationally to provide a range of services, spanning application design and development, system integration, business strategy and IT consultancy.
The Company had approached the Council, having previously been engaged systematically in local authority work from 1998, initially with some London Boroughs, and having been involved in various e-government initiatives. The Council assured itself of the Company’s good record and that the quoted price offered good value for money.
The work involved an ION-IT project team of 7-8 people who met all the agreed timeframes, and it also entailed working with other firms as part of a wider programme of systems reform. The completed project has provided Buckinghamshire with a substantially more efficient use and control of its data. The Company also provided project management and technical expertise to support the in-house IT capabilities.
Buckinghamshire has been extremely pleased with the quality of service provided. They emphasise, in particular, flexibility in interpreting specifications and definitions, with excellent interfacing to ensure that the Council’s detailed needs were fully understood; and the Company’s clear methodology and careful planning.
The Council also value their now wider supplier base to provide more choice and more competition.
Contact: Chander Vasdev, [email protected]; tel: 01494 753 401 www.ionit.co.uk
5.6.6. Involvement of Small Businesses in the Defence Sector
Case Study 22 follows from discussions with Danny Connaughton, Principal Technology Diversification Manager of the Defence Diversification Agency. This contact was referred to us by a representative of the North West Development Agency, met during the launch function for the DTI's Electronics 2015 report in December 2004. The case is rather different from the other case studies, being an illustration of the role of small firms in innovation in a particular sector of the economy in general, and of a government agency in helping to promote this, partly through procurement but largely by means of other instruments.
In 2001 the former Defence Evaluation and Research Agency (DERA) was split into QinetiQ, currently a PPP between the MOD and a private shareholder, with the remaining MOD stake expected to be sold in due course, and Defence Science and Technology Laboratories (DSTL), which has remained in the public sector. These changes have been associated with major changes in procurement in the defence sector in recent years, and a greater interest in
88

� )LQDO�5HSRUW�
early involvement of industry in the procurement cycle.63 There is also an increased interest in involving small firms.
According to Dr Doug Burgess of the Research Acquisition Organisation within the Ministry of Defence, competitions have been run to involve universities and SMEs more fully in defence sector R&D. They were encouraged to participate in initiatives designed to involve a range of different-sized businesses in a manageable way. These were ‘Towers of Excellence’, concentrating on particular applications such as guided weapons, and Defence Technology Centres, which might be led by the larger firms in the sector, but which also enable smaller businesses to participate.
The Defence Suppliers Service (DSS) is the Ministry of Defence’s focal point to provide advice and assistance to businesses interested in becoming suppliers to the sector. The DSS identifies prime and sub-contract opportunities through the MoD Defence Contracts Bulletin, while DSS staff give ‘Selling to the MoD’ presentations at a variety of exhibitions, seminars and ‘Meet the Buyer’ events across the country.
Our Case Study describes some of the measures being taken by the DDA to promote technology transfer through smaller businesses.
CASE STUDY 22: DEFENCE TECHNOLOGY TRANSFER
The Defence Diversification Agency (DDA) was set up in 1999, following a recommendation in the 1999 White Paper on defence to encourage transfer of technology from the defence sector. So the Agency is primarily concerned with technology transfer (both from the defence sector to the rest of the economy, and from the rest of the economy to defence64), but it has a “particular responsibility for assisting SMEs, and believes that the greatest competitive advantage can be gained for the UK economy from within this responsive, fast-moving sector”.65 Dr Danny Connaughton, the DDA’s Principal Technology Diversification Manager in the North West Region, identified three examples which showed how innovations could be generated by small firms. (The examples also illustrate the difficulties that small innovative firms face in generating funds to bring their ideas to market.)
The first of these examples is that of Fothergill Applied Research led by Dr Ian Fothergill, an inventor who has developed a technique to identify potentially dangerous surface contaminants such as bacteria by remote analysis without the need to handle them. With some financial support from the Ministry of Defence, and a DTI SMART award, a new 4-person start-up company was set up to exploit the technology in conjunction with scientists at John Moores University in Liverpool.
63
64
65
Defence White Paper, 1999, chapter 5 “Defence support”, para. 97.
The DDA has three key initiatives: to encourage the widest possible exploitation of defence technology to companies servicing the civil sectors; to encourage the transfer of suitable civil technology into defence programmes; and to provide information on defence equipment and trends to inform the defence industry’s own diversification planning.
Extract from DDA press release.
89
� )LQDO�5HSRUW�
Smart Life Technologies (SLT) is another start-up company which has been developing new technology that will have applications in both the defence and other sectors. The technology is that of ‘smart’ textiles, that can be used in clothing to monitor the health and performance of the wearer, whether it be a soldier or a sick elderly person. The technology involves coating traditional fibres with new technology to monitor ECG cardiac response, temperature, respiration, and other bodily performance, and transmit the results to a monitoring centre. SLT’s Electronically Active Textiles (EAT©) are based within a fine-knitted lightweight seamless machine-washable garment, which incorporates integrated sensors and is worn next to the skin. The technology has been developed in conjunction with a university (UMIST, which is now part of the University of Manchester). We spoke with Chris Giness, MD of Smart Life, who confirmed that the problem has been in getting development funding, and with Nicky Gridley, a potential procurer for the product who works for the Defence Logistics Organisation, who confirmed that she had reviewed Smart Life’s proposed technology, and that the proposed products had potential for the Future Integrated Soldier Technology (FIST) programme.
A third case in which a small firm has demonstrated ability to innovate involves application of technology developed in the defence sector to the health sector.66 The technology involves making catheters for young kidney patients more free-flowing to reduce the risk of thrombosis caused by their use – the required plasma coating on the inside of the catheter was identified within Defence Science and Technology Laboratories, and had originally been developed for protective clothing for soldiers. The catheters are now being developed within three organisations: the Central Manchester and Manchester Children’s’ University Hospitals NHS Trust, the coating company P2i67 (a small spin-off firm based at Porton Down), and the University of Liverpool. According to Dr Ruth Hale of TrusTECH, on behalf of the NHS Trust, “the collaboration will hopefully bring about significant improvement in patient care”.
5.6.7. An eAuction
Case Study 23, included at the request of the OGC, illustrates a case in which an eAuction (or strictly a “reverse auction”, with reducing bids by sellers rather than increasing bids by buyers), was applied to a market supplied predominantly by small businesses. The Department of Constitutional Affairs (DCA) gave us the names of two participant companies with whom we discussed the process. The case demonstrates that for large contracts e-Auctions can, if they are well-managed as they were in this case, be well enough handled by smaller businesses. However eAuctions do present problems, which we discuss in Chapter 6.
The case study as presented here is based on the shorter of two versions published by the DCA, but with our own interpretation in the light of discussions with the DCA and participating companies.
66 Details of this third case are taken from the Autumn 2004 issue of Inspirations, the newsletter of the DDA. 67 At www.p2ilabs.com
90

� )LQDO�5HSRUW�
CASE STUDY 23: E-AUCTION OF COURT REPORTING SERVICES
The Department for Constitutional Affairs (DCA) first introduced electronic reverse auctions (eAuctions) In September 2003. Their second eAuction event was held in September 2004 for Court Reporting Services, which provide copy transcripts of court proceedings.
DCA have tendered for this service since the Courts Act 1971 and it is delivered by a number of specialist small to medium size suppliers. The contracts, covering 13 geographical regions across England & Wales, provide around 150 Computer Aided Transcription (CAT) writers to Crown Courts each day. The value of the contracts varies by region, but the regional average is somewhat over £0.5 million per year, extended over four years.
Following an invitation for Expressions of Interest ten firms were invited to submit conventional paper bids, including a new supplier to the market. At this stage it was expected, by the Department and by the bidding companies, that there would be a subsequent eAuction, but this was to be confirmed latter. After evaluation of the paper bids nine firms were invited to participate in the eAuction. DCA were confident that these suppliers could meet its required standard, and that the market was stable and diverse enough to provide effective competition in each region.
The technical management of the eAuction was outsourced to a specialist in web and software development, Bravo Solutions, who with DCA hosted supplier briefing sessions and one-to-one training. A full support service was also available to suppliers throughout the event. Suppliers praise the quality and value of all this support.
For the eAuction, electronic bids were made for each of the 13 regions as single, but interdependent, lots. Bids continued to be placed until there had been no bid on any lot for 5 minutes. To achieve sensible bidding increments, each bid had to be at least a small percentage (say 1.5 or 2 per cent) lower than the bidder’s previous bid. The process tended to lead to intervals of only a little under five minutes between bids and lasted for five hours, with a total of 322 bids. For some lots the bidding progressed steadily throughout; for other lots there were long intervals over which no bids were made. The results of the eAuction were examined and discussed within the Department the following day and successful bidders notified a week or two later.
The quality of the bids, as opposed to cost, was handled in two stages. At the first and more important stage, as noted above, each paper bid was assessed against a set of criteria to determine whether it met the required standard. Only firms that met this standard proceeded to the eAuction. Any further quality improvement beyond the required standard was regarded as of very little value. However when the final bids on a lot were so close as to be “matching” the relevant paper bids were reconsidered and, if there was a difference in quality, the contract was awarded to the higher quality bid. This happened with more than one lot.
Contracts were duly awarded to eight suppliers. The total contract value was 11 percent less than the previous contract, offering an expected saving of probably more than £3 million over the four years. This is an impressive contrast to DCA’s previous experience, which has seen prices rise with each new competition.
The DCA record that some suppliers expressed concern after the event about its duration. However the costs of this time, and of the extra costs incurred by DCA in staff time and employing Bravo Solutions, appear to be small relative to the size of these contracts.
Concerns have been expressed by suppliers about the extent to which quality of service can be satisfactorily embedded in the eAuction process. They have also questioned whether the cost levels achieved are sustainable. However on this latter point the DCA are satisfied that, if it is necessary, the contract management procedures, including service credits paid so long as the promised quality is delivered, will be sufficient to ensure that the quality promised in the bids will be delivered.
91

� )LQDO�5HSRUW�
��� /HVVRQV�IRU�*RYHUQPHQW�3URFXUHPHQW�
We here address further those key questions from the Research Specification noted at the beginning Chapter 5, about achievement of benefits and their generalisation, and also address two of the other key questions:
��Where SMEs have been perceived to deliver value for money in public markets, can this value for money be quantified? Can it be quantified in a systematic way that could provide purchasers with a useful ‘tool’ to evaluate tenders?
��Does the research evidence gathered in the project suggest that generic indicators of value of money can be established which could potentially be used to guide purchasers in procurement decisions?
6.1. The Benefits of Procurement from Small Businesses
6.1.1. Benefits to procurers
Smaller supplier…better value? lists the following areas of potential benefit from procuring from SMEs.
1. Competition
2. Cost
3. Innovation
4. Responsiveness
5. Flexibility
6. Quality of service
7. Specialism
When applying these headings we find that Responsiveness and Flexibly, and to a large extent Innovation and Specialism, are sub-headings of Quality of Service. We also note that the list is incomplete, in that it omits the social inclusion or environmental benefits that can arise from some SME procurements, in particular from social enterprises (although we have concerns, as explained below, about how these benefits are sometimes perceived). The list could also better capture the longer term dynamic benefits, as noted below, which can arise from close working between procurer and supplier. However, with these qualifications, this list identifies well the benefits displayed by the procurements in our case studies.
6.1.2. External Benefits
The literature review in Chapter 3 confirms the view that small businesses in general, especially those in areas where there is substantial innovation, bring benefits to the national economy. However we find no evidence from the case studies, nor indeed any clear suggestion in central procurement advice or guidance, that government procurers do or
92

� )LQDO�5HSRUW�
should significantly sacrifice their own interests for such wider benefits, which seem best handled by other, better focused policy instruments. It seems plausible that many of the IT related case studies, in particular, may have brought material external benefits to the economy more generally, but these would be very hard to pin down, let alone to value, even with hindsight, let alone at the time of the procurement. They seem best accepted as a national bonus for good general procurement practice.
There are however some situations in which benefits beyond those accruing directly to the procurer are taken into account. In one central government case (Green-Works, Case Study 15) procurement from a recycling social enterprise brought environmental benefits, which were explicitly recognised by the procurer as contributing to sustainability objectives for the Government Estate (and also brought social inclusion benefits which may have been given some weight). In another case (Sheffield Housing, Case Study 14) social enterprises are being developed to mobilise small construction-related businesses as part of a comprehensive scheme to reduce local social exclusion.
More questionable is the widespread perception in local government and in some other local procurers that “buying local” is of itself an important objective, on the presumption that this increases local prosperity, and sometimes that it brings a significant social benefit by reducing transport. Neither of these appears to be based on any impartial analysis and, as noted in section 4.8.3, the former, although an inevitable political pressure, appears not to be consistent with government guidance.
6.1.3. The Scope for Generalisation and for Quantification
Across the case studies, the relative importance of these various benefits varies. However a most striking feature of the studies is the commonality of nearly all the small suppliers, in respect of service quality (for a given cost), of specialism where it is relevant (especially but not only in IT and other professional services) and, less surprisingly, in adding to competition between suppliers.
These case studies are of course self selected, in that they are promoted by either suppliers or procurers with a good story to tell. However most are not merely stories of successful procurement. They are mostly stories where procurers, time and again, have stressed the extra qualities provided by the smaller supplier.
The extra quality has in most cases arisen from exceptional commitment, often associated with a willingness to put in extra time to overcome problems.68 This appears to be partly because the enterprises have an exceptional hunger for business, often as a route to widening their client base and to expansion, but also because both the directors and employees of smaller businesses often have an exceptional personal commitment to and pride in the service they are delivering and their collective reputation. This suggests that, in almost any field (excepting only the few that are either dominated by small businesses or in which small businesses clearly have no interest), where there has not been a significant, well directed effort by a procurer to explore the potential for more use of smaller businesses, a small
It is worth recording that a major public procurer was discouraged from considering one of several competitors for a service (although that – medium size – company’s bid was in any case not the best) because the company had developed a particular reputation for expecting extra money for any extra work.
93
68

� )LQDO�5HSRUW�
business initiative should be seriously considered, and rejected or postponed only with good reason.
Specialism is most conspicuous in the fields of IT and other professional services, where the development of specialist markets appears to know no bounds. However in nearly all of the case studies there is an element of specialism, ranging from marginal in the case of temporary ancillary staff to more significant specialism in fire fighting equipment and in some foods, and in office furniture recycling. In some markets, such as fire fighting equipment (Case Study 10), the choice between large and smaller firms, for a given product, may depend wholly on price. However, at least in the field of professional services and, especially, IT, the depth and diversity of specialisms is so great that the smaller firm, directly or as a subcontractor, can often provide services which would be beyond the scope of any larger firm. This applies across the whole of government.
The close relationships that develop during a successful procurement between procurer and a smaller supplier, often at managing director level on the supplier side, contribute to flexibility and innovation. However they can also have longer term dynamic consequences, providing scope, by closer understanding of the procurer’s needs and the supplier’s capacities, to develop new services, as illustrated conspicuously in the case of NHS food procurement in Cornwall (Case Study 12).
We see little scope for any generalised quantification of the benefits of procuring from small businesses. This is not only because circumstances vary so much from case to case. It is also because, although some of the benefits arise in terms of lower costs for similar quality, and this can be the dominant benefit in the supply of some goods or services, much of the benefit often arises from higher quality, both in product and in style of delivery. We doubt that valuing such quality impacts explicitly is generally practicable.
Central and local government, being accountable to different sets of electors, have different perspectives on the range of issues that should be taken into account in individual procurement decisions, or establishing the body’s procurement strategy. Thus some generalisations need to be tailored to one or the other. However our work in developing the case studies suggests that, with regard to external benefits, not accruing directly to the procurer:
��It seems unrealistic to expect either central or local government procurers generally to give weight to wider national economic benefits for procurement from small businesses, except insofar as they are specified in general policies (as for example on the procurement of hardwoods; or on recycling), or, possibly, where the externality is exceptionally clear (as perhaps in the case of the social inclusion activities of a supplier, as in Case Study 15).
��Local government procurers however will often, as the authorities’ responsibilities require, give weight to local external benefits. This will tend to favour local, and hence often smaller businesses, and, if coupled with well planned policies to reduce social exclusion and improve labour markets (as appears to be illustrated in Case Study 14), deserves to be applauded. We are advised however there are cases where local procurement is steered instead by simple protectionist motives, which serve the public interest less well.
94
� )LQDO�5HSRUW�
6.2. The Scope for Wider Use of Small Businesses
None of the work undertaken in this study – statistical analysis, literature review and case studies – suggests that there is any sound basis for deriving in the abstract an “optimal” level of SME procurement, either in aggregate or in any specific market. This is both because the optimum level of procurement from small businesses across sectors varies from zero to 100 per cent, and that it in any case it depends upon the competence of the particular procurer. The case studies do however suggest that there is scope for achieving net benefits from more use of small businesses across very wide areas of procurement.
In the fields of IT and professional consultancy, which figure heavily in the case studies, this may not be a major issue (although work with other procuring bodies would be needed to confirm this). In these fields many smaller businesses have established themselves and appear to be generally well used by central and local government, and as sub-contractors in markets where the prime contractor may need to be a very large operator. However, even in the case studies in these fields, it is conspicuous that in some cases the measures taken to provide sufficient reassurances to contract with a small business have required a significant level of procurer competence and imagination – as in the cases of the intergovernmental body contracting with Quest4 (Case Study 3), and IDeA contracting with EGS (Case Study 4).
Many of the other case studies describe proactive, sometimes strongly proactive, measures by procurers to widen the supplier base, by including more small businesses, in a varied range of goods and services - namely fresh food, toner cartridges, trailers for medical equipment, temporary ancillary staff, fire fighting equipment, housing development (albeit with a strong social inclusion element) and defence technology. This is a small sample, but its diversity suggests that across a very wide spectrum of procurement there is scope for imaginative action by competent procurers to improve value for money in this way.
6.3. eAuctions
Our investigation of eAuctions suggests a mixed picture.
On the positive side, the DCA, besides being very frank with and helpful to us in explaining Case Study 23, were strongly praised by suppliers for their practical handling of the eAuctioning of Court Reporting Services. Moreover that eAuction achieved an impressive financial saving, relative to what would have been expected from conventional procurement.
However firm reservations were expressed to us by the (successful) participants to whom the DCA referred us, about whether the quality for this service could be satisfactorily handled in terms of a required threshold standard, with no further trade-off between cost and quality (except for bids of virtually the same cost).
eAuctioning on price alone (subject to a threshold quality standard) seems clearly suitable for commodities with a precisely measurable specification, such as gas or electricity supplies, or office consumables where, once the specification is set and its reliability of supply assured, the contract decision can be made on price alone. This is less clearly suitable for services where quality is more complex and will vary between suppliers, and contract awards need to be decided on a combination of price and judgments about quality. One problem is the obvious one observed in the frequently quoted epigram of John Ruskin:
95

� )LQDO�5HSRUW�
“There is scarcely anything in the world that some man cannot make a little worse, and sell a little more cheaply. The man who buys on price alone is this man’s lawful prey.”
However there is the wider problem that few government procurements are a simple and immediate transfer of a good in exchange for money (as is normal practice in the case of conventional auctions of goods for sale). Rather the procurement leads on to an ongoing, preferably cooperative and within reason flexible relationship between procurer and supplier, over a period of months or years, and sometimes over successive contracts. A selection process based essentially on price alone, even if subject to a required quality standard for admission to the eAuction, will tend to lose the informal relationship between customer and supplier.
We have been advised on eAuctions by the British Printing Industries Federation (BPIF). They explained that their members had participated in a number of such auctions and that they also see eAuctions, provided they are well prepared, as not discriminating against small businesses.
They have however come across a number of cases which give cause for concern about how eAuctions are managed in practice – although the bad practice examples reported are from private sector rather than government procurers. In one instance a bidder had made it clear, in advance of the eAuction, that a change in the specification (to a more standard size) would greatly reduce the cost, but the specification was not changed and they bid accordingly. They discovered later that the company winning with a lower bid had done so on the (correct) presumption that they could persuade the procurer to change the specification post contract. On another occasion a procurer used an eAuction not to let a contract, but as a device to provide negotiating data to help bring down the price charged by their preferred supplier, who did not participate in the eAuction. (Such serious abuses might well be vulnerable to legal challenge, but many businesses might baulk at the time and financial and reputational risk which this would entail.)
We understand from the BPIF that, although most eAuctions are still currently based on price alone, some eAuction software has developed to a stage at which bids can be handled against a range of criteria, not simply price. Moreover the pressure to develop such software is reported to have come not only from suppliers, but also from buyers, who wish to use eAuctions, but in a way that is supportive of long term cooperative relationships with suppliers. Indeed we understand that in some cases buyers are finding that their favoured suppliers are refusing to participate in “lowest price” eAuctions, because the supplier does not wish to enter into such a relationship with the procurer, and this is limiting the competition that the procurer is trying to encourage.
A DCA supplier suggested to us that quality might be built explicitly into the process by a system of quality premiums. Before the auction, the prospective bidders would be assessed for quality. If they were materially different, the highest and lowest quality bidders would be identified, and all the others placed on a scale between them. The highest quality bidder would be awarded a premium (and the other bidders pro rata premiums), such that the figure bid by that high quality bidder on the eAuction screen would be less (by a fixed sum or a fixed percentage) than the financial value of the bid, were it accepted. The contract would be awarded to the bidder offering the lowest screen bid. Such a procedure would have two great merits. It would force the procurer to think clearly about quality – what is important and how
96
� )LQDO�5HSRUW�
much each characteristic is worth. It would also provide transparency, with if necessary a clear audit trail of the quality judgments and valuations.
The BPIF are keen to see established standards of good practice. However at present this appears to be difficult, as each procurer follows its own practices, with no very effective means of achieving generally accepted standards.
6.4. Analytical Aspects of Procurement
Our discussions with the SBS, the OGC and the ODPM, with other central bodies and with many procurers and suppliers and others in developing the case studies, have highlighted the somewhat limited formal analysis which appears to be committed to procurement, in contrast to the very extensive administrative input.
With respect to small businesses, considerable analytical input has been directed to their access to finance, but not to the issues of government procurement. Some of these are as follows. Most appear to be tractable issues, which could be handled with few resources if technical advice were available at the appropriate level.
��An operational definition of “value for money”: This appears to be a source of fairly widespread concern. The practical guidance is that it includes whole life costs (as opposed to only initial cost), and includes quality as well as cost. (Officials tell us the term to use now is “value for money” – you must never say “cheapest”.) However there is no guidance on the extent to which value for money should include externalities69, or in what circumstances. It is perhaps for this reason that some public authorities are constructing their own, somewhat questionable interpretations of externalities.
��The balance between the economies of large scale procurement and the disbenefits of loss of competition: The Gershon Report emphasised scale alone (with a passing reference to SMEs and innovation). However, as noted in a subsequent report commissioned by the OFT on competition in public procurement70, whereas aggregation of related contracts may sometimes provide best value, there are circumstances where “the trend towards contract aggregation raises a number of potential competition concerns” by confining the market to the few large suppliers who supply the full spectrum of these services. We are told that there was no analysis support for the earlier report of such effects, and further work in this field could be of value.
��Characteristics of markets with exceptional small business potential: Analysis of the economy of scale issue by the OFT was proposed in Recommendation 8 of the BRTF Report “Government: Supporter and Customer?” of 2003. That Recommendation also proposed “research to identify the characteristics of those markets where it is important to ensure that small and medium-sized enterprises are able to compete”. The
69 Externalities being impacts which fall not on the procurer or the supplier but on other parties, such as local communities, or the wider economy, or the natural environment.
70 Assessing the impact of public sector procurement on competition Prepared for the OFT by •econ, September 2004. Papers OFT742a, 742b and 742c. This point was made in the context of a case study on waste management (paragraph 6.59). The same point was put to us by a supplier in this market, who was not currently disadvantaged by aggregation but would have been when they were a smaller company, confirming that the issue arises not only in theory but is also a substantial issue in practice
97
� )LQDO�5HSRUW�
recommendation was accepted by the Government in principle, but subject to OFT priorities, and we understand that this latter part was not carried through.71
��How quality can be brought into specifications: It has been put to us that some of the quality benefits of SMEs are difficult to build into specifications, and thus difficult to give due weight to in awarding contracts. We have no view on whether this is a serious issue, but it would seem to merit investigation. If it is a material issue then there may be scope for developing ways of designing specifications – for example by putting more weight on references – to overcome the problem. (At the same time, specifications may now sometimes be designed to favour local suppliers unduly strongly.)
��Local procurement and employment impacts: Some public bodies, including the NHS and at least some local authorities, are adopting the position that local procurement should be encouraged because it is good for local prosperity. This position is also supported by the Sustainable Development Commission. Within this model the EC constraints on protectionism are recognised, but seen as an obstacle to be overcome rather than as policy reflecting the public interest. This buy local model seems to be contrary to the Government’s policy stance on regional regeneration, which is that persistent local unemployment rates can be reduced only by adaptations in the labour market, for example through reskilling. These are complex but important issues and in the absence of central analytical input they appear to be developing, in government procurement, their own local and environmental political momentum.
��The extent to which procurement is suitable as an instrument for other policies: The documentation required by local government and some other public bodies (although we understand less so for most central government departments) includes demands which are not clearly proportionate to the social benefit they bring. It was explained by one procurer, when it was suggested that firms will simply learn to give the right answers about, for example, their environmental policies, that for that reason the procurer had to dig deeply and obtain very full information – even though it was unrelated to the product being supplied. We have no absolute view on whether the current balance is correct. However the extent to which procurement is used as an instrument for other policies, the costs which this imposes on taxpayers and service users, and the associated benefits, appear nowhere to be appraised in a systematic way. (One contributory factor, put to us by more than one procurer, is that public procurers have no knowledge of the costs which they themselves incur, let alone suppliers, in devising and managing these contract requirements.) It would be of value to compare public sector procurement procedures in this respect with those of large private sector companies.72
71 The •econ report is an extremely thorough theoretical analysis, addressed to the whole of public procurement. The one section addressed particularly to SMEs (paragraphs 5.5 to 5.17) does not extend to identifying the characteristics of markets where small firm competition should be encouraged more than in others.
72 Comparison with private sector procurement raises the wider issue if how much public bodies should mimic the ”corporate social responsibility” (CSR) driven behaviour of private sector bodies. As noted in Chapter 4, it might be argued that CSR, to the extent that it is about corporate reputation, is not a helpful concept for public bodies, as they should be concerned with the public interest as a whole and not driven by their own concerns for popularity. However it could be of interest to know the extent to which private sector commitments to CSR intrude, if at all, on demands for paperwork from their suppliers.
98

� )LQDO�5HSRUW�
��The scope for pre-contract discussion with suppliers: Practice appears to vary across the public sector in application of the rules constraining discrimination between suppliers. One common convention is the risk-minimising strategy of refusing any such contact, except in the form of written responses to questions which are sent to all bidders or potential bidders. However it is not uncommon for a successful small business procurement to be preceded by discussion and negotiation of terms which give assurance against the risks of the business failing. A systematic reassessment and full, practical definition of good practice in this field could be rewarding. We understand that the OGC is pursuing this as part of the Kelly programme of procurement reform.
��Supply chains: As noted earlier, we have found in this work only a few sub-contracting case studies (three for the same IT prime contractor, albeit in very different applications, and a local authority steering construction companies into sub-contracting in a way to reduce social exclusion). However small businesses clearly have a major role in subcontracting and we note that this is an active OGC concern. Some empirical work on sub-contracting, perhaps analogous to this present study, could be of value.
��Transport miles: This is another externality being enthusiastically promoted by some public bodies, in the context of food procurement, without, it appears, any impartial central analysis.
��Framework agreements and lists of approved suppliers: The use of framework agreements or other mechanisms whereby suppliers are accepted onto a list, which is then used by one or by many procurers as a source list, and perhaps a requirement, for potential suppliers, is widespread. It has obvious virtues, in reducing transactions costs for both procurers and suppliers, and in most respects they appear to work well. However they can be administered in different ways, some producing better outcomes than others. One issue is the choice between essentially continuous updating, accepting any new applicant of the required standard, versus updating at long intervals, perhaps with a window of a few weeks every several years for businesses to apply for listing. The sound advice in “Smaller supplier … better value?” on such lists is “Refresh them regularly” and “make it easy for suppliers to become listed”, but the means for achieving this or monitoring its achievement appear not to be developed.73
��eAuctions: Technology has made eAuctions feasible and they have their place. However there appears to be no comprehensive analysis as yet of the problems which they pose (apart from those of practical administration) and the circumstances in which are or are not appropriate, or in which they need to be tailored to include quality variables in the bidding process.
One list, which opens only for a short window every few years, provoked vigorous criticism from two of the most competent suppliers in the case studies, who had missed the previous window. The sponsoring body claimed that the system worked well for those who were in it, that being excluded did not prevent the firms from subcontracting, that permanent or much more frequent listing would be an excessive administrative burden. We did not however feel that these responses really dealt with the issue. Any procurer using the list is facing a less competitive market than it needs to, because these and no doubt other competent firms are excluded. It is also claimed that permanent or more frequent listing is anyway prevented by EC regulations, which seems surprising. However the SBS advise us that the new EC Procurement Directive, to be implemented by January 2006, includes provision for ‘dynamic procurement’, which will explicitly allow for firms to pre-qualify against a standard, and then be added to an on-line catalogue.
99
73

� )LQDO�5HSRUW�
There are yet other issues relevant to small firm procurement which have been raised during the course of this work, and which could merit further analysis, but which we have not encountered directly. These include the relationship between PFI/PPP contracting and small businesses and the roles of portals and websites.
100
� )LQDO�5HSRUW�
��� &RQFOXVLRQV�DQG�5HFRPPHQGDWLRQV�
7.1. Statistical Data
The analysis of statistical data available on government procurement from SMEs is severely constrained by the absence of comprehensive data on the size of businesses to which specific government contracts are awarded. However:
��In 2003 SMEs accounted for 52 per cent of total industry turnover and 58 per cent of total employment. Sectors where SMEs account for the highest proportions of turnover are agriculture/forestry/fishing, construction, real estate/renting/business activities, and health/social work. SBS figures are also able to identify more disaggregate sectors where SMEs account for particularly high proportions of total activity.
��Figures on government purchases as a proportion of total sales by sector can be extracted from the ONS Input Output tables. Government procurement accounts for about 5 per scent of total procurement in the economy, but much more in some sectors, such as those related to defence or health services.
��We have looked indirectly at the extent to which government purchases from firms of different sizes, using the only source we were able to identify, namely the biennial Federation of Small Businesses survey of their members. This includes questions on the proportions of sales accounted for by local and by central government, which suggest that small businesses supply about twice as much to local government as to central government.
��We have used information from the various sources to identify sectors where SMEs may be supplying less to government than might be expected on the basis of government demand and the SMEs’ overall representation in those sectors. This is possible however, with currently available data, only at a very aggregated level, which reveals patterns of supply that are broadly in line with expectations.
7.2. Academic Literature
The academic literature confirms the general presumptions in government guidance that SMEs contribute to competition and innovation. Some general conclusions implied by the literature are:
��There is evidence from a number of countries that SMEs’ contribution to the economy is increasing over time;
��UK SMEs rank more highly than UK large firms in EU league tables of innovation, so that removal of obstacles to SME development may be particularly beneficial to the UK economy;
��The study of development of clusters shows that spatial proximity promotes a continuous exchange of ideas and innovations between the firms making up the clusters – the same may happen to some degree with local procurement;
101

� )LQDO�5HSRUW�
��The presence of SMEs in a sector may exert a stabilising influence in times when national levels of activity are fluctuating, since SMEs tend to hire and fire at a more uniform rate than larger firms;
��There is evidence that the impact of more competition for goods and services and for ideas, and extra churn in employment and in enterprises, both of which are enhanced by the presence of SMEs, increase productivity growth in the economy.
7.3. The Case Studies
From a wide range of case studies we conclude that:
��The potential benefits listed by the OGC and the SBS of procurement from small businesses are in practice substantially achieved, over a wide range of procurement. The list could usefully be refined.
��Especially conspicuous, across a wide range of markets, is the ability and willingness of small firms to “go the extra mile”, in terms of commitment and service delivery.
��However explicit monetary valuation of such quality benefits is rarely if ever practicable; and there appears to be little prospect of developing quantitative rules of thumb for procurers on “the benefits of using small businesses”. The need is for competence in procurement policies and individual procurements, to recognise fully the value of small businesses as suppliers and how best to use them.
��Procuring from a small firm for a crucial project can expose the procurer to extra risk. Procurer competence is needed to obtain the necessary assurances that this risk is acceptable, and to devise measures if necessary to reduce it.
��Measures to increase competition by increasing small business participation can be effective in a wide range of procurement markets. However this too requires procurer competence, and may be resource intensive.
��Although the relative strengths of small businesses are similar across many fields, the optimal scope for their contribution varies from zero to 100 per cent. The effectiveness of procurement practices, and of policy initiatives to promote small businesses is not therefore well suited to analytically based targets (as distinct from temporary targets to motivate change in some areas in a particular direction). Practice in each field of procurement needs to be assessed on its own merits, case by case, and by comparisons across procurers and sectors.
��There is a disappointing lack of comprehensive monitoring data on the use of small businesses.
��There appears to be some lack of analytical input to government procurement, to support the very considerable administrative input. There are many issues on which objective and authoritative analysis might strengthen advice on procurement on issues relevant to small businesses, and to improve consistency with other areas, such as the handling of employment and environmental impacts.
��Our study of eAuctions suggests that, at least for large contracts, they do not discriminate against small businesses. However there appears to be scope for more development of
102

� )LQDO�5HSRUW�
the handling of quality in eAuctions, and the associated impact on ongoing customer-client relationships.
7.4. Recommendations
1. Measures to encourage professionalism in procurement policy and procedures in government bodies, including the sharing of good practice, should be seen as the primary instrument for achieving a better use of small businesses in government procurement.
2. Measures to remedy the conspicuous absence of comprehensive data to monitor the use of small businesses in government procurement should be encouraged.
3. Progress will best be driven by studies of current practice, and comparing practices and achievements across organisations and sectors. It would not be helpful to emphasise targets for SME procurement, in aggregate or in specific sectors.
4. Government procurement, perhaps especially with respect to procurement from small businesses, would benefit from wider analytical support to reinforce the considerable administrative inputs.
103

�
�������������
������������ �������������������������������������������������������
Tab
le A
.1 r
epro
duce
s th
e In
put/O
utpu
t pub
licat
ion
guid
e to
SIC
and
123
cla
ssif
icat
ions
. T
he s
econ
d co
lum
n re
cord
s th
e 12
3 cl
assi
fica
tion
used
in
the
ON
S I-
O ta
bles
, whi
ch a
re th
e st
atis
tical
bas
is f
or S
ectio
n 2.
3. T
he f
ourt
h co
lum
n re
cord
s th
e SI
C c
lass
ific
atio
n us
ed f
or th
e SB
S da
ta
whi
ch a
re th
e ba
sis
of S
ectio
n 2.
2. T
he la
st f
our
colu
mns
sho
w s
ub-d
ivis
ions
of
the
SIC
cla
ssif
icat
ion,
incl
udin
g, in
the
colu
mn
head
ed “
Sect
A
17”,
the
lette
rs u
sed
in T
able
2.1
. N
AC
E is
the
EC
eco
nom
ic c
lass
ific
atio
n sy
stem
, with
whi
ch th
e SI
C is
req
uire
d to
be
cons
iste
nt.
Tab
le A
.1
Cla
ssif
icat
ion
of
Inp
ut-
Ou
tpu
t In
du
stry
/Pro
du
ct G
rou
ps
by
Sta
nd
ard
Ind
ust
rial
Cla
ssif
icat
ion
(19
92)
and
NA
CE
11 le
vel
123
leve
l In
du
stry
/pro
du
ct g
rou
ps
SIC
(199
2)D
ivis
ion
sG
rou
ps,
Cla
sses
SIC
/NA
CE
Rev
.1 In
du
stri
al c
lass
ific
atio
ns
Div
isio
ns
A60
Su
b
sect
ion
sA
31
Sec
tA
17
A6
Agr
icul
ture
1 2 3
Agr
icul
ture
, hun
ting
and
rela
ted
serv
ice
activ
ities
For
estr
y, lo
ggin
g an
d re
late
d se
rvic
e ac
tiviti
esF
ishi
ng, o
pera
tion
of fi
sh h
atch
erie
s an
d fis
h fa
rms;
ser
vice
act
iviti
es in
cide
ntal
to fi
shin
g
01 02 05 10
11 +
12
13 14 15.1
15.2
+ 1
5.3
15.4
15.5
15.6
15.7
15.8
1 +
15.
8215
.83
15.8
415
.85
to 1
5.89
15.9
1 to
15.
9715
.98
16 17.1
17.2
17.3
17.4
17.5
117
.52
to 1
7.54
01
AA
A
1
02 05
BB
B
M
inin
g an
dqu
arry
ing
4 5 6 7
Min
ing
of c
oal a
nd li
gnite
; ext
ract
ion
of p
eat
Ext
ract
ion
of c
rude
pet
role
um a
nd n
atur
al g
as; s
ervi
ce a
ctiv
ities
inci
dent
al to
oil &
gas
ext
ract
ion
Min
ing
of m
etal
ore
sO
ther
min
ing
and
quar
ryin
g
10
CA
C
2
11 +
12
13
CB
14
M
anuf
actu
ring
8 9 10 11 12 13 14 15 16 17 18 19 20 21 22 23 24 25 26
Pro
duct
ion,
pro
cess
ing
and
pres
ervi
ng o
f mea
t and
mea
t pro
duct
sP
roce
ssin
g an
d pr
eser
ving
of f
ish
and
fish
prod
ucts
; fru
it an
d ve
geta
bles
V
eget
able
and
ani
mal
oils
and
fats
Dai
ry p
rodu
cts
Gra
in m
ill p
rodu
cts,
sta
rche
s an
d st
arch
pro
duct
sP
repa
red
anim
al fe
eds
Bre
ad, r
usks
and
bis
cuits
; man
ufac
ture
of p
astr
y go
ods
and
cake
sS
ugar
Coc
oa; c
hoco
late
and
sug
ar c
onfe
ctio
nery
Oth
er fo
od p
rodu
cts
Alc
ohol
ic b
ever
ages
Pro
duct
ion
of m
iner
al w
ater
s an
d so
ft dr
inks
Tob
acco
pro
duct
sP
repa
ratio
n an
d sp
inni
ng o
f tex
tile
fibre
sT
extil
e w
eavi
ngF
inis
hing
of t
extil
esM
ade-
up te
xtile
art
icle
s, e
xcep
t app
arel
Car
pets
and
rug
sO
ther
text
iles
15
DA
D
16 17
DB
27
Kni
tted
and
croc
hete
d fa
bric
s an
d ar
ticle
s 17
.6 +
17.
7
104
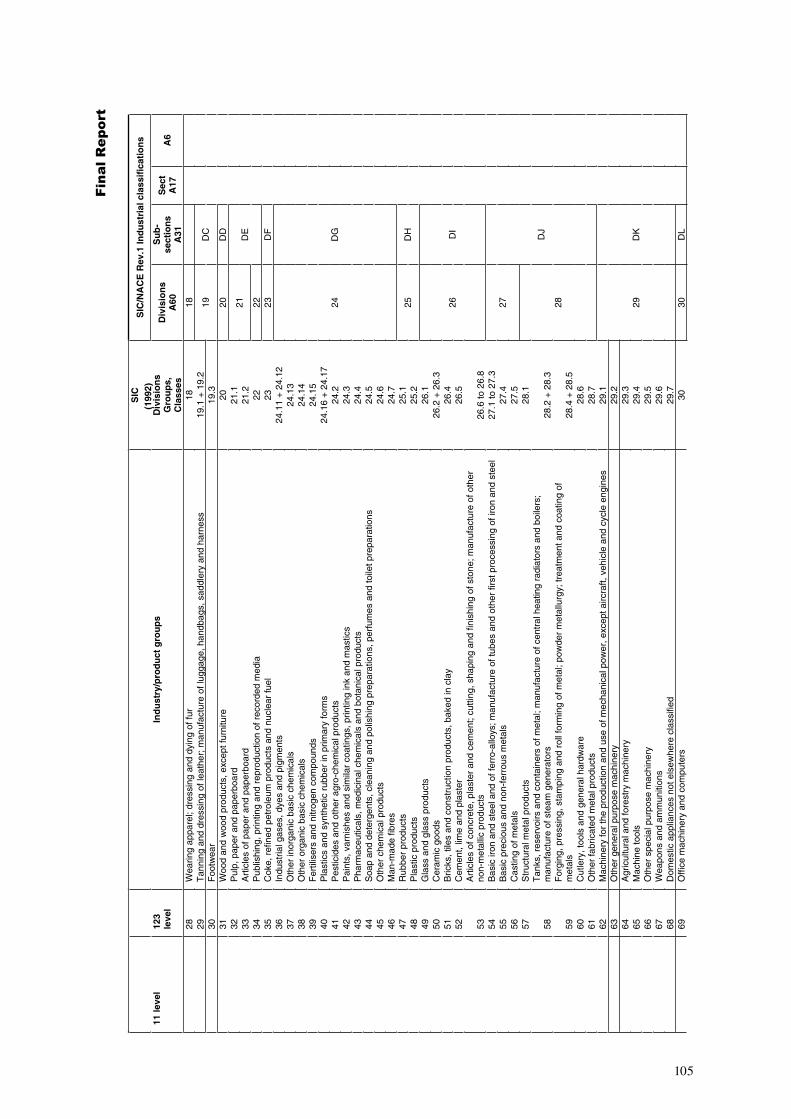
�
�������������
11 le
vel
123
leve
l In
du
stry
/pro
du
ct g
rou
ps
SIC
(199
2)D
ivis
ion
sG
rou
ps,
Cla
sses
SIC
/NA
CE
Rev
.1 In
du
stri
al c
lass
ific
atio
ns
Div
isio
ns
A60
Su
b
sect
ion
sA
31
Sec
tA
17
A6
28 29
Wea
ring
appa
rel;
dres
sing
and
dyi
ng o
f fur
Tan
ning
and
dre
ssin
g of
leat
her;
man
ufac
ture
of l
ugga
ge, h
andb
ags,
sad
dler
y an
d ha
rnes
s 18
19.1
+ 1
9.2
18 19
DC
30
F
ootw
ear
19.3
31 32 33 34 35 36 37 38 39 40 41 42 43 44 45 46 47 48 49 50 51 52 53 54 55 56 57 58 59 60 61 62
Woo
d an
d w
ood
prod
ucts
, exc
ept f
urni
ture
Pul
p, p
aper
and
pap
erbo
ard
Art
icle
s of
pap
er a
nd p
aper
boar
dP
ublis
hing
, prin
ting
and
repr
oduc
tion
of r
ecor
ded
med
iaC
oke,
ref
ined
pet
role
um p
rodu
cts
and
nucl
ear
fuel
Indu
stria
l gas
es, d
yes
and
pigm
ents
Oth
er in
orga
nic
basi
c ch
emic
als
Oth
er o
rgan
ic b
asic
che
mic
als
Fer
tilis
ers
and
nitr
ogen
com
poun
dsP
last
ics
and
synt
hetic
rub
ber
in p
rimar
y fo
rms
Pes
ticid
es a
nd o
ther
agr
o-ch
emic
al p
rodu
cts
Pai
nts,
var
nish
es a
nd s
imila
r co
atin
gs, p
rintin
g in
k an
d m
astic
sP
harm
aceu
tical
s, m
edic
inal
che
mic
als
and
bota
nica
l pro
duct
sS
oap
and
dete
rgen
ts, c
lean
ing
and
polis
hing
pre
para
tions
, per
fum
es a
nd to
ilet p
repa
ratio
nsO
ther
che
mic
al p
rodu
cts
Man
-mad
e fib
res
Rub
ber
prod
ucts
Pla
stic
pro
duct
sG
lass
and
gla
ss p
rodu
cts
Cer
amic
goo
dsB
ricks
, tile
s an
d co
nstr
uctio
n pr
oduc
ts, b
aked
in c
lay
Cem
ent,
lime
and
plas
ter
Art
icle
s of
con
cret
e, p
last
er a
nd c
emen
t; cu
tting
, sha
ping
and
fini
shin
g of
sto
ne; m
anuf
actu
re o
f oth
erno
n-m
etal
lic p
rodu
cts
Bas
ic ir
on a
nd s
teel
and
of f
erro
-allo
ys; m
anuf
actu
re o
f tub
es a
nd o
ther
firs
t pro
cess
ing
of ir
on a
nd s
teel
B
asic
pre
ciou
s an
d no
n-fe
rrou
s m
etal
sC
astin
g of
met
als
Str
uctu
ral m
etal
pro
duct
sT
anks
, res
ervo
irs a
nd c
onta
iner
s of
met
al; m
anuf
actu
re o
f cen
tral
hea
ting
radi
ator
s an
d bo
ilers
;m
anuf
actu
re o
f ste
am g
ener
ator
sF
orgi
ng, p
ress
ing,
sta
mpi
ng a
nd r
oll f
orm
ing
of m
etal
; pow
der
met
allu
rgy;
trea
tmen
t and
coa
ting
of
met
als
Cut
lery
, too
ls a
nd g
ener
al h
ardw
are
Oth
er fa
bric
ated
met
al p
rodu
cts
Mac
hine
ry fo
r th
e pr
oduc
tion
and
use
of m
echa
nica
l pow
er, e
xcep
t airc
raft,
veh
icle
and
cyc
le e
ngin
es
20 21.1
21.2
22 2324
.11
+ 2
4.12
24.1
324
.14
24.1
524
.16
+ 2
4.17
24.2
24.3
24.4
24.5
24.6
24.7
25.1
25.2
26.1
26.2
+ 2
6.3
26.4
26.5
26.6
to 2
6.8
27.1
to 2
7.3
27.4
27.5
28.1
28.2
+ 2
8.3
28.4
+ 2
8.5
28.6
28.7
29.1
20
DD
21
DE
22 23
D
F
24
DG
25
DH
26
DI
27
DJ
28 29
DK
63
Oth
er g
ener
al p
urpo
se m
achi
nery
29
.2
64 65 66 67 68
Agr
icul
tura
l and
fore
stry
mac
hine
ryM
achi
ne to
ols
Oth
er s
peci
al p
urpo
se m
achi
nery
Wea
pons
and
am
mun
ition
sD
omes
tic a
pplia
nces
not
els
ewhe
re c
lass
ified
29.3
29.4
29.5
29.6
29.7
69
O
ffice
mac
hine
ry a
nd c
ompu
ters
30
30
D
L
01 5
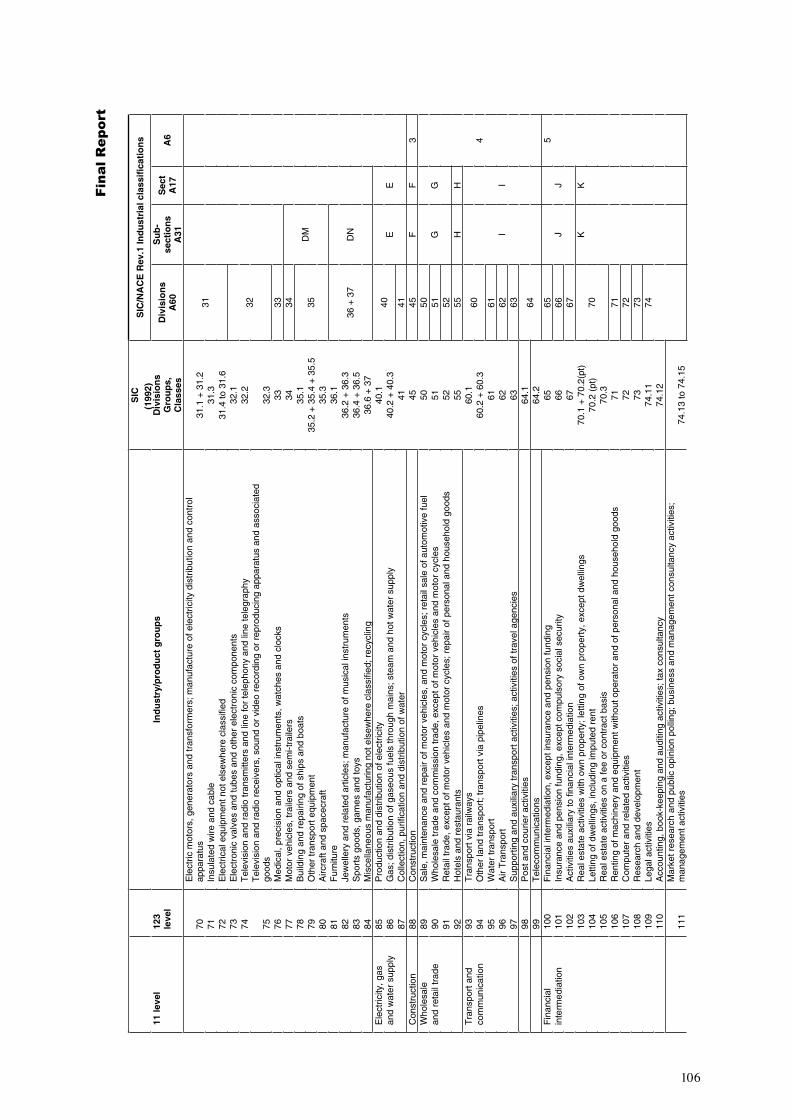
�
�������������
11 le
vel
123
leve
l In
du
stry
/pro
du
ct g
rou
ps
SIC
(199
2)D
ivis
ion
sG
rou
ps,
Cla
sses
SIC
/NA
CE
Rev
.1 In
du
stri
al c
lass
ific
atio
ns
Div
isio
ns
A60
Su
b
sect
ion
sA
31
Sec
tA
17
A6
70 71 72 73 74 75 76 77 78 79 80 81 82 83 84
Ele
ctric
mot
ors,
gen
erat
ors
and
tran
sfor
mer
s; m
anuf
actu
re o
f ele
ctric
ity d
istr
ibut
ion
and
cont
rol
appa
ratu
sIn
sula
ted
wire
and
cab
leE
lect
rical
equ
ipm
ent n
ot e
lsew
here
cla
ssifi
edE
lect
roni
c va
lves
and
tube
s an
d ot
her
elec
tron
ic c
ompo
nent
sT
elev
isio
n an
d ra
dio
tran
smitt
ers
and
line
for
tele
phon
y an
d lin
e te
legr
aphy
Tel
evis
ion
and
radi
o re
ceiv
ers,
sou
nd o
r vi
deo
reco
rdin
g or
rep
rodu
cing
app
arat
us a
nd a
ssoc
iate
dgo
ods
Med
ical
, pre
cisi
on a
nd o
ptic
al in
stru
men
ts, w
atch
es a
nd c
lock
s M
otor
veh
icle
s, tr
aile
rs a
nd s
emi-t
raile
rsB
uild
ing
and
repa
iring
of s
hips
and
boa
tsO
ther
tran
spor
t equ
ipm
ent
Airc
raft
and
spac
ecra
ftF
urni
ture
Jew
elle
ry a
nd r
elat
ed a
rtic
les;
man
ufac
ture
of m
usic
al in
stru
men
ts
Spo
rts
good
s, g
ames
and
toys
Mis
cella
neou
s m
anuf
actu
ring
not e
lsew
here
cla
ssifi
ed; r
ecyc
ling
31.1
+ 3
1.2
31.3
31.4
to 3
1.6
32.1
32.2
32.3
33 34 35.1
35.2
+ 3
5.4
+ 3
5.5
35.3
36.1
36.2
+ 3
6.3
36.4
+ 3
6.5
36.6
+ 3
740
.140
.2 +
40.
341 45 50 51 52 55 60
.160
.2 +
60.
361 62 63
31 32 33 34
DM
35
36 +
37
DN
Ele
ctric
ity, g
asan
d w
ater
sup
ply
85 86 87
Pro
duct
ion
and
dist
ribut
ion
of e
lect
ricity
Gas
; dis
trib
utio
n of
gas
eous
fuel
s th
roug
h m
ains
; ste
am a
nd h
ot w
ater
sup
ply
Col
lect
ion,
pur
ifica
tion
and
dist
ribut
ion
of w
ater
40
E
E
41
Con
stru
ctio
n 88
C
onst
ruct
ion
45
F
F
3 W
hole
sale
and
reta
il tr
ade
89 90 91 92
Sal
e, m
aint
enan
ce a
nd r
epai
r of
mot
or v
ehic
les,
and
mot
or c
ycle
s; r
etai
l sal
e of
aut
omot
ive
fuel
Who
lesa
le tr
ade
and
com
mis
sion
trad
e, e
xcep
t of m
otor
veh
icle
s an
d m
otor
cyc
les
Ret
ail t
rade
, exc
ept o
f mot
or v
ehic
les
and
mot
or c
ycle
s; r
epai
r of
per
sona
l and
hou
seho
ld g
oods
H
otel
s an
d re
stau
rant
s
50
G
G
4
51 52 55
H
H
Tra
nspo
rt a
ndco
mm
unic
atio
n 93 94 95 96 97
Tra
nspo
rt v
ia r
ailw
ays
Oth
er la
nd tr
ansp
ort;
tran
spor
t via
pip
elin
esW
ater
tran
spor
tA
ir T
rans
port
Sup
port
ing
and
auxi
liary
tran
spor
t act
iviti
es; a
ctiv
ities
of t
rave
l age
ncie
s
60
I I
61 62 63
98
Pos
t and
cou
rier
activ
ities
64
.1
64
99
Tel
ecom
mun
icat
ions
64
.265 66 67
70.1
+ 7
0.2(
pt)
70.2
(pt
)70
.371 72 73
74.1
174
.12
Fin
anci
alin
term
edia
tion
100
101
102
103
104
105
106
107
108
109
110
Fin
anci
al in
term
edia
tion,
exc
ept i
nsur
ance
and
pen
sion
fund
ing
Insu
ranc
e an
d pe
nsio
n fu
ndin
g, e
xcep
t com
puls
ory
soci
al s
ecur
ityA
ctiv
ities
aux
iliar
y to
fina
ncia
l int
erm
edia
tion
Rea
l est
ate
activ
ities
with
ow
n pr
oper
ty; l
ettin
g of
ow
n pr
oper
ty, e
xcep
t dw
ellin
gsLe
tting
of d
wel
lings
, inc
ludi
ng im
pute
d re
ntR
eal e
stat
e ac
tiviti
es o
n a
fee
or c
ontr
act b
asis
Ren
ting
of m
achi
nery
and
equ
ipm
ent w
ithou
t ope
rato
r an
d of
per
sona
l and
hou
seho
ld g
oods
Com
pute
r an
d re
late
d ac
tiviti
esR
esea
rch
and
deve
lopm
ent
Lega
l act
iviti
esA
ccou
ntin
g, b
ook-
keep
ing
and
audi
ting
activ
ities
; tax
con
sulta
ncy
65
J J
5 66 67 70
K
K
71 72 73 74
111
Mar
ket r
esea
rch
and
publ
ic o
pini
on p
ollin
g; b
usin
ess
and
man
agem
ent c
onsu
ltanc
y ac
tiviti
es;
man
agem
ent a
ctiv
ities
74
.13
to 7
4.15
106

�
�������������
11 le
vel
123
leve
l In
du
stry
/pro
du
ct g
rou
ps
SIC
(199
2)D
ivis
ion
sG
rou
ps,
Cla
sses
SIC
/NA
CE
Rev
.1 In
du
stri
al c
lass
ific
atio
ns
Div
isio
ns
A60
Su
b
sect
ion
sA
31
Sec
tA
17
A6
112
113
114
Arc
hite
ctur
al a
nd e
ngin
eerin
g ac
tiviti
es a
nd r
elat
ed te
chni
cal c
onsu
ltanc
y; te
chni
cal t
estin
g an
d an
alys
isA
dver
tisin
gO
ther
bus
ines
s se
rvic
es
74.2
+ 7
4.3
74.4
74.5
to 7
4.8
75 8085
.1 +
85.
285
.390 91 92 93 95
Pub
licad
min
istr
atio
n 11
5 P
ublic
adm
inis
trat
ion
and
defe
nce;
com
puls
ory
soci
al s
ecur
ity
75
L L
6
Edu
catio
n, h
ealth
and
soci
al w
ork
116
117
118
Edu
catio
nH
uman
hea
lth a
nd v
eter
inar
y ac
tiviti
esS
ocia
l wor
k ac
tiviti
es
80
M
M
85
N
N
Oth
er s
ervi
ces
119
120
121
122
123
Sew
age
and
refu
se d
ispo
sal,
sani
tatio
n an
d si
mila
r ac
tiviti
es
Act
iviti
es o
f mem
bers
hip
orga
nisa
tions
not
els
ewhe
re c
lass
ified
Rec
reat
iona
l, cu
ltura
l and
spo
rtin
g ac
tiviti
esO
ther
ser
vice
act
iviti
esP
rivat
e ho
useh
olds
with
em
ploy
ed p
erso
ns
90
O
O
91 92 93 95
P
P
107
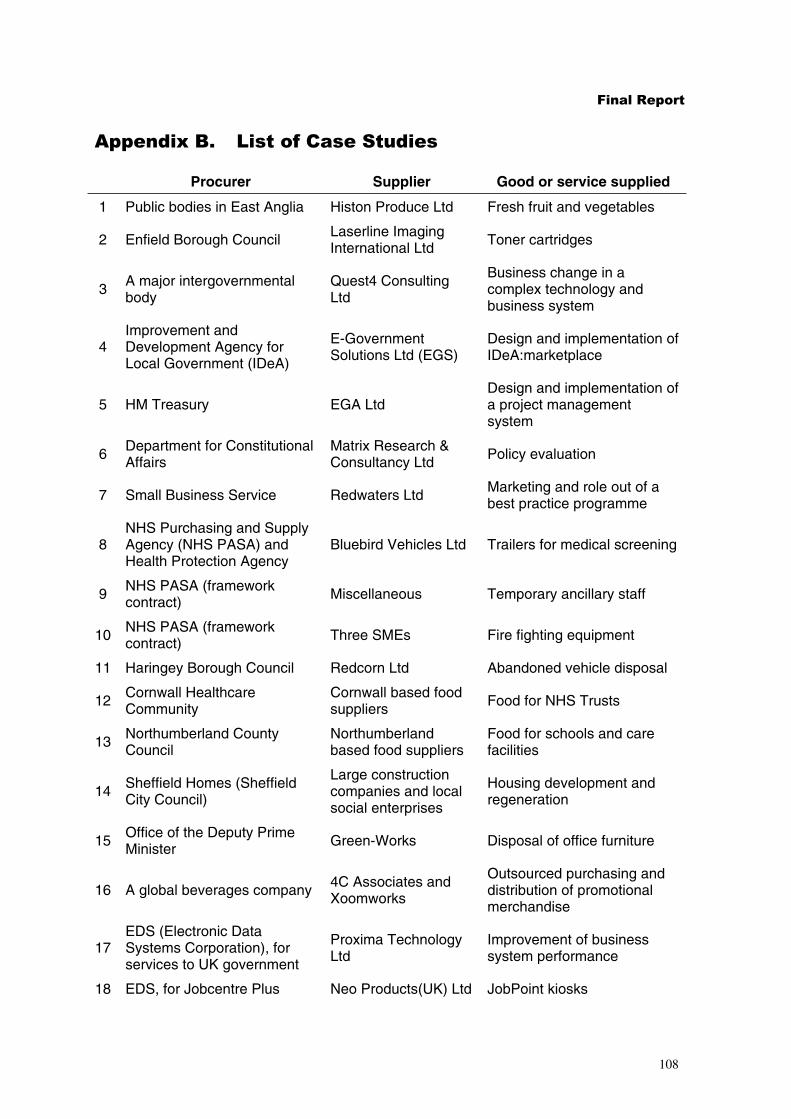
� �������������
������������ ���������������������
Procurer Supplier Good or service supplied
1 Public bodies in East Anglia Histon Produce Ltd Fresh fruit and vegetables
2 Enfield Borough Council Laserline Imaging International Ltd Toner cartridges
3 A major intergovernmental body
Quest4 Consulting Ltd
Business change in a complex technology and business system
4 Improvement and Development Agency for Local Government (IDeA)
E-Government Solutions Ltd (EGS)
Design and implementation of IDeA:marketplace
Design and implementation of 5 HM Treasury EGA Ltd a project management
system
6 Department for Constitutional Affairs
Matrix Research & Consultancy Ltd Policy evaluation
7 Small Business Service Redwaters Ltd Marketing and role out of a best practice programme
NHS Purchasing and Supply 8 Agency (NHS PASA) and Bluebird Vehicles Ltd Trailers for medical screening
Health Protection Agency
9 NHS PASA (framework contract) Miscellaneous Temporary ancillary staff
10 NHS PASA (framework contract) Three SMEs Fire fighting equipment
11 Haringey Borough Council Redcorn Ltd Abandoned vehicle disposal
12 Cornwall Healthcare Community
Cornwall based food suppliers Food for NHS Trusts
13 Northumberland County Council
Northumberland based food suppliers
Food for schools and care facilities
14 Sheffield Homes (Sheffield City Council)
Large construction companies and local social enterprises
Housing development and regeneration
15 Office of the Deputy Prime Minister Green-Works Disposal of office furniture
16 A global beverages company 4C Associates and Xoomworks
Outsourced purchasing and distribution of promotional merchandise
17 EDS (Electronic Data Systems Corporation), for services to UK government
Proxima Technology Ltd
Improvement of business system performance
18 EDS, for Jobcentre Plus Neo Products(UK) Ltd JobPoint kiosks
108

� �������������
19
20
21
22
23
Procurer
EDS, for HM Prison Service
Suffolk County Council
Buckinghamshire County Council
Defence Diversification Agency (as promoter)
Department of Constitutional Affairs (e-auction)
Supplier
Valtech Ltd
Smart421
ION Information Technologies Ltd
Miscellaneous
Several SMEs
Good or service supplied
Offender case management system
Information system for social care
Integration of systems to new SAP based platforms
Defence technology transfer
Court reporting services
109

’
Authors: NERA Economic Consulting 15 Stratford Place, London W1C 1BE, United Kingdom
Tel: +44 20 7659 8500Fax: +44 20 7659 8501www.nera.com
This document can be accessed online at: www.sbs.gov.uk/analytical or www.supplyinggovernment.gov.uk
Postal enquiries should be addressed to: SME Procurement Team, Small Business Service, Level 1, St Mary’s House, 9-11 London Road, Sheffield, S1 4LA
Email enquiries should be addressed to: [email protected]
The views expressed in this report are the authors and do not necessarily reflect those of the Small Business Service or the Government.
Printed in the UK on recycled paper with a minimum HMSO score of 75.First published August 2005. Department of Trade and Industry. www.dti.gov.uk/
© Crown Copyright. URN 05/1454