a study of the factors influencing the consumption …
TRANSCRIPT

A STUDY OF THE FACTORS INFLUENCING THE
CONSUMPTION OF READY-TO-DRINK MEAL
REPLACEMENT AMONG THAI URBAN
PROFESSIONALS
BY
MISS INTUON ISRAPRASAS
AN INDEPENDENT STUDY SUBMITTED IN PARTIAL
FULFILLMENT OF THE REQUIREMENTS FOR THE DEGREE
OF MASTER OF SCIENCE PROGRAM IN MARKETING
(INTERNATIONAL PROGRAM)
FACULTY OF COMMERCE AND ACCOUNTANCY
THAMMASAT UNIVERSITY
ACADEMIC YEAR 2018
COPYRIGHT OF THAMMASAT UNIVERSITY
Ref. code: 25616002040159XTN

(1)
Independent Study Title A STUDY OF THE FACTORS INFLUENCING
THE CONSUMPTION OF READY-TO-DRINK
MEAL REPLACEMENT AMONG THAI URBAN
PROFESSIONALS
Author Miss Intuon Israprasas
Degree Master of Science Program in Marketing
(International Program)
Major Field/Faculty/University Faculty of Commerce and Accountancy
Thammasat University
Independent Study Advisor Associate Professor Nigel Barrett, Ph.D.
Academic Years 2018
ABSTRACT
The research was conducted using both qualitative and quantitative
methods. Due to limited time and resources, convenient sampling and snowball method
were used to collect data. In exploratory research, the data were obtained from
secondary research and 15 in-depth interviews. In descriptive research, the data were
gathered from 177 self-administered online questionnaire responses. In-depth interview
analysis was done using deductive and inductive approach. The results were used to
form hypotheses on factors influencing the intention to purchase and benefit
segmentation. The data analysis for the questionnaire was done using the Statistic
Program for the Social Sciences (SPSS). The analysis identified three major benefit
segments, the ‘Sport and Nutrition’ segment, the ‘Time and Convenience’ segment, and
the ‘Weight-control’ segment. The opportunity for potential consumers is in the ‘Sport
and Nutrition’ and ‘Time and Convenience’ segment, especially in consumers who are
already dietary supplement users. Different product features and consumption
behaviors were found to be significantly related to different consumer benefit segments.
Overall product features and marketing elements to be improved are taste, value for the
price, and ‘feel good’ factors. Office buildings and mass transit locations can be
effective locations to target. Potential users are lower involvement consumer and
marketing should be made available at purchase points, especially in convenience
Ref. code: 25616002040159XTN

(2)
stores. Recommended marketing messages are on personal appearance improvement
and solution to daily life hassles.
Keywords: Ready-To-Drink meal replacement, meal replacement drink,
urban professional, influencing factors, intention to purchase,
benefit segmentation
Ref. code: 25616002040159XTN

(3)
ACKNOWLEDGEMENTS
First and foremost, I would like to express my gratitude toward my advisor,
Associate Professor Nigel Barrett, Ph.D., for his encouragements, support and guidance
throughout this project. Furthermore, I would like give thanks to my classmates who
had been the source of inspirations, knowledge, and advices, and also to the respondents
who kindly provided the information which made this project possible. Last but not
least, I am forever grateful to my family who has been there for me whenever I needed.
Miss Intuon Israprasas
Ref. code: 25616002040159XTN

(4)
TABLE OF CONTENTS
Page
ABSTRACT (1)
ACKNOWLEDGEMENTS (3)
LIST OF TABLES (7)
LIST OF FIGURES (8)
CHAPTER 1 INTRODUCTION 1
1.1 Problem Statement 1
1.2 Research Purpose 2
1.3 Research Objectives 2
CHAPTER 2 REVIEW OF LITERATURE 3
2.1 Background on Meal Replacement 3
2.2 Global Market and Trends 3
2.3 Thai Market, Trends, and Health Issues 4
2.4 Academic Theory Implication 5
2.4.1 Determinants of Customer-Perceived Value 5
2.4.2 Influences on Consumer Behavior 6
2.4.3 Consumer Buying Decision Process 7
CHAPTER 3 RESEARCH METHODOLOGY 8
3.1 Exploratory Research Methodology 8
Ref. code: 25616002040159XTN

(5)
3.1.1 Secondary Research Methodology 8
3.1.2 In-depth Interview 8
3.2 Descriptive Research Methodology 9
3.2.1 Questionnaire Design 9
3.2.2 Key Research Variables 11
3.3 Sample Size 11
3.4 Data Collection 11
3.5 Data Analysis Plan 12
3.2.1 Exploratory Research Analysis 12
3.2.2 Descriptive Research Analysis 12
CHAPTER 4 RESULTS AND DISCUSSION 13
4.1 In-depth Interview Analysis 13
4.2 Questionnaire Analysis 15
4.2.1 Profiles of Respondents 15
4.2.2 Benefit Segmentation 18
4.2.3 Factors Influencing the Intention to Purchase 23
CHAPTER 5 CONCLUSIONS AND RECOMMENDATIONS 26
5.1 Conclusion and Managerial Implication 26
5.2 Research Limitation 28
5.3 Suggestions for Future Study 29
REFERENCES 30
APPENDICES
APPENDIX A: Questions for In-depth Interviews 33
APPENDIX B: A Sample of Survey Questionnaire 34
APPENDIX C: Total Respondents’ Socio-Demographic Profile 39
Ref. code: 25616002040159XTN

(6)
APPENDIX D: Cluster Differences by Socio-Demographic Profile 40
APPENDIX E: Cluster Differences by Consumers’ Attitudes 41
APPENDIX F: Factors Influencing Intention to Purchase 42
BIOGRAPHY 44
Ref. code: 25616002040159XTN
(7)
LIST OF TABLES
Tables Page
4.1 Segment Difference by Gender 16
4.2 Consumer Segments by Ready-To-Drink Meal Replacement Knowledge 16
4.3 Consumer Segments by Dietary Supplement Intake 17
4.4 Results of ANOVA - Consumer Segments Differences by Attitudes 17
4.5 Consumer Segments by Behavioral Characteristics 18
4.6 Result of Cluster Analysis on Benefit Sought 19
4.7 Consumer Segments by Clusters 19
4.8 Cluster Differences by Behavioral and Psychographic Characteristics 21
4.9 Results of ANOVA - Cluster Differences by Product Attributes 23
4.10 Results of t-test and Descriptive Statistics for Consumer Perceived Value 24
4.11: Multiple Regression on Factors Influencing Intention to Purchase 25
Ref. code: 25616002040159XTN
(8)
LIST OF FIGURES
Figures Page
2.1 Determinants of Customer-Perceived Value 5
2.2 Model of Influences on Consumer Behavior 6
2.3 Five-stage Model of the Consumer Buying Decision Process 7
3.1 Selection Criteria and Definition of Respondents 10
3.2 Independent Variables and Dependent Variables 10
Ref. code: 25616002040159XTN
1
CHAPTER 1
INTRODUCTION
1.1 Problem Statement
Nowadays, many urban professionals across the globe face hectic lifestyle and
health issues from their sedentary work life amid the growing trends of health and
fitness, as well as the rise of healthcare costs. Due to tight schedules, traffics and long
work hours, many urban professionals find themselves skipping meals and eating low-
quality food with high sodium, high sugar and lack nutritional value which affects both
their mental and physical health. Meal replacement has become one of the solutions for
a convenient healthy diet by saving time, minimizing efforts, and ensuring proper
nutritional value.
The global health trend is shifting from weight control to holistic healthy
lifestyle and fitness. In USA, Soylent launched Ready-To-Drink meal as a nutritional
solution for people who are living a busy life, frustrated with meal preparation, and
conscious about nutrition. In India, myDaily launched meal replacement shakes for
busy urban professionals as 70% of Indian skip their breakfast, and many of them only
have time for fast food which results in weight problems. Meal replacements in
Thailand are positioned only for weight loss, neglecting the portion of consumers
without a weight problem, seeking the healthy and convenient benefit of nutritional
food in easy consumption form. BodyKey by Nutrilite is a leading product in Ready-
To-Drink meal replacement among smaller local players. The brand image of weight
loss benefits might be a barrier to prospective customers with different attitudes towards
health. Hence, this research was conducted to understand consumer demand for Ready-
To-Drink meal replacements among Thai urban professionals, to identify factors
influencing the intention to purchase Ready-To-Drink meal replacement amid the
changing health trends, and to identify potential consumer and consumer by benefit
segmentation.
Ref. code: 25616002040159XTN
2
1.2 Research Purpose
This study aims to understand the changing health trends and its effects on
consumer demand for Ready-To-Drink meal replacements, and identify the segment of
Thai urban professionals who seek nutritional and convenience benefits of Ready-To-
Drink meal replacements. The data uncovered from this study will benefit companies
who seek new opportunities for a meal replacement product and to tailor effective
marketing strategies to the changing health trends and behaviors among urban
professionals in Thailand. This study is a Contemporary Topic in Applied Marketing
regarding Health Issues and Opportunities.
1.3 Research Objectives
The following objectives were addressed in this study
i) To identify Ready-To-Drink meal replacement potential consumer and
consumer among Thai urban professionals by benefit segmentation.
ii) To identify factors influencing the intention to purchase Ready-To-Drink
meal replacement among Thai urban professionals, i.e., perceived value
between regular meal and Ready-To-Drink meal replacement, the
psychological factors, and the situational factors.
Ref. code: 25616002040159XTN

3
CHAPTER 2
REVIEW OF LITERATURE
2.1 Background on Meal Replacement
Meal replacement is a formulated food that, by itself, can replace one or more
daily meals. It can be in form of ready-to-serve or to be prepared with water or milk.
Requirements for a meal replacement include a minimum food energy value of 225
calories per serving, a specified amount and quality of protein, a maximum amount of
energy derived from fat (35 percent), and specified amounts of various vitamins and
mineral nutrients. Common categories for meal replacement are weight reduction diet,
daily meals replacement, clinical meal replacement and instant breakfast (Canadian
Food Inspection Agency, 2018).
Meal replacement was initially meant for elderlies or as a medical food for ill
adults, however, in recent years it has widened its market into regular adults as a
convenient solution for balance nutrition, sports nutrition, and weight control. There
are some controversies and concerns over the benefits and disadvantages of relying on
meal replacements as a main source of nutrition over real food (Krasy, 2004).
2.2 Global Market and Trends
In the Consumer Health market, Meal Replacement is the largest product
category within Weight Management and Wellbeing (WMW, 15.9 billion USD). The
global market value of meal replacement is 6.9 billion USD in 2016 with 31% growth
over five-year period. Other growths in WMW such as supplement nutrition drink (73%
growth) is driven by seniors’ consumption, protein-based sports nutrition (80% growth)
is driven by health and fitness trends, and protein supplements (61% growth) is driven
by plant-based protein demand among the vegan population. Meal replacement will
have to evolve as consumer trends are moving away from weight loss into staying active
and healthy. Innovations such as integration with online fitness management plans and
digital tools, online connected communities, transparency, and clean labels will drive
Ref. code: 25616002040159XTN

4
future growth. Current market leaders are Herbalife (19%) and Abbott Laboratories
(8%). Examples of innovative brands that are gaining recognition are Nupo (Denmark)
which is low cost, uses real ingredients and has long shelf-life; and Soylent (USA)
which is a balanced meal on-the-go product with high-quality plant-based nutrition.
Examples of products are meal bars and shakes (Euromonitor, 2017). Soylent is a meal
replacement brand which started out as a startup and gains traction among techies and
entrepreneurs by offering open-source build your own meal replacement platform that
is machine learning based. Employing agile methodology, the products are launched
with transparent release notes and reinvented continually, using learnings from its
customers, testings, and feedbacks. This gives Soylent a community of enthusiastic and
engaged customers (CB Insights, 2017). myDaily is a Ready-To-Drink meal
replacement brand founded in India. The product is positioned as a solution for busy
urban professionals. 30 percent of Indians skip their breakfast, and 72 percent of urban
professionals have junk food due to busy schedules. The company offers free diet
consultation and product subscription (Srikant, 2017).
2.3 Thai Market, Trends and Health Issues
The current market value of meal replacement in Thailand is 6.8 billion THB
and registered 5% growth with Amway (Thailand) Ltd and Herbalife International
(Thailand) Ltd as the market leaders. Thai consumers are becoming more
knowledgeable and health conscious. Although a small portion of consumer exercise
routinely, the majority of them seeks healthier diets. This is an opportunity for
convenience easy-to-use products for managing nutrition intake. International brands
compete on innovation and know-how while local brands push hard sales.
Amway (Thailand) Ltd launched BodyKey by Nutrilite as a meal replacement
for weight management, alongside InBody watch and boost interest with competition
challenge. Local brands are mostly weight loss supplements that promote and sell on
online channels and use celebrities as a mean to capture the market. Current channels
are specialist retailers (37%), direct selling (36%), grocery retailers (18%), internet
retailing (5.6%) and home shopping (3.5%) (Euromonitor, 2018).
Ref. code: 25616002040159XTN

5
Rising incomes, internet access and global fitness trends are driving changes in
Thai urban consumer’s diets and habits. There are increasing demands for organic
products, fortified/functional foods, ‘free from’ foods, and dietary supplements. Urban
consumers shop for packaged food and save time by frequenting convenience stores for
meals. Busy urban consumers are joining fitness, doing short workout sessions
(Euromonitor, 2018).
A study of Thai urban sedentary workers diet intake concluded that there is a
declining consumption of energy and carbohydrate, while consumption of proteins and
fats increases. Dietary fiber and most micronutrients intakes were not sufficient
according to the Thai Dietary Reference Intake (DRI). The study suggests improvement
in dietary patterns and healthier meal selections to avoid risks of diet-related chronic
diseases (Ivanovitch, Klaewkla, Chongsuwat, Viwatwongkasem and Kitvorapat, 2014).
2.4 Academic Theory Implication
2.4.1 Determinants of Customer-Perceived Value
Figure 2.1: Determinants of Customer-Perceived Value
Customer-Perceived Value is the difference between the prospective
customer’s evaluation of the total benefits and costs of a product offering against the
Customer-Perceived Value
Total Customer Benefit Total Customer Cost
Product
Benefit
Service
Benefit
Personal
Benefit Image Benefit
Monetary
Cost
Time
Cost
Energy
Cost
Psychological
Cost
Ref. code: 25616002040159XTN
6
perceived alternatives. The total customer benefit is the perceived monetary value of
economic benefits, functional benefits, and psychological benefits customers expect
from a given market offering in terms of product, service, personal, and image benefit.
The total customer cost is the perceived bundle of costs customers expect to incur in
evaluating, obtaining, using, and disposing of the given market offering, which can be
categorized into monetary, time, energy, and psychological costs. The value of the
offering can be increased by raising the benefits or reducing the costs (Kotler & Keller,
2016).
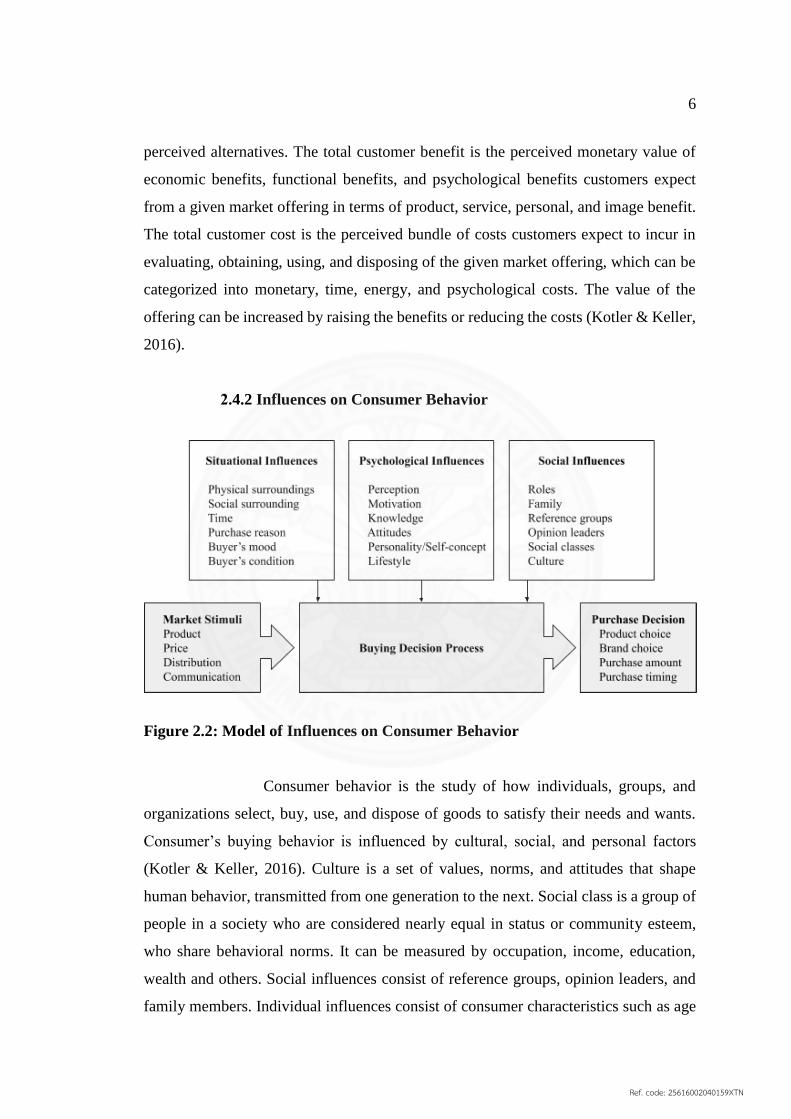
2.4.2 Influences on Consumer Behavior
Figure 2.2: Model of Influences on Consumer Behavior
Consumer behavior is the study of how individuals, groups, and
organizations select, buy, use, and dispose of goods to satisfy their needs and wants.
Consumer’s buying behavior is influenced by cultural, social, and personal factors
(Kotler & Keller, 2016). Culture is a set of values, norms, and attitudes that shape
human behavior, transmitted from one generation to the next. Social class is a group of
people in a society who are considered nearly equal in status or community esteem,
who share behavioral norms. It can be measured by occupation, income, education,
wealth and others. Social influences consist of reference groups, opinion leaders, and
family members. Individual influences consist of consumer characteristics such as age
Ref. code: 25616002040159XTN
7
and gender, as well as, personality, self-concept, and lifestyle. Psychological influences
consist of perception, motivation, learning, and attitudes (Lamb, Hair, & Mcdaniel,
2018). The marketing mix is a model used to define the marketing options in terms of
price, product, promotion, and place for a product offering to meet a specific customer
need or demand.
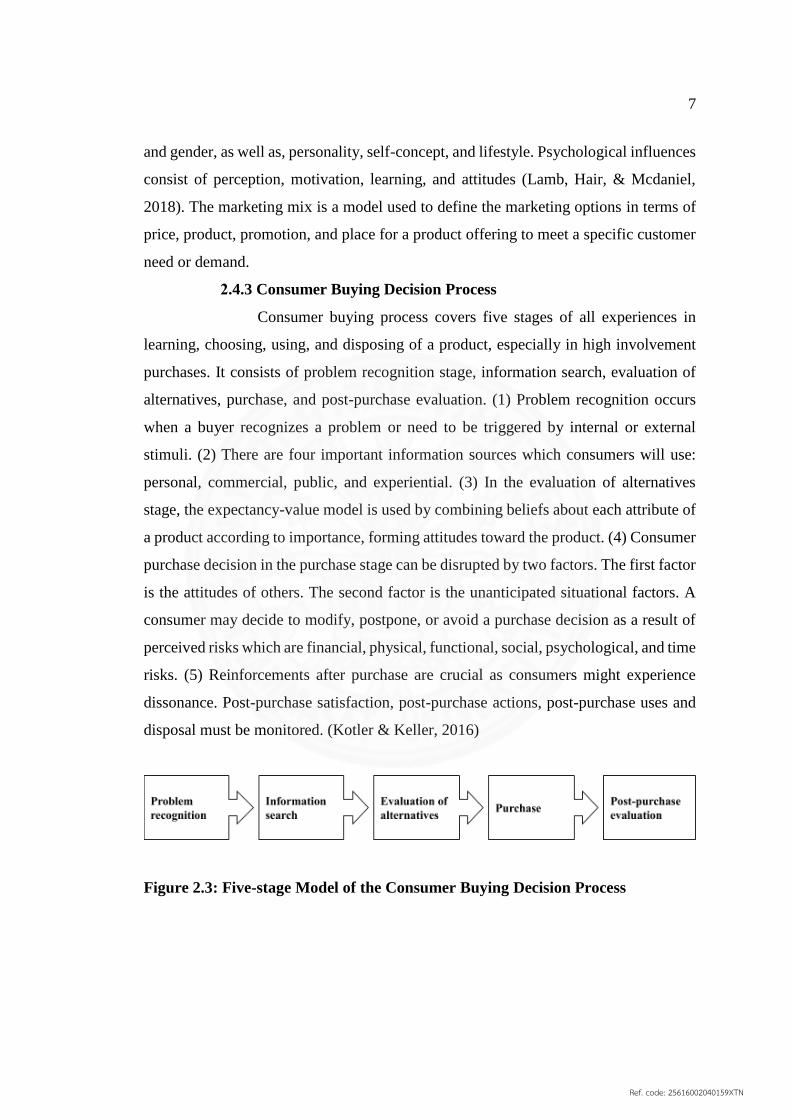
2.4.3 Consumer Buying Decision Process
Consumer buying process covers five stages of all experiences in
learning, choosing, using, and disposing of a product, especially in high involvement
purchases. It consists of problem recognition stage, information search, evaluation of
alternatives, purchase, and post-purchase evaluation. (1) Problem recognition occurs
when a buyer recognizes a problem or need to be triggered by internal or external
stimuli. (2) There are four important information sources which consumers will use:
personal, commercial, public, and experiential. (3) In the evaluation of alternatives
stage, the expectancy-value model is used by combining beliefs about each attribute of
a product according to importance, forming attitudes toward the product. (4) Consumer
purchase decision in the purchase stage can be disrupted by two factors. The first factor
is the attitudes of others. The second factor is the unanticipated situational factors. A
consumer may decide to modify, postpone, or avoid a purchase decision as a result of
perceived risks which are financial, physical, functional, social, psychological, and time
risks. (5) Reinforcements after purchase are crucial as consumers might experience
dissonance. Post-purchase satisfaction, post-purchase actions, post-purchase uses and
disposal must be monitored. (Kotler & Keller, 2016)
Figure 2.3: Five-stage Model of the Consumer Buying Decision Process
Ref. code: 25616002040159XTN

8
CHAPTER 3
RESEARCH METHODOLOGY
This study includes both exploratory and descriptive research. The research was
conducted using both qualitative and quantitative methods. In exploratory research, the
data were obtained from secondary research and in-depth interviews. In descriptive
research, the data were gathered from self-administered online questionnaires.
3.1 Exploratory Research Methodology
The exploratory research was conducted to obtain the overview information of
Ready-To-Drink meal replacement market, trends, and competitions in Thailand, as
well insights into Thai urban professionals’ lifestyles, attitudes, and behaviors,
including the features and benefits that they seek from meal replacements. The data
obtained from exploratory research was used in developing descriptive research.
3.1.1 Secondary Research
The secondary research was conducted to explore the overview of
meal replacement industry in Thailand, including opportunities, trends and key players,
and give a basic understanding of Thai urban consumers such as their lifestyles, dietary
demands and factor influencing the consumption of meal replacements. The data was
collected from academic journals, market research publication, articles, government
and trade association publications, websites, and other credible online sources.
3.1.2 In-depth Interviews
In-depth interviews was conducted to (1) understand the perception
and consumption behavior of Thai urban professionals towards regular food and Ready-
To-Drink meal replacement products, (2) explore the factors influencing the intention
to purchase Ready-To-Drink meal replacement, especially, the functional and
emotional benefits that Thai urban professionals seek, (3) gain a perspective on
consumer segmentation. Qualitative data was collected from 15 Thai urban
professionals working in Bangkok, between the age of 23 - 40 years old who have
Ref. code: 25616002040159XTN

9
consumed meal replacement products within the past 12 months. The results from in-
depth interviews were used to form hypotheses on factors influencing the intention to
purchase for further test and quantification in the descriptive research (See Appendix A:
Questions for In-depth Interview).
3.2 Descriptive Research Methodology
3.2.1 Questionnaire Design
Descriptive research was conducted in the form of a self-administered
questionnaire based on insights collected from the in-depth interviews. The purpose of
the questionnaire was to (1) identify Ready-To-Drink meal replacement potential
consumer and consumer among Thai urban professionals by benefit segmentation, (2)
identify factors influencing the intention to purchase Ready-To-Drink meal
replacement among Thai urban professionals, i.e., perceived value between regular
meal and Ready-To-Drink meal replacement, psychological factors, and situational
factors. The questionnaire was distributed to reach the target of 150 respondents.
Respondents are Thai professionals working in Bangkok, between the age of 23 - 40
years old who may or may not have consumed Ready-To-Drink meal replacement.
The questionnaire consisted of five parts. The first part measured
consumer’s past experience with Ready-To-Drink meal replacements. The second part
measured consumption purposes and behaviors. The third part was designed to
determine the importance of each product attributes. The fourth part measured
psychographic and situational factors and the fifth part consisted of socio-demographic
questions. The consumer attitudes and influencing factors were measured by Likert
scale format. Behaviors and demographics were measured in the form of multiple-
choice questions (See Appendix B: A Sample of Survey Questionnaire).
3.2.2 Key Research Variables
Key research variables were identified from exploratory research.
Perceived value between regular diet and Ready-To-Drink meal replacement,
psychological factors, and situational factors were used as independent variables.
Perceived value consists of functional benefits, emotional benefits, perceived price, and
Ref. code: 25616002040159XTN

10
Figure 3.1: Selection Criteria and Definition of Respondents
Figure 3.2: Independent Variables and Dependent Variables
Ref. code: 25616002040159XTN

11
perceived convenience. Psychological factors consist of self-perception, health
consciousness, self-efficacy, and dietary preference. Situational factors consist of
physical wellness, physical activity, degree of busyness, eating habits, and dietary
supplement intake.
3.3 Sample Size
The target population were Thai urban professionals working in Bangkok,
between the age of 23 - 40 years old. For qualitative research, the sample size for in-
depth interviews were 15 respondents. Respondents were Thai urban professionals who
had consumed meal replacement product within the past 12 months. For quantitative
research, a total of 177 respondents were selected for further analysis. Respondents
included users, potential users, and nonusers.
3.4 Data Collection
Due to limited time and resources, convenient sampling and snowball method
were used for in-depth interviews and questionnaires. 15 in-depth interviews were
conducted between December 17 - 31, 2018 by both face-to-face interviews and
telephone interviews. The interviews were sound recorded for further analysis. Each in-
depth interview took approximately 30 - 45 minutes. Respondents were recruited
through personal connections of the researcher. Self-administered questionnaires were
distributed between February 25 - March 15, 2019 to reach the target respondents of
150. The final number of valid responses were 177. The recruitment for questionnaires
were through online channels, personal connections, and the snowball method.
Respondents were qualified through a set of screening questions to ensure that the
samples will represent the population of interest. Pilot tests were conducted prior to
actual data collection with the sample size of 10 to validate and improve the questions
design and sequence from errors and misinterpretations.
Ref. code: 25616002040159XTN

12
3.5 Data Analysis Plan
The purpose of this study is to understand consumer demand for Ready-To-
Drink meal replacements among Thai urban professionals, to identify factors
influencing the intention to purchase Ready-To-Drink meal replacement, and to
identify potential consumer and consumer by benefit segmentation.
3.5.1 Exploratory Research Analysis
The data analysis was done using deductive and inductive approach.
For the inductive approach, data was grouped and analyzed for similarities and
differences. For the deductive approach, data was grouped based on frameworks and
analyzed for relationships. The analysis process was as follows: (1) Data reduction:
data was organized, cleaned and labelled and assigned to each research objectives. (2)
Coding: using content analysis, the organized data was coded by categorizing into
concepts and patterns for interpretation; using thematic analysis, data was grouped into
identified themes linking to research objectives. (3) Conclusion: implications were
validated against previous findings and research objectives to draw final conclusions.
3.5.2 Descriptive Research Analysis
The data analysis was done using the Statistic Program for the Social
Sciences (SPSS). First objective was to identify Ready-To-Drink meal replacement
potential consumer and consumer by benefit sought segmentation. The data analysis
objectives were (1) to segment Thai urban professionals, based on benefits sought; (2)
To profile segments based on demographic, behavioral, and psychographic. Statistical
methods used were cluster analysis, chi-square test, and ANOVA. Second objective
was to identify factors influencing the intention to purchase Ready-To-Drink meal
replacement among Thai urban professionals. The data analysis objectives were (1) to
determine the perceived value between regular meal and Ready-To-Drink meal
replacement; (2) to determine the relationship among the influencing factors and the
intention to purchase Ready-To-Drink meal replacements; (3) to compare the
similarities and differences between the consumer segments (current users, potential
users, and nonusers). Statistical methods used were tests of difference between groups
(t-test, ANOVA) and multiple regression
Ref. code: 25616002040159XTN

13
CHAPTER 4
RESULTS AND DISCUSSION
4.1 In-depth Interview Analysis
Research results were concluded from 15 in-depth interviews, conducted on
Thai urban professionals working in Bangkok, between the age of 23 - 40 years old
who have consumed meal replacement products within the past 12 months. Product
mentioned by the respondents were categorized into four product groups, which were
soy-based meal replacement drinks (Hooray! Better Shake), high protein drinks (Meiji
High Protein, FAV, whey protein drinks, and chicken breast drinks.), weight-control
product (BodyKey by Nutrilite), and medical nutritional drinks (Ensure, Gen-DM).
Purpose for consuming Ready-To-Drink meal replacements products
discovered from the interviews were for sport supplement, weight-control,
convenience, time-saving, better nutrition, cost-saving and taste. For sport supplement,
respondents sought high protein and low sodium features. Sugar and carbohydrates
were concerns varied between respondents who exercised to be leaner (n=3) and to gain
body mass (n=2). Product used for this purpose were high protein drinks and soy-based
meal replacement drinks. Soy-based meal replacement drinks gives moderate amount
of protein while providing lower calories which was preferred by the respondents who
exercised to be leaner, especially women. Respondents who consumed Ready-To-
Drink meal replacement for weight-control was divided into two categories, the routine
users who are heavy user (n=3), and the casual users who are light user (n=3). The
routine users used weight-control product such as BodyKey by Nutrilite as a daily meal
replacement for breakfast. Two respondents reported consuming products periodically
until desire weight is reached. One respondent found the product to be a permanent
convenience solution for diet. Protein supplements were sometimes used in combined
with weight-control product. The casual users consumed low sugar and low calories
soy-based meal replacement drinks and high protein drinks occasionally to replace
meals and to satisfy hunger between meals or late nights without adding too much
carbohydrates. Most of the respondents perceived Ready-To Drink meal replacement
Ref. code: 25616002040159XTN
14
as a solution for better health and convenience (n=10). Of which, five respondents
consumed high protein supplements and soy-based meal replacement drinks for early
commutes, two respondents to save time during busy lunch, and three respondents when
working late nights. Two respondents who consumed healthy food regularly,
considered Ready-To-Drink meal replacement consumption as a cost-saving method
since healthy food are usually more expensive than regular food. Three respondents
consumed the products for the taste.
Influencing factors toward intention to purchase Ready-To-Drink meal
replacement were hypothesized from the in-depth interview insights, and categorized
based on the objective and academic theories into three groups, which are perceived
value, psychological factors, and situational factors. First, ‘perceived value’ consisted
of functional benefit, emotional benefit, perceived value for the price, and perceived
convenience between regular daily diet and Ready-To-Drink meal replacement. From
the interviews, functional benefits were identified as nutritional value and ‘keep me
full’. Emotional benefits were identified as taste, visual appeal, healthiness, and ‘make
me feel good’ Second, ‘psychological factors’, consisted of self-perception, health
consciousness, self-efficacy, and dietary preference. From the interviews, 12
respondents considered themselves as health conscious and often looked for healthy
alternatives. 11 respondents were willing to consume less delicious products if they
were healthier. Eight respondents were willing to pay more for healthier products. Six
respondents said they took good care of their own health. Two of the them said they
exercise regularly and they believe they can commit to their healthy diet. Respondents
who consumed weight-control meal replacements expressed dissatisfaction with how
their they look. Six respondents prefer non repetitive diets. Third, ‘situational factors,
consisted of physical wellness, level of physical activity (exercise), level of busyness,
unhealthy eating habits (skip meals, instant meals, snacks, etc.), and dietary supplement
intake. Five respondents reported taking dietary supplements as another method to
fulfill nutritional needs.
In addition, some barriers to purchase intention were identified as follows. In
taste and texture aspects, eight respondents perceived that products were too sweet for
their liking and the taste of the sweetness felt chemical. Five respondents were
particular about the liquidity level, consistency, and volume. When compared to regular
Ref. code: 25616002040159XTN

15
daily diet, two respondents felt that Ready-To-Drink meal replacements cannot
completely substitute regular food because there is nothing to chew on. Six respondents
sought variety and sometimes prefer convenience food in the convenience stores. In
value for the price aspect, respondents mentioned the price should not exceed other
convenient nutritional sources. For example, two boiled eggs can yield equal amount
of protein and fullness at cheaper price. The preferred price was between 25 - 60 THB
and should not exceed 100 THB. In terms of satisfying hunger, six respondents said
they would prefer if there are products that make them feel full longer and last three to
five hours. In terms of benefit positioning, one respondent mentioned that she wanted
a solution to her breakfast problem but she didn’t consume Ready-To-Drink meal
replacement product regularly as the product is marketed as a weight-loss product.
4.2 Questionnaire Analysis
4.2.1 Profiles of Respondents
There were 250 surveys completed, of which 210 samples passed the
screening process. 177 responses were considered valid and used in data analysis. 72
respondents were current users, 87 were potential users, and 18 were nonusers. The
profile of qualified respondents were 33% male and 67% female. 69% of the profile
were between 23 and 31 years of age, 31% were between 32 and 40. For education
level, 53% of the profile were bachelor’s degree graduates, 47% were master’s degree
graduates. For occupation, 61% were corporate employees, 16% were business owners,
8% were freelancers, and 4% were government employees. 11% were reported as
having multiple occupations. 87% of the profile lived in Bangkok. 60% of the
respondents’ monthly personal incomes were between 20,001-60,000 THB (See
Appendix C: Total respondents’ socio-demographic profile).
chi-square test of independence was performed to examine the
relation between consumer segments and socio-demographic characteristics. The result
indicated that gender was significantly related with consumer segments (p < 0.05).
There was higher proportion of male respondents who were current users (45.6%),
while female respondents were higher in potential users and nonusers’ segments (71.6%
and 88.9%, respectively).
Ref. code: 25616002040159XTN

16
Table 4.1: Segment Difference by Gender
Gender Current
(n=72)
Potential
(n=87)
Non
(n=18)
Total
(n=177) x2 Sig.
Male 31 (45.6%) 22 (27.2%) 2 (11.1%) 55 (32.9%) 10.961 .027
Female 37 (54.4%) 58 (71.6%) 16 (88.9%) 111 (66.5%)
Other 0 (0.0%) 1 (1.2%) 0 (0.0%) 1 (0.6%)
Note: The numbers in the table indicate n, with column percentage in parentheses.
On product knowledge, results indicated around 50% of potential
users and nonusers had no prior knowledge of the term ‘Ready-To-Drink meal
replacement’, including 33% of the current users. For communication, online channel
and self-research were significantly related with consumer segments (p < 0.1). High
percentage of current users reportedly learned about Ready-To-Drink meal replacement
product from online (56.9%) and self-research (29.2%), comparing to potential users
and nonusers.
Table 4.2: Consumer Segments by Meal Replacement Drink Knowledge
Knowledge Current
(n=72)
Potential
(n=87)
Non
(n=18)
Total
(n=177)
x2 Sig.
Knowledge
Yes 48 (66.7%) 42 (48.3%) 9 (50.0%) 99 (55.9%) 5.692 .058
No 24 (33.3%) 45 (51.7%) 9 (50.0%) 78 (44.1%)
Communication
TV and Radio 16 (22.2%) 20 (23.0%) 2 (11.1%) 38 (21.5%) 1.289 .525
Online 41 (56.9%) 32 (36.8%) 4 (22.2%) 77 (43.5%) 10.209 .006
Recommendation 33 (45.8%) 30 (34.5%) 7 (38.9%) 70 (39.5%) 2.127 .345
Self-search 21 (29.2%) 6 (6.9%) 1 (5.6%) 28 (15.8%) 16.258 .000
Store browse 44 (61.1%) 45 (51.7%) 7 (38.9%) 96 (54.2%) 3.300 .192
Direct sales 10 (13.9%) 7 (8.0%) 5 (27.8%) 22 (12.4%) 5.572 .062
Others 1 (1.4%) 2 (2.3%) 0 (0.0%) 3 (1.7%) 0.541 .763
Note: The numbers in the table indicate means, with standard deviations in parentheses.
Dietary supplement intake was found to be significantly related to
consumer segments (p < 0.05). 68.1% of current users took dietary supplements while
66.7% of nonusers did not.
Ref. code: 25616002040159XTN

17
Table 4.3: Consumer Segments by Dietary Supplement Intake
Current
(n=72)
Potential
(n=87)
Non
(n=18)
Total
(n=177)
x2 Sig.
Dietary Supplements
Take 47 (68.1%) 40 (48.2%) 6 (33.3%) 93 (54.7%) 9.747 .008
Not take 22 (31.9%) 43 (51.8%) 12 (66.7%) 77 (45.3%)
Note: The numbers in the table indicate means, with standard deviations in parentheses.
One-way ANOVA was used to compare the means between
consumer segments against different attitudes, using the F-distribution. On health
consciousness, the means differences of ‘search for healthy alternatives’, ‘exercise’,
and ‘skip meals’ were found to be significant (p < 0.05). The result indicated that
current users searched for healthy alternatives more (M=4.25, SD=0.76) and also did
more exercise (M=3.07, SD=1.15). The mean of potential users is highest on skipping
meals (M=3.18, SD=1.46)
Table 4.4: Results of ANOVA - Consumer Segments Differences by Attitudes
Attitudes Current
(n=72)
Potential
(n=87)
Non
(n=18)
Total
(n=177)
F Sig.
Health Consciousness
Search for
healthy alternatives
4.25
(0.76)
4.13
(0.76)
3.72
(0.89)
4.14
(0.78) 3.277 .040
Exercise 3.07
(1.15)
2.24
(1.02)
2.33
(0.84)
2.59
(1.11) 12.704 .000
Skip meals 2.75
(1.48)
3.18
(1.46)
2.22
(1.17)
2.91
(1.46) 3.927 .022
Self-efficacy for healthy behavior
Take good care of health 3.46
(1.09)
2.90
(0.98)
2.94
(1.00)
3.14
(1.06) 5.912 .003
Willing to consume
less delicious products
3.65
(1.01)
3.35
(0.96)
2.67
(0.97)
3.40
(1.02) 7.428 .001
Self-perception
Physically healthy 3.65
(0.74)
3.04
(0.80)
3.28
(0.67)
3.31
(0.82) 12.183 .000
Note: The numbers in the table indicate means, with standard deviations in parentheses.
Ref. code: 25616002040159XTN

18
Chi-square test of independence was performed to examine the
relation between consumer segments and behavioral characteristics. Consumption
location and purchase channels were found to be significantly related with consumer
segments (p < 0.05). Majority of current users consumed products at home (50%),
followed by workplace (23.6%) and 16.7% consumed products at purchase points.
39.1% of potential users prefer to consume products at workplace, followed by 28.7%
who wanted to consume at home. A significantly high proportion of potential users
wanted to consumed Ready-To-Drink meal replacement while commuting (25.3%).
Convenience stores were found to be significantly related to consumer segments (p <
0.05) and were most preferred by major proportion of potential users at 85.1%. Direct
sales were also significantly related to consumer segments and in comparison, higher
percentage of current users purchased products by direct sales (18.1%)
Table 4.5: Consumer Segments by Behavioral Characteristics
Characteristics Current
(n=72)
Potential
(n=87)
Total
(n=159)
x2 Sig.
Behavioral
Consumption Location
Home 36 (50%) 25 (28.7%) 61(38.4%) 18.543 .001
Workplace 17(23.6%) 34 (39.1%) 51 (32.1%)
Purchase Point 12 (16.7%) 6 (6.9%) 18 (11.3%)
On-the-Go 6 (8.3%) 22 (25.3%) 28 (17.6%)
Other 1 (1.4%) 0 (0.0%) 1 (0.6%)
Purchase Channels
Convenience
store
35 (48.6%) 74 (85.1%) 109 (68.6%) 24.275 .000
Supermarket 29 (40.3%) 46 (52.9%) 75 (47.2%) 2.508 .113
Direct sales 13 (18.1%) 3 (3.4%) 16 (10.1%) 9.288 .002
Online 22 (30.6%) 17 (19.5%) 39 (245%) 2.582 .108
Others 6 (8.3%) 0 (0.0%) 6 (3.8%) 7.534 .006
Note: The numbers in the table indicate means, with standard deviations in parentheses.
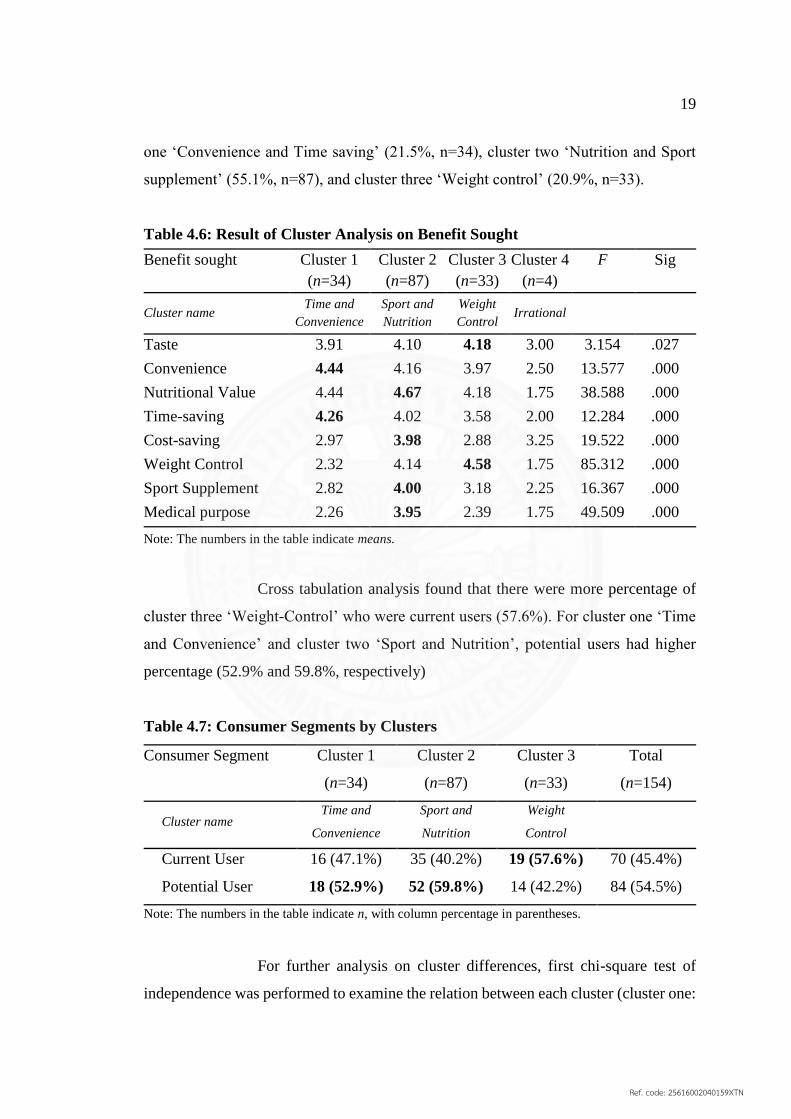
4.2.2 Benefit Segmentation
The cluster analysis was used to segment 158 potential users and
current users based on benefit sought. Three important segments were identified: cluster
Ref. code: 25616002040159XTN
19
one ‘Convenience and Time saving’ (21.5%, n=34), cluster two ‘Nutrition and Sport
supplement’ (55.1%, n=87), and cluster three ‘Weight control’ (20.9%, n=33).
Table 4.6: Result of Cluster Analysis on Benefit Sought
Benefit sought Cluster 1
(n=34)
Cluster 2
(n=87)
Cluster 3
(n=33)
Cluster 4
(n=4)
F Sig
Cluster name Time and
Convenience
Sport and
Nutrition
Weight
Control Irrational
Taste 3.91 4.10 4.18 3.00 3.154 .027
Convenience 4.44 4.16 3.97 2.50 13.577 .000
Nutritional Value 4.44 4.67 4.18 1.75 38.588 .000
Time-saving 4.26 4.02 3.58 2.00 12.284 .000
Cost-saving 2.97 3.98 2.88 3.25 19.522 .000
Weight Control 2.32 4.14 4.58 1.75 85.312 .000
Sport Supplement 2.82 4.00 3.18 2.25 16.367 .000
Medical purpose 2.26 3.95 2.39 1.75 49.509 .000
Note: The numbers in the table indicate means.
Cross tabulation analysis found that there were more percentage of
cluster three ‘Weight-Control’ who were current users (57.6%). For cluster one ‘Time
and Convenience’ and cluster two ‘Sport and Nutrition’, potential users had higher
percentage (52.9% and 59.8%, respectively)
Table 4.7: Consumer Segments by Clusters
Consumer Segment Cluster 1
(n=34)
Cluster 2
(n=87)
Cluster 3
(n=33)
Total
(n=154)
Cluster name Time and
Convenience
Sport and
Nutrition
Weight
Control
Current User 16 (47.1%) 35 (40.2%) 19 (57.6%) 70 (45.4%)
Potential User 18 (52.9%) 52 (59.8%) 14 (42.2%) 84 (54.5%)
Note: The numbers in the table indicate n, with column percentage in parentheses.
For further analysis on cluster differences, first chi-square test of
independence was performed to examine the relation between each cluster (cluster one:
Ref. code: 25616002040159XTN

20
Time and Convenience, Cluster two: Sport and Nutrition, Cluster three: Weight
Control) and socio-demographic characteristics. All of the relations between these
variables were insignificant (p > 0.05). The socio-demographic characteristics of the
total current users and potential users from all three clusters were 64.4% female, 69.0%
between the age of 23-31 years old, 99.4% had bachelor’s degree or higher, 61% were
office employees, 61% had monthly personal income of 20,001-60,000 THB, and
87.7% were Bangkok residents (See Appendix D: Cluster Differences by Socio-
demographic Characteristics).
The second chi-square test of independence was performed to
examine the relation between each cluster and behavioral and psychographic
characteristics. For behavioral characteristics, consumption patterns, consumption
locations, and two of the purchase channels were found to be significantly related with
cluster segments (p < 0.05). In terms of consumption pattern, the majority of cluster
one and cluster two consumes Ready-To-Drink meal replacement occasionally (55.9%
and 49.4% respectively), followed by few times a week (32.4% and 19.5%
respectively), while cluster three had higher percentages of respondents who consume
periodically (33.3%) and once a week (15.2%) than the other clusters. In terms of
consumption location, the majority of cluster one consumes Ready-To-Drink meal
replacement at their workplaces (47.1%), and cluster two and cluster three at home
(34.5% and 54.5%, respectively). However, cluster two has significantly higher
percentage of people who consume Ready-To-Drink on-the-go and at purchase points
(24.1% and 14.9%, respectively). In terms of purchase channels, cluster one and two
have the highest percentage of purchasing products from convenient store (76.5% and
73.6%), while cluster three has the highest percentage of purchasing products from
online direct sales (27.3%). For psychographic characteristics-busyness, cluster two has
the highest percentage of people who can manage daily tasks (74.4%), while cluster
one has the highest percentage of people who cannot manage daily tasks (48.4%).
Ref. code: 25616002040159XTN

21
Table 4.8: Cluster Differences by Behavioral and Psychographic Characteristics
Characteristics
Cluster 1
(n=34)
Cluster 2
(n=87)
Cluster 3
(n=33)
Total
(n=154)
x2 Sig.
Time and
Convenience
Sport and
Nutrition
Weight
Control
Behavioral
Consumption Pattern
Occasionally 19 (55.9%) 43 (49.4%) 11 (33.3%) 73 (47.4%) 22.864 .011
Periodically 1 (2.9%) 13 (14.9%) 11 (33.3%) 25 (16.2%)
Once a week 2 (5.9%) 8 (9.2%) 5 (15.2%) 15 (9.7%)
Few times a
week 11 (32.4%) 17 (19.5%) 2 (6.1%) 30 (19.5%)
Workdays 1 (2.9%) 3 (3.4%) 1 (3.0%) 5 (3.2%)
Everyday 0 (0.0%) 3 (3.4%) 3 (9.1%) 6 (3.9%)
Consumption Location
Home 11 (32.4%) 30 (34.5%) 18 (54.5%) 59 (38.3%) 17.233 .028
Workplace 16 (47.1%) 23 (26.4%) 10 (30.3%) 49 (31.8%)
Purchase Point 2 (5.9%) 13 (14.9%) 2 (6.1%) 17 (11.0%)
On-the-Go 5 (14.7%) 21 (24.1%) 2 (6.1%) 28 (18.2%)
Other 0 (0.0%) 0 (0.0%) 1 (3.0%) 1 (0.6%)
Consumption Time
Morning 12 (35.3%) 36 (41.4%) 14 (42.4%) 62 (40.3%) 5.642 .687
Noon 4 (11.8%) 6 (6.9%) 1 (3.0%) 11 (7.1%)
Afternoon 6 (17.6%) 11 (12.6%) 2 (6.1%) 19 (12.3%)
Evening 8 (23.5%) 27 (31.0%) 13 (39.4%) 48 (31.2%)
Late evening 4 (11.8%) 7 (8.0%) 3 (9.1%) 14 (9.1%)
Purchase Channels
Convenience
store
26 (76.5%) 64 (73.6%) 15 (45.5%) 105 (68.2%) 10.095 .006
Supermarket 15 (44.1%) 46 (52.9%) 11 (33.3%) 72 (46.8%) 3.791 .150
Direct sales 0 (0.0%) 6 (6.9%) 9 (27.3%) 15 (9.7%) 16.007 .000
Online 5 (14.7%) 23 (26.4%) 11 (33.3%) 39 (25.3%) 3.203 .202
Others 2 (5.9%) 3 (3.4%) 1 (3.0%) 6 (3.9%) 0.471 .790
psychographic
Level of busyness
Manageable 16 (51.6%) 64 (74.4%) 18 (60.0%) 98 (66.7%) 6.087 .048
Unmanageable 15 (48.4%) 22 (25.6%) 12 (40.0%) 49 (33.3%)
Note: The numbers in the table indicate n, with column percentages in parentheses.
Ref. code: 25616002040159XTN

22
One-way ANOVA was used to compare the means between each
cluster segments against different attitudes, using the F-distribution. All of the means
differences were found to be insignificant (p > 0.05). In terms of health consciousness,
the mean of the total profile for ‘search for healthy alternatives’ is 4.22 (SD=0.67),
exercise is 2.59 (SD=1.12), water consumption is 3.08 (SD=1.02), fruit and vegetable
consumption is 2.71 (SD=0.72), meal skipping is 2.99 (SD=1.47), instant meal
consumption is 2.78 (SD=1.06), and snacking between meals is 3.31 (SD=1.26). In
terms of self-efficacy for healthy behavior, the mean of the total profile for ‘take good
care of health’ is 3.17 (SD=1.06), ‘willing to pay more for healthier products’ is 4.01
(SD=0.78), and ‘willing to consume less delicious product if it is healthier’ is 3.52
(SD=0.96). In terms of diet preference, the mean of the total profile for ‘like to try new
things’ is 3.72 (SD=0.82) and ‘able to eat the same thing repeatedly’ is 3.71 (SD=0.91).
In terms of self-perception, the mean of the total profile for ‘happy with own body’ is
3.17 (SD=1.00) and ‘physically healthy’ is 3.31 (SD=0.84) (See Appendix E: Cluster
Differences by Consumers’ Attitudes).
One-way ANOVA was also used to compare the means between each
cluster segments against different the importance of each product attributes, using the
F-distribution. In terms of important nutritional attributes, the means differences on
high fiber, low calories, low carbohydrate and sugar, low fat, low sodium, and specific
compound added were significant (p < 0.05). The means of cluster one on all significant
attributes are relatively low compared to other clusters. The means of cluster two ‘Sport
and Nutrition’ on high fiber, low fat, low sodium and specific compound added are
highest at 4.27 (SD=0.68), 4.42 (SD=0.74), 4.31 (SD=0.72), and 3.23 (SD=0.90),
respectively. The means of cluster three ‘Weight Control’, on low calories and low
carbohydrate and sugar are highest at 4.55 (SD=0.57) and 4.39 (SD=0.76), respectively.
In terms of important convenience attributes, the means difference on time-saving was
significant (p < 0.05). The means of cluster one and two are similar at 4.25 (SD=0.76)
and 4.28 (SD=0.66), while cluster three is at 3.90 (SD=0.75).
Ref. code: 25616002040159XTN

23
Table 4.9: Results of ANOVA - Cluster Differences by Product Attributes
Attributes
Cluster 1
(n=34)
Cluster 2
(n=87)
Cluster 3
(n=33)
Total
(n=154)
F Sig.
Time and
Convenience
Sport and
Nutrition
Weight
Control
Important nutritional attributes
Complete nutrition 4.09
(0.93)
4.40
(0.67)
4.16
(0.64)
4.28
(0.74) 2.535 .083
High in protein 3.91
(0.78)
4.19
(0.74)
3.97
(0.95)
4.08
(0.80) 1.830 .164
High in fiber 3.72
(0.92)
4.27
(0.68)
3.84
(0.73)
4.06
(0.78) 8.011 .000
Low calories 3.34
(0.97)
4.36
(0.78)
4.55
(0.57)
4.18
(0.90) 23.645 .000
Low carbohydrates/sugar 3.91
(0.93)
4.33
(0.77)
4.39
(0.76)
4.25
(0.82) 3.732 .026
Low fat 3.44
(0.91)
4.42
(0.74)
4.35
(0.71)
4.19
(0.87) 19.478 .000
Low sodium 3.84
(0.90)
4.31
(0.72)
3.94
(0.68)
4.14
(0.78) 5.890 .003
Energizing
(e.g., contain caffeine)
2.78
(1.07)
3.23
(0.92)
3.06
(1.06)
3.10
(0.99) 2.491 .086
Specific compound added
(e.g., collagen, l-carnitine, etc.)
2.72
(0.89)
3.23
(0.90)
2.58
(0.92)
2.99
(0.94) 7.710 .001
Important convenience attributes
Ease of consumption 4.31
(0.82)
4.33
(0.62)
4.23
(0.56)
4.30
(0.65) .267 .766
Easy to find 4.31
(0.69)
4.33
(0.66)
4.10
(0.60)
4.28
(0.66) 1.460 .236
Portability 3.75
(0.92)
4.10
(0.80)
3.81
(0.75)
3.97
(0.83) 2.965 .055
Time-saving 4.25
(0.76)
4.28
(0.66)
3.90
(0.75)
4.19
(0.71) 3.390 .036
Note: The numbers in the table indicate means, with standard deviations in parentheses.
4.2.3 Factors Influencing the Intention to Purchase
A paired sample t-test was conducted to compare each factors of
consumer perceived value between importance on choosing regular daily diet and
Ready-To-Drink meal replacement satisfaction level. Taste is the most important factor
Ref. code: 25616002040159XTN

24
in regards of choosing a regular diet (M=4.27, SD=0.68), followed by value for the price
(M=4.03, SD=0.71) and ‘make me feel good’ (M=3.90, SD=0.76), respectively.
However, the paired sample t-test results showed that consumer satisfaction toward
Ready-To-Drink meal replacement on taste (M=3.99, SD=0.89), value for the price
(M=3.69, SD=0.99), and ‘make me feel good’ (M=3.69, SD=0.86) were significantly
lower (p < 0.05). In regards of satisfaction, healthiness is the most satisfied factor
(M=4.28, SD=0.78), followed by nutrition (M=4.26, SD=0.76). The scores of both
factors on satisfaction (M=3.97, SD=0.79 and M=3.84, SD=0.88) are significantly
higher than importance on choosing regular diet (p < 0.05). Convenience, ‘keep me
full’, and visual appeal did not differ significantly (p > 0.05)
Table 4.10: Results of t-test and Descriptive Stats for Consumer Perceived Value
Outcome Importance on
choosing diet
RTD-MR
Satisfaction Mean Diff. t Sig.
Taste 4.27
(0.68)
3.99
(0.89)
0.28
(1.01) 3.470 .001
Visual appeal 3.38
(0.74)
3.35
(0.88)
0.03
(0.93) .340 .735
Nutrition 3.84
(0.88)
4.26
(0.76)
-0.42
(1.01) -5.268 .000
Healthiness 3.97
(0.79)
4.28
(0.78)
-0.30
(0.93) -4.080 .000
Keep me full 3.78
(0.84)
3.82
(0.92)
-0.04
(1.12) -.495 .621
Make me feel good 3.90
(0.76)
3.69
(0.86)
0.21
(0.94) 2.779 .006
Value for the price 4.03
(0.71)
3.69
(0.99)
0.34
(1.09) 3.861 .000
Convenience 3.96
(0.68)
4.08
(0.74)
-0.11
(0.83) -1.727 .086
Note: The numbers in the table indicate means, with standard deviations in parentheses.
Multiple regression analysis was used to test if the following factors
significantly influence the intention to purchase Ready-To-Drink meal replacement of
current users, potential users, and nonusers. Overall, three factors explained 20.4% of
the variance in the total profile of current users, potential users, and nonusers ((R2=.20,
Ref. code: 25616002040159XTN

25
F=3.08, p < .05). The results indicated higher purchase intention was significantly
influenced by negative self-perception (β=-.24, p < .05), higher health consciousness
(β=.25, p < .05), and dietary supplement intake (β=.33, p < .05). For current users, three
factors explained 38.4% of the variance (R2=.38, F=2.63, p < .05). Higher purchase
intention was found to be significantly influenced by non-fussy diet preference (β=.29,
p < .05), higher physical wellness (β=.27, p < .05), and lower physical activity (β=-.17,
p < .05). For potential users, two factors explained 23.2% of the variance (R2=.23,
F=1.60, p = .11). Higher purchase intention was found to be significantly influenced by
lower self-perception (β=-.31, p < .05) and lower ability to overcome busyness (β=-.31,
p < .05). For nonusers, the factors were non-significant. (See Appendix D: Multiple
Regression on Factors Influencing Intention to Purchase).
Table 4.11: Multiple Regression on Factors Influencing Intention to Purchase
Current User Potential User Nonuser Total
(Constant) 1.186 3.893 -3.427 1.074
Perceived Value
Functional benefit .001 -.057 1.287 -.002
Emotional benefit -.185 -.067 .003 -.046
Perceived price .042 -.030 -.443 .124
Perceived convenience .175 -.135 -.170 -.103
Psychological factors
Self-perception -.024 -.308* -.038 -.241*
Health consciousness .156 .118 .924 .253*
Self-efficacy .090 .144 -1.254 .273
Diet preference .291* -.060 1.395 .080
Situational factors
Physical wellness .270* .088 -.638 .186
Physical activity -.171* .085 1.128 .050
Level of busyness -.209 -.287* .022 -.128
Unhealthy eating habits .061 .179 -.551 .075
Supplement intake .270 -.054 .152 .330*
R .619 .481 .879 .452
R Square .384 .232 .773 .204
Adjusted R Square .238 .087 .034 .138
F 2.632 1.600 1.046 3.08
Sig. .006 .106 .537 .000
Note: The numbers in the table indicate β, * Significant at p < 0.05
Ref. code: 25616002040159XTN

26
CHAPTER 5
CONCLUSIONS AND RECOMMENDATIONS
5.1 Conclusion and Managerial Implication
Overall, there was no significant difference in consumer segments in terms of
socio-demographic. However, there was a higher proportion male current user which
can be related to high amounts of current users who are in sport and nutrition segment,
high proportion of female were nonusers and potential users which could means
opportunity for marketing Ready-To-Drink meal replacement to female consumers.
The term Ready-To-Drink meal replacement could be educated more to consumer to
signify dietary functions since high percentage of all consumer segments did not know
this term even though they had awareness of the products in the market. Online channels
were the main source of product awareness for current users. Hence, online advertising
should be tailored to broaden awareness to other segments. Current users also became
aware of products by self-search which means that they were more conscious of their
dietary needs. To reach potential users, communication focus should be expanded to
other channels such as purchase points. Ready-To-Drink meal replacements can be
successfully promoted to the same audience as dietary supplement users since there
were many current users reportedly use dietary supplements and already had nutritional
knowledge. Based on research results, current users were health conscious consumer
who had self-efficacy for healthy behaviors, while potential users were most prone to
skipping meals but also open to less delicious but healthy products. Ready-To-Drink
meal replacement can be marketed to meet this need. According to research findings,
in addition to convenience store and supermarket, there were also opportunities to
market products to be available near office buildings and public transportation
locations.
Three major clusters were identified from current users and potential users
based on benefit segmentation. First cluster sought convenience and time saving
benefit. Second cluster ‘Sport and Nutrition’ sought nutritional, sport supplement, cost-
saving, and medical benefits. Third cluster ‘Weight-control’ sought weight-control and
Ref. code: 25616002040159XTN

27
taste benefits. ‘Sport and Nutrition’ was the largest cluster at 54%. ‘Time and
Convenience’ and ‘Weight-control’ cluster were equally smaller. ‘Weight-control’ had
the lowest proportion of potential users which could mean that growth is in the ‘Time
and Convenience’ and ‘Sport and Nutrition’ clusters. In terms of product attributes,
‘Time and Convenience’ users wanted complete nutrition and convenience. ‘Sport and
Nutrition’ users wanted high protein, low fat, low sodium. They also sought high fiber
and specific compound added. Time-saving and portability were also more concerned
by this group. ‘Weight-control’ users wanted low calories, low carbohydrates and low
sugar product which are easy to consume. On consumption habits and lifestyle, ‘Time
and Convenience’ users were likely to purchase products at convenience store and
consume products occasionally to few times a week at their workplace. They were busy
consumer who felt that daily tasks were more than manageable. ‘Sport and Nutrition’
users were also likely to purchase products at convenience store and consume products
occasionally to few times a week but at home, purchase points, and while commuting.
They lived an active and manageable lifestyle. ‘Weight-control’ users were likely to
purchase products from all channels, however they had higher tendency than other
groups to purchase from direct sales and online channels since weight-control products
were especially sold more by these channels. Heavy users were likely to consume
product every day or periodically, while light users were likely to consume once a week.
Marketing managers can use the insights from benefit segmentation.
Taste, value for the price, healthiness and ‘make me feel good’ were the most
important factors for choosing daily diet among Thai urban professionals. Except for
healthiness, consumer satisfaction of the products was significantly lower than the
expectation of daily diet in three of the important factors. The satisfaction of Ready-
To-Drink meal replacement products significantly exceeded expectation of regular diet
in nutrition and healthiness. The influencing factors for purchasing intentions are
negative self-perception, high health consciousness, and dietary supplement intake.
Current users who were non-fussy eater and had low physical activities had higher
purchase intention. Potential users were influenced by low self-perception and lower
ability to overcome busyness.
Ref. code: 25616002040159XTN
28
For recommendations, marketing managers can communicate product function
as meal replacement in addition to specific nutritional features, to serve as a solution
for meal skipping behavior among potential users. Potential users are lower
involvement consumer who have moderate health consciousness and self-efficacy for
healthy behaviors. Information and marketing communication should be made at
purchase points, especially in convenience stores which is the most preferred channel.
Moreover, consumption behaviors suggested office buildings and public transportation
locations such as mass transit system stations (BTS and MRT) can also be effective
locations for new channels to market breakfast replacement suitable for commuting.
Product features and marketing elements to be improved are taste, value for the price,
and feel good factors. Marketing message should focus on personal appearance
improvement and solution to daily life hassles. Dietary supplement users have high
potential on becoming Ready-To-Drink meal replacement users. ‘Sport and nutrition’
users are the highest segment, followed by ‘Time and Convenience’. There are lower
opportunities on potential consumer in the ‘Weight control’ segment. Product features
for “Sport and Nutrition should focus on high protein, low fat and low sodium with
additional fiber and specific compound added for product differentiation. ‘Time and
Convenience’ users seek quick and easy complete nutrition.
5.2 Research Limitation
Due to time constraint and limited budget, the questionnaire was distributed
online and non-probability were used for data collection. The sample size was relatively
small, and female biased. Therefore, the findings cannot be generalized to the entire
population since such inference would need a sample that is larger and better represents
the population. The unproportionate nature of the respondents in each consumer
segments (current users, potential users, and nonusers) affected the integrity of the
analysis results. Segmentation and clusters comparison were limited to the analogous
socio-demographic characteristics of urban professional samples.
The term ‘meal replacement’ was not a widely generalized term among Thai
consumers. Therefore, responses in the questionnaire may be distorted to individual
misconceptions. In addition, Ready-To-Drink meal replacements in Thailand are still
Ref. code: 25616002040159XTN

29
limited. The product used by consumers as meal replacements in this research may not
fit all definitions of meal replacement by the official Food and Drug Administration.
Despite best efforts in planning and structuring this study, the researcher had
limited experience in descriptive research and analysis. While the methodology
employed in this research fall into a quantitative research, causality interpretation from
this research should be done in a cautious manner, especially for marketing managers
aiming to launch new products.
5.3 Suggestion for Future Study
This research, influencing factors on purchase intentions were mainly
determined in consumer behavior aspects in terms of situational and psychological
influences. Further research can focus more on market stimuli (product, price,
distribution, and communication) and explore the social influences and purchase
decision in the Influences on Consumer Behavior model. In terms of samples,
segmentation and clusters comparison were limited to the analogous socio-
demographic characteristics of urban professional samples. The sample can be
improved by widening the demographic and by using probability and proportion
sampling. In determining the perceived value between regular diet and Ready-To-Drink
meal replacement, the analysis can be improved by dividing the satisfaction of meal
replacement products into product categories. To build on the insights from this
research, comparative studies can be done between ‘officers’ and ‘sportsman’, and also
between animal-based products and plant-based products.
Ref. code: 25616002040159XTN

30
REFERENCES
Books and Book Articles
Kotler, P., & Keller, K. L. (2016). Marketing Management: Global Edition. Essex:
Pearson Education Limited.
Lamb, C. W., Hair, J. F., & Mcdaniel, C. (2018). MKTG: Principles of Marketing.
Boston, MA: Cengage Learning.
Electronic Media
Canadian Food Inspection Agency. (2018, May 11). Labeling Requirements for Foods
for Special Dietary Use. Retrieved November 25, 2018, from Canadian Food
Inspection Agency: http://www.inspection.gc.ca/food/labelling/food-labelling-
for-industry/foods-for-special-dietary/eng/1393627685223/1393637610720?
chap=16#s29c16
CB Insights. (2017, December 14). We Analyzed 9 Of The Biggest Direct-to-
Consumer Success Stories To Figure Out The Secrets to Their Growth —
Here’s What We Learned. Retrieved November 25, 2018, from CB Insights:
https://www.cbinsights.com/research/direct-to-consumer-retail-strategies/
Euromonitor International. (2018, January). Consumer Lifestyles in Thailand.
Retrieved November 25, 2018, from Euromonitor:
http://www.euromonitor.com/
Euromonitor International. (2018, October). Weight Management and Wellbeing in
Thailand. Retrieved November 25, 2018, from Euromonitor:
http://www.euromonitor.com/
Euromonitor International. (2017, June). Weight Management and Wellbeing: Trends
and Innovations. Retrieved November 25, 2018, from Euromonitor:
http://www.euromonitor.com/
Ivanovitch, K., Klaewkla, J., Chongsuwat, R., Viwatwongkasem, C., & Kitvorapat,
W. (2014, December 2). The Intake of Energy and Selected Nutrients by Thai
Ref. code: 25616002040159XTN

31
Urban Sedentary Workers: An Evaluation of Adherence to Dietary
Recommendations. Retrieved November 25, 2018, from Hindawi:
https://www.hindawi.com/journals/jnme/2014/145182/
Krasny, L. T. (2004, December 3). Regulatory Issues: Meal Replacements –
Convenience or Compromise? Retrieved November 25, 2018, from Food
Processing: https://www.foodprocessing.com/articles/2004/53/
Srikant, M. (2017, April 10). A meal-replacement shake for busy professionals.
Retrieved November 25, 2018, from Smart CEO:
http://smartceo.co/a-meal-replacement-shake-for-busy-professional
Ref. code: 25616002040159XTN

APPENDICES
Ref. code: 25616002040159XTN
33
APPENDIX A
QUESTIONS FOR IN-DEPTH INTERVIEWS
1. What are the factors you use for choosing a regular daily diet?
2. What does your daily diet usually look like?
3. How much do you spend on a regular meal?
4. Do you think your current diet is healthy? If not, what are your concerns?
5. Do you find your workday diet convenient? If not, what are the inconveniences?
6. How often do you find yourself skipping a meal or not having a proper meal?
7. What are your usual reasons for skipping a meal or not having a proper meal?
8. How did you become aware of meal replacement drinks?
9. Which meal replacement drinks have you consumed in the past 12 months?
10. Where did you buy the product?
11. What was your purpose in purchasing the product?
12. How satisfied were you with the product?
13. What would be the reasons for you to stop consuming meal replacement drinks?
14. Describe your meal replacement drink consumption habit.
15. Do you look for a better solution to your diet? If so, what features do you seek?
16. How would you feel about a meal replacement drink, marketed directly to urban
professionals as a healthy and convenient solution to a busy lifestyle?
17. Are you a health-conscious person?
18. Describe your healthy and unhealthy behaviors.
19. Demographic questions (gender, age, occupation, household size)
Ref. code: 25616002040159XTN

34
APPENDIX B
A SAMPLE OF SURVEY QUESTIONNAIRE
Part 1: preliminary questions
1. How important are these following factors on choosing your regular daily diet?
(1 = very unimportant, 5 = very important)
a. Taste b. Visual appeal
c. Nutrition d. Healthiness (not bad for health)
e. Keep me full f. Make me feel good
g. Value for the price h. Convenience
2. Do you know what is “meal replacement drink”?
a. Yes b. No
Definition of meal replacement drink
Meal replacement drink or shake is a formulated drink that can replace one or more
daily meals. It gives minimum energy of 225 calories per serving and has a specified
amount and quality of protein, carbohydrates, fat, and various vitamins and mineral
nutrients. It can be used for many purposes such as weight reduction diet, daily meals
replacement, instant breakfast, and sports supplement.
3. Which of these meal replacement drinks have you seen before?
(Select all that apply)
a. High protein supplements (e.g., Meiji High Protein, FAV High protein milk)
b. Plant-based drinks (e.g., Tipco Beat High Protein, Hooray! Better Shake)
c. Weight-control product (e.g., BodyKey by Nutrilite-Amway, Herbalife)
d. Medical nutritional drinks (e.g., Ensure, Gen-DM)
e. None (proceed to 1-E)
f. Others (please specify)
Ref. code: 25616002040159XTN

35
Part 1-A: Consumers who have awareness of meal replacement products
4. How did you become aware of the meal replacement products you have selected
(Select all that apply)?
a. TV/Radio b. Online
c. Personal Recommendation d. Self-search
e. Store browse f. Direct sales
g. Others (please specify)
5. How relevant are the benefit claims of products in the market to your needs?
a. Very relevant b. Relevant
c. So-so d. Not so relevant
e. Not at all relevant
6. Which meal replacement drinks have you consume before? (Select all that apply)
a. High protein supplements (e.g., Meiji High Protein, FAV High protein milk)
b. Plant-based drinks (e.g., Tipco Beat High Protein, Hooray! Better Shake)
c. Weight-control product (e.g., BodyKey by Nutrilite-Amway, Herbalife)
d. Medical nutritional drinks (e.g., Ensure, Gen-DM)
e. None (proceed to 1-E)
f. Others (please specify)
Part 1-B: Consumers who have tried meal replacement products
7. How well do meal replacement drinks in the market actually meet your needs?
a. Very well b. Well
c. So-so d. Not so well
e. Not at all well
8. How satisfied were you with your choice of meal replacement drink according to
each following factor? (1 = very unsatisfied, 5 = very satisfied)
a. Taste b. Visual appeal
Ref. code: 25616002040159XTN

36
c. Nutrition d. Healthiness (not bad for health)
e. Keep me full f. Make me feel good
g. Value for the price h. Convenience
9. Have you consumed meal replacement drinks in the past 12 months?
a. Yes b. No
Part 1-C: Potential for future consumption
10. How would you feel about a meal replacement drink, marketed directly to urban
professionals as a healthy and convenient solution to a busy lifestyle?
a. Very interested b. Interested
c. So-so d. Not so interested
e. Not at all interested
11. How likely will you consume meal replacement drinks in the next 12 months?
a. Definitely b. Very likely
c. Likely d. Unlikely
e. Definitely not
Part 2: Current user and Potential user
12. Which meal replacement drinks will you be interested to consume in the future?
(Select all that apply)
a. High protein supplements (e.g., Meiji High Protein, FAV High protein milk)
b. Plant-based drinks (e.g., Tipco Beat High Protein, Hooray! Better Shake)
c. Weight-control product (e.g., BodyKey by Nutrilite-Amway, Herbalife)
d. Medical nutritional drinks (e.g., Ensure, Gen-DM)
e. None (proceed to 1-E)
f. Others (please specify)
Ref. code: 25616002040159XTN

37
13. What would be your purpose for consuming meal replacement drinks? Please rate
the factors below according to the level of importance.
(1 = very unimportant, 5 = very important)
a. Taste b. Convenience
c. Nutritional Value d. Time-saving
e. Cost-saving f. Weight Control
g. Sport Supplement h. Medical purpose
i. Others (please specify)
14. How often are you likely to consume meal replacement drinks?
a. Occasionally b. Periodically
c. Once a week d. Few times a week
e. Workdays f. Everyday
15. Where are you most likely to consume meal replacement drinks?
a. Home b. Workplace
c. Purchase point d. On-the-go (while commuting)
e. Others (please specify)
16. When are you most likely to consume meal replacement drinks?
a. Morning b. Noon
c. Afternoon d. Evening
e. Late evening
17. Where are you most likely to purchase meal replacement drinks
(select all that apply)
a. Convenience store b. Supermarket
c. Direct sales d. Online
e. Others (please specify)
Ref. code: 25616002040159XTN

38
Part 3: Product Attributes
18. How important are each following nutritional factors on your meal replacement
drinks consumption? (1 = very unimportant, 5 = very important)
a. Complete nutrition b. High in protein
c. High in fiber d. Low calories
e. Low carbohydrates/sugar f. Low fat
g. Low sodium h. Energizing (e.g., contain caffeine)
i. Specific compound added
(e.g., collagen, l-carnitine, etc.)
19. How important are each following convenient factors on your meal replacement
drinks consumption? (1 = very unimportant, 5 = very important)
a. Ease of consumption b. Easy to find
c. Portability d. Time-saving
Part 4: Health behaviors and concerns
20. How much do you agree with the following statements?
(1 = strongly disagree, 5 = strongly agree)
a. I search for healthy alternatives
b. I’m willing to pay more for healthier products
c. I’m willing to consume less delicious product if it’s healthier
d. I’m happy with my body
e. I’m physically very healthy
f. I take very good care of my health
g. I like to try new things
h. I can eat the same thing repeatedly
Ref. code: 25616002040159XTN

39
APPENDIX C
TOTAL RESPONDENTS’ SOCIO-DEMOGRAPHIC PROFILE
Table C: Total Respondents by Socio-demographic Characteristics
Characteristics Current
(n=72)
Potential
(n=87)
Non
(n=18)
Total
(n=177) x2 Sig.
Socio-demographic Gender
Male 31 (45.6%) 22 (27.2%) 2 (11.1%) 55 (32.9%) 10.961 .027
Female 37 (54.4%) 58 (71.6%) 16 (88.9%) 111 (66.5%)
Other 0 (0.0%) 1 (1.2%) 0 (0.0%) 1 (0.6%)
Age
23-31 years 43 (63.2%) 60 (75.0%) 13 (72.2%) 116 (69.9%) 2.470 .291
32-40 years 25 (36.8%) 20 (25.0%) 5 (27.8%) 50 (30.1%)
Education Level
Vocational 0 (0.0%) 1 (1.2%) 0 (0.0%) 1 (0.6%) 3.679 .451
Bachelor
degree 31 (45.6%) 47 (58.0%) 10 (55.6%) 88 (52.7%)
Master degree 37 (54.4%) 33 (40.7%) 8 (44.4%) 78 (46.7%)
Occupation
Employee 36 (52.9%) 55 (67.9%) 11 (61.1%) 102 (61.1%) 12.575 .127
Business
Owner 16 (23.5%) 8 (9.9%) 3 (16.7%) 27 (16.2%)
Gov. Employee 4 (5.9%) 1 (1.2%) 1 (5.6%) 6 (3.6%)
Freelance 4 (5.9%) 10 (12.3%) 0 (0.0%) 14 (8.4%)
Multiple Occ. 8 (11.8%) 7 (8.6%) 3 (16.7%) 18 (10.8%)
Monthly Personal Income (THB)
< 20,001 5 (7.4%) 6 (7.4%) 0 (0.0%) 11 (6.6%) 3.480 .901
20,001-40,000 20 (29.4%) 24 (29.6%) 6 (33.3%) 50 (29.9%)
40,001-60,000 21 (30.9%) 25 (30.9%) 6 (33.3%) 52 (31.1%)
60,001-80,000 9 (13.2%) 16 (19.8%) 3 (16.7%) 28 (16.8%)
> 80,000 13 (19.1%) 10 (12.3%) 3 (16.7%) 26 (15.6%)
Type of dwelling
Single house 25 (36.8%) 31 (38.3%) 9 (50.0%) 65 (38.9%) 11.112 .195
Townhouse 13 (19.1%) 17 (21.0%) 3 (16.7%) 33 (19.8%)
Condominium 25 (36.8%) 24 (29.6%) 4 (22.2%) 53 (31.7%)
Comm. bldg. 5 (7.4%) 9 (11.1%) 1 (5.6%) 15 (9.0%)
Other 0 (0.0%) 0 (0.0%) 1 (5.6%) 1 (0.6%)
Location
Bangkok 64 (94.1%) 67 (82.7%) 15 (83.3%) 146 (87.4%) 4.678 .096
Suburban 4 (5.9%) 14 (17.3%) 3 (16.7%) 21 (12.6%)
Note: The numbers in the table indicate means, with standard deviations in parentheses.
Ref. code: 25616002040159XTN

40
APPENDIX D
CLUSTER DIFFERENCES BY SOCIO-DEMOGRAPHIC
Table D: Cluster Differences by Socio-demographic Characteristics
Characteristics
Cluster 1
(n=34)
Cluster 2
(n=87)
Cluster 3
(n=33)
Total
(n=154)
x2 Sig.
Time and
Convenience
Sport and
Nutrition
Weight
Control
Gender
Male 13 (41.9%) 32 (37.2%) 6 (20.7%) 51 (34.9%) 4.242 .374
Female 18 (58.1%) 53 (61.6%) 23 (79.3%) 94 (64.4%)
Other 0 (0.0%) 1 (1.2%) 0 (0.0%) 1 (0.7%)
Age
23-31 years 25 (80.6%) 55 (64.0%) 20 (71.4%) 100 (69.0%) 3.065 .216
32-40 years 6 (19.4%) 31 (36.0%) 8 (28.6%) 45 (31.0%)
Education Level
Vocational
training 1 (3.2%) 0 (0.0%) 0 (0.0%) 1 (0.7%) 6.804 .147
Bachelor
degree 17 (54.8%) 48 (55.8%) 11 (37.9%) 76 (52.1%)
Master degree 13 (41.9%) 38 (44.2%) 18 (62.1%) 69 (47.3%)
Occupation
Employee 20 (64.5%) 49 (57.0%) 20 (69.0%) 89 (61.0%) 7.749 .458
Business
Owner 5 (16.1%) 15 (17.4%) 4 (13.8%) 24 (16.4%)
Gov.
Employee 0 (0.0%) 5 (5.8%) 0 (0.0%) 5 (3.4%)
Freelance 1 (3.2%) 10 (11.6%) 3 (10.3%) 14 (9.6%)
Multiple Occ. 5(16.1%) 7 (8.1%) 2 (6.9%) 14 (9.6%)
Monthly Personal Income (THB)
< 20,001 2 (6.5%) 9 (10.5%) 0 (0.0%) 11 (7.5%) 14.622 0.67
20,001-40,000 14 (45.2%) 24 (27.9%) 5 (17.2%) 43 (29.5%)
40,001-60,000 6 (19.4%) 29 (33.7%) 11 (37.9%) 46 (31.5%)
60,001-80,000 2 (6.5%) 14 (16.3%) 7 (24.1%) 23 (15.8%)
> 80,000 7 (22.6%) 10 (11.6%) 6 (20.7%) 23 (15.8%)
Location
Bangkok 26 (83.9%) 76 (88.4%) 26 (89.7%) 128 (87.7%) 0.559 .756
Suburban 5 (16.1%) 10 (11.6%) 3 (10.3%) 18 (12.3%)
Note: The numbers in the table indicate n, with column percentage in parentheses.
Ref. code: 25616002040159XTN
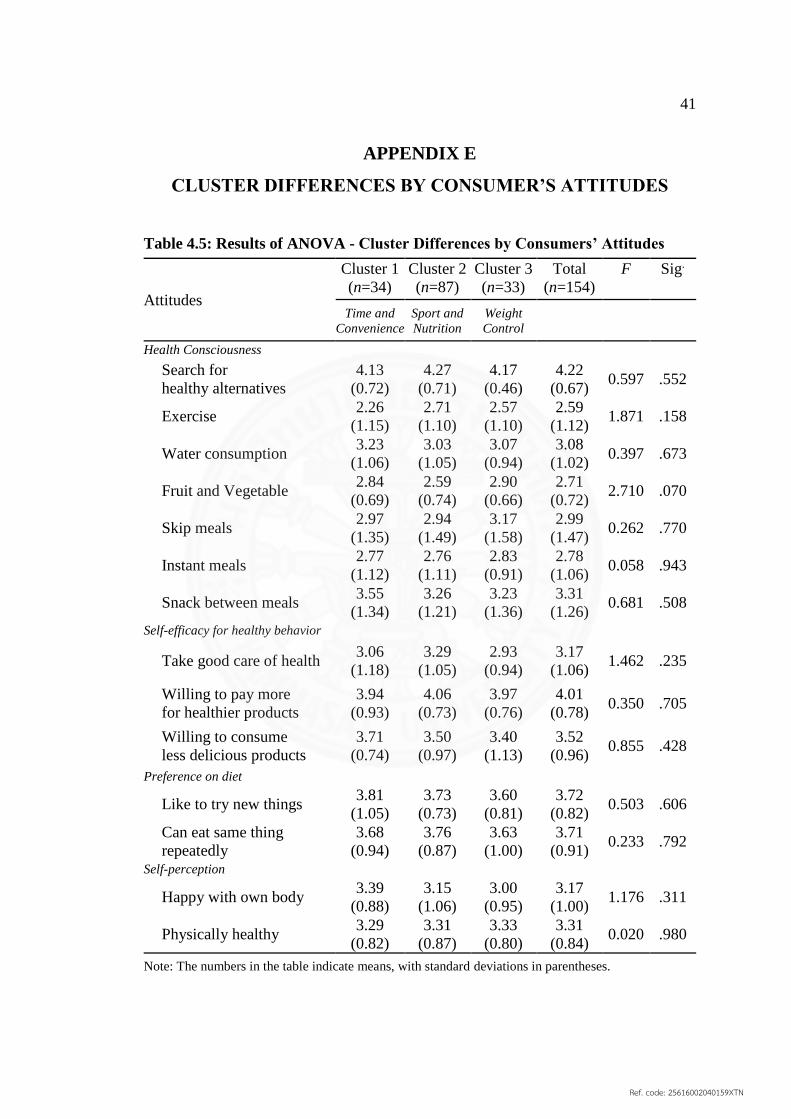
41
APPENDIX E
CLUSTER DIFFERENCES BY CONSUMER’S ATTITUDES
Table 4.5: Results of ANOVA - Cluster Differences by Consumers’ Attitudes
Attitudes
Cluster 1
(n=34)
Cluster 2
(n=87)
Cluster 3
(n=33)
Total
(n=154)
F Sig.
Time and
Convenience
Sport and
Nutrition
Weight
Control
Health Consciousness
Search for
healthy alternatives
4.13
(0.72)
4.27
(0.71)
4.17
(0.46)
4.22
(0.67) 0.597 .552
Exercise 2.26
(1.15)
2.71
(1.10)
2.57
(1.10)
2.59
(1.12) 1.871 .158
Water consumption 3.23
(1.06)
3.03
(1.05)
3.07
(0.94)
3.08
(1.02) 0.397 .673
Fruit and Vegetable 2.84
(0.69)
2.59
(0.74)
2.90
(0.66)
2.71
(0.72) 2.710 .070
Skip meals 2.97
(1.35)
2.94
(1.49)
3.17
(1.58)
2.99
(1.47) 0.262 .770
Instant meals 2.77
(1.12)
2.76
(1.11)
2.83
(0.91)
2.78
(1.06) 0.058 .943
Snack between meals 3.55
(1.34)
3.26
(1.21)
3.23
(1.36)
3.31
(1.26) 0.681 .508
Self-efficacy for healthy behavior
Take good care of health 3.06
(1.18)
3.29
(1.05)
2.93
(0.94)
3.17
(1.06) 1.462 .235
Willing to pay more
for healthier products
3.94
(0.93)
4.06
(0.73)
3.97
(0.76)
4.01
(0.78) 0.350 .705
Willing to consume
less delicious products
3.71
(0.74)
3.50
(0.97)
3.40
(1.13)
3.52
(0.96) 0.855 .428
Preference on diet
Like to try new things 3.81
(1.05)
3.73
(0.73)
3.60
(0.81)
3.72
(0.82) 0.503 .606
Can eat same thing
repeatedly
3.68
(0.94)
3.76
(0.87)
3.63
(1.00)
3.71
(0.91) 0.233 .792
Self-perception
Happy with own body 3.39
(0.88)
3.15
(1.06)
3.00
(0.95)
3.17
(1.00) 1.176 .311
Physically healthy 3.29
(0.82)
3.31
(0.87)
3.33
(0.80)
3.31
(0.84) 0.020 .980
Note: The numbers in the table indicate means, with standard deviations in parentheses.
Ref. code: 25616002040159XTN
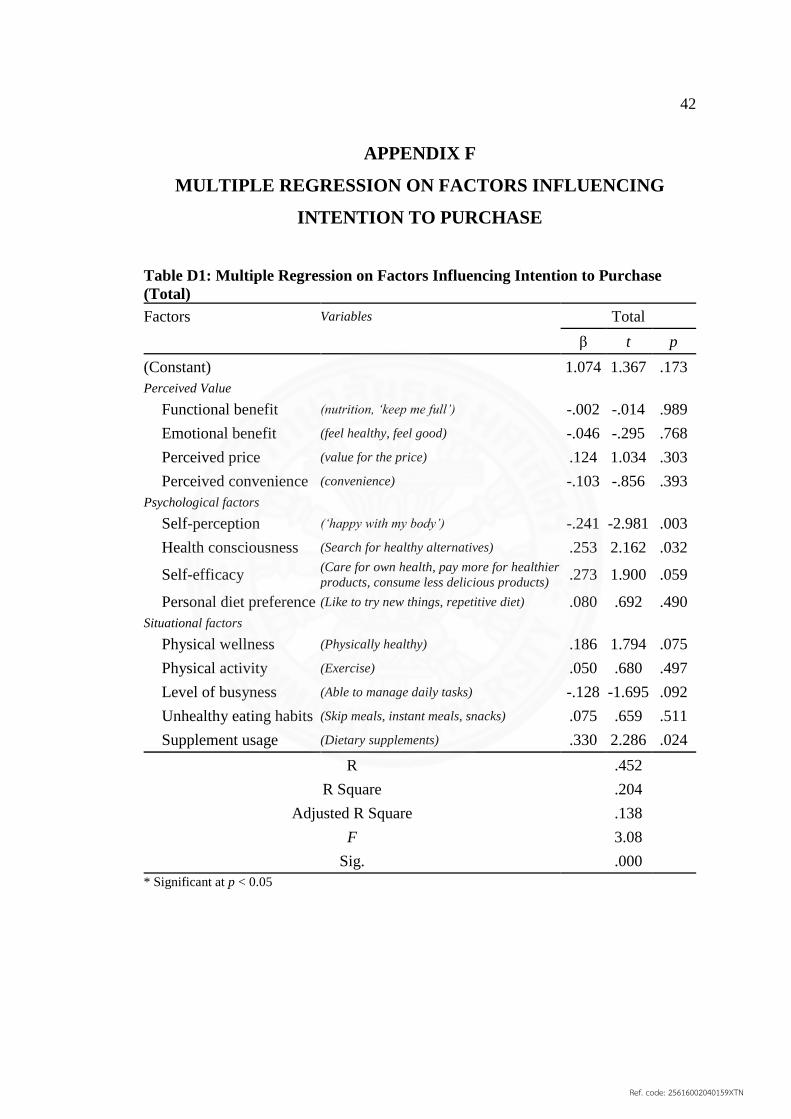
42
APPENDIX F
MULTIPLE REGRESSION ON FACTORS INFLUENCING
INTENTION TO PURCHASE
Table D1: Multiple Regression on Factors Influencing Intention to Purchase
(Total)
Factors Variables Total
β t p
(Constant) 1.074 1.367 .173
Perceived Value
Functional benefit (nutrition, ‘keep me full’) -.002 -.014 .989
Emotional benefit (feel healthy, feel good) -.046 -.295 .768
Perceived price (value for the price) .124 1.034 .303
Perceived convenience (convenience) -.103 -.856 .393
Psychological factors
Self-perception (‘happy with my body’) -.241 -2.981 .003
Health consciousness (Search for healthy alternatives) .253 2.162 .032
Self-efficacy (Care for own health, pay more for healthier
products, consume less delicious products) .273 1.900 .059
Personal diet preference (Like to try new things, repetitive diet) .080 .692 .490
Situational factors
Physical wellness (Physically healthy) .186 1.794 .075
Physical activity (Exercise) .050 .680 .497
Level of busyness (Able to manage daily tasks) -.128 -1.695 .092
Unhealthy eating habits (Skip meals, instant meals, snacks) .075 .659 .511
Supplement usage (Dietary supplements) .330 2.286 .024
R .452
R Square .204
Adjusted R Square .138
F 3.08
Sig. .000
* Significant at p < 0.05
Ref. code: 25616002040159XTN

43
Table D2: Multiple Regression on Factors Influencing Intention to Purchase
Current User Potential User Nonuser
β t p β t p β t p
(Constant) 1.186 1.435 .157 3.893 2.916 .005 -3.427 -0.735 .495
Perceived Value
Functional benefit .001 .007 .995 -.057 -.293 .771 1.287 2.321 .068
Emotional benefit -.185 -1.049 .299 -.067 -.274 .785 .003 .010 .993
Perceived price .042 .283 .778 -.030 -.163 .871 -.443 -.808 .456
Perceived convenience .175 1.209 .232 -.135 -.767 .446 -.170 -.385 .716
Psychological factors
Self-perception -.024 -.242 .809 -.308 -2.764 .007 -.038 -.148 .888
Health consciousness .156 1.017 .314 .118 .691 .492 .924 1.187 .289
Self-efficacy .090 .534 .595 .144 .686 .495 -1.254 -1.515 .190
Diet preference .291 2.152 .036 -.060 -.375 .709 1.395 1.067 .335
Situational factors
Physical wellness .270 2.265 .027 .088 .583 .562 -.638 -.957 .383
Physical activity -.171 -2.239 .029 .085 .772 .443 1.128 1.809 .130
Level of busyness -.209 -1.787 .079 -.287 -2.561 .013 .022 .047 .965
Unhealthy eating habits .061 .482 .632 .179 .985 .328 -.551 -1.233 .272
Supplement usage .270 1.498 .140 -.054 -.253 .801 .152 .285 .787
R .619 .481 .879
R Square .384 .232 .773
Adjusted R Square .238 .087 .034
F 2.632 1.600 1.046
Sig. .006 .106 .537
* Significant at p < 0.05
Ref. code: 25616002040159XTN

44
BIOGRAPHY
Name Miss Intuon Israprasas
Date of Birth February 13, 1988
Educational Attainment
2011: Bachelor’s Degree of Fine Arts
in Visual Communication Design,
Silpakorn University
Work Experiences Marketing Communication Executive
COTTO, Siam Sanitary Ware Industry Co., Ltd.
Ref. code: 25616002040159XTN