a study of the hospital supply chain - ahrmm summary overall, participating hospitals appear to...
TRANSCRIPT

A Study of the Hospital Supply Chain
December 2014
Report prepared by
David Peng and Arunachalam Narayanan
Department of Decision and Information Sciences
University of Houston
Executive Summary
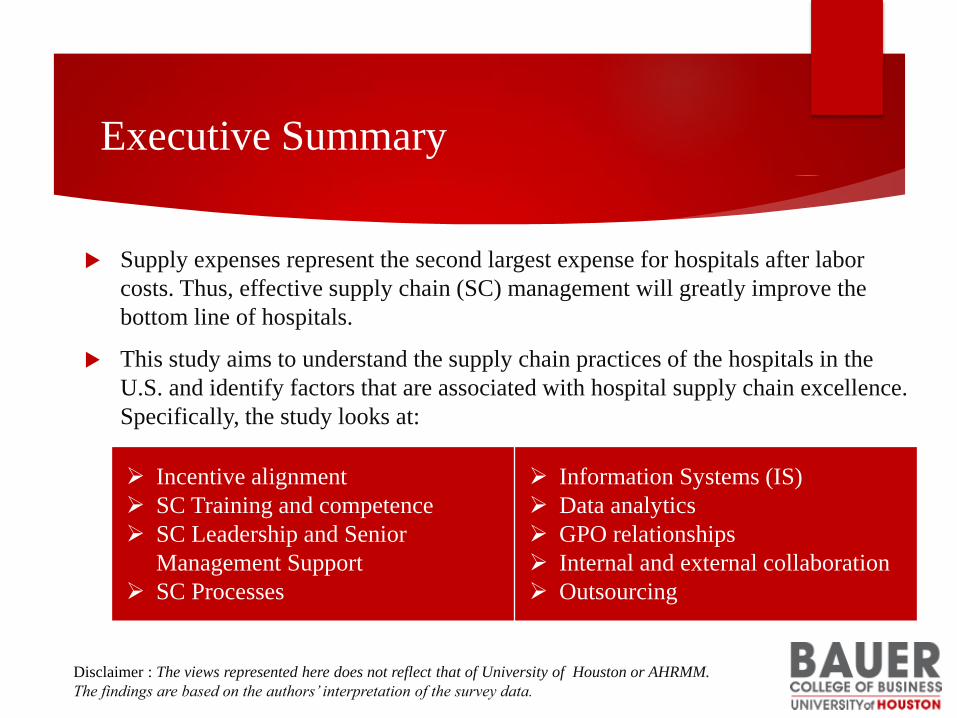
Supply expenses represent the second largest expense for hospitals after labor
costs. Thus, effective supply chain (SC) management will greatly improve the
bottom line of hospitals.
This study aims to understand the supply chain practices of the hospitals in the
U.S. and identify factors that are associated with hospital supply chain excellence.
Specifically, the study looks at:
Disclaimer : The views represented here does not reflect that of University of Houston or AHRMM.
The findings are based on the authors’ interpretation of the survey data.
Incentive alignment
SC Training and competence
SC Leadership and Senior
Management Support
SC Processes
Information Systems (IS)
Data analytics
GPO relationships
Internal and external collaboration
Outsourcing

Executive Summary
Overall, participating hospitals appear to actively improve supply chain processes via initiatives such as lean and Six Sigma, process standardization, and benchmarking.
Hospitals with higher internal collaboration are associated with higher supply chain savings, while hospitals that collaborate better with external supply chain members (e.g., GPOs) tend to perform better than their peers.
Hospitals on average perceive that they have relatively low levels of IS integration, IS planning for supply chain, and incentives for clinical staff to engage in supply chain initiatives.
There is still room for improvements in data analytics in hospital SCs, especially in analyzing product utilization, using statistical tools, and tracking supplier performance metrics.

Executive Summary
Supply chain leadership, information systems integration, and the percentage of
spend through GPOs are the most significant factors that drive supply chain cost
savings.
Improving procurement costs has the strongest effect on supply cost savings.
Improving logistics costs and utilization, and reducing number of SKUs
surprisingly have relatively small or insignificant effects on supply chain cost
savings.
Supply chain training is associated with increased SC performance and savings.
Hospitals involved in the AHRMM’s CQO movement tend to perform better than
those not involved in CQO movement.
Demographics
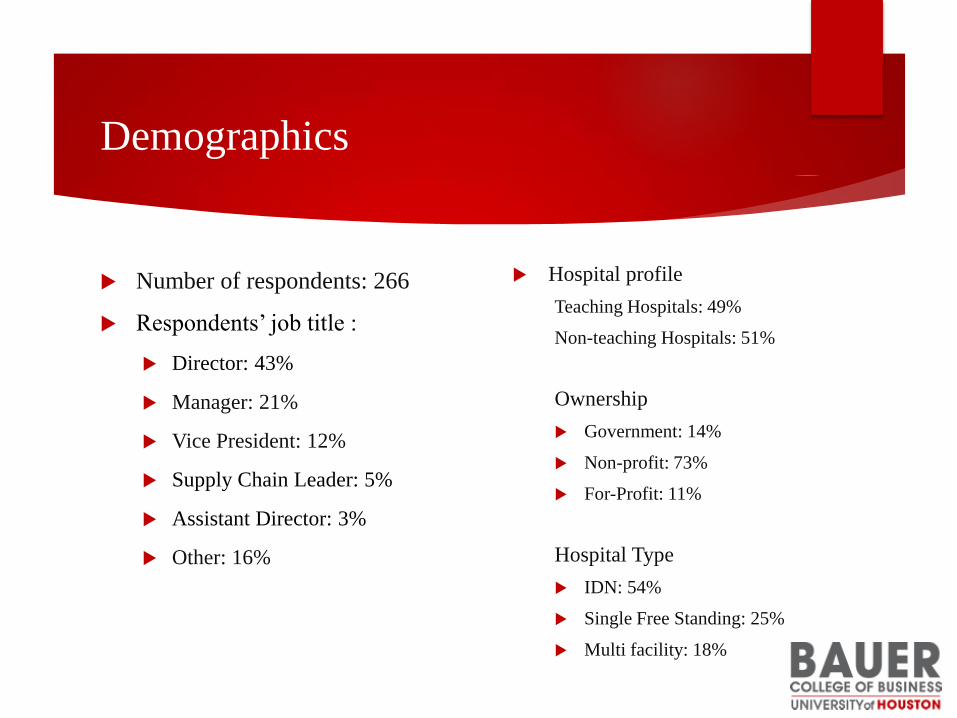
Number of respondents: 266
Respondents’ job title :
Director: 43%
Manager: 21%
Vice President: 12%
Supply Chain Leader: 5%
Assistant Director: 3%
Other: 16%
Hospital profile
Teaching Hospitals: 49%
Non-teaching Hospitals: 51%
Ownership
Government: 14%
Non-profit: 73%
For-Profit: 11%
Hospital Type
IDN: 54%
Single Free Standing: 25%
Multi facility: 18%

Supply Chain Department Profile
Title of the supply chain (SC) leader
Director: 59%
Vice President: 22%
Manager: 9%
Chief Supply Chain Officer: 2%
CEO: 2%
Executive Vice President: 1%
Other: 5%
In a majority (60%) of the hospitals, the supply chain leader
reports to a CFO or Vice President of Finance.
Number of supply chain employees
Less than 5: 10%
5 -10: 10%
10 – 50: 33%
51 -100: 17%
More than 100: 30%

Supply Chain Expenditure and
Savings
< $1M 1 to $10 M 10-$50 M $50-$100 M $100-$300 M $300-$500 M >$500 M
2% 20% 23% 15% 17% 9% 13%
No savings 1% *17% 3%
Less than $1 M 32% 83% 80% 46% 13% 9%
$1 - $5 M 33% 20% 48% 63% 38% 12% 6%
$5-$10 M 15% 5% 18% 36% 40% 12%
$10 - $20 M 8% 2% 8% 13% 24% 15%
> $20 M 11% 4% 24% 64%
SC Savings
SC
Expenditure
*The percentage value in each gray-shaded cell represents the percentage of hospitals within each SC expenditure level (each column)
that realized a specific level of SC savings

Supply Chain Expenditure and
Savings
The supply chain cost savings on average are higher in teaching hospitals than non-
teaching hospitals.
SC Savings SC Expenditure
<$100 million >$ 100 million
<$ 5 million 45 16
$5 - $10 million 7 26
>$ 10 million 5 32
SC Savings SC Expenditure
<$100 million >$ 100 million
<$ 5 million 102 11
$5 - $10 million 3 4
>$ 10 million 0 14
Teaching Hospitals Non-Teaching Hospitals
*The cell value represents the number of hospitals within each SC expenditure level (each column) that realized a
specific level of SC savings
Physician Incentive Alignment
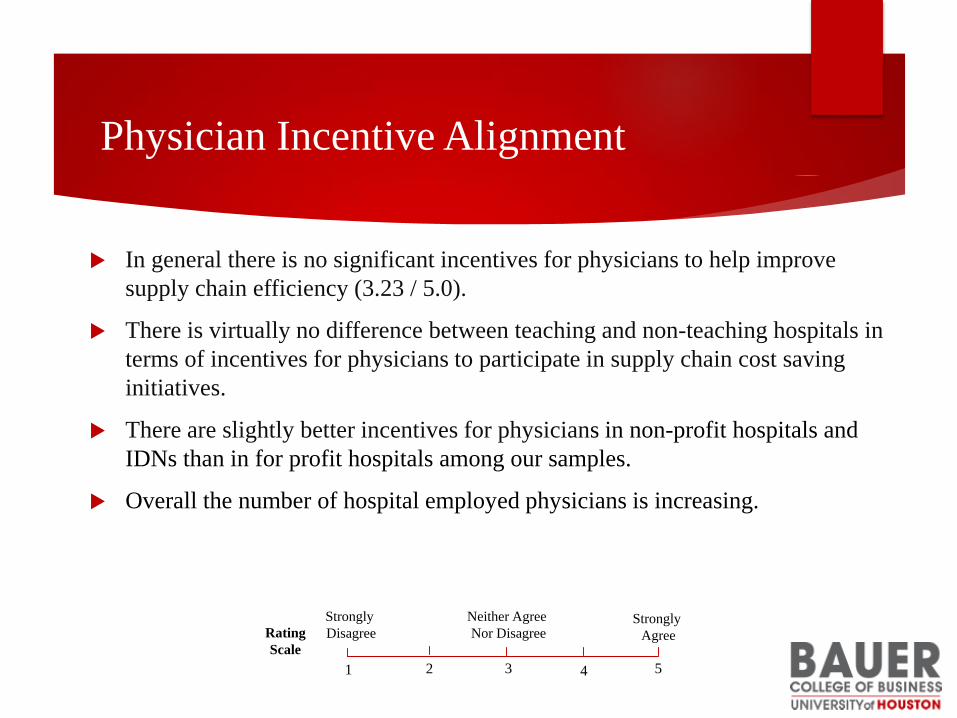
In general there is no significant incentives for physicians to help improve
supply chain efficiency (3.23 / 5.0).
There is virtually no difference between teaching and non-teaching hospitals in
terms of incentives for physicians to participate in supply chain cost saving
initiatives.
There are slightly better incentives for physicians in non-profit hospitals and
IDNs than in for profit hospitals among our samples.
Overall the number of hospital employed physicians is increasing.
1 32 4 5
Strongly
Disagree
Neither Agree
Nor DisagreeStrongly
AgreeRating
Scale
Supply Chain Training and
Awareness
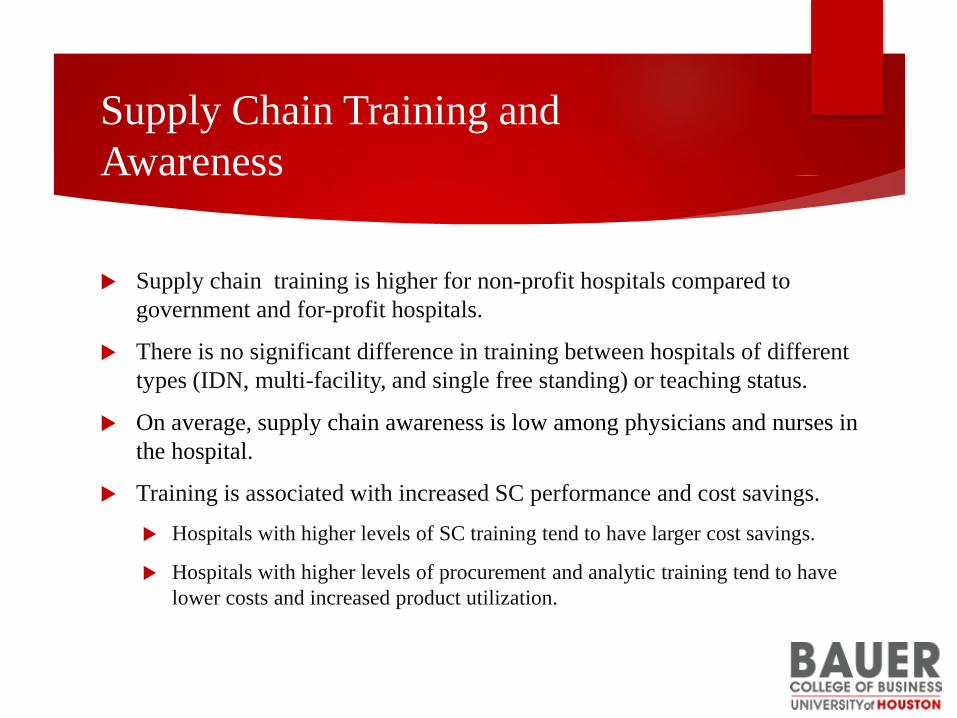
Supply chain training is higher for non-profit hospitals compared to
government and for-profit hospitals.
There is no significant difference in training between hospitals of different
types (IDN, multi-facility, and single free standing) or teaching status.
On average, supply chain awareness is low among physicians and nurses in
the hospital.
Training is associated with increased SC performance and cost savings.
Hospitals with higher levels of SC training tend to have larger cost savings.
Hospitals with higher levels of procurement and analytic training tend to have
lower costs and increased product utilization.

Supply Chain Training
Training Overall
Teaching Status Hospital Type Hospital Ownership
TeachingNon
TeachingIDN
Single free
standing
Multi
facilityGovt. For profit Non-profit
Value Analysis 2.88 2.65 3.11 2.96 2.92 2.71 2.75 2.66 2.96
Negotiation 2.66 2.37 2.95 2.68 2.67 2.62 2.61 2.31 2.73
Contracting 2.82 2.57 3.07 2.86 2.85 2.74 2.83 2.38 2.89
Process Mapping 2.50 2.26 2.75 2.57 2.58 2.33 2.28 2.21 2.61
Lean Management 2.72 2.55 2.89 2.70 2.81 2.70 2.83 2.28 2.79
Data Analysis 2.86 2.69 3.04 2.89 2.88 2.79 2.81 2.52 2.93
Communication 2.75 2.63 2.88 2.68 2.73 2.89 2.72 2.48 2.81
Project Management 2.58 2.39 2.78 2.58 2.60 2.59 2.50 2.14 2.69
Note : The highest rating is 5 and the lowest rating is 1.

Supply Chain Leadership and Senior
Management Support
On average hospitals report moderately strong senior management support for
supply chain management (3.65/5).
Senior management support for supply chain management is lower in
government hospitals (3.38/5) when compared to non-government hospitals
(3.71/5).
Strong SC leadership and senior management support are associated with
higher supply chain cost savings and increased supply chain performance.
1 32 4 5
Strongly
Disagree
Neither Agree
Nor DisagreeStrongly
AgreeRating
Scale

Supply Chain Competence
There are no significant differences with respect to perceived SC competence
across hospitals of different types, ownerships or teaching status.

Information Systems
IDN and multi-facility hospitals on average have high levels of information
systems (IS) planning and integration than single, free-standing hospitals.
Teaching hospitals on average have higher levels of IS planning and integration
than non-teaching hospitals.
IS planning and integration are stronger in non-profit and government hospitals
compared to for-profit hospitals.
Better IS planning is associated with increased supply chain cost savings.
IS integration is positively associated with competitive (relative to peer)
performance, while IS planning is positively associated with performance
improvements.
Overall, information systems in hospitals do not adequately capture the
effectiveness of materials and equipment used.

Electronic Linkages with
Supply Chain Partners
Hospitals have stronger electronic linkages with distributors (4.07/5) and
GPOs (4/5) than with vendors (suppliers) (3.58/5).
This may be because a majority of hospitals probably do not transact directly with
vendors.
Single, free-standing hospitals have the weakest electronic linkage in each
category.
Non-profit hospitals have the strongest electronic linkage in each category.
Teaching hospitals have stronger electronic linkages than non-teaching
hospitals.
Outsourcing
Outsourcing levels are relatively high in the areas of support services (2.96/5), but hospitals on average have relatively low outsourcing levels in the areas of distribution (1.71/5), procurement (1.62/5), contracting (1.82/5), IT services (1.94), and clinical services (2.04).
These findings are interesting since prior studies report that IT services and clinical services are major areas of hospital outsourcing.
For-profit hospitals outsource to a greater extent than non-profit and government hospitals.
Multi-facility hospitals outsource to a greater extent when compared to single free standing hospitals.
The level of outsourcing has no significant association with supply chain cost savings.
Outsourcing IT services is negatively associated with supply chain improvement metrics, while outsourcing distribution services is positively associated with increased supply chain performance relative to peers.

Supply Chain Processes
Hospitals on average are committed to supply chain process standardization and
improvements.
Teaching hospitals are more committed to process standardization than non-
teaching hospitals.

Data Analytics
Hospitals on average do not adequately utilize and analyze the data available to them,
suggesting room for improvements, especially in the areas of product utilization, use
of statistical tools, and supplier performance metrics.

Coordination and Collaboration
Hospitals in a multi-hospital system generally coordinate supply chain
activities to a high extent at the system level (4/5).
Internal collaboration is significantly associated with hospital supply chain
cost savings.
External collaboration is significantly associated with both logistics and
procurement cost improvements.
Hospitals with higher external collaboration tend to perform better than
their peers.

Value Analysis Team
The vast majority of hospitals (95%) have a value analysis team (95%).
Only a small percentage of value analysis teams have a physician as the team
leader (20%).
Hospitals with physician-led value analysis teams tend to be associated with
slightly better supply chain performance.
With one exception: hospitals with physician-led value analysis teams tend to be
less inclined to reduce the number of SKUs.

GPOs
On average, 65% of the hospital supply spend is through GPOs. But this
percentage varies by hospital types, ownership and teaching status.
The percentage of supply spend through GPOs
By Teaching Status : Teaching: 60%; Non Teaching: 70%
By Ownership: Non-profit: 64%; Government: 70%; For profit: 70%
By Types: Multi-facility: 60%; IDN: 63%; Single free-standing: 73%
60% of the sample hospitals are associated with only one GPO;30% are
associated with two GPOs; only 8% are associated with three GPOs.

GPOs
The GPO services used by hospitals to a relatively high extent include:
Benchmarking with peer hospitals (3.64/5)
Assistance in supply chain analysis and improvements (3.66/5)
Selecting and standardizing materials (3.82/5)
Hospitals indicate that they are more likely to have multiple suppliers for
physician preference items (4/5) than for commodity items (3.28/5).
Single, free-standing hospitals have a higher dependency on GPO contracts
than IDN and multi-facility hospitals (3.60/5 versus 3.25/5 and 3.38/5).

GPOs
Increased use of GPO services is associated with lower logistics costs,
lower procurement costs, and increased product standardization.
As expected, a higher percentage of spend through GPO contracts is
associated with lower procurement costs.
There is wide consensus among hospitals that GPOs provide more than one
vendor for their product choices.

CQO and SC performance
Hospitals involved in COQ initiatives tend to perform better in each performance
dimension.
SC PerformanceHospital not involved in
COQ initiative
Hospital involved in
COQ initiative
aLogistics Cost Improvements 3.63 3.81
aProcurement Cost Improvements 3.78 4.04
aContract Flexibility Improvements 3.51 3.87
aImprovements in Product Utilization 3.60 3.64
bLogistics Cost* 3.45 3.64
bUtilization 3.36 3.58
bNumber of SKUs 3.30 3.48
bPercentage of Supply Cost 3.49 3.68
aImprovements in the last three years; bPerformance compared to peer hospitals

Drivers of Supply Chain Cost
Savings
Supply chain leadership, information systems integration, the percentage of
spend through GPOs are significant drivers of supply chain cost savings.
Procurement cost improvements are positively associated with supply chain
cost savings. Logistics cost improvements, however, are negatively associated
with supply chain cost savings.
Using multiple suppliers for preference items are positively associated with
supply chain cost savings; using multiple suppliers for commodity items has a
smaller positive effect on supply chain cost savings.
Note : The results are based on regression analysis which controlled for hospital total spend, ownerships, types, and
teaching status