“a study of wrist watch industry” -...
TRANSCRIPT

“A STUDY OF WRIST WATCH INDUSTRY”
Management Research Project -I
Submitted
In the partial fulfillment of the Degree of
Master of Business Administration
Semester-III
By
Name E.No
Patel Brijesh (12044311075)
Patel Mitul (12044311109)
Prajapati Hitesh (12044311126)
Prajapati Nikul (12044311128)
Prajapati Piyush (12044311130)
Sojitra Radhika (12044311150)
Under the Guidance of:
Prof. (Dr.) Mahendra Sharma
Prof. & Head,
V. M. Patel Institute of Management.
&
Ms. Harsha Jariwala & Prof. Abhishek Parikh
Asst.Professor,
V. M. Patel Institute of Management.
Submitted To:
V. M. Patel Institute of Management,
Ganpat University,
Kherva.
(December, 2013)

CERTIFICATE BY THE GUIDE
This is to certify that the contents of this report entitled ―A Study of wrist watch industry in
india‖ by ―Patel Brijesh(075),Patel Mitul(109),Prajapati Hitesh(126),
Prajapati Nikul(128),Prajapati Piyush(130),Sojitra Radhika(150)‖ submitted to V. M. Patel
Institute of Management for the Award of Master of Business Administration (MBA Sem-II)
is original research work carried out by him/her/them under my supervision.
This report has not been submitted either partly or fully to any other University or Institute
for award of any degree or diploma.
Prof. (Dr.) Mahendra Sharma,
Professor & Head,
V. M. Patel Institute of Management,
Ganpat University.
Ganpat Vidhyanagar.
Date :4/12/2013
Place : Kherva
CANDIDATE’S STATEMENT
I hereby declare that the work incorporated in this report entitled ―A Study of wrist watch
industry in India‖ in partial fulfillment of the requirements for the award of Master of
Business Administration (Semester II) is the outcome of original study undertaken by me/us
and it has not been submitted earlier to any other University or Institution for the award of
any Degree or Diploma.
(Name & Sign. Of Student)
Patel Brijesh ___________
Patel Mitul ___________
Prajapati Hitesh ___________
Prajapati Nikul ___________
Prajapati Piyush ___________
Sojitra Radhika ___________
Date :4/12/2013
Place : Kherva

PREFACE
Industrial activity plays an important role in economic development of our country. The
knowledge of present market scenario is very much essential and keeping that in view, our
college gave us a very good opportunity of industrial interaction in terms of Management
Research Project-I.
As a part of Our Academic requirement of MBA program, we have selected WATCH
INDUSTRY as the industry to be analyzed under the subject named MRP-1. The reason to
choose Watch Industry is very obvious. One, that industry has very interesting history and
background. It is concerned with basic Infrastructure development as well as continuous
changing advanced technology. Secondly, it has opportunistic future and directly impact on
economy. Industry has a very rich area of analyzing. Through this kind of Industry Analysis
we can have good exercise of learning and also help us to understand current trend of
industry with its all-possible dimensions.
The report covers all the landmark changes in Insurance industry and competitive markets
being driven by globalization and Internet technology. It would also provide you the idea of
analyzing, crafting, formulating, evaluating, implementing and executing business strategies
related to the Watch Industry in today‘s volatile markets.
ACKNOWLEDGEMENT
We the students of Management at V.M.Patel Institute of Management, Ganpat University
are very much benefited from the help of many people during the evolution of this project.
We give our special thanks to respected Dr. Mahendra Sharma, Professor & Head, V.M. Patel
Institute of Management, Ganpat University for providing us an opportunity to carry out topic
to study on ―Wrist Watch Industry‖.
We would like express our special gratitude to our respected Prof. Harsha Jariwala and Prof.
Abhishek Parikh, all concern persons who have provided us help through their information,
guidance and all kinds of support, which was required for preparation of this report. Without
their help it would have been difficult for us to complete our Management Research Project –
I.
As always, we value your recommendations and thoughts about the report. Your comments
regarding coverage and contents will be most welcome, as will your calling our attention to
specific errors, deficiencies and oversights.
By:-
Brijesh k. Patel
Hitesh p. Prajapati
Mitul B. Patel
Nikul P. Prajapati
Piyush I. Prajapati
Radhika V. Sojitra

EXECUITIVE SUMMERY
The report titled 'India Watch Industry ' provides a comprehensive analysis of the various
aspects such as market size, segmentation, trends and developments and future projections of
the mass, mid and premium price wrist watches as key segments of the market. The report
provides the market share of the major brands and company profiles of key players/ brands in
all the major segments (mid, affordable luxury, luxury and super luxury) The report also
covers the online watch industry and wall clock segment in India and provides market size
and future projections of economy, mid and premium price wall clocks as three segments of
the wall clock industry in the country.
The Indian watch market for timepieces has grown at a rapid pace in the past few years
clocking a CAGR of 9.3% for the period FY‘2008-FY‘2013. The market for timepieces
includes wrist watches, table clocks, alarm clocks and wall clocks. But the market for wrist
watches formed the major proportion of the market for time pieces with a contribution of
about 89% in the total watch market in the country by revenue while the market for wall
clocks formed the rest of the market share of 11% in FY‘2013.
The wristwatch market has grown in terms of value from INR 33,731.0 million in FY‘2008 to
INR ~ million in FY‘2013. The wrist watches market in India can be classified into three
broad categories based on price. The first is the mass price segment consisting of watches
priced lower than INR 1,000 which are mainly the wrist watches sold by the unorganized
players. The second category is the mid price segment of watches priced between INR 1,000
and INR 10,000. The third is the premium watch segment with watches priced above INR
10,000.
In India, the mass segment of watches contributes the highest to the market in terms of
volume. On the other hand, in terms of value, each of the mass and the mid price segments
contribute about 37%-38% to the total wristwatch market in India. The rest is contributed by
the premium segment which constitutes around 25% of the INR ~ million wristwatch
industry in India.
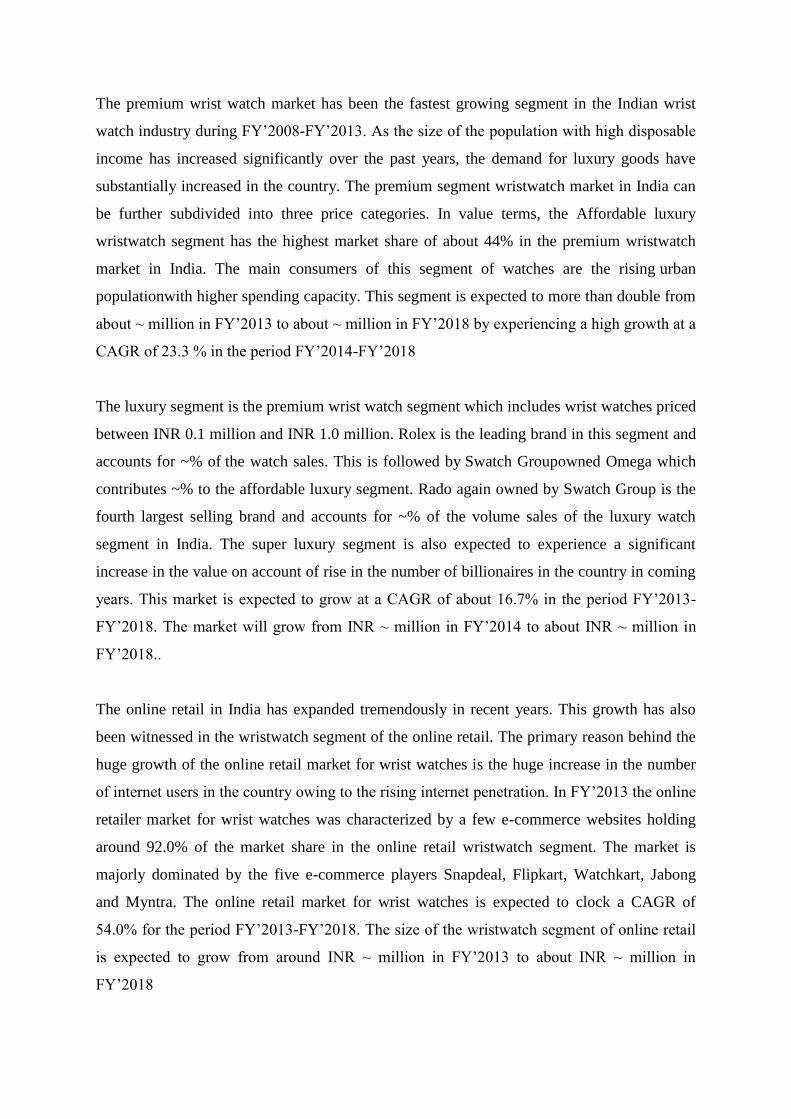
The premium wrist watch market has been the fastest growing segment in the Indian wrist
watch industry during FY‘2008-FY‘2013. As the size of the population with high disposable
income has increased significantly over the past years, the demand for luxury goods have
substantially increased in the country. The premium segment wristwatch market in India can
be further subdivided into three price categories. In value terms, the Affordable luxury
wristwatch segment has the highest market share of about 44% in the premium wristwatch
market in India. The main consumers of this segment of watches are the rising urban
populationwith higher spending capacity. This segment is expected to more than double from
about ~ million in FY‘2013 to about ~ million in FY‘2018 by experiencing a high growth at a
CAGR of 23.3 % in the period FY‘2014-FY‘2018
The luxury segment is the premium wrist watch segment which includes wrist watches priced
between INR 0.1 million and INR 1.0 million. Rolex is the leading brand in this segment and
accounts for ~% of the watch sales. This is followed by Swatch Groupowned Omega which
contributes ~% to the affordable luxury segment. Rado again owned by Swatch Group is the
fourth largest selling brand and accounts for ~% of the volume sales of the luxury watch
segment in India. The super luxury segment is also expected to experience a significant
increase in the value on account of rise in the number of billionaires in the country in coming
years. This market is expected to grow at a CAGR of about 16.7% in the period FY‘2013-
FY‘2018. The market will grow from INR ~ million in FY‘2014 to about INR ~ million in
FY‘2018..
The online retail in India has expanded tremendously in recent years. This growth has also
been witnessed in the wristwatch segment of the online retail. The primary reason behind the
huge growth of the online retail market for wrist watches is the huge increase in the number
of internet users in the country owing to the rising internet penetration. In FY‘2013 the online
retailer market for wrist watches was characterized by a few e-commerce websites holding
around 92.0% of the market share in the online retail wristwatch segment. The market is
majorly dominated by the five e-commerce players Snapdeal, Flipkart, Watchkart, Jabong
and Myntra. The online retail market for wrist watches is expected to clock a CAGR of
54.0% for the period FY‘2013-FY‘2018. The size of the wristwatch segment of online retail
is expected to grow from around INR ~ million in FY‘2013 to about INR ~ million in
FY‘2018
The wall clock industry in India has grown from about INR 4,188.0 million in FY‘2008 to
INR ~ million in FY‘2013. The growth in market in the value terms is mainly driven by sales
of the wall clocks brands such as Ajanta, Sonera Industries, Opal, Sonam Quartz and Samay.
The premium wall clock segment is the fastest growing segment in the wall clock market in
India and has grown at a CAGR of 12.3% in the period FY‘2008-FY‘2013.
Key Topics Covered in the Report:
The market size of the India watches industry by value.
The market segmentation of the watches industry by wrist watches
The market size and future projections of the wrist watch market in India by value.
Market segmentation of the wrist watches market on the basis of price.
Market size and future projections of the mass, mid and premium price wrist watch
segments.
Market share of major players in the mass, mid and premium price wrist watch segments.
Market shares of major players in affordable luxury segment and major brands in luxury
and super luxury premium watch segments on the basis of unit sales.
Market share of major players in the overall India wrist watch market on the basis of
revenue.
Trends and developments in the wrist watch market in India.
Market size and future projections of the wall clock industry in India by value.
Market segmentation of the wall clock industry on the basis of price.
Market size and future projections of the economy, mid and premium price wall clock
segments.
Market size and future projections of the online wrist watch market by value.

List of Tables
TABLE NO.
PARTICULARS PAGE NO.
Table 4.1 Current ratio.................................................................. 55
Table 4.2 Quick ratio………..................................................... 57
Table 4.3 Profitability ratio………............................................ 58
Table 4.4 Net profit ratio.............................................................. 60
Table 4.5 Return on net worth...................................................... 62
Table 4.6 Debt services coverage ratio......................................... 64
Table 4.7 Interest coverage ratio................................................... 66
Table 4.8 Debtor‘s turnover......................................................... 67
Table 4.9 Debtor ratio................................................................... 69
Table 4.10 Working capital turnover ratio...................................... 70
Table 4.11 Fixed Asset turnover ratio............................................. 72
Table 4.12 Net sales........................................................................ 79
Table 4.13 Average sundry debtors................................................ 80
Table 4.14 Adjusted net profit........................................................ 81

LIST OF FIGURES
FIGURE NO. PARTICULARS PAGE NO.
Figure 1 Current ratio (times).................................................. 55
Figure 2 Quick ratio (times).................................................... 57
Figure 3 Profitability Ratio...................................................... 58
Figure 4 Net profit ratio........................................................... 60
Figure 5 Return on net worth................................................... 62
Figure 6 Debt services coverage ratio..................................... 64
Figure 7 Interest coverage ratio............................................... 66
Figure 8 Debtor‘s turnover...................................................... 67
Figure 9 Debtor ratio............................................................... 69
Figure 10 Working capital turnover ratio in times.................... 70
Figure 11 Fixed Asset turnover ratio in times........................... 72
Figure 12 Average net sales....................................................... 79
Figure 13 Average sundry debtors............................................. 80
Figure 14 Adjusted net profit.................................................... 81

CONTENTS
No. Particular Page No.
Certificate by Guide II
Candidate Statement III
Preface IV
Acknowledgement V
Executive summery VI
List of tables IX
List of Figure and Graphs X
PART –I
CHAPTER 1 INTRODUCTION OF INDUSTRY 1
1.1 Introduction of Wrist Watch Industry In India 2
1.2 History of wrist watch industry 6
1.3 Watch industry in India – An overview 19
1.4 Industry Framework 20
1.5 Competitive Structure of watch industry 21
1.6 Watch making process 22
CHAPTER 2 Major players of watch industry in India 25
2.1 History of IST limited 26
2.2 History of KDDL 28
2.2.1 Mission & Vision 29
2.3 History of Opel Clock 30
2.3.1 Mission & Vision 32
CHAPTER 3 Macro analysis of Industry 33
3.1 Industry dominant economic features 34
3.2 Porter‘s five force model 37
3.3 Industry Driving forces 42
3.4 Strategic group mapping 44
3.5 Key success factors 46
3.6 PEST Analysis 47
CHAPTER 4 Introduction of Financial statement & its analysis 49
4.1 Introduction 50
4.2 Financial Analysis & techniques 52
4.2.1 Ratio Analysis 53
4.2.2 Advantages of ratio Analysis 54
4.2.3 Liquidity Ratio 54
4.2.4 Profitability Ratio 58
4.2.5 Coverage Ratio 64
4.2.6 Turnover Ratio 67
4.4 Balance Sheet 73
4.5 Profit & Loss A/c 74
4.6 Common size statement 75
4.7 Trend Analysis 78
CHAPTER 5 Findings 82
CHAPTER 6 Conclusion 84
PART-II
CHAPTER 7 B-Plan 86
7.1 Introduction 88
7.2 Products of Company 89
7.3 Company name and Strategy 93
7.4 Regulation and Documentation 95
7.5 Objectives of business 97
7.5.1 Mission statement 97
7.5.2 Vision statement 97
7.5.3 Status of the company 97
7.5.4 Market status of the company 97
7.5.5 Marketing Objective 97
7.6 Segmentation 99
7.6.1 Target market segment strategy 99
7.6.2 Market Need 100
7.6.3 Market Trends 100
7.6.4 Market Growth 100
7.7 Situation Analysis 101
7.7.1 Competitors in Indian wrist watch industry 101
7.8 Organisation structure 102
7.9 Production Planning 103
7.9.1 Raw material planning 103
7.10 Financial Analysis 104
CHAPTER 8 Bibliography 109
CHAPTER 9 Annexure i-iii

PART - I
Chapter 1
Introduction

1.1 Introduction Of Wrist Watch Industry In India
Today, a wristwatch is considered as much of a status symbol as a device to tell time. In an
age when cell phones and digital pagers display tiny quartz clocks, the mechanical wristwatch
has slowly become less of an object of function and more a piece of modern culture.
Walk into the boardroom of any Fortune 500 company and you‘re likely to see dozens of
prestigious wristwatches, including such names as Rolex, Vacheron Constantin, Frank
Müller, Jaeger-LeCoultre and even Patek Phillipe. However, this was not always the case.
Less than 100 years ago, no self-respecting gentleman would be caught dead wearing a
wristwatch. In those days of yore, real men carried pocket watches, with a gold half-hunter
being the preferred status symbol of the time—no pun intended.
Wristlets, as they were called, were reserved for women, and considered more of a passing
fad than a serious timepiece. In fact, they were held in such disdain that many a gentlemen
were actually quoted to say they ―would sooner wear a skirt as wear a wristwatch‖.
The established watch making community looked down on them as well. Because of their
size, few believed wristlets could be made to achieve any level of accuracy, nor could they
withstand the basic rigors of human activity. Therefore, very few companies produced them
in quantity, with the vast majority of those being small ladies‘ models, with delicate fixed
wire or chain-link bracelets.
This all started to change in the nineteenth century, when soldiers discovered their usefulness
during wartime situations. Pocket watches were clumsy to carry and thus difficult to operate
while in combat. Therefore, soldiers fitted them into primitive ―cupped‖ leather straps so they
could be worn on the wrist, thereby freeing up their hands during battle. It is believed that
Girard-Perregaux equipped the German Imperial Naval with similar pieces as early as the
1880s, which they wore on their wrists while synchronizing naval attacks, and firing artillery.
Decades later, several technological advents were credited with the British victory in the
Anglo-Boer War (South Africa 1899-1902), including smokeless gunpowder, the magazine-
fed rifle and even the automatic or machine gun. However, some would argue that it was a
not-so-lethal device that helped turn the tide into Britain‘s favor: the wristwatch.

While the British troops were superiorly trained and equipped, they were slightly
outnumbered, and at a disadvantage while attacking the Boer‘s heavily entrenched positions.
Thanks to these recently designed weapons, a new age of war had emerged, which, now more
than ever, required tactical precision. British officers achieved success by using these
makeshift wristwatches to coordinate simultaneous troop movements, and synchronize
flanking attacks against the Boer‘s formations.
In fact, an ―Unsolicited Testimonial‖ dated June 7, 1900, appeared in the 1901, Goldsmith‘s
Company Watch and Clock Catalog as follow:
―… I wore it continually in South Africa on my wrist for 3 ½ months. It kept most excellent
time, and never failed me.—faithfully yours, Capt. North Staffs. Regt.‖
This testimonial appeared below an advertisement for a military pocket watch listed as The
Company‘s ―Service‖ Watch, and was further described as: ―The most reliable timekeeper in
the World for Gentlemen going on Active Service or for rough wear.‖
In 1906, the evolution of wristlets took an even bigger step with the invention of the
expandable flexible bracelet, as well as the introduction of wire loops (or lugs) soldered onto
small, open-faced pocket watch cases, allowing leather straps to be more easily attached. This
aided their adaptation for military use and thus marked a turning point in the development of
wristwatches for men.
Another timely issue was the vulnerability of the glass crystal when worn during combat.
This was addressed by utilizing ―pierced metal covers‖, frequently called shrapnel guards.
These were basically metal grills (often made of silver), placed over the dial of the watch—
thereby protecting the glass from damage while still allowing the time to be easily read.
A less common solution was the use of leather covers, snapped into place over the watch.
While they did offer protection from damage, they were cumbersome to use, and thus were
primarily seen in the extreme climates of Australia and Africa.
Even with their success in combat, the popularity of the wristwatch was still limited to ladies‘
models. They didn‘t reach the mainstream market until some two decades later, when soldiers
from around the world converged on Europe to help defeat the German Empire in WWI

(1914-1919). Due to the strategic lessons learned in the Boer War, the demand for reliable,
accurate wristwatches was now at its peak.
While German troops at this time were largely issued the more primitive ―pocket watch‖
designs, Allied troops had a wide range of new models to choose from. Many examples
featured small silver pocket watch cases fitted with leather straps and displayed radium-
illuminated porcelain dials protected by the aforementioned shrapnel guards.
Wristwatches were no longer considered a novelty but were now a wartime necessity, and
companies were scrambling to keep up with the demand. One company that enjoyed success
during this time was Wilsdorf & Davis, Ltd., founded in 1905, and later renamed The Rolex
Watch Company, Ltd., in 1915.
Hans Wilsdorf, the founder and director of Rolex, was a strong proponent of wristwatches
since the turn of the century. While others scoffed at them, Wilsdorf continued to experiment
with their accuracy and reliability. Thus, some would argue that he did more for their
advancement than anyone in history. In fact, he is even credited with sending the first
wristwatches to the Neuchatel Observatory (Switzerland), for accuracy testing. They all
passed the rigorous battery of tests, which encouraged Wilsdorf to push them even further.
Rolex subsequently received the very first wristwatch Chronometer awards from the School
of Horology in Bienne (1910), and the Class ―A‖ Certificate of Precision from the Kew
Observatory in England (1914). To this day, Rolex watches consistently receive more
Chronometer Certificates from the Contrôle Officiel Suisse des Chronomètres (COSC), than
every other watch company in the world, combined.
After the Great War, many soldiers returned home with souvenir trench watches—so named
for the trench warfare in which they were used. When these war heroes were seen wearing
them, the public‘s perception quickly changed, and wristwatches were no longer deemed as
feminine. After all, no one would dare consider these brave men as being anything but. In the
final years of the war, wristwatches began to see numerous improvements. Case makers like
Francis Baumgartner, Borgel and Dennison introduced revolutionary designs, which aided in
making them more resistant to water and dust. These designs were later improved on when
Rolex introduced the first truly waterproof wristwatch, the Oyster, in 1926.

Over the next decade, watch companies slowly added additional models to their catalogs, and
finally, by the mid-1930s, they accounted for 65 percent of all watches exported by
Switzerland. It was an uphill battle, but the wristwatch had finally arrived. They were now
accurate, waterproof and, by 1931, perpetually self-winding, when Rolex introduced the Auto
Rotor, a revolutionary design, which is used to this day by watch companies around the
world.
The success of the wristwatch was born out of necessity, and Rolex continued this tradition
by introducing a series of Professional, or ―tool watches‖ in the early 1950s. These models,
including the Submariner, Explorer, GMT-Master, Turn-O-Graph, and Milgauss were also
designed out of necessity, as they included features and attributes that were essential for a
specific task or profession.
Because of its rugged design, variations of the Submariner have subsequently been issued to
numerous militaries, including the British Royal Navy, Royal Canadian Navy and British
Royal Marines, as well as the U.S. Navy Seals. Over the years, dozens of companies like
Omega, Benrus and Panerai have also supplied specialty watch models for military duty.
Thus, the role of the wristwatch seems to have come full circle. With the general public now
leaning toward high-tech, digital gadgets, the classic mechanical wristwatch has once again
found its home on the wrists of those brave soldiers who welcomed it some 100 years ago.

1.2 History Of Wrist Watch Industry
A watch is a timepiece, typically worn either around the wrist or attached on a chain and
carried in a pocket. Wristwatches are the most common type of watch used today. Watches
evolved in the 17th century from spring powered clocks, which appeared in the 15th century.
The first watches were strictly mechanical. As technology progressed, the mechanisms used
to measure time have, in some cases, been replaced by use of quartz vibrations or electronic
pulses. The first digital electronic watch was developed in 1970.
Before wristwatches became popular in the 1920s, most watches were pocket watches, which
often had covers and were carried in a pocket and attached to a watch chain or watch fob. In
the early 1900s, the wristwatch, originally called a Wristlet, was reserved for women and
considered more of a passing fad than a serious timepiece. Men, who carried pocket watches,
were quoted as saying they would "sooner wear a skirt as wear a wristwatch". This changed
in World War I, when soldiers on the battlefield found pocket watches to be impractical and
attached their watches to their wrist by a cupped leather strap. It is also believed that Girard-
Perregaux equipped the German Imperial Navy with wristwatches in a similar fashion as
early as the 1880s, to be used while synchronizing naval attacks and firing artillery.
Most inexpensive and medium-priced watches used mainly for timekeeping are electronic
watches with quartz movements. Expensive collectible watches, valued more for
their workmanship and aesthetic appeal than for simple timekeeping, often have purely
mechanical movements and are powered by springs, even though mechanical movements are
less accurate than more affordable quartz movements. In addition to the time, modern
watches often display the day, date, month and year, and electronic watches may have many
other functions. Watches that provide additional time-related features such
as timers, chronographs and alarm
functions are not uncommon. Some modern designs even go as far as using GPS technology
or heart-rate monitoring[capabilities.

The earliest dated watch known, from 1530
Watches evolved from portable spring-driven clocks, which first appeared in 15th century
Europe. Watches weren't widely worn in pockets until the 17th century. One account says
that the word "watch" came from the Old English word woecce which meant "watchman",
because it was used by town watchmen to keep track of their shifts. Another says that the
term came from 17th century sailors, who used the new mechanisms to time the length of
their shipboard watches (duty shifts).
Movement
Different kinds of movements move the hands differently as shown in this 2 second exposure.
The left watch has a 24-hour analog dial with a mechanical 1/6 s movement, the right one has
a more common 12-hour dial and a "1 s" quartz movement
A Russian mechanical watch movement
A movement in watch making is the mechanism that measures the passage of time and
displays the current time (and possibly other information including date, month and day).
Movements may be entirely mechanical, entirely electronic (potentially with no moving

parts), or they might be a blend of the two. Most watches intended mainly for timekeeping
today have electronic movements, with mechanical hands on the watch face indicating the
time.
Mechanical movements
Compared to electronic movements, mechanical watches are less accurate, often with errors
of seconds per day, and they are sensitive to position, temperature and magnetism. They are
also costly to produce, require regular maintenance and adjustment, and are more prone to
failure. Nevertheless, the craftsmanship of mechanical watches still attracts interest from part
of the watch-buying public. Skeleton watches are designed to leave the mechanism visible for
aesthetic purposes.
Mechanical movements use an escapement mechanism to control and limit the unwinding
and winding parts of a spring, converting what would otherwise be a simple unwinding into a
controlled and periodic energy release. Mechanical movements also use a balance
wheel together with the balance spring (also known as a hairspring) to control motion of the
gear system of the watch in a manner analogous to the pendulum of a pendulum clock.
The tourbillion, an optional part for mechanical movements, is a rotating frame for the
escapement, which is used to cancel out or reduce the effects of gravitational bias to the
timekeeping. Due to the complexity of designing a tourbillion, they are very expensive and
only found in "prestige" watches.
The pin-lever escapement (called the Roskopf movement after its inventor, Georges Frederic
Roskopf), which is a cheaper version of the fully levered movement, was manufactured in
huge quantities by many Swiss manufacturers as well as by Timex, until it was replaced by
quartz movements.
Tuning-fork watches use a type of electromechanical movement. Introduced by Bulova in
1960, they use a tuning fork with a precise frequency (most often 360 hertz) to drive a
mechanical watch. The task of converting electronically pulsed fork vibration into rotary
movement is done via two tiny jeweled fingers, called pawls. Tuning-fork watches were
rendered obsolete when electronic quartz watches were developed. Quartz watches were
cheaper to produce and even more accurate.

Traditional mechanical watch movements use a spiral spring called a mainspring as a power
source. In manual watches the spring must be rewound periodically by the user by turning the
watch crown. Antique pocket watches were wound by inserting a separate key into a hole in
the back of the watch and turning it. Most modern watches are designed to run 40 hours on a
winding and thus must be wound daily, but some run for several days and a few have 192-
hour mainsprings and are wound weekly.
Automatic watches
Automatic watch: An eccentric weight, called a rotor,
swings with the movement of the wearer‘s body and winds the spring
A self-winding or automatic watch is one that rewinds the mainspring of a mechanical
movement by the natural motions of the wearer's body. The first self-winding mechanism
was invented for pocket watches in 1770 by Abraham-Louis Perrelet, but the first "self-
winding", or "automatic", wristwatch was the invention of a British watch repairer named
John Harwood in 1923. This type of watch allows for constant winding without special action
from the wearer; it works by an eccentric weight, called a winding rotor, which rotates with
the movement of the wearer's wrist. The back-and-forth motion of the winding rotor couples
to a ratchet to automatically wind the mainspring. Self-winding watches usually can also be
wound manually so they can be kept running when not worn or if the wearer's wrist motions
are inadequate to keep the watch wound.

Electronic movements
Electronic movements have few or no moving parts, as they use the piezoelectric effect in a
tiny quartz crystal to provide a stable time base for a mostly electronic movement. The crystal
forms a quartz oscillator which resonates at a specific and highly stable frequency, and which
can be used to accurately pace a timekeeping mechanism. For this reason, electronic watches
are often called quartz watches. Most quartz movements are primarily electronic but are
geared to drive mechanical hands on the face of the watch in order to provide a traditional
analog display of the time, which is still preferred by most consumers.
Prototype of a Quartz Wristwatch, CEH Switzerland, 1967
In 1959 Seiko gave an order to Epson (a daughter company of Seiko and the actual brain
behind the quartz revolution) to start developing a quartz wristwatch. The project was
codenamed 59A and by the 1964 Tokyo Summer Olympics, Seiko had a working prototype
of a portable quartz watch which took part in time measurements throughout the event.
The first prototypes of an electronic quartz wristwatch (not just portable quartz watches as
the Seiko timekeeping devices at the Tokyo Olympics in 1964) were made by the CEH
research laboratory in Neuchâtel, Switzerland. From 1965 through 1967 pioneering
development work was done on a miniaturized 8192 Hz quartz oscillator, a thermo-
compensation module and an in house-made, dedicated integrated circuit (unlike the hybrid
circuits used in the later Seiko Astron wristwatch). As a result, the BETA 1 prototype set new
timekeeping performance records at the International Chronometric Competition held at the
Observatory of Neuchâtel in 1967.

Quatrz Movement of the Seiko Astron, 1969 (Deutsches Uhrenmunseum, inv. 2010-006)
The first quartz watch to enter production was the Seiko 35 SQ Astron, which hit the shelves
on December 25, 1969. One particularly interesting decision made by Seiko at that time was
to not patent the whole movement of the quartz wristwatch, thus allowing other
manufacturers to benefit from the Seiko technology. This played a major role in the
popularity and quick development of the quartz watch, which in less than a decade was
dominant in the watch market, nearly ending an almost 100 years of mechanical wristwatch
heritage. The modern quartz movements are produced in very large quantities, and even the
cheapest wristwatches typically have quartz movements. Whereas mechanical movements
can typically be off by several seconds a day, an inexpensive quartz movement in a child's
wristwatch may still be accurate to within half a second per day—ten times better than a
mechanical movement.
After a consolidation of the mechanical watch industry in Switzerland during the 1970s, mass
production of quartz wristwatches took off under the leadership of the Swatch Group of
companies, a Swiss conglomerate with vertical control of the production of Swiss watches
and related products. For quartz wristwatches, subsidiaries of Swatch manufactured watch
batteries (Renata), oscillators (Oscilloquartz) and integrated circuits (Ebauches Electronic
SA). The launch of the new SWATCH brand in 1983, was marked by bold new styling,
design and marketing. Today, the Swatch Group is the world's largest watch company.
Seiko's efforts to combine the quartz and mechanical movements bore fruit after 20 years of
research, leading to the introduction of the Seiko Spring Drive, first in a limited domestic
market production in 1999 and to the world in September 2005. The Spring Drive manages to

keep time within quartz standards without the use of a battery, using a traditional mechanical
gear train powered by a spring, while at the same time doesn't have the need of a balance
wheel either.
Radio time signal watches are a type of electronic quartz watch which synchronizes (time
transfer) its time with an external time source such as inatomic clocks, time signals
from GPS navigation satellites, the German DCF77 signal in Europe, WWVB in the US, and
others. Movements of this type may -among others- synchronize not only the time of day but
also the date, the leap-year status of the current year, and the current state of daylight saving
time (on or off). However, other than the radio receiver these watches are normal quartz
watches in all other aspects.
Electronic watches require electricity as a power source, and some mechanical movements
and hybrid electronic-mechanical movements also require electricity. Usually the electricity
is provided by a replaceable battery. The first use of electrical power in watches was as a
substitute for the mainspring, in order to remove the need for winding. The first electrically
powered watch, the Hamilton Electric 500, was released in 1957 by the Hamilton Watch
Company of Lancaster, Pennsylvania.
Watch batteries (strictly speaking cells, as a battery is composed of multiple cells) are
specially designed for their purpose. They are very small and provide tiny amounts of power
continuously for very long periods (several years or more). In most cases, replacing the
battery requires a trip to a watch-repair shop or watch dealer; this is especially true for
watches that are designed to be water-resistant, as special tools and procedures are required to
ensure that the watch remains water-resistant after battery replacement. Silver-oxide and
lithium batteries are popular today; mercury batteries, formerly quite common, are no longer
used, for environmental reasons. Cheap batteries may be alkaline, of the same size as silver-
oxide cells but providing shorter life. Rechargeable batteries are used in some solar powered
watches.
Some electronic watches are also powered by the movement of the wearer of the watch. For
instance, Seiko's Kinetic powered quartz watches make use of the motion of the wearer's arm
turning a rotating weight which causes a tiny generator to supply power to charge a

rechargeable battery that runs the watch. The concept is similar to that of self-winding spring
a movement, except that electrical power is generated instead of mechanical spring tension.
Solar powered watches are powered by light. A photovoltaic cell on the face (dial) of the
watch converts light to electricity, which in turn is used to charge a rechargeable battery
or capacitor. The movement of the watch draws its power from the rechargeable battery or
capacitor. As long as the watch is regularly exposed to fairly strong light (such as sunlight), it
never needs battery replacement, and some models need only a few minutes of sunlight to
provide weeks of energy (as in the Citizen Eco-Drive). Some of the early solar watches of the
1970s had innovative and unique designs to accommodate the array of solar cells needed to
power them (Synchronar, Nepro, Sicura and some models by Cristalonic, Alba, Seiko and
Citizen). As the decades progressed and the efficiency of the solar cells increased while the
power requirements of the movement and display decreased, solar watches began to be
designed to look like other conventional watches.
A rarely used power source is the temperature difference between the wearer's arm and the
surrounding environment (as applied in the Citizen Eco-Drive Thermo).
Display
Analog
poljot chronograph
Traditionally, watches have displayed the time in analog form, with a numbered dial upon
which are mounted at least a rotating hour hand and a longer, rotating minute hand. Many
watches also incorporate a third hand that shows the current second of the current minute.
Watches powered by quartz usually have a second hand that snaps every second to the next
marker. Watches powered by a mechanical movement appears to have a gliding second hand,
although it is actually not gliding; the hand merely moves in smaller steps, typically 1/5 of a

second, corresponding to the beat (half period) of the balance wheel. In some escapements
(for example the duplex escapement), the hand advances every two beats (full period) of the
balance wheel, typically 1/2 second in those watches, or even every four beats (two periods, 1
second), in the double duplex escapement. A truly gliding second hand is achieved with
the tri-synchro regulator of Spring Drive watches. All of the hands are normally mechanical,
physically rotating on the dial, although a few watches have been produced with "hands" that
are simulated by a liquid-crystal display.
In watches sold for timekeeping, analog display remains very popular, as many people find it
easier to read than digital display; but in timekeeping watches the emphasis is on clarity and
accurate reading of the time under all conditions (clearly marked digits, easily visible hands,
large watch faces, etc.). They are specifically designed for the left wrist with the stem (the
knob used for changing the time) on the right side of the watch; this makes it easy to change
the time without removing the watch from the wrist. This is the case if one is right-handed
and the watch is worn on the left wrist (as is traditionally done). If one is left-handed and
wears the watch on the right wrist, one has to remove the watch from the wrist to reset the
time or to wind the watch.
Analog watches as well as clocks are often marketed showing a display time of
approximately 1:50 or 10:10. This creates a visually pleasing smile-like face on upper half of
the watch, in addition to enclosing the manufacturer's name. Digital displays often show a
time of 12:08, where the increase in the number of active segments or pixels gives a positive
feeling.
Tactile
Eone Timepieces, a company owned by Hyungsoo Kim that is based in Washington D.C.,
United States (U.S.), launched its first tactile analog wristwatch on July 11, 2013 on
the Kickstarterwebsite. The device is primarily designed for sight-impaired users, who can
use the watch's two ball bearings to determine the time, but it is also suitable for general use.
The timepiece is named the "Bradley", after Paralympic swimmer Bradley Snyder, a
former U.S. Navy member who lost his sight in Afghanistan. Snyder, who was introduced to
Kim through a mutual friend, responded positively to the watch, stating: "... the first time I
put it on, I was blown away."

As of July 14, 2013, the Kickstarter had raised over US$149,000 and the first batch of 350
watches is scheduled to ship during November 2013.
Digital
Cortebert digital mechanical pocket watch. 1890s
Cortebert digital mechanical wristwatch.1920s
A silver Pulsar LED watch from 1976.
A digital display simply shows the time as a number, e.g., 12:08 instead of a short hand
pointing towards the number 12 and a long hand 8/60 of the way round the dial. The digits
are usually shown as a seven-segment display.

The first digital mechanical pocket watches appeared in late 19th century. In the 1920s, the
first digital mechanical wristwatches appeared.
The first digital electronic watch, a Pulsar LED prototype in 1970, was developed jointly
by Hamilton Watch Company and Electro-Data, founded by George H. Thiess. John Bergey,
the head of Hamilton's Pulsar division, said that he was inspired to make a digital timepiece
by the then-futuristic digital clock that Hamilton themselves made for the 1968 science
fiction film 2001: A Space Odyssey. On April 4, 1972, the Pulsar was finally ready, made in
18-carat gold and sold for $2,100. It had a red light-emitting diode (LED) display.
Digital LED watches were very expensive and out of reach to the common consumer until
1975, when Texas Instruments started to mass-produce LED watches inside a plastic case.
These watches, which first retailed for only $20, reduced to $10 in 1976, saw Pulsar lose
$6 million and the Pulsar brand sold to Seiko.
An early LED watch that was rather problematic was The Black Watch made and sold by
British company Sinclair Research in 1975. This was only sold for a few years, as production
problems and returned (faulty) product forced the company to cease production.
A digital watch displaying the time, seconds, and date
Most watches with LED displays required that the user press a button to see the time
displayed for a few seconds, because LEDs used so much power that they could not be kept
operating continuously. Usually the LED display color would be red. Watches with LED
displays were popular for a few years, but soon the LED displays were superseded by liquid
crystal displays (LCDs), which used less battery power and were much more convenient in

use, with the display always visible and no need to push a button before seeing the time. Only
in darkness you had to press a button to light the display with a tiny light bulb, later
illuminating LEDs.
The first LCD watch with a six-digit LCD was the 1973 Seiko 06LC, although various forms
of early LCD watches with a four-digit display were marketed as early as 1972 including the
1972 Gruen Teletime LCD Watch, and the Cox Electronic Systems Quarza. In Switzerland,
Ebauches Electronic SA presented a prototype eight-digit LCD wristwatch showing time and
date at the MUBA Fair, Basle, in March 1973, using a Twisted Nematic LCD manufactured
by Brown, Boveri & Cie, Switzerland, which became the supplier of LCDs to Casio for
the CASIOTRON watch in 1974.
From the 1980s onward, digital watch technology vastly improved. In 1982 Seiko produced
a watch with a small television screen built in, and Casio produced a digital watch with a
thermometer as well as another that could translate 1,500 Japanese words into English. In
1985, Casio produced the CFX-400 scientific calculator watch. In 1987 Casio produced a
watch that could dial your telephone number and Citizen revealed one that would react to
your voice. In 1995 Timex released a watch which allowed the wearer to download and store
data from a computer to their wrist. Some watches, such as the Timex Datalink USB,
feature dot matrix displays. Since their apex during the late 1980s to mid-1990s high
technology fad, digital watches have mostly become simpler, less expensive time pieces with
little variety between models.
Despite these many advances, almost all watches with digital displays are used as
timekeeping watches. Expensive watches for collectors rarely have digital displays since
there is little demand for them. Less craftsmanship is required to make a digital watch
face and most collectors find that analog dials (especially with complications) vary in quality
more than digital dials due to the details and finishing of the parts that make up the dial (thus
making the differences between a cheap and expensive watch more evident).

Illuminated
Many watches have displays that are illuminated, so they can be used in darkness. Various
methods have been used to achieve this.
Mechanical watches often have luminous paint on their hands and hour marks. In the mid-
20th Century, radioactive material was often incorporated in the paint, so it would continue to
glow without any exposure to light. Radium was often used, but produced small amounts of
radiation outside the watch which might have been hazardous. Tritium was used as a
replacemant, since the radiation it produces has such low energy that it cannot penetrate a
watch glass. However, tritium has a half-life of only about 12 years, so the paint did not
remain luminous for more than a few years. Nowadays, luminous paint is still sometimes
used on analog displays, but no radioactive material is contained in it. This means that the
display glows soon after being exposed to light, but quickly fades.
Watches that incorporate batteries often have electric illumination of their displays. However,
lights consume far more power than electronic watch movements. In order to conserve the
battery, the light is activated only when the user presses a button. Usually, the light remains
lit for a few seconds after the button is released, which allows the user to move his hand out
of the way.
Animation of LCD, both unit and with electroluminescent backlight switched on.
In some early digital watches, LED displays were used, which could be read as easily in
darkness as in daylight. However, the user had to press a button to light up the LEDs, which
meant that the watch could not be read at all without the button being pressed, even in full
daylight.
Some cheaper watches have small incandescent lamps to illuminate the display. However,
these tend to produce very non-uniform illumination, and are very wasteful of electricity.
Other watches use electroluminescent material to produce uniform illumination of the
background of the display, against which the hands or digits can be seen.

1.3 WATCH INDUSTRY IN INDIA - AN OVERVIEW
The Indian watch industry inclusive of all product categories is estimated at over Rs. 10000
Cr. Growing at average rate of 8% annually. After two year of recessionary clout the
countries watch market is expected to grow at a brisk 9% to 11% in the next couple of years.
With the economy springing positive vibes, steadily progressing retail landscape and larger
disposable income level market insiders opine that Indian consumer is spurring the demand.
The 15th
India International Watch & Clock Fair ‗Samay Bharti‘, under the auspices of the
watch trade Federation held between February 4th
to 7th
2010 saw in impressive line up of
over 100 national and international companies primarily from India. Switzerland, France,
Japan, Taiwan and Hong kong.
Accordin to hemal Kharoda, chif organiser of the 4 day exhibition held in Mumbai after six
year is likely to attract over the 4000 dealer, wholsoller from all over the country and abroad.
The Indian watch industry inclusive of all product categories is estimated at over Rs.10000
cr. Growing at average rate of 8% annually. Overall 4.5 Cr. watches are manufacture in a
year. The highest share of watches retailed is around the price range from Rs. 500 to Rs.
3000.
The categories of watches retailed in price brecket of Rs. 4000 to Rs. 15000 is growing at an
exponential rate of over 20%.
The size of the organised luxury watch segment is around 3% growing at around 20%
annually. With liberal import since the last 10 years many international brands have shops in
India, some even opening there subsidiary in the cities of Mumbai, Delhi and Bangalore.

1.4 INDUSTRY FRAMEWORK

1.5 Competitive Structure of Watch industry
Watch industry Players:
Watch industry in India in the organized sector produces around 60% of the total production.
According to a recent study, more than 90 percent of the watches were from the lower price
ranges with international costs being less than 20 euros. Moreover, around 20 to 25 watches
are being sold for every 1000 citizens. Thus there is enormous potential for growth of the
industry in this untapped segment. Some customers look out for features like fashion appeal,
technology, sophistication and status. Others go for durability, economy and precision.
The main players in the organized watch industry are as below …
1. IST
2. KDDL
3. Opal ltd.
And other players in the organized sector are as below……..
HMT
Titan
Timex
Rolex
Omega

1.6 WATCH MAKING PROCESS
This section will focus on quartz digital watches with LED displays. Although the assembly
of such watches must be performed carefully and methodically, the most essential aspects of
the manufacturing process are in the manufacture of the components.
Quartz
1. The heart of a quartz watch is a tiny sliver of quartz. The synthetically produced
quartz is cut by the manufacturer with a diamond saw and shipped to the watchmaker
to use. The production of "grown" quartz is a critical step in the process.
Quartz, in a natural form, is first loaded into a giant kettle or autoclave (the same
device used by doctors and dentists to sterilize instruments). Hanging from the top of
the autoclave are seeds or tiny particles of quartz

In watch assembly, the entire set of crystal and microchips is set onto a circuit board.
A battery is also installed that generates electricity for the quartz crystal and supplies
the power for the LED display with the desired crystalline structure. An alkaline
material is pumped into the bottom of the autoclave, and the autoclave is heated to a
temperature of roughly 750 degrees Fahrenheit (400 degrees Celsius). The natural
quartz dissolves in the hot alkaline liquid, evaporates, and deposits itself on the seeds.
As it deposits itself, it follows the pattern of the crystalline structure of the seeds.
After about 75 days, the chamber can be opened, and the newly grown quartz crystals
can be removed and cut into the correct proportions. Different angles and thicknesses
in the cutting lead to predictable rates of oscillation. The desired rate of oscillation for
quartz used in wristwatches is 100,000 megaHertz or 100,000 oscillations per second.
2. To work most effectively, the piece of quartz needs to be sealed in a vacuum chamber
of one sort or another. Most commonly, the quartz is placed into a sort of capsule,
with wires attached to both ends so that the capsule can be soldered or otherwise
connected to a circuit board.
The microchip
3. The electronic leads generated by a battery through the quartz (producing oscillations)
will go to a microchip that serves as a "frequency dividing circuit." Microchip
manufacture, like the quartz, is also carried out by the supplier to the watch
manufacturer. An extensive and complex process, making microchips involves
chemical and/or x-ray etching of a microscopic electronic circuit onto a tiny piece of
silicon dioxide.
4. The oscillation rate of perhaps 100,000 vibrations/second is reduced to 1 or 60 or
some other more manageable number of oscillations. The new pattern of oscillation is
then sent to another microchip that functions as a "counter-decoder-driver." This chip
will actually count the oscillations that it receives. If there are sixty oscillations per
second, the chip will change the reading on an LED every second. After 3,600
oscillations (60 x 60), the counter will instruct the LED to change the reading for
minutes. And, after 60 x 60 x 60 oscillations (216,000), the counter will change the
hour reading.

Assembly
5. The entire set of crystal and microchips is set onto a circuit board. The board
incorporates a space to hold the battery that supplies electricity to the quartz crystal
and supplies the power for the LED display. Generally, the space for the battery is on
the outside of the surface facing the back of the case. The battery can be replaced by
removing the back of the watch, shaking out the old one, and dropping in the new
battery.
6. The mechanism used for setting the watch is then connected. This mechanism
involves two pins that extend beyond the case of the watch. One pin lets the counter
circuit know which reading to reset—seconds, minutes, or hours. The second pin is
pushed a number of times to bring the display to the desired reading.
7. The entire circuit board, along with a battery, is then closed into a case, and a wrist
strap is attached.

Chapter 2 Major Players of
Watch Industry
in India

2.1 IST limited
History
Swiss Time Limited (IST) was incorporated as a public limited company on 31.08.1976 to
carry on the business of manufacture, design, import and export of watches and watch parts,
components, cases and other ancillary products.
It began operations in 1977 by assembly of watches with imported components. It began
manufacturing components in March 1979. In April 1980, the company issued shares to the
public to part finance a project to manufacture different kinds of wrist watches.
However due to a shift in customer preference to quartz watches and competition from
Illegally imported watches there was down turn in the market for mechanical and automatic
watches manufactured by IST. To remedy this situation, IST diversified into manufacturing
precision components for defence applications in 1989 and further into manufacture of
components for electronic/medical dental instruments for the export market in February 1993.
Apart from a brief period of labour unrest in January-February 1991, the employer-employee
relations in the company have been very cordial.
Operation of the company
The primary operations of the company are now manufacturing components for
exports. The components manufactured are high quality precision components used in
electronic, medical and dental instrument. The company had developed the
components to meet the exacting standards required of its international customers and
has been able to secure repeat orders from its buyers. In the year ended 31 March
1994 the company recorded export sales of more than Rs 395 lacks.
IST is also manufacturing precision components for the Ministry of Defence. Used in
various applications the components require a high level of precision and quality. The
quality of ST's products has been appreciated by the Ministry of Defence. Sales to the
Ministry of Defence in year 1993-94 were Rs. 127.13 Lakhs.

2006
I S T Ltd has informed that the Company has entered into Supplemental Agreement
with Unitech Ltd., for development of Software/IT Park on 28.419 acres instead of
13.35 acres.
2011
Mr. Manish Mehta, FCS has been appointed as Company Secretary & Compliance
officer of the Company.
2012
Appointment of Mr. Suresh Chand Jain as an Executive Director of the Company.
Appointment of Mr. Gaurav Guptaa as Director of the Company who was appointed
as an additional Director.
Appointment of Mr. Rishi Kumar Jain as Director of the Company who was
appointed as an Independent Director.

2.2 KDDL
History
Commencing production of watch dials in 1983, Kamla Dials and Devices (KDDL) faced
difficulties due to adverse government policies, infrastructural problems and the sudden
liquidation of its original Swiss collaborator, Leschot. The company took a step towards
revival by entering into a new collaboration with Tesio Precision, Taiwan.
The company manufactures the entire range of watch dials -- plain printed dials, multi-printed
dials, pressed dials, applied index dials, multi-function dials, and dials with special features
including luminised indexes, jewels, and precious stone surfaces such as mother of pearl,
tiger's eye, etc. Domestic customers include major watch manufacturers like Titan, Allwyn,
Timex, Bentex, HMT, etc. It exports mainly to Europe.
Its unit manufacturing watch hands commenced production in 1994 along with a third
production line for dials. Apart from further expansions of existing facilities, a wholly-owned
subsidiary, Kamla Appliques, floated to take over the manufacturing facilities of appliques
(components used in making dials) from KDDL.
To keep pace with changing preferences, the company has entered into a collaboration with
Ageo Seimitsu, Japan, to produce diamond-cut hands, which is a shift from simple buffed
hands. KDDL is also expanding its existing facilities.
The company is planning to develop new dial finishes in the near future. To increase the
market share in Hong Kong and Swiss markets the company is taking severe efforts in cost
cutting and aggressive marketing.

2.2.1 Mission & Vision
Our vision is to globalize India as a market for watches and a leading source of manufactured
products for the watch and other precision-led businesses.
We are using India‘s well-developed technical expertise to create state-of-the-art factories,
offering top quality products while competing with the best in the world. As India becomes a
global manufacturing hub, we aim to play a leading role in the watch and precision
engineering business.
At the same time we envision India as a booming market for the world‘s best products. Swiss
watch companies already see India as the market with the greatest growth potential. Our
vision is to play a central role in the retail of Swiss watches and in the retail of a wide range
of luxury lifestyle products.
2.3 OPEL CLOCK
History
OPAL LUXURY TIME PRODUCTS LIMITED is a Pune based company, into the business
of manufacturing and marketing of High-end Designer Wall Clocks and Table Clocks with
the brand name OPAL and CALIBER.
A decade ago, the clock as a product category has been largely neglected in the country, by
manufacturers, and no sincere effort was made by them to uplift the product category, on the
contrary, they brought down the prices and quality, by getting into the price war, and hence
the product category lost the battle. The purpose of a clock has been primarily to show time,
in houses, offices and public places.
In 1996 Mr. Subhash Gujar had created & launched the brand with a difference, of making
clock a piece of art, more than a time showing device. It launched high end clocks, with a
major design element, movements from Japan, high class door step service, new innovative
materials, unconventional channels of sales, and because of all this, though with great
difficulty, it has reached and has been recognized to be the pioneers and leaders in this range.
Till 2007 OPAL as a brand was well recognized across the country and all major dealers were
dealing in the products, and the range was very well accepted by the consumers.
The growth was happening at a good speed and the need of investments was rising very high
which the partners of the firm understood that they cannot keep pace with and hence strategic
alliance with the management of Innovative Venture Ltd. was done.
Innovative Venture Ltd. a company based in Pune, primarily in to manufacturing of auto
components, having an annual turnover of Rs. 450.00 crores, was looking out for investments
in companies which had great growth plan but were stuck because of funding.
When both the promoters met and joined hands, the new company was formed in February
2007 by the name of OPAL LUXURY TIME PRODUCTS PRIVATE LIMITED and the
operations started in February 2007.

Today OPAL has a PAN India presence, and the products are sold by leading Home
Improvement stores, gift stores, white goods dealers and high end watch & clock stores. We
are proudly associated with Shopper's Stop, Home Town, @Home, Reliance Retail, THS and
are an important business associate to them, in the Home Improvement stores.
Each designer timepiece goes through an elaborate and minute process so that what emerges
finally is perfection. The first step in that process is the designing team, a talented group of
individuals who always seek to be inspired to devise creations that will stand out and will
eventually reign over time.
Once the designing is complete the assembling takes at Opal's well equipped setup in
Roorkee, Uttarakhand where cutting edge technology is matched with impeccable materials
and expert workmanship. Moreover all movements of Opal clocks are quartz movements
from Japan, the world leaders in this segment. Each and every element of the timepiece is
carefully chosen, so that when we say that Opal is perfect in every small detail it is no
exaggeration.
When we hand over any Opal timepiece we are honouring the trust that our patrons have
entrusted to us. Hence Opal brings a stunning range of exclusive and exquisite timepieces
like Westminster Chime, Pendulum, Statue, Digital, Feature and World clock for the true
connoisseur, who appreciates quality, chooses exclusivity and respects commitment.
Opal has till date delighted with many admirer who consider these timepieces an integral part
of their lifestyle, an understated and subtle elegance that adorns their homes and enhances its
aesthetic appeal. And therein lies our immense satisfaction.
It has reached to a platform where the brand is well recognized and the fixed costs are well
covered, i.e. it has now created a launch pad from where the company and its investors
including bankers can ride the growth.
It currently boasts of a wide dealer network ranging from Jammu in north to Kochi in south
and Ahmedabad in west to Shillong in east.

The growth in the new housing and home improvement market has been phenomenal and
OPAL is benefiting from the same.
Opal Luxury Time Products Pvt. Ltd. becomes Opal Luxury Time Products Limited from
1st Nov, 2012.
2.3.1 Mission and Vision
The Opal Vision
Opal's vision is based on consistent innovation through cutting edge technology to improve
the quality of its product. Its aim is to make each Opal creation a collectible item that is as
much a work of art as it is technologically desirable. Its vision is complemented by a state of
the art manufacturing unit and handpicked designers. Consistent up gradation in technology
and creativity - through leadership, team education and advanced facilities may complete
Opal's aspiration of surpassing their own achievements and creating new standards.
The ultimate vision of the company is to be the best and most recognized brand in the varied
products including watches & clocks, leather accessories, writing instruments, worldwide.
We are passionate about making it a complete lifestyle brand.
The Opal Mission
We look forward to being the most desired brand in lifestyle products through undeviating up
gradation in technology and creativity - through leadership, team education and enhancing
facilities.

Chapter 3
Macro
Analysis of
Industry

3.1 Industry Dominant Economic features
In this instance, the dominant economic features will help further gauge the overall potential
attractiveness of the industry, as well as give us a deeper look into what the current
companies in this industry deal with at this level.
1. Market size and growth Rate
Growing at 10-15% every year, driven by youth and premium segment of consumers,
according to a report.
Current GDP rate of industry is 8%.
2. Scope of competitive rivalry
Geographic area
However, in value terms, around 60 per cent of the total watch market in India is
controlled by organized players that include domestic firms such as Titan, Timex,
Maxima and HMT, and a host of international brands and companies such as LVMH,
Seiko, the Swatch Group, Chanel and others.
In terms of volumes, the organized players currently command 40 per cent of the
industry (around 460 lakh units annually) and the rest 60 per cent by the unorganized
segment, which consists of smuggled watches, cheap imported watches and those
assembled by small unorganized players.
3. Buyers needs and requirements
Many customers prefer mechanical and automatic watches, while others prefer quartz
watches. Newer segments are also on rise such as ladies watches, children‘s watches
and gent‘s watches.
Customers usually base their preferences and buying decisions on a variety of factors
like price, durability, utility, aesthetic appeal and brand name. A combination of all
these points ultimately forms the customer‘s buying decision that translates into the
purchase of a watch.

4. Production Capacity
There are many competitors in industry, so competition between these company is
increased which affect the production capacity of watch.
5. Pace of technological change
To sustain in the market company have to come up with new technology every day.
Watch comes with new features like GPS system, Bluetooth, LED display etc.
With the younger generation opting to use their smart phones to tell time, the watch-
making industry is being forced to get smart and high-tech to recapture consumers.
Ulysse Nardin, a Swiss luxury watchmaker, launched what it claimed is "the world's
first luxury hybrid smartphone," integrating a mechanical watch rotor into the mobile
phone.
Material: 100% silicone with digital watch
Shape: square, silver, white oil
With adjustable silicone strap for children, women, and men
Type of wristbands: glow in the dark, solid color, multiple colors, and transparent
Printing: printing logo, embossed&debossed logo are both ok
Color: any Pantone colors, we have 11 existing colors for your reference.
With EN71, CE, CPSIA, SGS, and RoHS certificates
Easy to wear and read time
Elastic and flexible
Eco-friendly, non-toxic, lightweight, and durable
Suitable for advertisement, promotion, gifts

6. Degree of Product Differentiation
The idea is to offer a product that is perceived as unique by the customer. The
uniqueness can rely in the design -Techno Marine, the brand who dares to mix plastic
and diamond-, the brand image -Rolex and achievement, Cartier and art-, the
technology used -Omega and the co-axial movement-, after-sales and customer
services, etc.
Of course, the company cannot totally ignore the costs if it chooses a differentiation
strategy but it is not the primary target.
7. Vertical integration
Anticipating the battle for the watch components, it is a couple of years now that
Rolex is following a backward vertical integration strategy in order to be able to
ensure a total independence from competitor groups.
This pattern shows through the numerous takeovers of suppliers that took place lately.

3.2 PORTER’S FIVE FORCE MODEL
3.2.1 Rivalry among Competing Sellers
Rivalry is stronger because Watch Company comes with different innovative product,
adding new features and technology.
Buyer switching cost is higher in watch industry because the price of watch is
different according to brand.
The number of rivalry is increased in the market because it comes with new product
in the market.
If there is a difference between the product of two company or rivals than we can say
that rivalry is weaker.
High level of advertising made by company will increase buyer perception towards
product of company.

3.2.2 The bargaining power of buyers:
When consumers are looking for a watch, they are confronted to the multitude of
brands competing and the various segments: fashion brands
watches, hautehorlogerie watches, mass-market watches, etc. As we have seen
previously, the number of watchmakers is very important and therefore, buyers have
to make a choice. The different criteria involved in the decision-making process may
be :
1) Price – we can find watches for 10€ as well as spending thousands of Euros
2) Quality – made in China vs. Swiss made
3) Style – colorful plastic watch vs. Leather wristband and golden watch
4) Size – from the Piaget Altiplano (2.35mm thick) vs Rolex Sea dweller (15mm
thick) …
Established brand
If the brand is very famous, successful and appealing to customers, there is no
obvious difficulty for distributors to sell the products: the marketing and
communication efforts done by the brand will drive customers easily into the
jeweller‘s shops. In this case, the bargaining power of the buyers is pretty low: he
wants the product in order to sell it and gain benefits on the sales. Of course, the
jewellers can influence the final customer‘s choice.
Newcomers
The situation is totally different for new entrants. Jewellers are usually not especially
risk takers and if they have no guarantee that the brand is a hit and will be easily sold,
then one might have a hard time trying to convince them to buy ones products. All the
power is in the hands of the distributors; with no distributors, the way to the
customers is locked. What is more, distributors might be pressured by actual players
to refuse to distribute new brands. Therefore, as we mentioned earlier, distribution is
an important barrier to entry.

This important number of competitors means a broader offer to the consumer, which
enhances his bargaining power. This power is also reinforced by the fact that buying a
watch is usually not an utility purchase. This point is more and more true as people
have time on their mobile phones and a watch is becoming of a second importance.
3.2.3 The bargaining power of suppliers:
There is an important difference between the mass market brands and premium ones.
If both of them often have the « swiss made » inscription, they have two different
meanings. For the first ones, the watch components are usually made in a low labour
cost country, with a low to medium quality, and then are assembled in Switzerland,
allowing the watch to be « swiss made ». For the second ones, both manufacturing the
components and assembling them are made in swiss by the company, which is often
synonym of a good quality. For the first group of manufacturers – that includes
Swatch, suppliers don‘t have to have a very strong know-how, and can therefore be
relatively numerous. This is diminishing their bargaining power over watch brands.

3.2.4 The threat of new entrants:
Even though the haute-horlogerie segment has very strong barriers to entry
(manufacturing costs, brand heritage, distribution selectio), swatch can be attacked by
new entrants. Indeed, its products are simple, accessible, playful, and colorful – the
exect opposit of haute-horlogerie watches – and entering this segment does not have
very specific requirements (as brand heritage can be). It also can be attractive as there
are not a very strong competition on this specific segment.
Capital requirement
In order to be considered, a watch needs a brand that is recognized and considered by
everybody as belonging to the world of luxury. Therefore, a new brand entering the
market is compelled to invest in huge advertising campaigns in order to get fame and
identification from the public.
What is more, at first, a campaign to penetrate the luxury market should target a very
large audience: an object possesses the title of exceptional and luxury only if
everybody knows the brand and accepts it as a luxury object.
Brand recognition
This barrier is tightly tied to the first one … basically it is where the money goes.
Watch making relies heavily on differentiation strategies which require lots of
investments in advertising and public relation (PR) events.
Objectively, the product is, from a design point of view, very similar from one brand
to another even though most companies claim their product is unique.
It would be more correct to say that the brand and its communication bring life to the
product, give it its identity and maybe has the potential to make it unique. A good
statement of this evolution is Mr. Nicolas Hayek3 mentioning ―We are selling
emotion‖.
Distribution
Last but not least, distribution is also an important issue for a new company willing to
penetrate the market. The distributor is taking an important financial risk if he decides

to supply a brand that is still unknown or that cannot ensure a certain amount of
spending in marketing and communication to promote its products.
The distributor has to pay for the products he buys and if he doesn‘t sell them he is the
one supporting the net loss.
3.2.5 The threat of substitutes:
The way we use a watch shifted drastically these years. As the wristwatch was a
revolution (opposed to the pocket watch), the mobile phones are changing the rules of
the industry. The utilitarian aspect of a watch a decreased a lot, the time being now
available on mobile phones, computers, and more. People would rather consider a
watch as a style accessory, an expression of their personality. Therefore, we can see
the threat of substitute as relatively high. The primary function of watches – that is
giving the time ! – is seriously challenged by all the electronic devices we carry
everyday (mobile phones, mp3 players, Kindles/iPads, laptops, etc.).

3.3 INDUSTRY’S DRIVING FORCES
3.3.1 Growing Use of Internet and Ecommerce
The internet is proving to be an new distribution channel. Watch industry‘s websites
is access faster than its rivalry. It was opened at 24*7 and 365 days in a year. Now the
companies used internet to reach their best supplier and customer.
3.3.2 Industry Globalization
If the competitors increase their business of market before that you have to expand
our product and market from primary to international and globally
.
As we know that some of the companies of watch industry are established and spread
globally like, Timex, Rolex, etc.
They cover their market in different countries and it break the market of its substitute
product and comes again in market.
3.3.3 Change in long term industry Growth rate
At the time of cell phone introduce, it broke the market of watch industry because
people will see time in cell phone. So no need to wear watch but now a days its
fashion or manner to wear different types of watch at different occasion.
So the growth rate of industry will increase to 9.3 %
3.3.4 Product Innovation
Competition In an industry is always of affected by riverls racing to be first to
introduce the new product in the market
Take the example of watch which connected with Samrt-phone of Samsung Galaxy
note-3 Gear. It is called product innovation, its introduce in a digital, LED and Other
form also.

3.3.5 Technological change And manufacturing process innovation
As time passes competitors come with new technological device, so sustain in the
market you also have to introduce product innovative idea.
It means earlier it contain big model and simple look. And now it comes in a
digital form which carries fashionable look and multi-functionality.
3.3.6 Marketing innovation
Watch industry come with new advertisement, they create need of watch in our
daily life.
It introduce of product at one or two level of distribution channel which directly
affect to the price and services.
3.3.7 Entry or Exit of major firm
Entry of major foreign firm or companies in to a geographic market shoe new way
of competition and come up with new innovation.
Entry into a market often involves substantial reduced costs for the purchase or
rent of new equipment and advertising expenditures to develop product
awareness.
3.3.8 Changes in the cost of Efficiency
Of course the costs of wrist watch increase as it increase innovation in existing
product or new product in the market.
But with that efficiency of doing work and features is also increase. So we can say
that a change in cost and efficiency is higher in watch industry.
3.3.9 Changing Societal concern, attitude and lifestyle
Emerging social issues and changing attitude and lifestyle can be powerful
instigators of industry change
As the attitude and life style change, there is change in demand of customer. They
want different types of watch to ware at different occasion.
And as par their requirement they produce watch and cover their market at global
level also.

3.4 STRATEGIC GROUP MAPPING
Strategic group mapping is technical for displaying the different market or competitive
position that rival firms occupy in the industry.
3.4.1 Price and quality range
Watch industry contain high and medium price of product with best quality.
Ex., Range :- 2500 – 4000
4000 – 6000
6000– 8000
3.4.2 Geographic Coverage
It converge regional to global level of geographic converge.
Regional – Casio pvt ltd.
National – Rado, Roamer, Fastrack.
Global – Titan, Citizen, Omega,
3.4.3 Product line Breath
There are wide range of product under watch, like simple, digital, Sport and
Innovative etc.

3.4.4 Use of Distribution Channel
Now a day‘s customers have no time and no need to go physically at place of watch
shop because with the help of internet anyone can purchase it online. So, it decrease
distribution channel up to one or two level.
3.4.5 Service Offered
Watch industry provide full services to their customer. After sealing product there is
some defect arise, they solve it at free of cost with in warranted time or charge
nominal if over the time limit of warranty.

3.5 KEY SUCCESS FACTORS
3.5.1 Technology Related
Watch industry comes everyday with new technological innovation in market. So,
it maintains their position.
As time passes they use new manufacturing efficiency and decrease their
manufacturing costs which directly reduce their product cost.
3.5.2 Manufacturing related
As we have seen technology related to watch, manufacturing cost will reduce. If
price is a rise but never compromise on quantity.
They used capital intensive technology which is important part of reducing
manufacturing cost.
3.5.3 Distribution Related
In watch industry the network of wholesaler and distribution are stronger.
They reduce price by directly selling product through internet.
3.5.4 Marketing Related
Watch industry have wide range of product line and variety.
They produce as per requirement of customer (silver/gold/platinum/diamond)
They give very effective advertisement by indoor and outdoor media like, T.V.,
Internet, Holdings, Newspaper, etc…
3.5.5 Skills and capability related
Watch industry is capable to cover national and global market.
It daily comes with new innovative product in the market. So, competition with its
substitute is higher.
As par region, they provide delivery time. Like 5 days, 7 days from the order
placed.

3.6 PEST ANALYSIS
4.1.1 PESTL ANALYSIS:-
It is very important that an organization considers its environment before beginning
the marketing process. In fact, environmental analysis should be continuous and feed
all aspects of planning. The organization's marketing environment is made up from:
The internal environment
The micro-environment
The macro-environment e.g. Political (and legal) forces, Economic forces, Socio-
cultural forces, and Technological forces. These are known as PESTL factors.
A PEST analysis is one of them that are merely a framework that categorizes
environmental influences as political, economic, social and technological forces.
Sometimes two additional factors, environmental and legal, will be added to make a
PESTL analysis, but these themes can easily be subsumed in the others. The analysis
examines the impact of each of these factors (and their interplay with each other) on
the business.
PEST is useful when a company decides to enter its business operations into new
markets and new countries. The use of PEST, in this case, helps to break free of
unconscious assumptions, and help to effectively adapt to the realities of the new
environment.
Point of Pest Analysis Industry or Business

The pest analysis includes some of these basic factors:
*.Political Factors
*.Economic Factors
*.Social Factors
*.Technological Factors
1. Political Factors:
We are facing a lot of political instability in Indian for many years which affects the
business sector very much because new governments come with new policies which
may result in winding up of any business. There may be a government can come up
with new strategies which can affect the profitability ratios of business. Like if the
government increases the taxes in Indian so it can decrease the ratio of our profit.
Changing in the policies is also an important aspect affecting the business sector.
2. Economic Factors:
There is an economic crunch is going is India from last 5-6 years which has reduced
the purchasing power of customers so when purchasing power decreases the demand
for Watch and warm Watch decreases and at the end the demand for Angora wool
decreases.
From the Overall market KDDL have 60% market share
GDP growth rate of watch industry is 9.3%.
3. Social Factors:
Keeping in view the cultural trends in Indian we have products which will be
according to the values of our society. This will also benefit us in the increasing of
market potential. As we know that people changes their lifestyles and attitudes
according to the new trends of society. So there are possibilities of new innovative
business to survive in the market like our business.
4. Technological Factors:
As we know that new technology in a coming day by day. So we will be hoping for
the new technology to come up so that we are able to increase our production.
Now watch industry introduce new product in the market with adding new features. It
introducing digital watch with GPS, Bluetooth, and listen mp3 song. This is called
innovation in technology to sustain in the market.

Chapter 4
Introduction of
financial statement &
its analysis
4.1 INTRODUCTION
The position of finance in business can be match with the position of blood in the human
body. Finance is the life blood of the business. Finance, today is not only limited up to
function that circulate business but also extended its boundaries. Today success or failure of
any business concerned heavily depends upon how effective finance management a firm has.
It is the portfolio that gives maximum return at minimum cost. Further different parties, both
inside and outside of the firm are interested in financial position of firm and fixed interval
they often evaluate financial position by assessing financial statement of firm.
To understand the financial performance & condition of a firm, it‘s stakeholders look at three
financial statement, viz the Balance sheet, Profit & Loss A/c & the sources & uses of funds
statement. The Balance sheet showed the financial position of the business at a given point of
time. The p & L A/C reflects the financial performance of the firm over a period of time. For
the purpose of taking decision by shareholders, creditors, & other persons regarding their
individual matters it is necessary for them to analyze various financial statements.
The financial Analysis is a process of evaluating the relationship between component parts of
financial statement to obtain a better understanding of the firm‘s position & performance. The
first step is to select the information relevant to the decision under consideration from the
total information contained in financial statement. The second step is to arrange the
information in a way to highlight significant relationship. The final step is interpretation &
drawing of conclusion. The basic limitation of the Traditional financial statement comprises
the Balance sheet & P& L A/C is that they do not give all the information related to financial
operation of the firm.
There are total 16 companies in Watch industry. Performing financial analysis with all is
difficult. Hence, we have done financial analysis of some of the companies based on selected
criteria. To scrutinize the companies, we have gone for filteration through Capitaline
software,

The results of this filteration is presented in the following table
Stage of Filteration filteration Base Result
Stage 0 Watch Company 16
Stage 1 Sales > 11 Cr. 6
Stage 2 Net Profit>30 Lakh 5
Stage 3 EPS> Rs. 0.40 4
Financial analysis has done on the basis of certain criteria. I have selected three companies in
Indian market that is IST, Opal luxury and KDDL Ltd. This 3 company is selected on3
criteria that are Sales, Net profit and Earning per share.
This chapter deals with the following issues related to research study
Objectives of Financial Analysis
The aim of the project is to study working procedure and financial analysis of WATCH
INDUSTRY. The Study will highlight the following objective.
Study the ratio analysis of Watch industry.
Study the cash flow statement
Common size statement

4.2 FINANCIAL ANALYSIS & TECHNIQUES.
As stated earlier success or failure of any firm heavily depends on its financial management.
The function of financial management is to manage the inflow and outflow of firm in such a
way so that firm can carry out its objective easily. For earning out the objective management
also have to be familiar with the financial position of firm time by time. So for knowing of
financial position management has to go for financial analysis. Management can analyze
firm‘s financial position by evaluating and analyzing financial statement of the firm. Here we
define some techniques of analyzing financial statements are as follows.
Ratio analysis
Common size statement
Trend Analysis

4.2.1 Ratio Analysis
Introduction:
Ratio, broadly speaking, is the numerical relationship between to numbers, and hence
ratio analysis of statement stands for the process of determining and presenting the
relationship of items and groups of items in the statement
The ratio analysis is one of the most powerful tools of the financial analysis. It is used as
a device to analysis and interpret the financial statements can be analyze more clearly
and decision made from such analysis. A ratio can be expressed in three different ways.
The use of ratio is not confined to financial manager only. There are different parties in
ratio analysis for knowing the financial position of the firm for different purposes. The
supplier of goods on credit, banks, financial institution, investors, shareholders and
management make use of ratio analysis as a tool in evaluating the financial position and
performance of a firm for granting credit, providing loans for making investments in the
firm. Thus, ratios have wide applications and are of immergence use today.
Summary of Ratio:-
1. Liquidity Ratio
2. Profitability Ratio
3. Turnover Ratio
4. Coverage Ratio

4.2.2 Advantages of Ratio Analysis:-
Ratio Analysis is useful or the beneficial to various classes of the people like shareholders,
management, creditors etc. Their uses for the ratio may be different. So wide variety of
ratios can be used for the uses of various classes of the people. It provides useful data to the
management, which would help them in taking important policy decisions. It helps in inter
firm comparison, which shows the strength & weakness of the firm as compared to other
firms & will indicate the trend in the respective fields. Ratios guide the Mgt in making some
of the important decisions. The use of ratios was started by Banks for ascertaining the
Quickity of business & profitability of body corporate business for the purpose of
advancing loans to them. It gradually became popular & other creditors began to use them
profitably. Now even the investors calculate ratios from the published accounts of the body
corporate in order to have an idea about the solvency & profitability of the body corporate
before investing their savings.
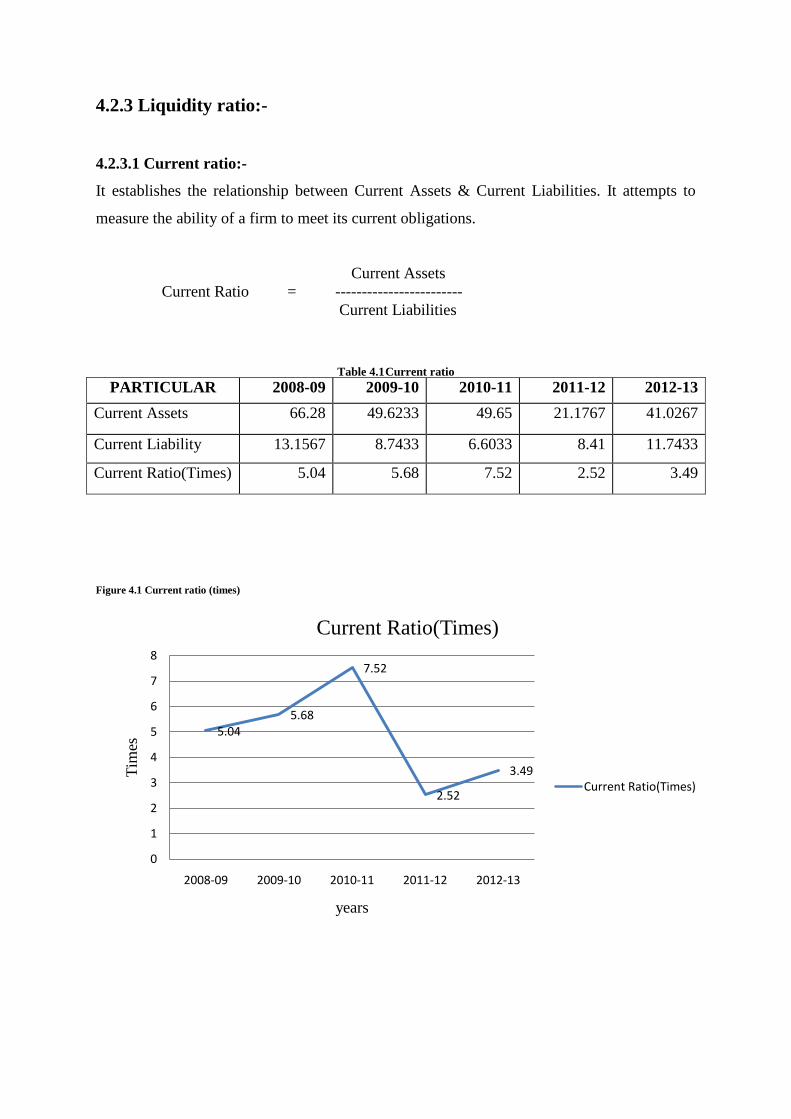
4.2.3 Liquidity ratio:-
4.2.3.1 Current ratio:-
It establishes the relationship between Current Assets & Current Liabilities. It attempts to
measure the ability of a firm to meet its current obligations.
Current Assets
Current Ratio = ------------------------
Current Liabilities
Table 4.1 Current ratio
PARTICULAR 2008-09 2009-10 2010-11 2011-12 2012-13
Current Assets 66.28 49.6233 49.65 21.1767 41.0267
Current Liability 13.1567 8.7433 6.6033 8.41 11.7433
Current Ratio(Times) 5.04 5.68 7.52 2.52 3.49
Figure 4.1 Current ratio (times)
5.045.68
7.52
2.52
3.49
0
1
2
3
4
5
6
7
8
2008-09 2009-10 2010-11 2011-12 2012-13
Tim
es
years
Current Ratio(Times)
Current Ratio(Times)

Interpretation:-
The idle current ratio is 2:1. We can see from graph that current ratio is continuously increase
up to 2010-11 but in 2011-12 it is decrease because total current assets of IST is decreased
from 109.44 to 14.09 in 2011. So it directly made impact on overall industry‘s performance.
The higher value of current ratio indicates more liquidity of the firm‘s ability to pay its
current obligation in time. It is better for the company to increase the level of the current ratio
for greater functioning of the Business.

4.2.3.2 Quick ratio:-
It is also termed as acid test ratio. It is supplementary to current ratio. It establishes the
Relationship between the quick assets & the current liabilities.
Quick assets
Quick Ratio = ---------------------
Current Liability
Table 4.2 Quick ratio
PARTICULAR 2008-09 2009-10 2010-11 2011-12 2012-13
Quick Assets 50.2467 43.1466 43.2733 13.8 31.3234
Current liability 13.1567 8.7433 6.6033 8.41 11.7433
Quick ratio (Times) 3.82 4.93 6.55 1.64 2.67
Figure 4.2 Quick ratio (times)
Interpretation:-
The idle quick ratio is 1:1 is considered to be satisfactory. There is same situation occurred in
quick ratio also because of decrease in current assets.
3.82
4.93
6.55
1.64
2.67
0
1
2
3
4
5
6
7
2008-09 2009-10 2010-11 2011-12 2012-13
Tim
es
Years
Quick ratio (Times)
Quick ratio (Times)

4.2.4 Profitability Ratio
4.2.4.1 Operating Profit Ratio:-
It indicates the operational efficiency of the firm & is a measure of the firm‘s ability to cover
total operating expenses.
Operating profit
Operating Profit Ratio = ------------------------- * 100
Net sales
Table 4.3 Profitability ratio (Rs in Cr)
Figure 4.3 Operating profit percentage
13.0314.76
11.01
23.9926.59
0
5
10
15
20
25
30
2008-09 2009-10 2010-11 2011-12 2012-13
Per
centa
ge
Years
Operating Profit(%)
Operating Profit(%)
PARTICULAR 2008-09 2009-10 2010-11 2011-12 2012-13
Operating profit 5.54 4.5767 3.0467 9.3733 12.2167
Net sales 42.53 31 27.6633 39.06 45.9333
Operating Profit (%) 13.03 14.76 11.01 23.99 26.59

INTERPRETATION:-
The company is more profitable than an average firm in its industry. We can see that
operating profit ratio is decrease in 2010-11 because operating profit KDDL Ltd is decrease
from 8.57% in 2009-10 to 3.04% in 2010-11 and same way decrease in the net sales of
KDDL Ltd. from 67.22% to 52.42%, it decrease more than the other company.
After 2010-11, sales of KDDL and Opal increase more in comparison of operating profit.
Thus a higher value of operating margin ratio is favorable which indicates that more
proportion of revenue is converted to operating income.

4.2.4.2 Net profit ratio:-
It is also termed as sales margin ratio or profit margin ratio or net profit to sales ratio. It
reveals the firm‘s overall efficiency in operating the Business. Net profit ratio is used to
measure the relationship between net profit & sales.
Net profit after tax
Net Profit Ratio = ------------------------- *100
Net sales
Table 4.4 Net profit ratio (Rs in Cr)
Figure 4.4 Net profit in percentage
3.22 2.74
0
11.09
13.68
0
2
4
6
8
10
12
14
16
2008-09 2009-10 2010-11 2011-12 2012-13
Per
centa
ge
Years
Net profit (%)
Net profit (%)
PARTICULAR 2008-09 2009-10 2010-11 2011-12 2012-13
Net profit after tax 1.37 0.85 00 4.3333 6.2833
Net sales 42.53 31 27.6633 39.06 45.9333
Net profit (%) 3.22 2.74 00 11.09 13.68

Interpretation:-
As we can see that from 2008-09 to 2010-11 overall Net profit ratio is continuously decrease,
because it was decreased net profit of KDDL ltd according to year from 1.51% to -3.18%.But
after that it was increase in 2012-13 is 9.38%.
A relatively net sale is also decline from 103.66% in 2008-09 to 52.42% in 2010-11. Then it
is increase and in 2012-13 it is again 101.07which is higher than the other company.

4.2.4.3 Return on net worth:-
In order to judge the efficiency in which proprietors funds are employed in business, this ratio
is ascertained. This includes share capital & reserves. It is of great practical importance to the
prospective investors. It enables the profitability of a company to be compared with that of
the other company. It also indicates whether the return on proprietors funds enough in
relation to the risks that they undertake. This ratio shows that amount of dividend are likely to
be received on shares.
Net profit after tax
Return on Net worth = ------------------ ---------- * 100
Net Worth
Table 4.5 Return on net worth (Rs in Cr.)
Particular 2008-09 2009-10 2010-11 2011-12 2012-13
Net profit after tax 1.37 0.85 00 4.3333 6.2833
Net Worth 53.5033 54.7067 54.65 59.21 65.7667
Return on Net worth (%) 2.56 1.55 00 7.32 9.55
Figure 4.5 Return on net worth in percentage
2.561.55
0
7.32
9.55
0
2
4
6
8
10
12
2008-09 2009-10 2010-11 2011-12 2012-13
Per
centa
ge
Years
Return on Networth (%)
Return on Networth (%)

Interpretation:-
As we have seen in net profit ratio that how net profit is decreased till 2010-11 and after that
it increase. And not much fluctuation seen in net worth of different companies individually.
After 2010-11 the company IST, KDDL and Opal‘s net worth is continuously increase from
126.86%, 32.43%, 4.67% to 137.5%,47.97%, 11.83% in year 2012-13.

4.2.5 Coverage ratio
4.2.5.1 Debt services coverage ratio
A debt services coverage ratio of less than 1 would means negative cash flow. In corporate
finance, it is the amount of cash flow available to meet annual interest and principle payments
on debt, including sinking fund payment.
Net operating income
Debt Services coverage Ratio = ----------------------------- * 100
Total debt
Table 4.6 Debt services coverage ratio (Rs in Cr.)
PARTICULAR 2008-09 2009-10 2010-11 2011-12 2012-13
Net operating income 5.54 4.5767 3.0467 9.3733 12.2167
Total debt 21.29 12.3767 13.66 12.67 17.3
Debt Service coverage (%) 26.02 36.98 22.30 73.98 70.62
Figure 4.6 Debt service coverage in percentage
26.02
36.98
22.3
73.9870.62
0
10
20
30
40
50
60
70
80
2008-09 2009-10 2010-11 2011-12 2012-13
Per
centa
ge
Years
Debt Service coverage(%)
Debt Service coverage(%)

Interpretation:-
There was change in debt of KDDL and Opal Company that‘s why the overall position of
debt is increased. It was also increased in operating profit from 3.65% and 3.07% of company
IST and KDDL to 9.01% and 22.88% respectively.
By seeing this condition till 2010-11 debt services coverage ratio is fluctuate and after that it
is drastically increased in 2011-12.

4.2.5.2 Interest coverage ratio
Solvency of firm is measured by its ability to generate adequate profit to cover its interest
payment.
PBIT
Interest Coverage Ratio = -------------------
Interest
Table 4.7 Interest coverage ratio (Rs in Cr.)
PARTICULAR 2008-09 2009-10 2010-11 2011-12 2012-13
PBIT 5.54 4.5767 3.0467 9.3733 12.2167
Interest 1.7533 1.5033 1.4867 1.9067 2.28
Interest Coverage Ratio(Rs.) 3.16 3.04 2.05 4.92 5.36
Figure 4.7 Interest coverage ratio in rs.
Interpretation:-
We can see that till 2010-11 it continuously decrease in overall PBIT(Operating profit) but
after that it increase. These happened because change in PBIT of KDDL company. From
11.39% of 2008-09 to 3.07% in 2010-11. And it increase to 22.88% in 2012-13. So we can
say that that is drastically change in PBIT of KDDL then other company.
There is no any wide difference in Interest of all companies in different year.
3.16 3.04
2.05
4.925.36
0
1
2
3
4
5
6
2008-09 2009-10 2010-11 2011-12 2012-13
Per
centa
ge
Years
Interest Coverage Ratio(Rs.)
Interest Coverage Ratio(Rs.)

4.2.6 Turnover ratios:-
4.2.6.1 Debtor’s turnover ratio:-
It is also termed as Receivable turnover Ratio. Debtors & receivables represent the
uncollected portion of credit sales. It indicates the number of times the receivables are turned
over in business during particular period. This ratio establishes the relationship between
receivables & sales.
(Note : Net sales = Credit sales)
Credit sales
Debtor‘s Turnover Ratio = --------------------------
Debtors + receivables
Note – Take Net sales as credit Sales
Table 4.8 Debtor’s turnover (Rs in Cr.)
PARTICULAR 2008-09 2009-10 2010-11 2011-12 2012-13
Credit sales 42.53 31 27.6633 39.06 45.9333
Debtors+ receivables 7.47 4.5433 6.1567 9.6167 9.6933
Debtor‘s turnover(times) 6 7 4 4 5
Figure 4.8 Debtor’s turnover in times
6
7
4 4
5
0
1
2
3
4
5
6
7
8
2008-09 2009-10 2010-11 2011-12 2012-13
Per
centa
ge
Years
Debtor‘s turnover(times)
Debtor’s turnover(times)

Interpretation
The overall debtor‘s turnover ratio is in decrease trend because change in credit sales is
higher than change in debtors. The debtor of IST in 2008-09 is 7.86% but after that it
continuously decreases.
Relatively net sales is same as we have seen in earlier net profit ratio that is decline from
103.66% in 2008-09 to 52.42% in 2010-11. Then it is increase and in 2012-13 it is again
101.07which is higher than the other company.

4.2.6.2 Debtor ratio
The average time taken by customers to pay their bills. Debtor‘s ratio shows that in how
many days customer will pay their debt. It‘s better to take fewer days rather than more to
fulfill their debt.
Debtors
Debtor Ratio = -------------------- * 365
Net sales
Table 4.9 Debtor ratio (Rs in Cr.)
PARTICULAR 2008-09 2009-10 2010-11 2011-12 2012-13
Debtors 7.47 4.5433 6.1567 9.6167 9.6933
Net sales 42.53 31 27.6633 39.06 45.9333
Debtor Ratio(days) 64 53 81 90 77
Figure 4.9 Debtor ratio in days
Interpretation:-
In this ratio there is inverse relationship of debtor‘s turnover ratio. Other factors are remained
same. Changes in the debtors and credit sales are same as we have seen that‘s why the
situation of debtor‘s ratio is decrease, increase and again decrease in the last year.
6453
8190
77
0
20
40
60
80
100
2008-09 2009-10 2010-11 2011-12 2012-13
Per
centa
ge
Years
Debtor Ratio(days)
Debtor Ratio(days)

4.2.6.3 Working capital turnover ratio:-
This ratio highlights the effective utilization of working capital with regard to sales. This
ratio represents the firm‘s Quickity position. It establishes the relationship between net sales
& net working capital.
It is an index to know whether the working capital has been effectively utilized or not in
making sales. A higher WC turnover ratio indicates efficient utilization of working capital.
Net sales
Working capital Turnover Ratio = --------------------------
Working capital
Table 4.10 Working capital turnover ratio (Rs in Cr.)
PARTICULAR 2008-09 2009-10 2010-11 2011-12 2012-13
Net sales 42.53 31 27.6633 39.06 45.9333
Working capital 53.1233 40.88 43.0467 12.7667 29.2834
W.C
turnover(times)
1(0.80) 1(0.76) 1(0.64) 3 2
Figure 5.10 Working capital turnover in times
1 1 1
3
2
0
0.5
1
1.5
2
2.5
3
3.5
2008-09 2009-10 2010-11 2011-12 2012-13
Per
centa
ge
Years
W.C turnover(times)
W.C turnover(times)

Interpretation:-
Working capital comes from deduct current liability from current assets. So this two part play
important role deciding working capital. As we can see that overall working capital is
continuously decreased till 2011-12, after that it increases but not up to the level of earlier
year.
Because current ratio is continuously increase up to 2010-11 but in 2011-12 it is decrease
because total current assets of IST is decreased from 109.44 to 14.09 in 2011.There is also
fluctuation in liability of KDDL company.

4.2.6.4 Fixed assets turnover ratio:-
This ratio indicates the efficiency of the assets management. It is used to measure the
utilization of fixed assets. This ratio establishes the relationship between cost of goods sold &
the total fixed assets. This ratio measures the efficiency and profit earning capacity of
concern.
Net Sales
Fixed Assets Turnover Ratio = ------------------------
Net fixed assets
Table 4.11 fixed assets turnover ratios (Rs in Cr.)
PARTICULAR 2008-09 2009-10 2010-11 2011-12 2012-13
Net sales 42.53 31 27.6633 39.06 45.9333
Net fixed assets 17.5633 19.17 17.88 18.7467 21.6633
Fixed Asset
turnover(times)
2 2 1 2 2
Figure 4.11 Fixed asset turnover in times
Interpretation
Fixed assets turnover ratio is decrease in 2011-11 and then it is same as earlier year. In year
2008-09, fixed assets of IST was 9.34Cr. which was increased in year 2010-11 to 14.6 Cr.
Same situation happened in KDDL that in year 2010-11 it was 38.28 Cr. But it was increased
in 2012-13 to 47.42 Cr. Net sales is also decline from 103.66% in 2008-09 to 52.42% in
2010-11. Then it is increase and in 2012-13 it is again 101.07which is higher than the other
company.
2 2
1
2 2
0
0.5
1
1.5
2
2.5
2008-09 2009-10 2010-11 2011-12 2012-13
Per
centa
ge
Years
Fixed Asset turnover(times)
Fixed Asset turnover(times)

4.4 BALANCE SHEET
Year 2012 2011 2010 2009 2008
SOURCES OF FUNDS :
Share Capital 5.6500 4.7500 4.4633 4.4633 4.3667
Reserves Total 60.0467 53.6967 49.7833 49.8400 48.3667
Equity Share Warrants 0.0700 0.4333 0.0000 0.0000 0.0367
Equity Application Money 0.0000 0.3300 0.4033 0.4033 0.7333
Total Shareholders Funds 65.7667 59.2100 54.6500 54.7067 53.5033
Secured Loans 10.4733 6.1067 8.8633 8.5100 15.3067
Unsecured Loans 6.8267 6.5633 4.7967 3.8667 5.9833
Total Debt 17.3000 12.6700 13.6600 12.3767 21.2900
Other Liabilities 1.8100 0.7633 0.0000 0.0000 0.0000
Total Liabilities 84.8767 72.6433 68.3100 67.0833 74.7933
APPLICATION OF FUNDS : 0.0000 0.0000 0.0000 0.0000 0.0000
Gross Block 40.2800 35.8433 33.3533 33.7333 31.0667
Less : Accumulated Depreciation 18.6167 17.0967 15.4733 14.5633 13.5033
Less:Impairment of Assets 0.0000 0.0000 0.0000 0.0000 0.0000
Net Block 21.6633 18.7467 17.8800 19.1700 17.5633
Lease Adjustment 0.0000 0.0000 0.0000 0.0000 0.0000
Capital Work in Progress 9.0033 3.4067 2.0667 1.6867 1.0300
Investments 14.4900 17.5467 6.7600 7.1000 4.7633
Current Assets, Loans & Advances 0.0000 0.0000 0.0000 0.0000 0.0000
Inventories 9.7033 7.3767 6.3767 6.4767 16.0333
Sundry Debtors 9.6933 9.6167 6.1567 4.5433 7.4700
Cash and Bank 14.2300 1.1900 5.3800 0.8500 1.8233
Loans and Advances 7.4000 2.9933 31.7367 37.7533 40.9533
Total Current Assets 41.0267 21.1767 49.6500 49.6233 66.2800
Less : Current Liabilities and Provisions 0.0000 0.0000 0.0000 0.0000 0.0000
Current Liabilities 10.0700 6.9467 5.0000 6.6633 10.8933
Provisions 1.6733 1.4633 1.6033 2.0800 2.2633
Total Current Liabilities 11.7433 8.4100 6.6033 8.7433 13.1567
Net Current Assets 29.2833 12.7667 43.0467 40.8800 53.1233
Miscellaneous Expenses not written off 0.0000 0.0000 0.0000 0.0000 0.0000
Deferred Tax Assets 0.3733 0.2667 0.5333 0.1500 0.1500
Deferred Tax Liability 2.1867 2.0700 1.9767 1.9033 1.8367
Net Deferred Tax -1.8133 -1.8033 -1.4433 -1.7533 -1.6867
Other Assets 12.2500 21.9800 0.0000 0.0000 0.0000
Total Assets 84.8767 72.6433 68.3100 67.0833 74.7933
Contingent Liabilities 16.7733 20.3767 24.2767 24.6533 21.5700

4.5 PROFIT & LOSS A/C
Year 2012 2011 2010 2009 2008
INCOME : Rs. In Cr.
Sales Turnover 47.8367 40.8300 28.7567 33.2800 44.9200
Excise Duty 1.9033 1.7700 1.0933 2.2800 2.3900
Net Sales 45.9333 39.0600 27.6633 31.0000 42.5300
Other Income 2.9733 1.1633 0.6300 0.4267 0.8700
Stock Adjustments 0.7500 0.2633 -0.3300 0.0367 7.0767
Total Income 49.6567 40.4867 27.9633 31.4633 50.4767
EXPENDITURE :
Raw Materials 13.6233 11.1833 8.1867 8.7667 24.7000
Power & Fuel Cost 1.1567 1.0667 0.9367 0.9700 1.1100
Employee Cost 12.4633 10.1267 7.8700 8.6700 8.4467
Other Manufacturing Expenses 3.8800 3.7033 2.8567 3.4067 3.6167
Selling and Administration Expenses 4.8633 4.2600 3.7767 3.9667 6.2300
Miscellaneous Expenses 1.4533 0.7733 1.2900 1.1067 0.8333
Less: Pre-operative Expenses Capitalised 0.0000 0.0000 0.0000 0.0000 0.0000
Total Expenditure 37.4400 31.1133 24.9167 26.8867 44.9367
Operating Profit 12.2167 9.3733 3.0467 4.5767 5.5400
Interest 2.2800 1.9067 1.4867 1.5033 1.7533
Gross Profit 9.9367 7.4667 1.5600 3.0733 3.7867
Depreciation 1.9000 1.7267 1.5800 1.5900 1.7167
Profit Before Tax 8.0367 5.7400 -0.0200 1.4833 2.0700
Tax 2.0800 1.0433 0.3433 0.4600 0.5733
Fringe Benefit tax 0.0000 0.0000 0.0000 0.0967 0.1067
Deferred Tax 0.0133 0.3567 -0.3033 0.0667 0.0000
Reported Net Profit 5.9433 4.3400 -0.0600 0.8600 1.3900
Extraordinary Items -0.3400 0.0067 -0.0600 0.0100 0.0200
Adjusted Net Profit 6.2833 4.3333 0.0000 0.8500 1.3700
Adjst. below Net Profit 0.0000 0.0033 0.0000 0.0000 0.0000
P & L Balance brought forward 7.3900 4.1200 4.1800 3.3200 2.2500
Statutory Appropriations 0.0000 0.0000 0.0000 0.0000 0.0000
Appropriations 1.5000 1.0733 0.0000 0.0000 0.3200
P & L Balance carried down 11.8333 7.3900 4.1200 4.1800 3.3200
Dividend 0.9033 0.7400 0.0000 0.0000 0.2433
Preference Dividend 0.0000 0.0000 0.0000 0.0000 0.0000
Equity Dividend % 10.0000 10.0000 0.0000 0.0000 3.3333
Earnings Per Share-Unit Curr 11.0400 18.8967 49.0033 21.0967 141.9133
Earnings Per Share(Adj)-Unit Curr 0.0000 0.0000 0.0000 0.0000 0.0000
Book Value-Unit Curr 114.2833 128.7967 202.1433 154.6500 229.4633 http://www.capitaline.com

4.6 Common size Statement
A company financial statement that displays all items as percentage of a common base figure.
These types of financial statement allows for easy analysis between companies and between
time periods of company.
The values on the common size statement are expressed as percentages of a statement
component such as revenue. While most firms don't report their statements in common size, it
is beneficial to compute if you want to analyze two or more companies of differing size
against each other.
Formatting financial statements in this way reduces the bias that can occur when analyzing
companies of differing sizes. It also allows for the analysis of a company over various time
periods, revealing, for example, what percentage of sales is cost of goods sold and how that
value has changed over time.

Common Size Balance sheet
Year 2012 2011 2010 2009 2008
SOURCES OF FUNDS : (Values in %)
Share Capital 6.6568 6.5389 6.5339 6.6535 5.8382
Reserves Total 70.7470 73.9188 72.8778 74.2965 64.6662
Equity Share Warrants 0.0825 0.5965 0.0000 0.0000 0.0490
Equity Application Money 0.0000 0.4543 0.5904 0.6012 0.9805
Total Shareholders Funds 77.4863 81.5085 80.0021 81.5512 71.5340
Secured Loans 12.3397 8.4064 12.9750 12.6859 20.4650
Unsecured Loans 8.0432 9.0351 7.0218 5.7640 7.9997
Total Debt 20.3829 17.4415 19.9969 18.4499 28.4647
Other Liabilities 2.1325 1.0508 0.0000 0.0000 0.0000
Total Liabilities 100.0000 100.0000 100.0000 100.0000 100.0000
APPLICATION OF FUNDS : 0.0000 0.0000 0.0000
Gross Block 47.4579 49.3419 48.8259 50.2863 41.5361
Less : Accumulated Depreciation 21.9342 23.5353 22.6514 21.7096 18.0540
Less:Impairment of Assets 0.0000 0.0000 0.0000 0.0000 0.0000
Net Block 25.5237 25.8067 26.1745 28.5767 23.4822
Lease Adjustment 0.0000 0.0000 0.0000 0.0000 0.0000
Capital Work in Progress 10.6077 4.6896 3.0254 2.5143 1.3771
Investments 17.0721 24.1547 9.8960 10.5840 6.3686
Current Assets, Loans & Advances 0.0000 0.0000 0.0000 0.0000 0.0000
Inventories 11.4325 10.1547 9.3348 9.6548 21.4366
Sundry Debtors 11.4207 13.2383 9.0127 6.7727 9.9874
Cash and Bank 16.7658 1.6382 7.8758 1.2671 2.4378
Loans and Advances 8.7187 4.1206 46.4593 56.2789 54.7546
Total Current Assets 48.3376 29.1518 72.6826 73.9735 88.6164
Less : Current Liabilities and Provisions 0.0000 0.0000 0.0000 0.0000 0.0000
Current Liabilities 11.8645 9.5628 7.3195 9.9330 14.5644
Provisions 1.9715 2.0144 2.3471 3.1007 3.0261
Total Current Liabilities 13.8360 11.5772 9.6666 13.0337 17.5905
Net Current Assets 34.5016 17.5746 63.0160 60.9398 71.0259
Miscellaneous Expenses not written off 0.0000 0.0000 0.0000 0.0000 0.0000
Deferred Tax Assets 0.4399 0.3671 0.7807 0.2236 0.2006
Deferred Tax Liability 2.5763 2.8496 2.8936 2.8373 2.4556
Net Deferred Tax -2.1365 -2.4825 -2.1129 -2.6137 -2.2551
Other Assets 14.4330 30.2577 0.0000 0.0000 0.0000
Total Assets 100.0000 100.0000 100.0000 100.0000 100.0000

Common Size P&L A/C
Year 2012 2011 2010 2009 2008
INCOME : (Value in %)
Sales Turnover 96.33348 100.8501 102.8367 105.7838 88.99101
Excise Duty 3.8329 4.3719 3.9099 7.2472 4.7348
Net Sales 92.5005 96.4782 98.9268 98.5366 84.2562
Other Income 5.9877 2.8734 2.2529 1.3562 1.7236
Stock Adjustments 1.5104 0.6504 -1.1801 0.1165 14.0196
Total Income 100.0000 100.0000 100.0000 100.0000 100.0000
EXPENDITURE :
Raw Materials 28.4782 27.3902 28.4683 26.3421 54.9871
Power & Fuel Cost 2.4179 2.6125 3.2572 2.9147 2.4711
Employee Cost 26.0534 24.8022 27.3671 26.0516 18.8040
Other Manufacturing Expenses 8.1108 9.0702 9.9338 10.2364 8.0514
Selling and Administration Expenses 10.1663 10.4336 13.1330 11.9190 13.8692
Miscellaneous Expenses 3.0380 1.8940 4.4858 3.3253 1.8552
Less: Pre-operative Expenses Capitalised 0.0000 0.0000 0.0000 0.0000 0.0000
Total Expenditure 78.2646 76.2028 86.6452 80.7891 100.0380
Operating Profit 25.5377 22.9572 10.5945 13.7520 12.3331
Interest 4.7661 4.6698 5.1697 4.5172 3.9033
Gross Profit 20.7716 18.2874 5.4247 9.2348 8.4299
Depreciation 3.9718 4.2290 5.4943 4.7776 3.8216
Profit Before Tax 16.7998 14.0584 -0.0695 4.4571 4.6082
Tax 4.3480 2.5553 1.1939 1.3822 1.2764
Fringe Benefit tax 0.0000 0.0000 0.0000 0.2905 0.2375
Deferred Tax 0.0279 0.8735 -1.0548 0.2003 0.0000
Reported Net Profit 12.4239 10.6295 -0.2086 2.5841 3.0944
Extraordinary Items -0.7107 0.0163 -0.2086 0.0300 0.0445
Adjusted Net Profit 13.1347 10.6132 0.0000 2.5541 3.0499
Adjst. below Net Profit 0.0000 0.0082 0.0000 0.0000 0.0000
P & L Balance brought forward 15.4481 10.0907 14.5355 9.9759 5.0090
Statutory Appropriations 0.0000 0.0000 0.0000 0.0000 0.0000
Appropriations 3.1356 2.6288 0.0000 0.0000 0.7124
P & L Balance carried down 24.7364 18.0996 14.3269 12.5601 7.3910
Dividend 1.8883 1.8124 0.0000 0.0000 0.5417
Preference Dividend 0.0000 0.0000 0.0000 0.0000 0.0000
Equity Dividend % 20.9040 24.4920 0.0000 0.0000 7.4207
Earnings Per Share-Unit Curr 23.0780 46.2817 170.4042 63.3913 315.9275
Earnings Per Share(Adj)-Unit Curr 0.0000 0.0000 0.0000 0.0000 0.0000
Book Value-Unit Curr 238.8979 315.4488 702.9332 464.6923 510.8313 http://www.capitaline.com
Interpretation
1. Net sales
Overall net sale is decrease with very minor difference. Because net sales of KDDL ltd. is
103.66% in 2008-09 to 52. 42% in 2010-11. Then it is increase and in 2012-13 it is again
101.07which is higher than the other company.
The better performance of KDDL ltd. was due to significant growth in the exports market,
which is a key strategic focus area of company. The higher exports were enabled by the
continuous and intensive efforts of the company to develop and service major global
players. The higher revenues coupled with cost control measures initiated by the
management, has helped the company in reporting higher profits during the year.
2. Dividend per Share
Overall dividend per share in 2008-09 was 1.88% which decreased in 2010-11 was 00 %and
it increased in 2012-13 was 0.54%.
It was decreased because volatility of KDDL was impact on overall DPS.

4.7 TREND ANALYSIS
Net Sales
Table 4.12 Net sales
Years 2008-09 2009-10 2010-11 2011-12 2012-13
Average Net sales 100.0000 74.0900 66.1153 93.3534 109.7806
The average net sales of industry is decrease from 2008 to 2010. Because net sales of KDDL
Limited company is decline from 103.66% in 2008 to 52.42% in 2010. Then it is increase and
in 2012 it is again 101.07which is higher than the other company. So the average sales is
increase.
Figure 4.12 Average net sales
100
74.0966.1153
93.3534
109.7806
0
20
40
60
80
100
120
2008-09 2009-10 2010-11 2011-12 2012-13
A. N
et
Sale
s
Years
Average net Sales
Ряд1

Average Sundry Debtors
Table 4.13 Average sundry debtors
Years 2008-09 2009-10 2010-11 2011-12 2012-13
Average Sundry
Debtors(Rs. In Cr.) 100.0000 60.8207 82.4191 128.7378 129.7632
Figure 4.13 Average sundry debtors
Average sundry debtors was continuously increase from 2009. The debtor of IST in 2008 is
7.86% but after that it continuously decreases. But debtors of KDDL in 2009 was 9.34 Cr.
Which was increase continuously and in 2012 it was 18.5 Cr.
100
60.8207
82.4191
128.7378 129.7632
0
20
40
60
80
100
120
140
2008-09 2009-10 2010-11 2011-12 2012-13
A. S
un
dry
De
bto
rs
Years
Average Sundry Debtors
Ряд1

Adjusted Net Profit
Table 4.14 Adjusted net profit
Years 2008-09 2009-10 2010-11 2011-12 2012-13
Adjusted Net Profit 100 62.04 00.0000 316.30 458.64
Figure 4.14 Adjusted net profit
Interpretation
As we can see that Average net profit till 2010-11 is continuously decrease after that it
continuously increase to 458.64%. It decreased because KDDL Ltd. was decreased in 2010-
11 up to -3.18Cr. After that it increased because KDDL Ltd. was increased to 9.83 Cr.
10062.04
0
316.3
458.64
0
50
100
150
200
250
300
350
400
450
500
2008-09 2009-10 2010-11 2011-12 2012-13
Adjusted Net Profit
Ряд1

Chapter 5
Findings

Debt service coverage ratio
Debt service ratio in 2008-09 was 26.02% and in year 2012-13, it was 70.62% which means
it increase in this ratio. It shoes industry have operating income covers only 70.62% annual
debt.
Debtors Ratio
Debtors‘ ratio shows in how many days debtors will pay their debt. Higher the debtors ratio is
bed for industry because it take more time to pay debt and lower the ratio will good because it
took less time to pay their debt. In 2012-13 it was 77 days which is lower than previous but
higher than other year which also may also decrease in future.
Working Capital turnover ratio
Working capital turnover ratio indicate the velocity of the utilization of net working capital.
This ratio represents the number of times the working capital is turned over the year. It
increased 1time to 2 times from 2008-09 to 2012-13.

Chapter 6
Conclusion

Plenty of different brands of watches are available in the market. Considering the market
share of those brands Titan watches stand first, it is the major shareholder in the market. Its
main features are variety in design, different price category, etc.
The customers in the different age groups and in the different income groups consider the
various features like price, design, and the brands. Their criteria of selection differ as their
income/age/ and education varies.
Most of the respondents (33%) use Titan watches. The second brand that has significant
number of customers is HMT watches. It covers the 19% of the total customers. The other
important brands of watches that the respondents use are Citizen, Timex, Classic, Sonata etc.
To improve the market share of the Titan watches they have to emphasize on the production
of gold type and plastic type watches.

PART-II
Chapter 7
B-Plan

Executive Summary
Royal-P&p is a start-up watch producer and distribution company. Its strategy is to serve the
upscale niche markets of the watch industry. It will capitalize on the German engineering and
manufacturing used to build the watches. There are many untapped potential markets within
this industry that desire high-quality, stylish goods, but do not think they can afford them or
do not know where to purchase them.
It is the firm's intention to build and export its products to the United States and to make
Royal-P&p. The company's long-term goals are to to achieve a 20% market share in the
Indian market, build brand image and brand equity through marketing, achieve a sustainable
55% profit margin, and eventually produce luxury watches in addition to the initial,
moderately-priced line.

7.1 INTRODUCTION
Introduction of Wrist Watch Industry in India
Today, a wristwatch is considered as much of a status symbol as a device to tell time. In an
age when cell phones and digital pagers display tiny quartz clocks, the mechanical wristwatch
has slowly become less of an object of function and more a piece of modern culture.
Walk into the boardroom of any Fortune 500 company and you‘re likely to see dozens of
prestigious wristwatches, including such names as Rolex, Vacheron Constantin, Frank
Müller, Jaeger-LeCoultre and even Patek Phillipe. However, this was not always the case.
Less than 100 years ago, no self-respecting gentleman would be caught dead wearing a
wristwatch. In those days of yore, real men carried pocket watches, with a gold half-hunter
being the preferred status symbol of the time—no pun intended.
Wristlets, as they were called, were reserved for women, and considered more of a passing
fad than a serious timepiece. In fact, they were held in such disdain that many a gentlemen
were actually quoted to say they ―would sooner wear a skirt as wear a wristwatch‖.
The established watch making community looked down on them as well. Because of their
size, few believed wristlets could be made to achieve any level of accuracy, nor could they
withstand the basic rigors of human activity. Therefore, very few companies produced them
in quantity, with the vast majority of those being small ladies‘ models, with delicate fixed
wire or chain-link bracelets.
Wristwatches were no longer considered a novelty but were now a wartime necessity, and
companies were scrambling to keep up with the demand. One company that enjoyed success
during this time was Wilsdorf & Davis, Ltd., founded in 1905, and later renamed The Rolex
Watch Company, Ltd., in 1915.
Thus, the role of the wristwatch seems to have come full circle. With the general public now
leaning toward high-tech, digital gadgets, the classic mechanical wristwatch have once again
found its home on the wrists of those brave soldiers who welcomed it some 100 years ago.

7.2 PRODUCTS OF COMPANY
Analog Wristwatch
An analog watch has hour, minute, and second hands to it, and the numbers one
through12 are arranged in a circle. An analog watch is traditionally powered by
winding it up daily. Some contemporary varieties have batteries. Analog watches
were the original kind of wristwatch and tell time through an ingenious system of
gears that precisely count time. Many people prefer them for their elegance and
beauty. All luxury watches are analog watches and they can last for decades if they
are well taken care of.
Kinetic Wristwatch
A kinetic watch is a sub-type of analog watch that has been gaining popularity among
watch enthusiasts. It works best for someone who wears a wristwatch daily as it relies
on movement to gain its power. A kinetic watch winds itself via the normal motion
your wrist makes throughout the day and can store energy in its wound gears for up to
72 hours. Many high end wristwatches are kinetic.

Quartz Watch
• Quartz watches were first mass produced in 1969 and are another kind of analog
watch. They can be wind up or battery operated and contain a precisely cut quartz
crystal that is piezoelectric and resonates at a steady rate, making for accurate time
keeping. Quartz watches solve some of the engineering difficulties with analog
watches that before it relied on wound gears. Gears run a bit faster when wound tight
and slow down as they wind down.
Digital Watch
• A digital watch is electric, battery or solar powered and displays time on a flat digital
screen with numbers. Digital watches are much newer than analog watches and were
invented in the 1970s. While they were initially expensive, they are currently the least
expensive types of watches and are known to be durable and rugged. Digital watches
can have more functions than analog watches and some of them have GPS,
compasses, altimeters and barometers.

7.2.1 Product Description of main products
Royal-P&p Watches are elegant analog watches with sporting characteristics, able to be used
to depths of 100 meters under water.
The "sport" watch will be made of a durable steel and hard rubber combination that
will provide both style and durability.
The "night" watch will be all black including the face with minimal white writing for
the numbers on the face and will feature white hands as well.
7.2.2 Competitive Comparison
Royal-P&p Watches will have the following sustainable competitive advantages:
1. German technology, experience, proficiency, and reputation.
2. High quality at a moderate price.
3. Elegant and ergonomic styling.
4. American marketing skills.
7.2.3 Sales Literature
Royal P&P Watches will use advertising, public relations, and sales programs to make the
public aware of the watches.
1. Advertisements and public relations pieces in local newspapers - particularly The
Times of india and The Economics Times.
2. Full-color brochures will be distributed at the various outlets where the watches are
sold.

7.2.4 Technology
PC-based software will be used for accounts receivable/payable, inventory, purchasing, sales,
shipping, and returns.
This business plan uses Business Plan Pro from Palo Alto Software, Inc. and it will be
reviewed and updated as necessary.
7.2.5 Future Products
A luxury watch is the current main focus for a future product. Other future products could
include alarm clocks, wall clocks, and clocks for luxury automobiles.
7.3 COMPANY NAME AND STRATEGY
NAME OF THE COMPANY: - Royal-P&p
Types of Business: Private
Address: Baroda, Gujarat.
Contact Detail: (O) (0265) - 221130, 22439 (M) 9016612421
E-mail ID: [email protected]
Logo of Royal-P&p:

STRATEGY FOR BUSINESS
Placing strategy :
There are basically two marketing channels:-
Direct marketing channel: - A marketing channel that has no intermediary levels
Indirect marketing channel: - Channel containing one or more intermediary levels.
We use both marketing channel – 187 Direct Dealers Time Zone & Non-traditional Outlets.
Pricing strategy :
These are some pricing strategies
1. Cost based pricing
2. Value based pricing
3. Competition based pricing
PRICE Mass (Rs.350-600) Popular (Rs.600-900) Premium (Rs.900-1500) Super-premium
(Rs.1500-8000)
Promoting strategy :
Marketers can choose from two basic promotion mix strategies:-
1) Push strategy (We use)
2) Pull strategy
Push strategy :
A promotion strategy that calls for using the sales force and trade promotion to push the
product through channels is called push strategy. The producer promotes the product to
wholesalers the wholesalers promotes to retailers, and the retailer promotes to consumers.
Positioning strategy :
Providing high quality products Royal-p&p initially pioneered the concept of "Gifting
watches". Customers who were fed up with ugly time machines welcomed the brand Titan.
Re- Positioning as a fashion accessory.
Repositioning strategies :
Repositioning strategies
Communication: tagline
TV commercial Billboards

7.4 REGULATION AND DOCUMENTATION
Procedure for Registration of a Private Limited Company
Select, in order of preference, a few suitable names, not less than four, indicative of
the main objects of the company. Ensure that the name does not resemble the name of
any other company already registered and also does not violate the provisions of
Emblems and names (prevention of improper use) Act, 1950.
Apply to the concerned ROC to ascertain the availability of name in e-Form1 A of
General Rules and Forms along with a fee of Rs. 500/-. If proposed name is not
available apply for a fresh name on the same application the digital signature of the
applicant proposing the company has to be attached in the form.
After the name approval the applicant can apply for registration of the new company
by filing the required forms (e-Forms 1, 18,32 ) within six months of name approval.
Arrange for the drafting of the Memorandum and Articles of Association by the
solicitors, vetting of the same by ROC and printing of the same.
Arrange for stamping of the Memorandum and Articles with the appropriate stamp
duty.
Get the Memorandum and Articles signed by at least two subscribers in his own hand,
his father's name, occupation, address and the number of shares subscribed for and
witnessed by at least one person.
Ensure that the Memorandum and Article is dated on a date after the date of stamping.
Pay the prescribed registration fee and filing fee.
The following documents are required to be filed with the Registrar of Companies:
o Memorandum of Association (duly stamped) and a duplicate thereof.
o Articles of Association (duly stamped) and a duplicate thereof.
o The agreement, if any, which the company proposes to enter into with any
individual for appointment as its managing or whole time director or manager.
o A copy of the agreement, if any, referred to in the articles.
o A power of attorney, if any (with prescribed stamps).

o A copy of the letter of the Registrar of Companies intimating the availability
of the proper name.
o e-Form No. 1 (with prescribed stamps) for incorporation of a Company.
o e-Form No. 18, if desired for change of situation of registered office.
o e-Form No. 32 and e-Form 32 Addendum, if desired for Particulars of
appointment of managing director, directors, manager and secretary and the
changes among them or consent of candidate to act as a managing director or
director or manager or secretary of a company and / or undertaking to take and
pay for qualification shares
o Document evidencing payment of prescribed registration and filing fee.
o The promoters, as being the subscribers to the Memorandum and Articles
should be the same person whose names are appearing in the original
application for availability of name (e-Form 1A). If the names have changed,
ROC will not register the company until and unless, the name is got re-
validated with the new subscribers as applicants, by paying another fee of Rs
500.
Obtain Certificate of Incorporation from ROC. If the registrar is satisfied that all the
requirements have been complied with by the companies, it will register the company
and issue a Certificate of Incorporation of the company. The date mentioned in the
certificate is the date of incorporation of the company.
Under Section 149(7) of the Companies Act, a private company can commence
business right from the date of its incorporation.

7.5 OBJECTIVES OF BUSINESS:-
7.5.1 Mission statement
As the names "Royal-p&p Watch" or "Royal-p&p Group" state, our policy is to provide the
best products and services to all "Royal-p&ps" in the india.
7.5.2 Vision statement
Innovative and progressive organization and to build india‘s most desirable brand.
7.5.3 Status of the Company
Within this short span of time we have gained a good word of mouth for our quality products
which we have been producing according to the market likings. Keeping eyes on the current
position of the Royal-P&p watches sale so trying to increase the sales the company about to
launch a new innovative, ground breaking, new unique product in the market which is
currently not available.
7.5.4 Market status of the company
As the basic phenomena of ROYAL-P&p company is to provide the best product and
services to all ―Royal-P&p‖ of the world, so company sees the whole world as their Royal-
p&p. But at this stage the company mainly focusing in India‘s market, our products are being
used in India. The goodwill of our products is high in the market. As a result of market
survey we have a large quantity of loyal customer as well as potential customers. There is
continuous communication with the customer (promotion) to increase the quality and
performance of existing products. On the basis of past experience there are good expectations
with the new product ―Supremacy Disk Watch‖.
7.5.5 Marketing Objectives
There are two types of marketing objectives which are given below
1. Short term objectives
2. Long term objectives
Short term objectives:

The fundamental objective of Royal-P&p Watches India to increase the sales volume of the
watches. Create a good image of our product in the mind of customers. Our main concern is
profitability.
Long term Objectives:
Royal-P&p WATCHES (INDIA) long term objectives are
• Retention of our loyal customer
• Capturing high market share
• Delivering quality products to our customers
• Capturing the potential target market of India
• Launching innovative changes for our product
• Creating brand awareness and brand loyalty

7.6 SEGMENTATION
Segmentation of Royal-P&p
- Based on price
- Market segmentation
- Based on user category
We segmented the market on the basic of the following variables:
- Demographic ( Age and social class)
- Psycho graphic (Lifestyle and personality)
- Behavioral (Benefits and occasions)
- Geographical (Region)
The first consisted of the high income/elite consumers who were buying a watch as a
fashion accessory. The were also willing to buy a watch on impulse. The price tag did
not matter to this segment. The price range between Rs.20000and Rs.1 lack.
The next segmented consisted of consumers who preferred some fashion in their
watches but to them price did matter. The price range between Rs.500 and 700.
The third segment consisted of the lower income consumers who saw a watch mainly
as a time keeping device and bought mainly on the basis of price.. The range between
Rs. 350 and 500.
7.6.1 Target market segment strategy
The watch industry, particularly the upscale markets, is growing faster than ever. Potential
watch buyers are willing to spend moderate to high amounts on watches because they can
make the customer look good - and hence feel good about them selves. In addition, Royal-
P&p Watches will be built to last a lifetime - battery replacement every ten years will be the
only necessary maintenance, therefore customers will see the inherent value in the watches.
The upscale niche market that Royal-P&p Watches has targeted is competitive because of the
competitors and the discerning consumers it serves. However, the competition is based more
on quality than price unlike the discount market.

7.6.2 Market Needs
The upscale watch industry is currently in a growth period, so now is an ideal time for entry.
7.6.3 Market Trends
B & B will distribute the watches to different areas
The cost of marketing the new product is expected to be the biggest challenge for
Royal-P&p. The initial use of B & B's facilities as a distribution channel will allow for
cost savings.
The lack of an existing recognized brand name will be an initial problem, but in a few
years Royal-P&p Watches intends to have achieved powerful brand equity - allowing
it to rely on, and succeed because of its brand name.
7.6.4 Market Growth
Consumers often only buy a new watch every 5 to 10 years, yet they purchase them often as
gifts. Therefore, advertising will be increased during the Christmas holiday season. The
intended retail outlets are full price and full service, therefore Royal-P&p will not need to use
an extreme price penetration strategy to gain a foothold in the market.

7.7 SITUATION ANALYSIS
1. Competitive analysis
The exception of strong rivalry among existing competitors, the luxury watch industry
is an attractive industry for existing companies due to its high entry barriers, low
threats of substitutes, weak buyer power , and low supplier power ( with the
exception of watch –movement and hairspring suppliers, of which there are only a
few suppliers.)
2. Customer analysis
Ladies: 10%
100% female , Age 20-40
Education: Junior College+
Social/income : irrelevant, living at parents home
Independent minds
Ads:Miros integrale
General Audience: 30%
70% male, Age 25-45
30% female, Age 25-45
Education: High school / university
Collectors:60%
Specialized watch-magazines
Independent minds ( no followers)
7.7.1 Competitors in Indian wrist watch industry
Titan
HMT
RADO
Rolex
Fastrack

7.8 ORGANISATION STRUCTURE
Board of Directors
Managing Director
General Manager General Manager Senior Manager Finance Manager
(H.R.D) (Accountant)
Production Manager Assistant Manager Assistant Manager Supervisor
(Marketing)
Workers Operator Other Operating Staff Accountant
Clerk

7.9 PRODUCTION PLANNING
7.9.1 Raw material suppliers
1. Guangzhou Guanghao watch Co.Ltd.
Country/Region: China (Mainland)
Main Products: Watches (Silicone Watch,Gift Watch,Kids Watch,Steel Watch.
Year Established: 2012
2. Devars Watch ( Shenzhen ) Co., Ltd.
Country/Region: China (Mainland)
Main Products: fashion watch, LED watch,Silicone Watch.
Year Established: 2011

7.10 FINANCIAL ANALYSIS
Salary Structure
Particular Amount Rs.
Manager 20000
Employees 12000
Supervisor 7000
Skilled workers 5000
Semi-skilled workers 3500
Sales Outline
Product Y1 Y2 Y3 Y4 Y5
Unit Unit Unit Unit Unit
P100 250 222 218 188 197
M100 210 204 201 206 212
B10 180 190 208 235 285
H10 110 127 135 155 167
Financial aspect
Sr.No. Particular Amount Rs.
1 Fixed Assets
Machinery 25,00,000
Computers 10,00,000
Tools 5,00,000
Total 40,00,000
Financial Sources at the time of Starting period
Particular Amount
Owner‘s Funds 50,00,000
ICICI Loan @ 11.50% 15,00,000
Total 65,00,000

PROJECTED PROFIT & LOSS A/C
Pro Forma Profit and Loss
Year 1 Year 2 Year 3 Year 4 Year 5
Sales 35,66,000 40,07,000 43,15,000 47,50,000 53,70,000
Direct Cost of Sales 4,10,000 5,00,000 6,10,000 6,40,000 6,65,000
Gross Margin 31,56,000 35,07,000 37,05,000 41,10,000 47,05,000
Expenses
Payroll 8,91,500 8,91,500 8,91,500 8,91,500 8,91,500
Sales and Marketing and Other Expenses 1,00,675 1,12,900 1,29,200 1,35,000 1,39,500
Depreciation @ 15% 3,75,000 3,75,000 3,75,000 3,75,000 3,75,000
Raw material 15,50,000 12,01,750 12,95,500 9,65,000 13,50,000
Utilities 6,000 7,000 8,000 8500 9500
Insurance 18,000 21,000 23,000 30,000 35,000
Rent 4,00,000 4,00,000 4,00,000 4,00,000 4,00,000
Other 6,000 6,300 6,500 6,500 6,500
Advertisement 2,00,000 2,10,000 1,80,000 2,25,000 2,16,000
Total Operating Expenses 35,47,175 32,25,450 33,08,700 30,36,500 34,23,000
Profit Before Interest and Taxes -3,91,175 2,81,550 3,96,300 10,73,500 12,82,000
Interest Expense @ 11.50% 1,72,500 1,72,500 1,72,500 1,72,500 1,72,500
Earing before tax -5,63,675 1,09,050 2,23,800 9,01,000 11,09,500
Tax @ 33% Nil 35,987 73,854 2,97,330 3,66,135
Profit After Tax -5,63,675 73,063 1,49,946 6,03,670 7,43,365
Less Carry Forward Loss -5,63,675 -4,90,612 -3,40,666 2,63,004
Balance Carrid Forward to Balance Sheet -5,63,675 -4,90,612 -3,40,666 2,63,004 10,06,369

PROJECTED BALANCE SHEET
Particular 2012 – 13 2011 – 12 2010 – 11 2009 – 10 2008– 09
SOURCES OF FUNDS :
Owners Fund 50,00,000 50,00,000 50,00,000 50,00,000 50,00,000
Net Profit /Loss -5,63,675 -4,90,612 -3,40,666 2,63,004 10,06,369
Loan Funds
Secured Loans 15,00,000 15,00,000 15,00,000 15,00,000 15,00,000
Unsecured Loans 0 0 0 0 0
Total Source of Fund 59,36,325 60,09,388 61,59,334 67,63,004 75,06,369
APPLICATION OF FUNDS :
Gross Block 25,00,000 25,00,000 25,00,000 25,00,000 25,00,000
Less : Accumulated Depreciation 3,75,000 3,75,000 3,75,000 3,75,000 3,75,000
Net Block 21,25,000 21,25,000 21,25,000 21,25,000 21,25,000
Capital Work in Progress 15,75,000 14,50,000 15,80,000 17,00,000 18,75,000
Other loan Investments 5,00,000 6,50,000 7,70,000 12,00,000 13,45,000
Total Fixed Assets ( A ) 42,00,000 42,25,000 44,75,000 50,25,000 53,45,000
Current Assets, Loans & Advances
Inventories 8,25,000 6,75,000 5,95,000 6,10,000 6,20,000
Sundry Debtors 6,50,000 8,35,000 6,94,000 5,85,000 7,40,000
Cash and Bank 10,06,325 9,11,388 9,95,334 10,63,004 11,96,369
Total Current Assets ( B ) 24,81,325 24,21,388 22,84,334 22,58,004 25,56,369
Less:- Current Liabilities and
Provisions
Current Liabilities 625000 502000 495000 405000 395000
Provisions 1,20,000 1,35,000 1,05,000 1,15,000
Differed Credit 0 0 0 0 0
Total Current Liabilities ( C ) 7,45,000 6,37,000 6,00,000 5,20,000 3,95,000
Net Current Assets ( B – C) = D 17,36,325 17,84,388 16,84,334 17,38,004 21,61,369
Total Assets ( A + D ) 59,36,325 60,09,388 61,59,334 67,63,004 75,06,369

Cash Flow Statement
Particular Year 1 Year 2 Year 3 Year 4 Year 5
OPERATING
Cash inflows
From sales of goods or services. 3356000 3507000 3705000 4110000 4705000
From returns on loans (interest) and on
equity securities (dividends).
0 0 0 0 0
Total Cash inflow 3356000 3507000 3705000 4110000 4705000
Cash outflows
To suppliers for inventory. 825000 675000 595000 610000 620000
To government for taxes. 0 35987 73854 297330 366135
To lenders for interest. 0 0 0 0 0
To others for expenses 6,000 6,300 6,500 6,500 6,500
Total cash Outflow 8,31,000 7,17,287 6,75,354 9,13,830 9,92,635
Total of Operating 25,25,000 27,89,713 30,29,646 31,96,170 37,12,365
INVESTING
Cash inflows
From sale of property, plant, and
equipment.
0 0 0 0 0
From sale of debt or equity securities of
other entities.
0 0 0 0 0
From collection of principal on loans to
other entities.
0 0 0 0 0
Total of cash inflow 0 0 0 0 0
Cash outflows
To purchase property, plant, and
equipment.
2500000
To purchase debt or equity securities of
other entities.
To make loans to other entities.
Total of cash outflow 2500000 0 0 0 0
Total Of Investin -2500000 0 0 0 0
FINANCING
Cash inflows
From sale of equity securities. 0 0 0 0 0
From issuance of debt (bonds and notes). 0 0 0 0 0
Total of Inflow
Cash outflows
To stockholders as dividends.
To redeem long-term debt or
reacquire capital stock.
Total of cash outflow
Total of Financing 0 0 0 0 0
Total Cashflow
(Opearting+Investing+Financing) 25000 2789713 3029646 3196170 3712365

Te cash flow in all the year is in positive so we can say that company is in good position
NPV = Interest / (1=r)n
Year Interest of Cash
flow (1+r)
n Interest of Cash
flow
1 3000 (1.12)1 2679
2 334766 (1.12)2 266873
3 363558 (1.12)3 258773
4 383540 (1.12)4 243747
5 445484 (1.12)5 252780
Total 10,24,852

Chapter 8
Bibliography
Book:
Thompson Jr, A. A., Strickland lll, A. J., Gamble, J. E., & Jain, A. K. (2009). Crafting
And Executing Strategy (14th edition ed.). India: The McGraw-Hill companies.
Financial accounting (3rd
edition) estern economy edition.
Website:
General Information of Watch companies. (n.d.). Retrieved Octomber 19, 2013, from
http://www.capitaline.com/generalinformation/ist/history.html.
Financial Data of watch Industry Companies . (n.d.). Retrieved November 2, 2013,
from http://www.moneycontrol.com/financials/watchindustries/ratios.html.
Overview of Segmentation of watch Industry. (n.d.). Retrieved september 22, 2013,
from http://www.fashionproducts.com/fashion-apparel-overview.html.
(n.d.). Retrieved november 10, 2013, from
http://www.scribd.com/doc/17496572/watch-Products-Limited.
Trend analysis of watch industry. (n.d.) Retrieved november 20, 2013, from
http://www.advertiseineurop.com/trendanalysis.htm.
http://www.slideshare.net/CheekuMaan/merger-and-acquisition-in-banking-sector
http://www.google.com/b-plan watch technology.htm
http://www.google.com/list of watch in india.html
http://www.asklaila.com/search/Pune//Opel%20watch/?searchNearby=false&v=listin
g
http://top3freeware.wordpress.com/tag/list-of-top-wrist-watch-companies-in-india
https://www.google.co.in/#q=list+of+regional+wrist+watch+company+in+india
http://www.alibaba.com/product-
gs/494953332/2011_innovative_led_wrist_watch_men.html
https://www.google.co.in/search?biw=1366&bih=623&noj=1&sclient=psy-
ab&q=an+effect+of+production+capacity+in+competitive+market+of+watch+indust
ry&oq=an+effect+of+production+capacity+in+competitive+market+of+watch+indus
try&gs_l=serp.3...801289.863066.1.863659.120.83.4.4.4.1.1201.45197.3j4-
1j62j6j3.75.0....0...1c.1.32.serp..74.46.24554.WadoU-ED0m8

Chapter 9
Annexure

BALANCE SHEET
Year 2012 2011 2010 2009 2008
SOURCES OF FUNDS :
Share Capital 5.6500 4.7500 4.4633 4.4633 4.3667
Reserves Total 60.0467 53.6967 49.7833 49.8400 48.3667
Equity Share Warrants 0.0700 0.4333 0.0000 0.0000 0.0367
Equity Application Money 0.0000 0.3300 0.4033 0.4033 0.7333
Total Shareholders Funds 65.7667 59.2100 54.6500 54.7067 53.5033
Secured Loans 10.4733 6.1067 8.8633 8.5100 15.3067
Unsecured Loans 6.8267 6.5633 4.7967 3.8667 5.9833
Total Debt 17.3000 12.6700 13.6600 12.3767 21.2900
Other Liabilities 1.8100 0.7633 0.0000 0.0000 0.0000
Total Liabilities 84.8767 72.6433 68.3100 67.0833 74.7933
APPLICATION OF FUNDS : 0.0000 0.0000 0.0000 0.0000 0.0000
Gross Block 40.2800 35.8433 33.3533 33.7333 31.0667
Less : Accumulated Depreciation 18.6167 17.0967 15.4733 14.5633 13.5033
Less:Impairment of Assets 0.0000 0.0000 0.0000 0.0000 0.0000
Net Block 21.6633 18.7467 17.8800 19.1700 17.5633
Lease Adjustment 0.0000 0.0000 0.0000 0.0000 0.0000
Capital Work in Progress 9.0033 3.4067 2.0667 1.6867 1.0300
Investments 14.4900 17.5467 6.7600 7.1000 4.7633
Current Assets, Loans & Advances 0.0000 0.0000 0.0000 0.0000 0.0000
Inventories 9.7033 7.3767 6.3767 6.4767 16.0333
Sundry Debtors 9.6933 9.6167 6.1567 4.5433 7.4700
Cash and Bank 14.2300 1.1900 5.3800 0.8500 1.8233
Loans and Advances 7.4000 2.9933 31.7367 37.7533 40.9533
Total Current Assets 41.0267 21.1767 49.6500 49.6233 66.2800
Less : Current Liabilities and Provisions 0.0000 0.0000 0.0000 0.0000 0.0000
Current Liabilities 10.0700 6.9467 5.0000 6.6633 10.8933
Provisions 1.6733 1.4633 1.6033 2.0800 2.2633
Total Current Liabilities 11.7433 8.4100 6.6033 8.7433 13.1567
Net Current Assets 29.2833 12.7667 43.0467 40.8800 53.1233
Miscellaneous Expenses not written off 0.0000 0.0000 0.0000 0.0000 0.0000
Deferred Tax Assets 0.3733 0.2667 0.5333 0.1500 0.1500
Deferred Tax Liability 2.1867 2.0700 1.9767 1.9033 1.8367
Net Deferred Tax -1.8133 -1.8033 -1.4433 -1.7533 -1.6867
Other Assets 12.2500 21.9800 0.0000 0.0000 0.0000
Total Assets 84.8767 72.6433 68.3100 67.0833 74.7933
Contingent Liabilities 16.7733 20.3767 24.2767 24.6533 21.5700
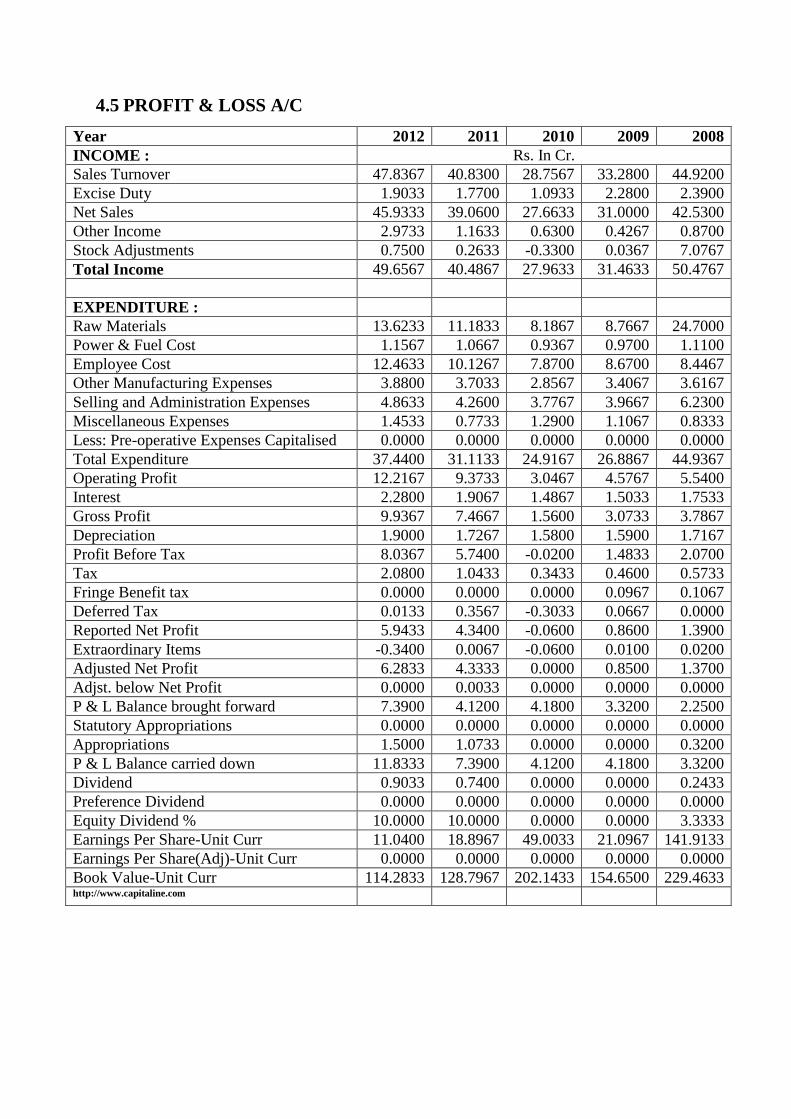
4.5 PROFIT & LOSS A/C
Year 2012 2011 2010 2009 2008
INCOME : Rs. In Cr.
Sales Turnover 47.8367 40.8300 28.7567 33.2800 44.9200
Excise Duty 1.9033 1.7700 1.0933 2.2800 2.3900
Net Sales 45.9333 39.0600 27.6633 31.0000 42.5300
Other Income 2.9733 1.1633 0.6300 0.4267 0.8700
Stock Adjustments 0.7500 0.2633 -0.3300 0.0367 7.0767
Total Income 49.6567 40.4867 27.9633 31.4633 50.4767
EXPENDITURE :
Raw Materials 13.6233 11.1833 8.1867 8.7667 24.7000
Power & Fuel Cost 1.1567 1.0667 0.9367 0.9700 1.1100
Employee Cost 12.4633 10.1267 7.8700 8.6700 8.4467
Other Manufacturing Expenses 3.8800 3.7033 2.8567 3.4067 3.6167
Selling and Administration Expenses 4.8633 4.2600 3.7767 3.9667 6.2300
Miscellaneous Expenses 1.4533 0.7733 1.2900 1.1067 0.8333
Less: Pre-operative Expenses Capitalised 0.0000 0.0000 0.0000 0.0000 0.0000
Total Expenditure 37.4400 31.1133 24.9167 26.8867 44.9367
Operating Profit 12.2167 9.3733 3.0467 4.5767 5.5400
Interest 2.2800 1.9067 1.4867 1.5033 1.7533
Gross Profit 9.9367 7.4667 1.5600 3.0733 3.7867
Depreciation 1.9000 1.7267 1.5800 1.5900 1.7167
Profit Before Tax 8.0367 5.7400 -0.0200 1.4833 2.0700
Tax 2.0800 1.0433 0.3433 0.4600 0.5733
Fringe Benefit tax 0.0000 0.0000 0.0000 0.0967 0.1067
Deferred Tax 0.0133 0.3567 -0.3033 0.0667 0.0000
Reported Net Profit 5.9433 4.3400 -0.0600 0.8600 1.3900
Extraordinary Items -0.3400 0.0067 -0.0600 0.0100 0.0200
Adjusted Net Profit 6.2833 4.3333 0.0000 0.8500 1.3700
Adjst. below Net Profit 0.0000 0.0033 0.0000 0.0000 0.0000
P & L Balance brought forward 7.3900 4.1200 4.1800 3.3200 2.2500
Statutory Appropriations 0.0000 0.0000 0.0000 0.0000 0.0000
Appropriations 1.5000 1.0733 0.0000 0.0000 0.3200
P & L Balance carried down 11.8333 7.3900 4.1200 4.1800 3.3200
Dividend 0.9033 0.7400 0.0000 0.0000 0.2433
Preference Dividend 0.0000 0.0000 0.0000 0.0000 0.0000
Equity Dividend % 10.0000 10.0000 0.0000 0.0000 3.3333
Earnings Per Share-Unit Curr 11.0400 18.8967 49.0033 21.0967 141.9133
Earnings Per Share(Adj)-Unit Curr 0.0000 0.0000 0.0000 0.0000 0.0000
Book Value-Unit Curr 114.2833 128.7967 202.1433 154.6500 229.4633 http://www.capitaline.com