a study on competency mapping and its impact
DESCRIPTION
MBA HR MANAGEMENT, A Study on Competency Mapping and Its ImpactTRANSCRIPT

1
TABLE OF CONTENTS
S.No CONTENTS PAGE
NUMBER
Chapter- I 1.1 Introduction
1.2 Research Methodology
2
13
Chapter- II 2.1 Review of Literature
2.2 Company Profile
21
35
Chapter- III Data Analysis and Interpretation 41
Chapter- IV
4.1 Findings
4.2 Conclusions
4.3 Suggestions
75
79
80
Appendix Questionnaire
Bibliography
82
86

2
LIST OF TABLES
Table No. Title Of Table Page No.
1 Respondents by Designation 42
2 Respondents by Education 43
3 Respondents by Age 44
4 Respondents by Experience 45
5 Respondents by using methods of Competency Mapping 46
6 Respondents by the level of contribution to the Performance
Appraisal.
48
7 Inter Relationship between designation and their opinion on
Performance Appraisal.
49
8 Inter Relationship between Education vs. Performance Appraisal. 50
9 Inter Relationship between Age and Performance Appraisal 51
10 Inter Relationship between Experience and Performance Appraisal 53
11 Inter Relationship among the factors influencing the Performance
Appraisal.
54
12 Respondents by the level of contribution to the Selection. 57
13 Inter Relationship between designation and Selection 58
14 Inter Relationship between Education and Selection 59
15 Inter Relationship between Age and Selection 60
16 Inter Relationship between Experience and Selection 61
17 Inter Relationship among the factors influencing the Selection. 62
18 Respondents by the level of significance to the future
competencies.
64

3
Table No. Title of Table Page No.
19 Inter Relationship between Designation and Future Competencies 65
20 Inter Relationship between Education and Future Competencies 66
21 Inter Relationship between Age and Future Competencies 67
22 Inter relationship between Experience and Future Competencies 69
23 Inter Relationship among the areas influencing future
competencies.
70
24 Respondents denoting the overall impact of the competency
mapping on the HR deliverables.
72

4
LIST OF CHARTS
Chart No. Title of Chart Page No.
1 Respondents by Designation 42
2 Respondents by Education 43
3 Respondents by Age 44
4 Respondents by Experience 45
5 Respondents by using methods of Competency Mapping 47
6 Respondents by the level of contribution to the Performance
Appraisal.
48

5
CHAPTER – I
INTRODUCTION

6
1.1 INTRODUCTION
At the heart of the every successful activity lies a competence or a skill. In today’s
competitive activities of business. There has been much thinking abut business strategy
over the last three decades, particularly regarding what competencies a business needs to
have in order to compete in a specific environment working to establish them throughout
the organization. Human Resource Development builds competency-based models that
drive business results.
All organizations are talking competencies. Some have truly worked the concept into
several of their processes. A few have a fully implemented competency modeling.
Microsoft is synonymous with windows and MS Office, applications which computer
users are familiar with worldwide. When you say Sony or Japan for that matter, the top of
the mind recall is about handy, compact or even miniaturized electronic goods…. In all
these cases, the organizations identified their niche and simultaneously built
competencies in their human resource, which have helped them to sustain and capitalize
on their strategic strength. The edge in the market place has an internal complement: an
internal edge in terms of leadership, openness, learning culture, creativity, sense of
ownership, high levels of motivation, etc.
Competencies can serve as the foundation of an integrated human resources system that
includes applications related to staffing, training and development, performance
management, and compensation. An integrated approach to human resources that

7
connects these focus areas can enable an organization to make the best use of
competencies while achieving competitive advantage.
Competencies are not personality traits, nor are they skills in the traditional sense.
Instead, they represent a set of behaviors that encompass skills, knowledge and personal
attributes. Furthermore, these factors are definable, observable and measurable.
Competency based HR systems are for staffing applications, competencies are used to
hire, place and promote people with the right capabilities to help the organization gain
competitive advantage. For training and development are widely used to identify gaps in
each participating employee’s capabilities so these gaps can be remedied. For
performance management, competencies and results are assessed side by side, focusing
employment on the how as well the what. For compensation, competencies and results
impact base pay decisions to reward performance and competency development.
Definitions of Competencies
There are a bewildering number of definitions of ‘competency’. In part this is because
organizations and competency ‘experts’ seem to prefer their own definitions of
competencies to those that have gone before. However, the majority of these definitions
are simply variations on two themes, which have different origins.

8
Main themes
The two main themes in the definition of competencies are:
Descriptions of work tasks or job outputs — these have their origins in national training
schemes, such as the National! Scottish Vocational Qualifications and the Management
Charter Initiative (MCI).
The MCI definition of the concept of competence is ‘the ability of a manager to perform
to the standards required in employment’. (MCI, 1992)
Descriptions of behaviour — these have evolved from the work of researchers and
consultants specializing in managerial effectiveness.
Many definitions of behavioural competency are variations on the following definition: a
job competency is ‘an underlying characteristic of a person which results in effective
and/or superior performance in a job’ (Klemp, 1980).
Variations typically expand on what the characteristics may be — as, for example, in this
much-quoted definition: ‘A job competency is an underlying characteristic of a
person in that it may be a motive, a trait, a skill, an aspect of one’s self-image or
social role, or a body of knowledge which he or she uses’ (Boyatzis, 1982). These
definitions indicate that a competency is made up of many things (motives, traits, skills,
etc) and yet we usually only see evidence of these things in the way somebody behaves.
For example, interpersonal skill will be demonstrated in how effectively a person

9
negotiates influences and works in a team. Behavioural competencies describe typical
behaviours observed when effective or superior performers apply motives, traits, skills,
etc to job-relevant tasks to produce job relevant outcomes.
The History and Background of Competencies
It is a part of the natural human condition to want to control the future, to turn the
unknown into the known, and to attempt to reduce the uncertainty that we constantly
face. The Egyptians created a god of locusts, for example, to help them cope with the
uncertainty of a two-week period in the autumn when a deluge of the insects could
destroy their entire crop. The same urge to reduce uncertainty has fueled the search
for the causes and predictors of behavior in the workplace. How can we tell how well
people will perform on the job before rather than after we hire them?
The question of what predicts performance has been the subject of scientific inquiry
for the past two hundred years. Scientists and pseudo-scientists have proposed a wide
range of factors that determine behavior and performance. These factors have
included size and shape of the head, brain weight, skin color, ethnicity, social class,
birth order, handwriting, religion, intelligence quotient (IQ), cultural heritage,
astrology, heredity, gender, and so on. Additional factors that have been used to
attempt to predict performance in the workplace are technical skills, years of
experience, education, certification, and personality traits.
It is against this background that the study of competencies began in the early 1970s.
In 1973 David McClelland published an article demonstrating that behavioral traits
and characteristics are much more effective than aptitude tests in determining who is

10
and is not successful in job performance.[1] Superior performers did things such as
exercise good judgment, notice problems and take action to address them, and set
challenging goals—behaviors relatively independent of aptitude, skill proficiency,
and experience level.
The research that began with this article has resulted in hundreds of job studies that
all attempt to answer one basic question: What is it that differentiates strong
performers from average performers? If we know what these differentiators are and
can measure them, they can be used to hire better employees, assess and appraise
employees, and help them improve their performance.
These differentiating characteristics have come to be called competencies. The most
useful definition of the term that I have heard is that competencies are enduring traits
or characteristics that help determine job performance.
In the business world today, there is some confusion over the definition of a
competency. The biggest confusion is between competencies and skills. Skills
generally refer to the mastery of techniques and knowledge that apply to a specific area
or profession. Sales skills include prospecting, handling objections, and closing.
Drafting skills include measuring and drawing. Managerial skills include writing and
forecasting. Some companies use the word “competency” to mean skills. This causes
them big headaches for two reasons. First, there are so many skills in every position in
an organization that management of a skills database is a time-consuming and difficult
activity. The bigger problem is that the focus on skills distracts people from the use and

11
assessment of competencies, which play a much bigger role in determining
performance.
Focusing on knowledge and skills misses the point. Having the greatest knowledge
and skill on the planet won’t make any difference if people have no desire and no
drive to use that skill and knowledge.
It is not that skills are unimportant. A threshold level of skill is necessary to do a job.
If you are hiring an electrical engineer to work at a nuclear power plant, you need
someone who knows electrical engineering. Assuming that technical ability
determines successful performance, however, is a costly mistake. People with basic
skills who are strong in the important competencies for a position will, because
they’re strong in those competencies, acquire whatever knowledge and skills they
need to become a superior performer in that job. If people strong in initiative do not
know the answer to a problem, they’ll use their initiative to find it. If people strong
in service orientation do not know the answer to a customer’s problem, they’ll find
someone who does. Keeping the focus on competencies is keeping your eye on the
ball. It is paying attention to what matters, paying attention to the things that actually
determine the difference between strong and weak performance.
There is nothing magical about competencies. The competency paradigm is simply
one way to break behavior down into its component parts. Like any paradigm, it is
useful to the degree that it helps explain reality, as we know it, and helps us
influence and predict the reality of the future. Competencies are a useful concept to
the extent that they can help explain why some people perform better than others, to

12
the extent that they help people improve their performance, and to the extent that
they help people make decisions that will enable them to accomplish their objectives.
When used effectively, the competency paradigm is a tonic for managers trying to
improve their organization in these areas.
One of the benefits of competencies is that the concepts are easy for most people to
understand. People have a common understanding of what we mean when we say
influence, or initiative, or teamwork. Not only are the terms easily understood, they also
generally have positive connotations. If you ask most people if they would like to be
results oriented, they will say yes. If you ask them if they would like to be innovative,
they’ll say yes. If you ask them if they would like to be good team players, they’ll say
yes. So in the battle to win the hearts and minds of employees and to create a culture of
competence, the language of competencies provides a means for translating the concept
of a high-performance culture into terms that people can embrace.
What is the difference between ‘competence’ and ‘competency’?
Many people have wondered if there is any difference between ‘competence’ and
‘competency’. A general convention has developed, although not always followed,
which uses ‘competence’ and ‘competency’ in the following ways.
- An ability based on work tasks or job outputs tends to be referred to as a
‘competence’.
- An ability based on behaviour tends to be referred to as a ‘competency’.

13
In practice, many organizations include tasks, outputs and behaviours in their
descriptions of competence/competency, and often blend them together. However, it is
far more common for descriptions to be behaviour-based rather than solely taskor job-
output-based. For the purposes of this book we refer to competency (i.e.) in relation to
frameworks based on behaviors.

14
COMPETENCY MAPPING
Competency Mapping is a process of identifying key competencies for an organization
and/or a job and incorporating those competencies throughout the various processes (i.e.
job evaluation, training, recruitment) of the organization. To ensure we are both on the
same page, we would define a competency as a behavior (i.e. communication, leadership)
rather than a skill or ability. The process requires specification determination, which
results in firming up the attributes and competencies required for each role in the
organogram. The competencies of the respective job description become the factors for
assessment on the performance evaluation. The skill inventory provides information on
the kind of competencies required for various positions in the organization. Then the
systematic approach of competence based interview is carried out to match the
competencies required for success on a job with that person. The competency mapping
process is designed to arrive at attributes (inherent personal traits) , and competencies
(knowledge, skills and abilities required in a job), unique to the client organization. Once
a competency map is developed and validated, it can be used to recruit and select,
manage, evaluate and develop people for the roles arrived at through the organization
design process. It also can be used in compensation management and succession
planning. Typically, the process requires specification determination, which results in
firming up the attributes and competencies required for each role in the organogram. A
preliminary project plan is developed to ensure that all the key stakeholders are involved
in the process and that appropriate activities and communication plans are established to
support the development of the maps. Clients are given the opportunity to review the

15
maps to ensure they meet current and future needs. Competencies and attributes are
evaluated to assess how accurately they describe performance requirements, and to
ensure they are aligned with the strategic business objectives.
The Role of Mapping
'Mapping' refers to the process of comparing things in search of relationships between
them. Mapping is used to plan where, when and how training is to be delivered and
assessed.
The process finally results in :
Ø Determination of technical, behavioural, and managerial traits required for
individual success.
Ø Providing accurate specifications for recruitment and staffing.
Ø Providing a basis for consistently measuring performance as related to the
business objectives.
Ø Reinforcing the critical elements of the organization's business strategy.
Results of Competency Mapping
For Individuals
Ø Individuals contribute to and learn from the interviewing process.
Ø Learn what professions are core to the organization.
Ø Know required skills and success indicators -- and what level of mastery they have
achieved.
Ø See what is necessary to learn if they want to move to another position.
Ø Have information for evaluating their performance.

16
For Managers
Ø Have the information needed for meaningful performance management.
Ø Know what is expected in each profession for coaching and evaluation purposes.
For Organizations
Ø Know what professions and practices are core to your business.
Ø Create a context for meaningful and effective succession planning.
Ø Tie career and leadership development to core competencies and best practices.
Ø Build consensus within and between teams.
17
1.2 RESEARCH METHODOLOGY
Research methodology is a way to systematically solve a research problem. It studies the
various steps that are generally adopted by a researcher in studying the research problem
together with the logic behind them.
STATEMENT OF THE PROBLEM
Management scholars as well as practitioners, for long, have argued that effective
management is only possible with a thorough understanding of employees' personalities
and behavioral styles, as well as their working situation.
Therefore, it is not surprising that organizations are spending considerable time as well as
expertise to arrive at Competency Models -clusters of knowledge, skills, attitudes,
motives, and values- required to turn out superior performance. This competency model
then becomes the basis for decision about hiring, training, appraisal, promotion and other
human resources issues. And in the past decade, thousands of organizations throughout
the world have joined the quest for competencies.
This is a competency era. It is beyond doubt that it is beneficial and cost effective to have
competent people occupy higher-level positions. Competency refers to the intellectual,
managerial, social and emotional competency. Many organizations in India and abroad
are channelizing efforts to mapping competencies and implementing assessment and
development centers. The need of the hour as indicated by many organizations is to
design and implement low cost assessment and development centers, specially designed

18
to meet the requirements of developing economies like ours. Therefore it was desired to
conduct Competency Mapping in-order to meet the future challenges across the global
competitive market.
TITLE
A Study on Competency Mapping and its impact on HR Deliverables.
OBJECTIVES OF THE STUDY
GENERAL OBJECTIVE
1. To know the role of competency mapping and its impact on HR Deliverables
SPECIFIC OBJECTIVES
1. To ascertain & understand the contribution of Competency Mapping in the
Performance Appraisal process.
2. To know the role of competencies in the selection and the hiring process.
3. To harness the significance of anticipating and managing the competencies
required for the future. (Competency Futuring)

19
Operational Definitions
Competency
An underlying characteristic required performing a given task, activity, or role
successfully is competency. Competency is measurable, observable and may take the
following forms: Knowledge, Attitude, and Skills, other characteristics of an individual.
Mapping
Mapping refers to the process of comparing things in search of relationships between
them. Mapping is used to plan where, when and how training is to be delivered and
assessed.
Competency Mapping
It is a process of identification of the competencies required to perform successfully a
given job or role or a set of tasks at a given point of time. It consists of breaking a given
role or job into its constituent tasks or activities and identifying the competencies
(technical, managerial. Conceptual, etc.) needed to perform the same successfully.
Competency Assessment
It is the assessment of the extent to which a given individual or a set of individuals
possess these competencies required by a given role or set of roles or levels of roles.
Performance Appraisal
Performance Appraisal activities include documenting achieved results (including use of
examples to clarify documentation) and indicating if standards are met or not. The
appraisal plan usually has some form of a development plan to address insufficient
performance

20
Competency based Performance Management System
A system for effective performance management starts with the identification of critical
positions, agreement on the top hard and soft skills required for those positions and then
provides the training and evaluation practices necessary to put the right people in the
right way.
Competency based Selection process
Competency based selection determines whether an applicant has the necessary
capabilities and characteristics and the knowledge, skills and abilities to do the job.
Competency based selection practices focus on what an applicant has done in the past.
Managers can zero in on the specific competencies critical to success.
RESEARCH DESIGN
The research design adopted by the researcher for the purpose this study is Descriptive.
The researcher by adopting descriptive study aims at evolving new insights and ideas to
formulate a comprehensive picture of competency mapping and its role in the HR
deliverables.
SAMPLE SIZE
For the purpose of this study, the size of the sample is 60.
SAMPLING METHOD
The sampling technique adopted for this study is Simple random Sampling method.

21
UNIVERSE:
The universe is the totality of units from which the sample is selected or derived. The
study focuses on competency mapping and HR deliverables, in the industry across all the
sectors.
SOURCE OF DATA COLLECTION
The researcher used both primary and secondary sources of data for the study.
Primary Data
Primary data was directly collected from the respondents.
Secondary Data
Secondary data was collected from books, journals, magazines and related websites.
TOOL OF DATA COLLECTION
Questionnaire is the tool adopted by the researcher for the purpose of collecting the data.
It refers to a device securing answers to questions by using a form, which the respondent
fills by himself. This method is followed because: - The professionals are well educated
and can understand the questions with much ease.s- Since most of the professionals are
amidst busy schedule in their work, this questionnaire will help them complete it at their
convenience.

22
COMPONENTS OF THE TOOL
The questionnaire consists of 25 questions. It has been divided into four parts to fulfill the
objectives of the research. The following are:
1. Personal profile.
2. Competency Mapping and its role in Performance Appraisal
3. Competency Mapping’s role in Selection and Hiring process
4. Significance of anticipating future competencies
PRETESTING
To ensure the effectiveness of the questionnaire, pre-testing was done on 10% of the
samples during the month of December 2004. Pre-testing revealed that the respondents
were able to reciprocate to the questionnaire as per the objectives of the study. Pre-testing
also revealed that for some of the questions minor changes should be done. Hence after
suitable modifications the revised questions was circulated among the Human Resource
Executives for the study.
CRITERIA FOR SAMPLE SELECTION
The criteria for selection of samples would be the following:
1. The respondent should be a HR Professional.
2. He/She should be not be less than one year of experience.
ACTUAL COLLECTION OF DATA
The data for study was collected in the month of January 2009 using Questionnaire.

23
ANALYSIS AND INTERPRETATION
The data collected were analyzed and interpreted by using quantitative information,
diagrams electronically using SPSS Version 11.0 (Statistical Package for Social
Sciences).
LIMITATIONS
• There may be some limitations encountered during collection of data
• Responses may suffer from human bias and prejudice
CHAPTERIZATION
I. Introduction and Review of literature
II. Research Methodology
III. Data analysis and interpretation
IV. Findings, conclusions and suggestions
V. Bibliography and Appendix

24
CHAPTER – II
REVIEW OF LITERATURE

25
2.1 REVIEW OF LITERATURE Competency Based Selection
There are several important advantages in competency based employee hiring and
selection.
First, competency based selection is results oriented. They make it easier to concentrate
on the results expected of a successful or exemplary performer. They focus less on
approximations of competence – such as educational level or years of experience – that
have little connection to verifiable results.
Second, competency based selection plays an important role in attracting individuals who
possess characteristics that might be difficult, if not impossible, to acquire by training or
development efforts.
Third, a competency based selection process provides applicants with opportunities to
outline, explain and demonstrate their qualifications in competency-based terms.
Fourth, competency based selection are readily transferable across work situations,
competency based selection may help the organization to function effectively even during
times of rapid or unanticipated change.
Fifth, competency-based selection processes give HR practitioners an opportunity to plan
for developing competencies for new hires and for experienced workers who must be
reassigned.

26
Sixth, competency based selection methods do not discriminate. They encourage
mangers to clarify the desired work results and to find individuals, who can achieve those
results regardless of age, race. Gender, sexual orientation, ethnic background or other
considerations that have little or no bearing on their ability to perform.

27
Competencies, Performance Appraisal and Career Development
First and foremost, individuals must demonstrate competencies. Perhaps the most
common place where they are demonstrated is within the scope of a particular job or
project involvement.
One of the first encounters with competencies for most individuals is in securing
employment with a new organization. Organizations that are purposefully using cutting-
edge methods to choose talent for positions or projects roles are engaging in what is
called competency based selection and recruitment. These interviewing and selection
methods are being used not only for hiring external applicants, but also for staffing
internal roles.
Many organizations that use competency based interviewing and selection are also later
using the individuals, and to plan for succession in the organization. Therefore, the
individual employees in such an organization will have an ongoing need to use and map
their competencies.

28
Why should employees map their competencies?
Lists of compelling reasons are following.
- Gains a clearer sense of true marketability in today’s job market; once the individual
knows how his competencies to those that are asked by the market in the key
positions of interest.
- Projects an appearance as a cutting edge and well prepared candidate, who has taken
the time to learn about competencies, investigate those in demand, and map their
own competencies prior to interviewing.
- Demonstrates self-confidence that comes from knowing one’s competitive
advantages more convincingly, and from being to articulate those advantages in
specific language.
- Secures essential input to resume development – a set important terms to use in
describing expertise derived from prior career experience.
- Gains advanced preparation for interviews, many of which may be delivered using a
competency-based approach called ‘structured behavioral interviewing’ or
‘behavioral event interviewing’.
- Develops the capability to compare one’s actual competencies to an organization or
position’s required/preferred competencies, in order to create, an Individual
Development Plan.

29
Competency Level Definition
Competency Level
Proficiency Level
C0 – Training
Obtained certification/Training recognized by organizations. No hands on experience.
C1 – Exposure
Has limited experience in the subject. Needs to improve knowledge of job in order to be able to function ably on a day-to-day basis.
C2 – Experience
Has a good knowledge of the subject and effectively applies the same in day-to-day work. Is a contributing member of the team on the subject concerned.
C3 – Expert
Is an expert at the subject conceptual as well as in application and uses the same towards implementing process improvements. Exhibits a high caliber of problem solving ability. Is recognized as an expert in the subject within the practice/group.
C4 - Excellence
Is recognized as an expert in the field in the industry and within the organization.

30
Methods of Competency Mapping Focus Groups
These consist of a group of people at varying levels within the authority who meet on a
regular basis over a period of time. The group will look at a cross-representation of roles
across the authority. It is usual practice for one person to present the main purpose of
each role, its key accountabilities, principal activities and performance indicators.
Following this presentation the group will brainstorm the range of qualities needed to
perform the role. Once all the roles have been brainstormed, the group will collate the
qualities into clusters. Once the clusters have been identified, the group will develop a
working title for each competency, together with the behavioral indicators of the
competency in action in every day work.
This approach can provide greater acceptance of the competencies within the authority,
as they tend to be in language that the authority understands. In-house people will also
have a greater understanding of the roles, although it is important to ensure that the group
reflects the range of roles across the authority. The main disadvantage with the approach
is that it can require a significant time commitment from those involved.
Inventories and questionnaires
This approach involves using an inventory (or questionnaire or checklist) to break down
the job requirements into key tasks, which are then subdivided into day-to-day activities.
The inventory information is obtained by talking to the jobholder and manager, as well as
through observing the jobholder in action. Following the initial identification of

31
activities, the jobholder is asked to give a score for elements such as the time taken to
undertake the work, its complexity and the consequences of error. The greater the score,
the greater the criticality of the tasks. Following the initial identification of activities, the
jobholder is asked to give a score for elements such as the time taken to undertake the
work, its complexity and the consequences of error. The greater the score, the greater the
criticality of the tasks. Following this, each competency is rated to provide and indication
of the importance of each competency. This approach is helpful where jobs are well
defined and predictable and it can be a cost-effective way of guaging the views of a large
number of jobholders and managers. However, it is essential the adequate time and
resources are provided to enable effective analysis of the inventory/questionnaire results.
In most circumstances, use of a software package for the purpose is recommended.
Interviews
This involves interviewing jobholders and/or managers in order to identify the specific
events that form a critical part of the job. Interviewees are usually asked to describe
particular experience in their work and the interviewer will then probe to determine the
actions taken and the outcome. From this, the interviewer can infer the competencies
required, particularly when dealing with critical incidents.
This approach tends to be most helpful to identify competencies, which are critical when
dealing with demanding situations, rather than the standard competencies, so determining
the difference between average and superior performance. This approach is helpful as it
focuses directly on the competencies required rather than analysing the work that then

32
needs to be developed into appropriate competencies. It is essential when implementing
this approach that the interviewer is experienced in a competency approach and has the
necessary interview skills.
Diaries and work logs
This involves the jobholder maintaining a record over a period of time, from which the
competencies can be deduced. This approach can take two forms. A diary approach
requires that the jobholder log the activities they undertake at various times throughout
the day. A log lists key criteria, perhaps in the form of competencies, and jobholders are
asked to record each time during the day they employ that competency.
This approach ensures that the jobholder’s views are directly taken into account and can
be a cost-effective way of gaining information from a large number of jobholders.
However, the process of analysing the results and collating them into some sort of order
can be time consuming.
Repertory grid
This approach attempts to identify the competencies, which differentiate between poor,
average and superior performance. The manager is interviewed and asked to place people
in various categories of performance. The interviewer then prompts the manager to
describe some of the examples of performance and then attempts to break these examples
down to certain elements that can isolate and identify the bahaviours that accompany
performance at different levels.

33
This approach only takes into account the views of the manager and not the jobholder. It
is also necessary to ensure confidentiality during the process. The process requires a
suitably experienced and skilled interviewer and can be time consuming.
Observation
This approach involves the observation of jobholders undertaking their normal day-to-
day activities. The observer will normally develop a record form that lists possible
behaviour indicators and then records when these behaviours are displayed during the
observation process, which might focus on a particular time period.
This approach enables the observer to see the work at first hand and prevents disruption
to the manager or jobholder. However, the jobholder may have concerns about being
observed for long periods of time and may need reassurance of the purpose of the
exercise. Where a number of observers are used, it is imperative that all observers use the
same approach.
Testing
Ability and psychometric tests are undertaken by a cross-section of jobholders. The
results are correlated against levels of job performance in order to identify differentiating
characteristics and key competencies.

34
This approach can provide differentiators between performance levels and also some
benchmark data on the current workforce, which can then be used as a measure for future
employees.
However, it is essential that there is clear data about the differing performance levels in
order to compare the test results against. This approach can also be very sensitive for
jobholders and it is therefore important that the purpose of the approach is clarified with
those involved.
Pitfalls in Competency Mapping
Valdis Krebs (1999) defines social capital as "who you know" and human capital as
"what you know". In an organization the 'you' refers to the corporate entity. These two
types of capital in any such entity can be explored using knowledge mapping tools called
'social network mapping' and 'competency mapping'. Competency mapping demonstrates
what type of knowledge and skills are required and/or found within the human capital of
the organization. An organization could use these personal competency maps to build a
'yellow pages' directory, match people to jobs or positions or determine what training
programs are needed to fill skill gaps.
Pitfall No. 1: Believing the map is the ultimate goal
Mapping is the easiest part of the process. The difficult parts are the audit (input) and
analysis (output). These are the ones most fraught with stumbling blocks and hidden
dangers. Mapping may seem to be the output of the system. In truth the map is the middle
part of the process and serves only as the beginning for analysis, the true output. It is a

35
pitfall to view the map as the desired end result. The map is nothing but a colossal waste
of time and money without the proper analysis. However, proper analysis is impossible
without asking the proper questions at the outset.
Pitfall No. 2: No Purposeful Question
Ask a stupid question and you will get a stupid answer. If you want a valuable result you
must ask a question that will give you a valuable answer. The reason the question may be
stupid is that a purpose or mission for the mapping project has not been defined. An
organization should not map merely for the sake of saying we now have an organizational
map. The map is not good in and of itself. It is only good in so far as it can bring about
positive change in the organization. The value of the map has been described as the
'reality' chart of an organization. The traditional organization chart shows you the
prescribed method in which communication is to flow. Knowing how communication
actually flows is of no greater value than the organization chart unless you want to
measure how close the flow is to what is desirable and if it is not, to use it to design
strategies to change it.
Pitfall No. 3: Not Knowing Where You Are Going
The pitfall is not having a mission. If you don't know where you are heading how will
you know when you get there? Similarly when you wish to effectively measure reality
you must have some idea of the ideal and must ask questions that will show whether this
ideal is in fact close to the mark or far removed. Thus the mission must reach far beyond
the map itself. The mission must be to create and sustain a knowledge flow that is more

36
profitable to your organization. Then the map becomes a measure of how close to the
ideal you already are in order to benchmark for future measures of how much change you
have been able to effect. If you are already there, that is, your organization is already rich
beyond your wildest dreams your mission might be to measure the current 'ideal'
knowledge flow. Then in the future when the bottom line is not so rosy, you will be able
to measure against the benchmark to see where the problems are occurring and use this to
try to re-create the ideal. However, until we know this perfection we must try to imagine
what would be better.
Pitfall No. 4: Not ensuring both reliability and validity
In fact, most ordinary people are not sure what these are much less what difference they
make when gathering data. Not only must the question have a purpose and match the
mission, the question must deliver both reliable and valid results. Reliability and validity
are indications of how usable a particular measuring tool really is. "Reliability tells us
how consistently we are measuring whatever we are measuring. Validity is concerned
with whether we are measuring what we say we are measuring." (Buley)
First reliability means the results are consistent, both internally and across time. If you
take a measure of any part of the whole subject at any one time, the results will be
consistent. That does not mean the results will be the same, just consistently measuring
the same thing. If you wish to measure the knowledge a person has by how many people
chose him as a subject matter expert, then the question must consistently measure this
concept no matter how many people are asked. To be reliable the results also must be

37
consistent over time - that is not that people's answers may not change but that the
question consistently measures the same concept no matter when the questionnaire is
delivered. Validity then kicks in as a measure of what you are really trying to do. If I am
trying to accurately measure my weight, then the results matter. A consistently wrong
answer means I am not accurately measuring my weight and if that is my intention, the
tool (the scale) is not a good one. This is easier seen in something tangible as weight and
a scale as the measuring tool. It is more difficult to apply in the situation of mapping
organizational knowledge. If we want to show the "who you know" or social capital, the
tool must measure that. When we want to measure "what you know" the tool must
actually be able to calculate this.
The data cannot be reliable and valid, if our measuring tool is not accurately consistently
measuring what we say we are measuring. Some think the main measuring tool is the
'system' - however, the question is really the input. Yes it is important the technology
takes in the results and charts an accurate reflection of the data. Yet no matter how
wonderful the technology is, it is nothing without valid and reliable input. The question is
really the key. If the question cannot be assessed to be reliable and valid, there is no sense
in even beginning the process.
Pitfall No. 5: Not Assessing the Results Accurately
Now we will assume you have found and tested on a sample audience the questions and
found them to be valid and reliable and that they actually reflect the mission.
Furthermore, let us assume the system has accurately produced the data in some visible

38
form, such as a map of connections. So far if any of this process has been flawed, the
minimum harm done is the waste of time and effort. Where the greatest danger now lies
is in the use or potential misuse of the data.

39
2.2. COMPANY PROFILE
We are pleased to introduce ourselves as manufacturers of press tools, press components
& precision machined components, jigs, gauges and industrial assemblies. Construction
of X-ray Cabins.
18 YEARS OF EXCELLENCE
Established in 1988. Madras Micro Tools. is conveniently located on Whitefield
Road about ten Kilometers from M.G.Road. It is also close to the International
Technology Park and KIADB Export promotion zone.
WORD-CLASS FACILITIES & WORKFORCE
We have a full-fledged plant with precision machinery and equipment to suit your
requirements. We manufacture, supply and installation of lead cells, leaded trolley, toggle
clamps, Hydraulic Scissors Lift. Our facilities include CNC machining, Cylindrical
grinding, hardening, centreless grinding, plating, anodizing, thread rolling, powder
coating, Tig welding etc.(painting), and facilities for fabrication. We have a dedicated
work force of qualified and skilled technicians.
Products
v Lead enclosures
v Trolley (Leaded & Mobile)
v Hydraulic Scissors lifts
v Toggle clamps
v CNC Machine components
v SS Fabrication

40
Grinder Stand Toggle Clamps Aeronotical Pump Body Circuit Break
Module
Collimeter Cab Friction Ring Hydraulic Scissors Lift Lead Enclouser
Medical Consumable Base
Medical Consumable Imager
Medical Consumable Mac 5000 Tray
Medical Consumable Over Hang

41
Medical Consumer TTH
Steel Sleve
DSGR Body
Lead Cell
Lead Mac 5000 Trolley Machine Parts
Medical Consumable Mac 5000 Tray -Back View

42
CUSTOMIZED SOLUTIONS
We also under take all types of job works including manufacturing & supply for
continuous production. We also make special customized studs and bolts as per your
requirement and we can also supply casting in brass, bronze & aluminum.
INDUSTRY-WIDE CLIENTELE
Our reputed customer list includes:
Medical Industry Wipro GE Medical Systems.
(Vendor Code No.UP 001) GE Medical Systems X-Ray(SA) Ltd.
Precision Mfg Industry GE BE Pvt Ltd. R&D Centers John F Weltch Technology Center Farm Equipment Industry V.S.T. Tillers & Tractors Ltd. Machine-building Industry Inductocast Steel Foundry Ltd. Heavy Equipment Industry Bharath Earth Movers Ltd.
(Vendor Code No.00901657)
We hope you will give us an opportunity to serve your special needs with our
world-class ISO certified quality at a competitive price and help us to build a long
relationship with you.
[For information of the intended recipient only. Do not circulate without the permission
of Madras Micro Tools.]

43
LIST OF EXISTING MACHINERY
CNC machining Center Milling machine HMT Lathe machine No. Name of the Machine Specification Make
1. CNC Machining Center Working Area 1200mm x 500mm x 600 ht 30 position Tool Changer
MATSURA JAPAN
2. Milling Machine FN2 - V HMT
3. Lathe Machine LB17 HMT
4. Shaping Machine 24 Inches RUBY
5. Surface Grinding Machine 400 x 150 x 250 BHURJI
6. Drilling Machine Pillar Type 1 Inch EFFICO
7. Drilling Machine 1 / 2 Inches KMP
8. Power Hacksaw Cutting Machine 200 Dia GANGA
9. Band Saw Cutting Machine
10. Arc Welding Machine 04mm JERMEX
11. Compressor 3 / 4 SAC
12. Hand Press No.6
13. Hand Drilling Machine 13mm KPT
14. Hand Grinding Machine BLACK & DUCKER
15. Hand Jig Saw Machine BOSCH
16. IGBT Inverter Tig / Arc Welding Machine HT 200 P CHOWEL

44
CHAPTER III
ANALYSIS and INTERPRETATION

45
ANALYSIS AND INTERPRETATION
After the completion of data collection process, the researcher analyzed and interpreted
the data to validate the study. The analysis and interpretation were done to:
· Synthesize the collected data
· Verify the statistical significance
· Interpret the data from the researcher’s point of view
· Explain the reasons behind the numerical figures
· To describe the study in a tabulated form
The interpretation consists of three parts:
· Introduction about the table
· Interpretation per se
· Researcher’s observation
The purpose of analysis and interpretation is to make the study easily comprehensible

46
Table No: 1 : Respondents by Designation
Designation
No. Of
Respondents
Percentage
Executives
42
70
Managers
8
30
The above table represents the data of designation of the respondents, which is broadly
classified into the Executive and the Managerial level.
The executive level represents the combination of the HR executives, Senior
Executives and HR Generalists. The Managerial level comprises of the Assistant
Manager, Manager – HR and the Branch Heads.
Thus we can infer that vast majority (70%) of the respondents belongs to the
executive class and little less than one third (30%) belong to the Managerial level.
Fig No: 1: Respondents by Designation
0
10
20
30
40
50
60
70
Executives Managers
No. of.Respondents
Percentage

47
Table No: 2 : Respondents by Education
Education
No. Of
Respondents
Percentage
MSW 31 52
MBA 25 41
PG Diploma 4 7
This table denotes the qualification of the respondents. They are postgraduates either in
Social Work or Business Management specializing in Human Resource management.
It represents that more than half (52%) of the respondents are Masters in Social
Work (MSW) and more than two fifth (41%) of them are Masters in Business
Administration (MBA) and less than 5% of them are Post Graduate Diploma in Human
Resources.
Thus we can infer that in the respondents population more than half of them were
MSWs and the remaining were MBAs.
Fig No: 2 : Respondents by Education
0
10
20
30
40
50
60
MSW MBA PGDiploma
No. of.Respondents
Percentage

48
Table No: 3 : Respondents by Age
Age (in years)
No. Of Respondents
Percentage
Below 30
40 67
Above 30
20 33
The table corresponds to the age of the respondents. It is widely categorized into two
groups – below 30 years and above 30 years.
The table shows that two third (67%) of the respondents are falling under the age group
of below 30 years and one third (33%) of them are above 30 years.
Fig No: 3 :Respondents by Age
0
10
20
30
40
50
60
70
Below 30 Above 30
No.of.Respondents
Percentage

49
Table No: 4 : Respondents by Experience
Experience
No. Of Respondents
Percentage
Below 5 years
42
70
5 years and above
18
30
The table demonstrates the years of experience of the respondents, which is broadly
classified as experience below 5 years and 6 years and above.
The data indicates that vast majority (70%) of the respondent population belong to
the category of below 5 years of experience and little less than the one third (30%) of the
respondents belong to 6 and above years of experience.
Fig No: 4 : Respondents by Experience
0
10
20
30
40
50
60
70
Below 5 Years 5 Years Above
No.of.Respondents
Percentage

50
Table No: 5 : Respondents by the method of Competency Mapping.
Methods
No. Of Respondents
Total
Focus Group Discussions
33 (55)
60 (100)
Inventories and Questionnaires
14 (23)
60 (100)
Behavioral Interviews
38 (64)
60 (100)
Diaries and Work logs
3 (5)
60 (100)
Repertory Grid
8 (13)
60 (100)
(Figures in the parentheses in all the tables represent percentage)
The table details on the methods used by the organization to map competencies. The
respondents can decide on one or more options, according to the organization they belong
to.The data explains that majority (63%) of the respondents use Behavioral interviewing as a
tool for Competency Mapping. Little more than half of the respondents (55%) practice Focus
Group Discussions as a method of Competency Mapping. Questionnaires are used by less
than one fourth of the respondents (23%). More than one tenth (13%) of the respondents use
repertory grid as a tool to map competencies. Diaries and Work logs are used by less than one
tenth (5%) of the respondents. Thus we can infer that behavioral interviews and focus
group discussions are the most widespread method of competency mapping.

51
Fig No: 5 : Respondents by the method of Competency Mapping
0
10
20
30
40
50
60
70
No.of.Respondents Percentage
Focus GroupDiscussions
Inventories andQuestionaries
Behavioral Interviews
Diaries and Work logs
Repertory Grid

52
Table 6 : Overall contribution of Competency Mapping to the Performance Appraisal
Level of Contribution
No. Of Respondents
Percentage
Low
7 11
High
53 88
Total
60 100
The table illustrates the role played by competency mapping in overall success of
performance appraisal. Almost all the respondents (88%) agree that competency mapping
plays a significant role in performance appraisal. But one tenth of the respondents (11%)
also say that it has very less or nil role to play in the performance appraisal process.
Thus we can infer that almost all the respondents (88%) feel that competency
mapping has an high impact on performance appraisal.
Fig 6 : Overall contribution of Competency Mapping to the Performance Appraisal
0
10
20
30
40
50
60
70
80
90
Low High
No.of.Respondents
Percentage

53
Table No: 7
Designation vs. Competency Mapping’s contribution to Performance Appraisal
Designation
Contribution to Performance Appraisal
Total High Low
Executives
39
(89)
5
(11)
44
(100)
Managers
14
(87)
2
(13)
16
(100)
Total
53 (88)
7
(12)
60
(100)
Chi-square value – 0.15 (With Yates correction) Not significant at 0.05 level Degree of freedom – 1 The table explains the relationship of the designation of the respondents and their opinion
on competency mapping and performance appraisal. In both the executives and
managers level, most of them (89% and 87%) have responded that competency mapping
has very high impact on the Performance Appraisal. On an average in both the levels,
one tenth of the respondents (11%, 13%) indicated that it has less impact on PMS
process. Thus we can infer that almost all the respondents feel that it has high impact on
performance appraisal. Since the calculated value (0.15) is less than the tabulated value
(3.841), there is no statistical significance between designation and performance
appraisal.

54
Table No: 8
Education vs. Competency Mapping’s contribution to Performance Appraisal
Education
Contribution to Performance Appraisal
Total High Low
MSW
31
(89)
4
(11)
35
(100)
MBA
22
(88)
3
(12)
25
(100)
Total
53 (88)
7
(12)
60
(100) Chi-square value – 0.125 Not significant at 0.05 level (With Yates correction) Degree of freedom – 1 The table describes the relationship of the education of the respondents and
correspondingly their views on competency mapping and performance appraisal.
In the MSW category almost all the respondents (89%) have accepted that competency
mapping plays an important role in Performance Appraisal. Similar response is also from
MBAs and PG Diplomas for accepting competency mapping. Thus we can understand
that irrespective of the qualification the HR professionals, they accept the high impact on
performance appraisal. Since the calculated value (0.125) is less than the tabulated value
(3.841), there is no statistical significance between education and performance appraisal.

55
Table No: 9
Age vs. Competency Mapping’s contribution to Performance Appraisal
Age (in years)
Contribution to Performance Appraisal
Total High Low
Below 30
38
(95)
2
(5)
40
(100)
Above 30
15
(75)
5
(25)
20
(100)
Total
53 (88)
7
(12)
60
(100) Chi-square value – 4.73 Significant at 0.05 level (With Yates correction) Degree of freedom – 1
The above table illustrates the relationship between the age of the respondents and the
impact on Performance Appraisal. The age is grouped as, ‘below 30 years’ and ‘above 30
years’. In the ‘below 30 years’ group almost all the respondents (95%) have agreed that
competency mapping contributes significantly to Performance Appraisal. In the ‘above
30 years’ group only three fourth (75%) of the respondents have put a positive note on
competency mapping. There is a notable difference (20%) in both the categories, though
they have agreed on competency mapping. In below 30 years group 5% of the
respondents says it has less impact on competency mapping. The other group, one fourth
of the respondents (25%) feel that it has less impact on the Performance Appraisal.

56
Thus we can conclude that professionals under the age 30 strongly agree on the
competency mapping to the performance appraisal.Since the calculated value (4.73) is
less than the tabulated value (3.841), there is statistical significance between age and
performance appraisal.

57
Table No: 10
Experience vs. Competency Mapping’s contribution to Performance Appraisal
Experience
Contribution to Performance Appraisal
Total High Low
Below 5 yrs
33
(92)
3
(8)
36
(100)
5 yrs and above
20
(83)
4
(17)
24
(100)
Total
53
(88)
7
(12)
60
(100) Chi-square value – 0.970 Not significant at 0.05 level Degree of freedom - 1
The table relates between the years of experience and the impact of competency mapping
on Performance Appraisal. Almost all of them have said that competency mapping has
high impact on Performance Appraisal. In the 6 years and above group more than three
fourths of the respondents (83%) have agreed on the impact and the remaining (17%)
hasn’t agreed on it. Nearly less than one tenth of the respondents (8%) in the below 5
years group have said that it has less impact on Performance Appraisal. Almost all the
respondents (92%) in this age group have agreed on the impact on it.Thus we can
conclude that HR professionals under 5 years of experience are expressing that
competency mapping has high impact on performance appraisal.Since the calculated
value (0.33) is less than the tabulated value (3.841), there is no statistical significance
between experience and performance appraisal.

58
Table No: 11
Factors of Competency Mapping and level of influence on Performance Appraisal
Factors
Strongly Agree
Agree Disagree Strongly Disagree
Total
Employee Acceptance
5 (8)
37 (62)
18 (30)
- 60 (100)
Fair Assessment
10 (17)
41 (68)
8 (13)
1 (2)
60 (100)
Specific Feedback
5 (8)
52 (87)
2 (3)
1 (2)
60 (100)
Reward management
4 (7)
47 (79)
7 (12)
1 (2)
60 (100)
Future Roles 8 (13)
49 (82)
3 (5)
- 60 (100)
Behavioral Interviewing
2 (3)
57 (95)
1 (2
- 60 (100)
Customized training needs
5 (8)
50 (84)
5 (8)
- 60 (100)
Employee Acceptance
The table elucidates the entire competency mapping factors, which are creating impact in
the performance appraisal. Almost all the respondents have responded that it is the fair
and transparent way of performance appraisal. Vast majority (70%) of the respondents
have said that competency based performance appraisal among employees is possible.
Little less than one third (30%) of the respondents have stated that it is not accepted
amidst employees.
Fair and Transparent Assessment
Most of the respondents (85%) have expressed that competency mapping in the appraisal
process ensures fairness and transparency. In that nearly one fifth of the respondents
(17%) have strongly agreed to that. More than one tenth (15%) of the respondents have

59
stated that it is does not constitute to any fairness in the process. Specific feedback and
Better reward Management
Almost all the respondents (95%) feel that competencies in the appraisal process will
ensure on specific feedback on performance expectations and on competency building
and development. Most of the respondents (86%) feel that it will facilitate better reward
management through appraisal process. More than one fifth (14%) of the respondents are
not agreeing that competencies will facilitate in the reward management.
Identifying future roles
Almost all of them (95%) have accepted that competencies in the appraisal process will
definitely pave the way for identifying the competencies required for the future roles. In
that less than one tenth (8%) of them have strongly agreed to that. And leery less than one
tenth of them (5%) are not for it.
Behavioral interviewing and Ascertaining customized training needs
Almost all of respondents (98%) felt that behavioral interviewing is an important link
between competency mapping and performance appraisal. Almost all the (98%)
respondents expressed that customized training needs can be ascertained. In that little
less than one tenth (8%) of them, strongly agreed to it. And remaining (8%) says that it is
not possible to ascertain the customized training needs through competency-based
appraisal.

60
Thus we can infer that almost all the respondents feel that competency mapping
contributes on deriving specific performance expectations from the employees.
Respondents also feel that competencies for future roles can be ascertained from the
competencies in the performance appraisal.

61
Table No: 12
Competency Mapping’s role in Selection and Hiring process
Level
No of respondents
Percentage
Low
19 32
High
41 68
Total
60 100
This table illustrates the overall impact of competency mapping on hiring and selection
practices.
This table is derived by using eight competency factors, which will influence the hiring
and selection process.
It represents that more than two third (68%) of the respondents have said that it has high
impact on hiring and selection practice. Less than one third (32%) of the respondents say,
it has low impact on selection.
Thus we can infer that more than two thirds of the respondents feel that competency
mapping has high impact in the selection process.

62
Table No: 13
Designation vs. Competency Mapping’s role in Selection and Hiring
Designation
Contribution to Selection
Total High Low
Executives
29
(66)
15
(34)
44
(100)
Managers
12
(75)
4
(25)
16
(100)
Total
41 (68)
19
(31)
60
(100) Chi-square value – 0.141 Not significant at 0.05 level Degree of freedom - 1 This table relates between the designation of the respondents and their views on
competency mapping in selection. Nearly two thirds (66%) of the executives feel that it
has high impact on selection process and remaining one third (34%) of the respondents
feel that competencies does not play a vital role in the selection process.
In the managers level, three fourth (75%) of the respondents feel that it has high impact
on selection and one fourth (25%) of them feel it has created less impact.
Thus we can infer that mangers feel that competencies in the selection creates high
impact on selection
Since the calculated value (0.141) is less than the tabulated value (3.841), there is no
statistical significance between designation and selection.

63
Table No: 14
Education vs. Competency Mapping’s role in Selection and Hiring
Education
Contribution to Selection
Total High Low
MSW
24
(69)
11
(31)
35
(100)
MBA
17
(68)
8
(32)
25
(100)
Total
41 (68)
19
(32)
60
(100) Chi-square value – 0.002 Not Significant at 0.05 level Degree of freedom - 1
This table relates education of the respondents and selection process. In both the
categories of Masters of Social Work and Masters in Business Administration, more than
two third (69%{MSW}, 68%{MBA}) of the respondents have said that it has high
impact on hiring and selection process.
Less than one third (31%{MSW}, 32%MBA}) of the respondents in both the categories
say it has less impact on selection.
Thus we can conclude that irrespective of the qualification the professionals have agreed
the high impact of the competency mapping in the performance appraisal.
Since the calculated value (0.002) is less than the tabulated value (3.841), there is no
statistical significance between education and selection.
64
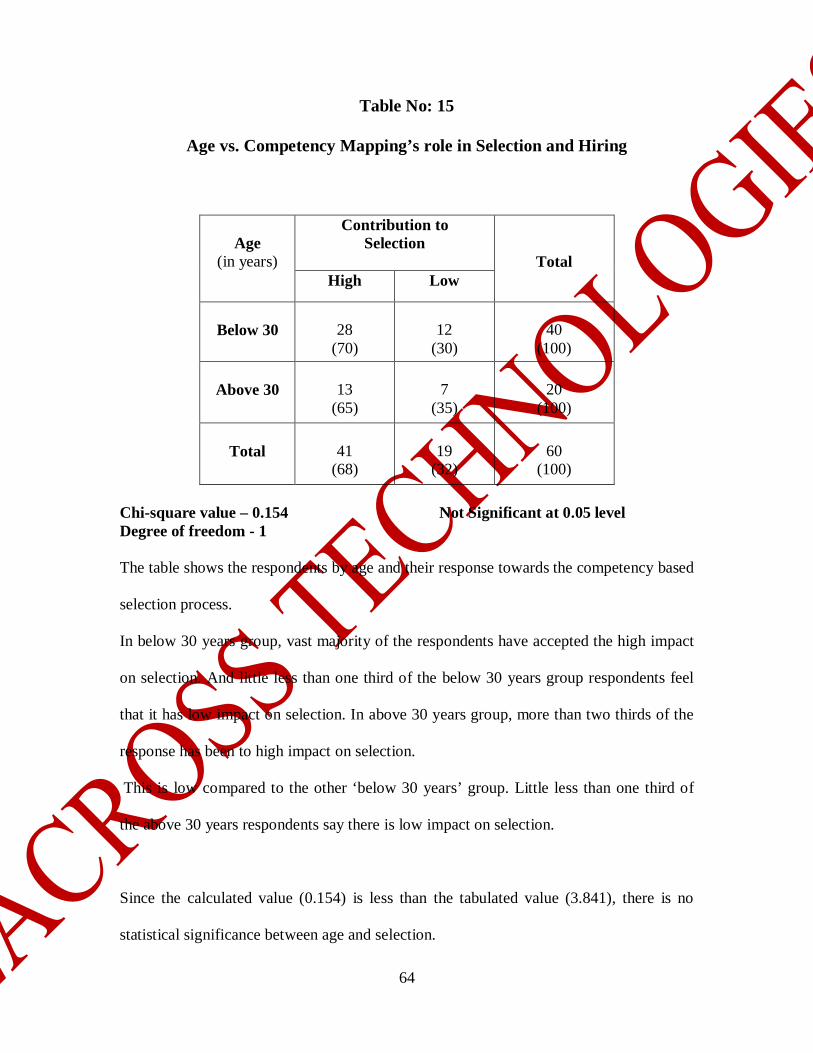
Table No: 15
Age vs. Competency Mapping’s role in Selection and Hiring
Age
(in years)
Contribution to Selection
Total High Low
Below 30
28
(70)
12
(30)
40
(100)
Above 30
13
(65)
7
(35)
20
(100)
Total
41 (68)
19
(32)
60
(100) Chi-square value – 0.154 Not Significant at 0.05 level Degree of freedom - 1 The table shows the respondents by age and their response towards the competency based
selection process.
In below 30 years group, vast majority of the respondents have accepted the high impact
on selection. And little less than one third of the below 30 years group respondents feel
that it has low impact on selection. In above 30 years group, more than two thirds of the
response has been to high impact on selection.
This is low compared to the other ‘below 30 years’ group. Little less than one third of
the above 30 years respondents say there is low impact on selection.
Since the calculated value (0.154) is less than the tabulated value (3.841), there is no
statistical significance between age and selection.

65
Table No: 16
Experience vs. Competency Mapping’s role in Selection and Hiring
Experience
Contribution to Selection
Total High Low
Below 5 yrs
25
(69)
11
(31)
36
(100)
5 yrs and above
16
(67)
8
(33)
24
(100)
Total
41
(68)
19
(32)
60
(100) Chi-square value – 0.051 Not Significant at 0.05 level Degree of freedom - 1
The table demonstrates the relationship between the experience of the respondents and
their opinion on competency based selection.
More than two thirds of the respondents in the below 5 years group feel that it has high
impact on selection process. Little less than one third of the respondents in the same
group feel that it has less impact on the selection. Nearly two thirds of the respondents in
the above 5 years group feel that it has less impact on the selection process.
One third of the respondents in the same group responded that it has low impact on the
selection process.
Since the calculated value (0.051) is less than the tabulated value (3.841), there is no
statistical significance between experience and selection.

66
Table No: 17
Factors of Competency Mapping which are influencing
Selection and Hiring process.
Factors
Strongly Agree
Agree Disagree Total
Effective than traditional method
18 (30)
42 (70)
- 60 (100)
Defines organizations’ expectations
15 (25)
37 (62)
8 (13)
60 (100)
Determination of role and job fit
8 (13)
43 (72)
9 (15)
60 (100)
Paying capacity & competencies
1 (2)
46 (76)
13 (22)
60 (100)
Competency and recruitment cost
1 (2)
48 (80)
11 (18)
60 (100)
Reduction in recruitment cost
4 (7)
55 (91)
1 (2)
60 (100)
Competency Benchmarking
3 (5)
57 (95)
- 60 (100)
The table elucidates each competency factor, which contributes to the hiring and
selection process.
Effective than the traditional method of selection & defining expectations
All the respondents (100%) feel that competency based selection is better than the
traditional method of selection and there is no opposite view on this.

67
Most of them (87%) feel that competency in the selection process defines the
expectations of the organizations clearly. Remaining (13%) of the respondents feel that it
does not define any expectation of the organization.
Determination of role and job fit
More than one tenth (13%) of the respondents feel that determination of role and job fit
is not possible through competency-based selection.
Balancing organizations paying capacity, recruitment cost and competencies
More than three fourth (78%) of them feel that there should be a balance between the
paying capacity and the competencies expected. Less than one fifth (22%) of the
respondents feel that there need not be a balance between the recruitment cost and the
expected competencies.
Reduction in training cost
Almost all of them (98%) feel that will be reduction in training cost through competency-
based selection.

68
Table No: 18
Competency Mapping and significance of anticipating future competencies
Level
No of respondents
Percentage
Low
13 22
High
47 78
Total
60 100
The table corresponds to the anticipation of competencies required for future. This data
relates to the significance of the anticipating and managing future competencies.
More than three fourth of the respondents feel that it is important to anticipate the future
competencies. More than one fifth of them feel that it has less significance to forecast
competencies required for future.
Thus we can infer that more than three fourth of the respondents (78%) feel that
competencies play an important role and creates high impact on the selection process.
69
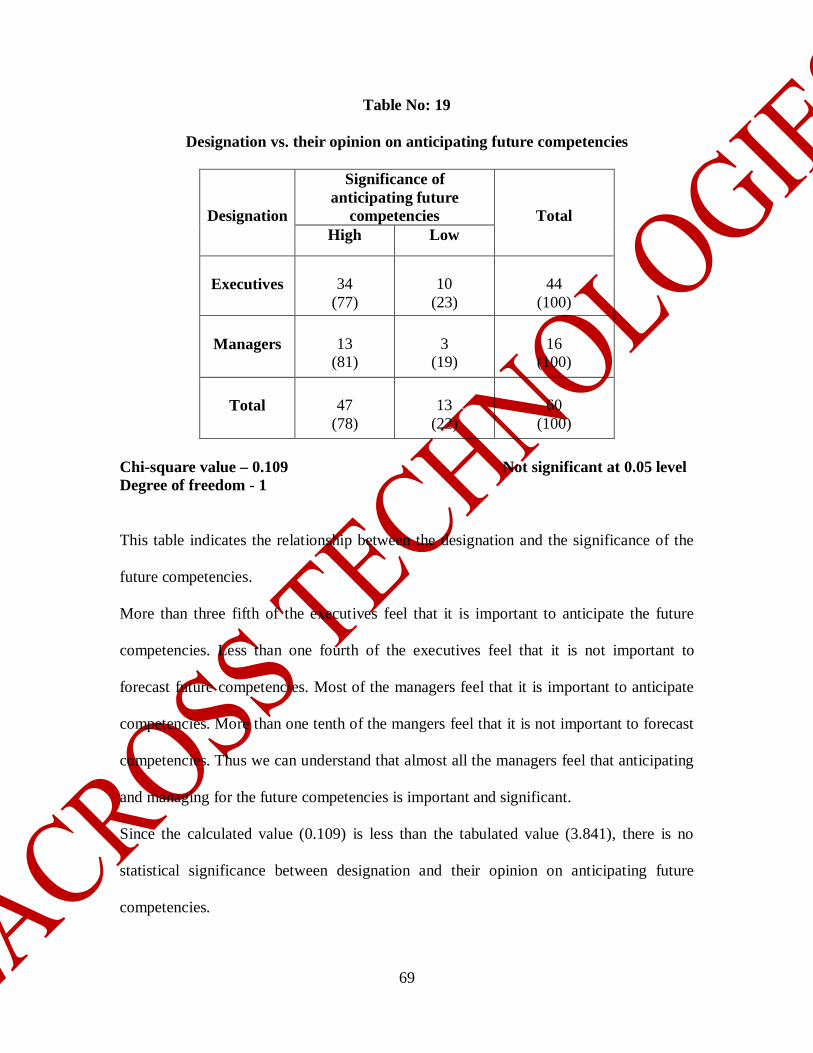
Table No: 19
Designation vs. their opinion on anticipating future competencies
Designation
Significance of anticipating future
competencies
Total High Low
Executives
34
(77)
10
(23)
44
(100)
Managers
13
(81)
3
(19)
16
(100)
Total
47 (78)
13
(22)
60
(100) Chi-square value – 0.109 Not significant at 0.05 level Degree of freedom - 1 This table indicates the relationship between the designation and the significance of the
future competencies.
More than three fifth of the executives feel that it is important to anticipate the future
competencies. Less than one fourth of the executives feel that it is not important to
forecast future competencies. Most of the managers feel that it is important to anticipate
competencies. More than one tenth of the mangers feel that it is not important to forecast
competencies. Thus we can understand that almost all the managers feel that anticipating
and managing for the future competencies is important and significant.
Since the calculated value (0.109) is less than the tabulated value (3.841), there is no
statistical significance between designation and their opinion on anticipating future
competencies.

70
Table No: 20
Education vs. their opinion on anticipating future competencies
Education
Significance of anticipating future
competencies
Total High Low
MSW
28
(80)
7
(20)
35
(100)
MBA
19
(76)
6
(24)
25
(100)
Total
47 (78)
13
(22)
60
(100) Chi-square value – 0.137 Not Significant at 0.05 level Degree of freedom - 1
This table relates the education and the respondents’ views on the future competencies.
Most of the MSW feel that the anticipating the competencies is important. And one fifth
(20%) of them feel that it is not important. More than three fourth (76%) of the MBAs
feel that it is significant to work on future competencies. Less than one fourth (22%) of
the MBAs say that it is not important to work on competencies. Thus we can infer that
almost all the respondents’ express that anticipating and managing competencies is
significant. Since the calculated value (0.137) is less than the tabulated value (3.841),
there is no statistical significance between education and anticipating future
competencies.

71
Table No: 21
Age vs. their opinion on anticipating future competencies
Age
(in years)
Significance of anticipating future
competencies
Total High
Low
Below 30
33
(83)
7
(17)
40
(100)
Above 30
14
(70)
6
(30)
20
(100)
Total
47 (78)
13
(22)
60
(100) Chi-square value – 1.227 Significant at 0.05 level Degree of freedom – 1 The table represents the age and the views of respondents on future competencies.
Most of them (83%) in the age group below 30 years feel that the forecasting
competencies are important. Less than one fifth (17%) of them feel that it is not important
to work on future competencies.
Vast majority (70%) of the above 30 years group feel that it is vital to work on
competencies, which are required for the future. Little less than the one third (30%) of
them feels that it is not vital to work on future competencies.

72
Thus we can conclude that respondents below 30 years say that anticipating and
managing future competencies are important.
Since the calculated value (1.227) is more than the tabulated value (3.841), there is
statistical significance between age and their opinion on anticipating future competencies.
.

73
Table No: 22
Experience vs. their opinion on anticipating future competencies
Experience
Significance of anticipating future
competencies
Total High Low
Below 5 yrs
30
(83)
6
(17)
36
(100)
5 yrs and above
17
(71)
7
(29)
24
(100)
Total
47
(78)
13
(22)
60
(100) Chi-square value – 1.326 Not Significant at 0.05 level Degree of freedom - 1
This table relates the experience and the significance of the future competencies. In the
category of below 5 years, most of them (83%) state that there should be high importance
given to future competencies. Less than one fifth (17%) of them feel that future
competencies are of low importance.
Vast majority (71%) in 5 years and above express that future competencies are vital to be
worked on. Little less than one third (29%) of them feel that it is not important.
Since the calculated value (1.326) is more than the tabulated value (3.841), there is
statistical significance between experience and their opinion on anticipating future
competencies.

74
Table No: 23
Opinion of HR professionals on anticipating and managing the future competencies
Factors
Strongly
Agree
Agree
Disagree
Total
Importance of anticipating competencies
15 (25)
36 (60)
9 (15)
60 (100)
Managing the speed of changing competencies
2 (3)
51 (85)
7 (12)
60 (100)
Succession Planning
1 (2)
56 (93)
3 (5)
60 (100)
Investing time for forecasting competencies
2 (3)
54 (90)
4 (7)
60 (100)
Contingency plan for mishap in forecasting competencies
- 55 (92)
5 (8)
60 (100)
The table illustrates the wholesome views of the respondents in anticipating, managing
the speed of changing competencies, future competencies and succession planning and
time investment for forecasting competencies.
Importance of Anticipating Competencies
Most of the respondents (85%) state that it is important to anticipate to future
competencies. In that 5% of them strongly agree that anticipating competencies for the
future is important. Only less than one fifth (15%) of the respondents say it is not
important to work on future competencies.

75
Managing the speed of changing competencies
Similarly most of the respondents (88%) were there for managing the speed and
preparing the contingency plan for mishap in forecasting the competencies. More than
one tenth (12%) of the respondents disagree to the fact that organizations can’t manage
the speed of changing competencies.
Succession planning and investing adequate time for forecasting competencies
All the respondents (95%) felt that anticipating the future competencies will ensure
succession-planning process. Again almost all the respondents (93%) feel that adequate
time has to be invested for forecasting the future competencies. Less than one tenth (7%)
of the respondents feel that it is not vital to invest time in forecasting the competencies.
Handling mishaps in forecasting competencies
Almost all the respondents (92%) feel that the organization should be prepared with the
contingency plan for handling the mishap in forecasting competencies.

76
Table No: 24
Signifying the overall impact of competency mapping on the HR Deliverables
Deliverables
Level of Contribution
Total
High
Low
Performance Appraisal
53 (88)
7 (12)
60 (100)
Selection
41 (68)
19 (32)
60 (100)
Future Business Needs
47 (78)
13 (22)
60 (100)
The table consolidates the overall impact competency mapping on the HR Deliverables.
It states the level of contribution or the role it plays in the deliverable. According to the
respondents, almost all of them (88%) express that competency mapping contributes
more to the performance appraisal process.
More than two thirds (68%) of the respondents feel that it contributes to the selection
process. Remaining (32%) respondents feel that competencies contribute less to the
selection and hiring process

77
More than three fourth (78%) of the respondents say that it is important to work on future
competencies and be prepared to manage them.
Thus we can infer that competency mapping has high impact on the HR deliverables i.e.
Performance Appraisal and Selection. We can also understand that anticipating and
managing future competencies is very significant.

78
CHAPTER – IV
FINDINGS, CONCLUSION & SUGGESTIONS

79
4.1 FINDINGS
Findings and Conclusion refer to the final outcome of the entire study the researcher has
mentioned the end result of the study. These findings are remarks taken from the analysis
and interpretation of the collected data.
Personal profile of the Respondents
Vast majority of the respondents were executives and remaining are managers. All the
respondents were young and none of the respondent fell in the middle age.
More than half of the respondents were Masters in Social Work specializing in Human
Resources and more than two fifths of the respondents were Masters in Business
Administration.
Ø Vast majority of the respondents had less than five years of experience and little
less than one-third of the respondents had more than five tears of experience.
Methods of Competency Mapping
Ø The respondents stated that Behavioral interviewing and focus group discussions
are the widespread techniques in the competency mapping. Questionnaires are
used by less than one fourth of the respondents.

80
Competency Mapping and Performance Appraisal
Ø Almost all the respondents have expressed their opinion that competency mapping
has high impact on the performance appraisal process. There were very few
respondents who felt that it has low impact on performance appraisal process.
Ø The personal profile of the respondents shows that executives feel that
competencies have high impact on the appraisal process. It also denotes that
irrespective of the qualification, respondents felt that competency mapping has
high impact on appraisal process. As aforesaid, in the age category respondents
below 30 years feel that competency mapping has a high impact on the appraisal
process. There is a large difference between the acceptances of the high level
impact between the age categories.
Ø Most of the respondents feel that competency mapping in performance appraisal
will ensure specific feedback on performance expectations. Similar response was
for competency’s contribution to mapping competencies for future roles. Theses
two factors contribute greatly to the performance appraisal.
Ø The majority of the respondents felt competency mapping has low impact because
of the employees’ acceptance for competency based performance appraisal
process and for the appraisee’s response about the fairness and transparency in
competency based performance appraisal.

81
Competency Mapping and Selection
Ø Majority of the respondents opine that competency mapping plays a significant
role in the selection and hiring process and has high impact on the deliverable.
Ø In the designation category, managers express that competency mapping has high
level of impact on the selection and hiring process. Both the postgraduates in the
Social Work and Business Administration agree that competency based selection
and hiring has high impact. In the age category respondents below 30 years say
that competency has high impact on the selection and hiring process. Less
experienced professionals feel that competency mapping has high impact on the
appraisal.
Ø The two factors, which contribute most to the selection process, are, reduction in
training cost and competency mappings’ role in defining the organisations
performance expectations.
Ø Determination of role and job fit and balance of the competency and recruitment
cost are the two factors, which contributes less to the competency based selection
and hiring process.

82
Future Competencies
Ø Most of the respondents feel that anticipating and managing competencies is vital
for organisations.
Ø At the same time, it is interesting to note that managers feel that it is more
important to anticipate and manage competencies in the future. Masters in Social
Work (MSW) feel that more importance should be given to future competencies.
There is a considerable level of difference in the age category for importance for
the future competencies. Respondents below the age group of 30 feel that it is
very important to anticipate, mange and invest time for future competencies. In
experience category, less experienced professionals are showing more importance
to future competencies compared to the more experienced. Therefore in the
personal profile it denotes that young professionals show more importance in
anticipating and managing future competencies.
Ø The two most important opinion factors, which gave significance on future
competencies, are, one, future competencies will ensure in better succession
planning process and investing adequate time in forecasting competencies. These
two factors gave high importance to future competencies.
Ø Importance of future competencies was low because of the factor that
organisations cannot change according to the speed of the changing competencies.
83
Few respondents also felt that organisations need not give much importance for
forecasting competencies.
Ø As an overall comparison of the three variables – Performance Appraisal,
Selection and Hiring process and Future Competencies, Competency
Mapping contributes to all the three variables. In particular, competency mapping
contributes significantly to performance appraisal. To the contrary, the level of
employee acceptance level was low for competency based performance appraisal.
The opinion on future competencies depicts that respondents are for anticipating
and managing competencies are important for organisations. However, there is a
very low response on the importance for anticipating competencies. The
competency based selection and hiring process comparatively gains less
significance. There was unanimous response that Competency based selection and
hiring is effective than the traditional method of selection.
4.2 Conclusion
The study shows that competency based HR practices are gaining momentum in the
field and the profession. The contradictions in certain areas of the findings depicts
the dynamics of the evolving models of competency mapping. For example, the
acceptance of the competency based appraisal is very low, but the overall
contribution is the highest in the performance appraisal. Like that in selection process
the acceptance of the competency based selection .

84
4.3 Suggestions
The researcher has put forward his ideas that can be applied in order to increase the
contribution of Competency Mapping in the HR deliverables. Some of the key
suggestions that have been recommended are as follows:
Ø The HR should create different ways to increase the level of acceptance for
competency based performance appraisal.
Ø The HR should show the fairness and transparency in the competency based
performance appraisal.
Ø The organizations should define their organizations’ expectations clearly through
the deployment of competencies in the selection process.
Ø The HR should determine the role and the job fit using the competencies.
Ø The HR should create the awareness and importance of anticipating the
competencies required for the future.
Ø The HR should convey the importance of investing time in forecasting the future
competencies to the senior management.

85
APPENDIX - I
QUESTIONNAIRE

86
A Study on Competency Mapping and its impact on the HR Deliverables
About Yourself:
Designation: Age:
Education: Years of Experience:
1. Please üthe method(s) of Competency Mapping used in your Organization.
Methods
Focus Group Discussions
Inventories & Questionnaires
Behavioral Interviews
Diaries & Work logs
Repertory Grid
Observation
Psychological Testing
Others (Specify)
Competency Mapping and Performance Appraisal
2. Competency based Performance Management System (PMS) has level of acceptance
among employees.
o Strongly Agree o Agree o Disagree o Strongly Disagree
3. Competency based PMS facilitates fair, objective and transparent assessment.

87
o Strongly Agree o Agree o Disagree o Strongly Disagree
4. Competency based PMS helps to establish specific feedback on performance
expectations for competencies.
o Strongly Agree o Agree o Disagree o Strongly Disagree
5. Competency based PMS facilitates better reward management strategies.
o Strongly Agree o Agree o Disagree o Strongly Disagree
6. Building competencies for future roles are effective through Competency based PMS.
o Strongly Agree o Agree o Disagree o Strongly Disagree
7. Behavioral interviewing directly links performance appraisal and competency
mapping.
o Strongly Agree o Agree o Disagree o Strongly Disagree
8. Customized training needs can be ascertained from competency based PMS.
o Strongly Agree o Agree o Disagree o Strongly Disagree
Competency Mapping and Selection
9. Competency based selection is much more effective than the traditional method of
selection.
o Strongly Agree o Agree o Disagree o Strongly Disagree
10. Competency mapping defines and communicates the organizations expectations
clearly.
o Strongly Agree o Agree o Disagree o Strongly Disagree
11. Roles and Job fit are determined through Competency based Selection.
o Strongly Agree o Agree o Disagree o Strongly Disagree

88
12. Competency mapping balances the organizations paying capacity and the expected
competencies.
o Strongly Agree o Agree o Disagree o Strongly Disagree
13. There should be congruence between the competency and the recruitment cost.
o Strongly Agree o Agree o Disagree o Strongly Disagree
14. Competency based selection increases the likehood of hiring people who fit the
organization.
o Strongly Agree o Agree o Disagree o Strongly Disagree
15. Competency mapping ensures reduction in the training cost.
o Strongly Agree o Agree o Disagree o Strongly Disagree
16. Competency benchmarking is possible in the selection process.
o Strongly Agree o Agree o Disagree o Strongly Disagree
Competency Mapping and Future Business Needs
17. It is important for an organization to anticipate the future competencies required for
the employees.
o Strongly Agree o Agree o Disagree o Strongly Disagree
18. The organization can manage the speed in which the required competencies are
changing.
o Strongly Agree o Agree o Disagree o Strongly Disagree
19. Anticipating the future competencies will facilitate in the succession planning
process.
o Strongly Agree o Agree o Disagree o Strongly Disagree

89
20. The management can invest substantial time for forecasting competencies.
o Strongly Agree o Agree o Disagree o Strongly Disagree
21. Organization is prepared with the contingency plan to meet out any mishap in
predicting the future competencies.
o Strongly Agree o Agree o Disagree o Strongly Disagree

90
BIBLIOGRAPHY
1. Richard. E. Boyatzis, “ The Competent Manager”
John Wiley & Sons Publisher : 1982
2. Hester. Chic, “A model for effective performance”
John Wiley & Sons Publisher : 1991
3. “Competency”. Vol. 4, No. 1, autumn 1996.
Annual survey of competency frameworks.
4. G. 0. Jnr .KLEMP “The Assessment of Occupational Competence”.
Report to the National Institute of Education, Washington, DC : 1980
5. “The Management Charter Initiative”
Introducing Management Standards, London, MCI : 1992
6. Jonathan Winterton & Ruth Winterton – Routeledge “Developing Managerial
Competence”.
London, New York : 1996
7. Dawson. Ross. "Developing knowledge-based client relationships.
www.mhhe.com : 2000
8. Argyris, Chris. “Skilled Incompetence”.
Harvard Business Review Article : 1986
9. Sanghi , Seema. “The Handbook of Competency Mapping”.
The Response Books : 2004