a study on cost-benefit analysis of fibre-optic co ......a study on cost-benefit analysis of...
TRANSCRIPT

A Study on Cost-Benefit
Analysis of Fibre-Optic
Co-Deployment with the
Asian Highway Connectivity
Asia-Pacific Information Superhighway (AP-IS)
Working Paper Series

2
The Economic and Social Commission for Asia and the Pacific (ESCAP) serves as the United Nations’ regional hub promoting cooperation among countries to achieve inclusive and sustainable development. The largest regional intergovernmental platform with 53 member States and 9 associate members, ESCAP has emerged as a strong regional think tank offering countries sound analytical products that shed insight into the evolving economic, social and environmental dynamics of the region. The Commission’s strategic focus is to deliver on the 2030 Agenda for Sustainable Development, which it does by reinforcing and deepening regional cooperation and integration to advance connectivity, financial cooperation and market integration. ESCAP’s research and analysis coupled with its policy advisory services, capacity building and technical assistance to governments aim to support countries’ sustainable and inclusive development ambitions.
Disclaimer: The Asia-Pacific Information Superhighway (AP-IS) Working Papers provide policy-relevant analysis on regional trends and challenges in support of the development of the Asia-Pacific Information Superhighway (AP-IS) and inclusive development. The findings should not be reported as representing the views of the United Nations. The views expressed herein are those of the authors, and do not necessarily reflect the views of the United Nations. This working paper has been issued without formal editing, and the designations employed and material presented do not imply the expression of any opinion whatsoever on the part of the Secretariat of the United Nations concerning the legal status of any country, territory, city or area, or of its authorities, or concerning the delimitation of its frontiers or boundaries. Correspondence concerning this working paper should be addressed to the email: [email protected].
Contact: ICT and Development Section Information and Communications Technology and Disaster Risk Reduction Division United Nations Economic and Social Commission for Asia and the Pacific United Nations Building Rajadamnern Nok Avenue Bangkok 10200, Thailand Email: [email protected]
The shaded areas of the map indicate ESCAP members and associate members.

3
Acknowledgements
This Working Paper was prepared by the National Information Society Agency and Korea
Telecom of the Republic of Korea.
Substantive comments were provided by Atsuko Okuda, Dongjung Lee and Siope Vakataki
‘Ofa of the Information and Communications Technology and Development Section under the
guidance of Tiziana Bonapace, Director, Information and Communications Technology and
Disaster Risk Reduction Division of the United Nations Economic and Social Commission for
Asia and the Pacific (ESCAP). The report benefited from substantive comments from Ishtiaque
Ahmed, Transport Division, Hong Joo Hahm, Deputy Executive Secretary for Programmes and
Kaveh Zahedi, Deputy Executive Secretary for Sustainable Development of ESCAP.
Tarnkamon Chantarawat and Sakollerd Limkriangkrai provided administrative support and
other necessary assistance for the issuance of this paper.
April 2018
The cover:
Image source: Tarnkamon Chantarawat

4
Table of Contents
Acknowledgements ................................................................................................................................ 3
List of Figures .......................................................................................................................................... 7
List of Tables ........................................................................................................................................... 8
Abbreviations and Acronyms ................................................................................................................. 9
Executive Summary .............................................................................................................................. 10
1. Introduction .................................................................................................................................. 12
1.1 Background .............................................................................................................................. 12
1.2 Project Scope ........................................................................................................................... 13
2. Methodology ................................................................................................................................ 13
2.1 Target Country Selection ......................................................................................................... 14
2.2 Prerequisite Study ................................................................................................................... 14
2.3 Calculation ............................................................................................................................... 14
2.4 Generalization ......................................................................................................................... 14
3. Definitions and Scope ................................................................................................................... 15
3.1 Co-Deployment ....................................................................................................................... 15
3.2 Utility Corridor ........................................................................................................................ 15
3.3 Comparative Study .................................................................................................................. 15
3.3.1 Comparative Study Case 1 ............................................................................................. 16
3.3.2 Comparative Study Case 2 ............................................................................................. 16
4. Prerequisite Study Results ............................................................................................................ 17
4.1 Country Information ............................................................................................................... 17
4.2 Highway Status ........................................................................................................................ 18
4.2.1 Number of Lanes and Width of Road Shoulders ........................................................... 20
4.2.2 Geographical and Geological Features .......................................................................... 20
4.2.3 Pavement Material ........................................................................................................ 20
4.3 Infrastructure Status ............................................................................................................... 21

5
4.3.1 Technical Requirements for Ducts ................................................................................. 21
4.3.2 Number of Ducts ........................................................................................................... 21
4.3.3 Manholes/Handholes .................................................................................................... 22
4.3.4 FOC (Number of Cores) .................................................................................................. 22
4.4 Material Specifications ........................................................................................................... 22
4.4.1 Duct Type ....................................................................................................................... 22
4.4.2 Manhole Type ................................................................................................................ 22
4.4.3 FOC Type ........................................................................................................................ 23
4.5 Unit Cost .................................................................................................................................. 23
5. Cost Estimation ................................................................................................................................. 25
5.1 Analysis of Cost Estimation ..................................................................................................... 25
5.1.1 Separated Deployment Cost Estimation ........................................................................ 25
5.1.2 Co-Deployment Cost Estimation for Two-Way Duct ...................................................... 27
5.1.3 Co-Deployment Cost Estimation for Four-Way Duct ..................................................... 29
5.2 Comparative Study Case ......................................................................................................... 30
5.2.1 Comparative Study Case 1 ............................................................................................. 30
5.2.2 Comparative Study Case 2 ............................................................................................. 31
5.3 Generalized Comparison Results using GDP per Capita based on PPP ................................. 32
6. Pros and Cons of Co-Deployment .................................................................................................... 34
6.1 Co-Deployment Stakeholders ................................................................................................. 34
6.1.1 Road Sector .................................................................................................................... 34
6.1.2 Telecommunication Sector ............................................................................................ 35
6.1.3 Government ................................................................................................................... 36
6.2 Issue Handling Model and Practice ........................................................................................ 37
6.2.1 Cross-Sectoral Cooperation for Co-Deployment ........................................................... 38
6.2.2 Cross-Sectoral Network Facility Sharing ........................................................................ 38
6.2.3 Rights of Way Concerning Civil Works ........................................................................... 38
6.2.1 Republic of Korea Case .................................................................................................. 39

6
6.2.2 European Union Case .................................................................................................... 43
6.3 Construction Cost Compensation ........................................................................................... 45
6.3.1 Rent and Lease............................................................................................................... 46
7. Case Study of Utility Corridors Construction Standards ................................................................. 48
7.1 Construction Standards........................................................................................................... 48
7.1.1 Civil Work Construction Method ................................................................................... 49
7.1.2 FOC Construction Method ............................................................................................. 56

7
List of Figures
Figure 1-1: Strategic initiatives of the AP-IS Master Plan Figure 2-1: Methodology for the cost-benefit analysis Figure 3-1: Comparative study case 1 Figure 3-2: Comparative study case 2 Figure 4-1: Asian Highway routes in Myanmar Figure 4-2: Network infrastructure expansion routes in Myanmar Figure 4-3: Trench specifications in Myanmar Figure 4-4: Two-way duct deployment recommendation in Myanmar Figure 4-5: Distance between manholes/handholes in Myanmar Figure 5-1: Summary of comparative study case 1 results Figure 5-2: Summary of comparative study case 2 results Figure 6-1: The impact of different ICTs by income group Figure 6-2: Relationship diagram among sectors in network facility sharing Figure 7-1: Civil work sequence diagram Figure 7-2: Trench excavation drawing Figure 7-3: Images of trench excavation and backfilling Figure 7-4: Bridge attachment Figure 7-5: U-clamp and bolt details Figure 7-6: Images of site-cast concrete manhole construction Figure 7-7: Manhole pit foundation work Figure 7-8: Manhole top slab and cover Figure 7-9: Cross sections of a manhole Figure 7-10: Handhole pit foundation work Figure 7-11: Handhole top slab Figure 7-12: Cross sections of a handhole Figure 7-13: Concrete marking post Figure 7-14: FOC sequence diagram Figure 7-15: FOC arrangement in manholes Figure 7-16: FOC joint closure installation procedure Figure 7-17: FOC splicing loss measurement

8
List of Tables
Table 3-1: Overview of the comparative study cases Table 4-1: Data survey items Table 4-2: Key information on CLMV countries Table 4-3: Asian Highway route status in Myanmar Table 4-4: Asian Highway classification Table 4-5: Highway unit cost Table 4-6: Highway unit cost applied by inflation rate Table 4-7: Telecommunication duct and FOC unit cost Table 4-8: Highway construction cost applied by inflation rate Table 5-1: Cost estimation for separated deployment of two-way duct per kilometre Table 5-2: Cost estimation for separated deployment of two-way FOC per kilometre Table 5-3: Cost estimation for co-deployment of two-way duct per kilometre Table 5-4: Cost estimation for co-deployment of four-way duct per kilometre Table 5-5: Cost estimation for co-deployment of four-way FOC per kilometre Table 5-6: GDP per capita based on PPP for CLMV countries in 2016 Table 5-7: Generalized cost estimation for CLMV countries Table 6-1: Roles and responsibilities of stakeholders Table 6-2: Pros and cons of co-deployment for the road sector Table 6-3: Pros and cons of co-deployment for dominant telecommunication operators Table 6-4: Pros and cons of co-deployment for new entrant operators Table 6-5: Pros and cons of co-deployment for governments Table 6-6: Facilities to be provided by obligation Table 6-7: Information, procedures and deadlines for providing facilities Table 6-8: Criteria for calculating facility provision fees Table 6-9: Fee for occupancy and road use Table 6-10: Network infrastructure working lifetime Table 6-11: Pros and cons for cost-plus, profit-based and retail-minus models Table 7-1: Manhole technical specifications Table 7-2: Handhole technical specifications

9
Abbreviations and Acronyms
AH Asian Highway AP-IS Asia-Pacific Information Superhighway ASEAN Association of Southeast Asian Nations CLMV Cambodia, Lao PDR, Myanmar and Viet Nam ESCAP Economic and Social Commission for Asia and the Pacific FOC Fibre-Optic Cable GDP Gross Domestic Product GI Galvanized Iron HDPE High-Density Polyethylene ICT Information and Communications Technology IEC International Electrotechnical Commission ITU International Telecommunication Union ODF Optical Distribution Frame OTDR Optical Time-Domain Reflectometer PPP Purchasing Power Parity SCD Silicon-Coated Duct SMP Significant Market Power
10
Executive Summary
The United Nations Economic and Social Commission for Asia and the Pacific (ESCAP) Asia-Pacific
Information Superhighway (AP-IS) initiative aims to overcome these challenges and provide seamless,
affordable and effective broadband connectivity that minimizes the digital divides. In doing so, the AP-
IS initiative focuses on four pillars, namely: connectivity; Internet traffic and network management; e-
resilience; and broadband for all. In the connectivity pillar, one of the key issues recognized by ESCAP
member States in promoting fibre-optic broadband network expansion throughout the region is
infrastructure sharing.1 This includes co-deployment of fibre-optic broadband network along other
utilities infrastructures (such as roads, railways, electricity grid, and gas/oil pipelines). In May 2017,
the ESCAP Commission adopted the AP-IS Master Plan and Regional Cooperation Framework
Document. These key references outline the governance structure, stakeholders to be involved, seven
strategic initiatives under the four pillars for implementation, and cooperation framework for the
implementation of the AP-IS initiative.
This report details the cost-benefit analysis of broadband co-deployment between the
telecommunication sector and transport sector, and highlights methods for reducing time and costs in
developing a broadband infrastructure. The report offers important policy insights into the merits of
infrastructure sharing, which will assist ESCAP member countries in moving forward on regional
dialogue in this area.
As a result of the comparative study in Myanmar, the co-deployment of the broadband network
(compared with separated deployment) has been estimated to save at least USD 7,379 per kilometre,
and the percentage of cost savings has been calculated at 56.83 per cent. Most of the cost saving in
co-deployment is derived from eliminating overlapping civil works such as excavation, backfilling and
reinstatement during highway construction.
The pros and cons of co-deployment for different stakeholders have been analysed to affirm co-
deployment benefits and synergies. Results show that the telecommunication sector will benefit from
significant cost savings and avoid the duplication of civil engineering works in the deployment of a
broadband network. The road sector will have the opportunity to generate new revenues by adding a
mere 0.87 per cent investment cost to road construction. Governments can achieve economic and
social benefits by implementing a broadband infrastructure quickly and cost effectively.
To improve the mutual benefits of stakeholders, it will be necessary to coordinate cross-sector
cooperation, encourage the sharing of facilities for effective national communications resource
management, and manage rights of way concerning civil engineering works from the perspective of
establishing a broadband network that covers the entire nation.
All in all, this report has estimated the cost savings from co-deployment, compared to separated
deployment. When applied to the whole of Asia, the amount saved would be even greater. In addition,
the pros and cons among stakeholders, issue handling in selected countries, and modelling of the
investment cost compensation have been included to further demonstrate the benefits of co-
1 The ESCAP Committee on ICT and the Committee on Transport in 2014, agreed to work together to establish cross-sectoral infrastructure and encourage co-deployment of fibre-optic cables along Asian highways and railways. See ESCAP, Report of the Committee on Information and Communications Technology on its fourth session, 22 October 2014
(E/ESCAP/CICT(4)/9). Available from http://www.unescap.org/sites/default/files/Final%20Report%20E.pdf.

11
deployment and facility sharing.
In the future, further studies will be required to provide guidelines for resolving issues including
cooperation for co-deployment, network facility sharing, and the management of rights of way in
CLMV countries. In addition, it will be necessary to study detailed lease-cost estimation methods for
compensation models such as long-run incremental costing, fully-distributed costing and Hatfield
costing model2 to identify the most suitable cost compensation model for the AP-IS.
2 Hatfield model or Hatfield Cost Proxy model for telecommunication networks is one of the standard models that can be
utilized to calculate network usage costs, developed by Hatfield Association Inc. at the request of telecommunication operators.

12
1. Introduction
1.1 Background
The 2030 Agenda for Sustainable Development adopted at the United Nations Sustainable
Development Summit in September 2015 stated that, "the spread of information and communication
technology and global interconnectedness has great potential to accelerate human progress, to bridge
the digital divide and to develop knowledge societies.”3 It is now more important than ever to use
broadband to improve the quality of life of nations connected by the Asian Highway, especially since
developing countries’ efforts to bridge the digital divides in the region have been insufficient. In fact,
digital divides are widening due to limited budgets and restrictive regulations. More nations need to
fulfil their commitments to achieving the Sustainable Development Goals by providing affordable
broadband connectivity. However, there are significant challenges to providing broadband, particularly
last mile connectivity.
To improve broadband connectivity and reduce the digital divide in the Asia-Pacific region, member
countries of the United Nations Economic and Social Commission for Asia and the Pacific (ESCAP)
adopted the Asia-Pacific Information Superhighway (AP-IS) initiative at the 71st ESCAP Commission in
2015. A year later, the AP-IS Master Plan and Regional Cooperation Framework Document were
endorsed. See Figure 1-1 for an overview of the seven strategic initiatives under the four pillars of the
AP-IS Master Plan.
Figure 1-1: Strategic initiatives of the AP-IS Master Plan
In November 2016, at the Telecommunications Senior Officials Meeting, findings from a pre-
3 Official Records of the General Assembly, Seventieth Session, Agenda Items 15 and 116, Resolution Adopted on 25 September 2015 (A/RES/70/1). Available from http://www.un.org/ga/search/view_doc.asp?symbol=A/RES/70/1&Lang=E.

13
feasibility study on the AP-IS for the Association of Southeast Asian Nations (ASEAN) subregion were
discussed, and countries with limited broadband connectivity were encouraged to focus on improving
their connectivity. Subsequently in June 2017, at the Fifth Meeting of the Working Group on the Trans-
Asian Railway Network in Busan, Republic of Korea, a review on the co-deployment of fibre-optic
cables (FOCs) along with railway infrastructure to promote cross-sectoral synergies was proposed.
Similarly, the Seventh Meeting of the Working Group on the Asian Highway Network met in Bangkok
in December 2017 and requested the ESCAP secretariat to conduct a study on cross- sectoral co-
deployment between highways and ICT infrastructure. The study is expected to provide evidence that
co-deployment of FOCs along the Asian Highway leads to mutual benefits for the information and
communications technology (ICT) and transport sectors, including significant cost and time savings.
1.2 Project Scope
To contribute to improving broadband connectivity and reducing the digital divide in Cambodia, Lao
PDR, Myanmar and Viet Nam (CLMV)—since these countries have been prioritized for infrastructure
development and broadband connectivity, Korea Telecom has collaborated with the National
Information Society Agency (NIA) and ESCAP to conduct a research study on the costs and benefits of
fibre-optic co-deployment for the Asian Highway. In this study, Korea Telecom has compared separated
deployment costs and co-deployment costs.
The statement of work is as follows:
1. Conduct a cost-benefit analysis of the Asian Highway with an underground utility corridor –
• Analyse the costs and benefits using comparative studies on co-deployment and
separated deployment of highways and utility corridors, based on construction costs and
breakdown structure of the representative country; and
• Generalize the result of the representative country based on the country’s purchasing
power parity (PPP).
2. Research the pros and cons of the co-deployment of highways and utility corridors from each
stakeholder’s perspective –
• Provide issue handling models and practices between stakeholders, construction cost
compensation models, and global case studies on the advantages and disadvantages of
co-deployment.
3. Provide a case study on construction standards for utility corridors.
This report will contribute to the update of the pre-feasibility study on the AP-IS for ASEAN and
indicate a future direction to enhance regional and subregional broadband connectivity among the
ASEAN countries, in particular CLMV countries.
2. Methodology
The methodology is divided into four stages: (1) target country selection; (2) prerequisite study; (3)
calculation; and (4) generalization. See Figure 2-1 for an overview of the methodology for the cost-
benefit analysis.
Figure 2-1: Methodology for the cost-benefit analysis

14
Notes: RFP = Request for Proposal; KT = Korea Telecom
2.1 Target Country Selection
Taking into account the potential impact on co-deployment, CLMV countries have been selected for
this study based on the following criteria:
• Population;
• Size of country; and
• Broadband service price.
2.2 Prerequisite Study
A prerequisite study including data surveys of environmental features, infrastructure status,
material specifications and costs has been conducted for cost estimation. The study includes:
• Questionnaires for data gathering;
• Data surveys through request for proposal analysis, online research, review of previous
studies and Korea Telecom’s global experience; and
• Site surveys and interviews with experts.
2.3 Calculation
The data acquired from the prerequisite study has been used to:
• Break down components into civil work and FOC installation for cost estimation;
• Calculate labour and material costs for civil work per kilometre;
• Calculate labour and material costs for FOC installation per kilometre; and
• Compare costs for separated deployment and co-deployment.
2.4 Generalization
Using GDP per capita based on PPP, the results from the target country have been generalized for

15
other CLMV countries. The generalized results indicate the actual cost amount of co-deployment
according to the countries’ different GDP per capita based on PPP.
3. Definitions and Scope
3.1 Co-Deployment
Co-deployment is defined as concomitant deployment of ducts and/or FOCs during the
construction of the Asian Highway network. There are three potential FOC network types that may be
deployed along the Asian Highway:
1. Route on existing highway(s) with ducts;
2. Route on existing highway(s) without duct; and
3. Route without existing highway.
On existing highways with ducts (type 1), infrastructure sharing (access to existing ducts) and
regulating duct lease price is a potential challenge rather than co-deployment. On existing highways
without duct (type 2), aerial FOC deployment is an option that is fast and cost effective. In this case,
regulation on rights of way to deploy telecommunication pole on the road should be studied to ease
deployment. Where there is no existing highway (type 3), duct co-deployment along with highway
construction is the best solution. This study covers the third type of deployment—the construction of
highway routes.
3.2 Utility Corridor
This study defines utility corridors along the Asian Highway as underground ducts (hereinafter
“ducts”). The purpose of ducts along the Asian Highway is limited to the function of providing a
backbone network, not as an access network for broadband subscribers.
3.3 Comparative Study
To compare the cost of separated deployment and co-deployment of ducts and FOCs, two study
cases have been conducted (see Table 3-1).
Table 3-1: Overview of the comparative study cases
Separated deployment case Co-deployment case
Case 1-1 Case 1-2
Separated deployment of ducts (two-way)
Co-deployment of ducts (two-way)

16
Case 2-1 Case 2-2
Deployment of ducts separately from existing
highway ducts
Co-deployment of ducts (four-way)
3.3.1 Comparative Study Case 1
This study compares Case 1-1, the separated deployment of ducts (two-way), and Case 1-2, the co-
deployment of ducts (two-way) to analyse cost savings. Only duct and FOC construction costs are
compared here. In this case, the separated deployment refers to the construction of ducts and FOCs
separately from the highway, and co-deployment refers to the simultaneous construction of the
highway, and two-way ducts and FOCs.
Figure 3-1: Comparative study case 1
3.3.2 Comparative Study Case 2
This study compares Case 2-1, the separated deployment of ducts (two-way) from existing highway
ducts, and Case 2-2, the co-deployment of ducts (four-way) to derive cost savings. Again, only duct and
FOC construction costs are compared. In this case, separated deployment refers to the additional
construction of a set of two-way ducts and FOCs, separate from the existing two-way ducts and FOCs
built on the highway. Co-deployment refers to the simultaneous construction of the highway and a set
of four-way ducts and FOCs. In Case 1, there is no existing duct on an existing highway, and in Case 2,
ducts have already been constructed on the existing highway.
Figure 3-2: Comparative study case 2

17
4. Prerequisite Study Results
Table 4-1 shows the data collected during the prerequisite study.
Table 4-1: Data survey items Area Item
Country information Population Size of country (km2) Broadband service price
Highway status
Highway information: current status, total length of highway, road standard (number of lanes, width of shoulder)
Geographical and geological features: bridge section, soil, rock area
Pavement material: asphalt, concrete
Infrastructure status
Duct: technical requirements (trench depth, number of ducts)
Manhole/handhole: distance between manholes, composition ratio of manholes and handholes
FOC: number of cores
Material specifications Duct type: HDPE, GI pipe Manhole and handhole specifications FOC type
Cost Civil works: labour and material cost per kilometre FOC installation: labour and material cost per kilometre
Regulation Co-deployment regulation Network facility sharing scheme
References:
• ESCAP’s pre-feasibility study on upgrading the Taunggyi-Kyaintong Highway (AH2) in Myanmar (2014)
• Korea Telecom’s IT infra-network expansion project in Myanmar (2016-2020)
• Korea Telecom’s network consulting project in Cambodia (2017)
4.1 Country Information
Table 4-2: Key information on CLMV countries
* Source: Michael Ruddy, "Broadband Infrastructure in the ASEAN-9 Region: Markets, Infrastructure, Missing Links, and Policy Options for Enhancing Cross-Border Connectivity", Terabit Consulting, no date. Available from http://www.ESCAP.org/sites/default/files/1%20Broadband-Infrastructure-in-the-ASEAN-9-Region.pdf.
Myanmar has the greatest potential for broadband infrastructure development, considering the size
of country, population and broadband service price. The number of Internet subscribers with an
Country Size of country (km2)
Population Annual 1 Mbps subscription + installation as a % of nominal GDP per capita*
Cambodia 181,035 15,957,223 48.7
Lao PDR 236,800 6,492,400 27.4
Myanmar 676,563 51,480,000 132.0
Viet Nam 330,966 92,700,000 7.9

18
Internet download speed of 256kbps or more increased from 3,961 in 2006 to 32,921 in a decade.4 It is also the largest country in South-East Asia with a population of 51.5 million, and it has the most expensive broadband service price in the subregion. In Myanmar, the cost of broadband service is higher than average income. For these reasons, Myanmar has been selected as the country for in-depth study.
4.2 Highway Status
Figure 4-1: Asian Highway routes in Myanmar
Source: ESCAP, “Pre-feasibility study of upgrading Taunggyi-Kyaintong Highway (AH2) in Myanmar”, November 2014.
Figure 4-2: Network infrastructure expansion routes in Myanmar
4 International Telecommunication Union, World Telecommunication/ICT Development Report and database.

19
• Myanmar is bordered to the north-west by Bangladesh and India, to the north and north-east by Tibet and China, to the east by Lao PDR and to the south-east by Thailand.
• The total length of the four Asian Highway routes in Myanmar is 3,009km (see Table 4-3).
• 2,712km (90 per cent) of the highway routes are class III standard or below (see Table 4-4).
Table 4-3: Asian Highway route status in Myanmar
Route no.
Classification Total length (km)
Class I Class II Class III Below class III
AH 1 80 144 984 431 1,656
AH 2 - 6 344 356 807
AH 3 - - 93 - 93
AH 14 67 - 386 - 453
Portion 147 (4.80%) 150 (4.98%) 1807 (60.05%) 905 (30.07%) 3,009
Source: ESCAP, “Pre-feasibility study of upgrading Taunggyi-Kyaintong Highway (AH2) in Myanmar”, November 2014.

20
Table 4-4: Asian Highway classification
Highway classification
Primary (4 or more lanes)
Class I (4 or more lanes) Class II (2 lanes) Class III (2 lanes)
Terrain classification L R M S L R M S L R M S L R M S
Design speed (km/h) 120 100 80 60 10 80 60 60 80 60 50 40 60 50 40 30
Width
Right of way 50 40 40 30 (40)
Lane 3.75 3.50 3.50 3.00 (3.25)
Shoulder 3.00 2.50 3.00 2.50 2.50 2.00 1.5 (2.0) 1.0 (1.5)
Median strip 4.00 3.00 3.00 2.50 N/A N/A N/A N/A
Minimum horizontal curve
520 350 210
115
350 210
115 210 115
80 50 115 80 50 30
Pavement slope (%) 2 2 2 2-5
Shoulder slope (%) 3-6 3-6 3-6 3-6
Type of pavement Asphalt/cement concrete Asphalt/cement concrete
Asphalt/cement concrete
Double bituminous treatment
Maximum superelevation (%)
10 10 10 10
Maximum vertical grade (%)
4 5 6 7 4 5 6 7 4 5 6 7 4 5 6 7
Structure loading (minimum)
HS20-44 HS20-44 HS20-44 HS20-44
4.2.1 Number of Lanes and Width of Road Shoulders
Depending on the number of lanes and the width of shoulders, excavation and pavement costs are
key factors that impact duct construction. Considering actual road environment, current traffic and the
traffic forecast suggested by ESCAP’s pre-feasibility study of upgrading Taunggyi-Kyanintong Highway
(AH2) in Myanmar, the main factors used for cost estimation are as follows:
• Number of lanes – 2
• The width of shoulder – 1.0-2.0 m
4.2.2 Geographical and Geological Features
The cost of duct construction depends on geographical features (plains, bridges, tunnel sections).
For example, the cost of bridge/tunnel sections is significantly higher than plains sections. The
geological environment considerations that affect cost are excavation and backfilling. Rock area costs
are higher due to the need for ripping and blasting works compared to less costly soil areas. For these
reasons, geographical and geological features are considered to improve cost estimation accuracy as
follows:
• Bridges – 1.3 per cent
• Soil – 94.7 per cent
• Rock – 4 per cent
4.2.3 Pavement Material
For separated deployment, the cost of reinstatement depends on pavement material. To improve
cost calculation accuracy, pavement material is considered as follows:
• Asphalt – 1 per cent
• Concrete – 0.1 per cent
21
4.3 Infrastructure Status
Key findings from the prerequisite study are as follows:
• There are no ducts deployed along Asian Highway II;
• In general, FOCs have been directly buried without duct; and
• In most cities, FOCs have been directly buried with only one duct for maintenance.
4.3.1 Technical Requirements for Ducts
The cost of excavation and backfilling depends on the technical specifications of ducts, such as
trench depth and width. Construction standards differ depending on geological or climate
characteristics. For example, the trench depth in the Republic of Korea is 1m, while in Australia it is
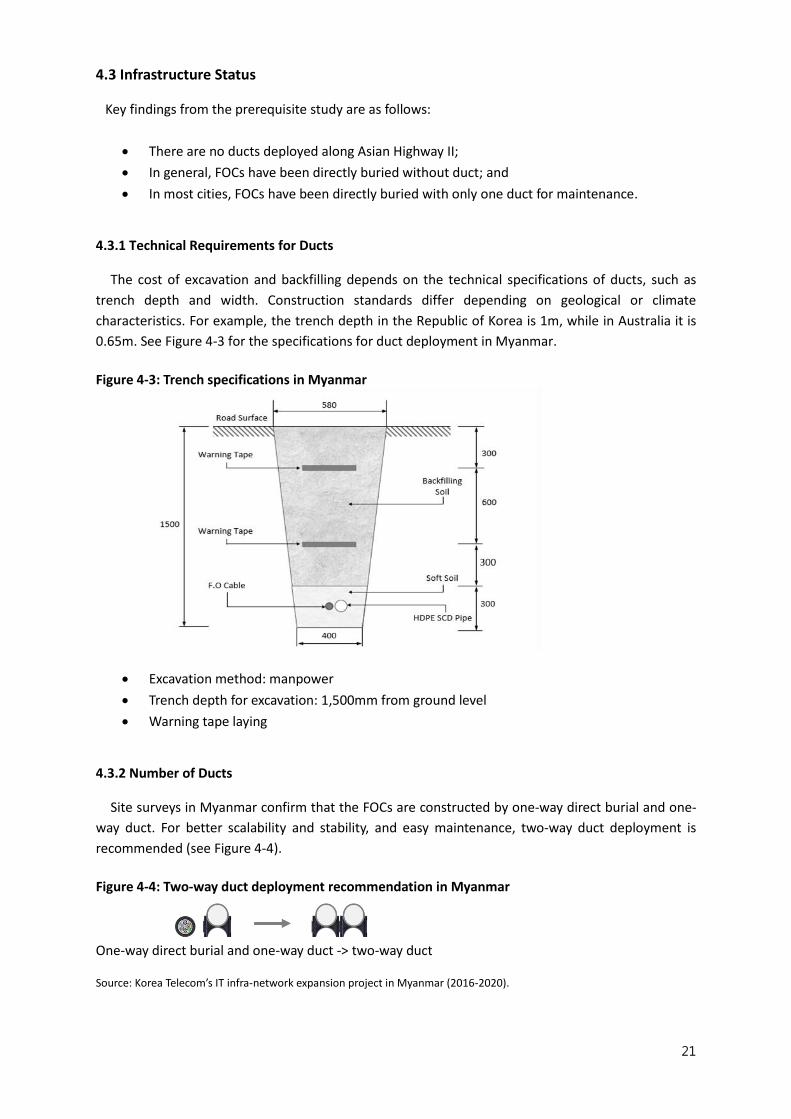
0.65m. See Figure 4-3 for the specifications for duct deployment in Myanmar.
Figure 4-3: Trench specifications in Myanmar
• Excavation method: manpower
• Trench depth for excavation: 1,500mm from ground level
• Warning tape laying
4.3.2 Number of Ducts
Site surveys in Myanmar confirm that the FOCs are constructed by one-way direct burial and one-
way duct. For better scalability and stability, and easy maintenance, two-way duct deployment is
recommended (see Figure 4-4).
Figure 4-4: Two-way duct deployment recommendation in Myanmar
One-way direct burial and one-way duct -> two-way duct
Source: Korea Telecom’s IT infra-network expansion project in Myanmar (2016-2020).

22
4.3.3 Manholes/Handholes
It is important that the design of splicing points consider current network traffic volume, ICT demand,
service, population density, and function of aggregation and branching point efficiency. The distance
between manholes/handholes is considered in these respects. For example, the distance between
splicing points in the Republic of Korea is 500m for backbone, and 246m for subscriber line. See Figure
4-5 for the key factors important to manholes/handholes in Myanmar, according to site surveys.
Figure 4-5: Distance between manholes/handholes in Myanmar
• Distance between manholes/handholes: 1km
• Manholes: 9 per cent
• Handholes: 91 per cent
4.3.4 FOC (Number of Cores)
See Figure 4-6 for the status of FOC cores in Myanmar, according to site surveys. Figure 4-6: Status of FOC cores in Myanmar
• 48 cores: 30 per cent
• 96 cores: 70 per cent
4.4 Material Specifications
4.4.1 Duct Type
The material for ducts (pipes) differs depending on their purpose. For example, galvanized iron (GI)
pipe is used for crossing roads or securing the protection, and high-density polyethylene (HDPE) pipe
is used in normal environments. According to Korea Telecom’s global experience in Myanmar, the ratio
for duct materials is as follows:
• HDPE pipe for plain area – 98.7 per cent
• GI pipe for bridge or road crossing – 1.3 per cent
4.4.2 Manhole Type
According to site surveys, all the manholes in Myanmar are site-cast manholes. Site casting has been
selected based on cost and ease of material procurement. See Table 7-2 for illustrations on the process
of constructing site-cast manholes.

23
4.4.3 FOC Type
According of site surveys, all FOCs in Myanmar are loose tubes.
4.5 Unit Cost
Given the limited availability of cost estimates, similar highway projects and telecom-based data,
including unit prices and quantities have been used for cost estimation (see Table 4-5).
Table 4-5: Highway unit cost
Description Unit Unit cost (USD)
A. Earthwork
1. Clearing and grubbing km 15.50
2. Soil excavation m³ 0.77
3. Rock excavation m³ 2.87
4. Embankment from roadway excavation m³ 2.62
5. Preparation of final subgrade surface m² 0.08
B. Pavement
1. Sub-base course m³ 14.62
2. Base course m² 13.62
3. Surface course m² 6.72
4. Prime coating (RSC-3) m² 0.34
5. Tack coating (RSC-4) m² 0.35
In Table 4-6, the unit costs have been adjusted to reflect the inflation rates in Myanmar.
Table 4-6: Highway unit cost applied by inflation rate
Description Unit cost (USD)
2012 2013 2014 2015 2016
Inflation rate (%) (GDP deflator)* 3.13% 4.38% 4.17% 4.13% 3.56%
A. Earthwork
1. Clearing and grubbing 15.50 15.99 16.69 17.38 18.10
2. Soil excavation 0.77 0.79 0.83 0.86 0.90
3. Rock excavation 2.87 2.96 3.09 3.22 3.35
4. Embankment from roadway excavation 2.62 2.70 2.82 2.94 3.06
5. Preparation of final subgrade surface 0.08 0.08 0.09 0.09 0.09
B. Pavement
1. Sub-base course 14.62 15.08 15.74 16.39 17.07
2. Base course 13.62 14.05 14.66 15.27 15.90
3. Surface course 6.72 6.93 7.23 7.54 7.85
4. Prime coating (RSC-3) 0.34 0.35 0.37 0.38 0.40
5. Tack coating (RSC-4) 0.35 0.36 0.38 0.39 0.41
* Source: World Bank IBRD IDA database 2012-2016.

24
Table 4-7: Telecommunication duct and FOC unit cost
Description Unit Unit cost (USD)*
A. Materials for civil work
1. HDPE SCD pipe m
2. GI pipe m
3. Warning tape (upper and lower side) m
4. Manhole cover, frame, nameplate each
5. Cable rack, bracket, bell mouth each
6. Handhole each
7. Cable tie each
8. Nylon rope for FOC route marking m
B. Materials for FOC
1. FOC 96 core m
2. FOC 48 core m
3. FOC joint closure (96 core) each
4. FOC joint closure (48 core) each
5. ODF 96 core each
6. ODF 48 core each
C. Installation of services for civil work
1. Soil excavation and backfilling m
2. Rock excavation and backfilling m
3. Excavation and backfilling for asphalt road m
4. Excavation and backfilling for concrete road m
5. Duct protection pipe attachment on bridge m
6. Installation of HDPE SCD pipe (one-way) m
7. Reinstatement for asphalt road m
8. Reinstatement for concrete road m
9. Manhole construction each
10. Handhole construction each
11. Warning tape laying (upper and lower side) m
12. Marking excavation route m
13. Jointing HDPE SCD pipe each
14. Cable tie binding each
D. Installation services for FOC
1. FOC pulling (96 core) m
2. FOC pulling (48 core) m
3. FOC splicing (96 core) each
4. FOC splicing (48 core) each
5. FOC termination (96 core) each
6. FOC termination (48 core) each
7. FOC test (96 core) each
8. FOC test (48 core) each
* Note: The unit cost is based on Korea Telecom’s experience in Myanmar and similar GDP-level countries. Unit cost data is

25
omitted intentionally due to non-disclosure agreements with customers, but is presented on a subtotal basis in the Cost Estimation chapter.
Based on the data surveys, the cost of highway construction per kilometre (with two lanes and
double bituminous surface treatment pavement) was USD 550,000 as of 2014. Reflecting the inflation
rate, by 2016, the highway construction cost per kilometre has increased to USD 642,220, as shown in
Table 4-8.
Table 4-8: Highway construction cost applied by inflation rate
Description 2012 2013 2014 2015 2016
Inflation rate (%) (GDP deflator) 3.13 4.38 4.17 4.13 3.56
Highway construction cost per kilometre (USD)
550,000* 567,215 592,059 616,748 642,220
* Source: ESCAP, “Pre-feasibility study of upgrading Taunggyi-Kyaintong Highway (AH2) in Myanmar”, November 2014.
4.6 Regulation
• No regulation for co-deployment in Myanmar.
• Network facility sharing scheme only in the telecommunication sector, with lease cost for ducts and FOCs.
5. Cost Estimation
The assumptions, constraints, unit costs and unit quantities included in this report cannot fully
reflect the local environmental and situational factors that affect costs, and therefore costs may vary
depending on the circumstances and environment of future constructions.
5.1 Analysis of Cost Estimation
This section gives the cost estimation for separated deployment of two-way duct, co-deployment of
two-way duct and co-deployment of four-way duct.
5.1.1 Separated Deployment Cost Estimation
In separated deployment, the estimated costs of duct and FOC deployment, excluding design cost,
value-added tax and operating profit are as follows:
• Construction of 1km of two-way duct – USD 12,984
• Construction of 1km of two-way duct with FOC – USD 20,118
See Table 5-1 for a breakdown of the material and service costs for constructing 1km of two-way
duct. Table 5-2 provides a breakdown of the material and service costs for constructing 1km of two-
way FOC. Construction of 1km of two-way duct with FOC is the sum of the total costs in Table 5-1 (USD
12,984) and Table 5-2 (USD 7,134).

26
Table 5-1: Cost estimation for separated deployment of two-way duct per kilometre
Description Unit Quantity Unit price (USD)
Total price (USD)
Materials for civil work
1. HDPE SCD pipe m 1,974
2. GI pipe m 26
3. Warning tape (upper and lower sides) m 1,000
4. Manhole cover, frame, nameplate each 0.09
5. Cable rack, bracket, bell mouth each 0.18
6. Handhole each 0.91
7. Cable tie each 1,000
8. Nylon rope for FOC route marking m 1,000
Subtotal 2,855
Installation of services for civil work
1. Soil excavation and backfilling m 936
2. Rock excavation and backfilling m 40
3. Excavation and backfilling for asphalt road m 10
4. Excavation and backfilling for concrete road m 1
5. Duct protection pipe attachment on bridge m 13
6. Installation of HDPE SCD pipe (two-way) m 2,000
7. Reinstatement for asphalt road m 10
8. Reinstatement for concrete road m 1
9. Manhole construction each 0.09
10. Handhole construction each 0.91
11. Warning tape laying (upper and lower sides) m 1,000
12. Marking excavation route m 1,000
13. Jointing HDPE SCD pipe each 2
14. Cable tie binding each 1,000
15. Installation of concrete marking post each 5
Subtotal 10,129
Grand total 12,984
Since only one manhole/handhole is required per kilometre, according to the data surveys, 9 per
cent of manholes and 91 per cent of handholes are applied. Thus, for per kilometre calculations, the
quantities used are 0.09 manholes and 0.91 handholes.
Based on the data survey on geographical and geological features, the following percentages are
applied to the cost estimate: soil excavation – 93.6 per cent, rock excavation – 4 per cent, bridge – 1.3
per cent, asphalt – 1.0 per cent, and concrete – 0.1 per cent. Thus, for per kilometre calculations, the
quantities used are: soil excavation – 936m, rock excavation – 40m, bridge – 13m, asphalt – 10m, and
concrete – 1 m. Since it is a calculation for two-way duct, the quantities are doubled for each unit in
the cost estimation. The pavement portion is calculated as 10m asphalt and 1m concrete because the
pavement portion needs to be reinstated.

27
Table 5-2: Cost estimation for separated deployment of two-way FOC per kilometre
Description Unit Quantity Unit cost (USD)
Total cost (USD)
Materials for FOC
1. FOC 96 core m 1,400
2. FOC 48 core m 600
3. FOC joint closure (96 core) each 0.58
4. FOC joint closure (48 core) each 0.3
5. ODF 96 core each 0.035
6. ODF 48 core each 0.015
Subtotal 5,958
Installation services for FOC
1. FOC pulling (96 core) m 1,400
2. FOC pulling (48 core) m 600
3. FOC splicing (96 core) each 0.58
4. FOC splicing (48 core) each 0.3
5. FOC termination (96 core) each 0.035
6. FOC termination (48 core) each 0.015
7. FOC test (96 core) each 0.02
8. FOC test (48 core) each 0.0086
Subtotal 1,176
Grand total 7,134
Based on the data surveys, FOC is calculated as 70 per cent for the 96 core and 30 per cent for the
48 core. FOC splicing for every 2km is estimated using the method of fusion splicing. Therefore, the 96
core splicing quantity is 0.29, and the 48 core splicing quantity is 0.15 for each kilometre of FOC.
The FOC is estimated to terminate at optical distribution frame (ODF) at every 40km, so that the 96
core termination quantity is 0.0175 and the 48 core termination quantity is 0.0075 for each kilometre
of FOC.
For the FOC test, the use of the optical time-domain reflectometer (OTDR) is estimated for every
70km, thus the 96 core test quantity is 0.01 and the 48 core test quantity is 0.0043 for each kilometre
of FOC. Since it is a calculation for two-way FOC, the quantities are doubled for each unit in the FOC
materials and services.
5.1.2 Co-Deployment Cost Estimation for Two-Way Duct
In the co-deployment of two-way duct, the estimated costs of duct and FOC deployment, excluding
design cost, value-added tax and operating profit are as follows:
• Construction of 1km of two-way duct – USD 5,605
• Construction of 1km of two-way duct with FOC – USD 12,739

28
See Table 5.3 for a breakdown of the material and service costs for the co-deployment of 1km of
two-way duct. The co-deployment of 1km of two-way duct with FOC is the sum of the total costs in
Table 5-3 (USD 5,605) and Table 5-2 (USD 7,134). The two-way FOC cost estimation for both separated
deployment and co-deployment are the same.
Table 5-3: Cost estimation for co-deployment of two-way duct per kilometre
Description Unit Quantity Unit price (USD)
Total price (USD)
Materials for civil work
1. HDPE SCD pipe m 1,974
2. GI pipe m 26
3. Warning tape (upper and lower sides) m 1,000
4. Manhole cover, frame, nameplate each 0.09
5. Cable rack, bracket, bell mouth each 0.18
6. Handhole each 0.91
7. Cable tie each 1,000
8. Nylon rope for FOC route marking m 1,000
Subtotal 2,855
Installation of services for civil work
1. Soil excavation m 947
2. Rock excavation m 40
3. Duct protection pipe attachment on bridge m 13
4. Installation of HDPE SCD Pipe (two-way) each 2,000
5. Manhole construction each 0.09
6. Handhole construction each 0.91
7. Warning tape laying (upper and lower sides) each 1,000
8. Marking excavation route m 1,000
9. Jointing HDPE SCD pipe each 2
10. Cable tie binding each 1,000
11. Installation of concrete marking post each 5
Subtotal 2,750
Grand total 5,605
Based on the data survey on geographical and geological features, the following percentages are
applied to the cost estimate: soil excavation – 94.7 per cent, rock excavation – 4 per cent, and bridge
– 1.3 per cent. Thus, for per kilometre calculations, the quantities used are: soil excavation – 947m,
rock excavation – 40m, and bridge – 13m. Since it is a calculation for two-way duct, the quantities are
doubled for each unit in the cost estimation.
The unit cost for soil and rock excavations in the installation of services for civil work refers to the
unit cost for highway construction in Table 4-6. Since the service unit is 1m³ at the unit price in the
highway excavation, if the trench depth is 1.5m and the width is 0.6m, the volume of the duct trench
is 0.9m³ (1.5 X 0.6 X 1). Therefore, the highway unit cost multiplied by 0.9 is applied to civil work service
prices.
29
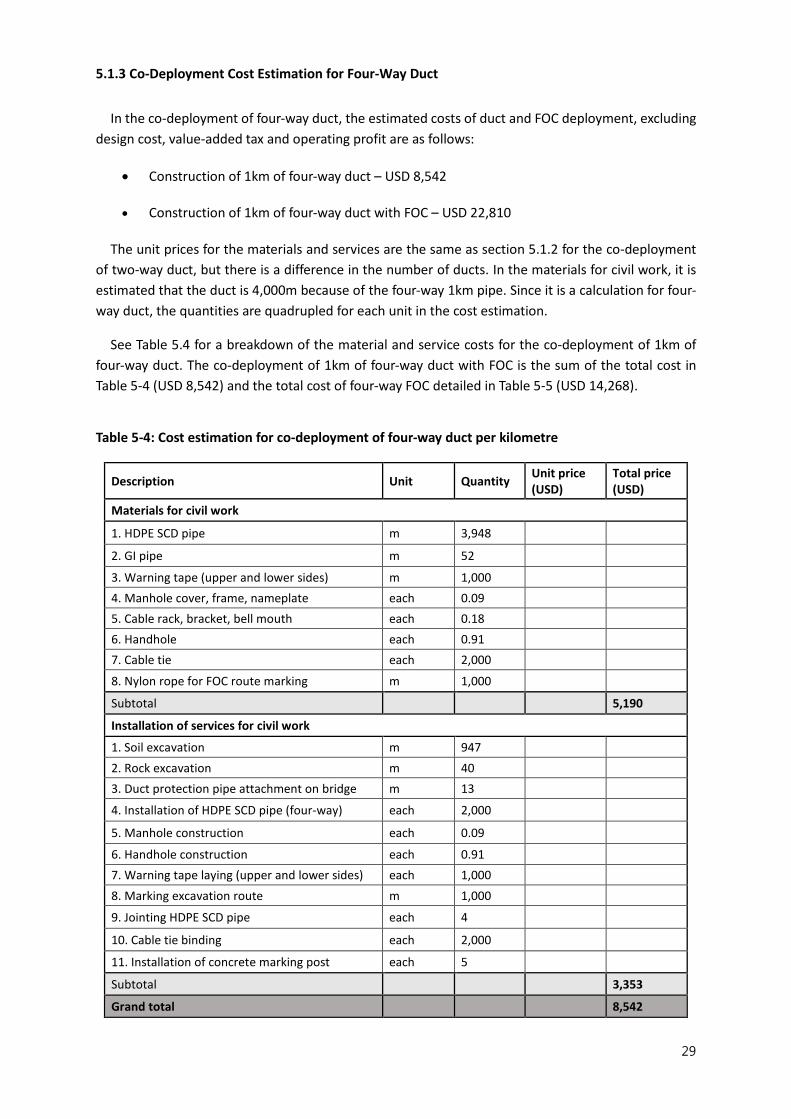
5.1.3 Co-Deployment Cost Estimation for Four-Way Duct
In the co-deployment of four-way duct, the estimated costs of duct and FOC deployment, excluding
design cost, value-added tax and operating profit are as follows:
• Construction of 1km of four-way duct – USD 8,542
• Construction of 1km of four-way duct with FOC – USD 22,810
The unit prices for the materials and services are the same as section 5.1.2 for the co-deployment
of two-way duct, but there is a difference in the number of ducts. In the materials for civil work, it is
estimated that the duct is 4,000m because of the four-way 1km pipe. Since it is a calculation for four-
way duct, the quantities are quadrupled for each unit in the cost estimation.
See Table 5.4 for a breakdown of the material and service costs for the co-deployment of 1km of
four-way duct. The co-deployment of 1km of four-way duct with FOC is the sum of the total cost in
Table 5-4 (USD 8,542) and the total cost of four-way FOC detailed in Table 5-5 (USD 14,268).
Table 5-4: Cost estimation for co-deployment of four-way duct per kilometre
Description Unit Quantity Unit price (USD)
Total price (USD)
Materials for civil work
1. HDPE SCD pipe m 3,948
2. GI pipe m 52
3. Warning tape (upper and lower sides) m 1,000
4. Manhole cover, frame, nameplate each 0.09
5. Cable rack, bracket, bell mouth each 0.18
6. Handhole each 0.91
7. Cable tie each 2,000
8. Nylon rope for FOC route marking m 1,000
Subtotal 5,190
Installation of services for civil work
1. Soil excavation m 947
2. Rock excavation m 40
3. Duct protection pipe attachment on bridge m 13
4. Installation of HDPE SCD pipe (four-way) each 2,000
5. Manhole construction each 0.09
6. Handhole construction each 0.91
7. Warning tape laying (upper and lower sides) each 1,000
8. Marking excavation route m 1,000
9. Jointing HDPE SCD pipe each 4
10. Cable tie binding each 2,000
11. Installation of concrete marking post each 5
Subtotal 3,353
Grand total 8,542

30
Table 5-5: Cost estimation for co-deployment of four-way FOC per kilometre
Description Unit Quantity Unit cost (USD)
Total cost (USD)
Materials for FOC
1. FOC 96 core m 2,800
2. FOC 48 core m 1,200
3. FOC joint closure (96 core) each 1.16
4. FOC joint closure (48 core) each 0.6
5. ODF 96 core each 0.07
6. ODF 48 core each 0.03
Subtotal 11,916
Installation services for FOC
1. FOC pulling (96 core) m 2,800
2. FOC pulling (48 core) m 1,200
3. FOC splicing (96 core) each 1.16
4. FOC splicing (48 core) each 0.6
5. FOC termination (96 core) each 0.07
6. FOC termination (48 core) each 0.03
7. FOC test (96 core) each 0.04
8. FOC test (48 core) each 0.0172
Subtotal 2,352
FOC total 14,268
5.2 Comparative Study Case
5.2.1 Comparative Study Case 1
Figure 5-1: Summary of comparative study case 1 results
Cost saved from co-deployment of ducts (two-way) = USD 7,379 per kilometre
Percentage of cost saving (two-way) = 56.83%
Calculations are as follows:

31
• Cost saved from co-deployment of ducts (two-way) = Separated deployment cost (two-way) – Co-deployment cost (two-way)
USD 7,379 = USD 12,984 - USD 5,605
• Percentage of cost saving (two-way) = (Cost saving (two-way)) / (Separated deployment cost (two-way)) X 100
56.83% = (USD 7,379/ USD 12,984) X100
In summary, the cost saving is calculated by comparing co-deployment costs with separated
deployment costs. The cost of two-way separated deployment is USD 12,984 per kilometre, while
the cost of two-way co-deployment is USD 5,605 per kilometre. Thus, two-way co-deployment can
save USD 7,379 per kilometre, representing 56.83 per cent of savings compared to separated
deployment.
5.2.2 Comparative Study Case 2
Figure 5-2: Summary of comparative study case 2 results
Cost saved from co-deployment of ducts (four-way) = USD 10,047 per kilometre
Percentage of cost saving (four-way) = 54.05%
Calculations are as follows:
• Cost saved from co-deployment of ducts (four-way) = (Separated deployment cost (two-way)
+ Existing duct deployment on highway (two-way)) – Co-deployment cost (four-way)
USD 10,047 = (USD 12,984 + USD 5,605) – USD 8,542
• Percentage of cost saving (four-way) = [Cost saving (four-way) / (Separated deployment cost
(two-way) + Existing duct deployment on highway (two-way))] X 100
54.05% = [USD 10,047 / (USD 12,984 + USD 5,605)] X 100
In summary, the cost saving is calculated by comparing the separated deployment cost and existing
duct deployment on highway with a new four-way co-deployment case. Here, the existing duct
deployment on highway is estimated to have the same cost as two-way co-deployment. Thus, four-
way co-deployment can save USD 10,047 per kilometre, representing 54.05 per cent of savings
compared to separated deployment and existing duct deployment.
In the analysis of the savings between separated deployment and co-deployment, excavation,

32
backfilling and reinstatement are the services with the greatest cost saving. This is because earthwork
is the largest cost component of duct deployment, and when it is deployed with highway construction,
it results in huge savings. Costs savings are incurred in backfilling and reinstatement because they are
included in the construction cost of the highway. Moreover, since pavement is included in the shoulder
of the highway (2-2.5m in width) where the duct (0.6m) is installed, it is a cost saving because highway
construction cost already includes the cost for shoulder pavement. In addition, as the number of ducts
increases, it may be possible to reduce the unit price through volume discounts.
However, there may be hidden costs from compliance issues related to gaining construction
permission, changes in the construction period, traffic control and the need for night work due to
daytime traffic in the separated deployment case.
When the saving of USD 10,047 per kilometre is applied to Myanmar’s 3,009km Asian Highway,
the total saving is USD 30,231,423. The amount saved would be even greater when applied to the
whole of Asia.
The ratios for duct co-deployment cost and highway construction cost are as follows:
• Duct co-deployment cost (two-way) / Highway construction cost = 0.87 per cent
• Duct co-deployment cost (four-way) / Highway construction cost = 1.33 per cent
The ratios for duct and FOC co-deployment cost and highway construction cost are as follows:
• Duct and FOC co-deployment cost (two-way) / Highway construction cost = 1.98 per cent
• Duct and FOC co-deployment cost (four-way) / Highway construction cost = 3.55 per cent
These calculations show that co-deployment costs are significantly lower than highway construction
costs, which means that co-deployment is cost effective and only accounts for a small percentage of
highway construction costs.
5.3 Generalized Comparison Results using GDP per Capita based on PPP
Due to limited resource availability, cost estimates have been applied to CLMV countries using an
inter-country ratio of GDP per capita based on PPP.
Table 5-6: GDP per capita based on PPP for CLMV countries in 2016
Country GDP per capita PPP (USD)*
Ratio (%)
Cambodia 3,744 65.3
Lao PDR 6,196 108.1
Myanmar 5,732 100
Viet Nam 6,435 112.3
* Source: World Bank Open Data. Available from https://data.worldbank.org/.
Based on the GDP per capita PPP ratios in Table 5-6, see Table 5-7 for the generalized cost
estimation for CLMV countries.

33
Table 5-7: Generalized cost estimation for CLMV countries
Description Cambodia
(USD) Lao PDR
(USD) Myanmar
(USD) Viet Nam
(USD)
Duct
1. Separated deployment of 1km duct (two-way) 8,481 14,035 12,984 14,576
2. Co-deployment of 1km duct (two-way) 3,661 6,059 5,605 6,292
3. Co-deployment of 1km duct (four-way) 5,580 9,234 8,542 9,590
Duct and FOC
1. Separated deployment of 1km duct and FOC (two-way)
13,141 21,747 20,118 22,584
2. Co-deployment of 1km duct and FOC (two-way) 8,321 13,771 12,739 14,301
3. Co-deployment of 1km duct and FOC (four-way) 14,899 24,658 22,811 25,607
In order to verify the generalized results, an interview and site survey with staff of an Internet
service provider in Cambodia has been conducted to investigate the costs of civil work and FOC
materials, and labour.5 The analysis shows that the two-way duct and FOC cost difference between
the generalized results and the survey results is only about 10 per cent. Therefore, it can be concluded
that the simulated results of the cost generalization are similar to actual cost estimations.
However, civil work occupies a larger portion in the Cambodia survey compared with the
generalized results. Although the generalized results and the Cambodian survey results differ by only
about 10 per cent, actual costs may vary widely from country to country. Therefore in future studies,
actual cost estimation through site surveys will be essential for transparent and reliable cost estimates.
Moreover, since material and labour costs for each country are different, surveys on the cost of
materials and services and the construction standards for duct may be required for future studies.
See Table 5-8 for generalized costs savings from co-deployment calculated for CLMV countries.
Table 5-8: Generalized cost saving for CLMV countries
Description Cambodia Lao PDR Myanmar Viet Nam
1. Separated deployment (two-way) – Co-deployment (two-way) (USD)
4,820 7,977 7,379 8,284
- Cost-saving ratio (%) 56.83 56.83 56.83 56.83
2. [Separated deployment of 1km duct (two-way) + Existing-deployment of 1km duct on highway (two-way)] – Co-deployment of 1km duct (four-way)) (USD)
6,562 10,860 10,047 11,278
- Cost-saving ratio (%) 54.05 54.05 54.05 54.05
The cost-saving ratio by country is the same because the difference in the ratio of GDP applies to
the cost but not the ratio.
5 Korea Telecom’s network consulting project in Cambodia in 2017.

34
6. Pros and Cons of Co-Deployment
6.1 Co-Deployment Stakeholders
As shown in the comparative study in Myanmar, there is an opportunity and need to leverage
synergies between the transportation and telecommunication sectors through the co-deployment of
ducts and FOCs during the construction and maintenance of roads.
To encourage co-deployment of broadband infrastructure, it is necessary to analyse the pros and
cons of co-deployment for different stakeholders, from the perspective of overall public and
environmental interest and mutual benefit. The analysis of pros and cons describes the potential
benefits for stakeholders, with a focus on the roles and responsibilities for co-deployment including
construction and maintenance of ducts and FOCs.
Procedures related to co-deployment of broadband infrastructure include approving construction
and maintenance of roads, constructing ducts and laying FOCs along roads, providing broadband
service, and maintaining ducts and FOCs.
As the pros and cons analysis results may vary depending on the business model for co-deployment,
this report limits the roles and responsibilities of stakeholders to those indicated in Table 6-1.
Table 6-1: Roles and responsibilities of stakeholders
6.1.1 Road Sector
The FOC network is a cost-effective and reliable network solution for both the telecommunication
and road sectors. The demand for Internet services continues to grow and solutions for intelligent road
management, such as the use of intelligent transportation systems, are exponentially increasing the
need for greater bandwidth. The best solution to meet these requirements is to deploy a fibre-optic
network with ducts to ensure future scalability.
New road construction should consider including ducts for future fibre-optic deployment. According
to cost estimations in the previous section, the additional cost for duct co-deployment is only 0.87 per
cent for two-way ducts, and 1.98 per cent for two-way ducts and FOCs, compared with highway
construction cost. For deployment after initial construction of roads, the cost of building an FOC
network with two-way ducts increases by 233 per cent compared to duct co-deployment.
The road sector may have network facilities to support its own internal telecommunication network
needs for transportation, not for providing telecommunication service. In this case, the road sector is
Procedure
Role and responsibility
Government Road sector Telecommunication sector
Approving construction and maintenance of roads O
Constructing and maintaining roads O
Constructing ducts and laying FOCs along roads O O
Providing broadband service O
Maintaining ducts and FOCs O O

35
the infrastructure owner of the network facilities that can provide broadband services. Infrastructure
sharing to the telecommunication sector can be a strategic opportunity for the road sector to monetize
the value of existing infrastructure, including ducts and FOCs. However, this increases the initial
investment cost and it takes time and effort to establish agreements compared to the more simple
construction of roads only. The pros and cons of co-deployment for the road sector are summarized in
Table 6-2.
Table 6-2: Pros and cons of co-deployment for the road sector
Pros Cons
Having infrastructure to accommodate intelligent transportation systems, including signalling and traffic monitoring for roads;
Having a new business model such as dynamic signage and road-user information;
Monetizing the potential value of existing infrastructure by leasing excess facilities; and
Reducing internal telecommunication network cost.
Increasing initial investment cost for deployment of ducts and FOCs besides road construction cost;
Managing network facility to meet service quality based on the service-level agreement for broadband service; and
Requiring a longer time period to reach contractual agreement on network infrastructure and facility sharing through consultation with the telecommunication sector.
6.1.2 Telecommunication Sector
Incumbent Dominant Operators
Most of the current dominant telecommunication operators have sufficient network facilities to
provide broadband services because they have been government entities, public or monopolized
corporations before the telecommunication market opened to competition. Ducts are especially highly
controlled by dominant operators. They already have their own backbones and access network for
their services, and existing infrastructure, including ducts, can be fully utilized.
For dominant operators, co-deployment of ducts and FOCs along roads is considered when new
broadband traffic routes along roads are needed due to the development of new areas, for example,
new airport construction or new residential development.
When an alternative traffic route is required in a fixed network during an emergency, or when a
temporary traffic route is required during a short-term event, duct and/or FOC lease is a good option
for dominant operators. However, dominant operators are reluctant to provide facilities that give
competitive advantages to others. The pros and cons of co-deployment for dominant
telecommunication operators are summarized in Table 6-3.
Table 6-3: Pros and cons of co-deployment for dominant telecommunication operators
Pros Cons
Reducing the cost and time to obtain permission for road rights of way; and
Having alternative routes available in emergencies.
Losing the leverage of existing network infrastructure as incumbent dominant players; and
Requiring high infrastructure quality (in particular, FOCs) for reliable broadband service even for leased network facilities.

36
New entrants
Usually incumbent telecommunication operators, in particular dominant players, can use their
existing ducts for FOCs. However, new entrants have no ducts, and they need to obtain rights of way
to construct their own ducts or access existing ducts from their competitors.
It is complex to obtain rights of way permission for the construction of ducts and laying FOCs. These
difficulties cause significant delays, and make it very difficult to meet launching schedules. Incumbent
operators and other infrastructure owners are often unwilling to share their ducts, or may not have
excess ducts, and may demand high usage fees.
For new entrants, co-deployment and infrastructure sharing with the road sector, who are not in
competition with them, could be the most cost-efficient and effective solution for a go-to-market
strategy. The pros and cons of co-deployment for new entrant operators are summarized in Table 6-4.
Table 6-4: Pros and cons of co-deployment for new entrant operators
Pros Cons
Reducing the time to obtain duct construction permission;
Reducing the cost of duct construction; Possibly reducing the time to enter the
telecommunication market; and Having guaranteed equal competition rights with
incumbent operators.
Requiring complex process, including consultation, to reach agreement; and
Having uncertain supply of ducts and FOCs in the long term.
6.1.3 Government
Co-deployment encourages efficient investment of telecommunication resources and prevents
unnecessary duplication between the road sector and the telecommunication sector.
Network infrastructure sharing across sectors contributes to fair competition by providing non-
discriminatory opportunities for new operators in the telecommunication market. Eventually, co-
deployment and network infrastructure sharing between the road and telecommunication sectors can
contribute to facilitating broadband network development and lead to economic and social benefits.
According to studies by the World Bank on 86 countries in the period between 1980 and 2011, an
increase of 10 percentage points in broadband service penetration corresponds to an increase in
economic growth of 1.35 per cent for developing countries and 1.19 per cent for developed countries
(see Figure 6-1).
However, it is necessary for government to coordinate and arbitrate disputes in cases where mutual
agreement, including contract, is not reached through consultation.

37
Figure 6-1: The impact of different ICTs by income group
Source: Michael Minges, "Exploring the Relationship between Broadband and Economic Growth", Background Paper
prepared for the World Development Report 2016: Digital Dividends, January 2015. Available from
http://pubdocs.worldbank.org/en/391452529895999/WDR16-BP-Exploring-the-Relationship-between-Broadband-and-
Economic-Growth-Minges.pdf.
Table 6-5: Pros and cons of co-deployment for governments
Pros Cons Having a fair and competitive ICT environment; Expanding the broadband infrastructure in a cost-
effective manner; and Enhancing national ICT resources that could lead to
economic and social benefits.
Requiring the establishment of a framework and guidelines for co-deployment across sectors; and
Having to coordinate and arbitrate co-deployment disputes.
6.2 Issue Handling Model and Practice
Co-deployment is concomitant deployment of ducts and/or FOCs along roads during their
construction. From the comparative study in Myanmar, the percentage of cost savings has been
calculated as 57.13 per cent. Most of the cost savings in co-deployment is derived from eliminating
overlapping civil works such as excavation, backfilling and reinstatement during construction of the
highway.
Besides actual construction costs, there are several things to consider to maximize the economic
and social benefits of co-deployment for broadband network connectivity, as follows:
• Cross-sectoral cooperation for co-deployment;
• Network facility sharing; and
• Civil works rights of way.
38
6.2.1 Cross-Sectoral Cooperation for Co-Deployment
When roads are constructed, the road sector can deploy ducts and FOCs under a commercial
contract with the telecommunication sector on condition that the telecommunication sector pays for
the construction cost as a user of the ducts and FOCs. Ducts and FOCs can also be co-deployed by
compulsory obligation, when the communication resources are considered as public goods by
government regulation.
To manage the national ICT resources efficiently, government needs to establish a cooperation
framework and guidelines for co-deployment in a fair and competitive environment. The framework
and guidelines should cover procedures for the request for construction of ducts and FOCs,
consultations to develop co-deployment agreements, and arbitrations when sectors fail to agree.
Procedures are also needed for the management and monitoring of co-deployment, and provision and
use of facilities to maximize the synergies across infrastructure sectors.
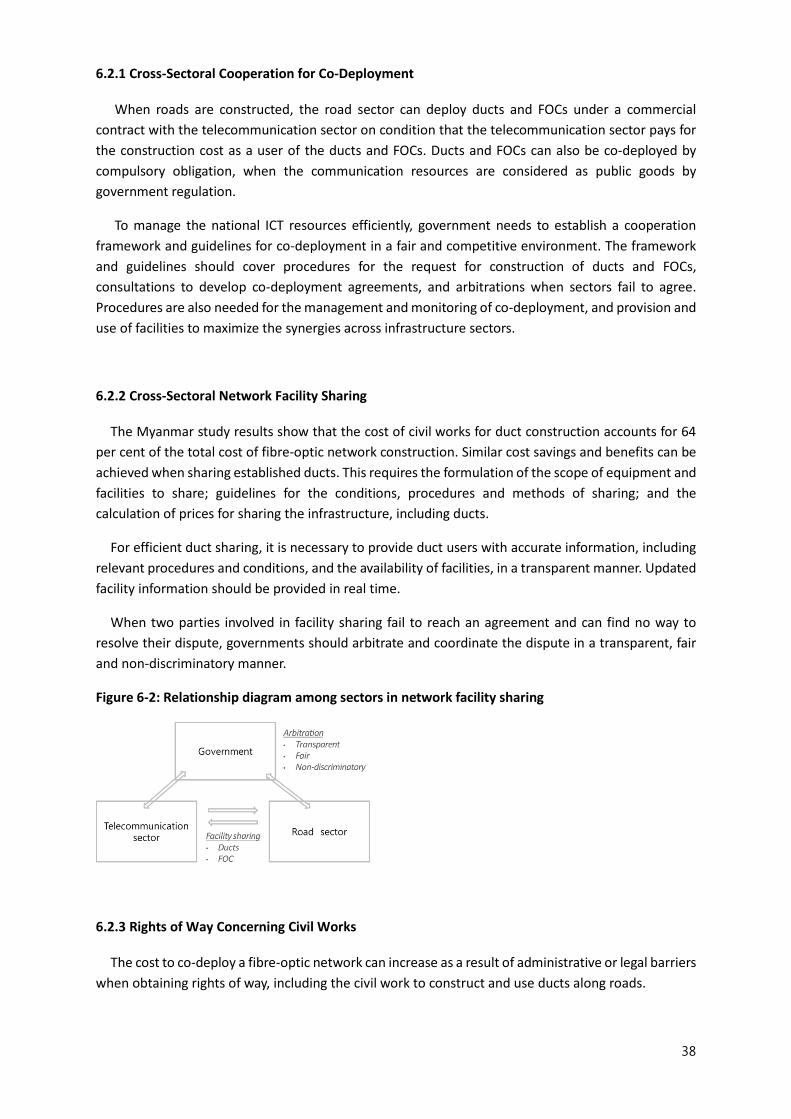
6.2.2 Cross-Sectoral Network Facility Sharing
The Myanmar study results show that the cost of civil works for duct construction accounts for 64
per cent of the total cost of fibre-optic network construction. Similar cost savings and benefits can be
achieved when sharing established ducts. This requires the formulation of the scope of equipment and
facilities to share; guidelines for the conditions, procedures and methods of sharing; and the
calculation of prices for sharing the infrastructure, including ducts.
For efficient duct sharing, it is necessary to provide duct users with accurate information, including
relevant procedures and conditions, and the availability of facilities, in a transparent manner. Updated
facility information should be provided in real time.
When two parties involved in facility sharing fail to reach an agreement and can find no way to
resolve their dispute, governments should arbitrate and coordinate the dispute in a transparent, fair
and non-discriminatory manner.
Figure 6-2: Relationship diagram among sectors in network facility sharing
6.2.3 Rights of Way Concerning Civil Works
The cost to co-deploy a fibre-optic network can increase as a result of administrative or legal barriers
when obtaining rights of way, including the civil work to construct and use ducts along roads.

39
A right of way is, “an easement granted by a property owner that gives the rights to travel over the
land and the provision by the property owner of reasonable use of the property to others, as long as
it is not inconsistent with the use and enjoyment of the land by the owner. The traditional principles
underlying rights of way had their origin in common law, which governed the free flow of water or
allowed neighbouring landowners to travel over one another’s property such as roads, railway and
utilities.”6
Governments normally manage and authorize permit-granting of rights of way that include
guidelines for construction and maintenance in the road sector, and for operation and maintenance of
ducts and FOCs in the telecommunication sector. As the demand for repetitive excavation and
reinstatement of an identical road by different telecommunication operators can hinder the free flow
of traffic roads and degrade road pavement quality, the process of granting rights of way also includes
establishing jurisdiction and arbitration, procedures and deadlines, and compensations.
6.2.1 Republic of Korea Case
In the Republic of Korea, cooperation for co-deployment, facility sharing and rights of way are
summarized and explained in the framework of the Informatization Act,7 the Telecommunication
Business Act,8 the Information and Communications Construction Business Act9 and the Road Act.10
Cross-Sectoral Cooperation for Co-Deployment
Telecommunication network operators (hereinafter “access seekers”) may request the construction
or lease of ducts and FOCs necessary for the installation of telecommunication cable facilities. The
requests are sent to facility management authorities in charge of construction, operation and
management of roads, railroads, subways, waterworks and sewerage, electrical facilities, and
telecommunication circuit facilities, on the condition that access seekers bear the associated costs.
Such facility management authorities may provide equipment and facilities under a contract with
an access seeker. Access seekers may request arbitration from the Minister of ICT where they fail to
reach an agreement with the facility management authorities on the construction or lease of ducts
and FOCs.
• Agreement and deadline
Where a facilities management authority is requested to construct or lease ducts and FOCs,
the authority must endeavour to reach an agreement related to such construction or lease
6 Organisation for Economic Co-operation and Development, "Public Rights of Way for Fibre Deployment to the Home", OECD Digital Economy Papers, No. 143, OECD Publishing, Paris. Available from https://www.oecd-ilibrary.org/science-and-technology/public-rights-of-way-for-fibre-deployment-to-the-home_230502835656. 7 Ministry of Science and ICT, Republic of Korea, "Framework Act on National Informatization", Act No. 14572, 14 March 2017. Available from https://elaw.klri.re.kr/kor_service/lawView.do?hseq=42620&lang=ENG. 8 Korea Communications Commission, "Telecommunications Business Act", Act No. 14113, 29 March 2016. Available from https://elaw.klri.re.kr/kor_service/lawView.do?hseq=42181&lang=ENG. 9 Ministry of Science and ICT, Republic of Korea, "Information and Communications Construction Business Act", Act No. 13589, 22 December 2015. Available from https://elaw.klri.re.kr/kor_service/lawView.do?hseq=37472&lang=ENG. 10 Ministry of Land, Infrastructure and Transport, Republic of Korea, "Road Act", Act No. 14539, 17 January 2017. Available from https://elaw.klri.re.kr/kor_service/lawView.do?hseq=42009&lang=ENG.
40
with an access seeker within three months from the date of receiving such request, to the
extent that it does not impede the proper business purpose of a facilities management
authority, except in extenuating circumstances.
• Requests for arbitration
An access seeker may submit a request for arbitration to the Minister of ICT if an
agreement between an access seeker and a facilities management authority cannot
conclude within three months.
The Minister of ICT must hear the opinions of the parties involved and may investigate
the facts where necessary, when conducting arbitration on the construction or lease of
ducts and FOCs on receiving a request for arbitration.
In mediation, where the Minister of ICT determines that a failure to reach an agreement
between the parties appears severely detrimental to public interest, the Minister may make
a mediatory decision for the conclusion of a fair agreement through consultation with the
heads of relevant central administrative agencies, taking account of the interests of the
parties involved.
Where the Minister of ICT makes a mediatory decision, the parties involved must comply
with the mediatory decision, except in extenuating circumstances.
• Management and monitoring
The Minister of ICT must determine and publicly announce the scope of equipment and
facilities, as well as the guidelines for the conditions, procedures, methods and calculation
of prices for providing such equipment and facilities. The scope of equipment and facilities
must consider the demand for equipment and facilities by telecommunication business
operators or facility management authorities.
For the purpose of developing competition policies for fair competition, the conditions
of competition in telecommunication business must be appraised every year by the Minster
of ICT.
For the efficient use and management of equipment and facilities, the Minister of ICT
may conduct an on-site investigation on the status of the provision and use of facilities, etc.
The Minister of ICT may designate a specialized institution to provide equipment, etc.
• Co-deployment for ducts along roads
According to the Information and Communications Construction Business Act, contracts
for road construction and duct construction must not be separated when the projects need
to be implemented concurrently. Drawing separate contracts would be difficult and
complex due to the nature of the projects and technological management. Therefore, co-
deployment of ducts along roads must be done by the road sector.

41
Cross-Sectoral Network Facility Sharing
• Obligation for network facility sharing
The dominant telecommunication network operator 11 and facility management
authorities12 are obligated to share their equipment and facilities when requested, including
ducts and FOCs, by preparing a contract. This is unless the facility management authority plans
to use the requested equipment and facilities prior to the date of request for equipment and
facilities.
The dominant telecommunication network operator has to provide an online information
system to coordinate requests for use of infrastructure. This system must provide information
including maps of ducts, manholes, handholes and poles, and their availability. When
requesting facility sharing, including ducts and FOCs, consultation with an access seeker must
be conducted in advance regarding demand for ducts.
Table 6-6: Facilities to be provided by obligation
Who Facility management authorities (Highway Corporations)
What Excess copper cables, excluding 8 per cent of the currently operating line and the currently operating line;
Excess FOCs, excluding 20 per cent of the currently operating line and the currently operating line;
Ducts including manholes/handholes and poles; Troughs and utility corridors to install cables and equipment; and Support fixtures on bridges, tunnels, subways and railways.
Table 6-7: Information, procedures and deadlines for providing facilities
Facility management authorities Dominant telecommunication business operator
Information Decided by consultation with access seeker: The scope, method and timing of
information to be provided; and The cost of providing information,
based on actual costs.
For ducts and poles (mandatory): Within 7 days; and The cost of providing information is
based on actual costs.
Procedures Submit written request with details on: - Purpose; - Location and route; - Facility types, specifications and quantities; and - Start date and duration.
On-site survey (at the cost of access seekers); Possibility of extension of the deadline; and Development and disclosure of guidelines for the provision of facilities.
Deadlines Notify an access seeker the availability of requested facilities within 2 weeks;
Provide available facilities within 4
Depending on quantities/length to be requested: For ducts, within 7-12 days
(more than 10 km: consultation);
11 A dominant telecommunication business operator is defined as an operator who possesses equipment and facilities indispensable for other telecommunication business operators to provide telecommunication services. 12 Facility management authorities are those who possess equipment and facilities, such as ducts, common utility conduits and poles. They include, highway corporations, water resources corporations, electric power corporations, rail network authorities, local public enterprises, local governments and regional construction management administrations.

42
weeks, including ducts and poles; and Through consultation, determine
deadlines for providing other facilities, except ducts and poles.
For FOCs, within 13 days; and For poles, within 4-7 days
(more than 500 poles: consultation).
Table 6-8: Criteria for calculating facility provision fees
Facility management authorities Dominant telecommunication business operator
Criteria Standard cost calculation method.* If the standard cost calculation method is not possible, it must be based on the accounting data.
Standard cost calculation method.
Agency that calculates the fee
By facilities provider, or joint calculation by agency with users and providers.
Verification may be requested by the user.
Responsible for verification.
Korea Communications Commission. Professional institution such as the
Electronics and Telecommunications Research Institute.
Responsible for calculation.
* Note: Refer to the cost-based model in section 6.3.1.
Rights of Way Concerning Civil Works
The access seeker that intends to obtain permission to occupy and use roads for duct construction
must submit an application that includes objective, location, duration of occupancy and road use, to a
road management authority. The application must be accompanied by design drawings.
In the case that the application includes road excavation, a project plan must be submitted during
the months of January, April, July or October of each year. The road management agency must
coordinate with the excavation applicant and the underground facility managers concerning the period
of occupancy and traffic flow measures, and notify all concerned parties within 30 days from the date
following the end of the month in which the project plan was submitted.
Repeated excavation on a road is not permitted within three years (two years in the case of sidewalks)
from the time of the initial road excavation, even if other applicants request it, except in urgent cases.
Where a road management agency deems it necessary for the systematic and efficient
implementation of duties of granting permission to occupy and use roads accompanied by excavation
of roads, each year it may request facility management authorities, including the telecommunication
sector, to submit a five-year excavation plan, as follows:
• Coordination by road management council
A road management council must be established to deliberate on and coordinate matters
concerning excavation of roads. Through consultation, the road management council must
formulate and coordinate a project plan that includes arrangements for the excavation of
roads and maintenance of facilities related to the excavation of roads.
• Fee for occupancy and road use
The occupancy period is on a ten-year basis, and fees depend on the type of area the road
passes through and the diameter of the duct.

43
Table 6-9: Fee for occupancy and road use
Item Unit Fee
Duct (0.2-0.4m diameter)
1m per year Approximately USD 1 for rural areas
• Online system
Application and approval for road use is available through an online system managed by
the Ministry of Land, Infrastructure and Transport, and real-time permission status can be
viewed.
6.2.2 European Union Case
In the European Union, cooperation for co-deployment, facility sharing and rights of way are
summarized and explained in the Directive 2014/61/CE13 on broadband cost reduction.
Cross-Sectoral Cooperation for Co-Deployment
According to the directive, the European Union has specified minimum rights and obligations
applicable across the European Union in order to promote cross-sectoral coordination in the
deployment of high-speed electronic communications networks.
Cross-Sectoral Network Facility Sharing
• Access to and transparency of existing physical infrastructure across sectors
Any network operator14 has the obligation to give access to its physical infrastructure for
the deployment of high-speed broadband networks (30 Mbps and more), upon written
request (including electronic means) and under fair terms and conditions, including price.
Network operators may refuse requested access for reasons related to compliance with
technical specifications, availability of space and existence of alternatives. In this case,
network operators must notify the access seeker of their refusal within two months.
For access to the physical infrastructure, public sector bodies and network operators must
provide minimum information such as location, route, access type, current occupancy of
existing infrastructure and a contact point to the access seeker. Field surveys should be
carried out at the cost of the access seeker.
• Arbitration
When commercial agreement cannot be reached between network operators and an
13 Directive 2014/61/EU of the European Parliament and of the Council of 15 May 2014 on measures to reduce the cost of deploying high-speed electronic communications networks. Available from http://eur-lex.europa.eu/legal-content/en/TXT/?uri=celex%3A32014L0061. 14 Network operator is defined as an undertaking providing construction, operation and management of roads, railway, ports and airports, as well as gas, electricity, heating and water services.

44
access seeker within two months, a dispute resolution will be conducted. The deadline for
dispute resolution is within four months.
Rights of Way Concerning Civil Works
• Coordination and transparency of planned civil works
When network operators conduct civil works, they have a right to coordinate the works,
as well as the obligation to meet any reasonable requests when civil works are provided as
public funds. This is based on the condition that any additional cost is covered by the
telecommunication service provider and the request is made duly.
Civil works must be planned six months in advance. When information about the planned
civil works is requested, the network operators have to make available minimum information
such as location, type, start date and duration of planned civil works.
• Single information points
One or more single information points should provide information on the physical
infrastructure and permits, including relevant procedures for civil works. Member States are
encouraged to submit the application for permits by electronic means. The deadline for
permit decision should be within four months of application, unless national law specifically
states otherwise.
Cooperation for co-deployment, network facility sharing and rights of way concerning civil works
may vary from country to country in the European Union. A short overview of some relevant laws in
European Union countries are explored in the subsection below.
Other Case Studies
In Austria, any telecommunication network operator can request access from an infrastructure
owner of communications, electricity, gas or similar facilities, for the joint use of the infrastructure,
including ducts. The obligation on infrastructure sharing applies not only to telecommunication
network operators, but also to other infrastructure owners. There is an obligation to provide ducts and
FOCs access at a cost-basis.15 The infrastructure owner must provide the accounted cost for deploying
the infrastructure, including acquisition cost, operation cost and cost associated with sharing.
Telecommunication network operators have access to rights of way and can construct ducts with
little interference from governments (i.e., municipalities). The national telecommunication regulator
plays a key role in facilitating dispute settlement.16
In France, public operators have rights of way on public highways and easements on private property.
Highway owners are obligated to provide access to network operators through agreement. The
national telecommunication regulator (ARCEP) have imposed the obligation on the significant market
15 Body of European Regulators for Electronic Communications, "Next Generation Access – Implementation Issues and Wholesale Products", BEREC Report, March 2010. 16 Organisation for Economic Co-operation and Development, "Public Rights of Way for Fibre Deployment to the Home", OECD Digital Economy Papers, No. 143, OECD Publishing, Paris. Available from https://www.oecd-ilibrary.org/science-and-technology/public-rights-of-way-for-fibre-deployment-to-the-home_230502835656.

45
power (SMP) operator (France Telecom) to: (1) grant access for reasonable requests; (2) make capacity
available where constraints exist; and (3) provide planning information to prevent SMP operator’s
abuse of its monopoly on the French telecommunication infrastructure. Calculation of the pricing is
based on the amount of duct area occupied by the cable. The effective area is calculated by multiplying
the cross-sectional area of the cable.17
Access seekers can go to online systems for requesting duct location and availability information.
Information needs to be provided within two months of receiving an access request for existing
infrastructure. Decisions on whether to accept or refuse the request must be made within two months.
When duct space is not sufficient to meet the requirements of the access seeker, the SMP (Orange)
may be required to deploy new sub-ducts, or the access seeker can deploy new ducts. As for FOCs,
access seekers may lay FOCs in accordance with the SMP’s specifications. In the case of access disputes
on existing infrastructure, the deadline for dispute resolution is within two months.18
Access to ducts is authorized for implementation of fibre-to-the-X network only. There is no
obligation for FOC access. There is an interesting case on access to utility infrastructure where the city
of Paris leased space in the public sewers for telecommunications in order to avoid civil works on the
roads from the 1990s to 2006.19
In Portugal, all network operators have the rights to use the public domain, including roads, for
burying, crossing or passing over, as necessary, for installation of systems, equipment and other
resources. Telecommunication network operators are obligated to provide access to ducts, poles and
other facilities to access seeker based on installation and maintenance systems, equipment and
facilities, and through an agreement.20
All entities, including energy, water and transportation providers, are obligated to grant access to
their owned or managed facilities, except the SMP, to promote synergies. Access to all available ducts
and related infrastructure suitable for electronic communication networks is provided at a cost-based
access price in an open and non-discretionary way. All entities must publish procedures and conditions
applicable to transparent access. The deadline for decision and response to any access request is
within 20 working days, and installations must be completed within four months.21 Information on
the location, route and availability of ducts is provided through an online system for access seekers.22
6.3 Construction Cost Compensation
There are rent and lease and equity investments as compensation for investment costs.
17 CSMG, “Economics of shared infrastructure access”, 2010. 18 WIK Consult, “Best practice for passive infrastructure access”, 19 April 2017. 19 Matthew Howett, “A benchmark of physical infrastructure access”, presentation made at the 12th Asia-Pacific Telecommunity Policy and Regulatory Forum, Bangkok, Thailand, 23 May 2012. 20 Organisation for Economic Co-operation and Development, "Public Rights of Way for Fibre Deployment to the Home", OECD Digital Economy Papers, No. 143, OECD Publishing, Paris. Available from https://www.oecd-ilibrary.org/science-and-technology/public-rights-of-way-for-fibre-deployment-to-the-home_230502835656. 21 ANACOM, “Portugal next generation”, 2014. 22 WIK Consult, “Best practice for passive infrastructure access”, 19 April 2017.

46
6.3.1 Rent and Lease
Investment costs can be recovered by renting or leasing infrastructure such as ducts or FOCs to the
telecommunication sector or any company that needs it.
Here, it is important to set a criterion for calculating the lease price. Generally, facility providers
(grantors) want to receive as much as possible, and service providers (grantees) want to pay as little
as possible. Therefore, the objectivity, credibility and transparency of the lease price calculation can
be a critical issue between grantors and grantees.
Actual lease cost calculation methods may have limitations due to economies of scale by country
and availability of facilities by company. Therefore, regulatory agencies in most countries regulate the
designation of obligation providers and pricing schemes. The pricing models are generally cost-based,
profit-based or retail-based models. These models are introduced in the subsection below based on
their application in the Republic of Korea.
Cost-Based Model (Cost-Plus Model)
The cost-based model is a method of calculating the lease cost based on the cost required to
construct the network infrastructure. This is also called a cost-plus model. The formula for calculating
the cost-plus is as follows:23
Lease cost = depreciation cost + operation cost + profit on the investment cost
Depreciation cost is estimated by applying the straight-line method based on the projected cost for
the constructed infrastructure and the conversion to the current cost using the inflation rate. Table 6-
10 shows the working lifetime of each infrastructure for the straight-line method based on South
Korean regulations.
Table 6-10: Network infrastructure working lifetime
Infrastructure Working lifetime
Duct 35 years
FOC 22 years
Manhole/handhole 40 years
The operation cost is calculated as the sum of operating labour cost and operating expenses. The
operating expenses may include statutory insurance, indirect expenses and general administrative
expenses. Since the appropriate profit for investment differs for each company by country, it is
necessary to set appropriate profit through negotiation among stakeholders.
The advantage of the cost-based model is that it is easy to secure policy consistency, and there is
rationality and transparency in calculating the fee for use. In addition, it is possible to prevent excessive
infrastructure construction and restrictions on competition due to differences in bargaining power. The
disadvantages include the need for accounting and engineering data to estimate costs, and there may
be the cost for adding infrastructure. Since the same price is applied to the same infrastructure, it is
also difficult to consider the competitive environment of the entrant operator.
23 Republic of Korea, Conditions of Provision of Facilities and Cost Estimation Standard Law (2014). Available from http://www.law.go.kr/admRulLsInfoP.do?admRulSeq=2200000002006#AJAX.

47
Profit-Based Model
The profit-based model is a method of estimating lease cost by the remaining profit, excluding the
appropriate profit from the sales profit generated by the service provider. The formula for calculating
the profit-based model is as follows:
Lease cost = [operating profit] – [operating cost x 10%] x 90.9091%
Operating profit excludes operating cost from operating revenue. Operating cost may include labour
cost, depreciation cost, maintenance and other operating expenses. Here, appropriate profit is about
9 per cent in the Republic of Korea, which is operating cost x 10% x 90.9091%.
The profit-based model in the Republic of Korea applies the estimated profit method, which
calculates the lease cost after estimating the profit generated by infrastructure use for the next three
years. This model includes the concept of profit distribution, which applies the method of distributing
cost to each service provider after estimating the total amount of the lease cost for infrastructure use.
The advantage of the profit-based model is that it is relatively easy to expand the infrastructure of
service providers. Moreover, the effort required to calculate the lease cost for infrastructure use and
the regulation cost are both relatively low. Also, after calculating the total amount based on the profit
of infrastructure use, the process of distributing lease cost to the incumbent operators and entrant
operators is added to consider the competitive environment of entrant operators. The disadvantages
include the lack of policy consistency with other wholesale regulations, the lack of rationality and
transparency in calculating the fee for use, and the possibility of divergence in the profit estimation
process. There is also concern that competition may be limited due to differences in bargaining power.
Retail-Based Model (Retail-Minus Model)
The retail-based model measures the cost based on the remaining charges, excluding the avoidable
cost (marketing-related expenses, etc.) from the retail price (or wholesale) traded in the market. This
is also called the retail-minus model. The formula for calculating the retail-minus is as follows:
Lease cost = retail price – avoidable cost – profit
Retail-minus is applicable only when the facility provider and the service provider provide the same
service, and the basic concept is to ensure profitability of the facility provider to maintain investment
attraction and profitability. It is mainly used by service providers to purchase completed services
wholesale and resell them in the retail market, or to allow the provision of independent service
through the use of necessary facilities.
The advantage of the retail-minus model is that it can easily estimate costs, and the cost of
regulatory enforcement for lease cost calculation is relatively low. In addition, it is possible to consider
the competitive environment of new entrants and prevent the decline of profits of service providers.
On the contrary, its disadvantages are that it can be applied only when the facility provider and service
provider offer the same service, it does not clearly reflect real discount rates such as temporary
promotions, and there is a gap between wholesale and retail service.

48
Table 6-11: Pros and cons for cost-plus, profit-based and retail-minus models
Cost-plus model Profit-based model Retail-minus model
Calculation formula
Lease cost = depreciation cost + operation cost + appropriated profit
Lease cost = [operating profit – appropriate profit] x (1-0.1%)
Lease cost = retail price – avoidable cost – appropriated profit
Pros
Policy consistency Rationality and
transparency in calculating lease cost
Prevents excessive
infrastructure construction Prevents restrictions on
competition due to differences in bargaining power
Relatively easy to expand the infrastructure of service providers
Relatively easy to calculate Regulation cost is relatively
low Possible to consider the
competitive environment of entrant operators
Easy to analyse the cost estimation
Low regulatory
enforcement cost Decreases service
providers profit loss Considers the competitive
environment of entrant operators
Cons
Needs accounting and engineering data to estimate costs
Cost for adding
infrastructure Difficult to consider the
competitive environment of entrant operators
Lack of policy consistency Lack of rationality and
transparency in calculating lease cost
Divergence in the profit
estimation process Competition restriction
due to differences in bargaining power
Applicable only when provider and user are providing the same service
Difficult to reflect the real
discount rate Gap between wholesale
and retail service
Applicable areas
Interconnection, local-loop unbundling and obligation for providing infrastructure or facility
Mobile telecommunication facilities lease
Mobile virtual network operator wholesale
Source: Korea Information Society Development Institute, “A study on costing methodology for improvement in facility
sharing policy”, 2016.
It is difficult to evaluate the best calculation method by considering only the characteristics and
advantages and disadvantages of the models. If co-deployment with the transport sector proceeds in
AP-IS, further detailed study on the cost calculation method suitable for AP-IS and other global cases
will be necessary.
7. Case Study of Utility Corridors Construction Standards
7.1 Construction Standards
The standards for duct and FOC construction may vary from country to country. The methods
introduced here is based on the criteria used for cost analysis in the data surveys on civil works and
FOC construction in Myanmar, as part of Korea Telecom’s IT infra-network expansion project in
Myanmar (2016-2020).

49
Definition of Civil Work
Civil work refers to all the physical cabling and supporting infrastructure (such as conduits, cabinets,
towers and poles), and any associated hardware (such as repeaters) located between a demarcation
point in a switching facility and a demarcation point in another switching facility or customer premise.
This includes all work for cable installation and civil work such as pipe/duct/manhole, and all related
subsidiary work inside and outside including:
• Excavation and backfilling;
• Installation for HDPE silicon-coated duct (SCD) or GI pipe, marking post and warning tape; and
• Construction of manholes/handholes.
Definition of FOC
All work for FOC installation including:
• Installation for FOC (48 core/96 core), jointing closure, ODF and termination; and
• Fusion splicing and testing.
7.1.1 Civil Work Construction Method
Figure 7-1: Civil work sequence diagram
Trench Excavation and Backfilling
Figure 7-2: Trench excavation drawing
Trench excavation and backfilling
Installation of duct pipe and warning tape
Manhole and handhole construction
Concrete marking post

50
Figure 7-3: Images of trench excavation and backfilling
Excavation Installation of pipe Installation of warning
tape Backfilling
Guidelines and specifications for trench excavation and backfilling include the following:
• Carry out trench excavation in accordance with the specifications given in Figure 7-2.
• Bottom of trench width must be 40cm, and excavation depth must be 150cm from ground
level.
• Ensure that the bottom of the trench is properly tamped, and carefully levelled and
compacted, and debris inside the trench is removed.
• If there are other underground facilities in traffic congestion area, conduct a test pit
excavation to avoid damage.
• Temporarily restore excavated road to prevent accidents.
• After backfilling, restore the excavated ground, road, footway, asphalt, concrete and related
areas to their original condition.
• In rocky areas, mountainous areas, and exceptional circumstances where there are other
underground utilities and obstacles that have already been buried, and it is not possible to
meet the requirement of 150cm trench depth from ground level, concrete reinforcement of
20-30cm or other necessary protections, such as HDPE SCD or GI/fluid conveyance pipe, must
be applied, and FOC may be laid at lesser depth.
Installation of Duct Pipe and Warning Tape
Guidelines and specifications for the installation of duct pipe and warning tape include the following:
• Following trench excavation, lay the HDPE SCD pipe on a 10cm thick bed of soft soil in the
150cm deep trench.
• Install the HDPE SCD pipe in accordance with the specifications given in Figure 7-2.
• Specifications for HDPE SCD pipe – outer diameter: 35mm and inner diameter: 29mm.
• Lay the warning tape 30cm below ground level and 60cm from the bottom level of trench
along the FOC route in order to prevent damage to FOCs that will be installed. Print caution
marks every two metres on the warning tape.

51
• Specifications for FOC warning tape – thickness: 0.1mm and width: 150mm.
• Use non-metallic couplers to connect two pieces of the HDPE SCD pipes. The couplers must
be suitable for direct burial. The couplers must also be of the push-fit type, and no other tools
or heating will be required to use these couplers.
• Specifications for duct pipes that cross a bridge –
- Ø 50mm - Ø 100mm GI pipe must be used to cross bridges to protect the FOCs that will
be installed (see Figure 7-4).
• Use u-clamps and bolts to fix the GI pipe on culverts based on bridge type (see Figure 7-5).
Figure 7-4: Bridge attachment
Figure 7-5: U-clamp and bolt details

52
Manhole and Handhole Construction
Manholes and handholes must be constructed where a new duct is to be laid along a roadside.
Figure 7-6: Images of site-cast concrete manhole construction
Excavation of manhole Placement of complete
manhole Placement of manhole base
Casting of manhole
Fixing of iron bar Completion of manhole Fixing of top slab iron
bar Installation of manhole cover
Guidelines and specifications for manhole construction include the following:
• Mark location of manholes to be constructed.
• Excavate terrain for manholes.
• Ensure that the bottom of the manhole pits are properly tamped, carefully levelled and dried.
• Manhole pit foundation work includes the following (see Figure 7.7) –
- Covering and compacting 5cm of soft soil;
- Spreading 10cm of gravel; and
- Placing 5cm of lean concrete.
• Ensure that the surfaces of the assembled metal forms are error-free.
• Check and confirm that the bottom of the manhole pits are completely dried before laying
any concrete.
• Construct manholes with reinforced concrete or concrete bricks, using ready-mixed or site-
mixed concrete.
• Composition ratio of concrete-mixing –
- Stone chips (20mm) : Sand : Portland Cement = 3 : 1.5 : 1
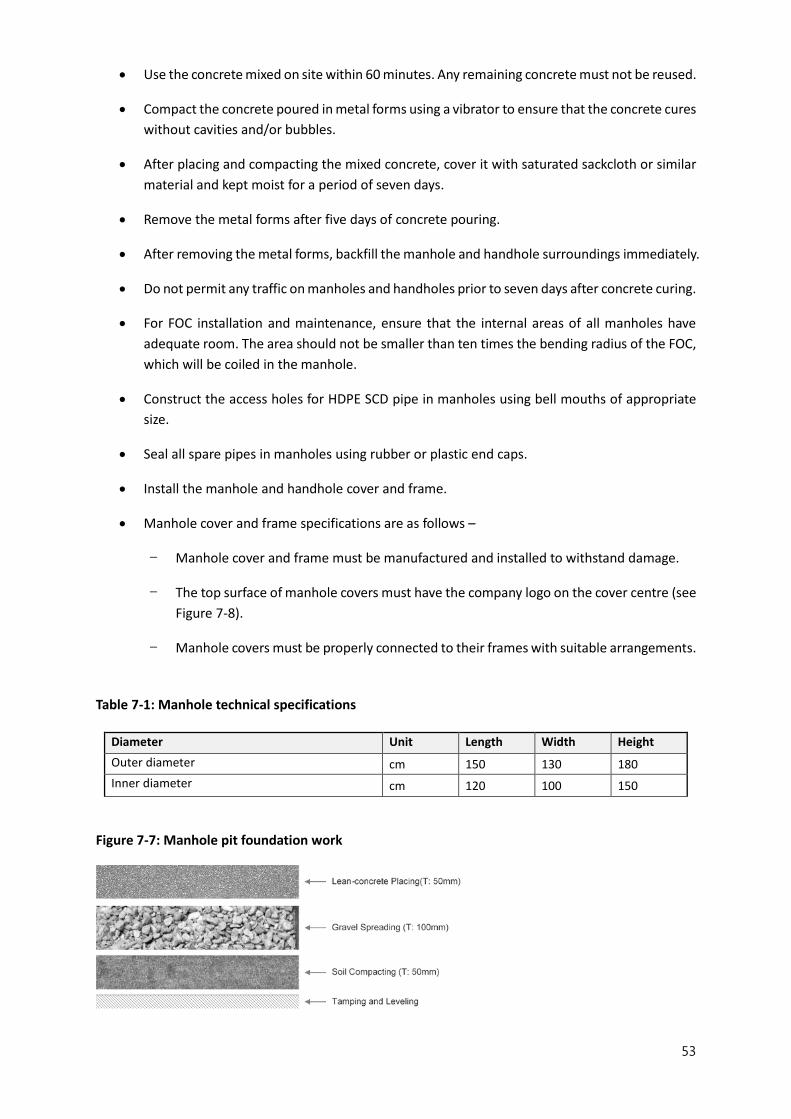
53
• Use the concrete mixed on site within 60 minutes. Any remaining concrete must not be reused.
• Compact the concrete poured in metal forms using a vibrator to ensure that the concrete cures
without cavities and/or bubbles.
• After placing and compacting the mixed concrete, cover it with saturated sackcloth or similar
material and kept moist for a period of seven days.
• Remove the metal forms after five days of concrete pouring.
• After removing the metal forms, backfill the manhole and handhole surroundings immediately.
• Do not permit any traffic on manholes and handholes prior to seven days after concrete curing.
• For FOC installation and maintenance, ensure that the internal areas of all manholes have
adequate room. The area should not be smaller than ten times the bending radius of the FOC,
which will be coiled in the manhole.
• Construct the access holes for HDPE SCD pipe in manholes using bell mouths of appropriate
size.
• Seal all spare pipes in manholes using rubber or plastic end caps.
• Install the manhole and handhole cover and frame.
• Manhole cover and frame specifications are as follows –
- Manhole cover and frame must be manufactured and installed to withstand damage.
- The top surface of manhole covers must have the company logo on the cover centre (see
Figure 7-8).
- Manhole covers must be properly connected to their frames with suitable arrangements.
Table 7-1: Manhole technical specifications
Diameter Unit Length Width Height
Outer diameter cm 150 130 180
Inner diameter cm 120 100 150
Figure 7-7: Manhole pit foundation work

54
Figure 7-8: Manhole top slab and cover
Figure 7-9: Cross sections of a manhole
Guidelines and specifications for handhole construction include the following:
• Decide on the location of handholes after route survey and completion of detailed designs.
• Construct handholes to secure splice closures and length of extra cable for easy operation
and maintenance of FOC.
• For duct entry to handholes, use bell mouths with rubber end caps and appropriate holes for
HDPE SCD pipes. Seal all unused duct entry through bell mouths with rubber or plastic end
caps.
• Construct handholes between cities for straight routes and at the points of FOC splicing. On
zigzag road sections, the span between handholes must be based on the tension of FOC
installation.
• Construct handholes in three parts with the reinforced concrete pieces for easy opening and
closing.

55
• Handhole pit foundation work includes the following (see Figure 7.10) –
- Tamping and levelling the bottom of the handhole pit after excavation;
- Covering and compacting 2cm of soft soil;
- Spreading 4cm of gravel; and
- Placing 2cm of lean concrete.
• Use the concrete mixed on site within 60 minutes. Any remaining concrete must not be
reused.
Table 7-2: Handhole technical specifications
Diameter Unit Length Width Height
Outer diameter cm 100 100 100
Inner diameter cm 80 80 80
Figure 7-10: Handhole pit foundation work
Figure 7-11: Handhole top slab

56
Figure 7-12: Cross sections of a handhole
Concrete Marking Post
Guidelines for installing concrete marking posts include the following:
• Install concrete marking posts at every 100-300m along the FOC route, according to
geographical, topographical and environmental conditions.
• Divide the concrete marking posts into two types—one for marking the FOC route and
another for marking the location of manholes/handholes.
• Install concrete posts for marking the location of manholes/handholes at the locations of
manholes/handholes to be constructed.
Figure 7-13: Concrete marking post
7.1.2 FOC Construction Method
The geometrical structure and optical characteristics described below meet the recommendations
of the International Telecommunication Union (ITU) standard—ITU-T G.652D, and the test method
meets the standards of the International Electrotechnical Commission (IEC)—IEC 60793-1 and IEC
60793-2.
Figure 7-14: FOC sequence diagram
FOC installation FOC splicing and
connection FOC termination
FOC test and measurement

57
FOC Installation
Guidelines for FOC installation include the following:
• Install the FOC into the HDPE SCD pipe in the spare duct using FOC blowing machines or
manpower, for easy operation and maintenance.
• Ensure that the FOC bending radius is not less than 20 times the cable’s outer diameter.
However, if tensile stress affects the FOC, the bending radius must not be less than 25 times
the cable’s diameter.
• Consider the following FOC arrangement in manholes and handholes (see Figure 7-15) –
- The FOC coiled in manholes and handholes must not exceed the FOC’s acceptable
bending radius, for future maintenance.
- The coiled FOC must be attached with tie-wraps on cable racks installed in manholes. In
handholes, the coiled FOC must also be properly attached, either on the wall or at the
bottom of the handholes.
• After completing the FOC installation and splicing, place 10m of spare FOC in the manholes
and handholes, for easy operation and maintenance.
• Attach the GI pipe of 50mm (or 100mm) to bridges/culverts.
• Attach U-clamps and bolts at intervals of 1m to fix the pipe on the bridges/culverts.
• FOC splicing on bridges is not allowed.
For FOC technical specifications see Table 7-3, and for FOC mechanical and environmental properties
see Table 7-4.
Figure 7-15: FOC arrangement in manholes

58
Table 7-3: FOC technical specifications in ITU-T.G652D
Item Specification
ITU – T.G652D
Geometrical characteristics
Effective group index (step index) @1,310nm @1,550nm and 1,625nm
1.467 1.468
Mode field diameter @1,310nm 9.2 ± 0.4 ㎛
Core/Clad concentricity error ≤ 0.5 ㎛
Cladding diameter 125 ± 0.7 ㎛
Cladding non-circularity ≤ 1.0 %
Coating diameter (Uncolored) 245 ± 10 ㎛
Optical characteristics
Cutoff wavelength (λ cc) ≤ 1,260nm
Attenuation coefficient @1,310nm maximum @1,383nm maximum @1,550nm maximum @1,625nm maximum
≤ 0.36 dB/km ≤ 0.32 dB/km ≤ 0.22 dB/km ≤ 0.24 dB/km
Bending loss @1625nm 30mm mandrel radius, 100 turns
≤ 0.05 dB
Attenuation uniformity ≤ 0.05 dB
Chromatic dispersion coefficient @1,285-1,330nm @1,290-1,330nm @1,550nm
≤ 3.2 ps/nm.km ≤ 2.8 ps/nm.km ≤ 18 ps/nm.km
Zero dispersion wavelength 1,300-1,322nm
Zero dispersion slope ≤ 0.092 ps/nm2km
PMD link design value ≤ 0.08 ps/√ km
PMD (maximum individual fibre) ≤ 0.2 ps/√ km
Mechanical characteristics
Proof test level 115 kpsi (0.8Gpa)
Coating strip (nominal) 1-5 N

59
Environmental characteristics
Temperature dependence (-60℃ - +85℃)
≤ 0.05 dB/km (@1,310nm/@1,550nm)
Temperature-Humidity cycling (-10℃ - +85℃/98% relative humidity)
≤ 0.05 dB/km (@1,310nm/@1,550nm)
Note: PMD = Physical Medium Dependent Source: ITU, “Recommendation ITU-T G.652: Characteristics of a single-mode optical fibre and cable", November 2009. Available from https://www.itu.int/rec/T-REC-G.652/en.
Table 7-4: FOC mechanical and environmental properties in IEC 60794-1
Item Test method Test condition
Tensile strength IEC 60794-1-E1
Tensile load: 2,800N for 48 core cable 3,400N for 96 core cable
Duration: 10 minutes
Cable length: not less than 100m
Crush IEC 60794-1-E3
Crush load: 4400N
Plate size: 100mm
Duration: 1 minute
Impact IEC 60794-1-E4
Impact energy: 10J (10 N.m)
Impact diameter: 25mm
Impact number: 10 points
Repeated bending
IEC 60794-1-E6
Test length: 1m
Applied load: 25kg
Bending radius: 20×cable diameter
Bending cycles: 20
Torsion IEC 60794-1-E7
Test length: 2m
Applied load: 50kg
Twist angle: ±180 degrees
Twist cycles: 10
Temperature cycling
IEC 60794-1-F1
Temperature change: +20℃→ -30℃→ +70℃→ +20℃
Duration: 24hrs at each step
Test cycles: 1
Water penetration
IEC 60794-1-F5
Cable length: 3m
Water height: 1m
Duration: 24 hrs
Source: IEC, "IEC 60794-1-2:2017 – Optical fibre cables - Part 1-2: Generic specification - Basic optical cable test procedures
- General guidance", 12 January 2017. Available from https://webstore.iec.ch/publication/33149.

60
FOC Splicing and Connection
The two main ways of joining FOCs are: (1) FOC splicing by fusion splicing machine; and (2) cable
sheath jointing by FOC closure.
Fusion splicing is the process of fusing or welding two fibres together usually by an electric arc. Fusion
splicing is the most widely used method of splicing as it provides for the lowest loss and least
reflectance, as well as the strongest and most reliable joint between two fibres.
Guidelines for FOC splicing include the following:
• Preparation work – Prepare FOC closure and install FOC into the closure.
• Cable stripping – Strip cable jacket and remove cable sheath.
• Removal of fibre-optic core coating – Remove the coated part of the fibre-optic core with
fibre optical stripper.
• Fibre-optic core cleaving – Cut the fibre-optic core with fibre optical cleaver.
• Fusion splicing – Splice the fibre-optic core with fusion splicing machine.
• Protection of the spliced core – Cover the spliced core with heat-shrinkable sleeve and shrink
the sleeve.
• Arrangement of the spliced cores – Arrange the spliced cores on the splice tray in the FOC
closure.
• Completion of FOC splicing – Close the FOC closure and hang the FOC closure on the wall or
bottom of manholes/handholes.
• Ensure that the splice loss of the FOC does not exceed 0.14dB. In the case that splice loss
exceeds 0.14dB, the FOC must be re-spliced until it becomes 0.14dB or less.
• A fibre joint closure is used as a branch out splicing point in fibre-optic networks.
Figure 7-16 shows the FOC joint closure installation procedure.
Figure 7-16: FOC joint closure installation procedure
Procedure Description
Separate the cable entry from the gasket in the insertion part of the lower enclosure.
Make a hole in the cable entry packing and insert the cable.

61
Strip 12cm of the cable sheath. Cut the cable tensile wire, leaving 8cm of reserve.
Strip the coating of the loose tube leaving 9cm of reserve. Remove the jelly and insert the protection tube. The length of
protection tube should be about 27cm.
Wrap the cable holder once with insulating tape to protect the cable.
Apply vacuum grease to the groove of the lower enclosure entry, align the cable at the lower enclosure, and fix the tensile wire using the correct electric tool.
Using the correct electric tool, fix the cable entered to the cable holder.
Use the same method for the opposing side. After finishing, put it in the lower enclosure.
Fix the protection tube at the splice tray using a small-type cable tie.
Arrange the spliced fibre-optic cores neatly on the splice tray.
Insert the spliced cores in the splice tray. After insertion, rearrange the spliced fibre-optic cores neatly on
the splice tray.
After connection, cover the splice tray. Fix it strongly with a band. Using a large cable tie, fix the cable entering the bottom of the
groove again. Apply grease at the bottom of the plastic part and insert the gasket
in the groove in the lower enclosure.

62
Adjust the groove of the upper and lower enclosure and cover the upper part.
Assemble the exterior closure bolt diagonally.
Assemble the support-pole holder.
FOC Termination and Test
There are two ways to terminate the FOC: (1) with connectors that can mate two fibres to create a
temporary joint and/or connect the fibre to a piece of network gear; or (2) with splices that create a
permanent joint between the two fibres.
The FOC that has pulled into nodes must be accommodated in the ODF after being connected with
the optical jumper cord by fusion splicing, and then the cords can be connected with optical adapters
in the ODF for FOC termination and testing.
The OTDR and the optic power meter must be used to measure the fibre loss throughout all nodes
that have been linked with the FOC.
The backscattering method is employed to detect optical faults. Light propagating through an FOC
gradually attenuates due to Rayleigh scattering. Faults are thus detected by monitoring the variation
of part of the backscattered light. Since the backscattered light attenuates exponentially as it travels
along the FOC, the attenuation characteristic is represented in a logarithmic scale graph. If the slope
of the graph is steep, then power loss is high. If the slope is gentle, then the optical fibre has a
satisfactory loss characteristic.
The backscattering method using the OTDR must be performed for FOC test and measurement. The
OTDR must be used to measure the length of the FOC and its overall attenuation, including the losses
of fusion splice and connector. In addition, the OTDR must be used to find fault and error locations due
to damage by measuring optical return loss. More specifically:
• Carry out the OTDR test for the completed FOC link between nodes.
• Ensure that the connector loss installed in the ODF does not exceed 0.5dB.
• Ensure that the attenuation coefficient of the FOC does not exceed 0.22dB/km at 1,550nm
and 0.36dB/km at 1,310nm.
• Ensure that the total loss of FOC link does not exceed the calculated allowable loss of the link
at the wavelengths of 1,310nm or 1,550nm.
• After completion of all FOC construction, perform bidirectional measurements using the
OTDR and power meters for all FOC routes (between transmission nodes) to graph the test
results.
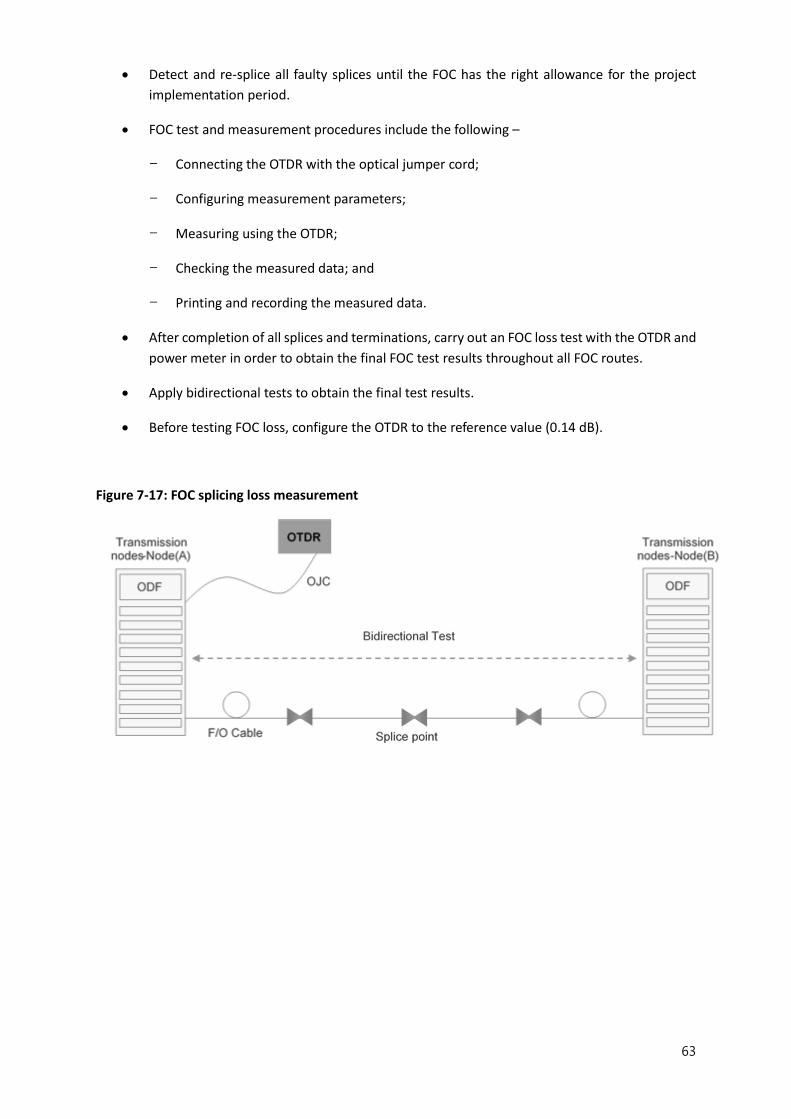
63
• Detect and re-splice all faulty splices until the FOC has the right allowance for the project
implementation period.
• FOC test and measurement procedures include the following –
- Connecting the OTDR with the optical jumper cord;
- Configuring measurement parameters;
- Measuring using the OTDR;
- Checking the measured data; and
- Printing and recording the measured data.
• After completion of all splices and terminations, carry out an FOC loss test with the OTDR and
power meter in order to obtain the final FOC test results throughout all FOC routes.
• Apply bidirectional tests to obtain the final test results.
• Before testing FOC loss, configure the OTDR to the reference value (0.14 dB).
Figure 7-17: FOC splicing loss measurement