a study on female customer satisfaction on hair oil and...
TRANSCRIPT
International Journal of Management Studies ISSN(Print) 2249-0302 ISSN (Online)2231-2528 http://www.researchersworld.com/ijms/
Vol.–V, Special Issue - 4, August 2018 [23]
DOI : 10.18843/ijms/v5iS4/03
DOIURL :http://dx.doi.org/10.18843/ijms/v5iS4/03
A Study on Female Customer Satisfaction on Hair
Oil and Beauty Cream with Special Reference to
Himalaya Products in Coimbatore District
A. Saravanakumar,
Asst. Professor in Commerce,
Rathinam College of Arts and Science,
Eachanari, Coimbatore, Tamilnadu,, India.
Santhosh Kumar Bojan,
Asst. Professor in Commerce,
Rathinam College of Arts and Science,
Eachanari, Coimbatore, Tamilnadu, India.
ABSTRACT
Customer satisfaction is a measure of how an organization‟s total product performs in relation to a
set of customer requirements. Organizations have invested heavily in improving performance in
areas that make a strong contribution to customer satisfaction, such as quality and customer
service. A highly satisfied customer generally stays loyal longer, buys more as the company
introduces new products and upgrades existing products. Fast-Moving Customer Goods (FMCG)
is products that are sold quickly and at relatively low cost. Marketing concepts that encompass a
customer's impression, awareness and consciousness about company offerings. Customer
perception is typically affected by advertising, reviews, public relations, social media, personal
experiences and other channels. Himalaya products are one of the great competitors of FMCG
products in the market. Customer satisfaction is derived when he compares the actual performance
of the product with the performance he expected out of the usage. The primary objective of this
study is to understand the customer perception and satisfaction studying the awareness of the
products within the customers and the number of customers who consumes the cosmetics.
Keywords: Himalaya Products, Customer Behaviour, Customer Behaviour of Women Customer
satisfaction.
INTRODUCTION:
The Himalaya drug company was founded in 1930 by Mr.M.MANAL with a clear vision to bring Ayurvedha to
society in a contemporary from and to unravel the mystery behind the 5000 year old system of medicine. This
included referring to ancient ayurvedic texts, selection in indigenous herbs and subject the formulation to
modern pharmacological, toxicological and safety tests to create new drugs and therapies.
The company is focused on developing safe, natural innovation remedies that will help people lead richer,
healthier live today, himalaya products have been endorsed by over 2, 50,000 doctors around the globe and
customers in over 90 country‟s rely on himalaya for their health and personal care needs. Himalaya herbals is
the range of 100% natural and safe products with rare herbs collected from the foothills of the Himalayas. Each
product combines the best of Ayurvedha with years of dedicated research. Batch to batch performance and
complete purity and safety are assured through the application of advanced pharmaceutical technology at every
stage of manufacture. So, go ahead and give us a try! We guarantee that you will be pleased.
HISTORY:
Every year, 300 million Himalaya products enter the homes of customers around the world. With a range of
over 300 healthcare and personal care products including brands like Liv.52, Cystone, and Bonnisan, we touch
International Journal of Management Studies ISSN(Print) 2249-0302 ISSN (Online)2231-2528 http://www.researchersworld.com/ijms/
Vol.–V, Special Issue - 4, August 2018 [24]
the lives of millions of customers worldwide, giving them products that help them lead healthier, enriched lives.
Himalaya's story began way back in 1930. A curious young man riding through the forests of Burma saw
restless elephants being fed the root of a plant, Rauwolfia serpentina, which helped pacify them. Fascinated by
the plant's effect on elephants, this young man, Mr. M. Manal, the founder of Himalaya, wanted to scientifically
test the herb's properties. With no money and only a pocketful of dreams, he pawned his mother's jewellery to
buy a hand-operated tabulating machine. The years that followed were a time of endurance and a test of the
young man's patience, strength and passion. He spent his days learning about herbs from neighbourhood healers
and his nights working on the machine to make a few hundred tablets. His vision was to 'bring the traditional
Indian science of Ayurveda to society in a contemporary form'.
In a time when herbal products were regarded with scepticism, our founder's belief in the healing power of
herbs was unwavering. He felt that if people were offered safe and effective herbal medicines, they would come
to accept them as part of their healthcare routine. He believed that herbal medicines could and should be
evaluated on the same quality and efficacy parameters as conventional medicine. This was possible through
empirical research. Once scientific research proved that herbal products worked, even doctors could be won
over. This was a big dream with big challenges. But he persevered on despite the obstacles. After four years of
researching the herb Rauwolfia serpentina, Serpina, the world's first natural antihypertensive drug was launched
in 1934. The discovery set the future course for Himalaya. It taught us the value of scientific research. It also
taught us the importance of patience, passion and perseverance. We have since focused on converting
Ayurveda's herbal tradition into a range of proprietary formulations dedicated to healthy living and longevity.
With a history spanning eight decades in the area of herbal research, Himalaya shares a close relationship with
nature. We are in the business of not only promoting good health but also safeguarding the health of our planet.
Ever since our inception, we have taken great care to protect biodiversity, collect herbs in a sustainable way and
promote good agricultural practices.
In 1955, Himalaya introduced Liv.52, a liver formulation that ensures optimum liver function. The product soon
became our flagship brand and a top selling herbal medicine. Other brands soon followed including Cystone,
Bonnisan and Rumalaya forte, products that went on to become household names. In 1999, Himalaya entered
the personal care segment under the brand name 'Ayurvedic Concepts'.This was unchartered territory which
brought with it new challenges and new opportunities for learning. People around the world were waking up to
the benefits of herbal and natural products for their personal care needs. Himalaya had close to seven decades of
research experience in herbal medicine and this legacy had helped us understand the world of herbs. The
prospect of entering the personal care space was therefore exciting. We wanted to give customers herbal
personal care products that were mild, gentle, hard-working and steeped in science! Our guiding philosophy
was to develop a range of personal care products rooted in Ayurveda and backed by research, a mainstay of the
Himalaya brand. By remaining true to our research ethic, we built credibility for our range of herbal personal
care products and gained the trust of our customers. A year later, we expanded our portfolio to include animal
health products with the objective of caring for the health and well-being of animals. With our expanding range
of products and growth in international markets, Himalaya underwent a rebranding where the entire range was
brought under a single umbrella- Himalaya Herbal Healthcare. With the present portfolio of pharmaceuticals,
personal care, baby care, well-being and animal health products, Himalaya has evolved into a 'head-to-heel'
herbal wellness company.
After close to 88 years, we remain committed to enriching the lives of people who use our products. Himalaya's
therapeutic products have brought relief to people suffering from ailments like liver disorders, diabetes to
kidney stones and joint disabilities. Our personal care range captures the best in nature and science, giving our
customers products that are gentle, effective and safe for long-term use. Our vision is to offer wellness in every
home and for the whole family through our herbal healthcare and personal care products. Today, the Himalaya
brand is synonymous with safe and efficacious herbal products. Starting off operations in Dehradun way back in
the 1930s, the company later spread its wings to Mumbai and across the country. In 1975, the company set up
an advanced manufacturing facility in Makali, Bengaluru, India. In 1991, the company relocated its R & D
facility to Bengaluru. We operate in over 90 countries, our products are prescribed by 400,000 doctors
worldwide, and millions of customers trust us for their health and personal care needs. Himalaya Global
Holdings Ltd. (HGH) is the parent of all Himalaya subsidiaries.
ITEMS OF THE PRODUCTS:
HAIR Items:
Anti-Dandruff Hair Cream
International Journal of Management Studies ISSN(Print) 2249-0302 ISSN (Online)2231-2528 http://www.researchersworld.com/ijms/
Vol.–V, Special Issue - 4, August 2018 [25]
Anti-Dandruff Hair Oil
Anti-Dandruff Shampoo
Anti-Dandruff Conditioner
Anti-Hair Fall Cream
Anti-Hair Fall Hair Oil
Anti-Hair Fall Shampoo
Anti-Hair Fall Conditioner
Damage Repair Protein Conditioner
Damage Repair Protein Shampoo
Dryness Defense Protein Shampoo
Dryness Defense Detangler & Conditioner
Gentle Daily Care Protein Conditioner
Gentle Daily Care Protein Shampoo
Himalaya Hair Detangle and Conditioner
Himalaya Herbals Protein Hair Cream
Himalaya Herbals Revitalizing Hair Oil
Himalaya Hairzone Solution for Hairloss
BEAUTY Items:
BE Anti-Wrinkle Cream. Helps fight wrinkles, naturally
Clear Complexion Whitening Day Cream
Lightens and evens skin tone
Clear Complexion Whitening Face Scrub
Deep Cleansing Apricot Face Wash
Fairness Kesar Face Pack
Fairness Kesar Face Wash
Gentle Exfoliating Apricot Scrub
Gentle Exfoliating Walnut Scrub
Customer Behaviour:
The field of customer behaviour tells us that how individuals, groups and organizations select, buy, use, and
dispose of goods, services, ideas, or experiences to satisfy their needs and desires. Understanding customer
behaviour is never simple, because customers may say one thing but do another. They change their minds at the
last minute. Companies can use it as a strategic tool for making profit by understanding that how and why
customers buy.
Customer Behaviour of Women:
Women are most powerful customers in the world as they control almost 80 percent of the household spending.
And no longer can the women‟s spending powers and influence be neglected. The role of women in the society
and their effects has changed. Most of the marketers know that „women are different‟, but we actually need a
deep rooted understanding of how and why they are different. Not all female are women, some are girls; not all
women are moms; not all moms are women; they may or may not be „forever young‟. What is important to
analyze are the multiple roles that a female plays in her everyday life. A marketer cannot ignore her role as a
mom and talk to her as a girl or women, and similarly a girl cannot be approached like a woman. Purchases are
emotionally significant and communication is important throughout the buying decision.
Buying Behaviour of Women:
Once women identify the need of a value, their first step towards buying is information search. They want a
product that meets their demands and is easy and reliable. Women would try to get benefit from others‟
experience by asking the people around them. They prefer doing a front end research. Women would want
detailed information from the staff and other people and attributes like opinion of her mates, the reputation of a
company, environment of the store, price of a product/service would matter more. Women usually start with a
generalized sense of their need and then continue to evaluate alternatives.
International Journal of Management Studies ISSN(Print) 2249-0302 ISSN (Online)2231-2528 http://www.researchersworld.com/ijms/
Vol.–V, Special Issue - 4, August 2018 [26]
Customer Satisfaction:
Customer satisfaction is a measurement used to quantify the degree to which a customer is happy with a
product, service, or experience. Customer satisfaction is a critical concept for customer success professionals to
understand and live by, and it's actually about more than a money-back guarantee. In this study, to discussing
customer satisfaction: what it is, and why it's important for business to start measuring. When it comes down to
it, customer satisfaction is a reflection of how a customer feels about interacting with brand. And businesses and
brands quantify this positive or negative feeling primarily using surveys.
REVIEW OF LITERATURE:
Anumesh Kariappa, (2016), this study to know the customer satisfaction of Indulekha products in Kasarkode
market. This study assists to identify the opinion of the customers of Indulekha products. To assess the customer
awareness about Indulekha brand. For the purposes of the study data collected are analyzed and arrived on some
conclusions. The research is conducted with the help of well formed questionnaire to make this study in a better
way and collected data from each sides of the kasarkode district and over 100 respondents are interviewed from
the different parts of the District. It is concluded that customer satisfaction is the important thing in the
marketing concept. Because without satisfying customers a company which cannot sustain in the market
forever , not only that customers mind is a changing one.
M.Banu Rekha and K.Gokila, (2015), the study has been understand the customer attitude of the different strata
people in the Indian society especially in Coimbatore city, Tamil Nadu towards Herbal Cosmetic Products. The
classification of the different strata of the people in area wise, gender wise, age wise, income wise, etc., The
research design adopted in the study was descriptive design, which is concerned with the descriptive of a group.
In descriptive research in such a way that the respondents is able to understand clearly what the researcher
wants and provides distinct information to measure the data. The data has been collected from the users of
herbal cosmetics products. A sample of 50 respondents was taken into account for finding their uses for the
herbal cosmetic products. It is concluded that the people now are not considering the cosmetics as luxury, most
of the customers feel that there are more chemicals in cosmetics, which cause many side effects, and started
switching over to herbal based cosmetics.
Dr. M. Rajarajan, (2016), It is to examine the customer‟s behaviour of herbal cosmetic products because customer
behaviour is a very complicated field of study. There are many factors, which affect the behavour of customers
which purchasing, using and evaluating the products. They are changes is fashion, technology and so on, different
types of user‟s skin, changes in customer attitude and so on. The first problem is the change in fashion, technology
and so on. Modernity first makes its headway in urban areas. Not only economic & technological advancements
find their place primarily in cities, but also new trends in fashion and personal health.
V.P.T. Dhevika, O.T.V Latasri and Libya Sangeetha Sharmila, (2013), this study is to investigate how the
respondents are influenced by factors of brand loyalty towards hair oil brands. Brand loyalty is important for an
organization to ensure that its product is kept in the minds of customers and prevent them from switching to
other brands. Product quality plays a significant role in influencing customers to be brand loyal customers. Four
hypotheses are accepted and two hypotheses are rejected.
Vanessa Apaolaza-Ibáñez, Patrick Hartmann, Sandra Diehl and Ralf Terlutter, (2011), conducted on a sample of
355 women aged 18 to 60, selected through random sampling (random street interviews) and establishing an
age quota (50% between 18 and 35 years, 50% between 36 and 60 years). The study focused on anti-aging and
body-firming/body-shaping creams, a relatively new category of cosmetic products where there are indeed no
observable short-term effects, while advertising claims refer to medium and longer-term beneficial outcomes.
The feeling of worry and/or guilt as a consequence of dissatisfaction with one‟s appearance and the perception
of not doing enough to improve may be the combined result of the exposure to attractive women in advertising.
Dr. S. Jagadeesan & G. Vani, (2017), the study analyze to the customer satisfaction towards hair oil users by
college Students in Salem City. Descriptive research method and Convenience sampling method used in the
study. The Sample Size is 70. The sources of data were primary as well as secondary. The data collected in the
Hair oil user‟s survey constitute primary data. Structured questionnaires were prepared for the customer
satisfaction to hair oil users separately for the study. It concluded that the College students prefer parachute
brand of hair oil and the factor analysis shows that value, quality, easy availability, relive dryness, suitable for
hair, better shine, attractive package and quantity are the factors influencing the purchasing of hair oil brands by
the customers.
K.Subbulakshmi P.Geethamani, (2017), the study descriptive analysis has been carried out, to study the
customer‟s perception towards cosmetic items in patanjali products. The primary data used in the study through
International Journal of Management Studies ISSN(Print) 2249-0302 ISSN (Online)2231-2528 http://www.researchersworld.com/ijms/
Vol.–V, Special Issue - 4, August 2018 [27]
questionnaire method. The secondary data were collected from various books, journals, magazines and
websites. The sample size has been taken as 50 respondents. The sampling technique used in this study is
convenient random sampling. The study concluded that most of the respondents are aware of the herbal
cosmetics. The people now are not considering the cosmetics as luxury, most of the customers feel that there are
more chemicals in cosmetics, which cause many side effects, and started switching over to herbal based
cosmetics. The cosmetic manufacturing company after realizing the need of the customer started providing
herbal based cosmetics. Many respondents feel that there is more chemical combinations in the herbal
cosmetics, which can be reduce by the manufactures, so that it would increase its usage by the customers.
Mrs. Gurmeet Kaur, 2016, The study is descriptive in nature. This study describes the customer retention and
satisfaction level towards selected herbal cosmetic products. The present study is based on primary data
collected through questionnaire administered on 100 female respondents using herbal cosmetic products in
Yamuna Nagar only. All the relevant information was obtained by conducting the interview of customers with
the help of pre tested and structured questionnaire. The present study depicts that majority of the respondents
are satisfied with quality and price of herbal cosmetic products. It is found that the respondents of all the age
group and income group are using personal care products. Herbal cosmetic products are preferred by the
respondents as compared to non herbal cosmetic products due to awareness of harmful effects of non herbal
cosmetic products.
RESEARCH METHODOLOGY:
Research in simple terms, refers to a search for knowledge. It is also known as a scientific and systematic search
for information on particular topic or issue. It is also known as the art of scientific investigation. Several social
scientists have defined research in different ways In the Encyclopaedia of Social Sciences, D. Slesinger and M.
Stephension (1930) defined research as “the manipulation of things, concept or symbols for the purpose of
generalizing to extend, correct or verify knowledge, whether that knowledge aids in construction of theory or in
practice of an art”.
Meaning of Research:
Research in simple terms, refers to a search for knowledge. It is also known as a scientific and systematic search
for information on particular topic or issue. It is also known as the art of scientific investigation. Several social
scientists have defined research in different ways In the Encyclopedia of Social Sciences, D. Slesinger and M.
Stephenson (1930) defined research as “the manipulation of things, concept or symbols for the purpose of
generalizing to extend, correct or verify knowledge, whether that knowledge aids in construction of theory or in
practice of an art”. According to Redman and Mory (1923), defined research is a “systematized effort to gain
new knowledge”. It is an academic activity and therefore the term should be used in a technical sense.
According to Clifford Woody (Kothari 1988) research comprises “defining and redefining problems,
formulating hypothesis or suggested solutions, collecting, organizing”.
Research Design :
The most important problem after defining the research problem is preparing the design of the research project,
which is popularly known as the „research design‟. A research design helps to decide upon issues like what,
when, where, how much, by what means, etc., with regard to an enquiry or a research study.
“A research design is the arrangement of conditions for collection and analysis of data in a manner that aims to
combine relevance to the research purpose with economy in procedure. In fact, the research design is the
conceptual structures within which research is conducted; it constitutes the blueprint for the collection,
measurement and analysis of data” (Selltiz, et.al. 1962). Thus, research design provides an outline of what the
researcher is going to do in terms of framing the hypothesis, its operational implications, and the final data
analysis.
According to Redman and Mory (1923), defined research is a "systematized effort to gain new knowledge". It is
an academic activity and therefore the term should be used in a technical sense. According to Clifford Woody
(Kothari 1988) research comprises "defining and redefining problems, formulating hypothesis or suggested
solutions; collecting, organizing.
OBJECTIVES OF THE STUDY:
1. To measure the level of awareness among customers towards the Himalaya Products.
International Journal of Management Studies ISSN(Print) 2249-0302 ISSN (Online)2231-2528 http://www.researchersworld.com/ijms/
Vol.–V, Special Issue - 4, August 2018 [28]
2. To ascertain the factors that influencing the customer on choosing of Himalaya Products.
3. To study about the customer level of satisfaction towards Himalaya products.
4. To offer suitable suggestion based on the study.
5. Suggestion and conclusion towards Himalaya products.
STATEMENT OF THE PROBLEM:
Different varieties of the products are available in the market customers prefer the variety of products for high
quality, low price and attractive wrappers .Most of the con summers are satisfied with quality products and
some of the customers prefer other factors each product differs from one another in terms of price, quality,
quantity, offers, advertisement etc. The competition is severe and the manufacturer has to consider the opinion
of the customers. In this context, the researcher is interested in studying the customer preference and
satisfaction towards the Himalaya products.
SCOPE OF THE STUDY:
The present study will be helpful in understanding the customer attitude of the different strata people in the
Indian society especially in Coimbatore city, Tamil Nadu towards Herbal Cosmetic Products.
The classification of the different strata of the people in area wise, gender wise, age wise, income wise, etc..,.
The study will also be helpful in analyzing the customer attitude towards the different factors identified after
the focus group discussions for the future studies by the researchers and academicians.
It will also help in studying the effect of cosmetics purchase of the study specifically among the segment
under consideration.
PERIOD OF THE STUDY:
The chosen time – period of the present study is the nearly a period of December 2017 – May 2018. This study
describes on Female customer Satisfaction on Hair products and Beauty cream with special Reference to
Himalaya Products in Coimbatore. The study is descriptive in nature. This study describes the customer
retention and satisfaction level towards selected cosmetic products. The present study is based on primary data
collected through questionnaire administered on 500 female respondents using cosmetic products in Coimbatore
only. All the relevant information was obtained by conducting the interview of customers with the help of pre
tested and structured interview schedule. To achieve the objective of the study, collected data has been analyzed
by percentage method.
METHOD OF DATA COLLECTION:
Data collection is the process of gathering and measuring information on targeted variables in an established
systematic fashion, which then enables one to answer relevant questions and evaluate outcomes. The data
collection component of research is common to all fields of study including physical and social sciences,
humanities and business. It helps scientists and analysts to collect the main points as gathered information. In
this project we use two methods
TYPES OF DATA:
1. Primary data
2. Secondary data
Primary Data:
A questionnaire is used as a tool for the systematic collection of relevant information. A well interview schedule
consisting of simple questions has been prepared and directed to the respondents.
Secondary Data:
Secondary data is collected from the company‟s websites, fact sheet etc.
Sampling: Sampling is a process used in statistical analysis in which a predetermined number of observations are taken
from a larger population. The methodology used to sample from a larger population depends on the type of
International Journal of Management Studies ISSN(Print) 2249-0302 ISSN (Online)2231-2528 http://www.researchersworld.com/ijms/
Vol.–V, Special Issue - 4, August 2018 [29]
analysis being performed, but may include simple random sampling or systematic sampling.
Sample Size: Sample size determination is the act of choosing the number of observations or replicates to include in a
statistical sample. The sample size is an important feature of any empirical study in which the goal is to make
inferences about a population from a sample. The sample size of the study 500 respondents.
Sample Design:
A sample design is made up of two elements.
Sampling method. Sampling method refers to the rules and procedures by which some elements of the
population are included in the sample. Some common sampling methods are simple random sampling ,
stratified sampling , and cluster sampling .
Estimator. The estimation process for calculating sample statistics is called the estimator. Different sampling
methods may use different estimators. For example, the formula for computing a mean score with a simple
random sample is different from the formula for computing a mean score with a stratified sample. Similarly,
the formula for the standard error may vary from one sampling method to the next.
TOOLS USED FOR THE STUDY:
Percentage Analysis for analyzing the data
No. Of respondents
Percentage = x 100
Total no. of respondent
LIMITATIONS OF STUDY:
1. The samples have been taken only from respondents.
2. This result was conducted only in particular area so this result cannot suitable to other places.
3. Data collected under this technique is subjective nature therefore they may not lead to quantitative checks.
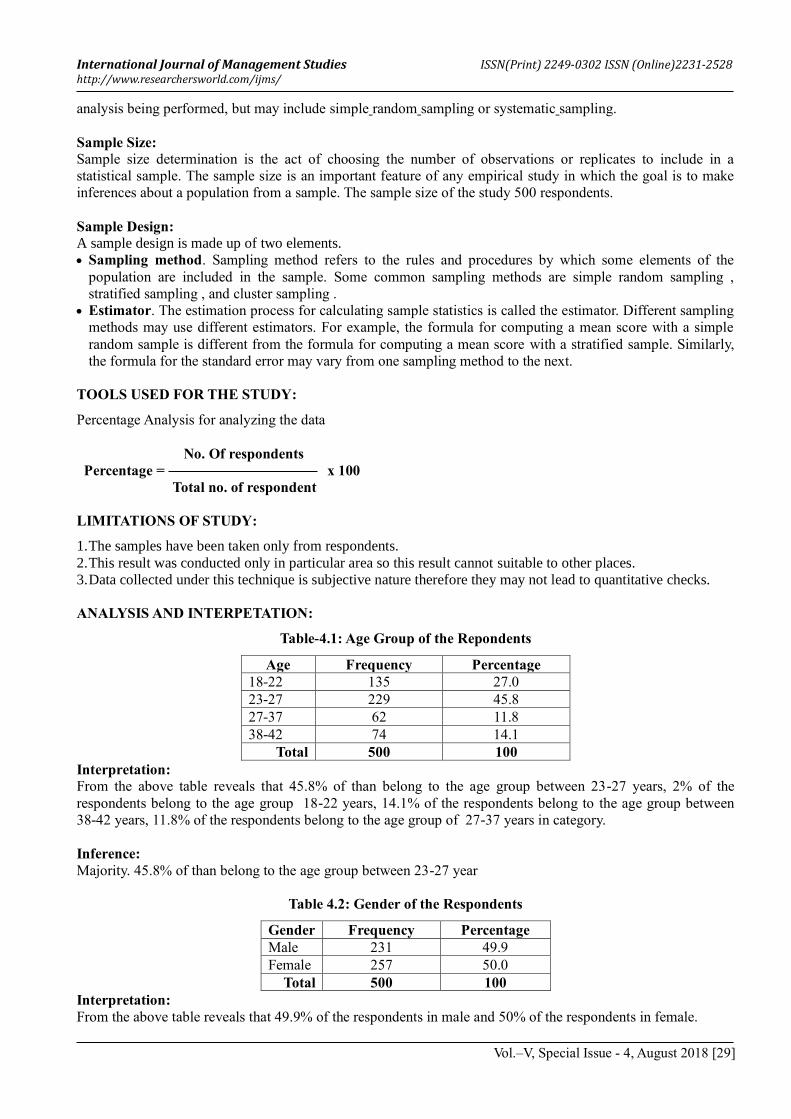
ANALYSIS AND INTERPETATION:
Table-4.1: Age Group of the Repondents
Age Frequency Percentage
18-22 135 27.0
23-27 229 45.8
27-37 62 11.8
38-42 74 14.1
Total 500 100
Interpretation:
From the above table reveals that 45.8% of than belong to the age group between 23-27 years, 2% of the
respondents belong to the age group 18-22 years, 14.1% of the respondents belong to the age group between
38-42 years, 11.8% of the respondents belong to the age group of 27-37 years in category.
Inference:
Majority. 45.8% of than belong to the age group between 23-27 year
Table 4.2: Gender of the Respondents
Gender Frequency Percentage
Male 231 49.9
Female 257 50.0
Total 500 100
Interpretation:
From the above table reveals that 49.9% of the respondents in male and 50% of the respondents in female.
International Journal of Management Studies ISSN(Print) 2249-0302 ISSN (Online)2231-2528 http://www.researchersworld.com/ijms/
Vol.–V, Special Issue - 4, August 2018 [30]
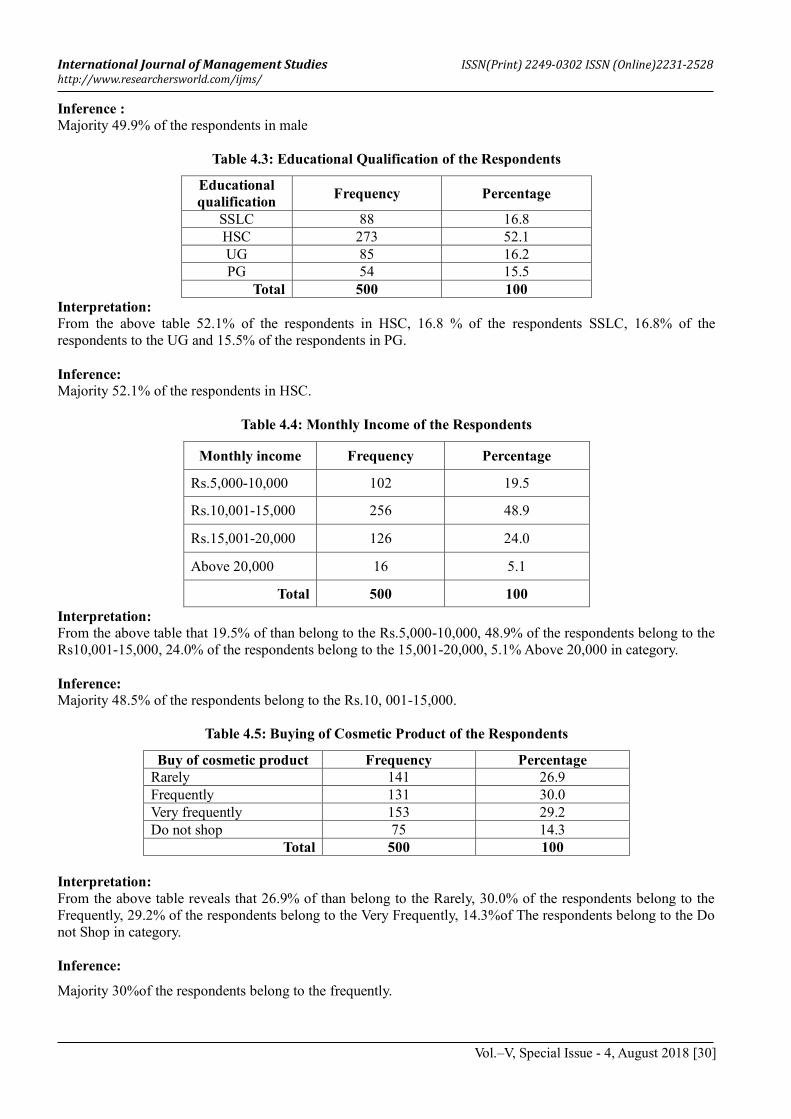
Inference : Majority 49.9% of the respondents in male
Table 4.3: Educational Qualification of the Respondents
Educational
qualification Frequency Percentage
SSLC 88 16.8
HSC 273 52.1
UG 85 16.2
PG 54 15.5
Total 500 100
Interpretation: From the above table 52.1% of the respondents in HSC, 16.8 % of the respondents SSLC, 16.8% of the
respondents to the UG and 15.5% of the respondents in PG.
Inference: Majority 52.1% of the respondents in HSC.
Table 4.4: Monthly Income of the Respondents
Monthly income Frequency Percentage
Rs.5,000-10,000 102 19.5
Rs.10,001-15,000 256 48.9
Rs.15,001-20,000 126 24.0
Above 20,000 16 5.1
Total 500 100
Interpretation:
From the above table that 19.5% of than belong to the Rs.5,000-10,000, 48.9% of the respondents belong to the
Rs10,001-15,000, 24.0% of the respondents belong to the 15,001-20,000, 5.1% Above 20,000 in category.
Inference:
Majority 48.5% of the respondents belong to the Rs.10, 001-15,000.
Table 4.5: Buying of Cosmetic Product of the Respondents
Buy of cosmetic product Frequency Percentage
Rarely 141 26.9
Frequently 131 30.0
Very frequently 153 29.2
Do not shop 75 14.3
Total 500 100
Interpretation:
From the above table reveals that 26.9% of than belong to the Rarely, 30.0% of the respondents belong to the
Frequently, 29.2% of the respondents belong to the Very Frequently, 14.3%of The respondents belong to the Do
not Shop in category.
Inference:
Majority 30%of the respondents belong to the frequently.
International Journal of Management Studies ISSN(Print) 2249-0302 ISSN (Online)2231-2528 http://www.researchersworld.com/ijms/
Vol.–V, Special Issue - 4, August 2018 [31]
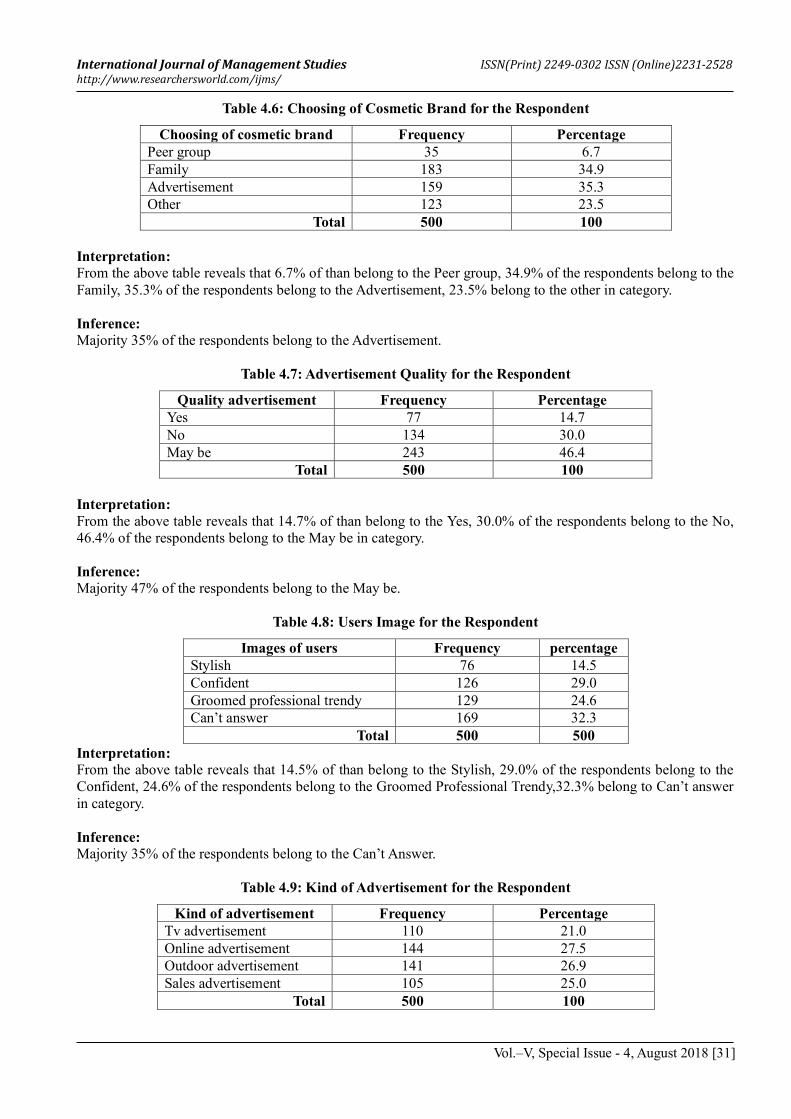
Table 4.6: Choosing of Cosmetic Brand for the Respondent
Choosing of cosmetic brand Frequency Percentage
Peer group 35 6.7
Family 183 34.9
Advertisement 159 35.3
Other 123 23.5
Total 500 100
Interpretation:
From the above table reveals that 6.7% of than belong to the Peer group, 34.9% of the respondents belong to the
Family, 35.3% of the respondents belong to the Advertisement, 23.5% belong to the other in category.
Inference:
Majority 35% of the respondents belong to the Advertisement.
Table 4.7: Advertisement Quality for the Respondent
Quality advertisement Frequency Percentage
Yes 77 14.7
No 134 30.0
May be 243 46.4
Total 500 100
Interpretation:
From the above table reveals that 14.7% of than belong to the Yes, 30.0% of the respondents belong to the No,
46.4% of the respondents belong to the May be in category.
Inference:
Majority 47% of the respondents belong to the May be.
Table 4.8: Users Image for the Respondent
Images of users Frequency percentage
Stylish 76 14.5
Confident 126 29.0
Groomed professional trendy 129 24.6
Can‟t answer 169 32.3
Total 500 500
Interpretation:
From the above table reveals that 14.5% of than belong to the Stylish, 29.0% of the respondents belong to the
Confident, 24.6% of the respondents belong to the Groomed Professional Trendy,32.3% belong to Can‟t answer
in category.
Inference:
Majority 35% of the respondents belong to the Can‟t Answer.
Table 4.9: Kind of Advertisement for the Respondent
Kind of advertisement Frequency Percentage
Tv advertisement 110 21.0
Online advertisement 144 27.5
Outdoor advertisement 141 26.9
Sales advertisement 105 25.0
Total 500 100
International Journal of Management Studies ISSN(Print) 2249-0302 ISSN (Online)2231-2528 http://www.researchersworld.com/ijms/
Vol.–V, Special Issue - 4, August 2018 [32]
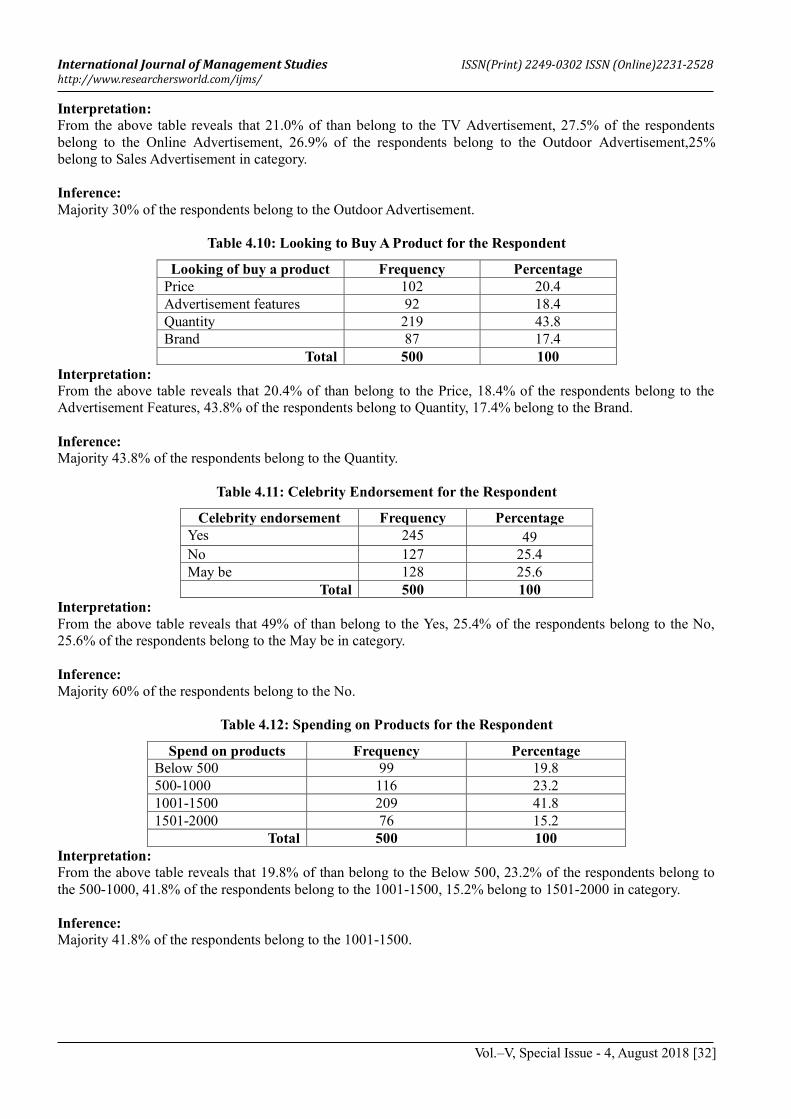
Interpretation:
From the above table reveals that 21.0% of than belong to the TV Advertisement, 27.5% of the respondents
belong to the Online Advertisement, 26.9% of the respondents belong to the Outdoor Advertisement,25%
belong to Sales Advertisement in category.
Inference:
Majority 30% of the respondents belong to the Outdoor Advertisement.
Table 4.10: Looking to Buy A Product for the Respondent
Looking of buy a product Frequency Percentage
Price 102 20.4
Advertisement features 92 18.4
Quantity 219 43.8
Brand 87 17.4
Total 500 100
Interpretation:
From the above table reveals that 20.4% of than belong to the Price, 18.4% of the respondents belong to the
Advertisement Features, 43.8% of the respondents belong to Quantity, 17.4% belong to the Brand.
Inference:
Majority 43.8% of the respondents belong to the Quantity.
Table 4.11: Celebrity Endorsement for the Respondent
Celebrity endorsement Frequency Percentage
Yes 245 49
No 127 25.4
May be 128 25.6
Total 500 100
Interpretation:
From the above table reveals that 49% of than belong to the Yes, 25.4% of the respondents belong to the No,
25.6% of the respondents belong to the May be in category.
Inference:
Majority 60% of the respondents belong to the No.
Table 4.12: Spending on Products for the Respondent
Spend on products Frequency Percentage
Below 500 99 19.8
500-1000 116 23.2
1001-1500 209 41.8
1501-2000 76 15.2
Total 500 100
Interpretation:
From the above table reveals that 19.8% of than belong to the Below 500, 23.2% of the respondents belong to
the 500-1000, 41.8% of the respondents belong to the 1001-1500, 15.2% belong to 1501-2000 in category.
Inference:
Majority 41.8% of the respondents belong to the 1001-1500.
International Journal of Management Studies ISSN(Print) 2249-0302 ISSN (Online)2231-2528 http://www.researchersworld.com/ijms/
Vol.–V, Special Issue - 4, August 2018 [33]
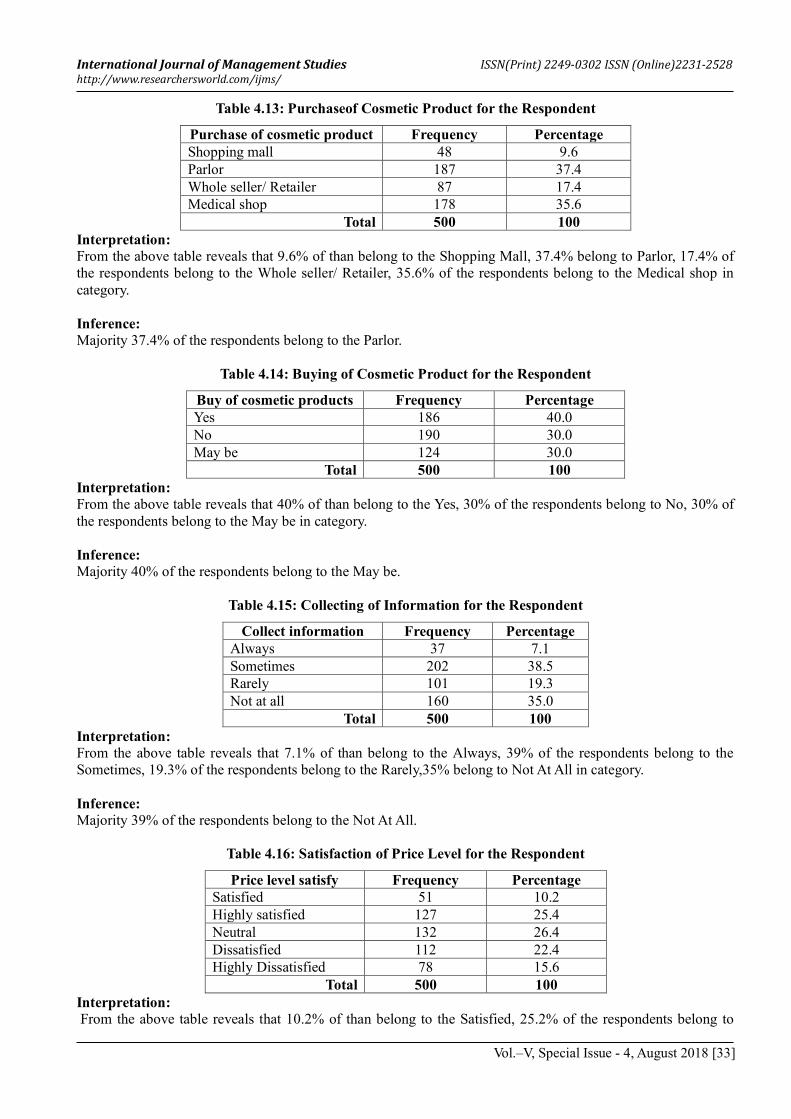
Table 4.13: Purchaseof Cosmetic Product for the Respondent
Purchase of cosmetic product Frequency Percentage
Shopping mall 48 9.6
Parlor 187 37.4
Whole seller/ Retailer 87 17.4
Medical shop 178 35.6
Total 500 100
Interpretation:
From the above table reveals that 9.6% of than belong to the Shopping Mall, 37.4% belong to Parlor, 17.4% of
the respondents belong to the Whole seller/ Retailer, 35.6% of the respondents belong to the Medical shop in
category.
Inference:
Majority 37.4% of the respondents belong to the Parlor.
Table 4.14: Buying of Cosmetic Product for the Respondent
Buy of cosmetic products Frequency Percentage
Yes 186 40.0
No 190 30.0
May be 124 30.0
Total 500 100
Interpretation:
From the above table reveals that 40% of than belong to the Yes, 30% of the respondents belong to No, 30% of
the respondents belong to the May be in category.
Inference:
Majority 40% of the respondents belong to the May be.
Table 4.15: Collecting of Information for the Respondent
Collect information Frequency Percentage
Always 37 7.1
Sometimes 202 38.5
Rarely 101 19.3
Not at all 160 35.0
Total 500 100
Interpretation:
From the above table reveals that 7.1% of than belong to the Always, 39% of the respondents belong to the
Sometimes, 19.3% of the respondents belong to the Rarely,35% belong to Not At All in category.
Inference:
Majority 39% of the respondents belong to the Not At All.
Table 4.16: Satisfaction of Price Level for the Respondent
Price level satisfy Frequency Percentage
Satisfied 51 10.2
Highly satisfied 127 25.4
Neutral 132 26.4
Dissatisfied 112 22.4
Highly Dissatisfied 78 15.6
Total 500 100
Interpretation:
From the above table reveals that 10.2% of than belong to the Satisfied, 25.2% of the respondents belong to
International Journal of Management Studies ISSN(Print) 2249-0302 ISSN (Online)2231-2528 http://www.researchersworld.com/ijms/
Vol.–V, Special Issue - 4, August 2018 [34]
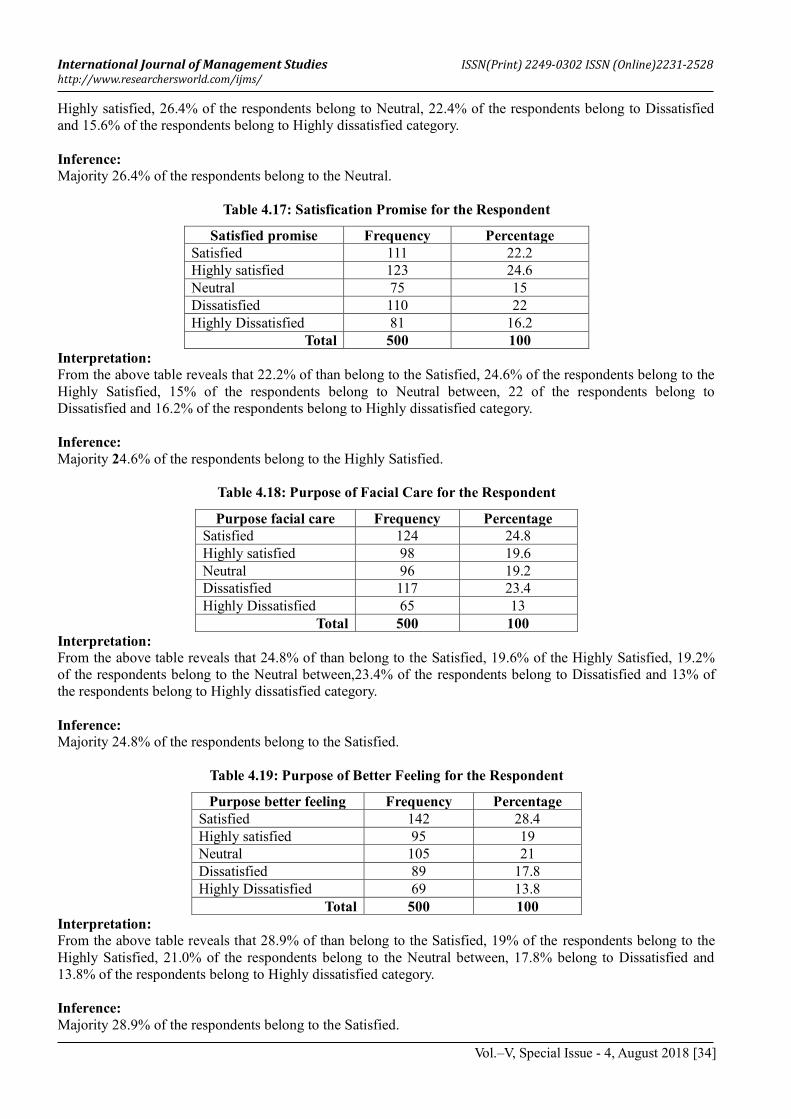
Highly satisfied, 26.4% of the respondents belong to Neutral, 22.4% of the respondents belong to Dissatisfied
and 15.6% of the respondents belong to Highly dissatisfied category.
Inference:
Majority 26.4% of the respondents belong to the Neutral.
Table 4.17: Satisfication Promise for the Respondent
Satisfied promise Frequency Percentage
Satisfied 111 22.2
Highly satisfied 123 24.6
Neutral 75 15
Dissatisfied 110 22
Highly Dissatisfied 81 16.2
Total 500 100
Interpretation:
From the above table reveals that 22.2% of than belong to the Satisfied, 24.6% of the respondents belong to the
Highly Satisfied, 15% of the respondents belong to Neutral between, 22 of the respondents belong to
Dissatisfied and 16.2% of the respondents belong to Highly dissatisfied category.
Inference:
Majority 24.6% of the respondents belong to the Highly Satisfied.
Table 4.18: Purpose of Facial Care for the Respondent
Purpose facial care Frequency Percentage
Satisfied 124 24.8
Highly satisfied 98 19.6
Neutral 96 19.2
Dissatisfied 117 23.4
Highly Dissatisfied 65 13
Total 500 100
Interpretation:
From the above table reveals that 24.8% of than belong to the Satisfied, 19.6% of the Highly Satisfied, 19.2%
of the respondents belong to the Neutral between,23.4% of the respondents belong to Dissatisfied and 13% of
the respondents belong to Highly dissatisfied category.
Inference:
Majority 24.8% of the respondents belong to the Satisfied.
Table 4.19: Purpose of Better Feeling for the Respondent
Purpose better feeling Frequency Percentage
Satisfied 142 28.4
Highly satisfied 95 19
Neutral 105 21
Dissatisfied 89 17.8
Highly Dissatisfied 69 13.8
Total 500 100
Interpretation:
From the above table reveals that 28.9% of than belong to the Satisfied, 19% of the respondents belong to the
Highly Satisfied, 21.0% of the respondents belong to the Neutral between, 17.8% belong to Dissatisfied and
13.8% of the respondents belong to Highly dissatisfied category.
Inference:
Majority 28.9% of the respondents belong to the Satisfied.
International Journal of Management Studies ISSN(Print) 2249-0302 ISSN (Online)2231-2528 http://www.researchersworld.com/ijms/
Vol.–V, Special Issue - 4, August 2018 [35]
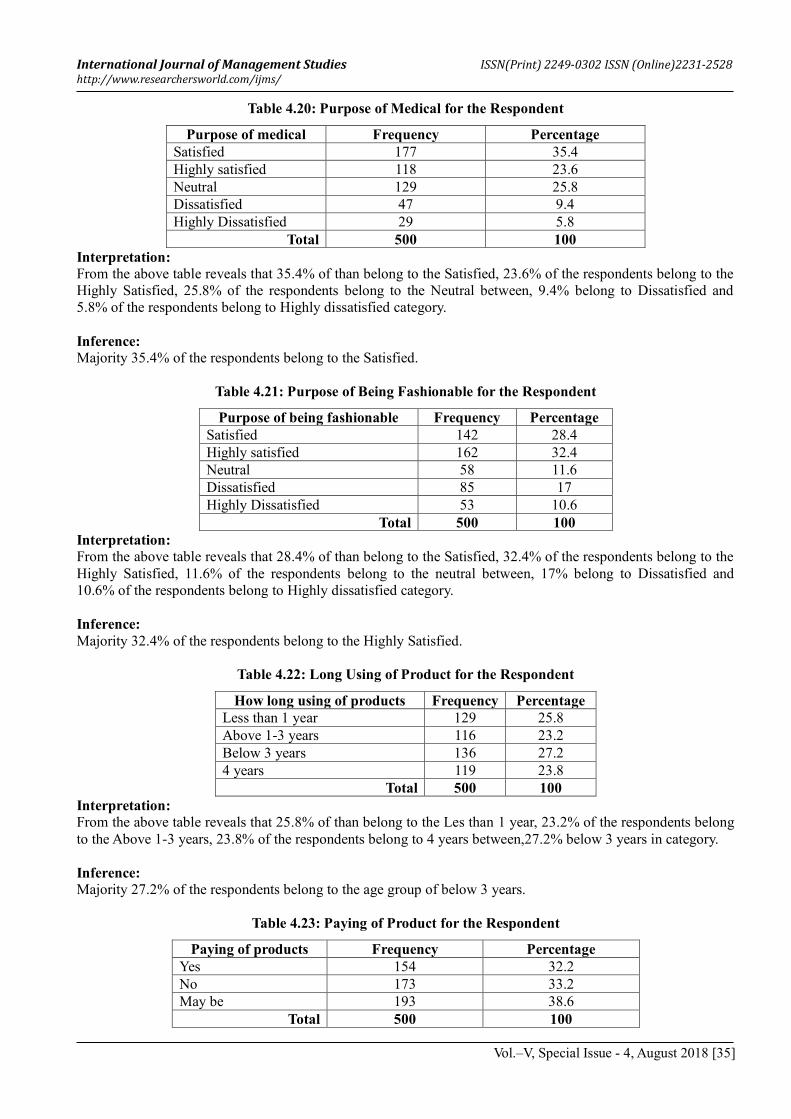
Table 4.20: Purpose of Medical for the Respondent
Purpose of medical Frequency Percentage
Satisfied 177 35.4
Highly satisfied 118 23.6
Neutral 129 25.8
Dissatisfied 47 9.4
Highly Dissatisfied 29 5.8
Total 500 100
Interpretation:
From the above table reveals that 35.4% of than belong to the Satisfied, 23.6% of the respondents belong to the
Highly Satisfied, 25.8% of the respondents belong to the Neutral between, 9.4% belong to Dissatisfied and
5.8% of the respondents belong to Highly dissatisfied category.
Inference:
Majority 35.4% of the respondents belong to the Satisfied.
Table 4.21: Purpose of Being Fashionable for the Respondent
Purpose of being fashionable Frequency Percentage
Satisfied 142 28.4
Highly satisfied 162 32.4
Neutral 58 11.6
Dissatisfied 85 17
Highly Dissatisfied 53 10.6
Total 500 100
Interpretation:
From the above table reveals that 28.4% of than belong to the Satisfied, 32.4% of the respondents belong to the
Highly Satisfied, 11.6% of the respondents belong to the neutral between, 17% belong to Dissatisfied and
10.6% of the respondents belong to Highly dissatisfied category.
Inference:
Majority 32.4% of the respondents belong to the Highly Satisfied.
Table 4.22: Long Using of Product for the Respondent
How long using of products Frequency Percentage
Less than 1 year 129 25.8
Above 1-3 years 116 23.2
Below 3 years 136 27.2
4 years 119 23.8
Total 500 100
Interpretation:
From the above table reveals that 25.8% of than belong to the Les than 1 year, 23.2% of the respondents belong
to the Above 1-3 years, 23.8% of the respondents belong to 4 years between,27.2% below 3 years in category.
Inference:
Majority 27.2% of the respondents belong to the age group of below 3 years.
Table 4.23: Paying of Product for the Respondent
Paying of products Frequency Percentage
Yes 154 32.2
No 173 33.2
May be 193 38.6
Total 500 100
International Journal of Management Studies ISSN(Print) 2249-0302 ISSN (Online)2231-2528 http://www.researchersworld.com/ijms/
Vol.–V, Special Issue - 4, August 2018 [36]
Interpretation:
From the above table reveals that 32.2% of than belong to the Yes, 33.2% of the respondents belong to No,
38.6% of the respondents belong to May be in category.
Inference:
Majority 39% of the respondents belong to the May be.
FINDINGS:
1. There exist of perfect positive correlation between the two factors. I.e. family income per month of the
respondents and spend for herbal cosmetics product per month of the respondents.
2. Majority of respondents, ranked first to quality of the product.
3. There is a significant relationship between age and period of using the products.
4. There no relationship between Educational Qualification and level of satisfaction about herbal
cosmetics products.
SUGGESTIONS:
1. The price of the herbal cosmetics product can be reduced which would attract more customers.
2. The manufacturers could reduce the chemical combination in the herbal cosmetics products.
3. The manufacturers can conduct a survey for knowing the customer need.
4. Window display is also an attractive method for attracting the minds of the people, especially the
housewives.
CONCLUSION:
The study reveals that most of the respondents are aware of the herbal cosmetics. The people now are not
considering the cosmetics as luxury, most of the customers feel that there are more chemicals in cosmetics, which
cause many side effects, and started switching over to herbal based cosmetics. The cosmetic manufacturing
company after realizing the need of the customer started providing herbal based cosmetics. Many respondents feel
that there is more chemical combinations in the herbal cosmetics, which can be reduce by the manufactures, so
that it would increase its usage by the customers. This study enables the manufactures to know the need and
preference of the customers which can be implemented by them to improve their products.
References:
Anumesh Kariappa, (2016). A Descriptive Study on Customer Satisfaction with Special Reference to “Hul Ltd”
International Journal of Engineering Research and Modern Education, Volume 1, Issue 2, Pp: 240 – 245.
Dr. M. Rajarajan, (2016). Customer Buying Behaviour Towards Herbal Cosmetic Products In India - An
Overview, International Journal of World Research, Volume: 1 Issue 34, October, Pp: 36-46.
Dr. S. Jagadeesan1 & G. Vani, (2017). Customer Satisfaction Towards Parachute Hair Oil Usage Among
College Student‟s In Salem City, International Journal of Advanced Scientific Research &
Development, Volume. 04, Issue. 10, Ver. I, October , Pp. 01 – 11.
K.Subbulakshmi1 P.Geethamani, (2017). A Study On Customers Perception Towards Cosmetic Items In
Patanjali Products With Special Reference To Tirupur City, Intercontinental Journal Of Marketing
Research Review, Volume 5, Issue 9, September Pp. 25 – 34.
M.Banu Rekha And K.Gokila, (2015). A Study On Customer Awareness, Attitude and Preference towards
Herbal Cosmetic Products with Special Reference to Coimbatore City, International Journal Of
Interdisciplinary And Multidisciplinary Studies, Volume 2, No.4, Pp: 96-100.
Mrs. Gurmeet Kaur, (2016). A Study Of Customer Satisfaction Towards Selected Herbal Cosmetic Products,
International Journal of Business Management and Scientific Research, Volume: 19, July, Pp: 51-57.
V.P.T. Dhevika, O.T.V Latasri And Libya Sangeetha Sharmila, (2013). A Study On Brand Loyalty Of Hair Oil
Among College Student, Elixir Marketing Mgmt. Volume: 59, Pp: 15767-15772.
Vanessa Apaolaza-Ibáñez1, Patrick Hartmann, Sandra Diehl and Ralf Terlutter, (2011). Women Satisfaction
With Cosmetic Brands: The Role Of Dissatisfaction And Hedonic Brand Benefits, African Journal Of
Business Management, Volume: 5, Issue 3, February, Pp. 792-802.
----