a study on the effectiveness of public distribution system...
TRANSCRIPT

A Study on the Effectiveness of Public Distribution System In Rural Tamilnadu
Submitted to
The Planning Commission Government of India, New Delhi
Submitted by
Dr. S. Nakkiran Principal (Retd.)
TBML Collage, Porayar-609307 TamilNadu
December-2004

Contents
Chapters Title Page Numbers List of Tables List of Charts Executive Summary 1 1 The Design and Execution of the Study 2-10 2 Public Distribution System in Tamilnadu
– An Analysis 11-18
3 Effectiveness of Public Distribution System
19-34
4 Major Findings, Conclusion and Suggestions
35-39
Tables I-XVI Bibliography XVII-XIX

ii
List of Table
Table No
Particulars Page No
2.1 Fair Price Shops in Tamilnadu I 2.2 Classification of Cooperative Societies running FPS II 2.3 Family Cards In Circulation In Tamil Nadu III 2.4 Distribution of Rice IV 2.5 Off take and Open Market Prices IV 2.6 Details of Food Subsidy IV 2.7 Details of Number of Shops in Sample Districts V 2.8 Allotment and Distributions of PDS Commodities in
Coimbatore District VI
2.9 Allotment and Distributions of PDS Commodities in Dindigul District
VI
2.10 Allotment and Distributions of PDS Commodities in Nagapattinam District
VI
3.1 Sex – wise distribution of respondents VII 3.2 Age– wise distribution of respondents VII 3.3 Educational status – wise distribution of respondents VII 3.4 Marital status of the respondents VIII 3.5 Exposure to Mass Media VIII 3.6 Contact with Change Agents VIII 3.7 Membership with Cooperatives IX 3.8 Age of Membership IX 3.9 Membership in Cultural / Social / Political
Organizations IX
3.10 Occupation of the Respondents X 3.11 Purchasing Behavior of Respondents X 3.12 Availability of Goods in Time in PDS XI 3.13 Satisfaction over the goods available XI 3.14 Reasons for not purchasing commodities in certain
times XII
3.15 Problems in PDS XIII 3.16 Suggestions to make PDS more effective XIII 3.17 Revision of Salaries Granted to the Salesmen of the
Fair Price shops XIV
3.18 Retail Margins XV 3.19 Staff for supervision of Fair Price shops XVI 3.20 Target for Departmental Officers for Inspection of
Fair Price shops

iii
List of Charts
Chart No
Title Page No
2.1 Role of Cooperatives in PDS 13 2.2 Food Subsidy 16 3.1 Problems in PDS 30 3.2 Suggestions to make PDS more effective 31

Executive Summary
PDS is considered as principal instrument in the hands of State
Governments for providing safety net to the poor against the spiraling rise
in prices of essential commodities. In this regard Tamil Nadu sets a model in
implementing the PDS as universal system. Here the involvement of the
Cooperative Societies is noteworthy, since they cover more than 93 per cent
of the FPS in Tamil Nadu. Further, the involvement of women SHGs in
the distribution network ensures safety, transparency, and accessibility and
above all reduced the transaction cost. Hence, this channel of distribution
can be promoted.
It was found in this study that problems like leakages, poor quality,
under weighment, non-availability of controlled as well as non-controlled
articles during certain times, non-availability of ration cards, bogus cards,
etc., affect the efficiency of the system. Ensuring the availability of essential
articles as per allotment as and when required by the cardholders, increased
margin to cooperatives, and better salary to employees, reduction in the
number of cards to be handled by a FPS, maintaining and updating the
Notice Boards at every FPS, formation of vigilance committees at every FPS
level and providing more role to women SHGs are the viable options put by
the sample respondents to strengthen the PDS, which cannot be ignored.
Further the continuance of Universal System will help to provide
safety net to the poor against spiraling market prices of essential
commodities. Though primarily employee of the PDS retail outlet should be
made responsible for eradicating the problem of bogus cards, effective
coordination between local bodies, revenue authorities and lead and link
societies will alone be able to eradicate this problem.

2
Chapter - 1
The Design and Execution of the Study
1.1 Introduction
Public Distribution System (PDS) is a poverty alleviation programme
and contributes towards the social welfare of the people. Essential
commodities like rice, wheat, sugar, kerosene and the like are supplied to the
people under the PDS at reasonable prices. PDS is a boon to the people
living below the poverty line. PDS is the primary social welfare and
antipoverty programme of the Government of India. Revamped Public
Distribution System (RPDS) has been initiated by the Government of India
from the year 1992 in order to serve and provide essential commodities to
the people living in remote, backward and hilly areas. Government
introduced Targeted Public Distribution System (TPDS) in the year 1997.
Central Government and State Governments have been actively involved in
steering the operations for the success of the PDS.
It is not possible to neglect the PDS in India, because majority of the
Indian population are living in rural areas and their standard of living is also
poor and they cannot afford to pay the prevailing market prices for the
essential commodities. Central Government has provided Rs. 6066 Crore
for food subsidy in the Union Budget for the year 1996-97. This has
increased over the years and stood at Rs. 21,200 crores in 2002-03.
Tamil Nadu sets a model in implementing the PDS as universal
system for the cause of eradicating poverty and improving standard of living
of the people living below the poverty line. Timely supply of essential
commodities is the basic element for the success of the PDS. Infrastructure
i.e., Fair Price Shops (FPS), godown facilities and employees are other
requisites of the PDS.

3
The involvement of the Cooperative Societies is noteworthy for the
success of the PDS in Tamil Nadu. The total family cards under the PDS in
Tamil Nadu are 13230193 as on 30th June 2004. There are 21662 full time
FPS run by cooperatives. More than 93 per cent of the fair price shops of
Tamil Nadu are managed by cooperatives. It shows the extensive
involvement of the Cooperative Societies in serving the rural people by
taking steps to supply essential commodities in the right time at affordable
prices. In addition to the regular and fulltime FPS, Department of
Cooperation has established part time FPS in villages. It helps the villagers
to purchase the essential commodities in the nearby places. There are 4673
part time FPS, 549 women shops and 36 mobile FPS functioning in Tamil
Nadu.
Cooperative societies have become accelerator for the success of the
PDS in Tamil Nadu. To procure essential commodities and supply them to
the public, an established and organized agency becomes essential. The
Food Corporation of India procures essential commodities on behalf of the
Central Government. The TNCSC procures essential commodities on
behalf of Government of Tamil Nadu. The lead societies viz., consumer
cooperatives and marketing cooperatives procure the essential commodities
(rice, wheat, sugar, palm oil) from the civil supplies corporation and deliver
to the FPS. The procurement and delivery of essential commodities is
performed in every taluk by the lead societies. Kerosene is procured from
the private dealers and it is supplied in the FPS. The FPSs are the agents at
the field level to distribute the articles to the ultimate beneficiaries in right
time. The Cooperatives have become organized agency for the supply of
essential commodities to the public in Tamil Nadu. In the procurement
stage as well as in the supply stage, the role of cooperatives is the felt need
of the hour. Cooperative Societies are actively involved and participated in
ensuring food security in Tamil Nadu.

4
1.2 Statement of the Problem
Number of research studies by individuals, institutions and
government agencies have been conducted on the subject PDS. Planning
Commission in the “Mid-term appraisal of Ninth Five Year Plan (1997-
2000) has also pointed out various areas covered by researchers on PDS.
The Planning Commission’s Report says that ‘with a net work of more than
4,00,000’ FPS, the PDS in India are perhaps the largest distribution
machinery of its type in the world. PDS is said to distribute each year
commodities worth Rs. 15,000 Crore to about 16 crore families. The huge
network can play a more meaningful role if only the system is able to
translate into micro level and macro level self-sufficiency by ensuring
availability of food grains for the poor households.
The above statement by the Planning Commission has lot of
meanings and expresses a desire to know the utility and implementation
process of PDS scheme. Current study is undertaken to answer some of
questions raised by the Planning Commission on PDS, such as:-
1) Its failure (PDS) to serve the population below poverty line
2) Its urban bias and neglect of rural areas
3) Lack of transparent and accountable arrangements for delivery
4) Diversion of PDS Commodities to the open market, and
5) The effectiveness of delivery machinery (coordination,
accountability and supervision)
To find a solution to the above problems of PDS, as raised by the
Planning Commission, present study is devoted.
1.3 Review of Literature
Numbers of studies have been done on PDS in India. Important
studies are presented here.
P.S.George (1974) has attempted to analyze public distribution of
food grains and their income distribution effects in Kerala. He has tried to

5
estimate the possible impact of rationing on incomes of the consumers
using the relationship. The results for Kerala suggest that the system is
economically viable. Further, ration rice, according to this study, accounted
for a major share of rice consumption of consumers belonging to low-
income groups.
The criteria of identifying target groups differed across studies.
Rajkrishna suggested that the beneficiaries of the distribution system could
be arrived at by deducting from the total population ( 1) the number of
income-tax assesses, and (2) cultivators households multiplied by five which
is the average size of the family.
For Raj Purothit (1978) the urban dwellers and rural poor should be
included under target groups. The Sixth Five-Year Plan identified 50.8 per
cent of rural population and 38 per cent of urban population as target
groups. However, in practice each State has followed its own criteria. For
instance, Gujarat excludes, (1) households whose annual income exceed Rs.
8,000, (2) dealers registered under Sales Tax Act, and (3) agriculturist
households, who are having more than 1/9 of ceiling of land. The
remaining population would be considered as target group.
Subba Rao (1980) has attempted to estimate food requirement for the
State of Andhra Pradesh under certain assumptions. While working out
these estimates he has assumed a supply level of 12 ozs. (340 grams) per
consumption unit. He concluded that ultimately the benefit of public
distribution is zero or negligible.
Gupta basing on certain assumption has projected food grains
requirements for PDS up to 1980, for all India, such projections are
assumed to help policy makers in their procurement efforts.
G.Suryanarayana undertook a study on “PDS in India – with
reference to Andhra Pradesh” during 1985. The major finding of the study

6
was urban people were getting more benefits through PDS than rural and
tribal people.
A detailed study was published on “Food security and Targeted PDS
in U.P”. The study was undertaken by Ravi Srivastaava and was published
in March 2000. The study was carried among 2250 households across 120
villages found that multiplicities of agencies, poor coordination and low
administrative accountability have combined to cripple the delivery
machinery.
The Tata Economic Consultancy Service conducted a study in 2000
to know how much PDS supplies were diverted from the system. At the
national level it was found that there was the diversion of 36 per cent of
wheat supplies, 31 per cent of rice and 23 per cent of sugar. In the case of
rice in Bihar and Assam the extent of diversion was as high as 65 per cent.
In the case of wheat the diversion was estimated to 10 per cent in Nagaland
and 69 per cent in Punjab. The report found no correlation between the
frequencies of the use of Enforcement Acts and extent of diversion. In
Northern Region U.P has more diversion of rice and sugar despite a higher
number of raids and convictions.
NIRD’s study on leakages in PDS (2003) found that not drawing and
partial drawing of quota was substantially contributed for leakages.
Though number of studies has been conducted on PDS, the
effectiveness of PDS has not been studied and measured quantitatively.
Present study will remove this gap and will show how for the rural
population have been benefited in PDS in terms of the objectives of PDS.
1.4 Objectives of the Study
The objectives of the present study are:
1. To study the socio-economic conditions of rural population
brought under PDS

7
2. To study the problems relating to the implementations of the
PDS
3. To study the benefits derived out of PDS
4. To offer suggestions to improve the working of PDS.
1.5 Hypothesis to be tested
The hypotheses to be tested in the study are:
1. People below poverty line do not have income to purchase PDS goods
2. Measures and weights are not accurate in PDS articles 3. Very old stocks are allowed for PDS 4. Majority cardholders do not use sugar 5. Monitoring of the scheme is ineffective 6. PDS has created overall benefits to poor people.
1.6 Methodology and Sampling
Present study is empirical in nature and will be studied using primary
data. The following Methodology and Sampling are followed.
Survey method was followed for this study. By following multi-stage
random sampling three districts viz., one backward, one moderate, and one
developed were selected (Nagapattinam, Dindigul, and Coimbatore). In the
second stage two blocks from each districts were selected for this study. In
the third stage four villages from each block were selected. From each
village 100 respondents (50 weaker section and 50 non weaker section) was
selected using simple random sampling. The sampling frame is as follows
Total Number of Districts: 3
Total Number of Blocks : 3 x 2 = 6
Total number of villages : 6 x 4 = 24
Total sample respondents : 24 x 100 = 2400
Weaker section : 1200
Non-weaker section : 1200
8
1.7 Tools for Data Collection
A pre-tested interview schedule covering all aspects of PDS was
administered among the respondents to elicit the needed information.
1.8 Relevance of the Study
PDS is an important planning scheme and greater importance is given
to this scheme as heavy expenditure is made on this. This study has greater
relevance because, the Government, Policy Makers and the Planning
Commission should know: -
1. Weather the PDS scheme has reached right beneficiaries?
2. Weather the implementation of the scheme is done as per the norms
lay down?
3. Whether the women SHGs are effective in running PDS?
4. Whether to continue or discontinue the universal system of PDS?
5. What are all the malpractices that exist in this scheme?
6. What are the problems faced by the rural poor in availing the benefits
of the scheme? and
7. What is the role of cooperative societies in running PDS?
1.9 Major Variables used For Data Collection
The important dependent variables used for the study are
effectiveness of PDS. Effectiveness denotes the fruitfulness of this scheme
–weather the benefits of PDS have reached the right people without any
hurdles.
The other variable is independent variables. The independent
variables used in this study are sex, age, educational status, marital status,
exposure to mass media, contact with change agents, and membership with
cooperatives, age of membership, membership in cultural, social and
political organizations and occupation of the respondents.
1.10 Definition of Concepts used
Important concepts used in this study are:-

9
1) Consumer Forum
Consumer Forums are organized either by consumers or by
government to redress the problems of the consumers.
2) Consumerism
Processes through which consumers seek redress, and remedy for
their dissatisfaction and frustration, with the help of organized efforts.
3) Consumer Protection
Taking measures, which contribute directly to give the consumer the
assurance that he will have the opportunity to buy goods of suitable quality
as required by him and to get the required service.
4) Cooperatives
Registered bodies under the respective State Cooperative Societies
Act & Rules.
5) Effectiveness of PDS
The fruitfulness of the PDS scheme – weather it has reached the right
people and weather the right people are using the scheme to their fuller
satisfaction or not.
6) Fair Price Shops / Ration Shops
Shops organized by government solely to distribute PDS article and
managed by states civil supplies department/ corporation / cooperatives /
women groups.
7) Lead Societies and Link Societies
For the purpose of PDS the Cooperative Marketing Societies
and Cooperative Wholesale Consumer Stores are acting as lead
societies and they procure and distribute the rationed articles to the
link societies. The Primary Agricultural Cooperative Banks are acting
as link societies. Both lead societies and link societies are running FPS
to distribute the rationed articles to the cardholders.

10
8) Public Distribution System (PDS)
PDS is a poverty alleviation programme and contributes towards the
social welfare of the people. Essential commodities like rise, wheat, palm oil,
kerosene, sugar, etc., are distributed at a lower price, which has
government’s contributions of subsidy.
9) Revamped PDS
The scheme lunched in January 1, 1992 covering 2496 development
blocks in the Country, which have employment assurance scheme. The retail
price of food grains under RPDS should not be higher than the central issue
price by more than 25 paise per kg.
10) Targeted Public Distribution System (TPDS)
This scheme was launched on June 1, 1997. The TPDS is to confer
benefits on the landless agricultural labours, marginal farmers, rural artisans,
and craftsman in rural areas. It includes slum dwellers and persons earning
their livelihood on daily basis. Special cards were issued to the families
below poverty line.
11) Rationed Goods
Goods that are meant for PDS as notified by the government from
time to time.
12) Weaker Sections
People below the poverty line and especially coming under the
category of SC & ST
1.11 Chapter Scheme
The study has four chapters as noted below.
1) The Design and Execution of the Study
2) Public Distribution System in Tamilnadu – An analysis
3) Effectiveness of PDS
4) Major Findings, Conclusion and Suggestions of the Study

11
Chapter - 2
Public Distribution System in Tamilnadu – An Analysis
2.1 Socio-Economic Profile of Tamilnadu
Tamilnadu lies on the southern tip of the country and is located in the
North Latitude between 80 5’ and 130 35’ and East Longitude between 760
15’ and 800 20’. The State is bounded by Kerala on the west, Andhra
Pradesh and Karnataka on the North, Bay of Bengal on the east and Indian
Ocean in the south. For administrative convenience, the State is divided
into 30 districts, 385 blocks, 201 taluks, and 16317 revenue villages.
In the case of rural Tamilnadu, though the share of rural population
have come down over the years from 73.31 in 1961 to 56.14 per cent in
2000-01, the size of rural population is at 3.49 crores out of the State
population 6.21 crores in 2000-01. As the spatial temporal distribution of
rainfall was not good during past several years the performance of
agriculture was tardy. In addition to this, the storage position in major
reservoir was not good and Cauvery water dispute added fuel to this fire.
This resulted in many socio-economic problems like unemployment and
poverty, lack of social and economic infrastructure and asymmetry in the
distribution of resources. Incidence of poverty in rural Tamilnadu was at
29.16 per cent as per Union Planning Commission in 1999-2000. With this
background the functioning of PDS is discussed in this chapter.
2.2 PDS in India
Public Distribution System is considered as principal instrument in
the hands of government for providing safety net to the poor and the
downtrodden. The system serves triple objectives namely protecting the
poor, enhancing the nutritional status and generates a moderate influence on
market prices. The focus and coverage of PDS have changed widely over
the years. Initially during word war civilian consumption was restricted so as
12
to divert food items to meet the food requirement of defense forces.
Subsequently frequent occurrence of drought throughout the country made
the planners to think on food shortages. In order to overcome this shortage
ration system was came in to existence. FPS was opened to distribute the
items of mass consumption in urban areas. Thereafter, it was extended to
rural areas. From the year 1992 Revamped PDS was introduced in those
areas where Drought Prone Area Programme and Dessert Development
Programme were in operation. Under this system people were allowed to
purchase essential items from the FPS at relatively much lower subsidized
rates. After, the Chief Ministers Conference held in July 1996, a revised
scheme known as Targeted PDS was introduced countrywide with a
network of 4.74 lakh FPS. Under this system two-tier subsidized pricing
system by classifying the cardholders is followed. Cardholders are classified
as Above Poverty Line (APL) and Below Poverty Line (BPL). The BPL
families are entitled to receive the essential commodities at a price, which is
very closer to the economic cost. BPL families are identified based on the
methodology given by Lakdawala Exert Group on estimates of poverty.
The TPDS was further liberalized in December 2000, and was renamed as
Antyodaya Anna Scheme. Under this scheme the poor was further classified
as the ‘Poorest Among the Poor’ and other living ‘BPL’.
2.3 Goals of PDS
The goal of PDS does not restrict itself with the distribution of
rationed articles. Making available adequate quantities of essential articles at
all times, in places accessible to all, at prices affordable to all and protection
of the weaker section of the population from the vicious spiral of rising
prices is the broad spectrum of PDS. More specifically, the goals of PDS
are:
Ø Make goods available to consumers, especially the disadvantaged /
vulnerable sections of society at fair prices;
13
Ø Rectify the existing imbalances between the supply and demand for
consumer goods; Check and prevent hoarding and black marketing in
essential commodities;
Ø Ensure social justice in distribution of basic necessities of life;
Ø Even out fluctuations in prices and availability of mass consumption
goods; and
Ø Support poverty-alleviation programmes, particularly, rural
employment programmes, (SGRY/SGSY/IRDP/ Mid day meals,
ICDS, DWCRA, SHGs and Food for Work and educational feeding
programmes).
2.4 PDS in Tamilnadu
The Government of Tamilnadu is implementing PDS since the year
1964. The scheme Village Shop Programme was introduced by the State
with the intention to have one shop for one village in order to feed essential
articles to rural public. Subsequently the scheme was converted into PDS
with the intention of providing essential commodities to the public both in
rural and urban areas at concession rate. Since the introduction of TPDS
from 1.6.1997 the universal PDS is in operation in Tamil Nadu with the
Antyodaya Anna Yojana and the expanded Antyodaya Anna Yojana
schemes. Under the universal PDS there is no discrimination of families on
APL and BPL lines based on income.
2.5 PDS Network
The unique feature of PDS in this State is Tamilnadu Civil Supplies
Corporation, Cooperatives and women SHGs govern the entire network.
No private dealer is allowed to run FPS. Also, the Government
guidelines show that no family cardholder is to travel more than 2 kms to
reach FPS.
Further, Cooperatives have been given an important role in the
implementation in PDS. For example, as on 30.03.2004, there were 28132

14
FPS including mobile FPS for the people in remote hilly area functioning in
the state (Table –2.1). This shows that majority of the FPS are run by
cooperatives. In the context of PDS, cooperatives are classified as Lead
societies and Link societies.
Role of Cooperatives in PDS
1149 158 36510
26279
0
5000
10000
15000
20000
25000
30000
TNCSC COOPs OtherCoops
Women Mobile
Agencies
No
of F
PS
Chart 2-1
The Lead societies are cooperative wholesale stores and cooperative
marketing societies, who act as whole seller in procuring essential
commodities from different sources and supply to Link societies that is
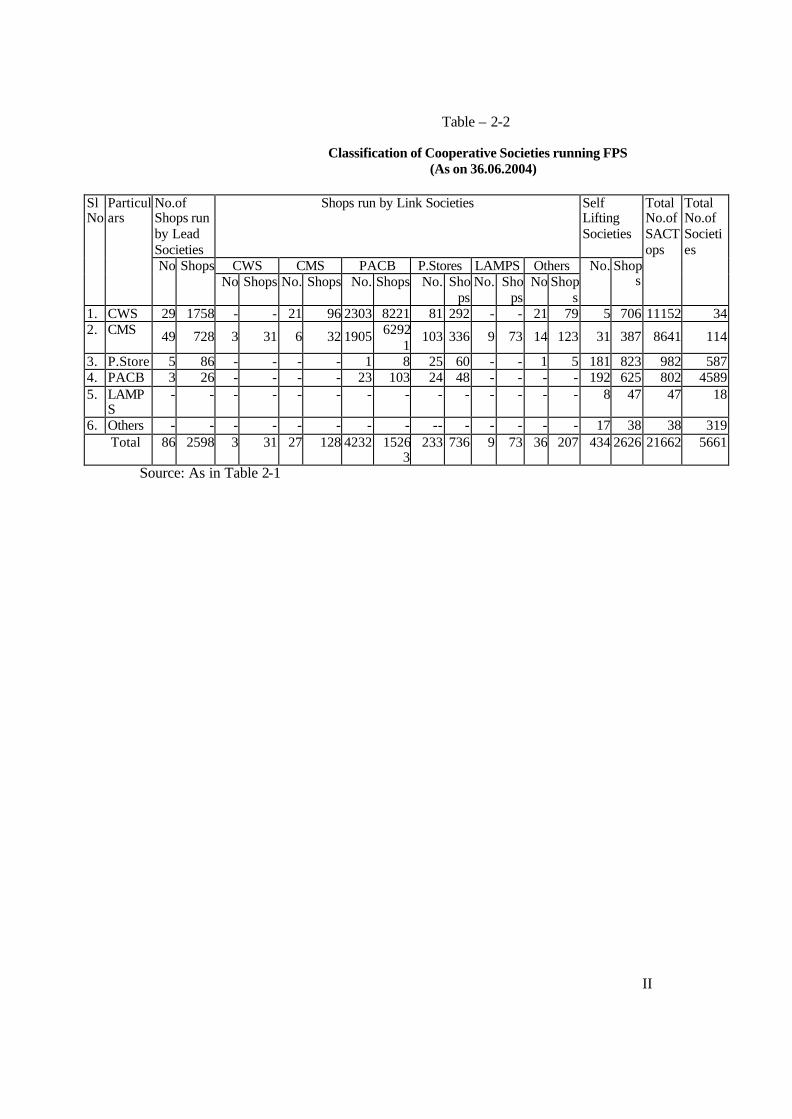
PACBs and LAMPs. At present in Tamil Nadu, there are 86 Lead societies
functioning and they run 2598 FPS. There were 4540 Link societies and they
run 16438 FPS. Apart from that 434 large-scale societies directly lifting the
commodities to run 2626 FPS (Table – 2.2). The district wise analysis shows
that the number of FPS was high in Villupuram (1846 FPS), which is
followed by Coimbatore (1641 FPS), and Velur (1613 FPS). This is because
the number of Full-time FPS run by cooperatives and women was high in
villupuram. Interestingly 353 Full time and 157 Part time women FPS are
also in operation in the State as a whole. In addition to this there are 36
mobile FPS are run so as to help the cardholders in remote villages / hilly
areas.

15
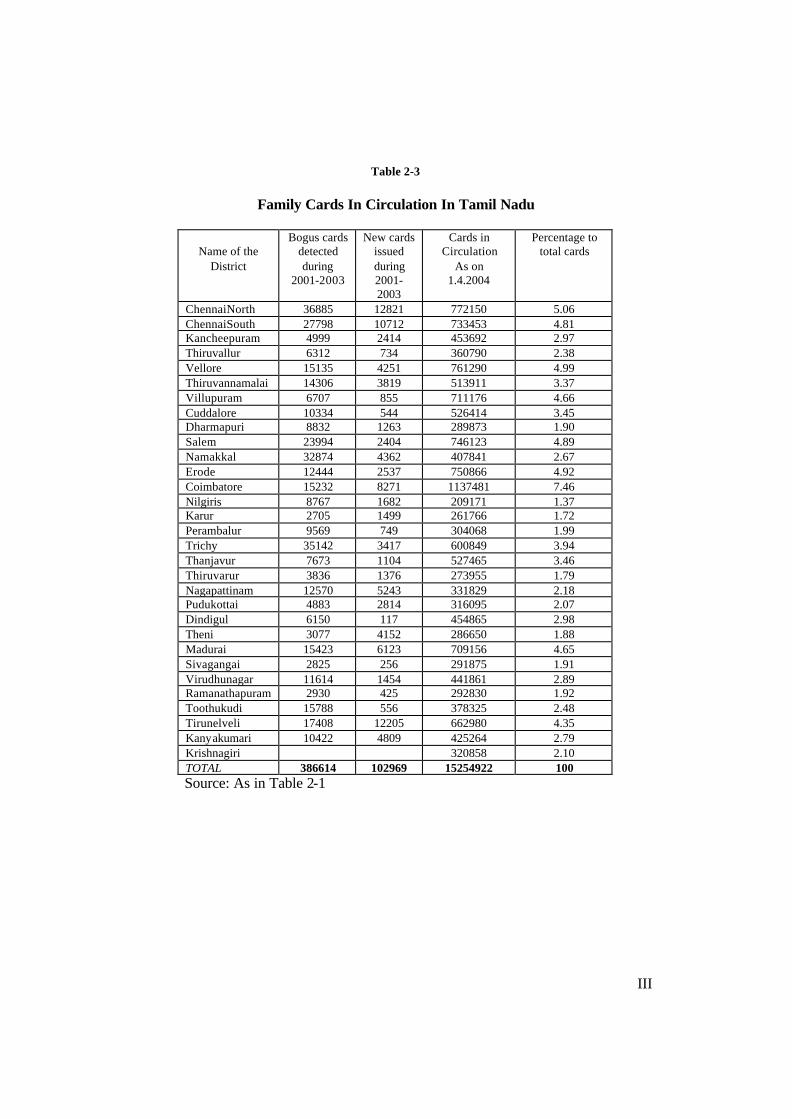
2.6 Family Cards in circulation
Distribution of the essential commodities is regulated by the family
card system. Irrespective of income status of the family, option based family
cards have been issued in the year 1998 to all families. Separate family cards
have been issued to those who opted to purchase rice and other essential
commodities. Normally a full-time FPS shall have the minimum of 800
cards and maximum of 1000 cards in Municipal Corporation and Municipal
areas. Full-time FPS in other areas shall have minimum of 500 cards and
maximum of 800 cards. As on 1.04.2004 there were 1.52 lakh family cards in
circulation in the State (Table-2.3) District-wise analysis of family cards in
circulation showed that the number of cards in circulation was high in
Coimbatore district (7.46 per cent), which was followed by Chennai North
(5.06 per cent) and Vellore (4.99 per cent) districts (As per 2000-2001 census
Coimbatore tops the list of districts with largest population at 4.224 million,
followed by Chennai with 2.16 million). Further the magnitude of bogus
cards that were in circulation could also be found in the table. During the
years 2001-2003, 386614 cards, i.e., more that 2 per cent of the cards in
circulation, were found as bogus cards. The number of bogus cards found
was high in Coimbatore, which was followed by Chennai North.
2.7 Distribution System
The Tamil Nadu Civil Supplies Corporation procures and stocks the
essential commodities in advance in a network of owned and hired buffer
and operational godowns right up to taluk level. The shop personnel move
the stocks from the taluk level operational godowns to the FPS as per
allocation made to them by district level authorities every month. At FPS
level, the entitlement of rice and sugar is linked to the number of members
in each family and that of kerosene is based on the number of LPG
cylinders and the nature of the area-rural, urban and hilly. Besides, kakhi
color cards were issued to police personnel for drawing kerosene only. For

16
example rice is supplied to the cardholders in one or two installments every
month as mentioned in the Table 2-4. Based on the number of cards in
circulation, entitlement and past off take, it is estimated that 200000 MT of
rice, 5000 MT of wheat, 25500 MT of sugar and 73000 KL of kerosene are
needed every month for distribution in this State through FPS. In addition,
25000 M.T. rice per month is required for the welfare schemes.
2.8 Price
Inflation is a cold-hearted enemy of social balance and therefore the
importance of holding the price line needs no emphasis. Undue price rise
erode into the real wages of labour class and benefit the renter class. Since
the States have very little say in the national monetary policy, their role
essentially revolves around demand management, curtailing non-
developmental expenditure and containing fiscal deficit of the budget. With
regard to PDS State Government intension is to control the prices of
essential commodities of mass consumption. In this study it was found that
price is the important factor, which attracts cardholders to purchase PDS
articles. Government also to provide safety net to the poor and the
downtrodden by subsidizing the price of the PDS articles at much lower
than the market price. For example over the years the difference between
State average open market price and the PDS issue price of rice was more
than Rs.6. Contrary to this, annual off-take of rice has come down over the
years from 2413006 M.Ts to 2995978 M.Ts (Table – 2.5) Paripasu Food
subsidy incurred by the State has increased from Rs.874 crores to Rs.1240
crores during the same period (Table – 2.6 & Chart 2-2).
2.9 Status of functioning of PDS in study areas
For the purpose of this study, three districts have been selected
namely Coimbatore, Dindigul and Nagapattinam. All the three districts
represent three different development scenarios. Coimbatore is famous for
its industrial development, while Nagapattinam is known for its coastal

17
wealth and tourism. Dindigul district is drought – hit and has a poor
groundwater status. With regard to the percentage of rural population to
total population as per 2001 census, it was 33.97 per cent in Coimbatore,
64.98 per cent in Dindigul, while it was 77.85 per cent in Nagapattinam.
The density of population is high in Nagapattinam (507), which is followed
by Coimbatore (470) and Dindigul (291).
Food Subsidy
874 905 907
1145
1540
1240 1240
1996-97
1997-98
1998-99
1999-00
2000-01
2001-02
2002-03
Am
ou
nt
in C
rore
s
Chart 2-2
2.10 Coverage of FPS and Cardholders
As far as coverage of cardholders is concerned, Coimbatore stood
first by covering 1215632 cards, which is followed by Dindigul (470417) and
Nagapattinam (350540). Average cards covered by a FPS are also high in
Coimbatore (736), which is followed by Dindigul (624) and Nagapattinam
(569). Again Coimbatore stands first among the sample districts in the
coverage of number of FPS, which is followed by Dindigul and
Nagapattinam. This is because the number of shops run by TNCSC and
SHG is high in Coimbatore district. The credit goes to the Tamilnadu
Women Development Corporation and NGO’s for their active support to
the SHGs to run PDS. In this study also it was found that FPS run by
SHGs are active compared to others in distributing the essential articles.

18
Also, another feature of PDS in Coimbatore district is there are four mobile
shops (Table 2.7).
2.11 Commodities handled
Generally rice, sugar, wheat, kerosene, maida and iodinated salt are
the commonly distributed items in FPS in Tamilnadu. Also, State
Government distributes Ooty tea through FPS so as to protect the interest
of the small tea growers of Ooty. Hence, the scope of PDS covers not only
the consumption but also the production of essential goods. The progress of
FPS in sample districts shows that, though the number of family cards is
comparatively less in Nagapattinam district the distribution of rice, wheat is
high. This might be due to the severe drought during past several years. In
the case of kerosene, it seems the consumption is high in Coimbatore,
which may be due to its urban character. Further, against allotment, there is
deficit in the distribution in all commodities; particularly it has been high in
rice (Table 2.8, Table 2.9, Table 2.10). Officials opined that distribution is
made based on entitlement as per the cards in circulation, past distribution
level and stock in hand at FPS level. Hence, the difference would in no way
affect the cardholders. But the response of the respondents is different,
which is discussed in the Chapter – 3.
2.12 Conclusion
The Government of Tamilnadu took all efforts to ensure the
availability, accessibility and affordability of essential commodities to the
poor. Hence, universal PDS is in operation in this State and the
Cooperatives are given much importance in the distribution system.
Further, the involvement of women SHGs in the distribution network
ensures safety, transparency, and accessibility and above all reduced the
transaction cost. Hence, this channel of distribution can be promoted.

19
Chapter - 3
Effectiveness of Public Distribution System
3.1 Introduction
Public Distribution System has been in existence in India since the
inter – war period. It had its origin with focus on distribution of food grains
in urban scarcity areas when the country passed through critical food
shortages. Now PDS is evolved as the important poverty alleviation
programme in India. At all India level with a network of about 4.63 lakh
FPS covering 1992 lakh ration card holders are handling 15 per cent of the
total availability of food grains in the country as a whole (Government of
Tamilnadu 2001-2002). This is perhaps the largest distribution network of
its kind in the world. Further the focuses of PDS are also changing over the
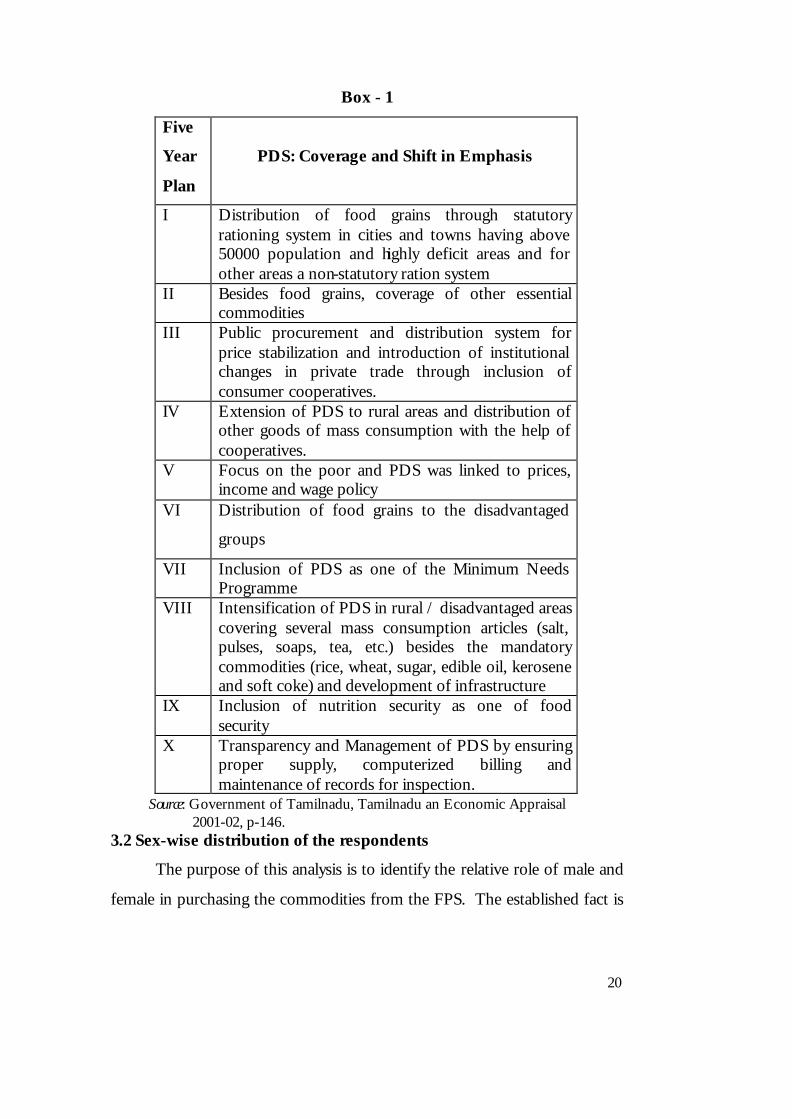
years (Box –1) from merely distribution of food grains to serving as safety
net to the poor and the downtrodden.
However, very often PDS is criticized for its ineffectiveness and
inefficiency in achieving its objectives. Poor quality of goods supplied
(NIRD: 2003), under weight (Raj Kumar Grover: 2003) leakage of PDS
articles to open market (Singh: 1981) non-availability of commodities easily
(Indian Institute of Public Opinion: 1991) etc. Hence, it becomes necessary
to assess the effectiveness of PDS from users perspective.
The effectiveness of PDS is measured based on the responses given
by the respondents of this study. The respondents of the study are
categorized into weaker sections and non-weaker sections. Apart from the
personal interview Focus Group Discussions (FGD) were also conducted to
substantiate the opinions of the respondents.
20
Box - 1
Five
Year
Plan
PDS: Coverage and Shift in Emphasis
I Distribution of food grains through statutory rationing system in cities and towns having above 50000 population and highly deficit areas and for other areas a non-statutory ration system
II Besides food grains, coverage of other essential commodities
III Public procurement and distribution system for price stabilization and introduction of institutional changes in private trade through inclusion of consumer cooperatives.
IV Extension of PDS to rural areas and distribution of other goods of mass consumption with the help of cooperatives.
V Focus on the poor and PDS was linked to prices, income and wage policy
VI Distribution of food grains to the disadvantaged
groups
VII Inclusion of PDS as one of the Minimum Needs Programme
VIII Intensification of PDS in rural / disadvantaged areas covering several mass consumption articles (salt, pulses, soaps, tea, etc.) besides the mandatory commodities (rice, wheat, sugar, edible oil, kerosene and soft coke) and development of infrastructure
IX Inclusion of nutrition security as one of food security
X Transparency and Management of PDS by ensuring proper supply, computerized billing and maintenance of records for inspection.
Source: Government of Tamilnadu, Tamilnadu an Economic Appraisal 2001-02, p-146. 3.2 Sex-wise distribution of the respondents
The purpose of this analysis is to identify the relative role of male and
female in purchasing the commodities from the FPS. The established fact is

21
that female members largely influence the purchasing behavior of the family.
This is also true in the case of FPS.
The present study found that more than 59 percent of the
respondents were female. The district wise and category wise analysis shows
that in all districts, the percentage of the female respondents were more in
the case of the weaker sections (Table 3.1). In the FGD, they opined that:
Everyday while returning to home after our work we use to go to PDS Centre to purchase rice for supper. The daily wages are the source of our purchase. If no work no wage and no food.
Source: FGD conducted among respondents of Panchampatti, Dindigul district on 10.09.2003. Hence, the ‘hypothesis people below poverty line do not have income
to purchase PDS goods’ is proved.
3.3 Age-wise distribution of the respondents
Age is the important factor, which also decides the purchasing
behavior of an individual and establishes the relationship with the market. In
the study, it was found that majority of the respondents in both the
categories were in the age group of 35 to 50 years. It shows that the middle
age group has been maintaining the relationship with FPS. One of the
reasons for this trend is that in many of the villages, a supervisory
committee consisting of persons belongs to different political
parties/associations is formed to oversee the functions of PDS. In majority
of the cases these groups consist of middle age groups. (Table 3.2)
3.4 Educational Status wise distribution of the respondents
Education as a key social factor plays a dominant role in molding the
behavior of the respondents. This study found that majority of the
respondents in all the sample districts were literate and diploma level
education was found very common (Table.3.3) and it was high in
Coimbatore.
Further, the respondents with no formal education were high among
weaker section than non-weaker section. The district-wise analysis shows

22
that respondents with no formal education were high in Dindigul than other
districts.
3.5 Marital status of the respondents
The size of the family decides the quantum of essential and non-
essential commodities required for consumption (Table 3.4). Based on the
size of the family the entitlement is fixed and allotment of rice, kerosene,
sugar and other controlled articles is made to FPS. It was found in the study
that Family cards are not only viewed as essential requirement for purchase
of essential articles but also to avail benefits under various Government
schemes and programmes. Even the respondents with joint family had
family cards separately for each family. Hence, majority of the respondents
were married.
3.6 Exposure to Mass Media
Mass media like Newspapers, Magazines, Radio and TV play a
predominant role in disseminating information to the mass. Exposure to
mass media helps an individual to increase his level of awareness on the
socio-economic life. Further, news on PDS are always attractive to the mass
media as FPS are always looked as rice, kerosene and sugar distribution
centres of Government. Hence, any decision taken by the policymakers on
PDS immediately reach to the nook and corner of the country. In this study
it was found that majority of the respondents have access to more than one
source of media. This helped respondents to have higher level of
awareness on the PDS. (Table. 3.5) The reasons are:
1. Every village panchayats is having common TV for the use of the public.
2. FM Radio has made easy access to information for the respondents of Coimbatore and Dindigul Districts.
3. As majority of the respondents were literates, they have easy access to information.

23
3.7 Contacts with Change Agents
The Government Departments and Non-Governmental
Organizations, as change agents, have relatively contributed for the
development of the village economy in Tamil Nadu. Especially in case of
NGOs their number has been increased during recent times in Tamil Nadu
and have been playing a significant role not only in the development of
village, but also managing FPS through Self Help Groups. The number of
FPS run by the Self-Help Groups in Tamil Nadu is already discussed in
Chapter 2.
In this study it was found that majority of the respondent had
established contact with both Government Department and NGOs (Table
3.6). Also interestingly the FPS run by SHGs have been effective in
distribution and reduced the transaction costs. However, there are also
instances, where SHGs failed to effectively manage the FPS.
In the FGD, they said that:
Women have free access to FPS as women SHGs run it. Also we sell non-controlled items to compete the local shops.
Source: FGD conducted among respondents of Panchampatti, Dindigul district on 10.09.2003. 3.8 Membership with Cooperatives
In Tamil Nadu, there are 4589 Primary Agricultural Cooperative
Banks (PACBs) and 181 Primary Agriculture and Rural Development Banks
(PCARDBs) functioning. They not only cater the banking needs of
members but also render other services for the development of the village
economy. At all India level 100 per cent of the villages are covered by
PACS and more than 75 per cent of the households enjoy the services
directly. In Tamilnadu also, the coverage of rural households by PACBs is
on par with the national average. With regard to PDS, in Tamilnadu
Cooperatives have been actively involved either as lead societies or as link
societies.
24
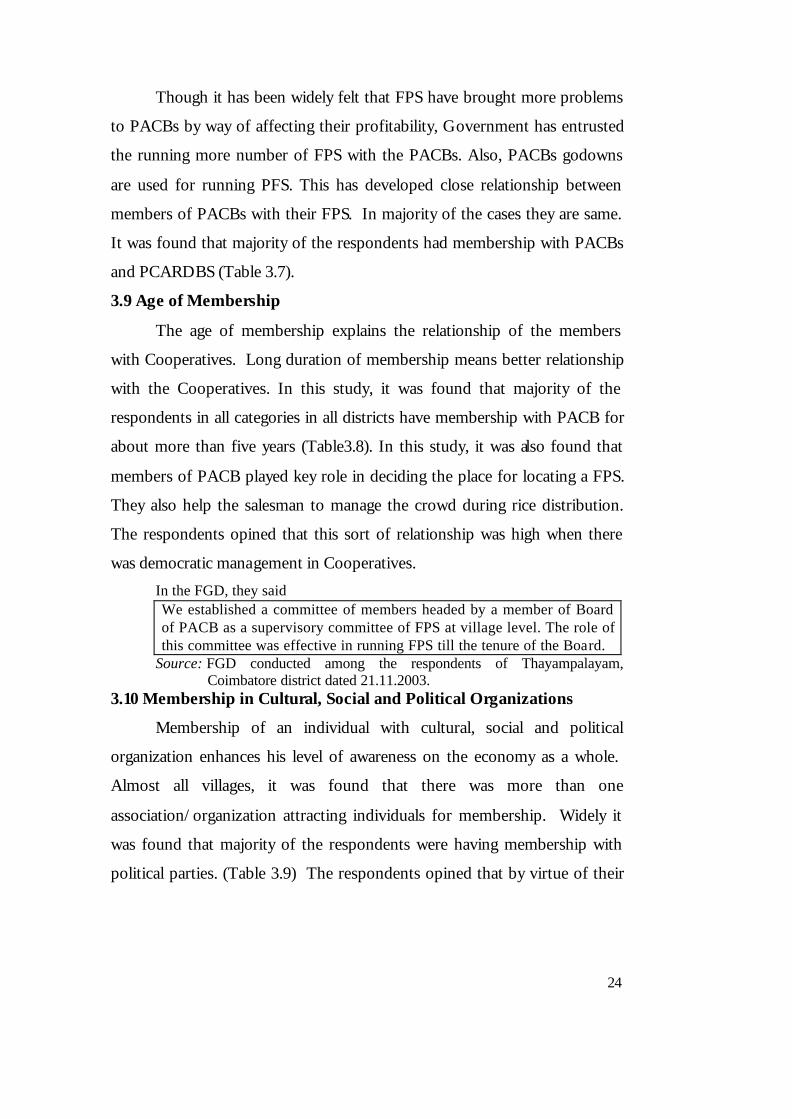
Though it has been widely felt that FPS have brought more problems
to PACBs by way of affecting their profitability, Government has entrusted
the running more number of FPS with the PACBs. Also, PACBs godowns
are used for running PFS. This has developed close relationship between
members of PACBs with their FPS. In majority of the cases they are same.
It was found that majority of the respondents had membership with PACBs
and PCARDBS (Table 3.7).
3.9 Age of Membership
The age of membership explains the relationship of the members
with Cooperatives. Long duration of membership means better relationship
with the Cooperatives. In this study, it was found that majority of the
respondents in all categories in all districts have membership with PACB for
about more than five years (Table3.8). In this study, it was also found that
members of PACB played key role in deciding the place for locating a FPS.
They also help the salesman to manage the crowd during rice distribution.
The respondents opined that this sort of relationship was high when there
was democratic management in Cooperatives.
In the FGD, they said We established a committee of members headed by a member of Board of PACB as a supervisory committee of FPS at village level. The role of this committee was effective in running FPS till the tenure of the Board.
Source: FGD conducted among the respondents of Thayampalayam, Coimbatore district dated 21.11.2003. 3.10 Membership in Cultural, Social and Political Organizations
Membership of an individual with cultural, social and political
organization enhances his level of awareness on the economy as a whole.
Almost all villages, it was found that there was more than one
association/organization attracting individuals for membership. Widely it
was found that majority of the respondents were having membership with
political parties. (Table 3.9) The respondents opined that by virtue of their

25
membership with this organization they enjoyed position in the Board of
PACBs or in running FPS.
3.11 Occupation of the respondents
Occupation decides the income level of the individual and ultimately
his purchasing behavior. As far as Tamil Nadu is concerned, during the last
several years due to monsoon failure both the production and productivity
in agriculture have been severely affected. Hence, income status of the
respondents were not separately discussed as there were already classified as
weaker sections and non – weaker sections.
As far as, the occupation of the respondents is concerned majority of
the respondents in the weaker sections category were agricultural coolies,
while majority of the respondents in the non-weaker section category were
farmers. Interestingly, it was found that Government servants, employees in
private organizations, small entrepreneurs, village traders and moneylenders
also have been the customers of FPS Centres as PDS in Tamilnadu is
universal in nature. In majority of the cases they come to FPS for the
purchase of sugar and wheat. Also, they give their cards to the needy people
for the purchase of rice intern they take the sugar. Though reasons are
varied, the low price of commodities supplied by the FPS was the main
reason. (Table3.10). Above all, due to failure of monsoon, even the large-
scale farmers depend on FPS for rice.
In the FGD, they said We were named as rice bowl of Tamil Nadu, now our bowls look FPS for rice.
Source: FGD conducted among respondents of Kathanchavadi, Nagapattinam District on 27.12,2003.

26
3.12 Purchasing behavior of the respondents
It was found that majority of the respondents depend FPS for
controlled articles. (Table 3.11) Non-controlled business of FPS was not
attractive to rural consumers. It was due to:
1) Non-availability of all non-controlled commodities under one roof
2) Non-availability of price discounts which is available in private shops
3) Location of the FPS is not at the middle of village and above
all
4) Non-availability of new stocks.
This trend compelled rural consumers to depend private shops for
non-controlled articles. But they demand that non-controlled articles also to
be sold through FPS.
Further, the reasons for selecting private agencies by the respondents
were correct rate and weight, quality, better customer relationship,
availability of varieties of commodities, credit facilities, display of the articles
and nearness.
3.13 Availability of Goods in time
India achieved self-sufficiency in food production, but that does not
guarantee food security to the poor. A long-term policy on food security
need not be over emphasized, as major portion of an individual income goes
for purchasing food articles. For example, at the all- India level the people
spend on an average about 63 per cent of their total expenditure on food in
the rural areas and about 55 per cent in the urban areas. Of the expenditure
incurred on all food items the expenditure on food grains accounts for 45
per cent in the rural areas and about 32 per cent in the urban areas. The
bottom 30 - 40 per cent of the population spends over 70 per cent of the
total expenditure on food. Of their expenditure on food, the bottom 30-40
per cent of the population spend about 50 per cent on food grains in the

27
rural areas and over 40 per cent in the urban areas (http:// Planning
commission/nic.in/Plans).
Both the Centre and State Governments have been taking serious
efforts in providing essential commodities in time to the customers. In this
regard the strategy followed in Tamilnadu is:
1) Making available adequate quantity of essential commodities of
acceptable quality at all times,
2) Ensuring equitable distribution of the available essential commodities
to all sections of the population at easily accessible places, and
3) Ensuring that the prices are affordable to all sections of the society.
Monitoring prices, market intervention, procurement, buffer stocking
and distribution of essential commodities through PDS are the functions of
the State Government arising out of the above strategies (Government of
Tamilnadu: 2004, pp-46-47).
But during the study, majority of the respondents opined that goods
were not available in time in all FPS (Table 3.12). The reasons found during
the study are:
1) In very many cases the location of FPS is at the headquarter of
PACB, which is normally away from the villages
2) Allotment of goods is not made according to the entitlements but it is
made according to the distribution of goods and opening stock at
FPS level
3) All the goods are not made available always
4) Lack of organic relationship between lead societies and link societies
leads to improper stocking of goods, and
5) Above all the FPS is opened upto 6 pm in all working days, whereas
the workers who return to their homes after 6 pm lack the
oppourtunity to purchase their entitlements. It was found that by

28
denying the oppourtunity to work, respondents had to avail the
benefits under PDS.
3.14 Satisfaction over the quantity and quality of goods available
Universal coverage is the hallmark of PDS in Tamilnadu. Though
many items have been listed as essential commodities in the Essential
Commodities Act, as most of them are freely available in the open market,
Government took efforts to distribute rice (stable food of the people in the
State), wheat, sugar, and kerosene (commonly found short supply) through
FPS. But it was widely opined by the respondents that the goods supplied
were inferior in quality and under weighment. Nearly seventy per cent of the
respondents were not satisfied over the goods supplied. Dissatisfaction is
high among the respondents belong to weaker sections in general and
among the respondents belonging to weak sections of Coimbatore and
Dindigul districts in particular. In the case of Nagapattinam district, the
dissatisfaction is high among the respondents belonging to non-weaker
sections, than their counterparts as the monsoon failure made them also to
depend FPS for food articles (Table 3-13).
3.15 Reasons for not purchasing commodities during certain times
As already stated full entitlement as per the requirements of cards are
not allotted to the FPS for distribution. Only about 90 per cent of the
entitlement is allotted. The major reason quoted by the officials was that the
cardholders did not lift all the goods. In this study an attempt is made to
find out the causes for the not purchasing the commodities by the
cardholders. The reasons found are (1) Lack of Information on the
availability of goods, (2) Lack of good quality, (3) Lack of income during the
time, Irregular supply, (4) Under-weighment, (5) Non-availability of non-
controlled articles, and (6) Lack of customer relations (Table 3-14). Among
these reasons lack of information on the availability of goods was the major
reason quoted by the majority of the respondents in general (24.2 per cent),

29
and majority of the respondents belong to weaker sections in Dindigul (31
per cent) and Nagapattinam (47.3) districts. On the other hand non-
availability of non-controlled articles was the major reason quoted by
majority of respondents belong to non-weaker sections in Coimbatore (27
per cent) and Nagapattinam (40.7 per cent). For majority of the
respondents in non-weaker sections category in Dindigul district (44 per
cent) and weaker sections category in Coimbatore (33.5 per cent) lack of
good quality was the major reason for not lifting the PDS articles. Further,
the hypothesis ‘very old stocks are allowed for PDS’ is proved.
3.16 Problems in PDS
As per the survey conducted by ORG-MARG commissioned by
CAG for assessing the perception of beneficiaries about the PDS, generally
there was dissatisfaction among the cardholders. They reported problems
of inability to obtain ration cards, charging of higher price, infrequent
opening of the FPS, frequent stock-out situations, under-weighing by the
FPS owners, inferior quality of food grains supplied through the PDS, non-
awareness of their entitlement, and non-existence of grievance-redress
channel, etc. (NIRD: 2003, p-18). This study also found that the cardholders
were facing the problems like (1) leakage, (2) under-weighment, (3) poor
quality, (4) non-availability of controlled and (5) non-controlled articles. In
general non-availability of non-controlled articles was the major problems
for majority of the respondents (27.5 per cent), which is followed by non-
availability of essential goods (22.6 per cent), though category wise
responses are different. This might be due to the facts that at village level
consumers are cheated in non-controlled articles trade by local merchants
(Table 3-15).
The respondents’ category wise analysis gives different picture. For
example for the majority of respondents in weaker sections category (27.3
per cent) non-availability of ration cards and for non-weaker sections
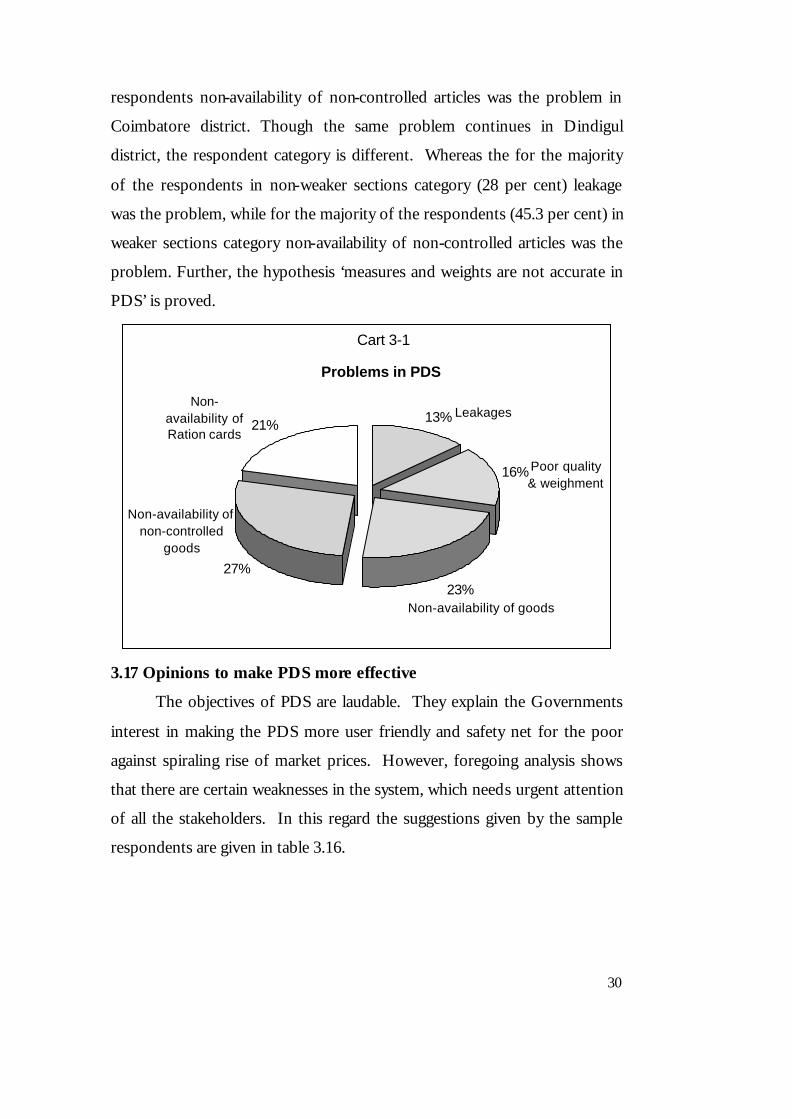
30
respondents non-availability of non-controlled articles was the problem in
Coimbatore district. Though the same problem continues in Dindigul
district, the respondent category is different. Whereas the for the majority
of the respondents in non-weaker sections category (28 per cent) leakage
was the problem, while for the majority of the respondents (45.3 per cent) in
weaker sections category non-availability of non-controlled articles was the
problem. Further, the hypothesis ‘measures and weights are not accurate in
PDS’ is proved.
Problems in PDS
13%
16%
23%27%
21%
Cart 3-1
Leakages
Poor quality & weighment
Non-availability of goods
Non-availability of non-controlled
goods
Non-availability of Ration cards
3.17 Opinions to make PDS more effective
The objectives of PDS are laudable. They explain the Governments
interest in making the PDS more user friendly and safety net for the poor
against spiraling rise of market prices. However, foregoing analysis shows
that there are certain weaknesses in the system, which needs urgent attention
of all the stakeholders. In this regard the suggestions given by the sample
respondents are given in table 3.16.

31
1) Increase the margin to society and salary to salesmen
About 9 per cent of the respondents in the entire category felt that
the margin available to cooperatives for running FPS and salary paid to
employees must be increased. However, they were not aware exact margin
and salary available to societies and employees, respectively (Table 3-17,
Table 3-18). This suggestion might have come in their mind due to the
increasing leakages of PDS articles to the open market. Also, no one can
deny the fact that the FPS salesmen are poorly paid. Further, their
educational qualifications ranges between matriculations to post-graduation.
However, some employees have got higher salary as they had wage
settlement during the period of Board of Management.
On the other hand the officials of Revenue Department, Cooperation
Department, Local Bodies, etc check the functioning of FPS periodically.
But even after all these checks and inspections malpractices have become
common phenomenon. Hence, the sample respondents felt that increase in
salary to salesmen and margin to the societies would arrest this problem to
certain extent.
Suggestions to Make PDS more effective
540
494
620
334
215
203
Chart 3-2
More Role for SHGs
Vigilance Committees
Maintaining Notice Boards
Availability of Non-controlled Commodities
Reduce Number of Cards per FPS
Increase margin & salary

32
2) Reduce the number of cards per FPS
As per the guidelines prescribed by the Government, a cardholder
should not travel more than 2 kms to reach FPS and the maximum number
of cards per shop will be 1000 at Municipal Corporation level and 800 at
village level. District Collectors are empowered to open additional FPS even
these guidelines are not satisfied. During the study the sample respondents
(8.4 per cent) opined that the number of cards handled by the FPS should
be reduced from the present level of 800, so as to enable the salesmen to
plan the requirements and distribute the cardholders with out any delay.
When one salesmen is made responsible for distributing large number of
card holders he could not distribute more than one article at a time and it
seems that even in some notice boards of FPS bearing the words like ‘today
kerosene only distributed’, even though stocks of the other articles are
available.
3) Availability of non-controlled articles
Though the respondents felt the importance of FPS in distributing
the rationed articles and control the prices in the open market about 22.5
per cent of them opined that non-controlled articles also should be made
available in FPS. The reasons they quote are within the purview of the
objectives of the PDS. They are viz.,
a) To make the non-controlled articles available to the rural
consumers at fair price, as they are priced slightly higher than
the MRP in rural areas.
b) To put check to the price rise in the local market
c) To increase the business viability of FPS
4) Notice Boards
Name of the FPS, stock position of different commodities, working
hours of FPS, cardholders’ details and allotment, higher officials phone
numbers for compliance, scale of supply, area allotted, etc., are to be
33
displayed though notice boards at every FPS. But during the field study it
was found that notice board was least cared by the personnel concerned and
are poorly maintained. Hence, the respondents (20.6 per cent) felt that
notice board should be kept updated daily.
5) Vigilance committees
There is separate administrative and supervisory wing is in operation
for food administration at State level. The Commissioner of Civil Supplies
and Consumer Protection is in overall charge. He is assisted by an
Additional Commissioner of Civil Supplies and Consumer Protection, one
Joint Commissioner, three Deputy Commissioners, a District Supply Officer
in each District and one Taluk Supply Officer in each Taluk. Allocation of
commodities to FPS is done by the District Supply Officers. The District
Supply Officers and Taluk Supply Officers also inspect the shops and
monitor the lifting and stock position.
Above all to improve the efficiency of the PDS, advisory committees
have been constituted at Village Panchayat, Revenue Divisions, and District
levels with officials concerned, people’s representatives and voluntary
consumer organizations as members. Above all a separate supervisory wing
is functioning under the Registrar of Cooperative Societies to inspect the
PDS (Table –3-19 & Table 3-20). But majority of the (25.7 per cent) sample
respondents of this study opined that they were unaware on the functioning
of these committees. Statistically also the hypothesis ‘monitoring of the
scheme is ineffective’ is proved. They suggest that FPS level vigilance
committees are to be created consisting of officials, cardholders and
consumer organizations so as to make the functioning of FPS more
efficiently.
6) More roles for SHGs
Women SHGs have been showing keen interest in running FPS, as it
directly affect their food security and felt that ‘PDS has crated overall

34
benefits to the poor people’. Hence, the hypothesis is proved. Further, it
was found that FPS run by SHGs are away from any political or social
problems. Infact they draw support and patronage from the villagers for
running FPS. The other benefits accrued out their business are:
1) Low transaction cost
2) Free from complaints of under weighment
3) Easy access to women members
4) Availability of non-controlled articles like other village shops, and
above all
5) Extended working hours for the facility of the villagers.
Hence, for about 13.9 per cent of the respondents opined that more
roles must be given for women SHGs to run FPS.
3.18 Conclusion
At Government level all efforts are taken to make the system more
effective and ensure the availability, affordability and accessibility of PDS
articles to the poor. But the responses of sample respondents of this study
showed different picture and unearthed that PDS is suffering from
problems like leakages, poor quality and under weighment, non-availability
of controlled as well as non-controlled articles, and non-availability of ration
cards. As the main objective of PDS is to provide safety net to the poor
against spiraling rise in price, the selling of non-controlled articles through
FPS is not away from the scope of PDS. Above all non-controlled articles
trade will strengthen the business viability of FPS. Further, increased
margin to cooperatives, and better salary to employees, reduction in the
number of cards to be handled by a FPS, maintaining and updating the
Notice Boards at every FPS, formation of vigilance committees at every FPS
level and providing more role to women SHGs are the viable options put by
the sample respondents for policy making to strengthen the PDS, which
cannot be ignored.

35
Chapter-4
Major Findings, Conclusions and Suggestions
This chapter presents the major findings of the present study,
conclusions and suggestions to make the PDS more effective.
4.1. Major Findings
Major findings of the study are listed below:
1) Universal coverage is the hallmark of PDS in Tamil Nadu. Only the
Government owned Tamil Nadu Civil Supplies Corporation,
Cooperatives and women SHGs alone are involved in running FPS.
More than 93 percent of FPS is run by cooperatives.
2) Villupuram district has the largest number of FPS, which was
followed by Coimbatore district, and Chennai North.
3) More than 2 percent of cards in circulation were found bogus during
the years 2001-2003 and the problem was high in Coimbatore district,
which was followed by Chennai North.
4) The difference between State’s average open market price and PDS
issue price of rice was more Rs.6 over the years, in contradiction to
this annual off-take of rice has come down while food subsidy
incurred by the State has increased from Rs.874 crores to 1240 crores.
5) While compared to Dindigul and Nagapattinam, the coverage of
cardholders and FPS was high in Coimbatore district.
6) The distribution pattern of PDS articles shows that the distribution of
rice and wheat was high in Nagapattinam district while kerosene was
high in Coimbatore district.
7) In all the commodities, in all the sample districts, there was difference
between commodities allotted and distributed; particularly the
difference was high in rice.
8) The district wise and respondents’ category wise analysis showed that
in all sample districts, the percentage of female respondents was high.

36
9) Middle age groups have close relationship with FPS.
10) The study found that majority of the respondents in the entire sample
districts were literates and diploma level education (technical) was
found high in Coimbatore district.
11) The study found that majority of the sample respondents was
married. Further, family cards were viewed beyond PDS
requirements.
12) It was found that sample respondents in all sample districts had
higher level of exposure to mass media.
13) It was found that sample respondents had higher level of contacts
with change agents, especially NGOs.
14) It was found that majority of the respondents, in all categories, in all
districts had membership with PACB for more than 5years.
15) It was found that by virtue of their participation in cultural, social and
political organizations, sample respondents enjoyed position in the
Board of Management of PACB or in running FPS.
16) It was found that all sections of people have used PDS articles and
the lower price was the motivating factor.
17) Non-controlled articles sold currently at FPS were not attractive to
rural consumers.
18) Majority of the sample respondents of the all sample districts felt that
goods were not available in time in all FPS.
19) It was found that dissatisfaction over the quality and quantity of
goods available were high among the respondents belonging to
weaker sections in general and among the weaker sections of
Dindigul and Coimbatore districts in particular.
20) It was found that lack of information on the availability of goods was
the major reason among the sample respondents for not purchasing
commodities during certain times.

37
21) It was found that non-availability of non-controlled articles, which
was followed by non-availability of controlled articles were the major
problems faced by sample respondents.
22) Increasing the margin to the society and the salary to the employees,
reducing the number of family cards to be handled by FPS,
maintaining and updating notice boards, forming vigilance
committees, providing more role of SHGs in running FPS and above
all, providing non-controlled articles were the major suggestions
given by sample respondents to make the PDS more effective.
4.2 Conclusion
Universal coverage is the hallmark of PDS in Tamil Nadu. State
Government is making all efforts to make the PDS more effective by
ensuring the availability, affordability and accessibility of PDS articles to the
poor. The network of PDS consists of 28132 FPS covering 1.52 lakh family
cards. Here, Cooperatives have been given more role in running FPS. The
emerging role of SHGs in PDS is widely appreciated. Moreover, they enjoy
the participation and involvement of entire village in running FPS. Hence,
FPS run by SHGs are found cost effective and trouble free.
The difference between State’s average, open market price and PDS
issue price of rice was more than Rs.6, but at the same time, off-take of PDS
have come down, in contradiction to this food subsidy incurred by state
have increased over the years. Sample districts wise analysis shows that the
problems of bogus cards were high in Coimbatore district. There were
differences between allotment and disbursement of PDS articles.
The participation of women and middle-aged respondents were
found high in all sample districts. Lack of information on the non-
availability of ration-articles was major reason for not lifting articles during
certain times. The non-controlled articles available at FPS were not
attractive, as they lack competitive advantage; sample respondents opined

38
that non-availability of non-controlled articles was the major problem.
Hence, irrespective of category of respondents opined that to control the
open market price, non-controlled articles too should be supplied through
FPS, in addition to making available the entitlements of individual
consumers for their purchase. Further, this is the major suggestion given by
the sample respondents to make PDS more effective. This shows that to
make the system more viable and effective, the participation of people is
important. In this context the best practices of some women SHGs may be
emulated and the role of local bodies in running FPS may be strengthened.
Above all the present system of universal system of PDS should be
continued as it has control over the market prices of essential commodities.
4.3 Suggestions
The following suggestions are made to make the PDS more effective
based on the findings of this study.
1) More Role for Women SHGs to run FPS
The role of women SHGs were widely appreciated not only in micro
credit but also in running the FPS. The reasons quoted were for business
viability of FPS as well as attracting the participation of users of PDS. At
the same time women SHGs need training to handle the system more
effectively. By giving proper training they may be involved widely in
running the FPS.
2) Vigilance Committees
The role of vigilance committees should be made transparent,
accountable and responsible. Wide publicity must be given on the role of
these committees and the particulars of officers’ incharge of the committees.
In this study it was found that the round the clock control room established
specially for monitoring PDS at the office of the Joint Registrar of
Cooperative Societies, Dindigul district have given positive results. These

39
facilities available at district headquarters should be made known to the
public.
3) Role of FPS
The role of FPS cannot be restricted with the distribution of rationed
articles alone, both in the context of business viability as well as
safeguarding the poor against spiraling rice of essential commodities.
Hence, FPS should concentrate on non-controlled articles also. At the same
time they should be competitive enough in attracting the consumers.
4) Distribution of Family cards
Family cards are used not only for purchasing requirements at FPS
but also as an identity card for the family. The problems of bogus cards as
well as not-issuing the cards to genuine cases were widely reported during
the study. This problem should be viewed seriously.
5) Role of Cooperatives in PDS
FPS has brought more problems to cooperatives in some cases, while
they were the salary providers to employees of cooperatives in some cases.
This aspect need a separate study to define the role of cooperatives in PDS
as well as to make use of cooperative network to make the PDS more
effective.
6) Bogus Cards
It was found that, 386614 bogus cards were detected during raids
during the years 2001-2003. Effective coordination between local bodies,
revenue authorities and lead and link societies will alone be able to solve this
problem. Above all the employee of the PDS retail outlet should be made
responsible for eradicating the problem of bogus cards. As the maximum
number of cards per ration shops is 1000, the PDS retail outlet personnel
could early detect and prevent bogus cards. Also the support of local PDS
Vigilance Committees may also be used in connection.
* * * * * * * *

I
Table 2-1
Fair Price Shops in Tamilnadu (As on 31.03.2004)
No. of Fair Price Shops
Run by TNCSC
No. of Fair Price Shops Run
by CO-OPERATIVES
No. of Fair Price
Shops Run by OTHERS
Women FPS
Total
Name of the District
Full time
Part time
Full time
Part time
Full time
Part time
Full time
Part time M
obil
e S
hops
Full time
Part time
GRAND TOTAL
Chennai North 215 0 436 3 10 0 0 0 661 3 664 (2.4) Chennai South 125 0 462 2 3 0 0 0 590 2 592 (2.1) Kancheepuram 30 0 804 418 2 0 29 19 865 437 1302 (4.7) Thiruvallur 7 0 711 179 1 0 0 6 719 185 904 (3.2) Vellore 41 0 1141 413 0 0 15 0 3 1200 413 1613 (5.7) Thiruvannamalai 3 0 1054 232 0 0 3 8 1 1061 240 1301 (4.6) Villupuram 0 0 1555 260 0 0 28 0 3 1586 260 1846 (6.6) Cuddalore 0 0 1112 134 3 1 8 0 1123 135 1258 (4.5) Dharmapuri 29 1 415 210 0 0 0 10 1 445 221 666 (2.4) Salem 0 0 1038 185 0 0 10 0 5 1053 185 1238 (4.4) Namakkal 36 0 547 133 0 0 6 0 589 133 722 (2.6) Erode 14 0 900 217 0 0 41 0 2 957 217 1174 (4.2) Coimbatore 62 0 1212 256 30 0 0 76 5 1309 332 1641 (5.8) Nilgiris 23 0 243 24 34 0 29 0 8 337 24 361 (1.3) Karur 2 0 336 125 0 0 14 0 352 125 477 (1.7) Perambalur 3 0 433 159 0 0 1 7 437 166 603 (2.1) Trichy 19 0 797 158 0 0 1 6 1 818 164 982 (3.5) Thanjavur 0 0 853 170 1 0 14 0 868 170 1038 (3.7) Thiruvarur 0 0 566 63 0 0 5 0 571 63 634 (2.3) Nagapattinam 0 0 565 33 17 0 22 0 604 33 637 (2.3) Pudukottai 17 0 667 182 0 0 9 1 693 183 876 (3.1) Dindigul 16 0 633 125 0 0 10 1 2 661 126 787 (2.8) Theni 0 0 372 34 1 0 13 0 386 34 420 (1.5) Madurai 28 0 930 95 3 0 16 1 977 96 1073 (3.8) Sivagangai 19 0 583 24 5 0 1 0 608 24 632 (2.3) Virudhunagar 25 0 626 118 0 0 12 0 663 118 781 (2.8) Ramanathapuram 19 0 477 31 0 0 17 0 2 515 31 546 (1.9) Toothukudi 76 6 607 116 0 0 0 3 683 125 808 (2.9) Tirunelveli 156 44 752 197 5 2 22 0 3 938 243 1181 (4.2) Kanyakumari 98 7 426 48 36 4 27 0 587 59 646 (2.3) Krishnagiri 28 0 454 228 0 0 0 19 482 247 729 (2.6) TOTAL 1091 58 21707 4572 151 7 353 157 3
6 23338 4794 28132
Source: Short notes issued by the Office of the Registrar of Cooperative Societies, Chennai
II
Table – 2-2
Classification of Cooperative Societies running FPS (As on 36.06.2004)
No.of Shops run by Lead Societies
Shops run by Link Societies Self Lifting Societies
CWS CMS PACB P.Stores LAMPS Others
SlNo
Particulars
No Shops No Shops No. Shops No. Shops No. Sho
ps No. Sho
ps No Shop
s
No. Shops
Total No.of SACTops
Total No.of Societies
1. CWS 29 1758 - - 21 96 2303 8221 81 292 - - 21 79 5 706 11152 34 2. CMS 49 728 3 31 6 32 1905 6292
1103 336 9 73 14 123 31 387 8641 114
3. P.Store 5 86 - - - - 1 8 25 60 - - 1 5 181 823 982 587 4. PACB 3 26 - - - - 23 103 24 48 - - - - 192 625 802 4589 5. LAMP
S - - - - - - - - - - - - - - 8 47 47 18
6. Others - - - - - - - - -- - - - - - 17 38 38 319 Total 86 2598 3 31 27 128 4232 1526
3233 736 9 73 36 207 434 2626 21662 5661
Source: As in Table 2-1
III
Table 2-3
Family Cards In Circulation In Tamil Nadu
Name of the
District
Bogus cards detected during
2001-2003
New cards issued during 2001-2003
Cards in Circulation
As on 1.4.2004
Percentage to total cards
ChennaiNorth 36885 12821 772150 5.06 ChennaiSouth 27798 10712 733453 4.81 Kancheepuram 4999 2414 453692 2.97 Thiruvallur 6312 734 360790 2.38 Vellore 15135 4251 761290 4.99 Thiruvannamalai 14306 3819 513911 3.37 Villupuram 6707 855 711176 4.66 Cuddalore 10334 544 526414 3.45 Dharmapuri 8832 1263 289873 1.90 Salem 23994 2404 746123 4.89 Namakkal 32874 4362 407841 2.67 Erode 12444 2537 750866 4.92 Coimbatore 15232 8271 1137481 7.46 Nilgiris 8767 1682 209171 1.37 Karur 2705 1499 261766 1.72 Perambalur 9569 749 304068 1.99 Trichy 35142 3417 600849 3.94 Thanjavur 7673 1104 527465 3.46 Thiruvarur 3836 1376 273955 1.79 Nagapattinam 12570 5243 331829 2.18 Pudukottai 4883 2814 316095 2.07 Dindigul 6150 117 454865 2.98 Theni 3077 4152 286650 1.88 Madurai 15423 6123 709156 4.65 Sivagangai 2825 256 291875 1.91 Virudhunagar 11614 1454 441861 2.89 Ramanathapuram 2930 425 292830 1.92 Toothukudi 15788 556 378325 2.48 Tirunelveli 17408 12205 662980 4.35 Kanyakumari 10422 4809 425264 2.79 Krishnagiri 320858 2.10 TOTAL 386614 102969 15254922 100
Source: As in Table 2-1

IV
Table 2-4
Distribution of Rice
No. of members in the family Maximum Quantity issued (per month)
One Adult (one unit) 12 Kgs. One Adult + One Child (1 + ½ Units) 14 Kgs. Two Adults or One Adult & 2 Children (2 units) 16 Kgs. Two Adults and One Child or One Adult with 3 Children (2 + ½ Units)
18 Kgs.
Three Adults and above (3 Units and above) 20 Kgs. Source: Government of Tamilnadu, Policy Note 2004-05,p56
Table 2-5
Off take and Open Market Prices
State Average Open Market Price
PDS issue price Difference
Year Common Fine &
Superfine Common
Fine & Superfine
Annual PDS
Off-take (in M.Ts)
Common Fine &
Superfine 1996-
97 8.44 9.93 2.00 3.75
2413006 (-)
6.44 6.18
1997-98
8.53 9.50 2.00 3.75 2218618 (8.05)
6.53 5.75
1998-99
9.09 10.44 2.00 3.75 2147784 (3.19)
7.09 6.69
1999-2000
10.10 11.45 2.00 3.75 2208013 (2.80)
8.10 7.7
2000-2001
10.55 11.60 3.50 3.50 2116477 (4.19)
8.05 8.1
2001-2002
10.36 11.38 3.50 3.50 2153428 (1.74)
6.86 7.88
2002-2003
10.69 12.02 3.50 3.50 2220515 (3.12)
7.19 8.52
2003-2004
11.79 12.41 3.50 3.50 2005978 (9.66)
8.29 8.91
Source: As in Table 2-1
Table 2-6 Details of Food Subsidy
Year Amount in Crores Growth Rate 1996-1997 874.00 42.11 1997-1998 905.00 3.55 1998-1999 907.00 0.22 1999-2000 1145.00 26.24 2000-2001 1540.00 34.49 2001-2002 1240.00 19.48 2002-2003 1240.00 0
Source: As in Table 2-1.
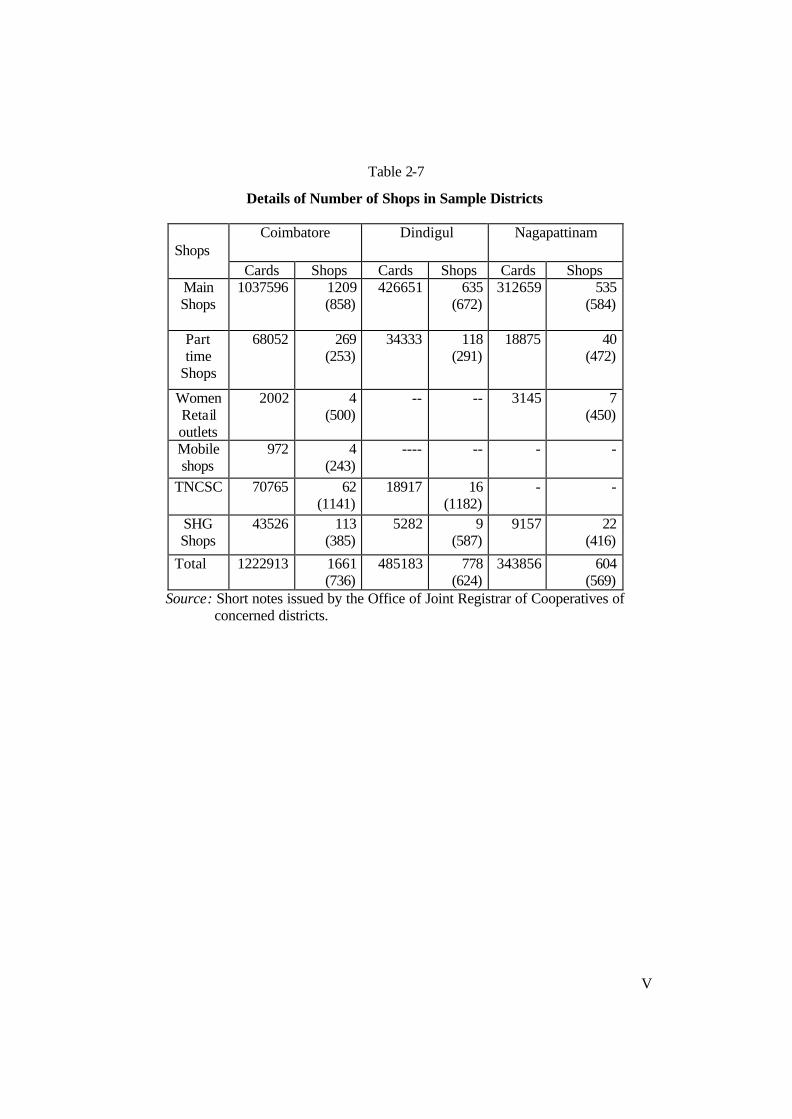
V
Table 2-7
Details of Number of Shops in Sample Districts
Coimbatore Dindigul Nagapattinam Shops
Cards Shops Cards Shops Cards Shops Main Shops
1037596 1209 (858)
426651 635 (672)
312659 535 (584)
Part time
Shops
68052 269 (253)
34333 118 (291)
18875 40 (472)
Women Retail outlets
2002 4 (500)
-- -- 3145 7 (450)
Mobile shops
972 4 (243)
---- -- - -
TNCSC 70765 62 (1141)
18917 16 (1182)
- -
SHG Shops
43526
113 (385)
5282 9 (587)
9157 22 (416)
Total 1222913
1661 (736)
485183 778 (624)
343856 604 (569)
Source: Short notes issued by the Office of Joint Registrar of Cooperatives of concerned districts.
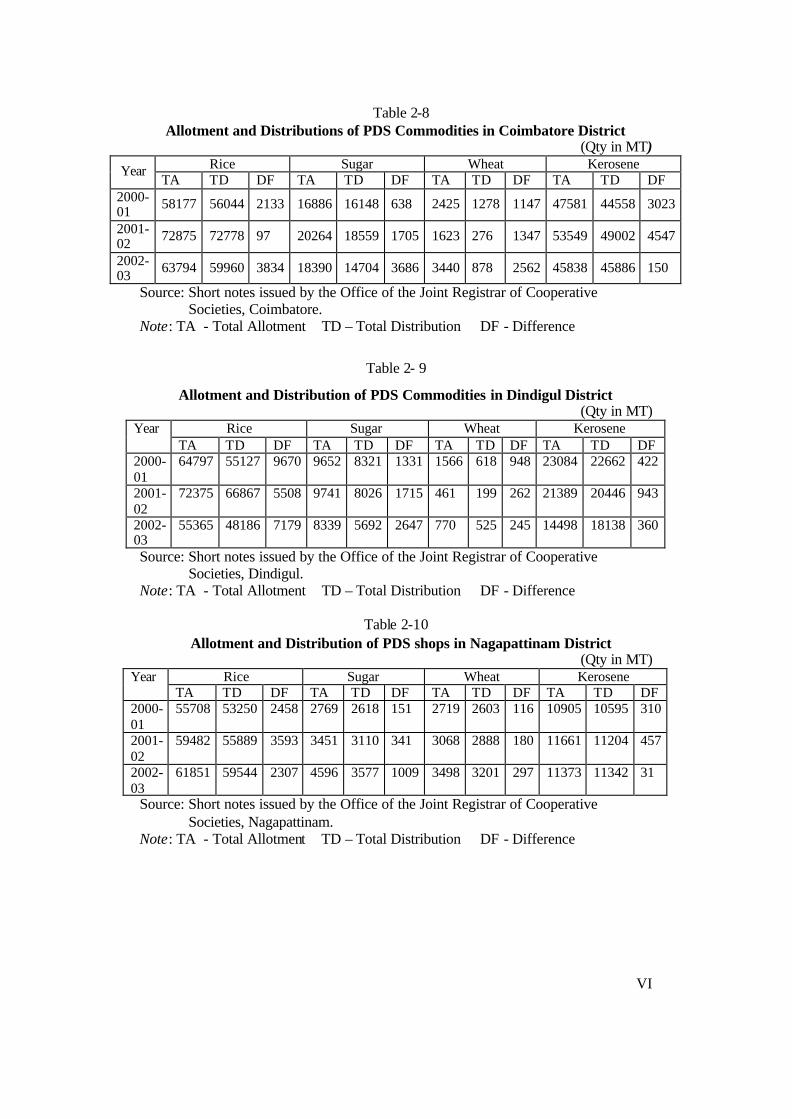
VI
Table 2-8
Allotment and Distributions of PDS Commodities in Coimbatore District (Qty in MT)
Rice Sugar Wheat Kerosene Year TA TD DF TA TD DF TA TD DF TA TD DF
2000-01
58177 56044 2133 16886 16148 638 2425 1278 1147 47581 44558 3023
2001-02
72875 72778 97 20264 18559 1705 1623 276 1347 53549 49002 4547
2002-03
63794 59960 3834 18390 14704 3686 3440 878 2562 45838 45886 150
Source: Short notes issued by the Office of the Joint Registrar of Cooperative Societies, Coimbatore. Note: TA - Total Allotment TD – Total Distribution DF - Difference
Table 2- 9
Allotment and Distribution of PDS Commodities in Dindigul District (Qty in MT)
Rice Sugar Wheat Kerosene Year TA TD DF TA TD DF TA TD DF TA TD DF
2000-01
64797 55127 9670 9652 8321 1331 1566 618 948 23084 22662 422
2001-02
72375 66867 5508 9741 8026 1715 461 199 262 21389 20446 943
2002-03
55365 48186 7179 8339 5692 2647 770 525 245 14498 18138 360
Source: Short notes issued by the Office of the Joint Registrar of Cooperative Societies, Dindigul. Note: TA - Total Allotment TD – Total Distribution DF - Difference
Table 2-10 Allotment and Distribution of PDS shops in Nagapattinam District
(Qty in MT) Rice Sugar Wheat Kerosene Year
TA TD DF TA TD DF TA TD DF TA TD DF 2000-01
55708 53250 2458 2769 2618 151 2719 2603 116 10905 10595 310
2001-02
59482 55889 3593 3451 3110 341 3068 2888 180 11661 11204 457
2002-03
61851 59544 2307 4596 3577 1009 3498 3201 297 11373 11342 31
Source: Short notes issued by the Office of the Joint Registrar of Cooperative Societies, Nagapattinam. Note: TA - Total Allotment TD – Total Distribution DF - Difference

VII
Table-3.1 Sex – wise distribution of respondents
(Figures in Numbers) CBE DGL NGM Total Particulars
W NW W NW W NW W NW Grand Total
Male 25
(6.2) 269
(67.3) 78
(19.5) 298
(74.5) 96
(24) 199
(49.8) 199
(16.6) 766
(63.8) 965
(40.2)
Female 375 (93.8)
131 (32.7)
322 (80.5)
102 (25.5)
304 (76)
201 (50.2)
1001 (83.4)
434 (36.2)
1435 (59.8)
Total 400 (100)
400 (100)
400 (100)
400 (100)
400 (100)
400 (100)
1200 (100)
1200 (100)
2400 (100)
Source: Compiled from Respondents Schedule Note: CBE – Coimbatore, DGL- Dindigul, NGM - Nagapattinam
Table 3-2 Age– wise distribution of respondents
(Figures in Numbers) CBE DGL NGM Total Particulars
W NW W NW W NW W NW Grand Total
Up to 35 5 (1.3)
38 (9.5)
17 (4.3)
21 (5.3)
32 (8.0)
39 (9.8)
54 (4.5)
98 (8.2)
152 (6.3)
35 – 50 363 (90.7)
256 (64)
206 (51.5)
296 (74)
198 (49.5)
306 (76.5)
767 (64)
858 (71.5)
1625 (67.7)
Above 50 32 (8.0)
106 (26.5)
177 (44.2)
83 (20.7)
170 (42.5)
55 (13.7)
379 (31.5)
244 (20.3)
623 (26)
Total 400 (100)
400 (100)
400 (100)
400 (100)
400 (100)
400 (100)
1200 (100)
1200 (100)
2400 (100)
Source: As in Table. 3.1 Note: As in note 3.1 Table 3-3
Educational status – wise distribution of respondents (Figures in Numbers)
CBE DGL NGM Total Particulars W NW W NW W NW W NW
Grand Total
No formal Education
21 (5.1)
96 (24)
233 (58.3)
19 (4.7)
167 (41.8)
28 (7)
421 (35.5)
143 (11.9)
564 (23.5)
Primary 102 (25.5)
152 (38)
39 (9.8)
15 (3.7)
105 (26.3)
30 (7.5)
246 (20.5)
189 (15.7)
435 (18.2)
Secondary 37 (9.3)
79 (19.8)
31 (7.6)
36 (9)
21 (5.3)
11 (2.8)
89 (7.4)
126 (10.6)
215 (8.9)
College 1 (0.3)
3 (0.8)
4 (1)
199 (49.8)
12 (3)
205 (51.2)
17 (1.4)
407 (33.9)
424 (17.6)
Diploma 238 (59.5)
61 (15.2)
90 (22.5)
118 (29.5)
91 (22.6)
121 (30.2)
419 (34.6)
308 (25.6)
727 (30.3)
Others
1 (0.3)
9 (2.2)
3 (0.8)
13 (3.3)
4 (1)
5 (1.3)
8 (0.6)
27 (2.3)
35 (1.5)
Total 400 (100)
400 (100)
400 (100)
400 (100)
400 (100)
400 (100)
1200 (100)
1200 (100)
2400 (100)
Source: As in Table. 3.1 Note: As in note 3.1
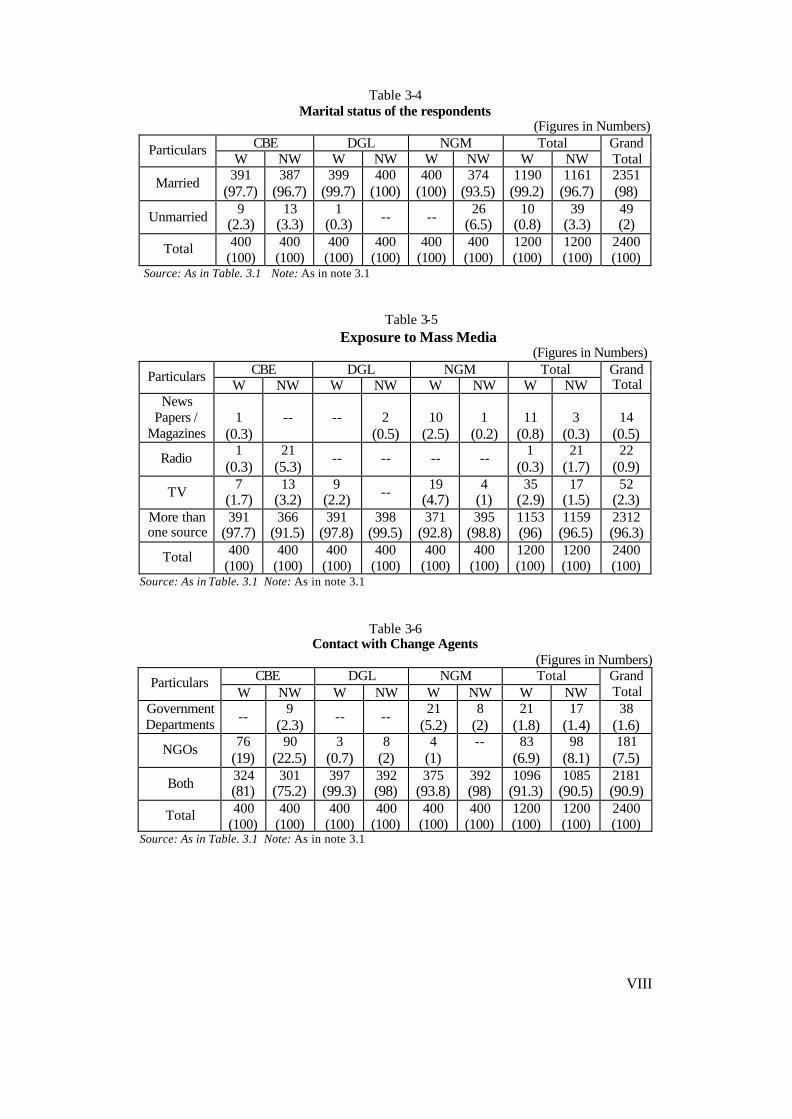
VIII
Table 3-4 Marital status of the respondents
(Figures in Numbers) CBE DGL NGM Total Particulars
W NW W NW W NW W NW Grand Total
Married 391
(97.7) 387
(96.7) 399
(99.7) 400
(100) 400
(100) 374
(93.5) 1190
(99.2) 1161
(96.7) 2351 (98)
Unmarried 9
(2.3) 13
(3.3) 1
(0.3) -- --
26 (6.5)
10 (0.8)
39 (3.3)
49 (2)
Total 400 (100)
400 (100)
400 (100)
400 (100)
400 (100)
400 (100)
1200 (100)
1200 (100)
2400 (100)
Source: As in Table. 3.1 Note: As in note 3.1
Table 3-5
Exposure to Mass Media (Figures in Numbers)
CBE DGL NGM Total Particulars W NW W NW W NW W NW
Grand Total
News Papers /
Magazines
1
(0.3)
--
--
2
(0.5)
10
(2.5)
1
(0.2)
11
(0.8)
3
(0.3)
14
(0.5)
Radio 1
(0.3) 21
(5.3) -- -- -- --
1 (0.3)
21 (1.7)
22 (0.9)
TV 7
(1.7) 13
(3.2) 9
(2.2) --
19 (4.7)
4 (1)
35 (2.9)
17 (1.5)
52 (2.3)
More than one source
391 (97.7)
366 (91.5)
391 (97.8)
398 (99.5)
371 (92.8)
395 (98.8)
1153 (96)
1159 (96.5)
2312 (96.3)
Total 400 (100)
400 (100)
400 (100)
400 (100)
400 (100)
400 (100)
1200 (100)
1200 (100)
2400 (100)
Source: As in Table. 3.1 Note: As in note 3.1
Table 3-6
Contact with Change Agents (Figures in Numbers)
CBE DGL NGM Total Particulars W NW W NW W NW W NW
Grand Total
Government Departments
-- 9
(2.3) -- --
21 (5.2)
8 (2)
21 (1.8)
17 (1.4)
38 (1.6)
NGOs 76
(19) 90
(22.5) 3
(0.7) 8
(2) 4
(1) --
83 (6.9)
98 (8.1)
181 (7.5)
Both 324 (81)
301 (75.2)
397 (99.3)
392 (98)
375 (93.8)
392 (98)
1096 (91.3)
1085 (90.5)
2181 (90.9)
Total 400 (100)
400 (100)
400 (100)
400 (100)
400 (100)
400 (100)
1200 (100)
1200 (100)
2400 (100)
Source: As in Table. 3.1 Note: As in note 3.1

IX
Table 3-7 Membership with Cooperatives
(Figures in Numbers) CBE DGL NGM Total Particulars
W NW W NW W NW W NW Grand Total
PACB 331 (82.7)
2 (0.5)
325 (81.2)
10 (2.5)
259 (64.7)
33 (8.3)
915 (76.3)
15 (1.3)
930 (38.7)
PCARDB 38 (9.5)
2 (0.5)
24 (6)
66 (16.5)
8 (2)
56 (14.7)
70 (5.8)
154 (12.8)
224 (9.3)
Both 31 (7.8)
396 (99)
51 (12.8)
324 (81)
133 (33.3)
311 (77)
215 (17.9)
1031 (85.9)
1246 (52)
Total 400 (100)
400 (100)
400 (100)
400 (100)
400 (100)
400 (100)
1200 (100)
1200 (100)
2400 (100)
Source: As in Table. 3.1 Note: As in note 3.1
Table 3-8
Age of Membership (Figures in Numbers)
CBE DGL NGM Total Particulars W NW W NW W NW W NW
Grand Total
Less than 3 years
63 (15.8)
72 (18)
88 (22)
112 (28)
89 (22.2)
141 (35.2)
240 (20)
325 (27.1)
565 (23.5)
3- 5 years 114 (28.5)
115 (28.7)
107 (26.7)
142 (35.5)
109 (27.2)
102 (25.5)
330 (27.5)
359 (29.9)
689 (28.7)
More than 5 years
223 (55.7)
213 (53.3)
205 (51.3)
146 (36.5)
202 (50.6)
157 (39.3)
630 (52.5)
516 (43)
1146 (47.8)
Total 400 (100)
400 (100)
400 (100)
400 (100)
400 (100)
400 (100)
1200 (100)
1200 (100)
2400 (100)
Source: As in Table. 3.1 Note: As in note 3.1
Table 3-9 Membership in Cultural / Social / Political Organizations
(Figures in Numbers) CBE DGL NGM Total Particulars
W NW W NW W NW W NW Grand Total
Cultural Organizations
42 (10.5)
39 (9.7)
56 (14)
49 (12.3)
52 (13)
41 (1.2)
150 (12.5)
129 (10.7)
279 (11.6)
Caste Associations
97 (24.2)
65 (16.3)
92 (23)
63 (15.7)
89 (22.2)
72 (18)
278 (23.1)
200 (16.6)
478 (19.9)
Political Associations
261 (65.3)
296 (74)
252 (63)
288 (72)
259 (64.8)
287 (71.8)
772 (64.4)
871 (72.7)
1643 (68.5)
Total 400 (100)
400 (100)
400 (100)
400 (100)
400 (100)
400 (100)
1200 (100)
1200 (100)
2400 (100)
Source: As in Table. 3.1 Note: As in note 3.1

X
Table 3-10 Occupation of the Respondents
(Figures in Numbers) CBE DGL NGM Total Particulars
W NW W NW W NW W NW Grand Total
Agriculture 148 (37)
28 (7)
139 (34.7)
199 (49.9)
175 (43.7)
215 (53.7)
462 (38.5)
442 (36.8)
904 (37.6)
Agri coolies 189 (47.3)
-- 176 (44)
-- 186 (46.6)
-- 551 (45.9)
-- 551 (23.9)
Dairy 63 (15.7)
95 (23.7)
85 (21.3)
118 (29.5)
39 (9.7)
125 (31.3)
187 (15.6)
338 (28.3)
525 (20.8)
Sheep rearing --
9 (2.2)
-- 16 (4)
-- 19 (4.8)
-- 44 (3.7)
44 (1.8)
Government servants
--
11 (2.8)
-- 18 (4.5)
-- 12 (3)
-- 41 (3.4)
41 (1.8)
Employees in Private Organizations
-- 20 (5)
-- 23 (5.7)
-- 15 (3.7)
-- 58 (4.8)
58 (2.4)
Micro Entrepreneurs
--
212 (53)
-- 15 (3.7)
-- 4 (1)
-- 231 (19.3)
231 (9.8)
Village traders
-- 10 (2.5)
-- 11 (2.7)
-- 6 (1.5)
-- 27 (2.2)
27 (1.1)
Money lenders
-- 15 (3.8)
-- -- -- 4 (1)
-- 19 (1.5)
19 (0.8)
Total 400 (100)
400 (100)
400 (100)
400 (100)
400 (100)
400 (100)
1200 (100)
1200 (100)
2400 (100)
Source: As in Table. 3.1 Note: As in note 3.1
Table 3.11
Purchasing Behavior of Respondents
(Figures in Numbers) CBE DGL NGM Total Particulars
W NW W NW W NW W NW Grand Total
Controlled 218 (54.5)
190 (47.5)
205 (51.2)
194 (48.5)
209 (52.2)
184 (46)
632 (52.6)
568 (47.3)
1200 (50)
Non -Controlled
2 (0.5)
10 (2.5)
5 (1.3)
6 (1.5)
9 (2.5)
5 (1.3)
16 (1.4)
21 (1.8)
37 (1.5)
Both 180 (45)
200 (50)
190 (47.5)
200 (50)
182 (45.3)
211 (52.7)
552 (46)
611 (50.9)
1163 (48.5)
Total 400 (100)
400 (100)
400 (100)
400 (100)
400 (100)
400 (100)
1200 (100)
1200 (100)
2400 (100)
Source: As in Table. 3.1 Note: As in note 3.1

XI
Table 3-12
Availability of Goods in Time in PDS (Figures in Numbers)
CBE DGL NGM Total Particulars W NW W NW W NW W NW
Grand Total
Available 126 (31.5)
254 (63.5)
107 (26.8)
226 (56.5)
112 (28)
211 (53)
345 (28.7)
691 (57.6)
1036 (43.1)
Not – available
274 (68.5)
146 (36.5)
293 (73.2)
174 (43.5)
288 (72)
189 (47)
855 (71.3)
509 (42.4)
1364 (56.9)
Total 400 (100)
400 (100)
400 (100)
400 (100)
400 (100)
400 (100)
1200 (100)
1200 (100)
2400 (100)
Source: As in Table. 3.1 Note: As in note 3.1
Table 3-13 Satisfaction over the goods available
(Figures in Numbers) CBE DGL NGM Total Particulars
W NW W NW W NW W NW Grand Total
Satisfied 106 (26.5)
141 (35.2)
131 (32.8)
192 (48)
89 (22.3)
79 (19.8)
326 (27.2)
412 (34.3)
738 (30.7)
Not – Satisfied
294 (73.5)
259 (64.8)
269 (67.2)
208 (52)
311 (77.7)
321 (80.2)
874 (72.8)
788 (65.7)
1662 (69.3)
Total 400 (100)
400 (100)
400 (100)
400 (100)
400 (100)
400 (100)
1200 (100)
1200 (100)
2400 (100)
Source: As in Table. 3.1 Note: As in note 3.1

XII
Table 3-14 Reasons for not purchasing commodities in certain times
(Figures in Numbers) CBE DGL NGM Total Particulars
W NW W NW W NW W NW Grand Total
Lack of Information on the availability of goods
16 (4)
101 (25.2)
124 (31)
91 (22.7)
189 (47.3)
59 (14.8)
329 (27.5)
251 (20.9)
580 (24.2)
Lack of good quality
134 (33.5)
96 (24)
27 (6.7)
176 (44)
13 (3.2)
89 (22.3)
174 (14.5)
361 (30.2)
535 (22.3)
Lack of income during the time
49 (12.2)
-- 102 (25.5)
-- 178 (44.5)
22 (5.5)
329 (27.5)
22 (1.8)
351 (14.6)
Irregular supply
12 (3)
5 (1.3)
20 (5)
-- -- 25 (6.2)
32 (2.6)
30 (2.5)
62 (2.5)
Under-weighment
14 (3.5)
- -- 12 (3)
20 (5)
-- 34 (2.8)
12 (1)
46 (1.9)
Non-availability of non-controlled articles
58 (14.5)
108 (27)
82 (20.5)
121 (30.3)
-- 163 (40.7)
140 (11.6)
392 (32.6)
532 (22.2)
Lack of customer relations
117 (29.2)
90 (22.5)
45 (11.3)
-- -- 42 (10.5)
162 (13.5)
132 (11)
294 (12.3)
Total 400 (100)
400 (100)
400 (100)
400 (100)
400 (100)
400 (100)
1200 (100)
1200 (100)
2400 (100)
Source: As in Table. 3.1 Note: As in note 3.1

XIII
Table 3-15 Problems in PDS
(Figures in Numbers) CBE DGL NGM Total Particulars
W NW W NW W NW W NW Grand Total
Leakages 35 (8.7)
54 (13.5)
--
99 (24.7)
18 (4.5)
112 (28)
53 (4.5)
265 (22.2)
318 (13.2)
Poor quality and weighment
69 (17.2)
111 (27.7)
16 (4)
90 (22.5)
-- 95 (23.8)
85 (7)
296 (24.5)
381 (15.9)
Non-availability of goods
101 (25.3)
40 (10)
126 (31.5)
62 (15.5)
138 (34.5)
76 (19)
365 (30.4)
178 (14.8)
543 (22.6)
Non-availability of non-controlled goods
86 (21.5)
150 (37.5)
176 (44)
45 (11.3)
181 (45.3)
22 (5.5)
443 (36.9)
217 (18)
660 (27.5)
Non-availability of ration cards
109 (27.3)
45 (11.3)
82 (20.5)
104 (26)
63 (15.7)
95 (23.7)
254 (21.2)
244 (20.5)
498 (20.8)
Total 400 (100)
400 (100)
400 (100)
400 (100)
400 (100)
400 (100)
1200 (100)
1200 (100)
2400 (100)
Source: As in Table. 3.1 Note: As in note 3.1
Table 3-16 Suggestions to make PDS more effective
(Figures in Numbers) CBE DGL NGM Total Particulars
W NW W NW W NW W NW Grand Total
Increase the margin and Salary
74 (18.5)
28 (7.0)
30 (7.5)
48 (12.0)
35 (8.7)
-- 139 (11.6)
76 (6.3)
215 (8.9)
Reduce number of cards per FPS
18 (4.5)
37 (9.3)
44 (11.0)
72 (18.0)
-- 32 (8.0)
62 (5.1)
141 (11.7)
203 (8.4)
Availability of Non-controlled articles
41 (10.3)
30 (7.5)
219 (54.8)
210 (52.5)
16 (4.0)
24 (6.0)
276 (23.0)
264 (23.0)
540 (22.5)
Notice Boards 198 (49.5)
211 (52.7)
47 (11.7)
--
17 (4.3)
21 (5.3)
262 (22)
232 (19.3)
494 (20.6)
Vigilance committees
-- 51 (12.7)
32 (8)
70 (12.5)
236 (59.0)
225 (56.2)
268 (22.2)
346 (29.0)
614 (25.7)
More SHGs 69 (17.2)
43 (10.8)
28 (7.0)
-- 96 (24.0)
98 (24.5)
193 (16.0)
141 (11.7)
334 (13.9)
Total 400 (100)
400 (100)
400 (100)
400 (100)
400 (100)
400 (100)
1200 (100)
1200 (100)
2400 (100)
Source: As in Table. 3.1 Note: As in note 3.1

XIV
Table -17 Revision of Salaries Granted to the Salesmen of the Fair Price shops
S. No Government order No.and date Effective date Amt.of salary fixed. (Rs.)
1. G.O. No 668 Cooperation dated 16.11.78 - 100 2. G.O.Ms.No. 691 F and CP Department dated
28.8.81 1.5.81 150
3. G.O.Ms.No.199 Cooperation Department dated 12.4.85
12.4.85 200
4. G.O.No. 260 CF and CP Department dated 4.12.88
1.8.88 250
5. G.O.Ms.No.378 CF&CP Deptt.Dated 2.5.90 1.3.90 350 6. Regtistrar’s Circular Rc. 35685/92 PDSG2
dated 27.2.92 1.3.92 500
7. G.O.Ms. No. 372 CF & CP Deptt. Dated 19.1.94
1.4.93 600
8. G.O. Ms. No.3 CF & CP Deptt Dated 6.1.94 1.4.94 600 9. G.O.Ms. No.3 CF & CP Deptt. Dated 16.6.95
as amended in G.O. Ms. No. 63 C.F & CP Deptt. Dated 14.3.96
1.9.96 1. For salesmen who have completed 5 yers of service Rs.430-10-450-15 525
2. Others Rs.800/-
10. G.O.Ms.No.170 CF & CP Deptt. Dated 11.9.96
1.9.96 1. For Salesmen who have not completed 5 years of service Rs.900/-
Packers Rs.800 11. G.O. Ms.No. 238 CF & CP Deptt. Dated
11.9.96 1.9.96 1. For
Salesman who have completed 5 years of service Rs.1250-25-1325-45-1640.
2. For salesmen who have not completed 5 years of service Rs.1300/-
3. Packers Rs.1150/-

XV
Table 3-18 Retail Margins
S. No
Commodit
y
Purchase Price (Rs)
Selling Price (Rs.)
Margin (Rs.)
Date of effect
Sharing of margin between Lead and
link socy. For
Lead Society
For link society
1. Rice 305.00 350.00 45.00 19.7.2000
18.00 27.00 +Empty gunnies
ITDP/HADP areas
305.00 350.00 45.00 19.7.2000
18.00 27.00 + Empty gunnies
2. Sugar 1337.45 1350.00 12.55 1.4.94 10.55 2.00 + Empty gunnies
3. Wheat 710.00 750.00 40.00 24.7.2002
16.00 24.00 + Empty gunnies
4. Palmolein Losse Pouch (100 Litres per pouch)
1810.00 2185.00
1950.00 2325.00
140.00 140.00
7.6.200 7.6.200
70.00 70.00
70.00 70.00
5. Kerosene (for 200 lts)
1601.69 1680 72.00 (per barrel ) Retail Trans Port Margin Rs.19.68
26.3.200 Entire margin will go to the self lifting society which lifts kerosene from the dealers directly
6. Rava 1254.29 1280.00 25.71 13.4.2000
13.76 13.75 +Empty gunnies

XVI
Table 3-19 Staff for supervision of Fair Price shops
Category of Officers Field Office i. Joint Registrar of Coop. Societies 2 - ii. Deputy Registrar 35 2 iii. Cooperative Sub Registrars 391 32 iv. Senior Inspector of Cooperative Societies 72 31 v. Junior Inspector of Coop. Societies - 21 Total 500 86
Table 3-20
Target for Departmental Officers for Inspection of Fair Price shops S.No Designation Target*
Per Month No.of
officers Target for all
Officers 1. Joint Registrar (PDS)
Chennai 45 2 90
2. Regional Joint Registrar 10 29 290 3. Joint Registrar / Special
Officer, of Lead Societies 10 10 100
4. Deputy Registrar/ Special Officer, of Lead Societies
25 22 550
5. Deputy Registrar (PDS) Chennai
60 5 300
6. Deputy Registrar (PDS) Chennai (I.V)
10 2 20
7. Deputy Registrar (PDS) Districts.
50 28 1400
8. Circle Deputy Registrars 10 63 630 9. Cooperative Sub
Registrars/Special Officer of Le3ad Societies
30 54 1620
10. Cooperative Sub Registrar (PDS), Chennai. (i) Regular Inspection (ii) Cursory Inspection
15 25
40 40
600 1000
11. Coop. Sub Registrar (PDS)/Senior Inspector (PDS) Districts.
25 413 10325
Total 708 16925 Source: As in table 2-1 Note: Job chart is As per G.O (R.T) No. 393, C.F & C.P Dept (J.2) Dated – 3.12.2003.

XVII
BIBLIOGRAPHY Books 1. U.K.Singh (1991), Public Distribution System, Mittal Publications, New Delhi. 2. Venugopal K.R. (1992), Deliverance from Hunger: The Public Distribution System
in India, Sage Publications, New Delhi. 3. Singh B.N.P. (1994), Economic Liberalization in India, Ashish Publishing
House, New Delhi. 4. Gupta K.R. (1995), Liberalization and Globalization of Indian Economy, Atlantic Publishers and Distributors, Vol.1 (11), New Delhi. 5. Dantwala M.L. (1995), The Food Problem and Green Revolution in Indian
Economy, S.Chand & Co. Ltd., New Delhi. 6. Radhakrishnan R. & Ravi (1996), Food Demand in India – Emerging Trends and
Perspectives Studies in Indian Economy, Himalaya Publishing House, New Delhi.
7. Misra S.K. & Pun.K. (1996), Food Problem, Food Policy and Public Distribution System, Himalaya Publishing House, New Delhi.
8. Choudhry R.C. & Rajakutty (ed.,), (1998), Five Years of Rural Development in India: Retrospect and Prospect, NIRD, Hyderabad.
9. Rao & Linneman (1996), Economic Reforms and Poverty Alleviation in India, Sage Publications, New Delhi.
10. Sivanna N. (1997), Food Security and Panchayat Raj, Concept Publishing Company, New Delhi.
11. Prakash B.A. (1999), Poverty Food Iintake and PDS in Kerala: Kerala’s Economic Development, Sage Publications, New Delhi.
12. Hanumantha Rao & Hans lineman C.H.(1996), Economic Reforms and P overty Alleviation in India, Sage Publications, New Delhi.
13. Krishnanji N. & Krishnan T.N. (1999), Public Support for Food Security, Sage Publications, New Delhi.
14. Tyagi D.S. (1990), Managing India’s Food Economy, Sage Publications, New Delhi.
15. Mishra, Bhasshal (1985), Economics of PDS in Food Grains, Asia Publication House, New Delhi.
16. Narayanan S. (1986), Demand Supply Gap and Pubic Distribution of Food Grains in India, Aglicol Publishing Academy, New Delhi.
17. Singh U.K. (1991), Public Distribution System, Mittal Publications, New Delhi. Journals 1. Balakrishnan, Pulapre & Ramaswami Bharat (1997), Quality of Public
Distribution System: Why it matters, Economic and Political Weekly, Vol.32 (4), January, p-62.
2. Bandyopadhyay (1997), Food Security and Liberalization, New Age, Vol.45 (1), January, p-8.
3. Dantwala M.L. (1993), Agricultural Policy: Prices and Public Distribution System: A Review, Indian Journal of Agricultural Economics, Vol.48 (2), p-173.

XVIII
4. Div S. Mahendra (1996), Food security: PDS Vs. EGS – A tale of two States, Economic and Political Weekly, Vol.31 (27), p-1752.
5. Geetha S. & Suryanarayana H. (1993), Revamping PDS: Some Issues and Implications, Economic and Political Weekly, Vol.28 (41), p-2207.
6. George P.S. (1996), Public Distribution System, Food Subsidy and Production Incentives, Economic and Political Weekly, Vol.31 (39), p-140.
7. Indrakanth S. (1997), Coverage and Leakages in PDS in Andhra Pradesh, Economic and Political Weekly, Vol.32 (19), May, p-999.
8. Jagadish Prasad (1992), Managing Public Distribution Policy: An Analysis of the Policy Perspectives, Indian Journal of Agricultural Economics, Vol.47(3), July-September, p-369.
9. Jayanthi, Selvi (1992), Public Distribution System in Periyar District, Tamil Nadu Journal of Cooperation, Vol.84 (1), April, p-693.
10. Jena A.C. (1996), Public Distribution System and Involvement of Panchayat Raj Institutions, Kurukshetra, Vol.45 (1&2), October-November, p-114.
11. Jha & Jai Prakash (1992), Administration of PDS: Perspectives, Objectives and Strategy, Financial Express, September, p-7.
12. Kabra, Kamal Nayan & Rao E.K. (1992), Public Distribution System and Liberalization, Productivity, Vol.3 (2), July-September, p-229.
13. Mohan Rao V. (1992), Revamped Public Distribution System, Yojana, March, p-6
14. Mooij Jos E. (1994), Public Distribution System as Safety Net: Who is Saved? Economic and Political Weekly, Vol.29 (3), p-119.
15. Roy, Sunando (1992), Public Distribution of Cereals: An Alternative Model, Economic and Political Weekly, Vol.27 (23), June, p-1209.
16. Sud, Surinder (1992), Making Public Distribution System more Effective, Yojana, April, p-18.
17. Suryanarayanan M.H. (1995), PDS Reform and Scope for Commodity based Targeting, Economic and Political Weekly, Vol.30 (13), p-687.
18. Swami Nathan Madhura (1996), Food Security in India: A Village view of the Public Distribution System in Maharashtra, Indian Journal of Agricultural Economics, Vol.51 (4), October-December, p-683.
19. Das Y.L.(1993), Public Distribution System: A Study of Bihar, Southern Economist, February, p-15.
20. Khare R.S. (1998), The issue of right to food among the Hindus: Notes and Comments, Contributions to Indian Sociology, Vol.32 (2), July-December, p-253.
21. Upadhyay U. (1996), Inflation, Food Security and Public Distribution System, Social Action, Vol.46(3), July-September, p-296.
22. Gurumoorthy T.R. (1997), Public Distribution System: A Boon to People Below Poverty Line, Third Concept, Vol.11 (128&129), October-November, p-63.
23. Vasudeva Rao V. (1999), Role of PDS in Food Security, Social Welfare, Vol.46(6), September, p-7.

XIX
24. Siddappan R. (1992), Public Distribution System: A Case Study of Gulmaged District in Karnataka, Southern Economist, Vol.30 (19), Februrary, p-13.
25. Kurian Lanki (1993), Ending Food Subsidies Nutritional Welfare and Budgetary Effect, The World Bank Economic Review, p-395.
26. Hanumantha Rao K. (2000), Social Security to the Rural Poor: Efficacy of PDS and WEPs in Karnataka, Journal of Rural Development, Vol.19 (3), July-September, p-453.
Reports 1. Government of India (2002-2003), Economic Survey 2. Government of Tamilnadu (2001-2002), Tamilnadu An Economic Appraisal,
Chennai 3. Government of Tamilnadu (2004), Policy Note on Cooperation, Food and
Consumer Protection Department. *********