a study on the tourism destination image of japan in … study on the tourism destination image of...
TRANSCRIPT
A study on the tourism destination image of Japan in the Chinese market
Xue PENG
The International Centre for the Study of East Asian Development
Working Paper Series Vol. 2013-09
March 2013
The views expressed in this publication are those of the author(s) and do
not necessarily reflect those of the Institute.
No part of this article may be used reproduced in any manner
whatsoever without written permission except in the case of brief
quotations embodied in articles and reviews. For information, please
write to the Centre.
The International Centre for the Study of East Asian Development, Kitakyushu

1
A study on the tourism destination image of Japan
in the Chinese market Xue PENG
The International Centre for the Study of East Asian Development Email: [email protected]
Abstract This study is aimed at revealing the tourism destination image (TDI) of Japan as represented on
Chinese websites. Three Internet-based information resources were used to collect the text database: travel advertisements, travel guides, and travel blogs. The TDI of Japan represented on each information source was studied by counting word frequencies in each text database. Correspondence analysis was utilized to reveal the associations of these TDIs. The results show that travel advertisements and guides project quite different images of Japan to those presented in travel blogs. Usually, Chinese tourists tend to be impressed by traditional cities with long histories, such as Nara and Kyoto. They are more impressed by historic landscapes than by natural landscapes or the traditional culture of Japan. These results imply that future tourism promotion efforts should focus on finding connections with the cultural background of tourists, in this case, those coming from China
1. Introduction Tourism is a tertiary industry with strong growth potential despite the current economic climate.
As globalization accelerated and transportation costs decreased drastically, international tourism has become more common than ever before. In recent years, Japan, which is in the midst of a long-lasting economic downturn, has started to recognize the potential of tourism and to expect it to play a role in regional economic development and industrial-structural transformation. Inbound tourism has particularly attracted the interest of policymakers and scholars. Japan currently experiences a lag in inbound tourism compared with other developed countries. In 2010, Japan ranked only 31st worldwide for international inbound tourist arrivals. Following the Tōhoku earthquake and tsunami, its rank dropped even lower in 2011 to just 38th (UNWTO, 2012). The low ranking, however, means that there is much room for growth, although this will demand that the Japanese government makes a greater effort to promote inbound tourism.
Japan has initiated several programs aimed at attracting inbound tourists, such as the “Visit Japan Campaign” in 2003 (which set a goal of attracting 10 million foreign visitors by the year 2010) and “Towards 30 Million Foreign Tourists” program in 2010 (which has the goal of attracting 15 million foreign visitors by 2013, 25 million by 2020, and 30 million in the future). China has been noted for producing the greatest economic effect on Japan’s tourism industry. Although the number of visitors from China ranks second (after South Korea), the total economic effect brought by Chinese tourists has been the largest in recent years, because of their high average spending during their travels in Japan (JNTO, 2010, 2011). Its geographical proximity,

2
robust economic growth, and large population base make China a highly valuable market for the Japanese tourism industry, despite the unstable Japan-China relationship. Therefore, in Japan, central government, local governments, and economic organizations are all engaging in major efforts to design policies aimed at attracting more Chinese tourists. In order to make these policies effective, it is important to understand Japan’s tourism image in the Chinese market.
2. Literature review Review on the definition of tourism destination image (TDI)
Since the 1970s, TDI has been considered as an essential element in the management of tourism resources and the design of promotion strategy and has been widely considered in the tourism industry and academia. Researchers have generally agreed that a destination’s perceived image has a strong impact on the behavior pattern of potential tourists (Bigne, Sanchez, and Sanchez, 2001; Fakeye and Crompton, 1991) and therefore is an important indicator for predicting the future trends in the tourism industry (Baker and Crompton, 2000; Bojanic, 1996; Cronin, Brady, and Hult, 2000; Petrick, 2004; Tam, 2000).
Although the definition of destination image varies among scholars, it is generally considered to be an individual’s mental representation of knowledge (beliefs), feeling, and overall perception of a particular destination (Hunt, 1971; Crompton, 1979; Embacher and Buttle, 1989; Fakeye and Crompton, 1991). However, the fact that these varied definitions exist implies that TDI is the product of mental and psychological activity. TDIs are assumed subjective and dependent on individual perceptions. Distinguished on the basis of stimuli sources and motives, perceived TDI can be divided into three hierarchically interrelated components: cognitive, affective, and conative (Gartner, 1993; 1996). Apparently, the formation of perceived TDI is not only affected by the personal attributes of individuals (intrinsic stimuli that project affective images) but also by external stimuli, which play a role in shaping one’s cognitive image.
A large body of literature has developed around topics related to external stimuli, such as the evaluation of quantities and qualities of facilities, the tourists’ satisfaction with tourism resources, this satisfaction’s relationship with repeat visiting behaviors, and so on (Backman and Veldkamp, 1995; Baker and Crompton, 2000; Cronin, Brady, and Hult, 2000). However, these studies have limited effectiveness in guiding positioning and promotion strategy in a market lacking a wealth of information regarding the potential tourism destination. The mere existence of tourism resources does not ensure that every potential traveler will be willing or able to access these resources. Nevertheless, the potential traveler must first gain some knowledge about their possible destinations in order to form the perceived TDI that may lead to further visit behavior (Baloglu, 1999). Thus, people’s perceived TDI would be largely determined by easily accessible information, especially in the case of newly emerged foreign tourist markets.
As suggested by Fakeye and Crompton (1991), a “flood of total impressions” pre-exists the involvement of the human mental process. Within this flood, the TDIs conveyed by external information sources have been identified and empirically studied. Unlike the perceived TDI produced by internal mental processes, such external TDIs are based only on external sources and are thus objective. Their relationships are demonstrated in Figure 1.

3
Figure 1 The relationship between external TDI(s) on information sources and perceived TDI Review of information sources
There is evidence that the types and amounts of information sources (as external stimuli) received by people influence the formation of their cognitive component of image (Gartner, 1993). Similar argument has been made by Um and Crompton (1990) that “the perceptual/cognitive evaluation of attributes is formed by external factors, which include various information sources such as symbolic stimuli (promotional efforts of a destination through media) and social stimuli (friends’ and relatives’ recommendations or word-of-mouth)” (cited in Baloglu and McCleary, 1999). The latest definition of TDI provided by Choi, Lehto and Morrison (2007, p.117) – “a compilation of beliefs and impressions based on information processing from a variety of sources over time” – also highlights the significance of information sources.
In recent years, studies have been developed to dig into the destination images conveyed by information sources such as websites, guidebooks, and travel advertisements. However, varied information sources have not been systematically classified and are only selected in empirical studies according to the researcher’s idiosyncratic interests. In the context of commercial tourism promotion, information sources can be divided into four types: (1) travel advertisements and promotional information directly published by travel agencies (as studied by Frías, Rodríguez, and Castañeda, 2008); (2) third-party media, such as official promotional teams, magazines, guidebooks, and brochures (whose role in deciding TDI has been emphasized by Croy and Wheeler, 2007); (3) blogs, essays, and diaries written by experienced travelers who voluntarily share their past travel experiences; and (4) material produced by official departments of tourism management.
The first two sources are similar in that they both are commercially related and provide information for the purpose of making profit, which may undercut their credibility. On the other hand, experienced travelers who share information voluntarily, usually anonymously and without any apparent commercial purpose, can be much more influential. As proved by Hanlan and Kelly (2005), word of mouth and autonomous independent information sources were the key medium through which respondents formed their image of a tourist destination in Australia. Their findings indicated the importance of destination experience in the image formation process and suggested
perceived TDI
cognitive image
affective image
conative image a potential tourist
external stimuli mental and psychological processes
product
external TDI resources at tourism destination
external TDI on source 1
external TDI on source 2
external TDI on source…
external TDI on source n
direct visit

4
that destination-marketing organizations can and should go beyond traditional mainstream media to communicate their brand message (Hanlan and Kelly, 2005). However, only few empirical studies have involved information shared by voluntary experienced travelers (VETs) (such as in Choi, Lehto, and Morrison, (2007)) and not enough have been conducted to compare it with other information sources and use it in guiding tourism practitioners and policymakers.
Internet as a medium instead of an information source The popularization of the Internet has changed how information is transferred. It has gradually
turned into one of the major ways for potential travelers to gather tourism information, a phenomenon much studied by scholars. For example, Patterson (2007) found that the Internet is the second most important source of general travel information, with only word-of-mouth information from friends ranking more highly. However, the Internet may be better considered as a medium instead of a source. The Internet carries, displays, and transfers information, but does not generate this information itself. As the Internet is in widespread use in societies all over the world, travel agencies and media are increasingly using it for promotion. It has also become common for travelers to share their experiences and feelings about a destination by writing blogs, posting on the information exchange websites, giving comments, and/or posting images of said destination. Such informative ads/articles/messages provide potential tourists with pre-existing knowledge of a destination and act as significant factor in shaping TDIs in readers’ minds, furthering affecting the destination selection process. Therefore, the information that is readily available online has provided valuable materials for the study of TDI with regard to information sources. Utilization of the Internet to study TDI has gradually gained attention from the U.S. as well as some Asian tourist destinations (Hyde, 2006; Lee, Soutar, and Daly, 2007; Choi, Lehto, and Morrison, 2007; Cormany and Baloglu, 2011), but there has been no similar study on representations of Japan in tourism sources.
This study aims to identify the characteristics of Japan’s TDIs as represented by information resources in the Chinese market. It encompasses three data sources, which are travel blogs, travel guides, and travel advertisements. This study contributes to academic research on TDIs by emphasizing VETs as an information source and comparing this with other sources. The results indicate several valuable policy changes that could guide promotion and planning within Japan’s tourism industry.
3. Methodology Text materials from the above-mentioned sources are collected from the Internet and used for
text-mining analysis. The frequency of each word is counted and then ranked. Words of highest rank are picked up and adopted in a quantitative analysis (correspondence analysis) to visualize differences between various information resources. It should be noted here that the contents used in the frequency analysis are all in Chinese. The results listed in this paper are translated from Chinese to English. 3.1 Data Sources
Text data were collected from websites. Considering similar websites always have duplicated contents, this study only selected the most representative information sources instead of choosing exhaustive ones.

5
Three types of resources were studied – travel guides, travel blogs, and travel advertisements. Texts from travel guides are taken from the major portal sina.com. Travel destinations are introduced on the website as they are in travel guide books. The editors of sina.com are in charge of updating and adding new materials in this vein. Texts from travel blogs are collected from sina.com, as well as from a website named lvping.com, where travel fans gather together and discuss their experiences. Users frequently posts articles about their travel experiences and voluntarily share their writings on the website. Both the sina blog and the lvping forum contain a large number of such spontaneously written articles. Texts of travel advertisements are from the five top tourism agencies in China with highest outbound-tourism performance (see Table 1). The vacation packages offered on the websites of these agencies are collected and are utilized as a text base from which to analyze the destination images communicated by travel advertisements. It should be noted that not all travel agencies put in the same effort to marketing through the Internet. Some still rely more on traditional sales routes (face-to-face) and the optional travel packages introduced online may not be representative of their full range of travel packages. On the other hand, newly established travel agencies, such as Ctrip, operate mainly as Internet-based businesses.
Table 1 The name of the surveyed travel agencies (top 5 in 2010)
Rank English name of the travel agencies Chinese name of the travel agencies
1 Guangdong China Travel Service Co. Ltd 广东省中国旅行社股份有限公司
2 GZL International Travel Service Co. Ltd 广州广之旅国际旅行社股份有限公司
3 China International Travel Service Shenzhen Co., Ltd 深圳中国国际旅行社有限公司
4 Ctrip.com International Co. Ltd. 上海携程国际旅行社有限公司
5 China International Travel Service Co., Ltd 中国国际旅行总社有限公司
Note: The above ranking is based on a comprehensive performance indicator comprising four sub-indicators, which are (a) the total number of outbound travelers the travel agency dealt with, (b) sales revenues, (c) gross profit, and (d) gross margin. A sum of the four sub-indicators with a coefficient of 1:1:1:2 comprises the final performance indicator. Source: published by National Tourism Administration of China (CNTA). Table 2 The number of travel advertisements (by departure city)
departure city Beijing Shanghai Guangzhou Shenzhen Nanjing Hangzhou Chengdu Shenyangnumber of ads 156 114 89 11 25 28 14 6
3.2 Text Data Processing
The text data was analyzed using a text mining software program called Rost WordParser1, which deals with text in Chinese.
The following technical operations were conducted to obtain interpretable results from the text-mining analysis:
1 It is acknowledged that Rost Word Parser is developed by Prof. Yang SHEN of Wuhan University in China.

6
(1) Defining a dictionary that contains the interpretable words containing multiple Chinese characters. The software first split sentences and paragraphs into words and then counted their frequency. It is possible for the user to define words according to the research purpose and thus ensure the unusual words are treated as a single word. For example, the software’s default settings would split the phrase “Japanese Yen (日元)” into “Japanese (日)” and “Yen (元)” but we can define “Japanese Yen” as one word and make sure that it is counted as a whole. Therefore, by defining an exhaustive dictionary, this software is considered sufficient for the purpose of this research. (2) Making the words in different sites consistent and grouping similar words into one if necessary. For example, “Beijing City (北京市)” and “Beijing (北京)” are considered to be the same and both are counted when determining the frequency. (3) Selecting meaningful words relating to destination image only and ranking these words. The grammatical and “stop” words, such as “ ’s (的),” “I( 我),” “at (在),” the past tense mark (了), and so on need to be ignored.
3.3 Correspondence Analysis Among the many methodologies used in image studies (summarized by Gallarza, Saura, and
García, 2002), correspondence analysis (CA) is a useful tool to explore the relationships between brands (sources) and attributes (images) (Whitlark and Smith, 2001). Correspondence analysis, also known as the R-Q Mode Factor Analysis, mainly deals with categorical rather than continuous data. It is a statistical visualization method for picturing the associations between the levels of a two-way contingency table. The multidimensional frequency data in the rows and columns of the table can be transformed into points in a two-dimensional space and can then be displayed on a map. The positions of the row and column points are consistent with their associations in the table. On the two-dimensional map, the distance between the row (column) points is a measure of similarity between the row(column)-frequency profiles. What’s more, the distance between row (images) and column variables (sources) also represents their correspondence.
As mentioned above, this study deals with three sources: travel advertisements, travel guides, and travel blogs. Two types of attribute variables were distinguished from the whole word pool: place names and tourism contents. The top 15 most frequent words of both types are observed for further analysis.
4. Findings 4.1 Place names and sub-categories of websites
Table 1 shows the top most-frequent place names and includes various spatial levels. The following place names appear frequently in all three sources: “Japan,” “Tokyo,” “Kyoto,” “Kansai,” “Osaka,” “Okinawa,” “Hokkaido,” “Fujisan,” and “world.” As the main research subject, “Japan” is the most important keyword. “Tokyo”, as the capital city, is favored by most Chinese tourists. Also, the cities/regions/sight-seeing spots on the traditional “golden route,” such as “Kyoto,” “Kansai,” “Osaka,” and “Fujisan” are frequently mentioned. “Okinawa” and “Hokkaido” emerge as newly popularized tourism destinations and are therefore worth attention.

7
The frequent utilization of the term “world” is similar in all three sources. It may be due to the fact that outbound tourism in China is still in its nascent stage. Maslow (1943) identified two primary types of motivational behavior – tension-reducing and arousal-seeking – and Chinese tourists primarily travel for the second one. For most travelers, the purpose of international tourism is to experience stimuli, such as new knowledge and fresh experiences, about unknown places. Thus, the positioning in the whole “world” (i.e. the most famous in the “world”, the best in the “world”, etc.) is important for attracting Chinese tourists.
Table 3 Ranking of places by frequency
Travel guides Ads of travel agencies Travel blogs rank word frequency word frequency word frequency
1 Japan 1.14 Japan 0.82 Japan 0.74 2 Tokyo 0.33 Tokyo 0.70 Tokyo 0.23 3 Kyoto 0.26 Okinawa 0.53 Kyoto 0.22 4 Okinawa 0.22 Osaka 0.46 Osaka 0.19 5 Hokkaido 0.18 Kyoto 0.22 Nara 0.13 6 China 0.16 Fujisan 0.22 China 0.12 7 Osaka 0.16 World 0.20 Fujisan 0.10 8 World 0.15 Shanghai 0.17 World 0.09 9 Sinjuku 0.08 Sapporo 0.16 Okinawa 0.08 10 Nara 0.07 Hokkaido 0.16 Hokkaido 0.08 11 Kobe 0.07 Beijing 0.15 Hakone 0.07 12 Kansai 0.06 Fukuoka 0.12 Shanghai 0.06 13 Otaru 0.05 Hakone 0.12 Kobe 0.05 14 Fujisan 0.05 Sinjuku 0.11 Kansai 0.05 15 Kiyomizudera 0.05 Guangzhou 0.11 Nagoya 0.04 / Sapporo 0.04 Kobe 0.10 Sapporo 0.04 / Fukuoka 0.03 Nagoya 0.08 Sinjuku 0.04 / Hakone 0.02 Otaru 0.07 Beijing 0.03 / Beijing 0.02 Kansai 0.06 Kiyomizudera 0.03 / Nagoya 0.02 Nara 0.05 Otaru 0.03 / Shanghai 0.02 Kiyomizudera 0.04 Fukuoka 0.02 / Guangzhou 0.02 China 0.03 Guangzhou 0.02
The above discussion is based on mere comparison of ranking, but the frequency differences of
the specific word (place name) among sources are not taken into account. To compare sources and look at the relationship between source and representative words (place names), a CA map has been created. In the map, there are three circles with same radius, which are used for reference to measure the distance between each two points. Due to the distinct underlying characteristics, or purposes, of communication, each source projects quite different images, as is apparent in the distribution of word variables surrounding each source. As shown in Figure 1, the word variables appear to cluster around travel advertisements, followed by travel guides, and lastly, travel blogs.

8
In the texts of travel advertisements, which need to communicate intensive information in only a few words, place names show up with high frequency. On the other hand, travel guides have more flexibility, and travel blogs the most, resulting in a lower frequency of place names.
Travel advertisements give more attention to international gateway cities like “Tokyo” (including “Sensoji,” “Ginza”), “Osaka,” “Nagoya,” “Fukuoka,” and “Sapporo.” The famous “Fujisan,” which is the landscape most symbolic of Japan, is also frequently included in travel advertisements. Travel guides and travel agencies are paying similar attention to “Sinjuku,” “Otaru,” “Kobe,” and “world.” Travel guides are more focused on “Hokkaido,” “Japan,” and “Kiyomizudera.”
It is interesting to observe that travel blogs share very little in common with travel advertisements. As shown in Table 4, while the first dimension explains 99.7% of the travel ads and 81.4% of the travel guides, it can only contribute to the 49.6% of the travel advertisements, while the rest (50.4%) are explained by the second dimension. While TDI in travel advertisements is represented by international gateway cities and the symbolic “Fujisan,” neither of these is emphasized as much in travel blogs. Travel guides somehow have some similarity with blogs in that they focus on “China,” “Kyoto,” and “Kansai.” The most unique representations of TDI found on travel blogs are shown in terms such as “Nara,” “Tsukiji,” “Hiroshima,” and “Hakone.” It is revealed that bloggers are similarly focusing on traditional cities with long histories, such as “Nara” and “Kyoto.” Neither of the newly popularized tourism destinations – “Hokkaido” (emphasized in travel guides) and “Okinawa” (in travel ads) – has inspired enough experienced travelers to blog about them.
Travel advertisements and guides frequently use the term “world” for positioning the destination but in reality travel bloggers seem less attracted by this worldwide positioning strategy. Instead, they are more focused on “China,” from where they started traveling. This grounding in “China” does feature in travel guides but is largely neglected in travel advertisements. The above evidence suggests that promotional strategy might be more effective if it connected the potential tourism destination with the cultural background of Chinese tourists. Unearthing historical connections between Japan and China might be a good way to attract Chinese tourists to Japanese destinations. Table 4. Summary of the correspondence analysis
a. 42 degree of freedom.
Dimension
Singular value Inertia χ2 Sig.
Proportion of inertia Confidence singular value
Accounted for Cumulative Standard
deviation Correlation
2 1 .324 .105 .827 .827 .278 -.072 2 .148 .022 .173 1.000 .314
Total .127 1.315 1.000a 1.000 1.000

Tabl
a Prob Pro
F
4.2
Insour“shofavoprov
S
TrTravTraAc
le 5 Dimens
oportion of dimoportion of sou
Figure 2 Co
Tourism con regard to torce. The threop” among thored tourism rvide more det
Source
ravel ads -0vel guides 0avel blogs 0ctive total
sions and cor
mension’s inerurce variation
orrespondenc
ontents andourism contenee sources coheir top 15 mresource in Jatailed informa
Cordinates 1 2
0.622 -0.040.590 -0.40.419 0.62
rrespondence
rtia attributablaccounted fo
ce map for thwebs
d informatints, there are dommonly feamost frequentapan. The termation about th
Inertia
47 0.05718 0.04325 0.027
.127
9
e to informati
le to each souor by dimensio
he frequently site sub-categ
ion sourcesdistinct differature the termt words. It isrms “garden,”he location an
Contribution1
0.541 0.330 0.129 1.000
ion sources
urce on.
mentioned pgories.
s rences amongms “spa,” “g easy to und
” “street,” andnd its leisure
n to inertiaa
2 0.007 0.362 0.631 1.000
places represe
g the images garden,” “streerstand that d “hotel” are facilities.
Explanation1
0.997 00.814 00.496 0
ented on thre
projected by eet,” “hotel,”“spa” is the usually prese
n by dimension2 Tota
.003 1.00
.186 1.00
.504 1.00
ee
each ” and most
ent to
n al 00 00 00

10
Table 6 Ranks of most frequent tourism contents
Note [1]: JPY = Japanese Yen, CNY = Chinese Yuan. The CA map is helpful in revealing the relationship between sources and images within a
two-dimensional space. As shown in Figure 2, the images represented on travel blogs fall within three categories of terms: terms related to shopping and currency, such as “CHY,” “JPY,” “price,” and “shop;” words related to domestic transportation like “station,” or “subway,” and to accommodation, such as “room;” terms related to historical landscapes, such as “shrine,” and “temple.”
On the other hand, the TDIs represented in travel advertisements are more concerned with dining and include terms like “breakfast,” “lunch,” “dinner,” and “dinning,” as well as those terms
Travel guides Ads of travel agencies Travel blogs rank word frequency word frequency word frequency
1 sakura 0.35 hotel 1.40 hotel 0.25 2 spa 0.28 breakfast 0.51 shop 0.17 3 shop 0.18 sight spot 0.50 JPY 0.15 4 temple 0.16 shopping 0.44 temple 0.15 5 park 0.14 dinner 0.39 spa 0.14 6 street 0.14 dining 0.37 park 0.12 7 JPY[1] 0.14 spa 0.36 airport 0.12 8 architecture 0.13 park 0.33 station 0.11 9 culture 0.13 street 0.33 street 0.10 10 city 0.12 flight 0.31 CHY 0.10 11 shopping 0.11 airport 0.29 price 0.09 12 geisha 0.11 lunch 0.28 room 0.09 13 island 0.10 shop 0.25 sakura 0.08 14 food 0.09 architecture 0.17 subway 0.07 15 hotel 0.08 culture 0.17 jinjya 0.06 / station 0.07 theme_park 0.17 shopping 0.06 / jinjya 0.07 temple 0.14 culture 0.05 / CHY[1] 0.07 food 0.13 architecture 0.05 / price 0.07 city 0.10 sight spot 0.05 / airport 0.06 JPY 0.08 food 0.05 / sight spot 0.06 CHY 0.05 city 0.05 / theme_park 0.04 island 0.05 breakfast 0.03 / subway 0.03 jinjya 0.02 dinner 0.03 / room 0.03 sakura 0.02 geisha 0.02 / flight 0.01 price 0.02 lunch 0.02 / dinner 0.01 station 0.01 island 0.02 / dining 0.01 geisha 0.01 theme_park 0.02 / lunch 0.00 room 0.00 flight 0.01 / breakfast 0.00 subway 0.00 dining 0.01

11
connected with long-distance (usually international) transportation, such as “flight,” and “airport,” and accommodation (“hotel”). The other strand of TDI keywords found in ads are “park,” “street,” “theme park,” “sight-seeing spot,” and “shopping,” all of which are presented in a depersonalized and unemotional manner. These can hardly be effective in attracting new customers. On the other hand, both travel advertisements and travel guides emphasize terms such as “food,” “spa,” “architecture,” and “culture,” which are likely to be more attractive.
The TDIs featured in travel guides are also represented by terms such as “city,” “island,” “geisha,” and “sakura.” Common images of traditional Japanese culture are echoed by these terms.
Following the above discussion, we can see that large parts of TDI in travel advertisements are too neutral to impress experienced travelers. The overlapping terms that feature in both advertisements and travel guides, such as “food,” “spa,” “architecture,” and “culture” appear much more conducive to attracting tourists. Travel guides are more likely to convey a traditional image of Japan, whereas bloggers pay more attention to shopping and prices rather than featuring terms that represent traditional cultural Japan, such as “geisha” and “sakura.”
This tendency to emphasize price is worth noting. Chinese tourists have astonished the world with their strong purchasing power. According to data gathered by one of the biggest shopping refund companies, Global Blue, Chinese citizens were the top overseas shoppers in 2011. It is true that income growth has allowed an increasing number of Chinese to afford overseas tours and shopping. While travel advertisements make more mentions of the behavior “shopping”, travel blogs pay intense attention to “price,” and the monetary units “Chinese Yuan (CNY),” and “Japanese Yen (JPY).” Although the advertisements must note the price of the travel plan they are promoting, they seldom mention any other costs. However, the travel bloggers are concerned about prices of a number of commodities besides travel costs, including food, cosmetics, electrical appliances, luxury goods, and so on. Bloggers especially are interested in recording and comparing prices, suggesting that they are sensitive to prices. The most enthusiastic consumers are actually international bargain hunters, who compare prices worldwide and when in Japan purchase items that have highest performance-to-price ratio.
It is also worth noting that bloggers pay more attention to cultural landscapes, as represented by terms like “shrine” and “temple,” rather than describing Japan’s natural landscapes. When writing an article about a recent trip, it is important to have a narrative to follow. To impress Chinese tourists, the landscapes described need to have certain features that can be easily remembered and, if possible, should tell a story. Ancient Chinese travelers liked to write poems about scenic views and these viewing spots became popular only after the poems themselves were popularized. When the travelers from later generations visited the same spot, they had usually memorized the older poems and wrote down new ones to express their feelings. The most famous poems would even be carved on rocks and it became a convention for Chinese tourists to recall stories about the ancient poems and visitors while sightseeing (Sasaki, 2007). Some newly popularized scenic spots that are not immortalized in poem are instead giving prominent trees, rocks, or mountains the names of animals that they are thought to resemble. This naming is intended to function in a similar way to the poems, in that it gives visitors a story to tell about the natural landscapes they are witnessing. However, in Japan, where Chinese tourists are not familiar with local culture, they may be unable to relate any poems to the views that they see. Since managers of Japanese tourism resources do not give funny names to the mountains or rocks, this source of narrative is also unavailable. On the other hand, terms relating to traditional architecture like “shrine” and “temple” convey a
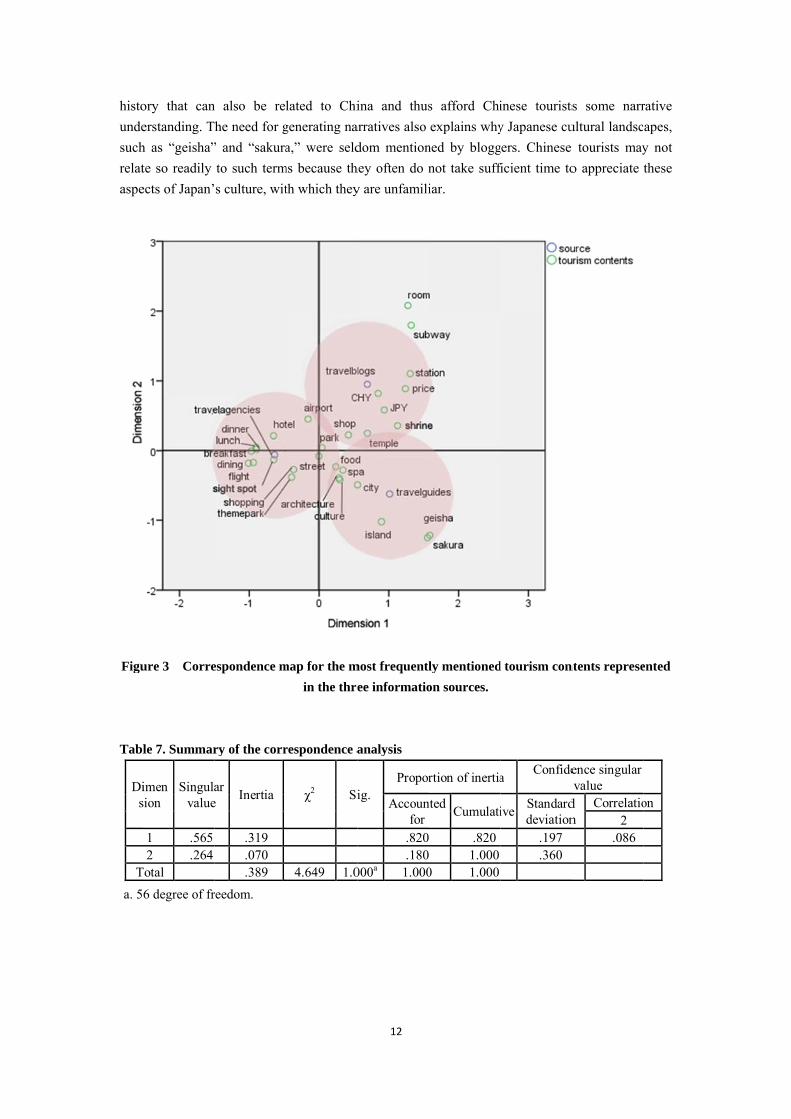
histoundesuchrelataspe
Figu
Tabl
Dis
T a. 5
ory that canerstanding. Th as “geisha”te so readily ects of Japan’
ure 3 Corre
le 7. Summar
imension
Singulavalue
1 .565 2 .264
Total 6 degree of fr
n also be rehe need for g
” and “sakurato such terms culture, wit
espondence m
ry of the corr
ar e Inertia
.319
.070
.389 reedom.
lated to Chigenerating naa,” were seld
ms because thth which they
map for the min the thre
respondence a
χ2 Si
4.649 1.0
12
ina and thusarratives also dom mention
hey often do ny are unfamili
most frequentlee informatio
analysis
ig. Propor
Accounfor
.820 .180
000a 1.000
s afford Chiexplains why
ned by bloggnot take suffiar.
ly mentionedon sources.
rtion of inertia
nted Cumulati
.8201.000
0 1.000
inese touristsy Japanese cugers. Chinese ficient time to
d tourism con
a Confide
ive Standarddeviation
.197
.360
s some narrultural landsc tourists mayo appreciate
ntents represe
ence singular value
d n
Correlatio2
.086
rative apes, y not these
ented
on

Tabl
S
TrTravTraAc
a Prob Pro ○ C
Toud○
Geis
SourTKiM
G Sa
5. Fr
quitetendsuchrepreto Cof n
le 8 Dimens
Source
ravel ads -0vel guides 1avel blogs 0tive total
oportion of dimoportion of sou
Cultural/ hist
daiji (in NaraCultural land
sha
rce: oudaiji: http:/inkakuji: http
Meji Shrine: http://ja.wiki
eisha: http://kakura: http://ja
Conclusirom the above different fr
d to be impreh “Nara” andesented by te
Chinese tourisnarrative, eve
sions and cor
Cordinates 1 2
0.638 -0.06.011 -0.62
0.692 0.95
mension’s inerurce variation
torical landsc
a) dscapes – Jap
Fig
//www.todaiji.://www.shoko
ipedia.org/wikkoimaiko.com/a.wikipedia.or
ions ve discussionrom that repressed by Japad “Kyoto.” Terms like “shrsts than areasen in an unfa
rrespondence
Inertia
61 0.13323 0.15950 0.097
0.389
rtia attributablaccounted fo
capes – tradit
Kinnkakuj
panese cultur
gure 4 The i
.or.jp/index.htoku-ji.jp/k_san
ki/%E6%98%/cast/ rg/wiki/%E6%
ns, we can seresented in tranese traditio
These travel brine” and “tem of natural beamiliar land.
13
e to informati
Contribution1
0.416 0.423 0.161 1.000
le to each souor by dimensio
tional archite
ji (in Kyoto) re
Sakillustration o
tml npai.html
%8E%E6%B2%
%A1%9C
ee that the TDravel guides onal cities wbloggers freqmple.” Theseeauty becausNeither Jap
ion sources
n to inertiaa
2 0.008 0.343 0.649 1.000
urce on.
ecture
Meiji
kura of various ima
%BB%E7%A
DI of Japanor travel ad
ith long histoquently writee historic landse they can prpan’s natural
Explanation b1 2
0.996 0.00.849 0.10.531 0.4
Shrine (in To
ages
5%9E%E5%A
represented overtisements.ories, as repr
about histordscapes may brovide touristlandscapes n
by dimension 2 Total 004 1.000151 1.000469 1.000
okyo)
AE%AE
on travel blo. Chinese touresented by tric landscapebe more attrats with some nor its tradit
0 0 0
ogs is urists terms es, as active
kind tional

14
culture (“geisha” and “sakura”) is represented as frequently in travel blogs. When striving to attract Chinese tourists, it is important to create a memorable story about the potential tourism destination. Finding connections with the cultural background of the tourists - in this case, “China” – would be an effective way to guide future tourism promotion.
The tourists’ enthusiasm for shopping and their sensitivity toward prices are also worth noting. The increasing purchasing power of Chinese tourists has been noted in various countries and has brought huge retail opportunities to destinations that are able to attract large numbers of Chinese tourists. Japan itself is also placing increasing importance on designing internationally competitive goods.
There are some limitations to this study. First, the correspondence analysis has an inherent weakness in that, to a certain extent, it relies on subjective judgment, such as the categorization of sources, the selection of image words, and so on. Also, it is only used to analyze correspondence instead of associations, thus the inter-category distances do not have statistically significant meaning. Second, because it is confined to a fixed information medium, the destination image of Japan only represents the images featured on the Internet. Third, the text contents data used in this analysis only covers a limited number of websites and thus may not be able to represent the images delivered to web users overall. Despite these limitations, studying the TDI of Japan is a worthwhile pursuit and the results of this paper offer important implications for Japan’s tourism industries and its government.
The study also faces a major challenge in that China and Japan’s relationship has been negatively affected by an unstable political situation. In periods of tense relations, international tourism always confronts severe setbacks. Even in times of peace, the influence of bilateral relations cannot be overlooked; however, it is beyond the scope of this paper. In future studies of Chinese tourism in other destinations (countries), political situations and bilateral relations should be included for comparative analysis.
This study considered including official Japanese tourism webpages for comparison, but there is not enough Chinese information on the official homepages of Japan’s overall tourism industry. Although major tourist cities have set up separate websites, the task of combining information on such dispersed websites into one text database is difficult. It would be particularly hard to decide the weight of each website because the influence of these homepages may be very different and some of them may have seldom been visited. Considering the difficulty of integrating these into one complete text, official homepages have been omitted from the sources for comparison in this study. Future study should endeavor to compare these sources of information with others when studying the TDI of specific cities or sightseeing spots.
References Maslow, A. H. (1943) A theory of human motivation. Psychological Review, 50(4): 370-396. Backman, S. J., and C. Veldkamp, (1995) Examination of the relationship between service quality
and user loyalty. Journal of Park and Recreation Administration, 13(2): 29-41. Baker, D. A., and J. L. Crompton (2000) Quality, satisfaction and behavioral intentions. Annals of
Tourism Research, 27(3): 785-804.

15
Baloglu, S. (1999) A path analytic model of visitation intention involving information sources, socio-psychological motivations, and destination image. Journal of Travel and Tourism Marketing, 8(3): 81–91.
Baloglu, S., and K. W. McCleary (1999) A model of destination image formation. Annals of Tourism Research, 26(4): 868-897.
Bigne, J., Sanchez, M. and Sanchez, J. (2001). Tourism image, evaluation variables and after purchase behavior: Inter-relationships. Tourism Management, 22(6): 607-616.
Bojanic, D.C. (1996). Consumer perceptions of price, value and satisfaction in the hotel industry: An explanatory study. Journal of Hospitality & Leisure Marketing, Vol.4, No.1: pp.5-22.
Choi, S., X. Y. Lehto, and A. M. Morrison (2007). Destination image representation on the web: Content analysis of Macau travel related websites. Tourism Management, 2007(28): 118-129.
Cormany, D., and S. Baloglu (2011) Medical travel facilitator websites: An exploratory study of web page contents and services offered to the prospective medical tourist. Tourism Management, 32(4): 709-716.
Crompton, J. L. (1979) An assessment of the image of Mexico as a vacation destination and the influence of geographical location upon the image. Journal of Travel Research, 18(4):18–23.
Cronin Jr, J. J., M. K. Brady and G. T. M. Hult, (2000) Assessing the effects of quality, value, and customer satisfaction on consumer behavioral intentions in service environments. Journal of Retailing, 76(2): 193-218.
Croy, W. and F. Wheeler (2007). Image formation: a research case. In Hall, C. M. (ed.) Introduction to Tourism in Australia: Development, Issues and Change, 5th edn. Frenchs Forest, Australia: Pearson Education; 1-11. Available at http://www.pearsoned.com.au/ wpsBridge/hall5/Files/Image%20Formation.pdf (retrived on 2011-11-29).
Embacher, J., and F. Buttle (1989) A repertory grid analysis of Austria’s image as a summer vacation destination. Journal of Travel Research, 28(3):3–23.
Fakeye, P. C., and J. L. Crompton (1991) Image differences between prospective, first-time, and repeat visitors to the lower Rio Grande Valley. Journal of Travel Research, 30(2):10–16.
Frías, D. M., M. A. Rodríguez, and J. A. Castañeda (2008). Internet vs. travel agencies on pre-visit destination image formation: An information processing view. Tourism Management, 29(1): 163-179.
Gallarza, M. G., I. G. Saura and H. C. García (2007) Destination image: towards a conceptual framework. Annals of Tourism Research, 29(1):56-78.
Gartner, W. C. (1993) Image formation process. Journal of Travel and Tourism Marketing, 2(2/3):191–215.
Gartner, W. C. (1996) Tourism Development: Principles, Policies, and Policies. New York: Van Nostram Reinhold.
Hanlan, J., and S. Kelly (2005). Image formation, information sources and an iconic Australian tourist destination. Journal of Vacation Marketing, 11(2): 163-177.
Hunt, J. D. (1971) Image: A factor in tourism. Cited in N. Telisman-Kosuta (1989) Tourism destination image. In S. F. Witt and L. Moutinho, eds., Tourism Marketing and Management Handbook, pp. 557–561. Cambridge: Prentice Hall.
Hyde, K. (2006). Contemporary information search strategies of destination-naïve international vacationers. Journal of Travel and Tourism, 21(2-3): 63-76.

16
Japanese National Tourism Organization (JNTO) (2010, 2011) Consumption Trend Survey for Foreigners Visiting Japan. JNTO. Available at: http://www.mlit.go.jp/kankocho/siryou/toukei/syouhityousa.html (retrived on 2012-11-01).
Lee, J., G. Soutar, and T. Daly, (2007) Tourists' search for different types of information: a cross-national study. Information Technology and Tourism, 9(3-4): 165-176.
Patterson, I. (2007). Information sources used by older adults for decision making about tourist and travel destination. International Journal of Consumer Studies, 31: 528-533.
Petric, J.F. (2004). The roles of quality, perceived value and satisfaction in predicting cruise passengers’ behavioral intentions. Journal of Travel Research, 42(4) 397-407.
Sasaki, T. (2007) The psychology of tourism travelling. Kyoto: Kitaohji-shobo. [translated from Japanese 佐々木・土師二(2007) "観光旅行の心理学".京都:北大路書房.]
Tam, J.L.M. (2000). The effects of service quality, perceived value and customer satisfaction on behavioral intentions. Journal of Hospitality and Leisure Marketing, 6(4): 31-43.
Um, S., and J. L. Crompton (1990) Attitude determinants in tourism destination choice. Annals of Tourism Research, 17(3): 432-448.
UNWTO (2012). UNWTO Tourism Highlights 2012 Edition. Madrid: world Tourism Organization (UNWTO). Available at: http://mkt.unwto.org/sites/all/files/docpdf/unwtohighli ghts12enlr_1.pdf (retrived on 2012-09-20).
Whitlark, D. B., & Smith, S. M. (2001). Using correspondence analysis map relationships. Marketing Research, 38(4): 22–27.