a study on wealth creation (1992-97)
TRANSCRIPT
Raamdeo Agrawal (9122) 207 3809 Volume IV No.12 February 2, 1998
MOTILAL OSWAL Queen's Mansion, 2nd Floor, A.K.Naik Marg, Behind Khadi Gramodyog, Fort, Bombay 400 001.TEL: (9122) 207 1379 FAX : (9122) 207 6686
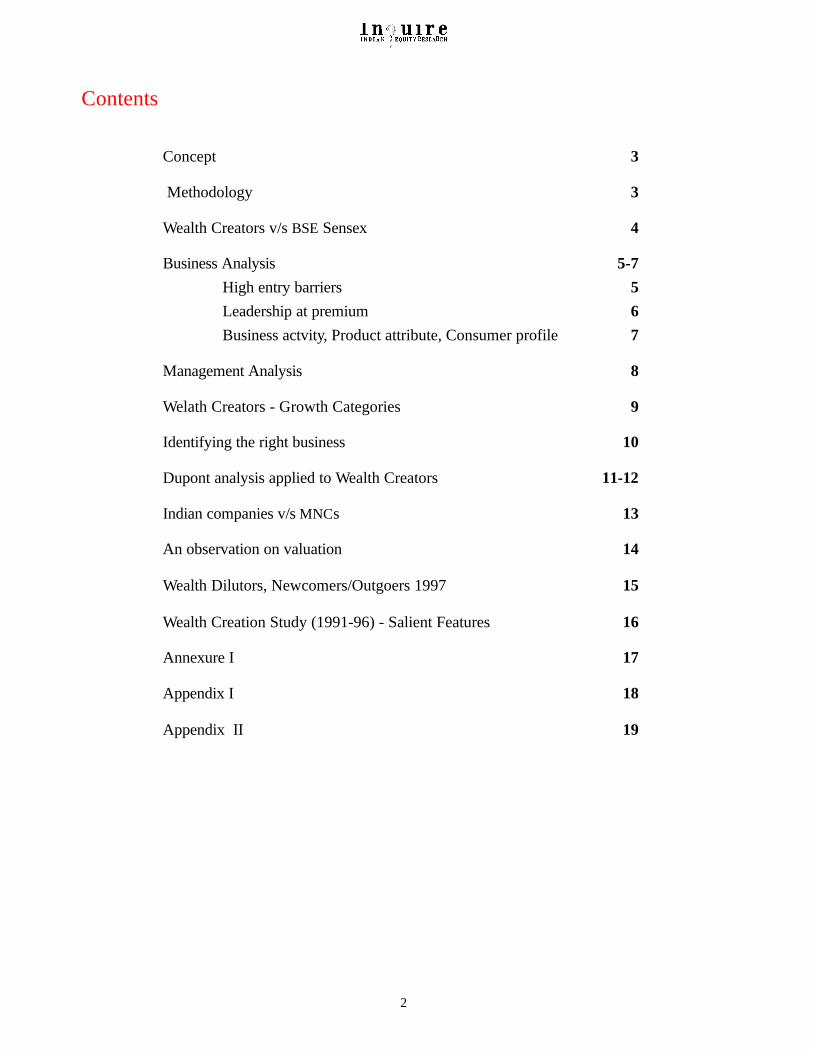
Inquire CAGR % of Rank Amount of
Rank FASTEST adjusted based BIGGEST Wealth Created mcap on size Rs. in Cr.
(92 to 97) (92 to 97)
1 Cipla Ltd 47.4 1 Hind Lever 7258
2 TVS Suzuki 43.5 2 Bajaj Auto 4780
3 Ramco Industries 42.4 3 Hindalco 3632
4 Oriental Hotels 42.3 4 Mahindra & Mahindra 2182
5 Fuller KCP 36.5 5 Ranbaxy Labs 1862
6 Sundaram Fastners 32.6 6 Indian Hotels 1848
7 Swaraj Engines 31.1 7 ABB Ltd 1661
8 EIH Ltd 28.0 8 EIH Ltd 1626
9 Punjab Tractors 27.6 9 HDFC 1453
10 Bajaj Auto 26.8 10 Colgate Palmolive 936
A Study on Wealth Creation (1992-97)
M O T I L A L O S W A LSecurities Limited
MEMBER OF THE STOCK EXCHANGE, MUMBAI
Wealth creators are driven by a passion for leadership in business.
Wealth creators are focused companies.
Consumer product companies display greater resilience during economic downturns.
High asset turnover is the key to wealth creation for MNCs.
High ROCE/ROE companies merit higher P/E and P/BV multiples.
2
Contents
Concept 3
Methodology 3
Wealth Creators v/s BSE Sensex 4
Business Analysis 5-7High entry barriers 5Leadership at premium 6Business actvity, Product attribute, Consumer profile 7
Management Analysis 8
Welath Creators - Growth Categories 9
Identifying the right business 10
Dupont analysis applied to Wealth Creators 11-12
Indian companies v/s MNCs 13
An observation on valuation 14
Wealth Dilutors, Newcomers/Outgoers 1997 15
Wealth Creation Study (1991-96) - Salient Features 16
Annexure I 17
Appendix I 18
Appendix II 19
Concept
3
Wealth creation is the process by which a company enhances the market valueof capital entrusted to it by its shareholders. It is a basic measure of success forany commercial venture.Wealth creation is achieved by rational actions of acompany in a sustained manner.
For an investor, wealth created by his company is the difference between themarket value of his holdings and his investment cost (adjusted for dilutions).But equity investments are associated with a greater degree of risk and hencefor an equity investor, the wealth created by the company must be greater thanthat from other relatively low risk assets.
At the time of making an investment decision we are familiar with the financialstatistics of the company, its management, products, etc. yet do we stop to askourselves, "Does this company have the ability to create great wealth for us ona sustained basis?". We hope this second study brings us closer to an answer.
Objective
To find the characteristics of those companies that have created wealth fortheir shareholders in the recent past. This would enable us to identify futurewealth creators.
Methodology
For the purpose of our study we have identified the top 45 Wealth Creators forthe period 1992-97 in the Indian Stock Market. These companies have thedistinction of adding atleast Rs.100 cr. to their market capitalisation over thisperiod adjusted for dilutions. We have termed this group the "Inquire 45".
The ranks have then been accorded on the basis of the speed of wealth creationi.e. compounded growth in wealth over the period of study.
The database used for this study is that of Capitaline Ole and Trends.
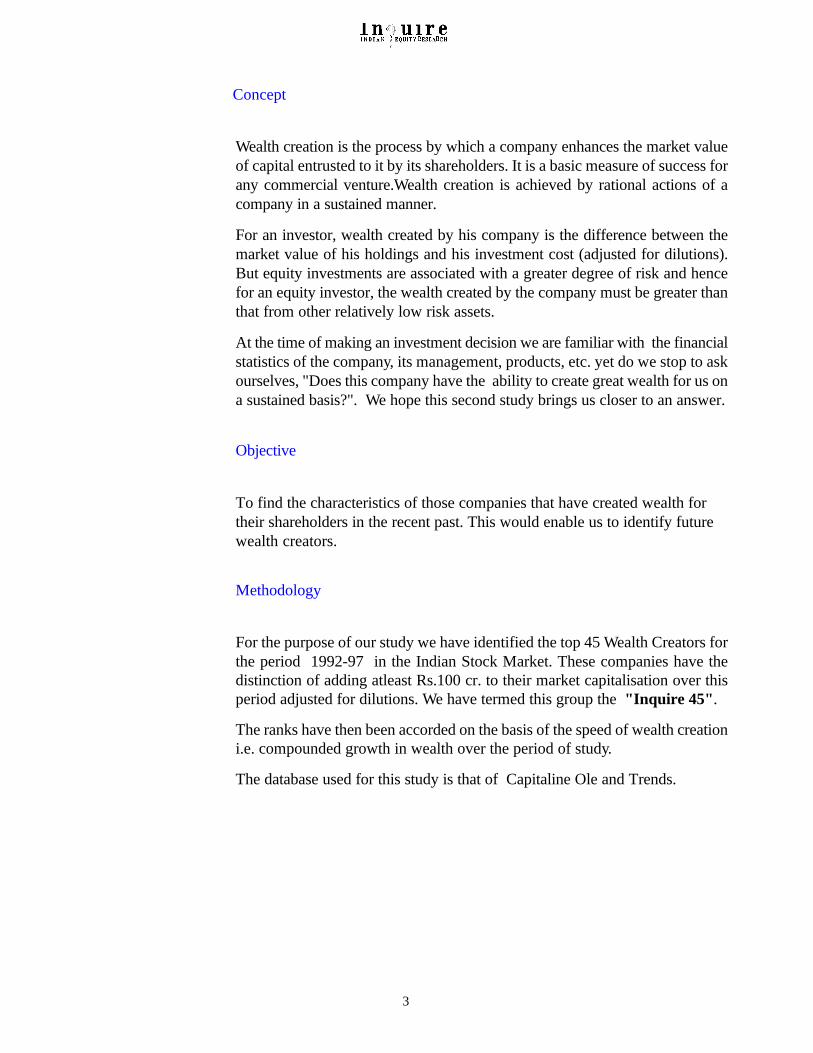
The state of the market during the period of study
The study pertains to the period between 01.04.92 to 31.03.97. During this period the BSE sensex hasdeclined from 4285 to 3360, a net loss of 22% at a CAGR of -4.7% p.a. In our previous study howeverthe Sensex had moved up from 1220 to 3392 giving a compounded annual return of 22.7% p.a. Thisstudy hence assumes greater significance due to the contrast in the state of the market. The first studythrew up approximately 300 companies as compared to only 45 companies in the present study. Thisclearly teaches the following lessons :
"Wealth Creation in a falling market is like swimming against the tide, which is difficult but not impos-sible".
It is hence important to study the attributes of stocks that perform well not only in good times but duringbad times too. This study is an attempt to open a discussion on this subject.
4
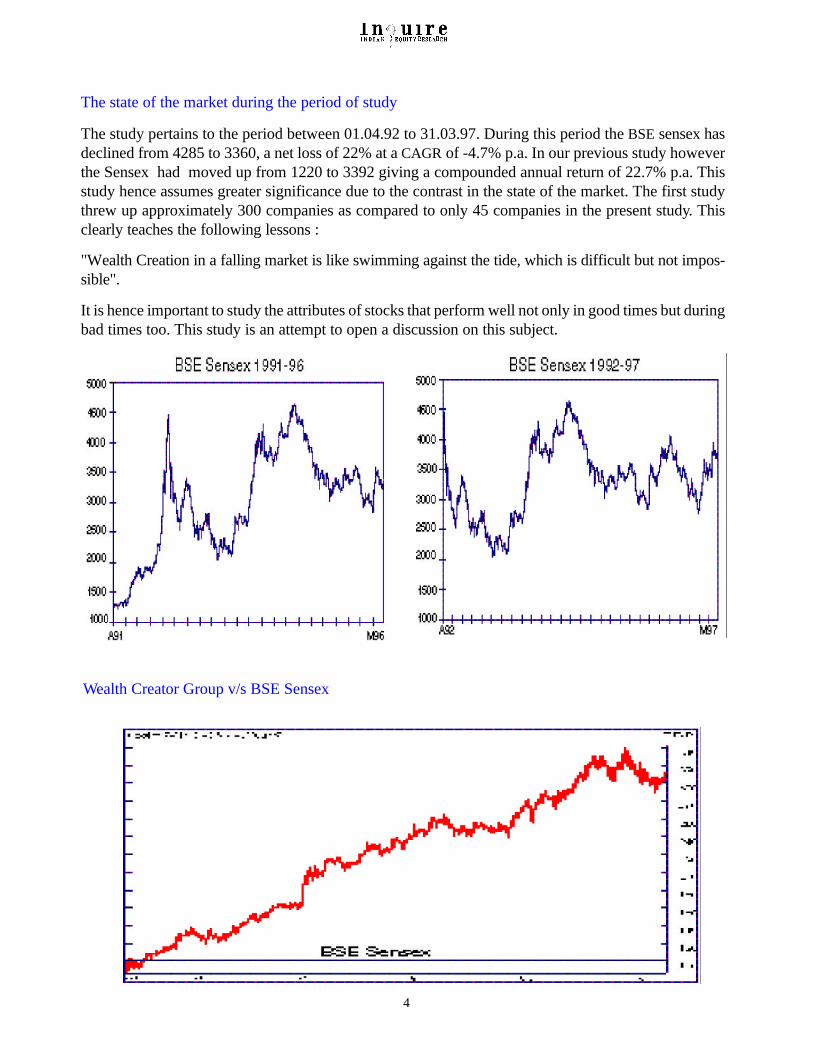
Wealth Creator Group v/s BSE Sensex

5
Business Analysis
I High entry barriers
Business with high entry barriers such as Pharmaceuticals, Au-tomobiles, Hotels & Personal Products are predominant.
1997 1996 ChangeAluminium 1 - + 1Air Conditioners 1 1 -Automobile, Auto. Accessories 9 6 + 3Banks - 2 - 2Cement 2 3 - 1Cigarettes - 1 - 1Compressors/Drilling Equipments 1 1 -Electrical Equipment 1 2 - 1Engines 2 - + 2Fastners 1 1 -Finance 2 1 + 1Hotels 4 4 -Packaging - 2 - 2Paint 1 - + 1Personal Products 4 1 + 3Pesticides - 2 - 2Pharmaceuticals 6 6 -Power Generation - 2 - 2Tyres 1 1 -Others* 9 9 -
45 45
* Ceramics, Computers, Dye-stuff, Lubricants, Printing, Glass, Weld-ing, Heavy Engineering, Travel & Tourism, Abrasives, Construction.
6
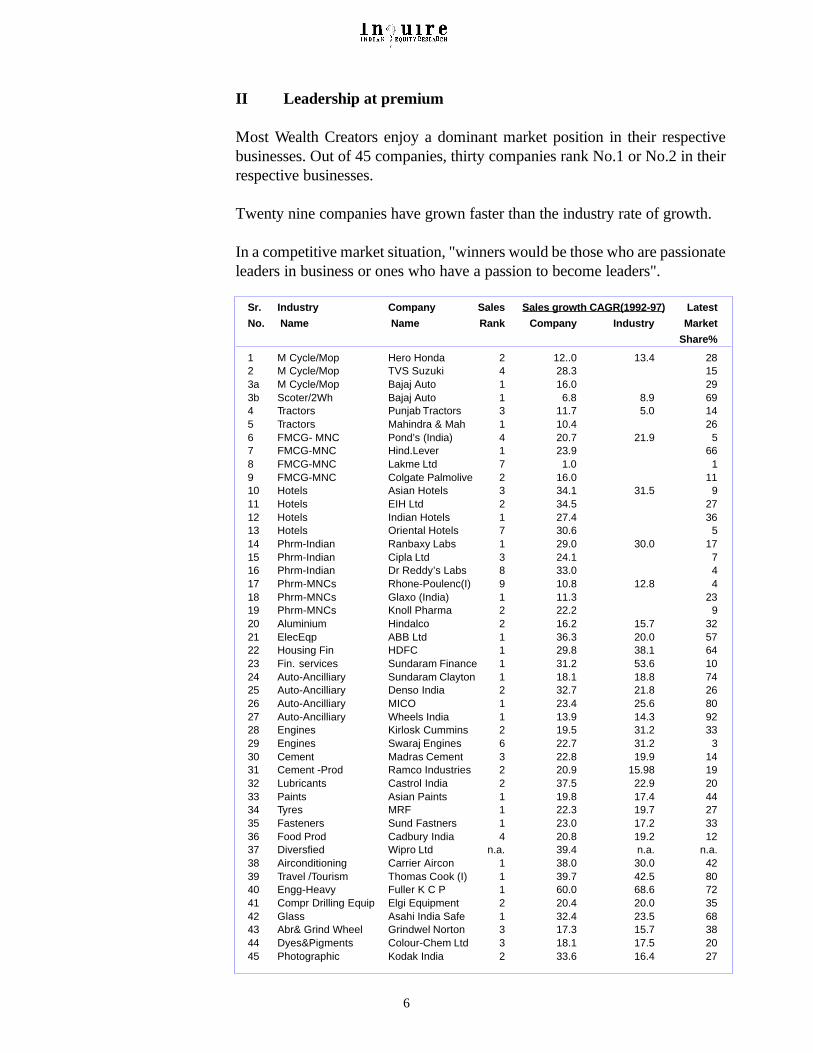
II Leadership at premium
Most Wealth Creators enjoy a dominant market position in their respectivebusinesses. Out of 45 companies, thirty companies rank No.1 or No.2 in theirrespective businesses.
Twenty nine companies have grown faster than the industry rate of growth.
In a competitive market situation, "winners would be those who are passionateleaders in business or ones who have a passion to become leaders".
Sr. Industry Company Sales Sales growth CAGR(1992-97) Latest
No. Name Name Rank Company Industry Market
Share%
1 M Cycle/Mop Hero Honda 2 12..0 13.4 282 M Cycle/Mop TVS Suzuki 4 28.3 153a M Cycle/Mop Bajaj Auto 1 16.0 293b Scoter/2Wh Bajaj Auto 1 6.8 8.9 694 Tractors Punjab Tractors 3 11.7 5.0 145 Tractors Mahindra & Mah 1 10.4 266 FMCG- MNC Pond’s (India) 4 20.7 21.9 57 FMCG-MNC Hind.Lever 1 23.9 668 FMCG-MNC Lakme Ltd 7 1.0 19 FMCG-MNC Colgate Palmolive 2 16.0 1110 Hotels Asian Hotels 3 34.1 31.5 911 Hotels EIH Ltd 2 34.5 2712 Hotels Indian Hotels 1 27.4 3613 Hotels Oriental Hotels 7 30.6 514 Phrm-Indian Ranbaxy Labs 1 29.0 30.0 1715 Phrm-Indian Cipla Ltd 3 24.1 716 Phrm-Indian Dr Reddy’s Labs 8 33.0 417 Phrm-MNCs Rhone-Poulenc(I) 9 10.8 12.8 418 Phrm-MNCs Glaxo (India) 1 11.3 2319 Phrm-MNCs Knoll Pharma 2 22.2 920 Aluminium Hindalco 2 16.2 15.7 3221 ElecEqp ABB Ltd 1 36.3 20.0 5722 Housing Fin HDFC 1 29.8 38.1 6423 Fin. services Sundaram Finance 1 31.2 53.6 1024 Auto-Ancilliary Sundaram Clayton 1 18.1 18.8 7425 Auto-Ancilliary Denso India 2 32.7 21.8 2626 Auto-Ancilliary MICO 1 23.4 25.6 8027 Auto-Ancilliary Wheels India 1 13.9 14.3 9228 Engines Kirlosk Cummins 2 19.5 31.2 3329 Engines Swaraj Engines 6 22.7 31.2 330 Cement Madras Cement 3 22.8 19.9 1431 Cement -Prod Ramco Industries 2 20.9 15.98 1932 Lubricants Castrol India 2 37.5 22.9 2033 Paints Asian Paints 1 19.8 17.4 4434 Tyres MRF 1 22.3 19.7 2735 Fasteners Sund Fastners 1 23.0 17.2 3336 Food Prod Cadbury India 4 20.8 19.2 1237 Diversfied Wipro Ltd n.a. 39.4 n.a. n.a.38 Airconditioning Carrier Aircon 1 38.0 30.0 4239 Travel /Tourism Thomas Cook (I) 1 39.7 42.5 8040 Engg-Heavy Fuller K C P 1 60.0 68.6 7241 Compr Drilling Equip Elgi Equipment 2 20.4 20.0 3542 Glass Asahi India Safe 1 32.4 23.5 6843 Abr& Grind Wheel Grindwel Norton 3 17.3 15.7 3844 Dyes&Pigments Colour-Chem Ltd 3 18.1 17.5 2045 Photographic Kodak India 2 33.6 16.4 27
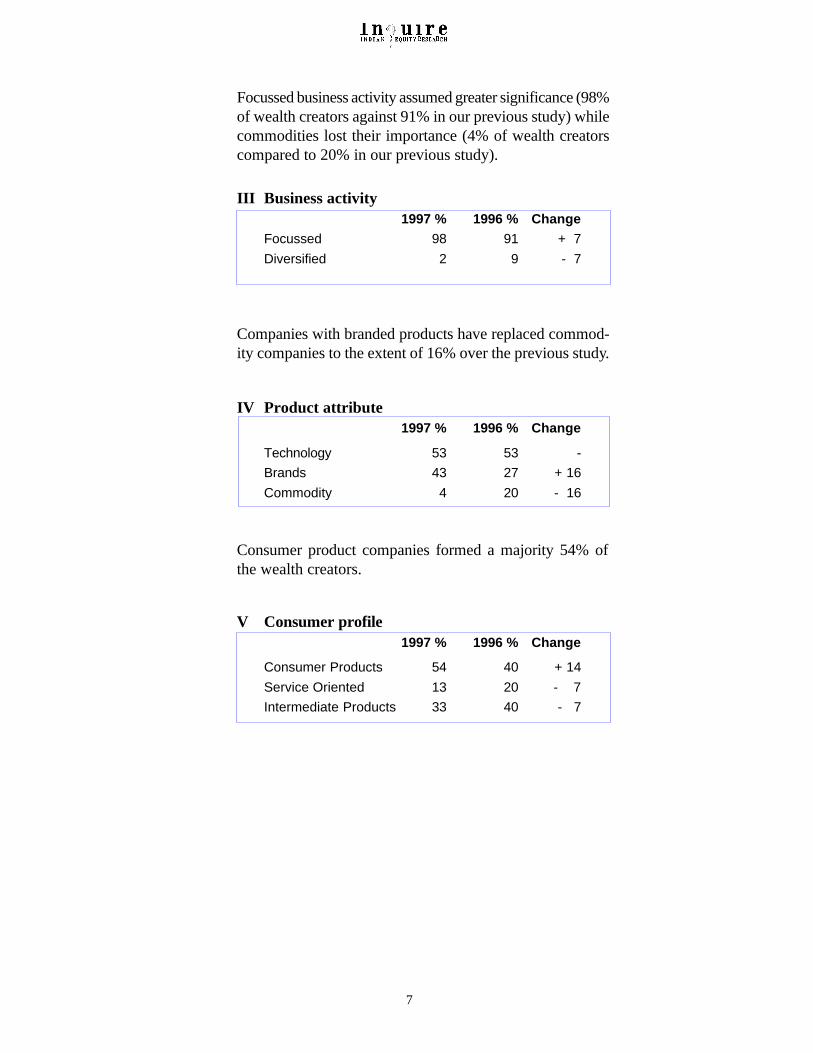
III Business activity1997 % 1996 % Change
Focussed 98 91 + 7
Diversified 2 9 - 7
Focussed business activity assumed greater significance (98%of wealth creators against 91% in our previous study) whilecommodities lost their importance (4% of wealth creatorscompared to 20% in our previous study).
7
Companies with branded products have replaced commod-ity companies to the extent of 16% over the previous study.
IV Product attribute1997 % 1996 % Change
Technology 53 53 -
Brands 43 27 + 16
Commodity 4 20 - 16
Consumer product companies formed a majority 54% ofthe wealth creators.
V Consumer profile1997 % 1996 % Change
Consumer Products 54 40 + 14
Service Oriented 13 20 - 7
Intermediate Products 33 40 - 7
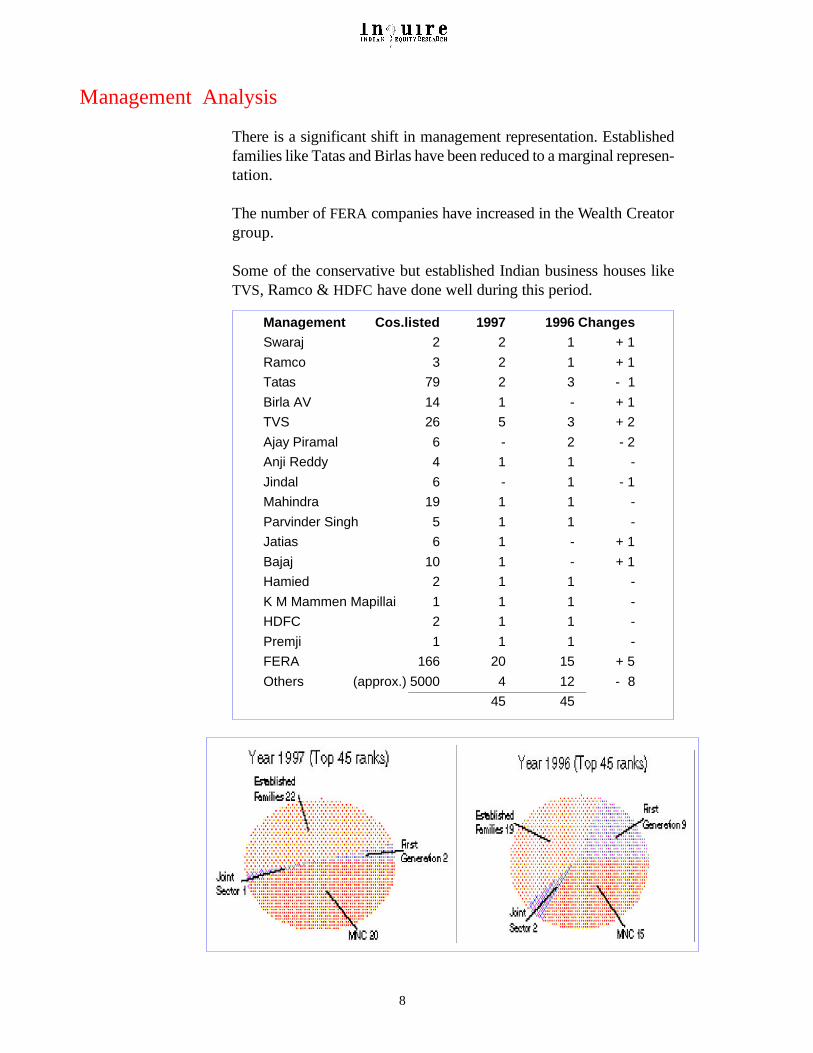
There is a significant shift in management representation. Establishedfamilies like Tatas and Birlas have been reduced to a marginal represen-tation.
The number of FERA companies have increased in the Wealth Creatorgroup.
Some of the conservative but established Indian business houses likeTVS, Ramco & HDFC have done well during this period.
Management Cos.listed 1997 1996 ChangesSwaraj 2 2 1 + 1
Ramco 3 2 1 + 1
Tatas 79 2 3 - 1
Birla AV 14 1 - + 1
TVS 26 5 3 + 2
Ajay Piramal 6 - 2 - 2
Anji Reddy 4 1 1 -
Jindal 6 - 1 - 1
Mahindra 19 1 1 -
Parvinder Singh 5 1 1 -
Jatias 6 1 - + 1
Bajaj 10 1 - + 1
Hamied 2 1 1 -
K M Mammen Mapillai 1 1 1 -
HDFC 2 1 1 -
Premji 1 1 1 -
FERA 166 20 15 + 5
Others (approx.) 5000 4 12 - 8
45 45
Management Analysis
8
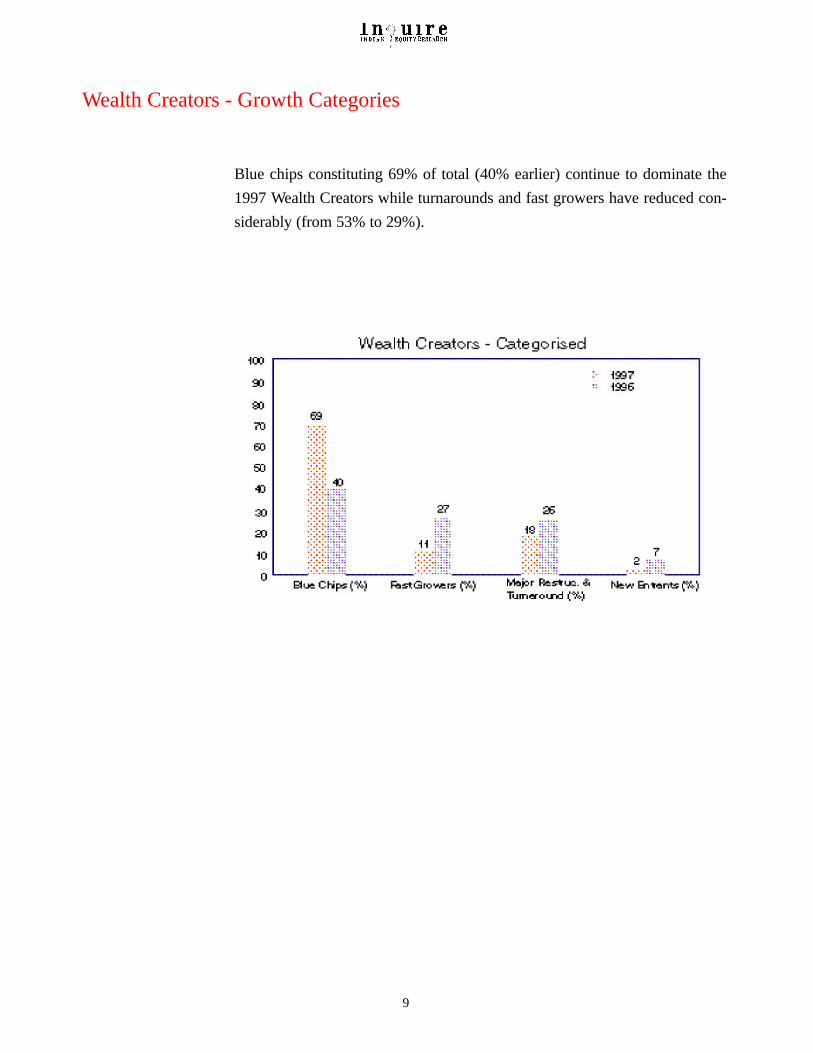
Blue chips constituting 69% of total (40% earlier) continue to dominate the1997 Wealth Creators while turnarounds and fast growers have reduced con-siderably (from 53% to 29%).
Wealth Creators - Growth Categories
9
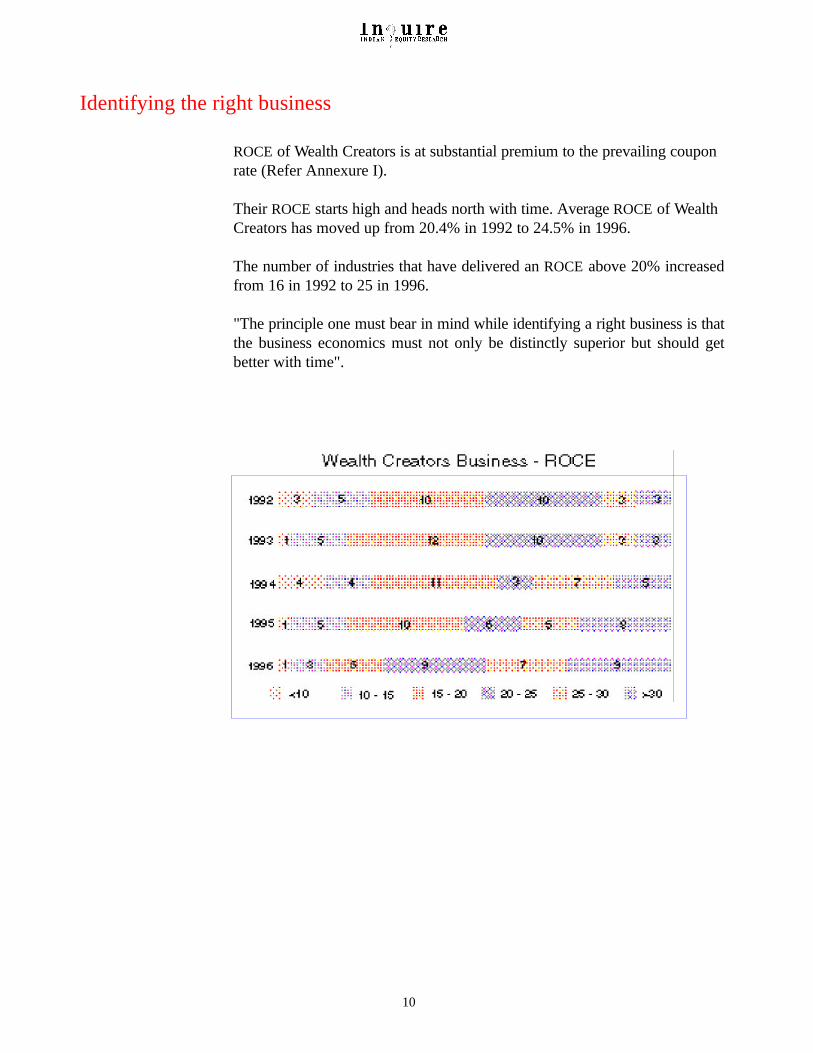
ROCE of Wealth Creators is at substantial premium to the prevailing couponrate (Refer Annexure I).
Their ROCE starts high and heads north with time. Average ROCE of WealthCreators has moved up from 20.4% in 1992 to 24.5% in 1996.
The number of industries that have delivered an ROCE above 20% increasedfrom 16 in 1992 to 25 in 1996.
"The principle one must bear in mind while identifying a right business is thatthe business economics must not only be distinctly superior but should getbetter with time".
Identifying the right business
10
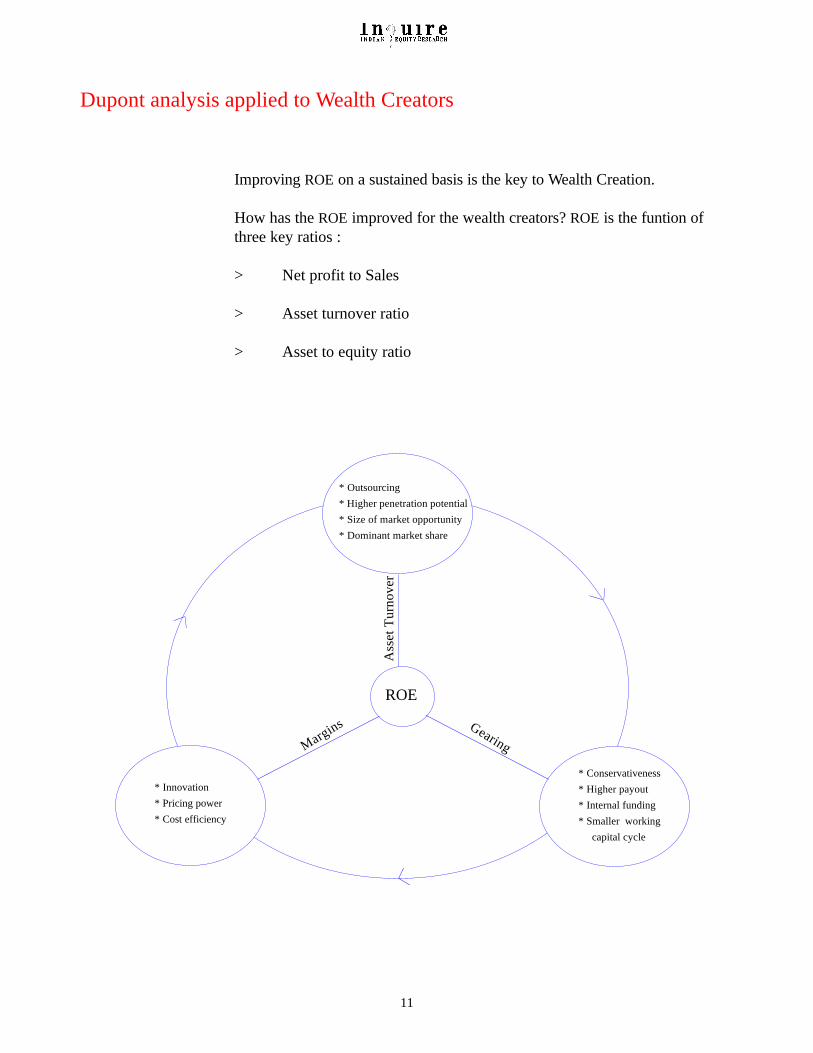
* Outsourcing* Higher penetration potential* Size of market opportunity* Dominant market share
* Conservativeness* Higher payout* Internal funding* Smaller working capital cycle
* Innovation* Pricing power* Cost efficiency
Margins Gearing
Ass
et T
urno
ver
ROE
Improving ROE on a sustained basis is the key to Wealth Creation.
How has the ROE improved for the wealth creators? ROE is the funtion ofthree key ratios :
> Net profit to Sales
> Asset turnover ratio
> Asset to equity ratio
Dupont analysis applied to Wealth Creators
11
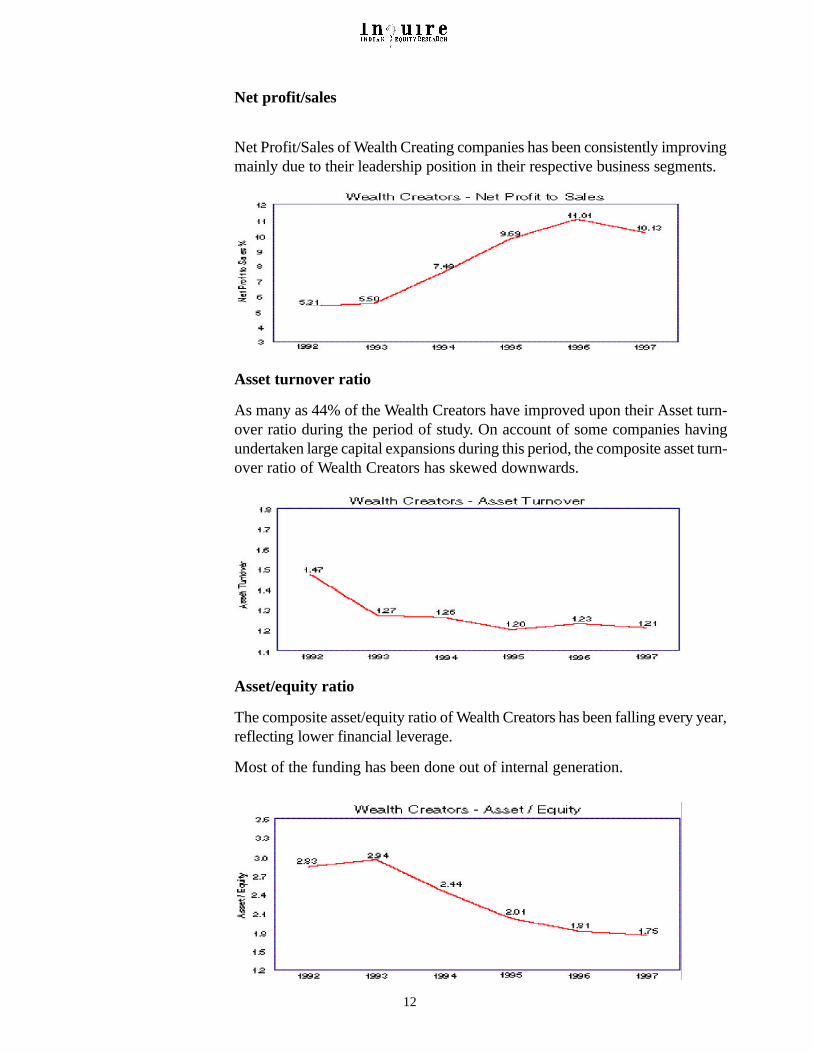
Asset turnover ratio
As many as 44% of the Wealth Creators have improved upon their Asset turn-over ratio during the period of study. On account of some companies havingundertaken large capital expansions during this period, the composite asset turn-over ratio of Wealth Creators has skewed downwards.
Net profit/sales
Net Profit/Sales of Wealth Creating companies has been consistently improvingmainly due to their leadership position in their respective business segments.
Asset/equity ratio
The composite asset/equity ratio of Wealth Creators has been falling every year,reflecting lower financial leverage.
Most of the funding has been done out of internal generation.
12
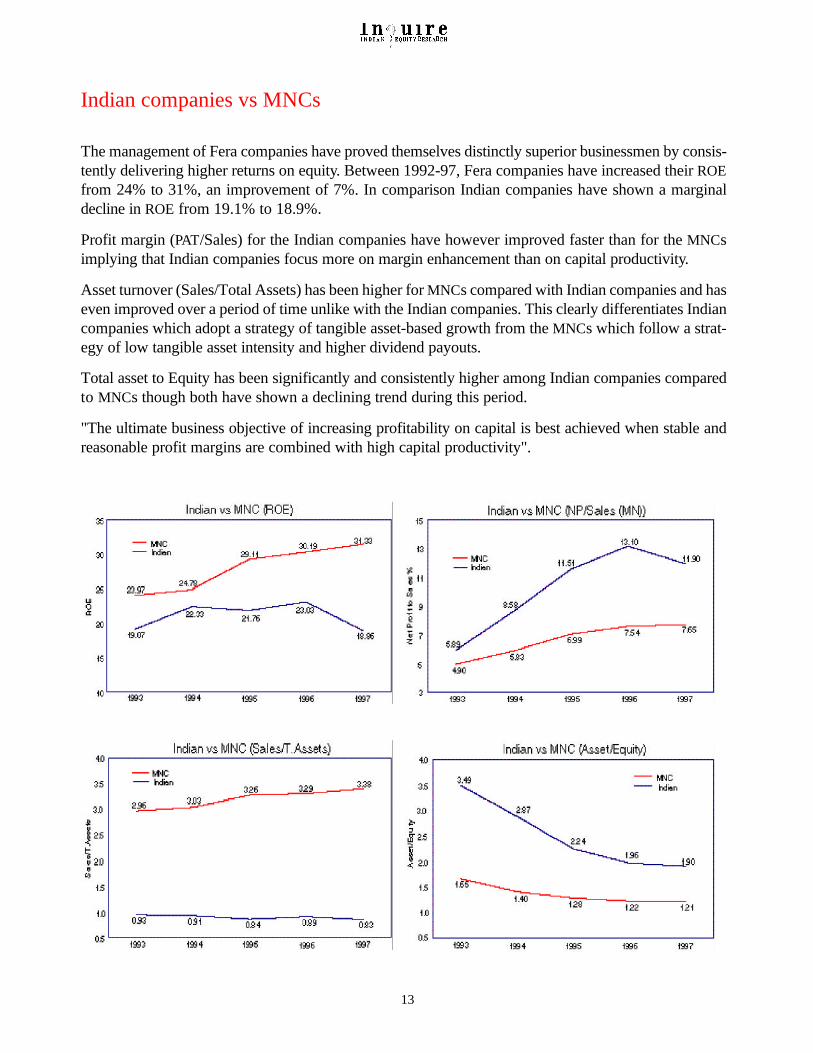
The management of Fera companies have proved themselves distinctly superior businessmen by consis-tently delivering higher returns on equity. Between 1992-97, Fera companies have increased their ROEfrom 24% to 31%, an improvement of 7%. In comparison Indian companies have shown a marginaldecline in ROE from 19.1% to 18.9%.
Profit margin (PAT/Sales) for the Indian companies have however improved faster than for the MNCsimplying that Indian companies focus more on margin enhancement than on capital productivity.
Asset turnover (Sales/Total Assets) has been higher for MNCs compared with Indian companies and haseven improved over a period of time unlike with the Indian companies. This clearly differentiates Indiancompanies which adopt a strategy of tangible asset-based growth from the MNCs which follow a strat-egy of low tangible asset intensity and higher dividend payouts.
Total asset to Equity has been significantly and consistently higher among Indian companies comparedto MNCs though both have shown a declining trend during this period.
"The ultimate business objective of increasing profitability on capital is best achieved when stable andreasonable profit margins are combined with high capital productivity".
Indian companies vs MNCs
13

An Observation on Valuation
I In our study last year, we observed that stock purchases made at P/E multiples well below a company’ssustainable ROE offer a good investment opportunity. In 1992, P/E multiples were significantlyhigher compared to ROE levels and have declined considerably by 1997 as seen below.
1992 1997P/E ROE P/E ROE
Sensex Companies 33.0 14.0 13.0 16.0Wealth Creators 44.0 22.0 21.0 22.0Wealth Dilutors 29.0 18.0 8.0 10.0
II If one observes the effect of compounding earnings over a 15-year period (as shown in figurebelow), P/E multiples would be higher than ROE when it exceeds 23% and lower than ROE when itis below 23%. It must hence be understood that, "at higher levels of sustainable ROE, companieswould command higher P/E multiples than at lower levels of sustainable ROE".
The Y-axis represents the future value of Re. 1, compounded at afixed rate x for a period of 15 years.
14
This fall illustrates, that prices accorded to businesses relatively higher in comparison to their long-term ROE, are clearly unsustainable. However, companies whose ROE levels have been sustainedby their strong earnings growth (41% CAGR for the wealth creator group) have created wealth forshareholders even during this period. On the other hand, companies whose ROE has not sustainedor has declined have diluted shareholder wealth during this period.
The price at which one acquires a business determines one's level of return. Investment in wealthcreators made at P/E multiples well below their ROE maximises returns.
15
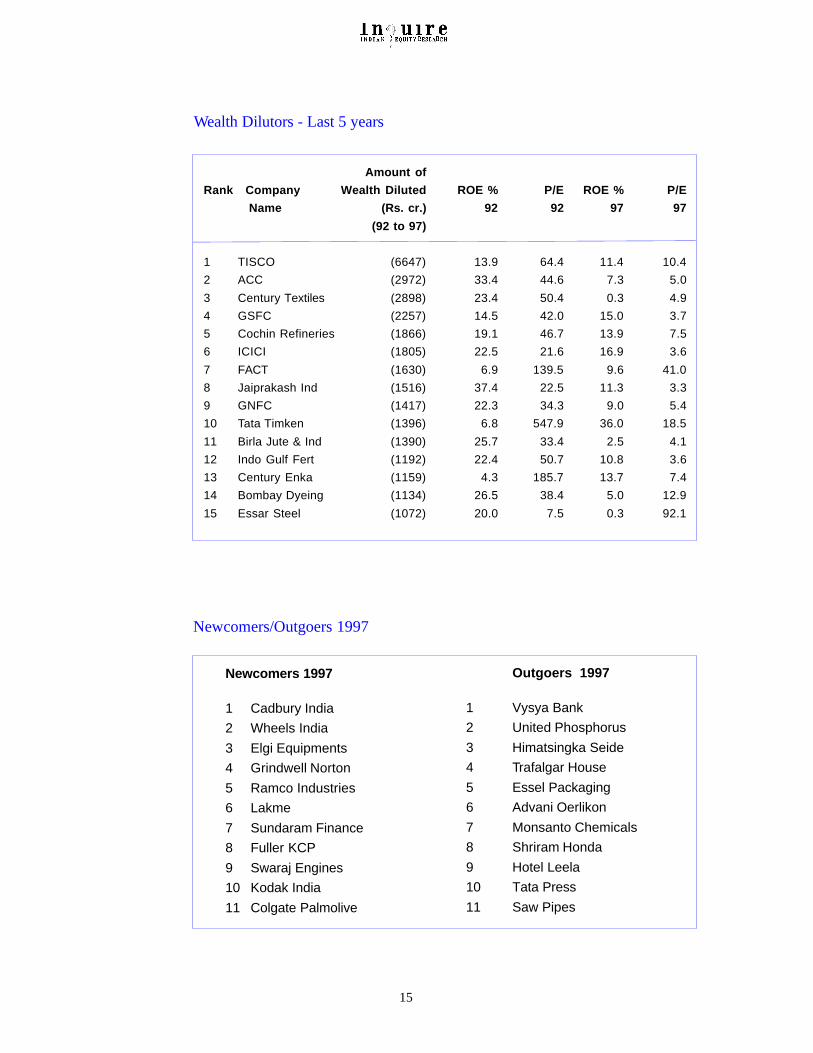
Amount of
Rank Company Wealth Diluted ROE % P/E ROE % P/E
Name (Rs. cr.) 92 92 97 97
(92 to 97)
1 TISCO (6647) 13.9 64.4 11.4 10.4
2 ACC (2972) 33.4 44.6 7.3 5.0
3 Century Textiles (2898) 23.4 50.4 0.3 4.9
4 GSFC (2257) 14.5 42.0 15.0 3.7
5 Cochin Refineries (1866) 19.1 46.7 13.9 7.5
6 ICICI (1805) 22.5 21.6 16.9 3.6
7 FACT (1630) 6.9 139.5 9.6 41.0
8 Jaiprakash Ind (1516) 37.4 22.5 11.3 3.3
9 GNFC (1417) 22.3 34.3 9.0 5.4
10 Tata Timken (1396) 6.8 547.9 36.0 18.5
11 Birla Jute & Ind (1390) 25.7 33.4 2.5 4.1
12 Indo Gulf Fert (1192) 22.4 50.7 10.8 3.6
13 Century Enka (1159) 4.3 185.7 13.7 7.4
14 Bombay Dyeing (1134) 26.5 38.4 5.0 12.9
15 Essar Steel (1072) 20.0 7.5 0.3 92.1
Newcomers 1997
1 Cadbury India
2 Wheels India
3 Elgi Equipments
4 Grindwell Norton
5 Ramco Industries
6 Lakme
7 Sundaram Finance
8 Fuller KCP
9 Swaraj Engines
10 Kodak India
11 Colgate Palmolive
Outgoers 1997
1 Vysya Bank
2 United Phosphorus
3 Himatsingka Seide
4 Trafalgar House
5 Essel Packaging
6 Advani Oerlikon
7 Monsanto Chemicals
8 Shriram Honda
9 Hotel Leela
10 Tata Press
11 Saw Pipes
Newcomers/Outgoers 1997
Wealth Dilutors - Last 5 years
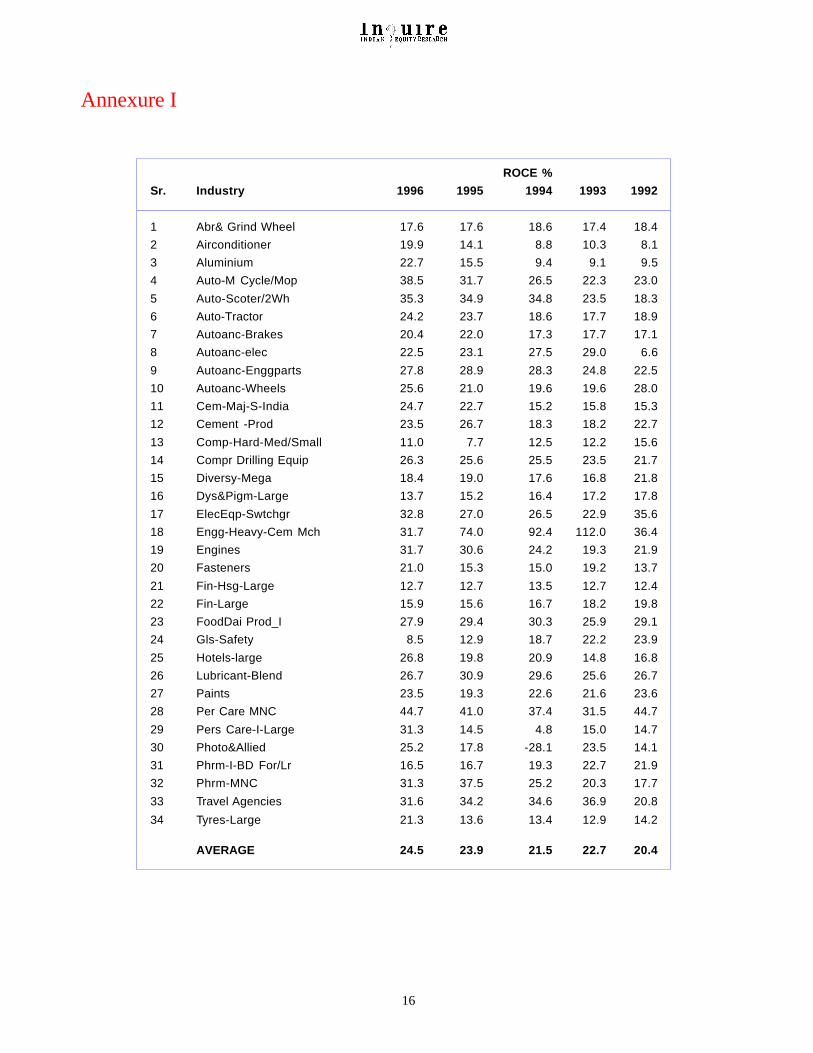
Annexure I
16
ROCE %
Sr. Industry 1996 1995 1994 1993 1992
1 Abr& Grind Wheel 17.6 17.6 18.6 17.4 18.4
2 Airconditioner 19.9 14.1 8.8 10.3 8.1
3 Aluminium 22.7 15.5 9.4 9.1 9.5
4 Auto-M Cycle/Mop 38.5 31.7 26.5 22.3 23.0
5 Auto-Scoter/2Wh 35.3 34.9 34.8 23.5 18.3
6 Auto-Tractor 24.2 23.7 18.6 17.7 18.9
7 Autoanc-Brakes 20.4 22.0 17.3 17.7 17.1
8 Autoanc-elec 22.5 23.1 27.5 29.0 6.6
9 Autoanc-Enggparts 27.8 28.9 28.3 24.8 22.5
10 Autoanc-Wheels 25.6 21.0 19.6 19.6 28.0
11 Cem-Maj-S-India 24.7 22.7 15.2 15.8 15.3
12 Cement -Prod 23.5 26.7 18.3 18.2 22.7
13 Comp-Hard-Med/Small 11.0 7.7 12.5 12.2 15.6
14 Compr Drilling Equip 26.3 25.6 25.5 23.5 21.7
15 Diversy-Mega 18.4 19.0 17.6 16.8 21.8
16 Dys&Pigm-Large 13.7 15.2 16.4 17.2 17.8
17 ElecEqp-Swtchgr 32.8 27.0 26.5 22.9 35.6
18 Engg-Heavy-Cem Mch 31.7 74.0 92.4 112.0 36.4
19 Engines 31.7 30.6 24.2 19.3 21.9
20 Fasteners 21.0 15.3 15.0 19.2 13.7
21 Fin-Hsg-Large 12.7 12.7 13.5 12.7 12.4
22 Fin-Large 15.9 15.6 16.7 18.2 19.8
23 FoodDai Prod_I 27.9 29.4 30.3 25.9 29.1
24 Gls-Safety 8.5 12.9 18.7 22.2 23.9
25 Hotels-large 26.8 19.8 20.9 14.8 16.8
26 Lubricant-Blend 26.7 30.9 29.6 25.6 26.7
27 Paints 23.5 19.3 22.6 21.6 23.6
28 Per Care MNC 44.7 41.0 37.4 31.5 44.7
29 Pers Care-I-Large 31.3 14.5 4.8 15.0 14.7
30 Photo&Allied 25.2 17.8 -28.1 23.5 14.1
31 Phrm-I-BD For/Lr 16.5 16.7 19.3 22.7 21.9
32 Phrm-MNC 31.3 37.5 25.2 20.3 17.7
33 Travel Agencies 31.6 34.2 34.6 36.9 20.8
34 Tyres-Large 21.3 13.6 13.4 12.9 14.2
AVERAGE 24.5 23.9 21.5 22.7 20.4

17
Wealth Creation Study (1991-96) - Salient Features
Wealth Creators have substantially high ROE and ROCE.
A high correlation is observed between the ROE and P/E of theWealth Creators.
Focussed companies in businesses with high entry barriers domi-nate the Wealth Creator group.
Despite a moderate sales growth of 23% p.a., better margins andhigher productivity helped them generate a 32% p.a. return forshareholders.
Wealth Creators have low capital intensity.
Wealth Creators are oriented towards sustained reduction of debt.
With an average tax rate of 20% or higher, Wealth Creators aresignificant tax payers too. Tax payment is hence conducive towealth creation.
Wealth Creators consistently increase ROCE and ROE throughproductivity of assets, earning returns higher than the cost ofcapital.
Dilution of equity per se does not detract them from wealthcreation.
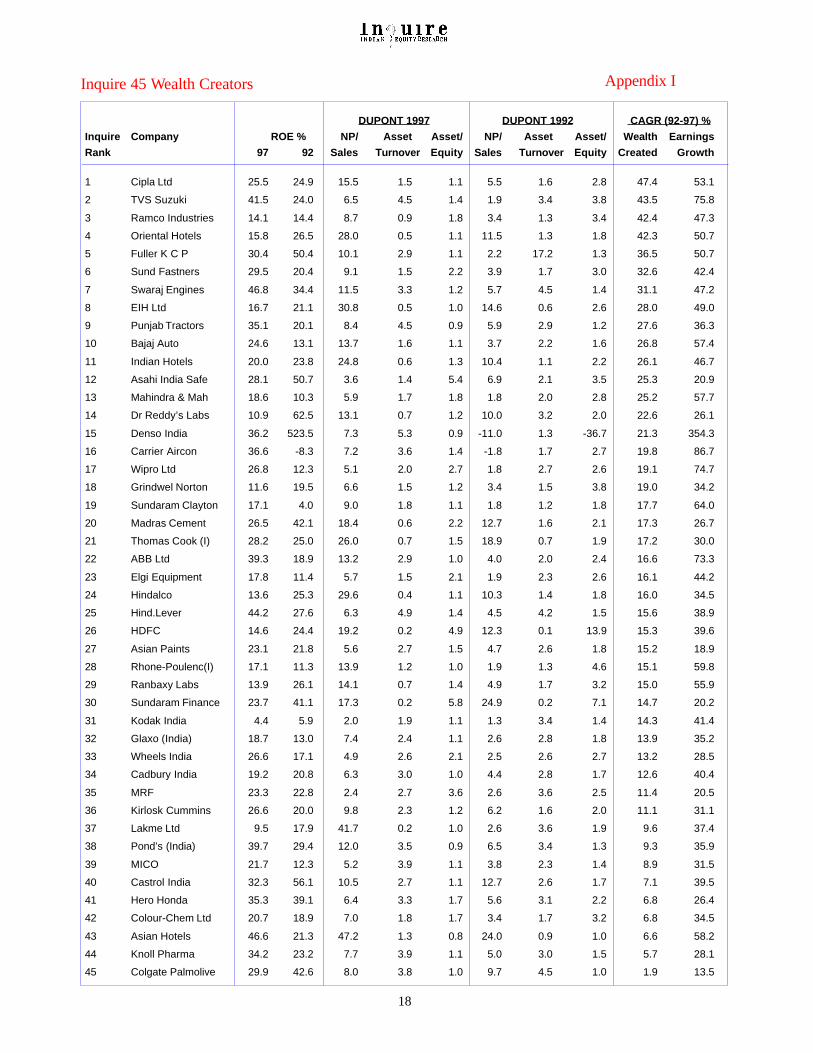
DUPONT 1997 DUPONT 1992 CAGR (92-97) %
Inquire Company ROE % NP/ Asset Asset/ NP/ Asset Asset/ Wealth Earnings
Rank 97 92 Sales Turnover Equity Sales Turnover Equity Created Growth
1 Cipla Ltd 25.5 24.9 15.5 1.5 1.1 5.5 1.6 2.8 47.4 53.1
2 TVS Suzuki 41.5 24.0 6.5 4.5 1.4 1.9 3.4 3.8 43.5 75.8
3 Ramco Industries 14.1 14.4 8.7 0.9 1.8 3.4 1.3 3.4 42.4 47.3
4 Oriental Hotels 15.8 26.5 28.0 0.5 1.1 11.5 1.3 1.8 42.3 50.7
5 Fuller K C P 30.4 50.4 10.1 2.9 1.1 2.2 17.2 1.3 36.5 50.7
6 Sund Fastners 29.5 20.4 9.1 1.5 2.2 3.9 1.7 3.0 32.6 42.4
7 Swaraj Engines 46.8 34.4 11.5 3.3 1.2 5.7 4.5 1.4 31.1 47.2
8 EIH Ltd 16.7 21.1 30.8 0.5 1.0 14.6 0.6 2.6 28.0 49.0
9 Punjab Tractors 35.1 20.1 8.4 4.5 0.9 5.9 2.9 1.2 27.6 36.3
10 Bajaj Auto 24.6 13.1 13.7 1.6 1.1 3.7 2.2 1.6 26.8 57.4
11 Indian Hotels 20.0 23.8 24.8 0.6 1.3 10.4 1.1 2.2 26.1 46.7
12 Asahi India Safe 28.1 50.7 3.6 1.4 5.4 6.9 2.1 3.5 25.3 20.9
13 Mahindra & Mah 18.6 10.3 5.9 1.7 1.8 1.8 2.0 2.8 25.2 57.7
14 Dr Reddy’s Labs 10.9 62.5 13.1 0.7 1.2 10.0 3.2 2.0 22.6 26.1
15 Denso India 36.2 523.5 7.3 5.3 0.9 -11.0 1.3 -36.7 21.3 354.3
16 Carrier Aircon 36.6 -8.3 7.2 3.6 1.4 -1.8 1.7 2.7 19.8 86.7
17 Wipro Ltd 26.8 12.3 5.1 2.0 2.7 1.8 2.7 2.6 19.1 74.7
18 Grindwel Norton 11.6 19.5 6.6 1.5 1.2 3.4 1.5 3.8 19.0 34.2
19 Sundaram Clayton 17.1 4.0 9.0 1.8 1.1 1.8 1.2 1.8 17.7 64.0
20 Madras Cement 26.5 42.1 18.4 0.6 2.2 12.7 1.6 2.1 17.3 26.7
21 Thomas Cook (I) 28.2 25.0 26.0 0.7 1.5 18.9 0.7 1.9 17.2 30.0
22 ABB Ltd 39.3 18.9 13.2 2.9 1.0 4.0 2.0 2.4 16.6 73.3
23 Elgi Equipment 17.8 11.4 5.7 1.5 2.1 1.9 2.3 2.6 16.1 44.2
24 Hindalco 13.6 25.3 29.6 0.4 1.1 10.3 1.4 1.8 16.0 34.5
25 Hind.Lever 44.2 27.6 6.3 4.9 1.4 4.5 4.2 1.5 15.6 38.9
26 HDFC 14.6 24.4 19.2 0.2 4.9 12.3 0.1 13.9 15.3 39.6
27 Asian Paints 23.1 21.8 5.6 2.7 1.5 4.7 2.6 1.8 15.2 18.9
28 Rhone-Poulenc(I) 17.1 11.3 13.9 1.2 1.0 1.9 1.3 4.6 15.1 59.8
29 Ranbaxy Labs 13.9 26.1 14.1 0.7 1.4 4.9 1.7 3.2 15.0 55.9
30 Sundaram Finance 23.7 41.1 17.3 0.2 5.8 24.9 0.2 7.1 14.7 20.2
31 Kodak India 4.4 5.9 2.0 1.9 1.1 1.3 3.4 1.4 14.3 41.4
32 Glaxo (India) 18.7 13.0 7.4 2.4 1.1 2.6 2.8 1.8 13.9 35.2
33 Wheels India 26.6 17.1 4.9 2.6 2.1 2.5 2.6 2.7 13.2 28.5
34 Cadbury India 19.2 20.8 6.3 3.0 1.0 4.4 2.8 1.7 12.6 40.4
35 MRF 23.3 22.8 2.4 2.7 3.6 2.6 3.6 2.5 11.4 20.5
36 Kirlosk Cummins 26.6 20.0 9.8 2.3 1.2 6.2 1.6 2.0 11.1 31.1
37 Lakme Ltd 9.5 17.9 41.7 0.2 1.0 2.6 3.6 1.9 9.6 37.4
38 Pond’s (India) 39.7 29.4 12.0 3.5 0.9 6.5 3.4 1.3 9.3 35.9
39 MICO 21.7 12.3 5.2 3.9 1.1 3.8 2.3 1.4 8.9 31.5
40 Castrol India 32.3 56.1 10.5 2.7 1.1 12.7 2.6 1.7 7.1 39.5
41 Hero Honda 35.3 39.1 6.4 3.3 1.7 5.6 3.1 2.2 6.8 26.4
42 Colour-Chem Ltd 20.7 18.9 7.0 1.8 1.7 3.4 1.7 3.2 6.8 34.5
43 Asian Hotels 46.6 21.3 47.2 1.3 0.8 24.0 0.9 1.0 6.6 58.2
44 Knoll Pharma 34.2 23.2 7.7 3.9 1.1 5.0 3.0 1.5 5.7 28.1
45 Colgate Palmolive 29.9 42.6 8.0 3.8 1.0 9.7 4.5 1.0 1.9 13.5
Inquire 45 Wealth Creators Appendix I
18
19
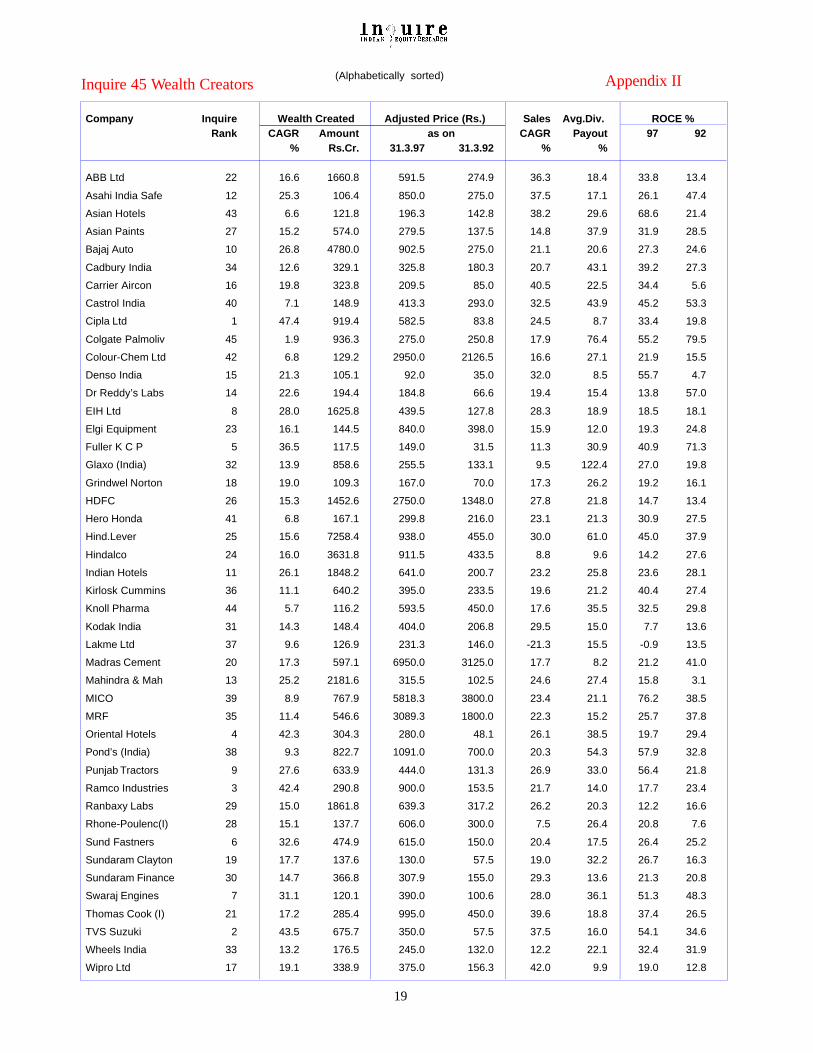
Inquire 45 Wealth Creators Appendix II
Company Inquire Wealth Created Adjusted Price (Rs.) Sales Avg.Div. ROCE %Rank CAGR Amount as on CAGR Payout 97 92
% Rs.Cr. 31.3.97 31.3.92 % %
ABB Ltd 22 16.6 1660.8 591.5 274.9 36.3 18.4 33.8 13.4
Asahi India Safe 12 25.3 106.4 850.0 275.0 37.5 17.1 26.1 47.4
Asian Hotels 43 6.6 121.8 196.3 142.8 38.2 29.6 68.6 21.4
Asian Paints 27 15.2 574.0 279.5 137.5 14.8 37.9 31.9 28.5
Bajaj Auto 10 26.8 4780.0 902.5 275.0 21.1 20.6 27.3 24.6
Cadbury India 34 12.6 329.1 325.8 180.3 20.7 43.1 39.2 27.3
Carrier Aircon 16 19.8 323.8 209.5 85.0 40.5 22.5 34.4 5.6
Castrol India 40 7.1 148.9 413.3 293.0 32.5 43.9 45.2 53.3
Cipla Ltd 1 47.4 919.4 582.5 83.8 24.5 8.7 33.4 19.8
Colgate Palmoliv 45 1.9 936.3 275.0 250.8 17.9 76.4 55.2 79.5
Colour-Chem Ltd 42 6.8 129.2 2950.0 2126.5 16.6 27.1 21.9 15.5
Denso India 15 21.3 105.1 92.0 35.0 32.0 8.5 55.7 4.7
Dr Reddy’s Labs 14 22.6 194.4 184.8 66.6 19.4 15.4 13.8 57.0
EIH Ltd 8 28.0 1625.8 439.5 127.8 28.3 18.9 18.5 18.1
Elgi Equipment 23 16.1 144.5 840.0 398.0 15.9 12.0 19.3 24.8
Fuller K C P 5 36.5 117.5 149.0 31.5 11.3 30.9 40.9 71.3
Glaxo (India) 32 13.9 858.6 255.5 133.1 9.5 122.4 27.0 19.8
Grindwel Norton 18 19.0 109.3 167.0 70.0 17.3 26.2 19.2 16.1
HDFC 26 15.3 1452.6 2750.0 1348.0 27.8 21.8 14.7 13.4
Hero Honda 41 6.8 167.1 299.8 216.0 23.1 21.3 30.9 27.5
Hind.Lever 25 15.6 7258.4 938.0 455.0 30.0 61.0 45.0 37.9
Hindalco 24 16.0 3631.8 911.5 433.5 8.8 9.6 14.2 27.6
Indian Hotels 11 26.1 1848.2 641.0 200.7 23.2 25.8 23.6 28.1
Kirlosk Cummins 36 11.1 640.2 395.0 233.5 19.6 21.2 40.4 27.4
Knoll Pharma 44 5.7 116.2 593.5 450.0 17.6 35.5 32.5 29.8
Kodak India 31 14.3 148.4 404.0 206.8 29.5 15.0 7.7 13.6
Lakme Ltd 37 9.6 126.9 231.3 146.0 -21.3 15.5 -0.9 13.5
Madras Cement 20 17.3 597.1 6950.0 3125.0 17.7 8.2 21.2 41.0
Mahindra & Mah 13 25.2 2181.6 315.5 102.5 24.6 27.4 15.8 3.1
MICO 39 8.9 767.9 5818.3 3800.0 23.4 21.1 76.2 38.5
MRF 35 11.4 546.6 3089.3 1800.0 22.3 15.2 25.7 37.8
Oriental Hotels 4 42.3 304.3 280.0 48.1 26.1 38.5 19.7 29.4
Pond’s (India) 38 9.3 822.7 1091.0 700.0 20.3 54.3 57.9 32.8
Punjab Tractors 9 27.6 633.9 444.0 131.3 26.9 33.0 56.4 21.8
Ramco Industries 3 42.4 290.8 900.0 153.5 21.7 14.0 17.7 23.4
Ranbaxy Labs 29 15.0 1861.8 639.3 317.2 26.2 20.3 12.2 16.6
Rhone-Poulenc(I) 28 15.1 137.7 606.0 300.0 7.5 26.4 20.8 7.6
Sund Fastners 6 32.6 474.9 615.0 150.0 20.4 17.5 26.4 25.2
Sundaram Clayton 19 17.7 137.6 130.0 57.5 19.0 32.2 26.7 16.3
Sundaram Finance 30 14.7 366.8 307.9 155.0 29.3 13.6 21.3 20.8
Swaraj Engines 7 31.1 120.1 390.0 100.6 28.0 36.1 51.3 48.3
Thomas Cook (I) 21 17.2 285.4 995.0 450.0 39.6 18.8 37.4 26.5
TVS Suzuki 2 43.5 675.7 350.0 57.5 37.5 16.0 54.1 34.6
Wheels India 33 13.2 176.5 245.0 132.0 12.2 22.1 32.4 31.9
Wipro Ltd 17 19.1 338.9 375.0 156.3 42.0 9.9 19.0 12.8
(Alphabetically sorted)

For more copies or other Inquire Research Call : (9122) 207 3809/ 207 1379 Fax (9122) 207 66 86This document is for information purposes only. In no circumstances should it be used or considered as an offer to sell or a solicitation
of any offer to buy or sell the securities or commodities mentioned in it. The information in this document has been obtained fromsources believed reliable, but we do not represent that it is accurate or complete, and it should not be relied upon as such.
NOTES