a study: uml for ooa and ood
TRANSCRIPT

D. Rajagopal & K. ThilakavalliInternational Journal of Knowledge Content Development & Technology Vol.7, No.2, 5-20 (June, 2017) 5
A Study: UML for OOA and OOD
D. Rajagopal*, K. Thilakavalli***
ARTICLE INFO ABSTRACT
Article history:Received 7 September 2016Revised 4 May 2017Accepted 9 May 2017
The notion of object oriented analysis and design in software engineering has many rewards that aid the programmer to have an understanding of and improve the program efficaciously. Object oriented metrics helps rather a lot to a programmer or developer to comprehend and unravel the thing-oriented trouble readily and exactly. Object oriented metrics helps in examining the usefulness of object oriented applied sciences or in simple phrases Object-oriented metrics depict characteristics of object-oriented programming. The intention of this paper is to have an understanding of concerning the UML, Object oriented evaluation and design and the way it plays in UML.
Keywords:Use Case, Object Diagram, Class Diagram, Activity and State Chart Diagram, Component and Sequence Diagram
1. Introduction
OOA, OOD, and UML-based diagrams typically used in the software development approach.
OOA, OOD approaches present a excellent framework for eventualities. A use case is a widespread
description of a whole transaction involving a few objects of the procedure. The UML language
supplies a suitable framework for situation acquisition making use of use case diagrams like sequence,
collaboration diagrams. A Scenariosis defined as an illustration of a given use case. Scenariosviewedin
two exclusive approaches via sequence diagrams and collaboration diagrams. Each variety of diagrams
depends on the equal underlying semantics. Conversion from one to the opposite is possible. In this
paper, we propose a requirement engineering process that composes UML eventualities for receive
a global description of a given service of the procedure and implementation code from the UML
use case (service).
2. Review of Literature
Jakimi and El Koutb (2009) means that, a requirement engineering procedure that composed
* Assistant Professor in the Department of Computer Science, Vivekanandha College of Arts and Sciences for women, Tiruchengode ([email protected])
** Assistant Professor, Department of Computer Applications, Karpagam University, Coimbatore, Tamilnadu, India ([email protected])International Journal of Knowledge Content Development & Technology, 7(2): 5-20, 2017.http://dx.doi.org/10.5865/IJKCT.2017.7.2.005

D. Rajagopal & K. ThilakavalliInternational Journal of Knowledge Content Development & Technology Vol.7, No.2, 5-20 (June, 2017)6
UML eventualities for acquire a global description of a given provider of the system and implementation
code from the UML use case (provider) and suggests four operators: sequential operator, concurrent
operator, conditional operator and generation operator to compose a set of eventualities that describe
a use case of a given approach. Their method used to be normal so it may be used to generate
the low level code in other object-oriented languages and it produced routinely a worldwide specification
of the entire approach in type of a three stage hierarchical colored Petri Nets (CPN).
Al-Fedaghi (2011) proposed utilizing float as a major notion underlying working out of routine
in net services and concluded that flow-established conceptualization guarantees to provide a firmer
base for net functions progress on the preliminary stages of design. It’s viable to integrate this
flow-founded process with present methods of software progress methods.
Sunil and Kurian (2014) evaluating object-oriented program procedure by means of alternate
requirement traceability centered affect analysis methodology for non-realistic requirements utilising
practical necessities. Their proposed analysis is highly dependent on an extraordinarily well outlined
software standards specification and non-functional traceable requirement. Extra headquartered on
exchange within the standards the have an effect on on the class diagram scan case attributes identified.
Founded on the requirement traceability which experiment cases transformed and also influence of
object-oriented paradigms analyzed.
3. Methodology to design the framework
Figure 1. Methodology for Designing the Framework

D. Rajagopal & K. ThilakavalliInternational Journal of Knowledge Content Development & Technology Vol.7, No.2, 5-20 (June, 2017) 7
4. Use case diagram:
Use case is a high-stage description of what the approach is meant to do, whose purpose is
to capture the approach requirements. In different words, if a use case represents a person interplay,
many variants of this user interaction can be described. UML is involved with the interplay between
the approach and external actors. One use case can name upon the offerings of a different use
case making use of some relations (entails, extends, makes use of, and many others).
4.1 Use Case Diagram objects
Use case diagrams include four objects. They’re Actor, Use case, method and package deal
ActorActor in a use case diagram is any entity that performs a position in a single given approach. This
would be a individual, group or an outside system and by and large drawn like skeleton shown below.
Use CaseA use case represents a operate or an motion inside the procedure. It has drawn as an oval and
named with the function.
SystemSystem is used to outline the scope of the use case and drawn as a rectangle. This an optional
aspect but useful when your visualizing gigantic programs. For illustration, we are able to create
all the use instances and then use the approach object to define the scope blanketed by means of
your venture. However, we will even use it to show the distinctive areas covered in unique releases.

D. Rajagopal & K. ThilakavalliInternational Journal of Knowledge Content Development & Technology Vol.7, No.2, 5-20 (June, 2017)8
PackagePackage is an extra non-compulsory detail that is totally priceless in difficult diagrams. Similar
to class diagrams, applications are used to workforce collectively use instances. They are drawn
just like the picture shown under.
4.2 Use Case Diagram Guidelines
Even though use case diagrams can be utilized for various purposes there are some fashioned
instructional materials you have to follow when drawing use cases. These comprise naming specifica-
tions, instructions of arrows, placing of use cases, usage of approach boxes, and proper usage of
relationships. In relation to inspecting the requirement of a procedure use case diagrams are 2nd
to none. They are visible and almost always very effortless to realize. The next use case diagram
directions will aid to create better use cases that are appreciated through clients and friends alike.
A use case diagram usually includes actors, use cases, and relationships. Extra difficult larger
diagrams can incorporate techniques and limits. It is essential to do not forget that these are instructions
and not ideas. It is very well to deviate if it improves the total exceptional of the diagram. To
get a deep figuring out of use case diagrams assess out our use case diagram tutorial.
4.3 Relationships in Use Case Diagrams
There are three varieties of relationships in a use case diagram. They are➢ Association between an actor and a use case
➢ Generalization of an actor and use case
➢ Prolong and comprise relationship between two use instances
4.4 Procedure to Create a Use Case Diagram
Identifying ActorsActors are external entities that interact together with your system. It may be a man or woman,
yet another procedure or an organization. In banking process essentially, the most apparent actor
is the client. Different actors will also be financial institution worker or cashier depending on the
role seeking to show within the use case. An illustration of an outside organization can also be
the tax authority or the relevant financial institution. Loan processor is an efficient instance of
outside procedure related as an actor.

D. Rajagopal & K. ThilakavalliInternational Journal of Knowledge Content Development & Technology Vol.7, No.2, 5-20 (June, 2017) 9
Identifying Use CasesNow it is time to determine the use circumstances. A great way to do this is to determine what
the actors want from the system. In banking system a consumer ought to open debts, deposit and
withdraw funds, request determine books and identical features and these can be viewed as use
cases. Prime stage use cases will have to at all times furnish whole capabilities required by means
of an actor. That may prolong or include use circumstances depending on the complexity of the
procedure. When establish the actors and the top-level use case, could have general idea of the
system. Now could nice tune it and add extra layers of detail to it.
Look for Common Functionality to use IncludeAppear for fashioned functionality that can be reused throughout the process. Finding two or
more use cases that share common functionality could extract the customary features and add it
to a separate use case. Then that can join it by way of the include relationship to exhibit that
it is invariably known as when the fashioned use case is carried out. Is it feasible to Generalize
Actors and Use cases? There may be situations the place actors are associated with similar use
circumstances even as triggering few use instances specified most effective to them. One of the
vital quality examples of this is “Make fee” use case in a fee system. Additional generalize it to
“Pay by way of bank card”, “Pay through cash”, “Pay by way of verify” etc. All of them have
the attributes and the functionality of a cost with particular scenarios special to them.
Optional Functions or Additional FunctionsThere are some functions, which can be caused optionally. In such cases can use the prolong
relationship and connect and extension rule to it. Within the beneath banking method instance “Calculate
Bonus” is not obligatory and handiest triggers when a special is matched. Lengthen does not perpetually
imply its non-compulsory. Frequently the use case linked via extend can complement the bottom
use case. Thing to keep in mind is that the base use case must be in a position to participate
in a perform on its possess even if the extending use case shouldn’t be known as.
Example

D. Rajagopal & K. ThilakavalliInternational Journal of Knowledge Content Development & Technology Vol.7, No.2, 5-20 (June, 2017)10
5. Object diagram
Object diagrams are derived from category diagrams so object diagrams are based upon class
diagrams. Object diagrams represent an example of a category diagram. The elemental ideas are
identical for sophistication diagrams and object diagrams. Object diagrams also symbolize the static
view of a method but this static view is a image of the system at a designated moment. Object
diagrams are used to render a collection of objects and their relationships as an example.
5.1 Purpose of object diagram
The intent of a diagram will have to be understood certainly to put into effect it almost. The purposes
of object diagrams are much like class diagrams. The change is that a category diagram represents
an summary mannequin inclusive of classes and their relationships. However, an object diagram represents
an illustration at a exact moment which is concrete in nature. It approach the item diagram is extra
just about the actual procedure behaviour. The intent is to capture the static view of a method at
a detailed second. So the rationale of the thing diagram may also be summarized as:➢ Forward and reverse engineering.
➢ Object relationships of a system
➢ Static view of an interaction.
➢ Understand object behaviour and their relationship from practical perspective
5.2 Procedure to draw the object diagram
An object diagram is an instance of a category diagram. It implies that an object diagram consists
of circumstances of matters used in a class diagram. So each diagram is made of equal common
elements but in distinctive kind. At school, diagram elements are in summary type to represent
the blue print and in object diagram; the elements are in concrete form to symbolize the real world
object.
To capture a certain approach, numbers of class diagrams are confined. However, if we recollect
object diagrams then we can have unlimited number of occasions that are detailed in nature. So
most effective those occasions are considered which are having impact on the system
➢ First, analyze the system and decide which instances are having important data and association.
➢ Second, consider only those instances, which will cover the functionality.
➢ Third, make some optimization, as the numbers of instances are unlimited.
Before drawing an object diagrams the following things should be remembered and understood
clearly:➢ Object diagrams are consist of objects.
➢ The link in object diagram is used to connect objects.
➢ Objects and links are the two elements used to construct an object diagram.

D. Rajagopal & K. ThilakavalliInternational Journal of Knowledge Content Development & Technology Vol.7, No.2, 5-20 (June, 2017) 11
Now after this the following things are to be decided before starting the construction of the
diagram:➢ The object diagram should have a meaningful name to indicate its purpose.
➢ The most important elements are to be identified.
➢ The association among objects should be clarified.
➢ Values of different elements need to be captured to include in the object diagram.
➢ Add proper notes at points where more clarity is required.
The following diagram is an example of an object diagram. It represents the Order management
system, which we discussed inClass Diagram. The following diagram is an instance of the procedure
at a specific time of purchase. It has the next objects
➢ Customer
➢ Order
➢ SpecialOrder
➢ NormalOrder
Now the customer object (C) is associated with three order objects (O1, O2 and O3). These
order objects are associated with specific order and average order objects (S1, S2 and N1). The
customer is having the following three orders with exclusive numbers (12, 32 and forty) for the
certain time considered. Now the customer can develop number of orders in future and in that
scenario the object diagram will reflect that. If order, distinctive order and traditional order objects
are observed then find that they are having some values. For orders the values are 12, 32, and
40 which suggests that the objects are having these values for the detailed second when the illustration
is captured. The identical is for specific order and natural order objects, which might be having
number of orders as 20, 30 and 60. If yet another time of buy is regarded then these values will
alternate hence.
Therefore, the next object diagram has been drawn since all of the aspects stated above:
Figure 2. Object diagram of an order management system

D. Rajagopal & K. ThilakavalliInternational Journal of Knowledge Content Development & Technology Vol.7, No.2, 5-20 (June, 2017)12
object diagrams are used for:➢ Making the prototype of a system.
➢ Reverse engineering.
➢ Modeling complex data structures.
➢ Understanding the system from practical perspective.
6. Class diagram
Class diagrams describe the constitution of the classes. The use of class diagrams indicates the
existence of classes and their relationship in the logical view of a system. The next figure shows
the student information system. Class (student department and course) is defining with their title,
attributes, and operations.
Figure 3. Class diagram for student info system
7. Activity diagram
Activity diagram is a further major diagram in UML to describe dynamic facets of the system.
Activity diagram is a float chart to symbolize the drift kind one activity to another activity. The
activity can be described as an operation of the procedure. Hence, the manage go with the flow
is drawn from one operation to one more. This drift may also be sequential, branched, or concurrent.

D. Rajagopal & K. ThilakavalliInternational Journal of Knowledge Content Development & Technology Vol.7, No.2, 5-20 (June, 2017) 13
Activity diagrams deals with all variety of glide manage by using extraordinary factors like fork,
become a member of etc.
7.1 Purpose of Activity diagram
The elemental functions of activity diagrams are much like different 4 diagrams. It captures
the dynamic behaviour of the system. Different four diagrams are used to show the message flow
from one object to one other however, activity diagram is used to exhibit message float from one
activity to an additional. Activity is a precise operation of the system. Activity diagrams will not
be handiest used for visualizing dynamic nature of a system but they’re additionally used to assemble
the executable procedure by means of using forward and reverse engineering tactics. The one missing
factor in activity diagram is the message part. It does no longer exhibit any message drift from
one endeavor to an additional. Activity diagram is a while regarded because the waft chart. Despite
the fact that the diagrams appears like a flow chart but it is not. It indicates one-of-a-kind flow
like parallel, branched, concurrent, and single
So the purposes can be described as:➢ Draw the activity flow of a system.
➢ Describe the sequence from one activity to another.
➢ Describe the parallel, branched and concurrent flow of the system.
7.2 Procedure to draw the Activity diagram
Activity diagrams are most of the time used as a drift chart includes events performed by using
the system. However activity diagram usually are not exactly a drift chart as they have some further
capabilities. These additional capabilities comprise branching, parallel float, swim lane and so forth.
Before drawing an activity diagram, we must have a transparent figuring out concerning the elements
utilized in activity diagram. The predominant aspect of an activity diagram is the exercise itself.
An endeavor is an activities performed by way of the procedure. After picking the events, we
must understand how they are associated with constraints and conditions.
Therefore, before drawing an activity diagram we should identify the following elements:
➢ Activities
➢ Association
➢ Conditions
➢ Constraints
Once the above-recounted parameters are identified, we ought to make a mental design of the
complete float. This mental design is then transformed into an undertaking diagram. The next is
an example of an endeavor diagram for order administration procedure. In the diagram, four activities
are identified that are related to conditions. One fundamental point must be naturally understood
that an exercise diagram could now not be precisely matched with the code. The activity diagram

D. Rajagopal & K. ThilakavalliInternational Journal of Knowledge Content Development & Technology Vol.7, No.2, 5-20 (June, 2017)14
is made to fully grasp the go with the flow of events and mostly used by the trade customers.
The following diagram is drawn with the four main activities:
➢ Send order by the customer
➢ Receipt of the order
➢ Confirm order
➢ Dispatch order
After receiving the order request, condition exams are carried out to investigate whether it is
usual or unique order. After the form of order is recognized, dispatch activity is performed and
that is marked because the termination of the process.
Figure 4. Activity diagram of an order management system
This diagram is used to model the activities which can be nothing however trade requirements.
So the diagram has more affected on business working out as a substitute implementation details.
Following are the main usages of activity diagram:➢ Modeling work flow by using activities.
➢ Modeling business requirements.
➢ High level understanding of the system’s functionalities.
➢ Investigate business requirements at a later stage.

D. Rajagopal & K. ThilakavalliInternational Journal of Knowledge Content Development & Technology Vol.7, No.2, 5-20 (June, 2017) 15
8. State chart diagram
A State chart diagram describes a state machine. Now to make clear it state computer can be
defined as a computing device, which defines one-of-a-kind states of an object and these states
are managed by way of outside or interior movements.
8.1 Purpose of State chart diagram
State chart diagram is one of the five UML diagrams used to mannequin dynamic nature of
an approach. They outline exclusive states of an object for the duration of its lifetime. Additionally,
these states are modified by way of activities. So State chart diagrams are priceless to model reactive
techniques. Reactive methods may also be outlined as a system that responds to external or internal
events. State chart diagram describes the glide of manage from one state to an extra state. States
are defined as a condition in which an object exists and it changes when some event is precipitated.
Accordingly, the fundamental rationale of State chart diagram is to mannequin lifetime of an object
from creation to termination. State chart diagrams are additionally used for ahead and reverse engineer-
ing of a system. However, the fundamental rationale is to mannequin reactive system.
Following are the main purposes of using State chart diagrams:➢ To model dynamic aspect of a system.
➢ To model lifetime of a reactive system.
➢ To describe different states of an object during its lifetime.
➢ Define a state machine to model states of an object.
8.2 Procedure to draw the State chart diagram
State chart diagram is used to explain the states of one of kind objects in its lifestyles cycle.
Therefore, the emphasis is given on the state changes upon some interior or outside hobbies. These
states of objects are foremost to research and implement them effectively. State chart diagrams
are very fundamental for describing the states. States will also be identified because the of objects
when a distinct occasion happens.
Before drawing a State chartdiagram, we must have clarified the following points:➢ Identify important objects to be analyzed.
➢ Identify the states.
➢ Identify the events.
The following is an illustration of a State chart diagram where the state of Order object is analyzed.
The first state is an idle state from where the procedure begins. The subsequent states are arrived
for activities like ship request, verify request, and dispatch order. These pursuits are responsible
for state alterations of order object. Throughout the life cycle of an object it goes through the

D. Rajagopal & K. ThilakavalliInternational Journal of Knowledge Content Development & Technology Vol.7, No.2, 5-20 (June, 2017)16
following states and there may be some irregular exists also. This abnormal exit could occur because
of some predicament in the process. When the complete existence cycle is complete it is considered
because the complete transaction as mentioned beneath.
Figure 5. State chart diagram of an order management system
8.3 Uses of State chart diagrams
State chart diagrams are used to model states and likewise movements operating on the system.
When implementing a system it is rather essential to clarify distinctive states of an object for the
duration of its lifetime and state chart diagrams are used for this rationale. When these states and
hobbies are identified, they are used to model and these units are used for the duration of implementation
of the system. So the main usages can be described as:➢ To model object states of a system.
➢ To model reactive system. Reactive system consists of reactive objects.
➢ To identify events responsible for state changes.
➢ Forward and reverse engineering.
9. Component diagrams
Component diagrams are one-of-a-kind in phrases of nature and behavior. Component diagrams
are used to model physical features of a approach. So component diagrams are used to imagine

D. Rajagopal & K. ThilakavalliInternational Journal of Knowledge Content Development & Technology Vol.7, No.2, 5-20 (June, 2017) 17
the organization and relationships amongst add-ons in a system. These diagrams are also used to
make executable techniques.
9.1 Purpose of Component diagram
Component diagram is a unique kind of diagram in UML. The intent is also special from all other
diagrams discussed so far. It does not describe the performance of the system nevertheless; it describes
the components used to make these functionalities. So from that factor aspect diagrams are used to
visualize the bodily accessories in a approach. These add-ons are libraries, packages, documents,
and so forth. Aspect diagrams can also be described as a static implementation view of a method.
Static implementation represents the group of the add-ons at a targeted moment.
A single component diagram cannot represent the entire system but a collection of diagrams are
used to represent the whole.
So the purpose of the component diagram can be summarized as:➢ Visualize the components of a system.
➢ Construct executables by using forward and reverse engineering.
➢ Describe the organization and relationships of the components.
9.2 Procedure to draw Component diagrams
Component diagrams are used to describe the physical artifacts of a system. This artifact involves
documents, executables, and libraries and so on. Therefore, the motive of this diagram is specific,
Component diagrams are used during the implementation phase of an utility. Nevertheless, it is
ready good upfront to visualize the implementation important points. Firstly, the process is designed
utilizing distinct UML diagrams and then when the artifacts are able component diagrams are used
to get a notion of the implementation.
This diagram is very essential due to the fact without it the applying cannot be implemented
effectively. A well-prepared component diagram is also important for different points like utility efficiency,
renovation etc
Therefore, before drawing a component diagram the following artifacts are to be identified clearly:➢ Files used in the system.
➢ Libraries and other artifacts relevant to the application.
➢ Relationships among the artifacts.
Now after identifying the artifacts the following points needs to be followed:➢ Use a meaningful name to identify the component for which the diagram is to be drawn.
➢ Prepare a mental layout before producing using tools.
➢ Use notes for clarifying important points.
The following is an aspect diagram for order management system. Right here the artifacts are
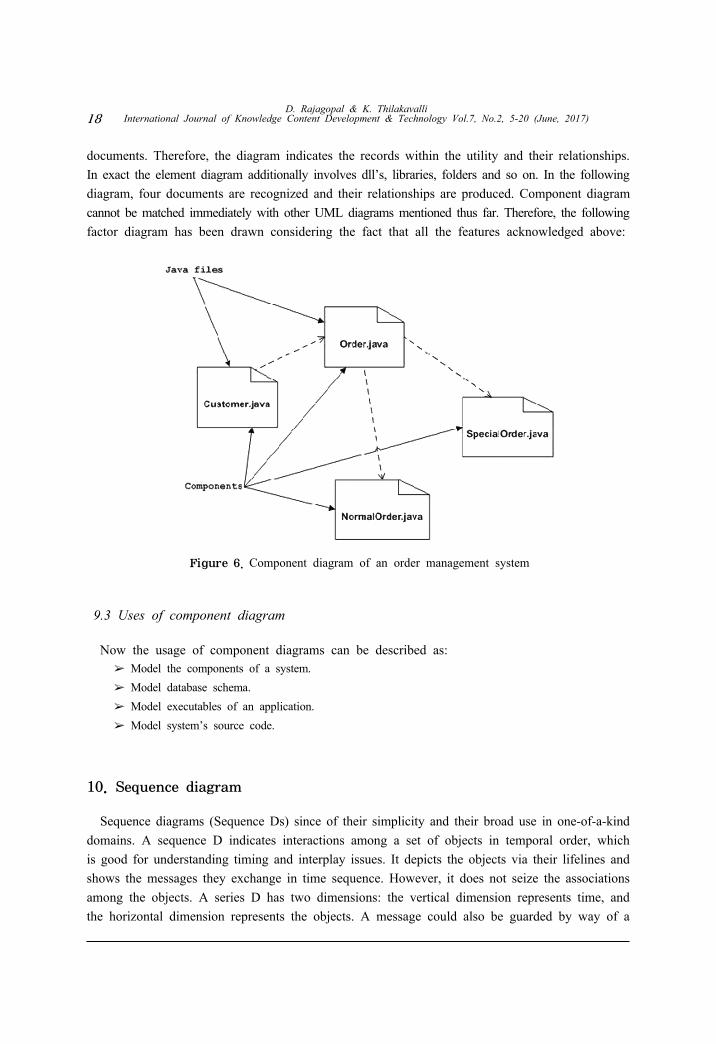
D. Rajagopal & K. ThilakavalliInternational Journal of Knowledge Content Development & Technology Vol.7, No.2, 5-20 (June, 2017)18
documents. Therefore, the diagram indicates the records within the utility and their relationships.
In exact the element diagram additionally involves dll’s, libraries, folders and so on. In the following
diagram, four documents are recognized and their relationships are produced. Component diagram
cannot be matched immediately with other UML diagrams mentioned thus far. Therefore, the following
factor diagram has been drawn considering the fact that all the features acknowledged above:
Figure 6. Component diagram of an order management system
9.3 Uses of component diagram
Now the usage of component diagrams can be described as:➢ Model the components of a system.
➢ Model database schema.
➢ Model executables of an application.
➢ Model system’s source code.
10. Sequence diagram
Sequence diagrams (Sequence Ds) since of their simplicity and their broad use in one-of-a-kind
domains. A sequence D indicates interactions among a set of objects in temporal order, which
is good for understanding timing and interplay issues. It depicts the objects via their lifelines and
shows the messages they exchange in time sequence. However, it does not seize the associations
among the objects. A series D has two dimensions: the vertical dimension represents time, and
the horizontal dimension represents the objects. A message could also be guarded by way of a

D. Rajagopal & K. ThilakavalliInternational Journal of Knowledge Content Development & Technology Vol.7, No.2, 5-20 (June, 2017) 19
situation, annotated by iteration or concurrency understanding, and/or restricted by way of an expression.
A sequence number representing the nested procedural calling sequence for the duration of the
situation, and the message signature can label each message.
Sequence numbers include a record of sequence elements separated by way of dots. Each and
every sequence aspect contains a quantity of constituents, corresponding to: a obligatory number
displaying the sequential role of the message, and a letter indicating a concurrent thread.
11. Conclusion
Object-oriented programming has turn out to be the typical; it is rather primary to have an under-
standing of the problems of retaining object-oriented software systems. Finally concluded that, through
this paper the UML diagrams like use case diagram, object diagram, class diagram, activity diagram,
state chart diagram, component diagram and sequence diagram studied and understood these kind
of diagrams are very useful in software engineering and it used to the programmer to realize and
develop the program efficiently.
References
Al-Fedaghi, S. (2011). Developing web applications. International journal of software engineering
and its applications, 5(2), 57-68.
Dr. Waralak V. Siricharoen. (2007). Ontologies and Object models in Object Oriented Software
Engineering. IAENG International Journal of Computer Science, 33(1), 1-6.
FarhadSoleimanianGharehchopogh, SamanJodatiGourabi, & Isa Maleki. (2014). Object Oriented
Software Engineering Models in Software Industry. International Journal of Computer
Applications, 95(3), 13-16.
Jakimi, A., & El Koutbi, M. (2009). An object-oriented approach to UML scenarios engineering
and code generation. International Journal of Computer Theory and Engineering, 1(1), 35.
K. K. Aggarwal, Yogesh Singh, Arvinder Kaur and Ruchika Malhotra. (2006). Software Design
Metrics for Object Oriented Software. Journal of object Technology, 6(1), 149-173.
Maniksharma, Gurdevsingh, Anish Arora and Parneetkaur. (2012). A Comparative Study of Statis
Object Oriented Metrics. International Journal of Advancements in Technology, 3(1), 25-34.
Sanjay Kumar Dubey. (2010). A Comprehensive Assessment of Object-Oriented Software Systems
Using Metrics Approach. International Journal on Computer Science and Engineering, 2(08),
2726-2730.
SHWETA SHARMA, & Dr S. SRINIVASAN. (2013). A review of Coupling and Cohesion metrics
in Object Oriented Environment. International Journal of Computer Science & Engineering
Technology (IJCSET), 4(8).
Shweta Srivastava, & Dr. Majhar Khaliq. (2014). Object Oriented Design for Testability: A Systematic
Review. International Journal of Advance Research in Computer Science and Management

D. Rajagopal & K. ThilakavalliInternational Journal of Knowledge Content Development & Technology Vol.7, No.2, 5-20 (June, 2017)20
Studies, 2(10).
Sunil, T. D., & Kurian, M. Z. (2014). A METHODOLOGY TO EVALUATE OBJECTORIENTED
SOFTWARE SYSTEMS USING CHANGE REQUIREMENT TRACEABILITY BASED
ON IMPACT ANALYSIS. International Journal of Software Engineering & Applications,
5(3), 47.
ZeynabRashidi. (2015). Optimizing Object Design Model in Software Engineering. International
Journal of Advanced Research in Computer Science and Software Engineering, 5(9).
[ About the authors ]
Mr. D. Rajagopal, he has completed his Bachelor of Computer Science degree
and completed his Master of Computer Applications degree in Periyar University
in the year 2003 and 2006 respectively. He completed his Master of Philosophy
in PRIST University in the year of 2012. He has 3 Years and 10 Months Experience
in the field of Software Developing and 6 Years and 6 months Experience in the
field of Teaching. He published 10 International Journal papers and a National
Conference paper. He delivered more than 10 seminar & training programs for different
Academic Institutions. His research area of Interest is Computer Networks (Wireless & Wired), Image
Processing, Mobile Computing, Data Mining, Software Programming (OOPS). He is the life time member
of MISTE, MIAENG. Currently I am working as an assistant professor in the department of computer
science, Vivekanandha College of Arts and Sciences for women, Tiruchengode.
Mrs. K. Thilakavalli, She has completed her Bachelor of Physics degree in
Bharathiar University in the year of 2006. She completed her Master of Computer
Applications degree in Anna University in the year 2009. She completed her
Master of Philosophy in PRIST University in the year of 2010. She has 6 Years
6 months experience in the field of Teaching. She published 10 International
Journal papers, three International Conference papers, and two National Conference
papers. Her research area of Interest is Image Processing, Computer Networks
(Wireless & Wired), Mobile Computing, Data Mining. Currently she is working as an Assistant
Professor in the Department of Computer Applications in Karpagam Academy of Higher Education,
Karpagam University, Coimbatore, Tamilnadu, India.