a successful replacement of conventional …
TRANSCRIPT

A SUCCESSFUL REPLACEMENT OF CONVENTIONAL ORGANOPHILIC CLAY
WITH A NEW POLYMER AS VISCOSIFIER AND FILTRATION CONTROL
AGENT IN MINERAL-OIL-BASED DRILLING MUDS
A Thesis
by
JAIRO A. CORTES
Submitted to the Office of Graduate and Professional Studies of
Texas A&M University
in partial fulfillment of the requirements for the degree of
MASTER OF SCIENCE
Chair of Committee, Hisham Nasr-El-Din
Committee Members, Jerome Schubert
Mahmoud El-Halwagi
Head of Department, Jeff Spath
August 2018
Major Subject: Petroleum Engineering
Copyright 2018 Jairo A. Cortes

ii
ABSTRACT
Oil-based drilling fluids (OBDF) can enhance wellbore stability in water-
sensitive reservoirs and protect metal surfaces of drilling equipment to minimize
corrosion due to H2S and CO2. Components of OBDF include oil as the continuous
phase and water as the dispersed phase, in conjunction with viscosifiers, emulsifiers,
filtration control agents, and weighting materials. Two of the most common types of
continuous phases in oil-based drilling fluids are diesel and mineral oil. Mineral oil is
less toxic than diesel, and oil retention properties of OBDF with mineral oil are less than
OBDF with diesel. Organophilic clays are clay minerals that have been treated with oil-
wetting agents, which will make the clay oil-dispersible. Organophilic clays mixed in
OBDF do not exhibit same viscosity or suspension characteristics as in water-based
drilling fluids, because electrical interaction between particles is minimal, making it
difficult to build viscosity and gel strength in high pressure and high temperature
(HP/HT) wellbore conditions. A new mineral-oil-based drilling fluids (MOBDF)
proposed was obtained by the successful replacement of conventional organophilic clay
additives with a methylstyrene/acrylate copolymer.
Two different drilling fluid formula, one containing conventional organophilic
clay additives and the other containing the replacement polymer as a viscosifier and
filtration control agent, were hot rolled at 150°F for 16 hours. To evaluate the alteration
of the wettability caused by the MBDOF and its components contact-angle
measurements were made in the laboratory. With similar weight proportions, the
apparent and kinetic viscosities of organophilic clay and cross-linked polymer were also
iii
compared.
Rheological properties and filtration characteristics tests were conducted using a
rotational viscometer and a HP/HT filter press, under three simulated wellbore
conditions (140°F/ 300 psi, 190°F/300 psi, and 250°F/500 psi). Filter cake is formed due
to positive pressure between OBDF and pore throat pressure. As a barrier between
wellbore and formation, it can minimize solids and fluids invasion. A core flooding test
was conducted to evaluate permeability of the filter cakes and CT scan was used to
measure the density distribution of the filter cakes. Emulsion droplets formed by mixing
MOBDF filtrate fluids with formation water were observed to analyze emulsion
plugging damage.
Experimental results show that the novel polymer has a promising future of
practical application, by providing thermal stability and stable rheological properties for
MOBDF in HP/HT conditions. It also yields lower filtration volume, higher quality filter
cake and a slightly greater emulsion plugging capabilities and greater formation
permeability retention than organophilic clay-based drilling fluids.

iv
DEDICATION
I would like to dedicate this project to:
My beloved mother Daissy, my source of inspiration.
My brother Johnny, my best friend.
My fiancé Sofía, my love, happiness, and unconditional support.
Thank you all for your everlasting love and warm encouragement throughout this
process.
God bless you.

v
ACKNOWLEDGEMENTS
I would like to express my sincere thanks and appreciation to Dr. Hisham Nasr-
El-Din for his invaluable guidance and support during my stay at Texas A&M
University and for serving as chair of my advisory committee.
I would like to extend my gratitude to Dr. Jerome Schubert and Dr. Mahmoud El-
Halwagi for serving as members of the advisory committee and for their vital
cooperation throughout the course of this research.
Finally, I would like to thank my good friends and colleagues Jing Zhou, Tariq
Almubarak, Omar Mahmoud, Ahmed Elsarawy, Mina Shaker, and my TAMU
Colombian family for making this such a wonderful experience.

vi
CONTRIBUTORS AND FUNDING SOURCES
Contributors
This work was supported by a thesis committee consisting of Professors Dr.
Hisham Nasr-El-Din and Professor Jerome Schubert of the Department of Petroleum
Engineering and Professor Mahmoud El-Halwagi of the Department of Chemical
Engineering.
All work for the thesis was completed by the student, in collaboration with
Professor Hisham Nasr-El-Din of the Department of Petroleum Engineering and the
assistance of PhD candidate Jing Zhou.
Funding Sources
Graduate study was supported by a fellowship from Texas A&M University

vii
NOMENCLATURE
API American Petroleum Institute
BHA Bottom hole assembly
CT scanner Computed tomography scanner
CTN CT number
ECD Equivalent circulating density
HP/HT High pressure/high temperature
MODF Mineral oil-based drilling fluid
OBDF Oil-based drilling fluid
OBM Oil-based mud
P Pressure
psi lb/in2
PV Plastic viscosity, Pore Volume
RPM Revolutions per minute
ROP Rate of penetration
S.G. Specific gravity
SBF Synthetic-based fluids
T Temperature
vol.% Volume percent
wt% Weight percent
WBDF Water-based drilling fluid
WBM Water-based mud
XRD X-ray diffraction
YP Yield point

viii
TABLE OF CONTENTS
Page
ABSTRACT .......................................................................................................................ii
DEDICATION .................................................................................................................. iv
ACKNOWLEDGEMENTS ............................................................................................... v
CONTRIBUTORS AND FUNDING SOURCES ............................................................. vi
NOMENCLATURE .........................................................................................................vii
TABLE OF CONTENTS ............................................................................................... viii
LIST OF FIGURES ........................................................................................................... xi
LIST OF TABLES .......................................................................................................... xvi
1. INTRODUCTION ...................................................................................................... 1
1.1 Problem Statement ................................................................................................ 2
1.2 Antecedents ........................................................................................................... 4
1.3 Research Objectives ............................................................................................ 15
2. LITERATURE REVIEW ......................................................................................... 17
2.1 Fundamentals of Drilling Fluids ......................................................................... 17
2.1.1 Types of Drilling Fluids .............................................................................. 18
2.1.2 Rheology ...................................................................................................... 25
2.1.3 Rheological Models ..................................................................................... 31
2.2 Functions of Drilling Fluids ................................................................................ 39
2.3 Composition of Oil-Based Drilling Fluids .......................................................... 42
2.4 Rheology Properties and Filtration Control of Oil-Based Drilling Fluids .......... 44

ix
2.4.1 Funnel Viscosity .......................................................................................... 44
2.4.2 Apparent viscosity (AV) .............................................................................. 45
2.4.3 Effective viscosity ....................................................................................... 45
2.4.4 Plastic Viscosity (PV) .................................................................................. 45
2.4.5 Yield Point (YP) .......................................................................................... 46
2.4.6 Gel Strength ................................................................................................. 46
2.4.7 Filtration Control ......................................................................................... 48
3. MATERIALS, LABORATORY EQUIPMENT, AND METHODOLOGY............ 50
3.1 Materials ............................................................................................................. 50
3.1.1 Cores and Minerology ................................................................................. 50
3.1.2 Oil-Based Drilling Fluid Formulas .............................................................. 52
3.2 Laboratory Equipment ........................................................................................ 56
3.2.1 Mixer ........................................................................................................... 56
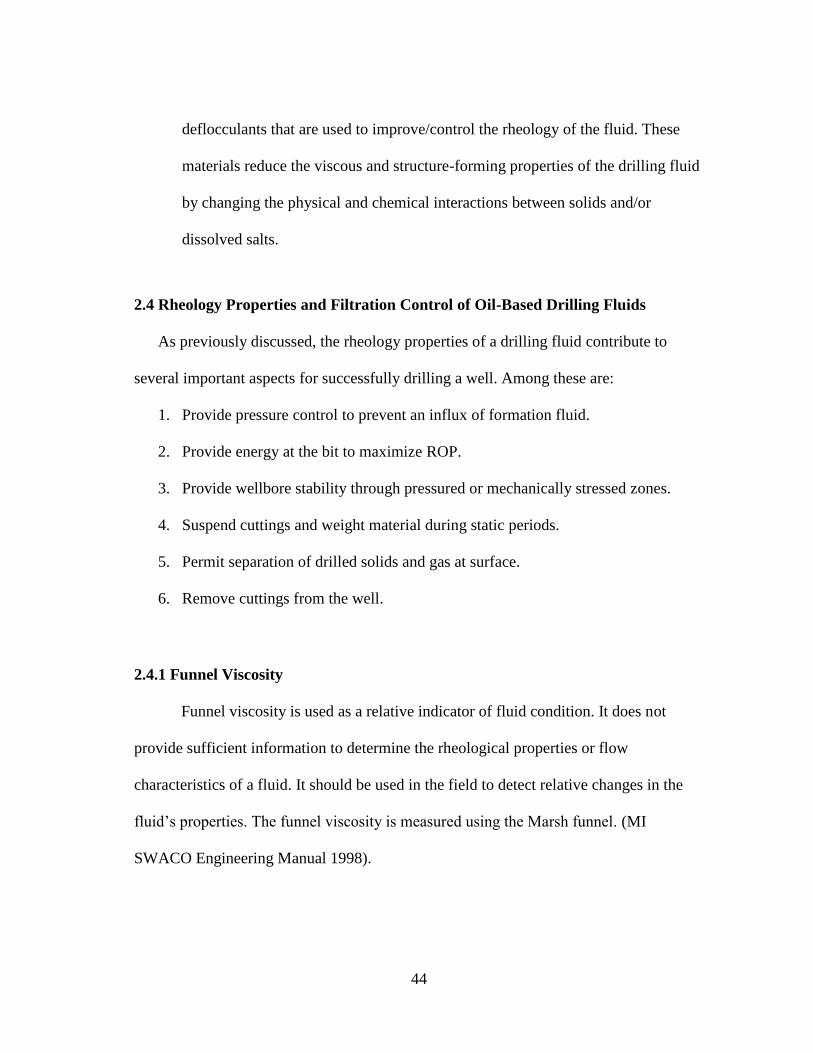
3.2.2 Viscometer and Rheometer ......................................................................... 57
3.2.3 Mud Balance ................................................................................................ 59
3.2.4 4-Roller and 5-Roller Oven and Aging Cell ................................................ 60
3.2.5 Dynamic HP/HT Filter Press ....................................................................... 60
3.2.6 CT-Scanner .................................................................................................. 62
3.2.7 Core Flow Setup .......................................................................................... 64
3.2.8 Drop Shape Analyzer .................................................................................. 65
3.3 Methodology / Plan of Action ............................................................................ 67
4. RESULTS OF EXPERIMENTS ............................................................................... 68
4.1 Chemical Composition of Additives Used in MOBDF A and B ........................ 68
4.1.1 Viscosifier in MOBDF A ............................................................................ 68
4.1.2 HT Filtration Control Additive in MOBDF A ............................................ 69
4.1.3 Polymer Additive in MOBDF B .................................................................. 71
4.2 Rheological Properties of MOBDF A and B ...................................................... 72
4.3 Filtration Control of MOBDF A and B .............................................................. 77
4.4 Filter Cake Thickness ......................................................................................... 83
4.5 Filter Cake Porosity ............................................................................................ 86
4.6 Porosity Determination ....................................................................................... 86
4.7 Filter Cake Removal Efficiency.......................................................................... 88
4.8 Filter Cake Permeability ..................................................................................... 90
4.9 Evaluation of Formation Damage ....................................................................... 91
4.9.1 Retained Permeability ................................................................................. 91
4.9.2 Rock Wettability .......................................................................................... 93

x
5. CONCLUSIONS ....................................................................................................... 97
6. FUTURE WORK ...................................................................................................... 98
REFERENCES ............................................................................................................... 100

xi
LIST OF FIGURES
Page
Figure 1. Zero barite sag incidents on wells drilled with clay-free SBF.
Reprinted from Burrows et al. (2004). ............................................................... 5
Figure 2. PWD comparison between System and conventional IO SBF
during field trial. Reprinted from Burrows et al. (2004). .................................. 6
Figure 3. ECD comparisons conventional OBM vs. low ECD OCF-IEF to FG.
Reprinted from Mahrous et al. (2016). .............................................................. 8
Figure 4. Using clay-free SBF with a low SWR significantly reduced base
oil dilution requirements. Reprinted from Ackal and Gillikin (2010). .............. 9
Figure 5. Brookfield testing on clay-free IEF compared to traditional IEF to
highlight the strength of the polymer interactions and
their ability to break. Reprinted from Rødsjø and Akutsu (2013). .................. 13
Figure 6. Increased ECD impact to the fluid density recorded on surface
showing a much more progressive profile, increasing the potential for
losses in this section. Reprinted from Rødsjø and Akutsu (2013). .................. 14
Figure 7. ECD impact to the fluid density recorded on surface.
The ECD production was low enough not to induce losses.
Reprinted from Rødsjø and Akutsu (2013). .................................................... 14
Figure 8. Days versus depth curve. Reprinted from Rødsjø and Akutsu (2013). ............ 15
Figure 9. Drilling fluids classification by composition. ................................................... 18
Figure 10. General fluid grouping by flow behavior. Reprinted from Ibeh (2007). ........ 19

xii
Figure 11. Composition of 11-lbm/gal water-based mud. Reprinted from
Bourgoyne et al. (1991). .................................................................................. 21
Figure 12. Composition of 11-lbm/gal oil-based mud. Reprinted from
Bourgoyne et al. (1991). .................................................................................. 23
Figure 13. Deformation of a Fluid by Simple Shear. Reprinted from Rabia (2001). ...... 26
Figure 14. Shear-thinning effect in Non-Newtonian fluids. Reprinted from
MI SWACO Engineering Manual (1998). ....................................................... 29
Figure 15. Effect of shear rate on effective viscosity of Non-Newtonian fluid.
Reprinted from MI SWACO Engineering Manual (1998). ............................. 30
Figure 16. Two-Plates-Model of viscosity. Reprinted from Quora.com ......................... 31
Figure 17. Shear stress vs. shear rate for a Newtonian Fluid. Reprinted from
Baker Hughes Drilling Fluids Reference Manual (2006). ............................... 32
Figure 18. Shear stress vs. shear rate for a Bingham plastic fluid. Reprinted
from Baker Hughes Drilling Fluids Reference Manual (2006). ...................... 33
Figure 19. Shear stress vs. shear rate for a Power Law Fluid. Reprinted from
Baker Hughes Drilling Fluids Reference Manual (2006). ............................... 35
Figure 20. Shear stress vs. shear rate for a Herschel-Bulkley Fluid. Reprinted from
Mitchell and Miska (2011). ............................................................................. 36
Figure 21. Shear stress versus shear rate for various rheological models.
Reprinted from Baker Hughes Drilling Fluids Reference Manual (2006). ..... 38
Figure 22. Different types of gel strengths. Reprinted from Xie (2001). ......................... 48
Figure 23. Indiana Limestone core. .................................................................................. 51
xiii
Figure 24. X-ray diffraction spectrum of the weighting material (CaCO3) sample. ........ 53
Figure 25. Compositon of the weighting material (CaCO3) sample. ............................... 53
Figure 26. Hamilton Multi-mixer Model 9B. ................................................................... 56
Figure 27. (Left) Grace M3600 Viscometer. (Right) Grace M5600
HP/HT Rheometer. .......................................................................................... 57
Figure 28. Baroid Mud Balance Model 140. .................................................................... 59
Figure 29. OFITE 4-Roller and 5-Roller Oven and Aging Cell. ...................................... 60
Figure 30. OFITE Dynamic HP/HT Filter Press. ............................................................. 61
Figure 31. CT Scanning unit at the Harold Vance Department
of Petroleum Engineering. ............................................................................... 63
Figure 32. Core-flood set up. ........................................................................................... 65
Figure 33. Kross Drop shape analyzer (DSA 100). .......................................................... 66
Figure 34. X-ray diffraction spectrum of organophilic clay viscosifier sample. ............. 68
Figure 35. Composition of organophilic clay viscosifier sample. .................................... 69
Figure 36. X-ray diffraction spectrum of the organophilic lignite sample. ...................... 70
Figure 37. Composition of the of the organophilic lignite sample. .................................. 70
Figure 38. Polymer A ....................................................................................................... 72

xiv
Figure 39. Apparent viscosity behavior of MOBDF A at different
shear rates and temperatures. ........................................................................... 74
Figure 40. Apparent viscosity behavior of MOBDF B at different
shear rates and temperatures. ........................................................................... 74
Figure 41. Apparent viscosity comparison between
MOBDF A and B at 140oF. ............................................................................. 75
Figure 42. Apparent viscosity comparison between
MOBDF A and B at 190oF. ............................................................................. 76
Figure 43. Apparent viscosity comparison between
MOBDF A and B at 250oF. ............................................................................. 77
Figure 44. Cumulative filtrate volume as a function of the square root
of the time under static conditions for MOBDF A
at 140, 190, and 250oF. .................................................................................... 79
Figure 45. Cumulative filtrate volume as a function of the square root
of the time under static conditions for MOBDF B
at 140, 190, and 250oF ..................................................................................... 80
Figure 46. Cumulative filtrate volume as a function of the square root
of the time under static conditions. Comparison between
MOBDF A and B at 140oF. ............................................................................. 81
Figure 47. Cumulative filtrate volume as a function of the square root
of the time under static conditions. Comparison between
MOBDF A and B at 190oF. ............................................................................. 82
Figure 48. Cumulative filtrate volume as a function of the square root
of the time under static conditions. Comparison between
MOBDF A and B at 250oF. ............................................................................. 83
Figure 49. Filter cake thickness formed by MOBDF A at 140oF/300 psi. ....................... 84

xv
Figure 50. Filter cake thickness formed by MOBDF A at 190oF/300 psi. ....................... 84
Figure 51. Filter cake thickness formed by MOBDF A at 250oF/500 psi. ....................... 85
Figure 52. Filter cake thickness formed by MOBDF B at 140oF/300 psi. ....................... 85
Figure 53. Filter cake thickness formed by MOBDF B at 190oF/300 psi. ....................... 85
Figure 54. Filter cake thickness formed by MOBDF B at 250oF/500 psi. ....................... 86
Figure 55. Contact angle measurement of disk 1 at 250oF/500 psi. ................................. 94
Figure 56. Contact angle measurements of disk 2 and 4.
Using MOBDF A at 250oF/500 psi. ................................................................ 95
Figure 57. Contact angle measurements of disk 3 and 5.
Using MOBDF B at 250oF/500 psi. ................................................................. 95

xvi
LIST OF TABLES
............................ Page
Table 1. Fluid properties tracked from laboratory to field.
Reprinted from Mahrous et al. (2016).................................................................. 7
Table 2. Average and Maximum Rates of Penetration.
Reprinted from Ackal and Gillikin (2010). ........................................................ 11
Table 3. Properties of the Indiana Limestone cores. ........................................................ 50
Table 4. Minerology of the Indiana Limestone cores. ..................................................... 50
Table 5. Properties of the Weighting Material. ................................................................ 52
Table 6. Properties of the Mineral Oil Escaid 110. .......................................................... 54
Table 7. MOBDF A Formula. .......................................................................................... 54
Table 8. MOBDF B Formula. .......................................................................................... 55
Table 9. CT scanning settings. ......................................................................................... 64
Table 10. MOBDF A properties after aging at 150oF for 16 hrs. ................................... 73
Table 11. MOBDF B properties after aging at 150oF for 16 hrs. ..................................... 73
Table 12. Comparison between MOBDF A and B properties at 140oF. .......................... 75
Table 13. Comparison between MOBDF A and B properties at 190oF. .......................... 76
Table 14. Comparison between MOBDF A and B properties at 250oF. .......................... 77

xvii
Table 15. Spurt Loss MOBDFs. ....................................................................................... 80
Table 16. Cumulative Filtrate Volume MOBDFs. ........................................................... 81
Table 17. Initial porosity of Indiana Limestone cores...................................................... 87
Table 18. Porosity of the filter cakes formed by the MOBDFs. ...................................... 88
Table 19. Efficiency of filter cake removal for MOBDF A ............................................ 89
Table 20. Efficiency of filter cake removal for MOBDF B ............................................. 90
Table 21. Filter cake permeability using MOBDF A and B. ........................................... 91
Table 22. Retained Permeabilities .................................................................................... 93
Table 23. Minerology of Berea sandstone cores .............................................................. 94
Table 24. DSA contact angle measurements. ................................................................... 96
Table 25. MOBDFs breakdown efficiency. ..................................................................... 96

1
1. INTRODUCTION
The success of the completion of an oil or gas well and its cost depends
substantially on four principal factors:
1. Bit rate of penetration (ROP)
2. Drill bit cleaning, cooling and lubrication
3. Drill cutting suspension and transportation to the surface
4. Support or integrity of the wellbore
Drilling fluids, also referred to as drilling muds, are added to the wellbore to
facilitate the drilling process affecting all the factors previously mentioned. The drilling
fluid’s density and ability to penetrate the formation have an effect on the rate of the
penetration. The hydraulic energy expended on the bottom of the hole and the apparent
viscosity and flow rate of the drilling fluid affect the cutting transport. The ability of the
fluid to form an impermeable filter cake and the ability to control formation pressures
affect and the stability and integrity of the wellbore (De Stefano 2013).
The continuously increasing worldwide demand for energy over the past decade
has driven oil and gas companies to drill deeper and hotter wells. As wells get deeper,
drilling fluids have taken on increased importance, serving a number of purposes and
solving a variety of problems that vary greatly from place to place. Operating under
these harsh conditions has motivated our industry to develop new robust drilling fluid
systems capable of safely performing under these circumstances.
2
Oil-based drilling fluids were developed to help maximize rates of penetration,
increase lubricity in directional and horizontal wells, and minimize wellbore stability
problems such as those caused by reactive shales. Until operators began drilling in deep
water locations, where the pore pressure/fracture gradient (PP/FG) margin is often very
narrow, the standard formulations provided satisfactory performance (Golis 1984).
Consistent rheology is crucial for the successful construction of these oil/gas wells. High
pump pressures mean high equivalent circulating densities (ECDs) at the bottom of the
well, increasing the probability of losses. Fluid losses in deep water wells can be costly,
considering the difficult logistics (Dhanashree Kulkarni and Shadaab Maghrabi 2014).
1.1 Problem Statement
When drilling deep wells, a narrow drilling margin (mud-weight windows) is a
key challenge to the drilling operation, thus the selection of the drilling fluid system is
crucial. The selected fluid system must be capable of delivering low equivalent
circulating density (ECD) margins to mitigate the risk of exceeding the formation
fracture gradient (Mahrous et al. 2016), a more stable and controllable fluid rheology
(Burrows et al. 2004), and economically viable.
Oil-based drilling fluids containing organophilic clays additives do not exhibit
same viscosity or suspension characteristics as in water-based drilling fluids due to the
electrical interaction between particles is minimal, making it difficult to build viscosity
and gel strength in high pressure and high temperature (HP/HT) wellbore conditions
(Schmidt et al. 1987).

3
By switching from a standard oil-based drilling fluid, containing organophilic
clay additives, to the use of a novel clay-free mineral oil-based drilling fluid (MBODF),
the drilling operation will benefit from a drilling fluid capable of performing under these
desired conditions, an overall reduction in logistics; a reduction in volume of fluid and
material needed, along with higher rates of penetration (ROP) due to lower equivalent
circulating densities (ECDs), and form a non-damaging thin filter cake that would
eliminate the need for costly and time consuming clean-up treatments (Martini et al.
2017).
Organophilic clays are most widely used as primary viscosifier for oil-based
drilling fluids and synthetic-based drilling fluids. Bentonite is an organophilic clay that
has been treated with an amine to make it yield in oil. However, organophilic clay
requires significant shear and circulating time to yield fully. Overtreatment resulting
from this delayed response often causes excessive viscosity, and the problem is
compounded when the fluid is at ambient temperature or worse, is exposed to cold
temperatures at the seabed in deep water locations (Methven and Baumann 1972).
There is a need to develop a fluid that produces higher gel strengths initially and
maintains a relatively flat response to temperature throughout the complete temperature
cycle of the drilling operation. Organophilic clays do not provide the viscosity or
suspension characteristics in the same way that clay solids do in water-based fluids.

4
1.2 Antecedents
In 2001, Burrows et al. (2004) first introduced an oil-based mud formulated
entirely without commercial clays or lignites in the Gulf of Mexico. Rheological
properties were controlled through the emulsion characteristics; a radical departure from
accepted solids suspension mechanisms. The behavior of this unique fluid changed the
perception about what constitutes a “good mud.”
The clay-free, emulsion-based fluid system consistently prevented detectable
barite sag on 80+ wells drilled. Based on observed fluid densities after long static
periods (an 8-day logging run in one case) and verified by modular dynamic test (MDT)
log data on numerous high-angle wells, the fluid’s unique emulsion structure and wetting
characteristics prevented settling of barite and other solids as shown in Figure 1.

5
Figure 1. Zero barite sag incidents on wells drilled with clay-free SBF. Reprinted from
Burrows et al. (2004).
In addition to preventing barite sag, the System has provided other important
field-documented performance advantages:
1. Whole mud losses reduced by an average of 60% while drilling, running casing,
and cementing (with 80% reductions reported on several deep water wells).
2. Significantly lower ECDs, validated by pressure while drilling (PWD) data. As
shown in Figure (2).
3. High, flat gel strengths that break with minimal initiation pressure, validated by
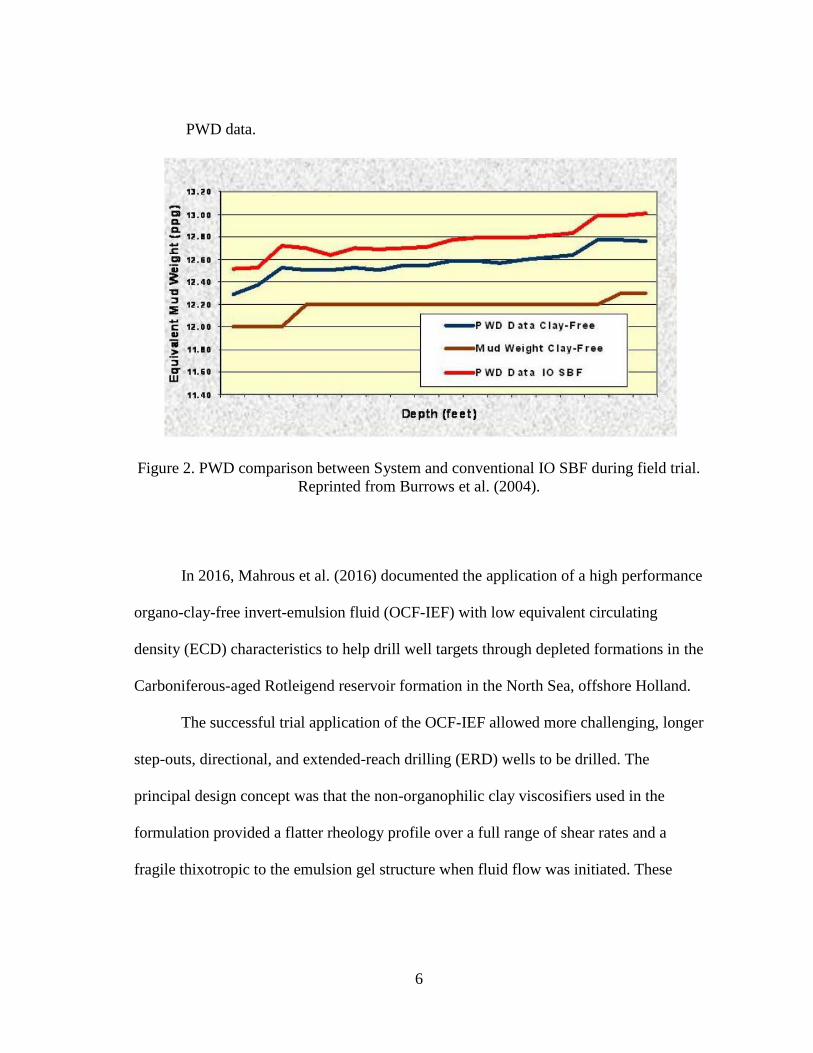
6
PWD data.
Figure 2. PWD comparison between System and conventional IO SBF during field trial.
Reprinted from Burrows et al. (2004).
In 2016, Mahrous et al. (2016) documented the application of a high performance
organo-clay-free invert-emulsion fluid (OCF-IEF) with low equivalent circulating
density (ECD) characteristics to help drill well targets through depleted formations in the
Carboniferous-aged Rotleigend reservoir formation in the North Sea, offshore Holland.
The successful trial application of the OCF-IEF allowed more challenging, longer
step-outs, directional, and extended-reach drilling (ERD) wells to be drilled. The
principal design concept was that the non-organophilic clay viscosifiers used in the
formulation provided a flatter rheology profile over a full range of shear rates and a
fragile thixotropic to the emulsion gel structure when fluid flow was initiated. These

7
features of the fluid resulted in the low ECD characteristics. Table 1 shows the fluid
properties tracked from laboratory to field.
Table 1. Fluid properties tracked from laboratory to field. Reprinted from Mahrous et al.
(2016).
Despite the complexity of drilling the section, the fluids provider and operator
managed to reach the top of the reservoir with the OCF-IEF system. Figure 3 shows an
ECD comparison concluding a reduction of 7.5 to 8.6% (actual/planned) using the low
ECD OCF-IEF system, versus 1.07% using conventional OBM. This drilling fluid
system, with its success, allowed many of the future longer step-out, directional, ERD,
and wellbore stability issues to be reduced during drilling operations of this magnitude.

8
Figure 3. ECD comparisons conventional OBM vs. low ECD OCF-IEF to FG. Reprinted
from Mahrous et al. (2016).
Ackal and Gillikin (2010) documented a seven-well development program in the
Gulf of Mexico. The high-angle (54°-73°) 9-7/8” production intervals had shallow kick-
off points (in one instance 70° by 3000 ft TVD, 30° average azimuth change, high of
67°). The complex well paths had proven difficult to drill with water-based fluids
(WBF). Wellbore stability and torque and drag issues added to non-productive time
(NPT). Previous wells drilled with WBF experienced slow penetration rates, multiple
wiper trips, and one lost directional bottomhole assembly (BHA). The decision was
made to use an organophilic clay-free synthetic-based fluid (SBF) on the seven-well
project.

9
The clay-free SBF could run with a low synthetic oil-to-water ratio (SWR) in the
range of 70/30 to 75/25 SWR as compared to the 80/20 SWR typically needed for
conventional SBFs. Gels remained low and flat, even when the low gravity solids (LGS)
content reached 15% on one well. The lower SWR values and reduced base oil dilution
requirements helped keep fluid maintenance costs low. Shown in Figure 4.
Figure 4. Using clay-free SBF with a low SWR significantly reduced base oil dilution
requirements. Reprinted from Ackal and Gillikin (2010).
The use of the clay-free SBF allowed the operator to drill the wells considerably
faster, at times drilling over 2,000 ft. per day despite the high percentage of LGS. No
wellbore instability issues occurred, trips went smoothly and casing was run to bottom
on every well. Four of the seven original wells reached total depth at 21% below
10
authority for expenditures (AFE) cost, and several sidetracks were drilled for geologic
reasons using the same clay-free system.
The clay- free system provides the expected benefits of an SBF yet can be run
with a lower SWR than a conventional clay-based SBF, reducing base oil requirements.
The clay-free system selected for the development contained zero organophilic clay or
lignite additives, so the solids content was inherently lower than that of conventional
SBFs. The emulsion chemistry provided the yield point values and gel strengths required
for good suspension and sag prevention, while exhibiting shear-thinning behavior for
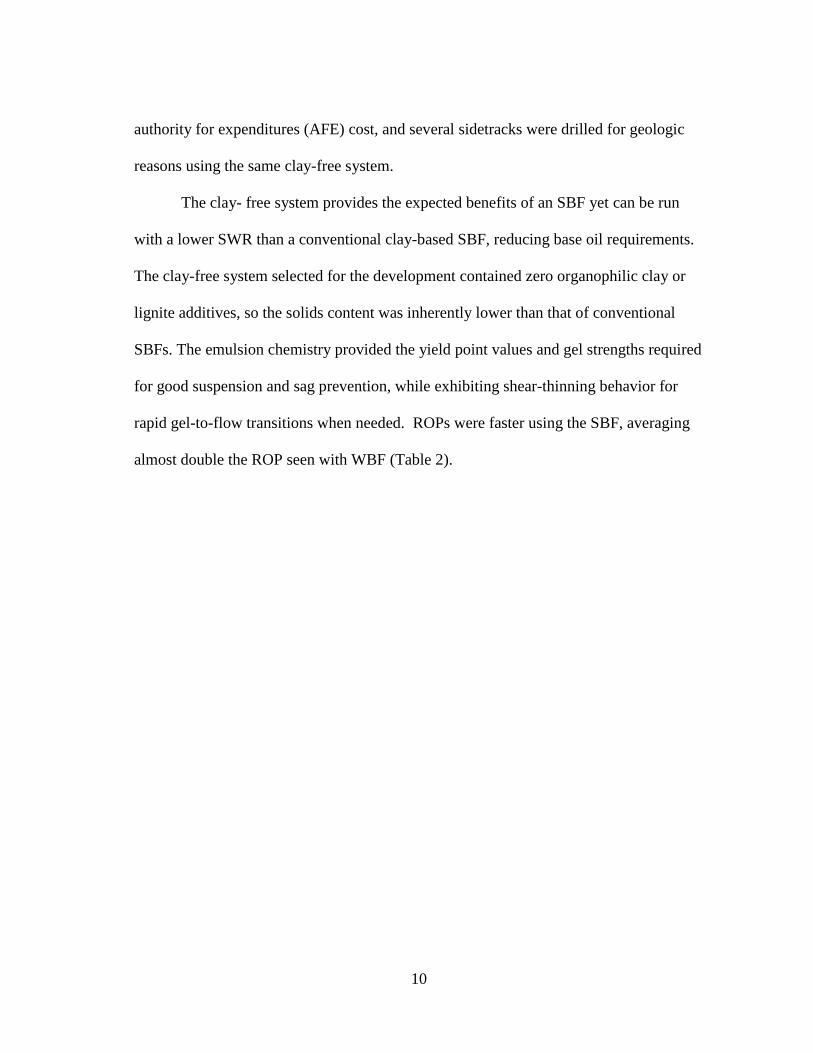
rapid gel-to-flow transitions when needed. ROPs were faster using the SBF, averaging
almost double the ROP seen with WBF (Table 2).
11
Table 2. Average and Maximum Rates of Penetration. Reprinted from Ackal and
Gillikin (2010).
As previously mentioned, invert emulsion fluids require organophilic clays to
provide viscosity and suspension characteristics. While effective, these drilling fluids are
prone to stratification in certain conditions, slow chemical reaction times, high pressure
spikes, and high ECDs.
Rødsjø and Akutsu (2013) described the first application of a clay-free IEFs in
the Norwegian continental shelf. The clay-free IEF was used to drill into a section
exhibiting temperatures greater than 160°C. Chemical consumption was substantially
lower compared to previous wells using traditional IEF systems, thus reducing shipping

12
requirements. The polymer chemistry in the clay-free IEF provided a significant
resistance to cold temperature and the rheology was significantly lower than those
measured in conventional IEFs at low temperatures (e.g., 4oC), an important observation
for fluid viscosity in deep water marine risers.
Brookfield testing was performed on this fluid, as shown in Figure 5, and
compared to traditional fluid to highlight the strength of the polymer interactions and
their ability to break. Relative to other IEFs, clay-free IEFs exhibited a unique low end
rheology signature, which deviated from conventional IEF systems at low shear rates.
This demonstrates the increasingly formation of the strong gels as the shear rate is
“stepped down” to low shear rates below 3 rev/min, and helps explain the excellent fluid
stability observed in the field.

13
Figure 5. Brookfield testing on clay-free IEF compared to traditional IEF to highlight the
strength of the polymer interactions and their ability to break. Reprinted from Rødsjø
and Akutsu (2013).
When comparing the ECDs, it was clear that there was much better ECD control
obtained with the clay-free IEF relative to the traditional organophilic clay-based IEF
(Figs. 6 and 7). This comparison demonstrates the impact of increased ECDs recorded
by the PWD downhole tools. The clay-free graph (Fig. 7) highlights that the ECD
production was low enough not to induce losses.

14
Figure 6. Increased ECD impact to the fluid density recorded on surface showing a much
more progressive profile, increasing the potential for losses in this section. Reprinted
from Rødsjø and Akutsu (2013).
Figure 7. ECD impact to the fluid density recorded on surface. The ECD production was
low enough not to induce losses. Reprinted from Rødsjø and Akutsu (2013).

15
The days versus depth curve shown in Figure 8 demonstrated a clear
improvement compared to planned days. The well was placed in the 95th percentile of
the Rushmore comparison, demonstrating that the well was drilled efficiently and safely.
Figure 8. Days versus depth curve. Reprinted from Rødsjø and Akutsu (2013).
1.3 Research Objectives
The objectives of this work are:
1. Develop a novel mineral-oil-based drilling fluid (MOBDF) formula by replacing
all organophilic clay additives with a novel polymer as a viscosifier and filtration
control agent.
2. Evaluate the viscosity and suspension characteristics of the novel MODF and
compare them to a MODF containing organophilic clay additives.

16
3. Evaluate the rheological, thermal stability, and filtration control properties of the
novel MOBDF.
4. Evaluate the filter cake removal effectiveness of the novel MOBDF.
5. Determine if formation damage is caused by the novel MOBDF.

17
2. LITERATURE REVIEW
2.1 Fundamentals of Drilling Fluids
Drilling fluids are one of the most crucial elements of any drilling operation. The
drilling fluid, or drilling mud, term used because of the thick consistency of the
formulation, has several functions which all must be optimized to ensure safety and
minimize hole problems.
In 1833 a French engineer named Flauville was watching a cable tool drilling
operation in which the drilling apparatus struck water. He realized that the gushing water
was very effective in lifting the cuttings out of the well. The principle of using moving
fluid to remove cuttings from the well bore was established. He conceived of an
assembly in which water would be pumped down the inside of a drilling rod and carry
cuttings with it as it returned to the surface in the space between the drilling rod and the
wall of the well bore. (Rabia 2001).
The early simple drilling fluids quickly gave way to increasingly “engineered”
systems. To better protect the target formations, additives were developed for improved
rheology and fluid-loss control, shale inhibition, and resistance to contamination.
Laboratory and field-test procedures became more sophisticated as drilling-fluid
companies and oil and gas operators sought correlations between surface measurements
and downhole conditions. Under conditions in which bentonite and other clay additives
proved inadequate, organic and synthetic polymers were substituted as viscosifiers and
fluid-loss-control agents. (Mitchell and Miska 2011).

18
The success of the drilling operation strongly depends on the selection of the
drilling fluid. Because drilling conditions vary widely, factors such as: the selection of
the base liquid (the continuous fluid phase of the drilling mud), environmental
restrictions, drill cuttings transport, interactions of the chemical additives with the
formation, and the control of the drilling fluid properties must all be taken into
consideration when selecting the proper drilling fluid formulation. But one thing is
certain, no drilling fluid is suitable for all situations.
2.1.1 Types of Drilling Fluids
A drilling fluid can be classified by the nature of its continuous fluid phase and its
constituents as shown in Figure 9. There are three types of drilling fluids:
1. Water-based drilling fluids.
2. Oil-based drilling fluids.
3. Gas-based (pneumatic) drilling fluids.
Figure 9. Drilling fluids classification by composition.

19
Fluids in general can be grouped into two according to their flow behavior: Newtonian
and non-Newtonian. Figure 10 illustrates the two groupings with examples.
Figure 10. General fluid grouping by flow behavior. Reprinted from Ibeh (2007).
Water-Based Drilling Fluid (WBDF)
Water-based drilling fluids (WBDF) are the most common type of drilling fluids
used in the industry. The base fluid may be fresh water, seawater, brine, saturated brine,
or a formate brine. The type of fluid selected depends on anticipated well conditions or
on the specific interval of the well being drilled.
Inhibitive fluids retard clay swelling. For this reason, inhibitive fluids are used
for drilling hydratable-clay zones. Inhibitive fluid systems do not use chemical
dispersants (thinners) or inhibitive ions, but native waters. They are designed to reduce
chemical reactions between the drilling fluid and the formation. Fluid formulations
containing sodium, calcium, and/or potassium ions to minimize shale hydration and
swelling. Saltwater drilling fluids are used for shale inhibition and for drilling salt

20
formations. They are also known to inhibit hydrates (ice-like formations of gas and
water) from forming, which can accumulate around subsea wellheads and well-control
equipment, blocking lines and impeding critical operations. The mechanisms of
inhibition vary according to the type of inhibitive product being used. It is common to
utilize two or more products in the same mud system. These mud systems also minimize
the reaction with the drilled cuttings and therefore help to avoid the high dilution rates
exhibited by other fluid groups. (Mitchell and Miska 2011)
Non-Inhibitive fluids do not contain additives to inhibit downhole problems.
They can be classified as non-dispersed and dispersed. Non-dispersed fluids do not do
not contain inhibiting ions such as chloride (Cl-), calcium (Ca2+) or potassium (K+) in the
continuous phase and do not utilize chemical thinners or dispersants to affect control of
rheological properties. While dispersed fluids do not contain inhibiting ions in the
continuous phase, but they do rely on thinners or dispersants such as phosphates,
lignosulfonate or lignite to achieve control of the fluids' rheological properties. (Rabia
2001)
Polymer fluids may be inhibitive or non-inhibitive depending upon whether an
inhibitive cation is used.
The density of the WBDFs can be increased by adding calcium carbonate
particles. High levels of suspended solids, however, in drilling fluids can cause high
frictional losses during fluid circulation. These loses create high Equivalent Circulating
Densities (ECDs) and limit pump rates. Low pump rates can result in inefficient hole
cleaning (Njobuenwu and Wobo, 2007).

21
The main concern with WBM is the thermal degradation of chemical additives
that often occurs while drilling high temperature wells. Such degradation can lead to
strong variations in rheological and filtration characteristics and loss of fluid properties
(Melbouci and Sau Arjun, 2006).
A typical WBDF composition is shown in Figure 11.
Figure 11. Composition of 11-lbm/gal water-based mud. Reprinted from Bourgoyne et
al. (1991).

22
Oil-Based Drilling Fluid (OBDF)
An oil-based drilling fluid is one in which the continuous phase of a drilling fluid
is oil. When water is added as the discontinuous phase then it is called an invert
emulsion. The base fluids most often selected are diesel, mineral oil, and low-toxicity
mineral oil. These fluids are particularly useful in drilling production zones, shales and
other water-sensitive formations, as clays do not hydrate or swell in oil. OBDFs are also
known to provide unequaled performance attributes with respect to the rate of
penetration, wellbore stability, high lubricity, high thermal stability, and high salt
tolerance. They are also useful in drilling high angle/horizontal wells because of their
superior lubricating properties and low friction values between the steel and formation
which result in reduced torque and drag (Payne 1997).
The oil/water ratios typically range from 90:10 to 60:40. Generally, the higher
the percentage of water, the thicker the drilling fluid is. High salinity levels in the water
phase dehydrate and harden reactive shales by imposing osmotic pressures.
OBDFs are more cost-effective and efficient than water muds in the following
situations:
1. Shale stability
2. Temperature stability
3. Lubricity (Shah et al.2010)
4. Corrosion resistance
5. Stuck pipe prevention
6. Contamination

23
7. Fluid loss control
8. By using palm oil as an alternative of diesel can be more environmentally
friendly (Shah et al. 2010)
9. Thin filter cake (De Stefano et al. 2012)
10. Resistant to salt, anhydrite, H2S and CO2. (Amani et al. 2012)
However, they are subjected to strict environmental regulation regarding their
discharge and recycling. They are flammable and may contain compounds that cause the
failure of rubber goods such as hoses, O-rings, gaskets and Blowout Preventer (BOP)
elements. Oil-base muds (OBM) lack gel structure and are difficult to viscosify so they
can be weighted.
A typical OBDF composition is shown in Figure 12.
Figure 12. Composition of 11-lbm/gal oil-based mud. Reprinted from Bourgoyne et al.
(1991).
24
Synthetic-based fluids (SBFs) were developed to provide the highly regarded
drilling-performance characteristics of conventional OBFs while significantly reducing
the toxicity of the base fluid. Consequently, SBFs are used almost universally offshore
and they continue to meet the increasingly rigorous toxicity standards imposed by
regulatory agencies. The cost-per-barrel for an SBF is considerably higher than that of
an equivalent-density water-based fluid, but because synthetics facilitate high ROPs and
minimize wellbore-instability problems, the overall well-construction costs are generally
less, unless there is a catastrophic lost-circulation occurrence. (MI SWACO Engineering
Manual 1998).
Gas-Based (Pneumatic) Drilling Fluid
These are not common systems as they have limited applications such as the
drilling of depleted reservoirs or aquifers where normal mud weights would cause severe
loss circulation. In the case of air, the maximum depth drillable is currently about 6-
8,000 ft because of the capabilities of the available compressors (Mitchell and Miska
2011). Water if present in the formation is very detrimental to the use of gas-based muds
as their properties tends to break down in the presence of water.
Gas or pneumatic drilling fluids are most commonly used in dry, hard formations
such as limestone or dolomite. In pneumatic drilling-fluid systems, air compressors
circulate air through the drillstring and up the annulus to a rotating head. The return
“fluid” is then diverted by the rotating head to a flowline leading some distance from the

25
rig to protect personnel from the risk of explosion. (MI SWACO Engineering Manual
1998).
2.1.2 Rheology
The physical properties of a drilling fluid, density and rheological properties are
monitored to assist in optimizing the drilling process. These physical properties
contribute to several important aspects for successfully drilling a well, including:
1. Provide pressure control to prevent an influx of formation fluid.
2. Provide energy at the bit to maximize Rate of Penetration (ROP).
3. Provide wellbore stability through pressured or mechanically stressed zones.
4. Suspend cuttings and weight material during static periods.
5. Permit separation of drilled solids and gas at surface.
6. Remove cuttings from the well.
Overview
Rheology is the science of deformation and flow of matter. By making certain
measurements on a fluid it is possible to determine how that fluid will flow under a
variety of conditions, including temperature, pressure and shear rate.
The deformation of a fluid can simply be described by two parallel plates
separated by some distance as shown in Figure 13.

26
Figure 13. Deformation of a Fluid by Simple Shear. Reprinted from Rabia (2001).
Shear Stress
An applied force (F), acting over an area (A), causes the layers to slide past one
another. However, there is a resistance, or frictional drag, force that opposes the
movement of these plates. This resistance or drag force is called shear stress (τ). In
equation form,
𝜏 =𝐹
𝐴 , …………………………………………………………………. (1)
with shear stress having typical units of lbf/100 ft2. Additionally, the fluid layers move
past each other easier than between a pipe wall and fluid layer. Therefore, we can
consider a very thin layer of fluid next to the pipe wall as stationary. (Baker Hughes
Drilling Fluids Reference Manual 2006).
Shear Rate
The difference in the velocities between two layers of fluid divided by the
distance between the two layers is called the shear rate (γ). In equation form,
27
𝛾 =𝑣𝑒𝑙𝑜𝑐𝑖𝑡𝑦 𝑑𝑖𝑓𝑓𝑟𝑒𝑛𝑐𝑒
𝑑𝑖𝑠𝑡𝑎𝑛𝑐𝑒
…………………………………………………………
(2)
With typical units of
𝑓𝑡/𝑠𝑒𝑐
𝑓𝑡=
1
𝑠𝑒𝑐= 𝑠𝑒𝑐−1
Newtonian and Non-Newtonian Fluids
The relationship between shear stress (τ) and shear rate (γ) defines the flow
behavior of a fluid. For some fluids, the relationship is linear. Such fluids are called
Newtonian fluids. Examples of Newtonian fluids include water, alcohols, and light oils.
Very few drilling fluids fall into the Newtonian category. Fluids which have flow
characteristics such that the shear stress does not increase in direct proportion to the
shear rate are called non-Newtonian fluids. Most drilling fluids are of this type. (Baker
Hughes Drilling Fluids Reference Manual 2006).
Viscosity
Of the rheological terms, viscosity is the most familiar. Is a measure of a fluid's
resistance to flow. It describes the internal friction of a moving fluid. A fluid with large
viscosity resists motion because its molecular makeup gives it a lot of internal friction. A
fluid with low viscosity flows easily because its molecular makeup results in very little
friction when it is in motion. (Mitchell and Miska 2011).

28
For a Newtonian fluid, the relationship between viscosity, shear stress and shear
rate is defined as the viscosity (μ) of the fluid where:
µ =𝜏
𝛾 ………………………………………………………………… (3)
For non-Newtonian fluids, the relationship between shear stress and shear rate is
defined as the effective viscosity. However, the effective viscosity of a non-Newtonian
fluid is not constant. For most drilling fluids, the effective viscosity will be relatively
high at low-shear rates, and relatively low at high-shear rates. In other words, the
effective viscosity decreases as the shear rate increases. When a fluid behaves in this
manner, it is said to be shear thinning. Shear thinning is a very desirable characteristic
for drilling fluids. (Baker Hughes Drilling Fluids Reference Manual 2006).
As shown in Figure 14, when the effective viscosity is plotted alongside the
shear-stress-shear-rate curve, it is easy to see the shear-thinning nature that most drilling
fluids exhibit. Shear thinning has very important implications in drilling fluids as it
provides what we desire most:
1. At high velocities (high shear rates) in the drillstring and through the bit, the mud
shear thins to low effective viscosities. This reduces the circulating pressure and
pressure losses.
2. At the lower velocities (lower shear rates) in the annulus, the mud has a higher
effective viscosity that aids in hole cleaning.
3. At ultra-low velocity the mud has its highest effective viscosity and when not
circulating will develop gel strengths that aid in suspending weight material and

29
cuttings. (MI SWACO Engineering Manual 1998).
Figure 14. Shear-thinning effect in Non-Newtonian fluids. Reprinted from MI SWACO
Engineering Manual (1998).

30
Figure 15. Effect of shear rate on effective viscosity of Non-Newtonian fluid. Reprinted
from MI SWACO Engineering Manual (1998).
Dynamic Viscosity
The dynamic viscosity of a fluid expresses its resistance to shearing flows, where
adjacent layers move parallel to each other with different speeds. It can be defined
through the idealized situation known as a Couette flow, where a layer of fluid is trapped
between two horizontal plates, one fixed and one moving horizontally at constant speed
u. This fluid has to be homogeneous in the layer and at different shear stresses. (The
plates are assumed to be very large so that one need not consider what happens near their
edges.). (MI SWACO Engineering Manual 1998).

31
Figure 16. Two-Plates-Model of viscosity. Reprinted from Quora.com
Kinematic Viscosity
Defined as the dynamic viscosity divided by the density of the material. This
results in units with dimensions of area per unit of time. When the units are mm2/s they
are known as centistokes (cSt).
𝜈 =µ
𝜌 ………………………………………….……………………. (4)
2.1.3 Rheological Models
A rheological model is a description of the relationship between the shear stress
and shear rate. Newton’s law of viscosity is the rheological model describing the flow
behavior of Newtonian fluids. It is also called the Newtonian model. However, since
most drilling fluids are non-Newtonian fluids, this model does not describe their flow
behavior. In fact, since no single rheological model can precisely describe the flow
characteristics of all drilling fluids, many models have been developed to describe the
flow behavior of non-Newtonian fluids. (MI SWACO Engineering Manual 1998).
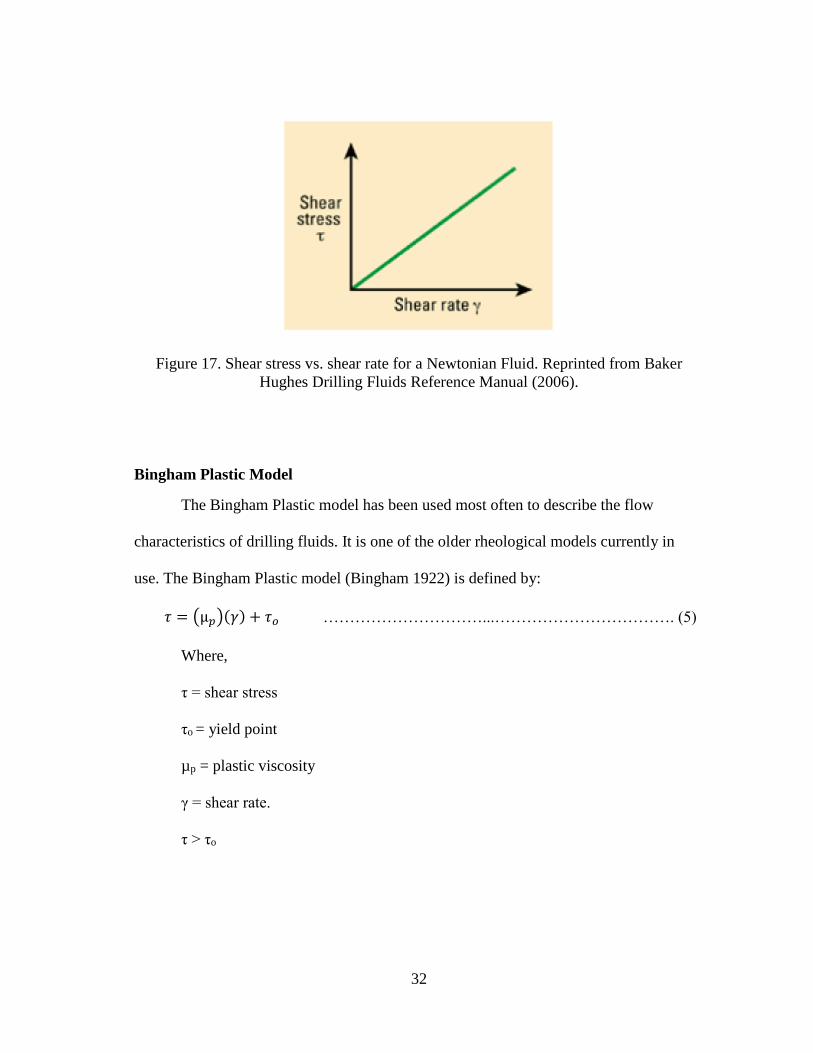
32
Figure 17. Shear stress vs. shear rate for a Newtonian Fluid. Reprinted from Baker
Hughes Drilling Fluids Reference Manual (2006).
Bingham Plastic Model
The Bingham Plastic model has been used most often to describe the flow
characteristics of drilling fluids. It is one of the older rheological models currently in
use. The Bingham Plastic model (Bingham 1922) is defined by:
𝜏 = (µ𝑝)(𝛾) + 𝜏𝑜 …………………………...……………………………. (5)
Where,
τ = shear stress
τo = yield point
µp = plastic viscosity
γ = shear rate.
τ > τo

33
Figure 18. Shear stress vs. shear rate for a Bingham plastic fluid. Reprinted from Baker
Hughes Drilling Fluids Reference Manual (2006).
No bulk movement of the fluid occurs until the applied force exceeds the yield
stress. The yield stress is commonly referred to as the Yield Point (YP). In Bingham
Plastic model a fluid will flow if the shear stress τ is greater than YP. Shear stress is
proportional to shear rate, this ratio is called plastic viscosity (PV), µp . YP typically is
shown in field units of lbf/100 ft2. (MI SWACO Engineering Manual 1998).
The effective viscosity is visually represented by the slope of a line from the
origin to the shear stress at some particular shear rate as shown in Figure 18. The slopes
of the dashed lines represent effective viscosity at various shear rates. As can be seen,
the effective viscosity decreases with increased shear rate. Plastic viscosity is used as an
indicator of the size, shape,

34
distribution and quantity of solids, and the viscosity of the liquid phase. The yield point
is a measure of electrical attractive forces in the drilling fluid under flowing conditions.
(Shah et al. 2010).
Power Law Model
Most drilling fluids exhibit behavior that falls between the behaviors described
by the Newtonian Model and the Bingham Plastic Model. This behavior is classified as
pseudo plastic. The relationship between shear stress and shear rate for pseudo plastic
fluids is defined by the power law mathematical model,
𝜏 = 𝐾(𝛾𝑛) ……………………………..……………………………….. (6)
where,
τ = shear stress
K = consistency factor
n = flow behavior index
γ = shear rate.

35
Figure 19. Shear stress vs. shear rate for a Power Law Fluid. Reprinted from Baker
Hughes Drilling Fluids Reference Manual (2006).
The two terms, K and n, are constants in the Power Law Model. Generally, K is
called the consistency factor and describes the thickness of the fluid and is thus
somewhat analogous to effective viscosity. If the drilling fluid becomes more viscous,
then the constant K must increase to adequately describe the shear stress/shear rate
relationship. (MI SWACO Engineering Manual 1998).
Additionally, n is called the flow behavior index and indicates the degree of non-
Newtonian behavior. A special fluid exists when n = 1, when the Power Law Model is
identical to the Newtonian Model. If n is greater than 1, another type of fluid exists
classified as dilatant, where the effective viscosity increases as shear rate increases. For
drilling fluids, the pseudo plastic behavior is applicable and is characterized when n is
between zero and one. Pseudo plastic fluids exhibit shear thinning, where the effective
viscosity decreases as the shear rate increases just like the Bingham Plastic Model. (Shah
et al. 2010).

36
Herschel-Bulkey Model
The Herschel-Bulkley model (Herschel and Bulkley 1926) is defined by
𝜏 = 𝜏𝑦 + 𝐾�̇�𝑛 ……...…………………………..…………………………. (7)
Where,
τ = shear stress
τy = yield point
K = consistency factor
n = flow behavior index
�̇� = shear rate.
Figure 20. Shear stress vs. shear rate for a Herschel-Bulkley Fluid. Reprinted from
Mitchell and Miska (2011).
37
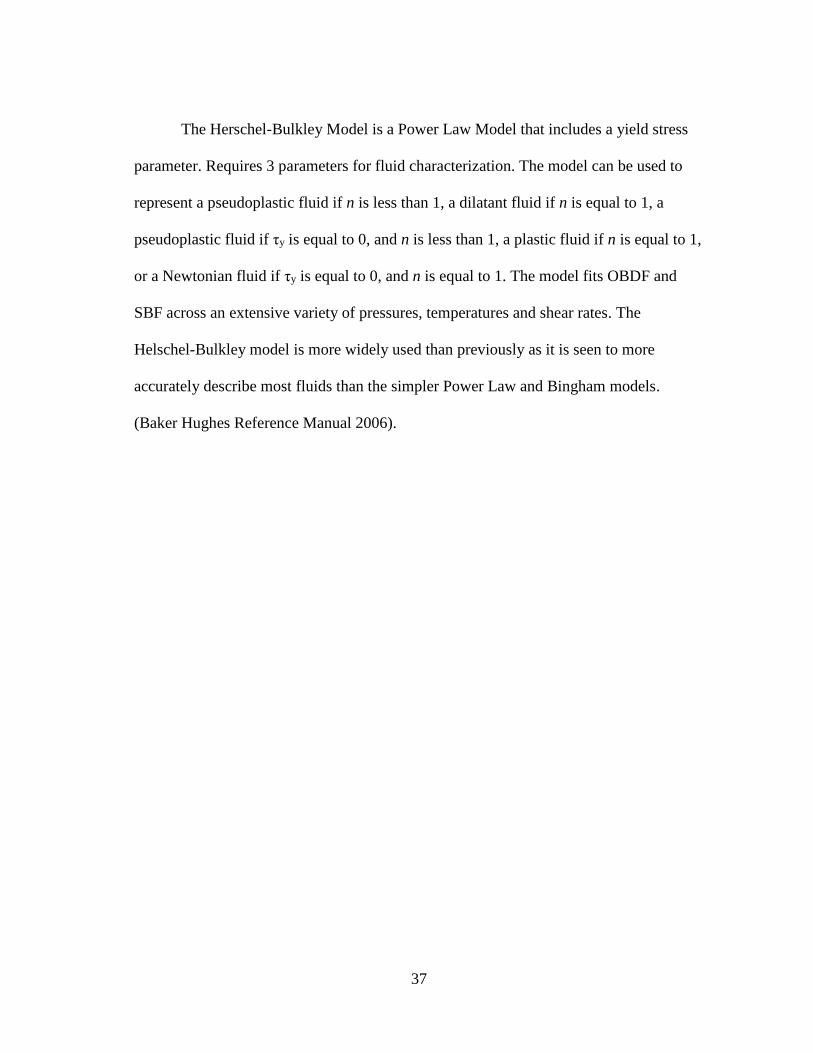
The Herschel-Bulkley Model is a Power Law Model that includes a yield stress
parameter. Requires 3 parameters for fluid characterization. The model can be used to
represent a pseudoplastic fluid if n is less than 1, a dilatant fluid if n is equal to 1, a
pseudoplastic fluid if τy is equal to 0, and n is less than 1, a plastic fluid if n is equal to 1,
or a Newtonian fluid if τy is equal to 0, and n is equal to 1. The model fits OBDF and
SBF across an extensive variety of pressures, temperatures and shear rates. The
Helschel-Bulkley model is more widely used than previously as it is seen to more
accurately describe most fluids than the simpler Power Law and Bingham models.
(Baker Hughes Reference Manual 2006).

38
Figure 21. Shear stress versus shear rate for various rheological models. Reprinted from
Baker Hughes Drilling Fluids Reference Manual (2006).
39
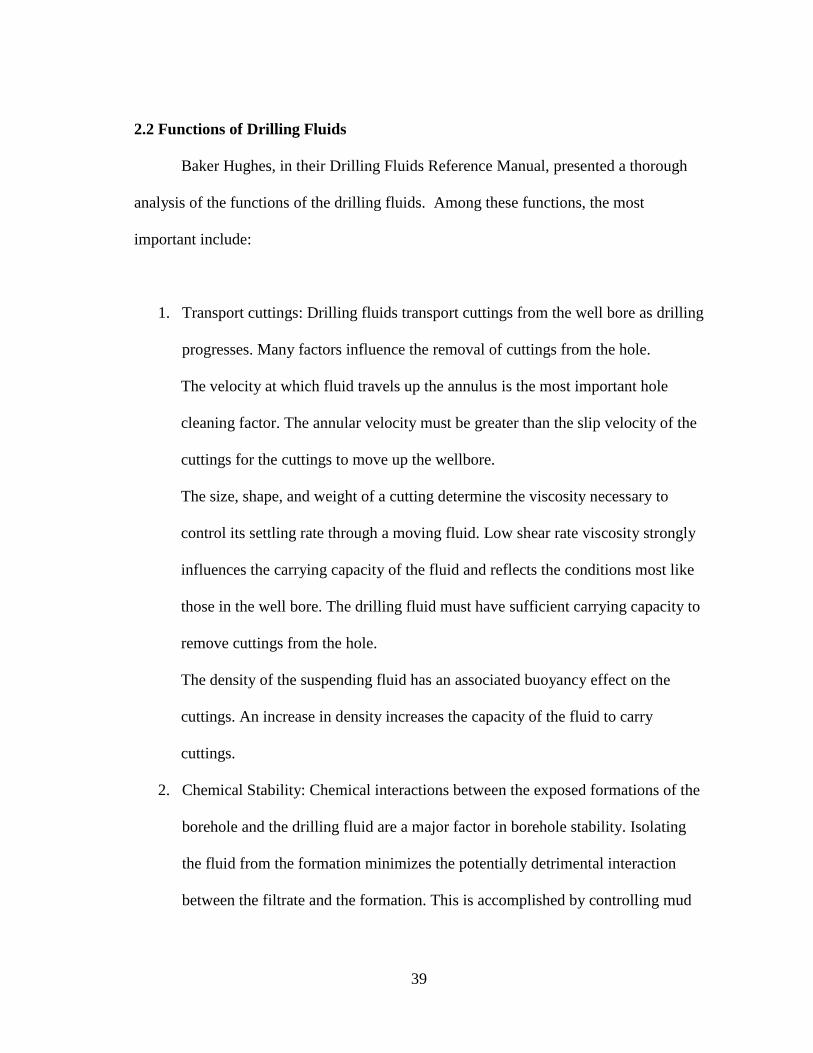
2.2 Functions of Drilling Fluids
Baker Hughes, in their Drilling Fluids Reference Manual, presented a thorough
analysis of the functions of the drilling fluids. Among these functions, the most
important include:
1. Transport cuttings: Drilling fluids transport cuttings from the well bore as drilling
progresses. Many factors influence the removal of cuttings from the hole.
The velocity at which fluid travels up the annulus is the most important hole
cleaning factor. The annular velocity must be greater than the slip velocity of the
cuttings for the cuttings to move up the wellbore.
The size, shape, and weight of a cutting determine the viscosity necessary to
control its settling rate through a moving fluid. Low shear rate viscosity strongly
influences the carrying capacity of the fluid and reflects the conditions most like
those in the well bore. The drilling fluid must have sufficient carrying capacity to
remove cuttings from the hole.
The density of the suspending fluid has an associated buoyancy effect on the
cuttings. An increase in density increases the capacity of the fluid to carry
cuttings.
2. Chemical Stability: Chemical interactions between the exposed formations of the
borehole and the drilling fluid are a major factor in borehole stability. Isolating
the fluid from the formation minimizes the potentially detrimental interaction
between the filtrate and the formation. This is accomplished by controlling mud
40
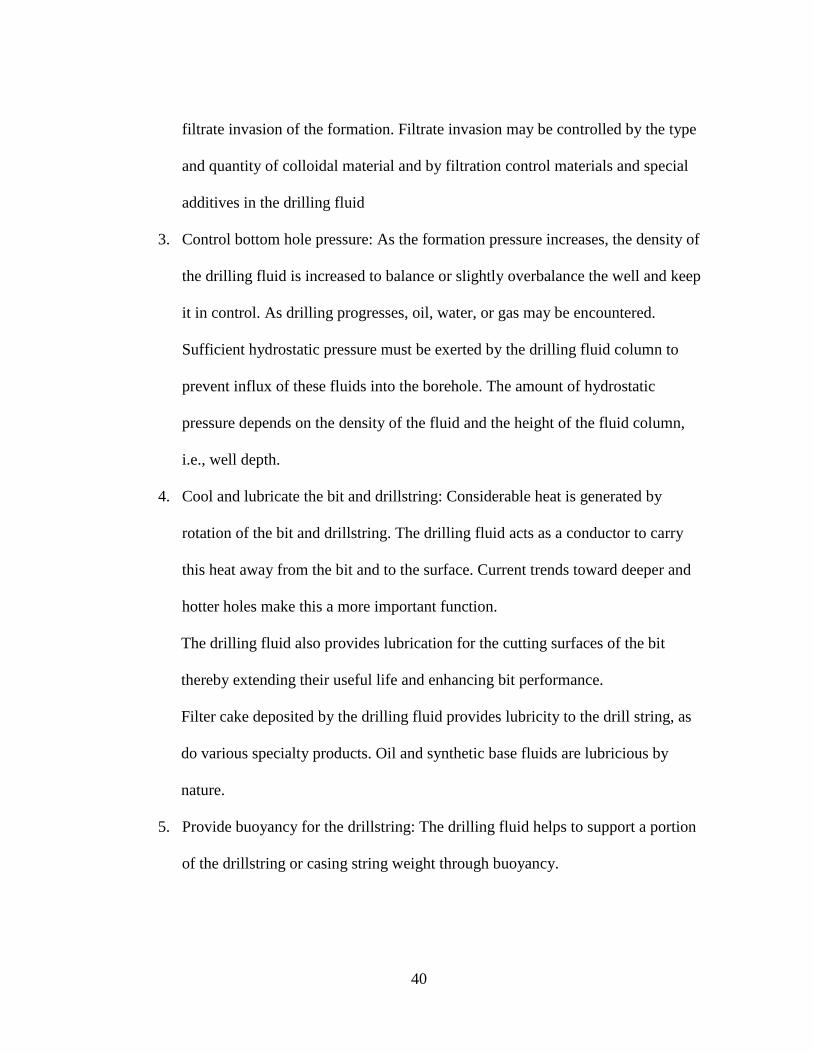
filtrate invasion of the formation. Filtrate invasion may be controlled by the type
and quantity of colloidal material and by filtration control materials and special
additives in the drilling fluid
3. Control bottom hole pressure: As the formation pressure increases, the density of
the drilling fluid is increased to balance or slightly overbalance the well and keep
it in control. As drilling progresses, oil, water, or gas may be encountered.
Sufficient hydrostatic pressure must be exerted by the drilling fluid column to
prevent influx of these fluids into the borehole. The amount of hydrostatic
pressure depends on the density of the fluid and the height of the fluid column,
i.e., well depth.
4. Cool and lubricate the bit and drillstring: Considerable heat is generated by
rotation of the bit and drillstring. The drilling fluid acts as a conductor to carry
this heat away from the bit and to the surface. Current trends toward deeper and
hotter holes make this a more important function.
The drilling fluid also provides lubrication for the cutting surfaces of the bit
thereby extending their useful life and enhancing bit performance.
Filter cake deposited by the drilling fluid provides lubricity to the drill string, as
do various specialty products. Oil and synthetic base fluids are lubricious by
nature.
5. Provide buoyancy for the drillstring: The drilling fluid helps to support a portion
of the drillstring or casing string weight through buoyancy.

41
6. Suspend cuttings/weighting material when circulation ceases: When circulation
is stopped, drilling fluids must suspend the drilled cuttings and weight material.
Circulation of the suspended material continues when drilling resumes. The
drilling fluid should also exhibit properties which promote efficient removal of
solids by surface equipment.
7. Facilitate the retrieval of information from the wellbore: Obtaining maximum
information on the formation being penetrated is imperative. A fluid which
promotes cutting integrity is highly desirable for evaluation purposes. The use of
electronic devices incorporated within the drill string has made logging and
drilling simultaneous activities.
8. Limit corrosion of drillstring, casing, and tubular goods: Corrosion in drilling
fluids is usually the result of contamination by carbon dioxide, hydrogen sulfide,
oxygen or, in the case of static fluids, bacterial action. Low pH, salt-
contaminated, and non-dispersed drilling fluids are inherently more corrosive
than organically treated freshwater systems. Oil or synthetic-based fluids are
considered non-corrosive. A proper drilling fluid corrosion control program
should minimize contamination and render the contaminating source non-
corrosive
9. Transmit hydraulic energy to the tools and bit: Once the bit has created a drill
cutting, this cutting must be removed from under the bit. If the cutting remains, it
will be “re-drilled” into smaller particles which adversely affect penetration rate
of the bit and fluid properties. The drilling fluid serves as the medium to remove

42
these drilled cuttings. One measure of cuttings removal force is hydraulic
horsepower available at the bit. Fluid density and viscosity affect bit hydraulic
horsepower.
2.3 Composition of Oil-Based Drilling Fluids
1. Mineral Oil: Mineral oils have lower aromatic (<1.0%) content than diesel and
are also considered less toxic. They have higher flash points than diesel and are
safer to use especially in high temperature applications. Also, they have a low
viscosity when compared to diesel and crude oils which will affect the overall
viscosity of the oil-based mud. Unlike diesel, mineral oils do not contain
surfactants that could change the wettability of the formation.
2. Emulsifiers: Are surfactants that reduce the surface tension between the water
droplets and oil which allows stable emulsions with small drops to be formed.
They are amphiphilic compounds with both hydrophilic “heads” and
organophilic “tails,” partially soluble in both water and oil. Historically, oil-mud
emulsifiers have been classified as primary and secondary.
Primary emulsifiers are used to reduce interfacial tension between the liquid
phases and make the internal phase dispersible while secondary emulsifiers are
very powerful oil wetting chemicals. Generally, these products do not form
emulsions as well as the primary emulsifiers, they are used to emulsify any water
intrusions quickly and stabilize the emulsion. Secondary emulsifiers consolidate
stability of the dispersed phase. Fatty acids are the basic components for nearly

43
all emulsifiers and wetting agents used in the preparation of invert emulsions.
Emulsifiers can be calcium fatty-acid soaps made from various fatty acids and
lime, or derivatives such as amides, amines, amidoamines, and imidazolines
made by reactions of fatty acids and various ethanolamine compounds.
3. Wetting agents: Is a surface-active agent that reduces the interfacial tension and
contact angle between a liquid and a solid. This causes the liquid to spread over
the surface of the solid.
4. Weighting material: Are compounds that are dissolved or suspended in drilling
fluid to increase its density. They are used to control formation pressures and to
help combat the effects of sloughing or heaving shales that may be encountered
in stressed areas.
5. Soluble salts: Are used primarily to increase the fluid’s density. Soluble salts are
added to increase the emulsified water phase’s salinity to provide inhibition of
shales and reactive solids. Control of salinity in invert oil muds is necessary to
“tie-up” free water molecules, and it prevents any water migration between the
mud and the open formation such as in shales.
6. Viscosifiers: Primary function is to provide viscosity and improve the drilling
fluid’s ability to remove cuttings from the wellbore by producing high YP/PV
ratios and gel strengths.
7. Filtration control materials: Reduce the amount of filtrate lost from the drilling
fluid into a subsurface formation.
8. Rheology control material: Materials called thinners, dispersants, or
44
deflocculants that are used to improve/control the rheology of the fluid. These
materials reduce the viscous and structure-forming properties of the drilling fluid
by changing the physical and chemical interactions between solids and/or
dissolved salts.
2.4 Rheology Properties and Filtration Control of Oil-Based Drilling Fluids
As previously discussed, the rheology properties of a drilling fluid contribute to
several important aspects for successfully drilling a well. Among these are:
1. Provide pressure control to prevent an influx of formation fluid.
2. Provide energy at the bit to maximize ROP.
3. Provide wellbore stability through pressured or mechanically stressed zones.
4. Suspend cuttings and weight material during static periods.
5. Permit separation of drilled solids and gas at surface.
6. Remove cuttings from the well.
2.4.1 Funnel Viscosity
Funnel viscosity is used as a relative indicator of fluid condition. It does not
provide sufficient information to determine the rheological properties or flow
characteristics of a fluid. It should be used in the field to detect relative changes in the
fluid’s properties. The funnel viscosity is measured using the Marsh funnel. (MI
SWACO Engineering Manual 1998).

45
2.4.2 Apparent viscosity (AV)
The viscosity of a non-Newtonian fluid changes with shear. The effective
viscosity (μe) of a fluid is a fluid’s viscosity under specific conditions. These conditions
include shear rate, pressure and temperature. (MI SWACO Engineering Manual 1998).
2.4.3 Effective viscosity
The effective viscosity is sometimes referred to as the Apparent Viscosity (AV).
The apparent viscosity is reported as either the mud viscometer reading at 300 RPM
(Θ300) or one-half of the meter reading at 600 RPM (Θ600). (MI SWACO Engineering
Manual 1998).
2.4.4 Plastic Viscosity (PV)
The plastic viscosity is the shear stress in excess of the yield stress that will
induce a unit rate of shear. In other words, it is that part of the flow resistance in a
drilling fluid mainly produced by the friction of the suspended particles and by the
viscosity of the liquid phase. (MI SWACO Engineering Manual 1998).
When using the viscometer, the plastic viscosity in centipoise (cP) or milliPascal
seconds (mPa•s) is found by subtracting the 300 RPM (Θ300) reading from the 600 RPM
(Θ600) reading
𝑃𝑉 = 𝛩300 − 𝛩600 …………………………………………………………….. (8)

46
2.4.5 Yield Point (YP)
Yield point, the second component of resistance to flow in a drilling fluid, is a
measurement of the electro-chemical or attractive forces in a fluid. These forces are a
result of negative and positive charges located on or near the particle surfaces. Yield
point is often used as an indicator of the shear thinning characteristics of drilling fluid
and its ability to suspend cuttings and weight material. Yield point in pounds per 100
square feet (lb/100 ft2) or in Pascals is calculated from the viscometer readings as:
𝑌𝑃 (𝑙𝑏100 𝑓𝑡2⁄ ) = 2 𝑥 𝛩300 − 𝛩600 ……………………………………. (9)
𝑌𝑃 (𝑙𝑏100 𝑓𝑡2⁄ ) = 𝛩300 − 𝑃𝑉 …………………………….……….. (10)
𝑌𝑃 (𝑃𝑎) = 0.4788 𝑥 (2 𝑥 𝛩300 − 𝛩600) …………………………….………. (11)
𝑌𝑃 (𝑃𝑎) = 0.4788 𝑥 (𝛩300 − 𝑃𝑉) …………………………………….. (12)
2.4.6 Gel Strength
Gel strength is a rheological parameter commonly used to describe non-
Newtonian fluids. The gel strength is the shear stress measured at low shear rate after a
mud has set quiescently for a period of time. In other words, it is the measure of ability
of a colloidal solid at rest to form a gel. A colloid is a finely divided solid that does not
deposit by gravity when dispersed in a liquid medium. Excessive gelation is caused by
high solids concentrations leading to flocculation. There are two readings for gel

47
strengths, 10-second and 10-minute with the speed of the viscometer set at 3 rpm. The
fluid must have remained static prior to each test, and the highest peak reading will be
reported. (Xie 2001).
Signs of rheological trouble in a mud system often are reflected by the gel
strength development of a mud with time shown in Figure 22. When there is a wide
range between the initial and 10-minute gel readings they are called “progressive gels”.
This is not a desirable situation. If the initial and 10-minute gels are both high, with no
appreciable difference in the two, these are “high-flat gels”, also undesirable. Gelation
should not be allowed to become much higher than is necessary to perform the function
of suspension of cuttings and weight material. For suspension “low-flat gels” are
desirable. (Xie 2001).

48
Figure 22. Different types of gel strengths. Reprinted from Xie (2001).
2.4.7 Filtration Control
Filtration process may occur under static or dynamic conditions. Static filtration
occurs when the slurry is applied to a filter cake without cross-flow. Therefore, the
particles are continuously deposited to form thicker filter cakes until the space available
is full of the filter cake. Dynamic filtration involves cross-flow through the filter cake,
which leads to variation in the thickness until the particle deposition and erosion rates
become equal (Civan 1998).
At early stages of filtration, both large and small particles deposit on the cake
surface; because the drag force driving the particles to the cake surface is high, then only

49
smaller and smaller particles are deposited (Jiao and Sharma 1994). The cake growth
rate gradually decreases until an equilibrium filtration rate is attained at which no
particles small enough to be deposited are available in the suspension. This mechanism
of cake growth gives rise to a heterogeneous cake with both large and small particles at
the internal and only small particles at the external portion of the cake.
Permeability of filter cake is controlled by the downhole static and dynamic
filtration behavior of the drilling fluid. Thick filter cakes which have high permeability
cause various operational problems such as excessive torque, drag, high swab and surge
pressures, and sticking of pipes. There are many approaches used to determine the filter
cake permeability. They assumed homogenous filter cake with constant properties of the
filter medium.

50
3. MATERIALS, LABORATORY EQUIPMENT, AND
METHODOLOGY
3.1 Materials
3.1.1 Cores and Minerology
High permeability Indiana limestone cores with a thickness of 0.25 in. and a
diameter of 2.5 in. were used to perform the filter cake formation and filtration analysis.
The properties of the cores and their mineralogy are shown in Tables 3 and 4.
Table 3. Properties of the Indiana Limestone cores.
Properties of the Indiana Limestone Cores
Porosity, vol% 23 - 30
Permeability, md 100
Length, in 0.25
Diameter, in 2.5
Table 4. Minerology of the Indiana Limestone cores.
Mineral Concentration (wt%)
Calcium carbonate 98
Quartz 1-2

51
Figure 23. Indiana Limestone core.

52
3.1.2 Oil-Based Drilling Fluid Formulas
Calcium carbonate (CaCo3) was chosen as the weighting material for the two
mineral-oil based drilling fluids used for the analysis. The properties if the weighting
material are shown in Table 5. The first of the drilling fluids (MOBDF A) was prepared
with a formula containing organophilic clay additives. The second fluid, a clay-free
drilling fluid (MOBDF B), was prepared with a formula containing the replacement
polymer viscosifier and filtration control agent. A complete list of the additives, the
quantities used, and their respective mixing times are shown in Table 8 and Table 9.
The chemical additives used in this work such as viscosifiers, emulsifiers and
fluid loss agents were supplied by the companies Baker Hughes and Halliburton.
Table 5. Properties of the Weighting Material.
Weighting
Material
Chemical
Formula
Density,
g/cm3
D50,
m Acid solubility
Mohs
Hardness
Calcium
Carbonate CaCO3 2.8 50 - 55 Soluble 3 - 4

53
Figure 24. X-ray diffraction spectrum of the weighting material (CaCO3) sample.
Figure 25. Compositon of the weighting material (CaCO3) sample.

54
Table 6. Properties of the Mineral Oil Escaid 110.
Commercial
Name
Density
at 60oF,
g/cm3
Initial
Boiling
Point, oF
Final
Boiling
Point, oF
Flash
Point, oF
Aniline
Point, oF
Aromatic
concentra
tion, wt%
Viscosity
at 104 oF, cSt
Escaid 110 0.806 394 459 167 162 0.05 1.63
Table 7. MOBDF A Formula.
Component Function/Description Quantity Mixing
time (mins)
Mineral Oil Continuous phase
250 ml -
Organophilic Clay
(modified hectorite) Viscosifier 6 g 5
Organophilic Clay
(organo-attapulgite) Viscosifier 6 g 5
Lime Alkalinity Control
Ca(OH)2 20 g 5
Polyamide/Mineral Oil
Blend
HT Primary
Emulsifier 15 g 5
Glycol Ether/Fatty Acid
Blend
HT Secondary
Emulsifier 15 g 5
Deionized Water Dispersed phase 25 ml 5
Calcium Chloride Density. Clay and
shale inhibition 8 g 5
Organophilic Lignite HT Filtration Control 10 g 5
Calcium Carbonate Weighting Material 400 g 15

55
Table 8. MOBDF B Formula.
Component Function/Description Quantity
Mixing
Time
(mins)
Mineral Oil Continuous phase
250 ml -
Polymer A Primary viscosifier and filtration
control agent 15 g 5
Lime Alkalinity Control
Ca(OH)2 20 g 5
Polyamide/Min
eral Oil Blend HT Primary Emulsifier 15 g 5
Glycol
Ether/Fatty
Acid Blend
HT Secondary Emulsifier 15 g 5
Deionized
Water Dispersed phase 25 ml 5
Calcium
Chloride Density, clay and shale inhibition 8 g 5
Clay-free
Sealing Agent HT Filtration Control 5 g 5
Calcium
Carbonate Weighting Material 400 g 15

56
3.2 Laboratory Equipment
3.2.1 Mixer
A Hamilton mixer was used to prepare the samples. Drilling fluids were mixed
by using the Multi-mixer Model 9B as shown in Figure 24. The average speeds of the
impellers were 11300 rpm.
Figure 26. Hamilton Multi-mixer Model 9B.
57
3.2.2 Viscometer and Rheometer
A Grace M3600 Viscometer and a Grace M5600 HP/HT Rheometer were used to
determine the rheological properties of the drilling fluids used in this work. Shear stress,
viscosity, or gel strength were determined from the degree of rotation of the bob under
the influence of the shear rate created in the mud by the action of the outer, rotating
sleeve.
Figure 27. (Left) Grace M3600 Viscometer. (Right) Grace M5600 HP/HT Rheometer.
Procedure
Yield Point (YP) and Plastic Viscosity (PV) measurements:
1. Place a sample in a suitable container and immerse the rotor sleeve exactly to the
inscribed line.
2. Set to the desired temperature. For example, set it to 140⁰F.
58
3. With the sleeve rotating at 600 rpm, wait for the dial reading to reach a steady
value. Record the dial reading for 600 rpm
4. Shift to 300 rpm and wait for the dial reading to come to a steady value. Record
the dial reading for 300 rpm.
5. Repeat the experiment for 6 rpm and 3 rpm (optionally for 100 and 200 rpm).
6. The plastic viscosity (PV) in centipoises equals the 600 rpm reading minus the
300 rpm reading.
7. The yield point (YP) in Ibf/100 ft2 equals the 300 rpm reading minus the plastic
viscosity. The temperature of the sample should be 140⁰F.
Gel-Strength measurements:
1. Place the fluid sample in position as in the procedure for plastic viscosity and
yield point measurement.
2. Stir at 600 rpm for a while.
3. Allow the fluid to stand undisturbed for 10 seconds. Then start stirring at 3 rpm.
The maximum reading attained after starting rotation at 3 rpm is the initial gel
strength.
4. Again stir the fluid sample at 600 rpm for a while and then allow the fluid to
stand undisturbed for 10 minutes, then put it in 3 rpm, The measurement at the
maximum reading is 10-minutes gel strength in lbf/100 ft2.

59
3.2.3 Mud Balance
The density of the fluids was measured with a mud Balance shown in Figure 26.
The mud balance should be calibrated frequently with fresh water. Fresh water should
give a reading of 62.3 PCF at 70oF.
Figure 28. Baroid Mud Balance Model 140.
Procedure
1. Put the instrument in a leveled position.
2. Fill the clean, dry cup with the fluid to be tested; make sure that some of the fluid
is expelled through the hole in the cap to free trapped air.
3. Wash or wipe the fluid from the outside of the cup. Put the beam on the support
and balance it by moving the rider along the graduated scale. The beam should be
in the horizontal direction and the bubble in the center line. Record your reading.
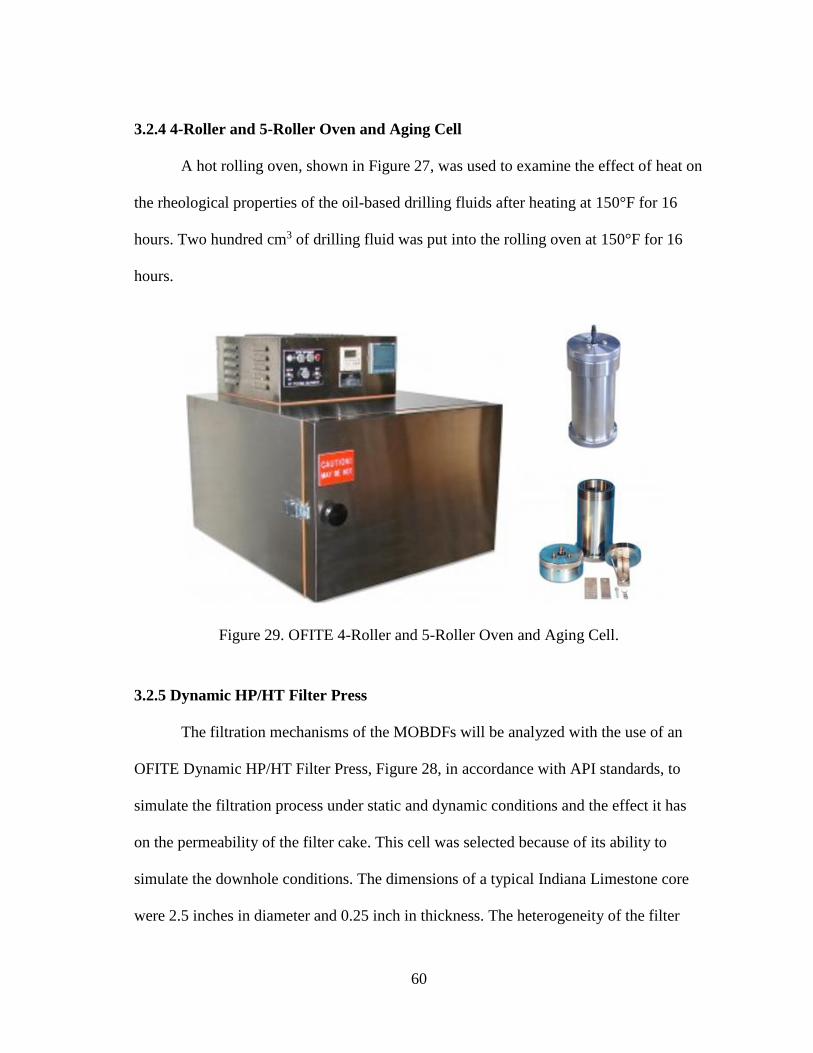
60
3.2.4 4-Roller and 5-Roller Oven and Aging Cell
A hot rolling oven, shown in Figure 27, was used to examine the effect of heat on
the rheological properties of the oil-based drilling fluids after heating at 150°F for 16
hours. Two hundred cm3 of drilling fluid was put into the rolling oven at 150°F for 16
hours.
Figure 29. OFITE 4-Roller and 5-Roller Oven and Aging Cell.
3.2.5 Dynamic HP/HT Filter Press
The filtration mechanisms of the MOBDFs will be analyzed with the use of an
OFITE Dynamic HP/HT Filter Press, Figure 28, in accordance with API standards, to
simulate the filtration process under static and dynamic conditions and the effect it has
on the permeability of the filter cake. This cell was selected because of its ability to
simulate the downhole conditions. The dimensions of a typical Indiana Limestone core
were 2.5 inches in diameter and 0.25 inch in thickness. The heterogeneity of the filter

61
cake was examined. The efficiency of removing the filter cake was determined by using
a novel surfactant removal fluid. The tests were carried out at temperatures between
140⁰F to 250° F. 250 to 500 psi differential pressures were used in all experiments to
stimulate overbalance pressure in downhole condition.
Figure 30. OFITE Dynamic HP/HT Filter Press.
Procedure
1. Lubricate the O-rings. Preheat the heating jacket to a little bit above selected test
temperature.
2. Load the cell with the fluid sample, take care not to fill the cell closer than ½
inch from the top.
3. Put the cell inside the equipment; make sure it is completely inside.

62
4. Place the cell into the heating jacket with both top and bottom valves closed.
Transfer the thermometer into the thermometer well.
5. Place the pressure units on the valves and lock in place. Apply the desired
differential pressure to the fluid while heating to the selected temperature.
6. Record the filtrate volume every minute. Total time of reading is 30 min
7. At the end of the test close both valves, back the T-screw off, and bleed pressure
from both regulators.
3.2.6 CT-Scanner
The properties of the filter cake formed by the novel MODFs were determined
and analyzed. The thickness of the filter cake build up, under different flow conditions,
were measured with a CT (Computed Tomography) scanner. The relationship between
the thickness of the filter cake and porosity will be developed and the permeability of the
filter cake will be determined.
The objective of the X-ray computed tomography process is to obtain descriptive
images of density variations within a sample. CT numbers are normalized values of the
calculated X-ray absorption coefficient of a pixel (picture element) in a computed
tomogram that provides radio density which is expressed in Hounsfield Units (HU).
Because X-ray attenuations are related to density, the CT image gives the density
distribution within every point of the object scanned. The radio density refers to a
relative inability of X-rays to pass through the material and is proportional to its density
(Novelline 2004; Wellington and Vinegar 1987). The average CT numbers increases

63
with the increase intensity. For reference, the CT number of water is 0 HU and air is -
1,000 HU (Akin and Kovscek 2003).
Figure 31. CT Scanning unit at the Harold Vance Department of Petroleum Engineering.

64
Table 9. CT scanning settings.
X-Ray Power 150 keV
Camera Exposure 1.8 seconds
Rotation Increment 1.0°
Vertical Step 9.5 mm
Image Display
Region 1024 × 1024 pixels
CT Image
Resolution 1 pixel = 0.00138 mm2
X-Ray Beam
Thickness 6 pixels (0.00828 mm)
3.2.7 Core Flow Setup
Core flood experiments were performed to investigate mud solids and filtrate
invasion and determine the pore blocking capabilities and retained permeability of the
MOBDFs. A schematic of the core-flood unit is shown in Figure 30.

65
Figure 32. Core-flood set up.
3.2.8 Drop Shape Analyzer
The Drop Shape Analyzer – DSA100 is a high-quality system solution for almost
all tasks in the analysis of wetting and adhesion on solid surfaces. This instrument was
used for contact angle measurements.

66
Figure 33. Kross Drop shape analyzer (DSA 100).

67
3.3 Methodology / Plan of Action
1. Determine the properties of the organophilic clay additives and the polymer
replacement.
1.1 Analyze the structure of the clay additives and the replacement polymer.
1.2 Evaluate additive compatibility and phase separation after hot rolling.
2. Rheological Properties of the MOBDFs at different temperatures.
2.1 Viscosity at 140, 190, and 250ºF.
2.2 PV at 140, 190, and 250ºF.
2.3 YP at 140, 190, and 250ºF.
2.4 Gel Strength at 140, 190, and 250ºF.
3. MOBDF Filtration Properties.
3.1 Spurt loss at 140ºF/300psi, 190ºF/300psi , and 250ºF/500psi
3.2 Total filtrate volume at 140ºF/300psi, 190ºF/300psi , and 250ºF/500psi
4. Filter Cake Properties
4.1 Porosity
4.2 Permeability
4.3 Filter cake removal efficiency
5. Evaluation of Formation Damage.
5.1 Determine retained permeability of each core after filter cake removal
6. Evaluation of Formation Wettability
6.1 Measure contact angle of between MOBDFs and the rock
6.2 Determine emulsion breakdown efficiency

68
4. RESULTS OF EXPERIMENTS
4.1 Chemical Composition of Additives Used in MOBDF A and B
4.1.1 Viscosifier in MOBDF A
Organophilic clay (modified hectorite)
Wet processed organophilic clay used as gallant/suspension agent in the HP/HT oil-
based mud system. Is temperature stable up to 425℉ (218℃).
Figure 34. X-ray diffraction spectrum of organophilic clay viscosifier sample.
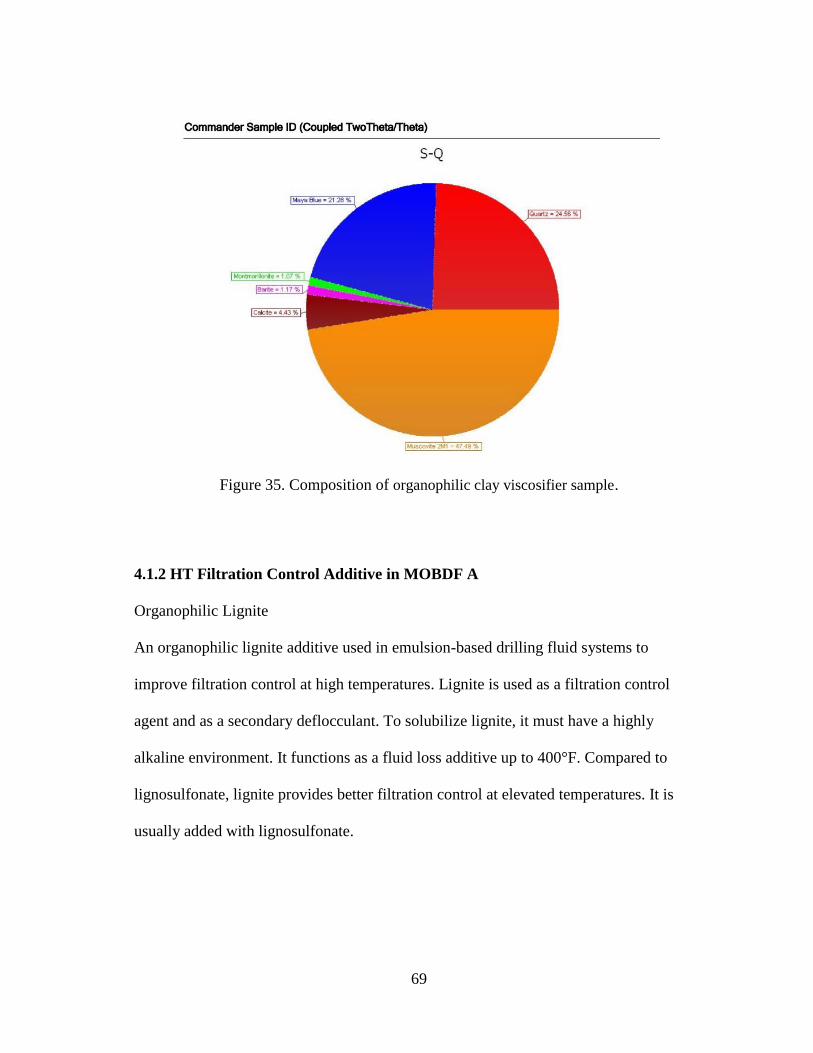
69
Figure 35. Composition of organophilic clay viscosifier sample.
4.1.2 HT Filtration Control Additive in MOBDF A
Organophilic Lignite
An organophilic lignite additive used in emulsion-based drilling fluid systems to
improve filtration control at high temperatures. Lignite is used as a filtration control
agent and as a secondary deflocculant. To solubilize lignite, it must have a highly
alkaline environment. It functions as a fluid loss additive up to 400°F. Compared to
lignosulfonate, lignite provides better filtration control at elevated temperatures. It is
usually added with lignosulfonate.

70
Figure 36. X-ray diffraction spectrum of the organophilic lignite sample.
Figure 37. Composition of the of the organophilic lignite sample.

71
4.1.3 Polymer Additive in MOBDF B
Polymer A
The filtration control agent is a cross-linked polymer that can provide filtration control in all
non-aqueous systems up to about 425°F (218°C). It can also provide secondary viscosity and is
suitable for use in fluids designed for deep water applications. Polymer A was the primary
filtration control agent for the clay-free invert emulsion fluid used in this work.
Applications/Functions
1. Can reduce HP/HT in all oil and synthetic mud systems in temperature ranges up
to 425°F (218°C).
2. Can provide secondary viscosity.
Properties
1. Appearance: Off-white powder.
2. Specific gravity: 1.03

72
Figure 38. Polymer A
4.2 Rheological Properties of MOBDF A and B
The main objective of this project was to develop an organophilic clay-free
drilling fluid formula capable of performing similarly to an already tested drilling fluid
formula containing organophilic clay additives. Polymer A was used as a viscosifier and
filtration control agent in MOBDF B as previously stated. The performance and stability
of MOBDF B was examined and compared to the performance of MODF A. The density
of both drilling fluids was kept constant for all the experiments and measured at room
temperature. The properties of MOBDF A and B are given in Table 10 and Table 11
after aging them for 16 hours at 150oF. The rheology was resolved with the Bingham
Plastic and Power Law models. Properties where measured at 120oF.

73
MOBDF A
Table 10. MOBDF A properties after aging at 150oF for 16 hrs.
Properties MOBDF A
Density, lb/ft3 101
Plastic Viscosity, cp 15
Yield Point, lb/100 ft2 16
10 s gel strength, lb/100 ft2 8
10 min gel strength, lb/100 ft2 58
MOBDF B
Table 11. MOBDF B properties after aging at 150oF for 16 hrs.
Properties MOBDF B
Density, lb/ft3 100
Plastic Viscosity, cp 10
Yield Point, lb/100 ft2 14
10 s gel strength, lb/100 ft2 6
10 min gel strength, lb/100 ft2 38
MOBDF A and B Comparison at Temperatures and Shear Rates
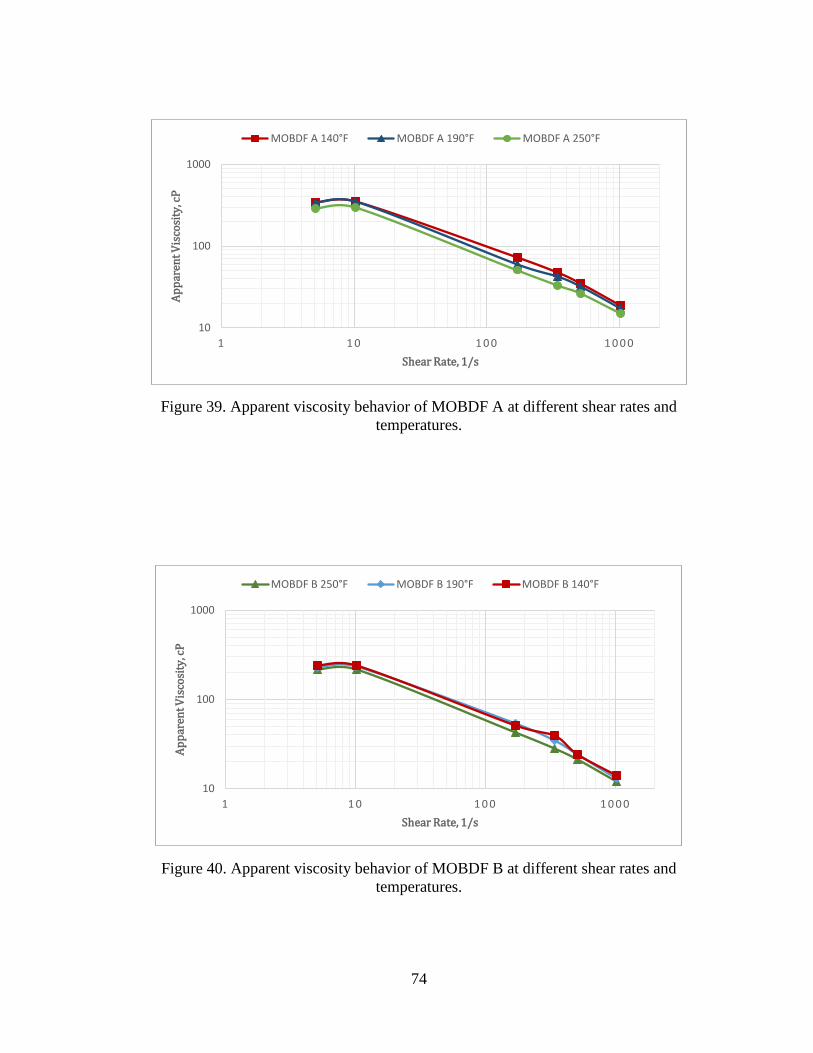
74
Figure 39. Apparent viscosity behavior of MOBDF A at different shear rates and
temperatures.
Figure 40. Apparent viscosity behavior of MOBDF B at different shear rates and
temperatures.
10
100
1000
1 1 0 1 0 0 1 0 0 0
Ap
par
ent
Vis
cosi
ty, c
P
Shear Rate, 1/s
MOBDF A 140°F MOBDF A 190°F MOBDF A 250°F
10
100
1000
1 1 0 1 0 0 1 0 0 0
Ap
par
ent
Vis
cosi
ty, c
P
Shear Rate, 1/s
MOBDF B 250°F MOBDF B 190°F MOBDF B 140°F

75
Figure 41. Apparent viscosity comparison between MOBDF A and B at 140oF.
Table 12. Comparison between MOBDF A and B properties at 140oF.
Properties MOBDF A MOBDF B
Density, lb/ft3 101 99
Plastic Viscosity, cp 16 10
Yield Point, lb/100 ft2 16 14
10 s gel strength, lb/100 ft2 8 6
10 min gel strength, lb/100 ft2 62 38

76
Figure 42. Apparent viscosity comparison between MOBDF A and B at 190oF.
Table 13. Comparison between MOBDF A and B properties at 190oF.
Properties MOBDF A MOBDF B
Density, lb/ft3 100 100
Plastic Viscosity, cp 15 11
Yield Point, lb/100 ft2 17 13
10 s gel strength, lb/100 ft2 9 6
10 min gel strength, lb/100
ft2 62
36

77
Figure 43. Apparent viscosity comparison between MOBDF A and B at 250oF.
Table 14. Comparison between MOBDF A and B properties at 250oF.
Properties MOBDF A MOBDF B
Density, lb/ft3 101 100
Plastic Viscosity, cp 11 9
Yield Point, lb/100 ft2 15 12
10 s gel strength, lb/100 ft2 8 6
10 min gel strength, lb/100 ft2 65 35
4.3 Filtration Control of MOBDF A and B
Filtration tests were conducted using the HP/HT filter press under static
conditions. Both drilling fluids were put in the cell and the temperature and pressure

78
were adjusted to 140°F/300 psi, 190oF/300 psi, and 250oF/500 psi. High permeability
Indiana limestone cores with a thickness of 1 in. and a diameter of 2.5 in. were used for
this experiment. First, the filter cake was formed at this temperature and pressure. The
filtrate was collected over a 30-minute interval and the results of the fluid loss
experiments are given in Figures 44 and 45 respectively. It shows that the fluid loss was
more prominent for MOBDF A.
Relation of filtrate volume to the square root of time
HP/HT filtration results for constant differential pressure are usually plotted as
cumulative filtrate volume versus square root of time. This is because theoretically,
cumulative filtrate volume is proportional to the square root of time for constant
differential pressure. In general, the line of cumulative filtrate volume does not pass
through the origin, as indicated in Figure 44 due to the spurt loss to the formation before
a filter cake is formed. The spurt loss and the cumulative filtrate volume of every
experiments were recorded in Tables 15 and 16.

79
Figure 44. Cumulative filtrate volume as a function of the square root of the time under
static conditions for MOBDF A at 140, 190, and 250oF.
0,0000
0,5000
1,0000
1,5000
2,0000
2,5000
0,0 5,0 10,0 15,0 20,0 25,0 30,0 35,0 40,0 45,0
Cu
mu
lati
ve F
iltr
ate
Vo
lum
e, c
m3
Square root of time, s0.5
MOBDF A 140°F/300psi MOBDF A 190°F/300psi MOBDF A 250 F/500psi

80
Figure 45. Cumulative filtrate volume as a function of the square root of the time under
static conditions for MOBDF B at 140, 190, and 250oF
Table 15. Spurt Loss MOBDFs.
Experimental
Conditions
Spurt Loss
MOBDF A, ml
Spurt Loss
MOBDF B, ml
140oF/300 psi 0.4 0.1
190oF/300 psi 0.6 0.05
250oF/500 psi 0.6 0.1
0,0000
0,2000
0,4000
0,6000
0,8000
1,0000
1,2000
1,4000
0,0 5,0 10,0 15,0 20,0 25,0 30,0 35,0 40,0 45,0
Cu
mu
lati
ve F
iltr
ate
Vo
lum
e, c
m3
Square root of time, s0.5
MOBDF B 140°F/300 psi MOBDF B 190°F/300 psi MOBDF B 250°F/500 psi

81
Table 16. Cumulative Filtrate Volume MOBDFs.
Experimental
Conditions
Filtrate Volume
MOBDF A, ml
Filtrate Volume
MOBDF B, ml
140oF/300 psi 2.2 1.3
190oF/300 psi 1.0 0.8
250oF/500 psi 1.6 0.6
Figure 46. Cumulative filtrate volume as a function of the square root of the time under
static conditions. Comparison between MOBDF A and B at 140oF.
0,0000
0,5000
1,0000
1,5000
2,0000
2,5000
0,0 5,0 10,0 15,0 20,0 25,0 30,0 35,0 40,0 45,0
Cu
mu
lati
ve F
iltr
ate
Vo
lum
e, c
m3
Square root of time, s0.5
MOBDF A 140°F/300psi MOBDF B 140°F/300psi

82
Figure 47. Cumulative filtrate volume as a function of the square root of the time under
static conditions. Comparison between MOBDF A and B at 190oF.
0,000
0,200
0,400
0,600
0,800
1,000
1,200
0,0 5,0 10,0 15,0 20,0 25,0 30,0 35,0 40,0 45,0
Cu
mu
lati
ve F
iltr
ate
Vo
lum
e, c
m3
Square root of time, s0.5
MOBDF A 190°F/300psi MOBDF B 190°F/300psi

83
Figure 48. Cumulative filtrate volume as a function of the square root of the time under
static conditions. Comparison between MOBDF A and B at 250oF.
4.4 Filter Cake Thickness
The thickness of the deposited filter cakes varies considerably depending on the
composition of the muds, depositional environments, nature of interactive forces
prevailing during the period of deposition, etc. Which is why the formed filter cake can
provide valuable information about the drilling fluid quality and can help take corrective
measures in designing a drilling fluid. Formation of a thick filter cake during static
filtration indicates the possibility of formation of a thick cake on the borehole wall
during the period of non-circulation with a reduction in hole diameter. This will cause an
0,0000
0,2000
0,4000
0,6000
0,8000
1,0000
1,2000
1,4000
1,6000
1,8000
0,0 5,0 10,0 15,0 20,0 25,0 30,0 35,0 40,0 45,0
Cu
mu
lati
ve F
iltr
ate
Vo
lum
e, c
m3
Square root of time, s0.5
MOBDF A 250°F/500psi MOBDF B 250°F/500psi

84
increase in the angle of contact between the cake and drill collar in case of a pipe stuck
problem. Figures 49 through 54 show the thicknesses of the filter cakes formed during
static filtration under the conditions already specified. The thicknesses of the filter cakes
formed by MOBDF B were slightly lower than MOBDF A in some cases.
Figure 49. Filter cake thickness formed by MOBDF A at 140oF/300 psi.
Figure 50. Filter cake thickness formed by MOBDF A at 190oF/300 psi.

85
Figure 51. Filter cake thickness formed by MOBDF A at 250oF/500 psi.
Figure 52. Filter cake thickness formed by MOBDF B at 140oF/300 psi.
Figure 53. Filter cake thickness formed by MOBDF B at 190oF/300 psi.

86
Figure 54. Filter cake thickness formed by MOBDF B at 250oF/500 psi.
4.5 Filter Cake Porosity
The formation of a filter cake and the invasion of filtrate in the formation change the
near wellbore reservoir characteristics in course of time. These changes affect the
readings of logging tools such as resistivity log, density log and neutron log. Cake
properties have numerous applications both in drilling and reservoir engineering
analyses. These properties also play a key role in numerical modelling of mud-related
drilling and reservoir engineering problems. Filter cake properties such as permeability
and porosity are important parameters for permeability determination in low permeable
formations during drilling.
4.6 Porosity Determination
The Indiana limestone cores were scanned before each experiment in dry and wet
conditions to determine their initial porosity.
1. Dry conditions: Each core was dried in the oven for 16 hrs at 150oF.
2. Wet conditions: Each core was saturated with a 5wt% KCl brine for 48
hours prior to the day of the experiment.

87
The porosity of each core was determined using equation 13 and the results recorded in
Table 17.
=𝐶𝑇𝑤𝑒𝑡 − 𝐶𝑇𝑑𝑟𝑦
𝐶𝑇𝑏𝑟𝑖𝑛𝑒 − 𝐶𝑇𝑎𝑖𝑟 ……………………………………………………..……(13)
where,
CTwet = CT number of the core after being saturated with the KCl brine
CTdry= CT number of the dry core
CTbrine = CT number of the KCl brine, (CTN = 53.89)
CTair = CT number of air, (CTN = -1000)
Table 17. Initial porosity of Indiana Limestone cores
Core # Porosity,
1 25%
2 27%
3 30%
4 23%
5 25%
6 28%
The porosity of the filter cake formed by the MOBDFs was determined similarly using
equation 13. The results are shown in Table 18 below:

88
Table 18. Porosity of the filter cakes formed by the MOBDFs.
Core # Experimental Conditions Porosity,
1 MOBDF A 140oF/300 psi 8%
2 MOBDF A 190oF/300 psi 5%
3 MOBDF A 250oF/500 psi 7%
4 MOBDF B 140oF/300 psi 2.5%
5 MOBDF B 190oF/300 psi 2.5%
6 MOBDF B 250oF/500 psi 3.5%
4.7 Filter Cake Removal Efficiency
The efficiency of removing the filter cake was done by measuring the weight of
the Indiana limestone core after being saturated in the 5wt% KCl brine for 48 hours.
After forming the filter cake at the desired temperature and pressure with the MOBDFs,
the weight of the core was measured a second time. A third and final weight
measurement was taken after soaking the core in the removal solution for 6 hours.
Efficiency was calculated using equation 14 based on weight differences before and after
the filter cake removal treatment.
𝐸𝑓𝑓𝑖𝑐𝑖𝑒𝑛𝑐𝑦 =𝑤2 − 𝑤3
𝑤2 − 𝑤1 ……………………………………………………… (14)
where,
w1 = weight of the Indiana limestone core saturated in 5wt% KCl brine
w2 = weight of the Indiana limestone core with formed filter cake

89
w3 = weight of the Indiana limestone core after removal treatment
Tables 19 and 20 give the efficiency of filter cake removal for MOBDF A and B,
respectively, at the different experimental conditions.
Table 19. Efficiency of filter cake removal for MOBDF A
Experimental Conditions
Measured weights,
g
140oF /300 psi 190oF /300 psi 250oF /500 psi
w1 49.8 45.3 48.2
w2 57.8 54.6 56.8
w3 50.4 46.5 48.8
Efficiency (%) 91.3 90.5 93.1

90
Table 20. Efficiency of filter cake removal for MOBDF B
Experimental Conditions
Measured
weights, g
140oF /300 psi 190oF /300 psi 250oF /500 psi
w1 49.3 48.9 49.6
w2 56.6 55.4 57.4
w3 49.9 49.3 50.3
Efficiency (%) 91.6 92.4 91.8
4.8 Filter Cake Permeability
Depending on the porosity of the filter cake obtained from the CT scan, Khatib
(1994) provided an empirical relationship to obtain the permeability of the filter cake
shown in equation 15.
𝑘𝑐 = 112.7 ∗ 𝑒−8.8(1−𝜙𝑐) …………………………………………………... (15)
kc = permeability of the filter cake
ϕc = porosity of the filter cake
The results of the calculated permeabilities of the filter cakes formed by MOBDFs A and
B are shown in Table 21.

91
Table 21. Filter cake permeability using MOBDF A and B.
Experimental Conditions
Permeability (kc),
md 140oF /300 psi 190oF /300 psi 250oF /500 psi
MOBDF A 0.034 0.026 0.031
MOBDF B 0.021 0.021 0.023
4.9 Evaluation of Formation Damage
4.9.1 Retained Permeability
Coreflood tests were performed to determine the removal efficiency of the filter
cakes generated by MOBDF A and B at a temperature of 250oF. The back pressure and
overburden pressures were set at 1100 psi and 1600 psi, respectively. Indiana limestones
cores were used for the test.
The initial permeability of each core used in these experiments was measured
using Darcy’s law, Equation 16.
𝑘 = 122.812 ∗ 𝑞 ∗ µ ∗ ℎ
𝛥𝑝 ∗ 𝑑2 …………………..……………………………(16)
where,
k = permeability of the core, md
q = flow rate, cm3/min
µ = fluid viscosity, cp
h = core thickness
Δp = differential pressure, psi
d = diameter through which the brine solution will flow, in

92
The time required to flow 1 pore volume (PV) of 5 wt% KCl brine at a constant
pressure was recorded. The same procedure was performed after the removal of the filter
cake to calculate the final permeability. The retained permeability was calculated using
equation 17.
𝑘𝑟 = 𝑘𝑓
𝑘𝑖∗ 100% ……………………………………………………………… (17)
where,
kr = retained permeability, md
kf = final permeability, md
ki = initial permeability, md
The core pore volume (PV) was calculated from the density of the brine (ρbrine =
1.03 g/cm3 at 70oF) and the weight difference in both dry and saturated cases of the
Indian limestone cores as shown in Equation 18.
𝑃𝑉 = 𝑤𝑠𝑎𝑡 − 𝑤𝑑𝑟𝑦
𝜌𝑏𝑟𝑖𝑛𝑒
………………………………………………………………(18)
where,
PV = pore volume of the Indian limestone core
wsat = weight of the Indiana limestone core saturated in 5wt% KCl brine
wdry = weight of the Indiana limestone core after being dried
ρbrine = density of the 5 wt% KCl brine

93
The results of the retained permeabilities after removing the filter cakes
generated by MOBDFs A and B are shown in Table 22.
Table 22. Retained Permeabilities
Core ID MOBDF
Used
Pore
Volume,
cm3
Initial
Permeability,
md
Final
Permeability,
md
Retained
Permeability,
%
IndiA A 9.26 100.75 78.14 77.56
IndiB B 9.67 100.34 89.33 89.04
4.9.2 Rock Wettability
Drop Shape Analysis (DSA) was used to determine the wettability of MOBDF A
and B and the effectiveness of the filter cake removal treatment to breakdown the
drilling fluids at 250oF/500 psi. Five sandstone disks were dried for 12 hours at 140oF
and labeled disk 1, 2, 3, 4, 5, 6, respectively. Table 23 shows the minerology of the
Berea sandstone disks used for DSA.
Disk 1, was saturated with a 5wt% brine KCl for 24 hours to measure the initial
wettability of sandstone disk. Disks 2 and 3, were saturated in MOBDF A and B
emulsion, respectively, for 24 hours to measure the wettability of sandstone disk after
being in contact with the MOBDFs emulsion. Finally, Disks 4 and 5 were saturated with
a blend of MOBDF A and B emulsion, respectively, and the removal treatment (1:1
ratio) for 24 hours, to measure the effectiveness of the removal treatment to break down
the MOBDFS.

94
The contact angle was measured using the captive drop method, with the
injection of a crude oil droplet on to the sandstone disk’s surface. The crude oil drop was
maintained on the disk’s surface for at least 2 minutes before using Drop Shape Analysis
software to capture the drop image and the contact angle value. The resulting
measurements were recorded in Table 24 and 25.
Table 23. Minerology of Berea sandstone cores
Minerology Quartz Kaolinite Microline Muscovite Smectite
Concentration, wt% 91 3 4 1 1
Figure 55. Contact angle measurement of disk 1 at 250oF/500 psi.

95
Figure 56. Contact angle measurements of disk 2 and 4. Using MOBDF A at 250oF/500
psi.
Figure 57. Contact angle measurements of disk 3 and 5. Using MOBDF B at 250oF/500
psi.

96
Table 24. DSA contact angle measurements.
Disk ID Saturated in with Contact Angle, o Wettability
Disk 1 5wt% brine KCl 58 Water-wet
Disk 2 MOBDF A 107 Oil-wet
Disk 3 MOBDF B 162 Oil-wet
Disk 4 MOBDF A + Removal treatment 82 Oil-wet
Disk 5 MOBDF B + Removal treatment 65 Oil-wet
𝑀𝑂𝐵𝐷𝐹 𝐵𝑟𝑒𝑎𝑘𝑑𝑜𝑤𝑛 𝐸𝑓𝑓𝑖𝑐𝑖𝑒𝑛𝑐𝑦 = 𝜃𝑀𝑂𝐵𝐷𝐹 − 𝜃𝑀𝑂𝐵𝐷𝐹+ 𝑟𝑒𝑚𝑜𝑣𝑎𝑙 𝑡𝑟𝑒𝑎𝑡
𝜃 𝑀𝑂𝐵𝐷𝐹 ………… (19)
where,
Θ MODF = Measured contact angle with disk saturated by MOBDF
Θ MOBDF + Removal treat = Measured contact angle with disk saturated by MOBDF + Removal treatment
Table 25. MOBDFs breakdown efficiency.
Breakdown Efficiency, %
MOBDF A 23.11
MOBDF B 59.86

97
5. CONCLUSIONS
The experiments carried out in this work revealed that a clay-free mineral oil-based
drilling fluid formula can be developed successfully by replacing all organophilic clay
additives with a cross-linked polymer as a viscosifier and filtration control agent. Based
on the results obtained from the rheology tests performed on the clay-free mineral oil-
based drilling fluid, we can conclude that the viscosity and suspension characteristics of
this drilling fluid were slightly improved compared to a drilling fluid containing
organophilic clay additives. The apparent viscosity of MOBDF B was lower (PV= 9-11
cp) than the apparent viscosity of MOBDF A (PV= 11-16 cp) when subjected to
different temperatures. MOBDF B also exhibited good ability to suspend cuttings (YP=
14 lb/100 ft2) at different temperatures and pressures. The clay-free mineral oil-based
drilling fluid exhibited good filtration properties a thin filter cake (≤ 0.06 in), small
filtrate volume (≤1.3 ml), small spurt loss (≤0.1 ml), and a filter cake permeability less
than 0.04 md under the experimental conditions set for this stud. The removal efficiency
of the filter cake generated by the clay-free mineral oil-based drilling fluid was very
similar to the removal efficiency of the drilling fluid containing organophilic clay
additives (90-93%). After filter cake removal, the retained permeability measured for the
clay-free mineral oil-based drilling fluid (89.04%) was higher than the retained
permeability attained after removing the filter cake formed by the drilling fluid
containing organophilic clay additives (77.56%).

98
6. FUTURE WORK
After considering the positive performance under the experimental parameters set for
the clay-free mineral oil-based drilling fluid formula, it would be ideal to assess its
performance under more severe conditions. Test the ability of the drilling fluid formula
to build viscosity and gel strength in high pressure and high temperature (HP/HT)
wellbore conditions and low temperatures (inside risers). Evaluate and characterize the
filter cake formed by the clay-free mineral oil-based drilling fluid formula using
different weighting materials, and determine the most efficient way to remove it.
The suggested experimental plan is described below:
1. Determine the rheological properties of the clay-free mineral oil-based drilling fluid
formula at the following range of temperatures:
1.1 Viscosity at 5, 10, 400, and 450ºF
1.2 PV at 5, 10, 400, and 450ºF
1.3 YP at 5, 10, 400, and 450ºF
1.4 Gel Strength at 5, 10, 400, and 450ºF
2. Determine the rheological properties of the clay-free mineral oil-based drilling fluid
formula at the following range of wellbore conditions:
2.1 5°F/1000psi, 5°F/2000psi, 5°F/3000psi, 5°F/4000psi
2.2 10°F/1000psi, 10°F/2000psi, 10°F/3000psi, 10°F/4000psi
2.3 400°F/1000psi, 400°F/2000psi, 400°F/3000psi, 400°F/4000psi

99
2.4 450°F/1000psi, 450°F/2000psi, 450°F/3000psi, 450°F/4000psi
3. Test different weighting materials for the clay free mineral oil-based drilling fluid
formula:
3.1 Ilmenite (FeTiO3)
3.2 Manganese Tetroxide (Mn3O4)
5. Test the efficiency of different removal treatments to remove the filter cake generated
by the clay free mineral oil-based drilling fluid formula.
5.1 Acids
5.2 Chelating agents
5.3 Oxidizers
5.4 Enzymes

100
REFERENCES
Ackal, K., and Gillikin, A. 2010. Clay-Free Synthetic-Based Fluid Provides High-Angle
Wellbore Stability with Minimal Dilution and Treatment Requirements, paper SPE
127560 presented at the 2010 IADC/SPE Drilling Conference and Exhibition, New
Orleans, Louisiana, USA, 2-4 February 2010.
Akin, S. and Kovscek, A.R. 2003. Computed Tomography in Petroleum Engineering
Research. Geological Society, London, Special Publications 215 (1): 23-38.
Al Moajil, A.M., and Nasr-El-Din, H. 2011. Formation Damage Caused by Improper
Mn3O4-Based Filter Cake Cleanup Treatments, paper SPE 144179 presented at the
European Formation Damage Conference, Noordwyk, The Netherlands, 5-7 June.
Alotaibi, M.B., Nasr-El-Din, H.A., Hill, A.D., Al Moajil, A.M. 2007. An Optimized
Method to Remove Filter Cake Formed by Formate Based Drill-in Fluid in
Extended Reach Wells. Paper SPE 109754 presented at Asia Pacific Oil and Gas
Conference and Exhibition, Jakarta, Indonesia. 30 October-1 November.
Al-Yami, A.S., Nasr-El-Din, H.A., Bataweel, M.A. et al. 2008. Formation Damage
Induced by Various Water-based Fluids Used to Drill HP/HT Wells. Paper SPE
112421-MS presented at the SPE International Symposium and Exhibition on
Formation Damage Control, Lafayette, Louisiana, USA, 13-15 February.
Amani, M., M Al-Jubouri, A. Shadravan. 2012. Comparative Study of Using Oil-Based
Mud Versus Water-Based Mud in HP/HT Fields. Advances in Petroleum
Exploration and Development. Vol. 4. Iss. 2. Pag. 18-27.
101
Bageri, B.S., Al-Mutairi, S.H., and Mahmoud, M.A. 2013. Different Techniques for
Characterizing the Filter Cake, paper SPE 163960 presented at the SPE Middle
East Unconventional Gas Conference and Exhibition, Muscat, Oman, 28-30
January.
Baker Hughes. 2006. Chapter 1- Fundamentals of Drilling Fluids. In Drilling Fluids
Reference Manual, 1-133.
Baker Hughes. 2006. Chapter 5- Oil/Synthetic Drilling Fluids. In Drilling Fluids
Reference Manual, 211-280.
Bourgoyne, A. T., Jr., K. K. Millheim, M. E. Chenevert et al. 1986. Applied Drilling
Engineering, Society of Petroleum Engineers (Reprint). SPE-31656-MS
Bourgoyne, A.T., Millheim, K.K., Chenevert, M.E., and Young, F.S. 1991. Applied
Drilling Engineering (revised printing), Textbook Series, SPE, Richardson, Texas
2.
Burrows, K., Carbajal, D., Kirsner, J. et al. 2004. Benchmark Performance: Zero Barite
Sag and Significantly Reduced Downhole Losses with the Industry’s First Clay-
Free Synthetic-Based Fluid paper SPE 87138 presented at the IADC/SPE Drilling
Conference, Dallas, Texas, USA, 2-4 March.
Carbajal, D.L., Burress, C.N., Shumway, W. et al. 2009. Combining Proven Anti-Sag
Technologies for HP/HT North Sea Applications: Clay-Free Oil-Based Fluid and
Synthetic, Sub-Micron Weight Material. Paper SPE 119378-MS presented at the
SPE/IADC Drilling Conference and Exhibition, Amsterdam, The Netherlands, 17–
19 March
102
De Stefano, G., Stamatakis, E., and Young, S. 2013. Development and Application of
Ultra-HTHP Drilling Fluids, paper SPE/OMC 2013-104 presented at Offshore
Mediterranean Conference and Exhibition, Ravenna, Italy, 20-22 March.
Elkatany, S.M., Nasr-El-Din, H., and Al Moajil, A. 2012. Evaluation of a New
Environmentally Friendly Treatment to Remove Mn3O4 Filter Cake, paper
IADC/SPE 156451 presented at the Asia Pacific Drilling Technology Conference
and Exhibition, Tianjin, China, 9-11 July.
Elkatatny, S. M, Mahmoud, M.A., and Nasr-El-Din, H.A. 2012. Characterization of
Filter Cake Generated by Water-Based Drilling Fluids Using Ct Scan. SPE
Drilling & Completion 27 (2): 282-293. SPE-144098-PA.
Elkatatny, S.M., Xiao, J., Nasr-El-Din, H.A. et al. 2013. Using Hydrochloric Acid to
Remove Ilmenite Water-Based Filter Cake in HP/HT Applications, paper SPE
165181 presented at the SPE European Formation Damage Conference &
Exhibition, Noordwijk, The Netherlands, 5-7 June.
Elkatatny, S.M., Nasr-El-Din, H.A., and Al-Bagoury, M. 2012. Evaluation of Ilmenite as
Weighting Material in Water-Based Drilling Fluids for HP/HT Applications, paper
SPE presented at the SPE Kuwait International Petroleum Conference and
Exhibition, Kuwait City, Kuwait, 10-12 December.
El-Monier, E. A. and Nasr-El-Din, H. A. 2010. A New Environmentally Friendly Clay
Stabilizer. SPE Prod & Oper. 28 (2): 145-153. SPE-136061-PA.
Golis, S.W. 1984. Oil Mud Techniques Improve Performance in Deep, Hostile
Environment Wells, paper SPE 13156 presented at the SPE Annual Technical
Conference and Exhibition, Houston, Texas, USA 16-19 September.

103
Guo, H., Vocken, J., Opstal, T., et al. 2012. Investigation of the Mitigation of Lost
Circulation in Oil-Based Drilling Fluids Using Additives. Paper SPE 151751
presented at the International Symposium and Exhibition on Formation Damage
Control, Lafayette, Louisiana, USA, 15-17 February.
Gusler, W., Pless, M., Maxey, J., Grover, and P., Perez, J.: “A New Extreme-HP/HT
Viscometer for New Drilling Fluid Challenges,” paper SPE 99009 presented at the
2006 IADC/SPE Drilling Conference, Miami, Florida, USA 21-23 February.
Ibeh, C. S. 2007. Investigation on the Effects of Ultra-High Pressure and Temperature on
the Rheological Properties of Oil-based Drilling Fluids. Master of Science Thesis,
Texas A&M University.
Kageson-Lee, N., Watson, R., and Prebensen, O.I. 2007. Formation Damage
Observations on Oil-Based-Fluid System Weighted with Treated Micronized
Barite, paper SPE 107802 presented at the European Formation Damage
Conference, Scheveningen, The Netherlands, 30 May – 1 June.
Khatib, Z., 1994. Prediction of Formation Damage Due to Suspended Solids; Modeling
Approach of Filter Cake Buildup in Injectors, paper SPE 28488 presented at the
Annual Technical Conference and Exhibition, New Orleans, Louisiana, USA, 25-
28 September.
Kulkarni, D., Maghrabi, S., and Wagle, V. 2014. Synergistic Chemistry Tailors Invert
Emulsion Fluids (IEF) with Consistent Rheology to Minimize Equivalent
Circulating Density (ECD) Fluctuations, paper SPE 171695 presented at the Abu
Dhabi International Petroleum Exhibition and Conference, Abu Dhabi, UAE, 10-
13 November.

104
Mahrous, R., Barkmann, T., Elshout, N. et al. 2016. Innovative Low-ECD Organo-Clay-
Free Invert Emulsion Fluid OCF-IEF System Helped Operations Hit Target, paper
SPE-180633 presented at the IADC/SPE Asia Pacific Drilling Technology
Conference Singapore, 22-24 August.
Martini, L., Ripa, G., Pellicanò, et al. 2017. Clay-Free Drill-In Fluid Reduces the Total
Cost of Ownership While Exceeding Production Expectations, paper OMC-2017-
648 presented at the Offshore Mediterranean Conference, Ravenna, Italy, 29-31
March.
Mas, M., Tapin, T., Marquez, R. et al. 1999. A New High-Temperature Oil-Based
Drilling Fluid, paper SPE 53941 presented at the Latin American and Caribbean
Petroleum Engineering Conference, Caracas, Venezuela, 21-23 April.
Mao, H., Qiu Z., and Xie, B. 2016. Development and Application of Utra-High
Temperature Drilling Fluids in Offshore Oilfield Around Bohai Sea Bay, China,
paper SPE/OTC 26384 presented at the Offshore Technology Conference Asia,
Kuala Lumpur, Malaysia, 22-25 March.
McKinney, L.K., Iyoho, W., and Azar, J.J. 1988. Formation Damage Due to Synthetic
Oil Mud Filtrates at Elevated Temperatures and Pressures, paper SPE 17162
presented at SPE Formation Damage Control Symposium, Bakersfield, California,
USA 8-9 February.
Melbouci, M. and Sau Arjun, C. 2006. Water-Based Drilling Fluids. U.S. patent No.
20060019834 (January 2006).

105
Methven, N., and Baumann, R. 1972. Performance of Oil Muds at High Temperatures,
paper SPE 3743 presented at SPE European Spring Meeting, Amsterdam,
Netherlands, 16-18 May.
Mitchell, R. F., S. Z. Miska. 2011. Fundamentals of Drilling Engineering, Vol. 12: SPE
Textbook Series, Society of Petroleum Engineers (Reprint).
Mohammed, A.H. 2001. Effect of Drilling Fluid Particle Sizes on Formation Damage:
Application to Horizontal Well, M.S thesis, King Fahad University of Petroleum &
Minerals, Dhuhran, Saudi Arabia.
Morton, E.K., Bomar, B.B., Schiller, M.W. et al. 2005. Selection and Evaluation Criteria
for High-Performance Drilling Fluids, paper SPE 96342 presented at SPE Annual
Technical Conference and Exhibition, Dallas, Texas, USA, 9-12 October.
Njobuenwu, D.O. and Wobo, C.A. Effect of Drilled Solids on Drilling Rate and
Performance. Journal of Petroleum Science and Engineering, 55, 3-4: 271-276
(February 2007).
Novelline, R.A. 2004. Squire's Fundamentals of Radiology. 6th. Harvard University
Press.
Payne, M. L., and Abbassian, F. 1997. Advanced Torque and Drag Considerations in
Extended-Reach Wells. Society of Petroleum Engineers, paper SPE 35102
presented at the IADC/SPE Drilling Conference, New Orleans, Louisiana, USA,
15-18 March.
Rabia, H. 2001. Chapter 7- Drilling Fluids. In Well Engineering & Construction, 197-
230.

106
Rheological Models. Schlumberger, http://www.glossary.oilfield.slb.com/. Downloaded
23 April 2018.
Rødsjø, M., and Akutsu, E. 2013. Case History: Clay-Free Invert Fluid in Norwegian
High-Temperature Well Provides Consistent Low ECD Profile, paper SPE 166538
presented at the SPE Offshore Europe Oil and Gas Conference and Exhibition,
Aberdeen, UK, 3-6 September.
Rostami, A., and Nasr-El-Din, H. 2010. A New Technology for Filter Cake Removal,
paper SPE 136400 presented at the SPE Russian Oil and Gas Technical
Conference and Exhibition, Moscow, Russia, 26-28 October.
Schmidt, D., Roos, A., and Cline, J. 1987. Interaction of Water with Organophilic Clay
in Base Oils to Build Viscosity, paper SPE 16683 presented at the SPE Annual
Technical Conference and Exhibition, Dallas, Texas, 27-30 September.
Shah, S. N., N. H. Shanker, and C. C. Ogugbue. 2010. Future Challenges of Drilling
Fluids and Their Rheological Measurements, paper AADE-10-DF-HO-41
presented at the AADE Fluids Conference and Exhibition, Houston, Texas, USA,
13-15 June.
Soliman, A.A., 1995. Oil Base Mud in High Pressure, High Temperature Well, paper
SPE 29864 presented at the Middle East Oil Show, Bahrain, 11-14 March.
Tovar, J., Azar, J.J., and Sarma, D.S. 1994. Formation Damage Studies on Reservoir
Rocks Using Water-Base and Oil-Base Muds, paper SPE 27349 presented at the
International Symposium on Formation Damage Control, Lafayette, Louisiana,
USA, 7-10 February.

107
Ventresca, M.L., Betancourt, J., Castillo, J., et al. 1995. Chemical System for Treating
Formation Damage Induced by Inverted Oil Muds, paper SPE 30125 presented at
the European Formation Damage Conference, The Hague, Netherlands, 15-16
May.
Wagle, V., Maghrabi, S., and Kulkarni, D., 2013. Formulating Sag-Resistant, Low-
Gravity Solids-Free Invert Emulsion Fluids, paper SPE 164200 presented at the
Middle East Oil and Gas Show and Conference, Manama, Bahrain, 10-13 March.
Wellington, S.L. and Vinegar, H.J. 1987. X-Ray Computerized Tomography. Journal of
Petroleum Technology 39 (8): 885-898. SPE-16983-PA.
Xiao, J., Nasr-El-Din, H., and Al-Bagoury, M. 2013. Evaluation of micronized Ilmenite
as a Weighting Material in Oil-Based Drilling Fluids for HP/HT Applications,
paper SPE 165184 presented at the European Formation Damage Conference and
Exhibition, Noordwyk, The Netherlands, 5-7 June.
Xiao, J., Nasr-El-Din, H., and Al-Bagoury, M. 2015. Removal of Ilmenite Oil-based
Filter Cake under HP/HT Conditions Using Hydrochloric Acid, paper SPE 175728
presented at the North Africa Technical Conference and Exhibition, Cairo, Egypt,
14-16 September.
Xie, J. 2001. Models for Filtration During Drilling, Completion and Stimulation
Operations. PhD dissertation, The University of Texas, Austin, Texas.
Xie, S., Deng, H., Wang, R. et al. 2013. Useful Recycling and Safe Disposal Technology
of Waste Oil Drilling Fluids and Its Application, paper SPE/IPTC 16623 presented
at the International Petroleum Technology Conference, Beijing, China, 26-28
March.