a summary of the eighth district member bank business loan ... · a summary of the eighth district...
TRANSCRIPT

May 1956 Volume X X X V III Number 5
A Summary of the Eighth District Member Bank Business Loan Survey
A NATION-WIDE SURVEY of business loans was conducted as of October 5,1955.
In the Eighth District, member banks made numerous business loans of various sizes to concerns in many industries. But, by number, most loans were to comparatively small firms.
Terms on individual loans varied greatly as banks adapted them to the requirements of borrowers. Effective interest rates on most loans ranged from 3 per cent to 10 per cent. The majority of the advances had maturities of less than a year, but many term loans were granted. Likewise, there was great variation in the type of security pledged, method of repayment and granting of commitments.
F e d crtM A e s e y v e H a n kW 7<Sf. L o u t s
Digitized for FRASER http://fraser.stlouisfed.org/ Federal Reserve Bank of St. Louis
Business Loans:A Summary of the Eighth District
Member Bank Business Loan Survey
(^O M M E R C IA L BANKS, as the adjective "commercial" implies, have traditionally considered lending to business their primary function. To be sure, for a time during the 1930's, the relative importance of loans declined compared with other banking assets, and in the war years of the early 1940*s bank credit expansion was largely directed into investments in Government securities. Nevertheless, in the postwar period loans have been regaining their characteristic share of the commercial banks' assets, and despite a rapid growth in loans for other purposes, advances to commerce and industry are still the most important, in terms of volume, of the various types of loans.
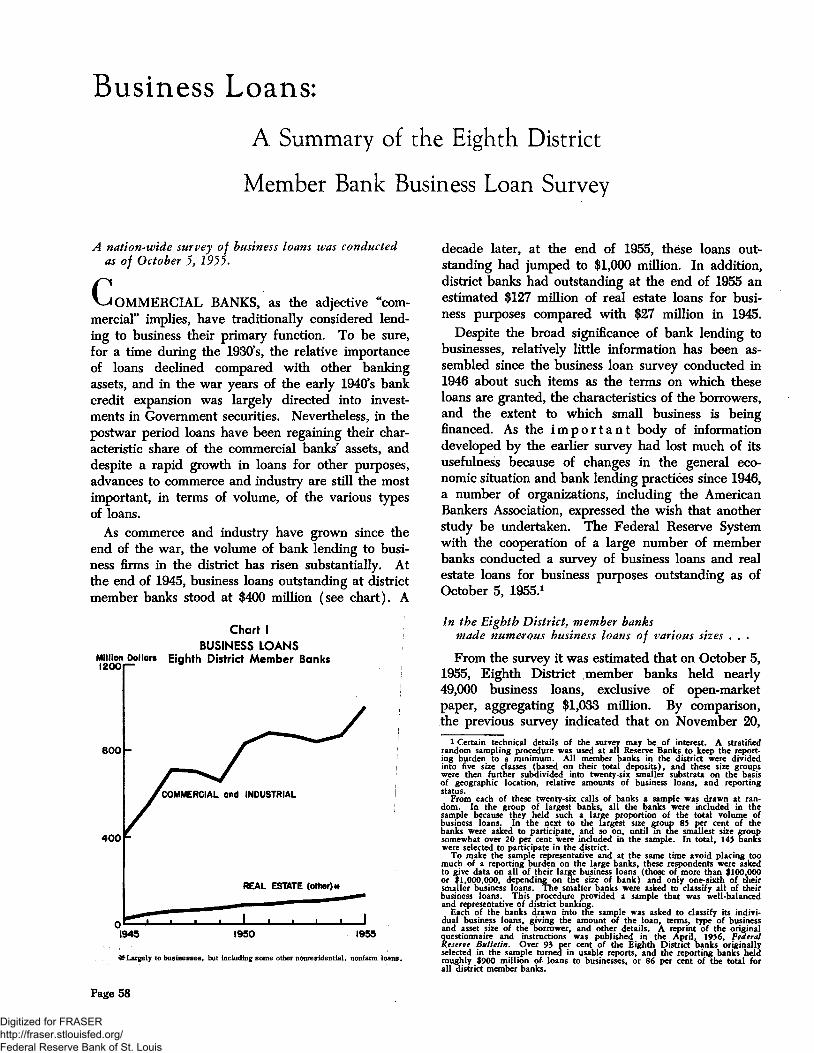
As commerce and industry have grown since the end of the war, the volume of bank lending to business Brms in the district has risen substantially. At the end of 1945, business loans outstanding at district member banks stood at $400 million (see chart). A
Chart !BUS!NESS LOANS
decade later, at the end of 1955, these loans outstanding had jumped to $1,000 million. In addition, district banks had outstanding at the end of 1955 an estimated $127 million of real estate loans for business purposes compared with $27 million in 1945.
Despite the broad signiBcance of bank lending to businesses, relatively little information has been assembled since the business loan survey conducted in 1946 about such items as the terms on which these loans are granted, the characteristics of the borrowers, and the extent to which small business is being Bnanced. As the i m p o r t a n t body of information developed by the earlier survey had lost much of its usefulness because of changes in the general economic situation and bank lending practices since 1946, a number of organizations, including the American Bankers Association, expressed the wish that another study be undertaken. The Federal Reserve System with the cooperation of a large number of member banks conducted a survey of business loans and real estate loans for business purposes outstanding as of October 5, 1955/
7%
From the survey it was estimated that on October 5, 1955, Eighth District member banks held nearly 49,000 business loans, exclusive of open-market paper, aggregating $1,033 million. By comparison, the previous survey indicated that on November 20,
l Certain technical details of the survey may be of interest. A stratified random sampling procedure was used at all Reserve Banks to keep the reporting burden to a minimum. All member banks in the district were divided into five size classes (based on their total deposits), and these size groups were then further subdivided into twenty-six smaller substrata on the basis of geographic location, relative amounts of business loans, and reporting status.
From each of these twenty-six calls of banks a sample was drawn at random. In the group of largest banks, all the banks were included in the sample because they held such a large proportion of the total volume of business loans. In the next to the largest size group 83 per cent of the banks were asked to participate, and so on, until in the smallest size group somewhat over 20 per cent were included in the sample. In total, 143 banks were selected to participate in the district.
To make the sample representative and at the same time avoid placing too much of a reporting burden on the large banks, these respondents were asked to give data on all of their large business loans (those of more than $100,000 or $1,000,000, depending on the size of bank) and only one-sixth of their smaller business loans. The smaller banks were asked to classify all of their business loans. This procedure provided a sample that was well-balanced and representative of district banking.
Each of the banks drawn into the sample was asked to classify its individual business loans, giving the amount of the loan, terms, type of business and asset size of the borrower, and other details. A reprint of the original questionnaire and instructions was published in the April, 1936, FfSfru/
Over 93 per cent of the Eighth District banks originally selected in the sample turned in usable reports, and the reporting banks held roughly $900 million of loans to businesses, or 86 per cent of the total for all district member banks.
Page 58
Digitized for FRASER http://fraser.stlouisfed.org/ Federal Reserve Bank of St. Louis
1946, district banks held approximately 29,000 loans to commerce and industry totaling $547 million. Put another way, in 1955 the approximate size of the average loan was $21,000, slightly larger than in 1946, but the number of loans at each bank on the average had increased 67 per cent since the early postwar survey.
Both size of loan and number of loans per bank varied greatly. Advances ranged from less than $100 to well over $3,000,000. At the smallest banks (under $2 million of deposits) the average business loan amounted to $3,000. Although the larger banks made numerous small loans, the average loan at these banks was influenced greatly by a few huge advances; thus, at the largest banks (over $100 million of deposits) the average loan amounted to roughly $72,000.
The number of business loans per bank ranged from none at a few banks (engaged primarily in Rnancing farmers and consumers) to about 2,000. At the smallest banks the average number of loans was 27 as against 1,050 at the largest banks. The total loan volume, as might be expected, was highly concentrated in a relatively few big banks where most of the large loans were made. The twenty district member banks wi t h over $50 m i l l i o n deposits lent 76 per cent of all funds advanced (86 per cent of all funds loaned to corporations). However, 73 per cent of the number of advances were made by the banks with less than $50 million of deposits. Smaller banks made 81 per cent of the total number of loans to partnerships and single proprietorships.
TABLE 1
BUS!NESS LOANS OF MEMBER BANKS
Estimated— October 5, 1955
BankDeposit ofDollars DMribution Number ^ Sh b ut& n
(Millions of Dollars)
^00 and over 8 607 58.8% 8,436 17.4%50 - 100 12 176 17.0 4,491 9.22 0 -5 0 26 87 8.4 6,715 13.8
10 - 20 40 56 5.4 6,614 13.62 - 1 0 273 96 9.3 18,802 38.6
Less than 2 133 11 1.1 3,615 7.4
All DistrictBanks 492 1,033 100.0% 48,673 100.0%
Business loans at Eighth District member banks were distributed among commercial and industrial concerns engaged in a wide variety of economic activity. In addition to the usual types of businesses, such as stores, service companies, factories, Rnance
companies, utilities, contractors, real estate firms, and commodity dealers, district banks made numerous loans to firms engaged in various other, less well- known, types of enterprise. The most loans, by number, went to retail establishments, whereas the greatest amount of advances were granted to manufacturing and mining concerns. However, as can be seen in the following table, the most pronounced characteristic of district member bank lending was not the concentration of loans to firms engaged in retailing and manufacturing, but the broad diversification of loan portfolios to virtually all types of commercial and industrial activity.
TABLE 2
BUSINESS LOANS BY TYPE OF BUSINESS
Eighth District Member Banks Estimated— October 5, 1955
Amt Outstanding No. of Loans
of Percent PercentdoHars, Distri. Number Distri.
285 27.6% 7,550 15.5%92 8.9 1,439 3.0
39 3.8 637 1.3
66 6.4 1,748 3.6
30 2.9 1,141 2.3
58 5.6 2,585 5.3
89 8.6 3,757 7.7142 13.7 17,697 36.4
59 5.7 623 1.3127 12.3 819 1.7
46 4.5 1,828 3.766 6.4 3,912 8.0
127 12.3 2,487 5.161 5.9 7,818 16.131 3.0 2,182 4.5
1,033 100.0% 48,673 100.0%
Manufacturing and Mining Food, liquor and tobacco Textiles, apparel and ^ leather ^ ^...........
Wholesale trade....................Retail trade...........................
Comnmditv dealers. .........
All other non-Rnancial. . . .
All Businesses..................
The distribution of loans was signiRcantly different on the survey date than it was in 1946. The most striking feature of the comparison was a much larger proportion of the district total borrowings at the latter date by sales Rnance companies, contractors, real estate Rrms, and businesses engaged in services. These companies have grown rapidly during the postwar period, and their need for bank credit has been great. On the other hand, wholesale trade and transportation, communications and other public utilities accounted for a much smaller per cent of total business loans. Many firms in these industries have recently grown at a less rapid rate than business generally, and they have probably relied to a greater extent on other means of financing, such as reinvested earnings and capital market issues.
Page 59
Digitized for FRASER http://fraser.stlouisfed.org/ Federal Reserve Bank of St. Louis
C h a rt !!
D!STR!BUT!ON OF BUS!NESS LOANS, BY AMOUNT Eighth District M em ber Banks
Estimated
OTHER
urtLfUfs
WHOLESALING
SERVICE
FIRMSySALES
FINANCE RETAILING
OTHER
PUBLICDUTIES
SALES
FINANCE
RETAILING
WHOLESALING
OCTOBER 5, 1955
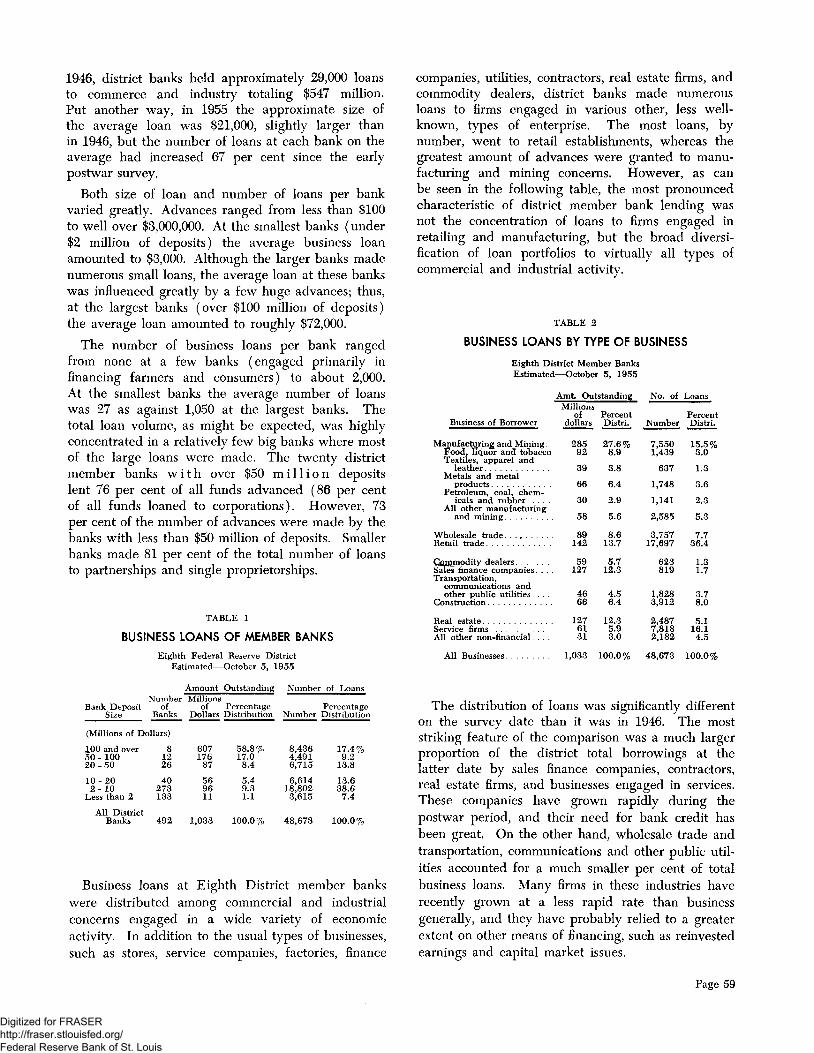
As a group, manufacturing and mining concerns accounted for a somewhat smaller proportion of total business indebtedness in late 1955 than in 1946, but there were significant differences by type of activity. The largest district borrowers in this category, food, liquor and tobacco Brms, declined somewhat in relative importance. Also, petroleum, coal, chemical, and rubber producers received a slightly smaller percentage of total business borrowings.
Conversely, the survey data indicated that textile, apparel, and leather companies accounted for a larger share of the total indebtedness at district member banks. "Other" manufacturing and mining concerns, including glass, lumber, furniture, printing, quarrying, paper, instruments, photography and jewelry, also were heavier borrowers relatively than they were in 1946. Metal and metal products Brms accounted for about the same proportion of total business loans at district member banks as they did in 1946.
An interesting fact underscored by the results of the survey was the large percentage of business loans by Eighth District member banks granted to relatively small Brms. A sizable number of loans were to companies with less than $5,000 of total resources.
NOVEMBER 20,1946
Over 23,600 loans, or nearly half of the total, were to Brms with total assets of less than $50,000. Another 17,700 loans, or 36 per cent of the total were made to Brms ranging in size from $50,000 to $250,000. While the large number of advances to small business reBects the preponderance of small Brms in the total business population, these loans likewise indicate that Bnancing small Brms has been an important activity of district banks. On the other hand, district member banks also extended credit to many of the commercial and industrial giants, Brms with over $100 million of assets.
TABLE 3
BUSINESS LOANS BY S!ZE OF BORROWER
Eighth District Member Banks Estimated— October 5, 1955
Asset Size of Borrower
M irons
Distri. Number Distri.
Less than $50,000.................. 64 6.2% 23,618 48.5%$50,000 to $250,000.............. 192 18.6 ^ 1 7 ,7 1 9 36.4$250,000 to $1,000,000 224 21.7 4,968 10.2
$1,000,000 to $5,000,000. . . 276 26.7 1,536 3.2$5,000,000 to $25,000,000. . 110 10.6 407 0.8$25,000,000 to $100,000,000. 66 6.4 194 0.4$100,000,000 and over......... 101 9.8 231 0.5
All Business Sizes............... 1,033 100.0% 48,673 100.0%
Page 60
Digitized for FRASER http://fraser.stlouisfed.org/ Federal Reserve Bank of St. Louis
There was considerable variation in the size of borrower among the major classes of business. The small concern was predominant in services (such as lodging, repair, amusement, recreation, personal and professional services) and retail trade, and there were many small transportation companies and contractors. The average size of manufacturing and mining firms, wholesale establishments, commodity dealers and sales finance companies was larger. Even in these latter groups, however, many of the loans were to businesses with less than $50,000 of total resources.
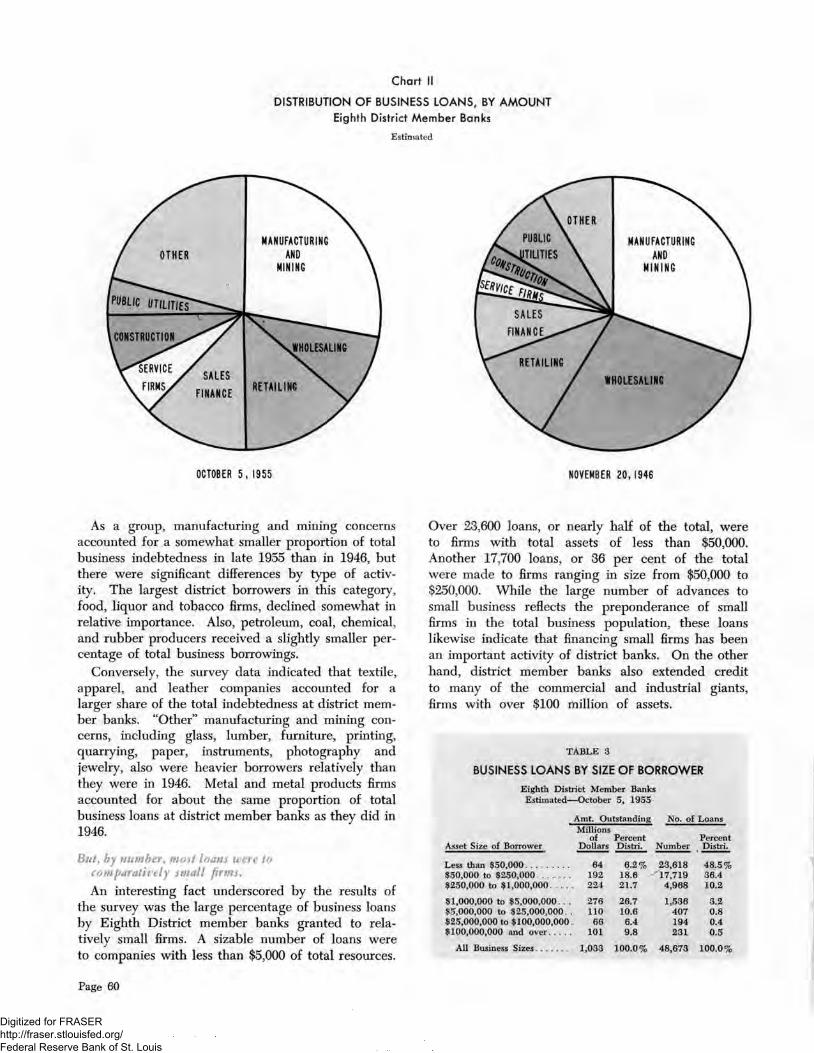
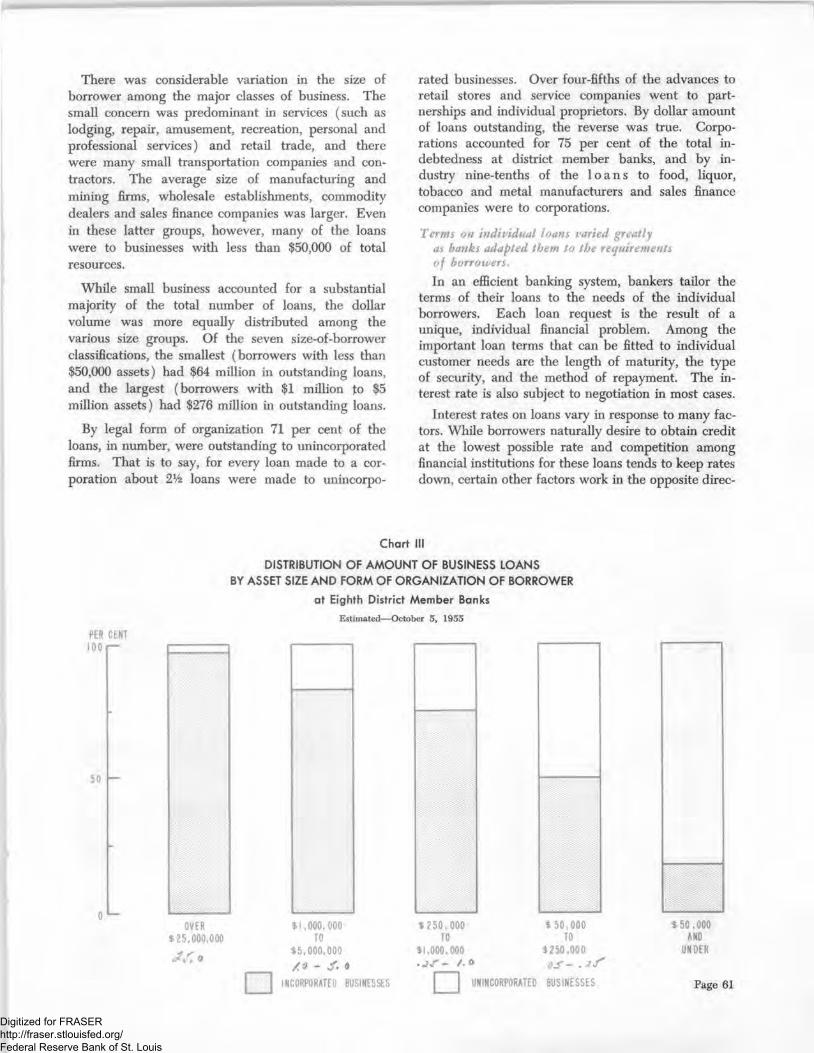
While small business accounted for a substantial majority of the total number of loans, the dollar volume was more equally distributed among the various size groups. Of the seven size-of-borrower classifications, the smallest (borrowers with less than $50,000 assets) had $64 million in outstanding loans, and the largest (borrowers with $1 million to $5 million assets) had $276 million in outstanding loans.
By legal form of organization 71 per cent of the loans, in number, were outstanding to unincorporated firms. That is to say, for every loan made to a corporation about 2% loans were made to unincorpo
rated businesses. Over four-Sfths of the advances to retail stores and service companies went to partnerships and individual proprietors. By dollar amount of loans outstanding, the reverse was true. Corporations accounted for 75 per cent of the total indebtedness at district member banks, and by industry nine-tenths of the l o a n s to food, liquor, tobacco and metal manufacturers and sales finance companies were to corporations.
Tffwy
In an efficient banking system, bankers tailor the terms of their loans to the needs of the individual borrowers. Each loan request is the result of a unique, individual financial problem. Among the important loan terms that can be Etted to individual customer needs are the length of maturity, the type of security, and the method of repayment. The interest rate is also subject to negotiation in most cases.
Interest rates on loans vary in response to many factors. While borrowers naturally desire to obtain credit at the lowest possible rate and competition among financial institutions for these loans tends to keep rates down, certain other factors work in the opposite direc-
Chart !!!
D!STR!BUT!ON OF AMOUNT OF BUS!NESS LOANS BY ASSET S!ZE AND FORM OF ORCAN!ZAT!ON OF BORROWER
at Eighth District Member Banks
Estimated— October 5, 1955
PER CENT!00r-
50
0 *—OVER
$25,000,000$),000, 000
TO$5,000,000
^ a] INCORPORATED BUSINESSES a
$ 250, 000 $ 50,000 TO TO
$t,000,000 3250,000
UN!NC0RP0RATED BUStNESSES
$ 50 ,000 AND
UNDER
Page 61
Digitized for FRASER http://fraser.stlouisfed.org/ Federal Reserve Bank of St. Louis

tion to raise rates. In addition to the pressure of aggregate credit demand on a limited supply, bankers are guided in fixing rates on specific loan requests by the cost of handling and the risks involved in the loans. Since the costs of servicing and the risks of loss vary greatly from one loan to another, interest rates must also differ if the banker is to accommodate his customers equitably and serve his own stockholders efficiently.
In analyzing the patterns of interest rates paid by various borrowers, it must be remembered that the effective rate is slightly higher on a discount basis than on a straight interest basis. Moreover, the effective interest rate may be influenced by the repayment method, for the method may determine the average amount of loan on which interest is being paid. To avoid confusion and to make more meaningful comparisons, interest rates used in the survey were uniformly the effective annual rate on the unpaid balance regardless of the stated rate on the note.
The figures collected in the survey show that Eighth District member banks charged rates ranging in most cases, exclusive of some instalment loans, from a low of 3 per cent to a high of about 10 per cent. Certain unusual cases were reported beyond this range, both higher and lower. For example, there were a few loans that carried rates below the * prime" rate of 3% per cent then current, and one loan, made for its good will value, actually required no payment of interest. A number of loans were made at 6 or 7 per cent discount on the original balance, which gave an effective interest rate on the average amount of the loan roughly double these rates. Both the modal charge (most frequent) and the median rate (midpoint of
TABLE 4
EFFECTIVE INTEREST RATES ON BUSINESS LOANSEighth District Member Bank?
Estimated— October 5, 1955
Per cent Per annum 1
Number of Loans
PercentageDistribution
Below 3 174 0.4%
4 to 52,0908,689
4.317.9
5 to 6 .............. 11,805 24.2
6 to 7 ..............7 to 8 ..............
17,0151,4047,496
34.92.9
15.4
Total number of loans......... 48,673 100.0%
i Each percentage range is up to, but not inclusive of, the higherper cent.2 Primarily instalment loans where discount or interest is calculated on original amount.
the array of all rates charged) were 6 per cent. The mean rate (average w e i g h t e d by principal) was roughly 4% per cent.
About 10 per cent of the banks in the district required that b o r r o w e r s carry on deposit an amount equal to some portion of their total borrowings. This requirement was more frequent among large banks than it was among smaller ones. At banks requiring a minimum deposit, it was generally agreed that the borrower should keep at least 10 to 20 per cent of the amount of the loan, sometimes computed on an average balance basis. Some banks only required that borrowers maintain an account at the bank. Sales finance companies were often required to keep a relatively larger balance than other customers, since they frequently were given a lower stated rate of interest and were sometimes located outside the community. A few bankers did not specifically ask their customers for a minimum balance, but they indicated that both size of loans and interest rates were influenced by the size of borrowers' previous accounts.
Large borrowers generally were able to command lower interest rates than smaller borrowers. Certain costs of making and servicing loans do not vary much with the size of the advance. In fact, some small loans, where credit investigation is extensive, where collection is a problem, or where payments are in a large number of instalments, are actually more costly to service than bigger loans. Then, too, advances to small business are generally more risky, since frequently the firms are less stable, have less able or experienced management and have a thinner margin of capital. Most loans made to the largest borrowers ($100 million or more of resources) were made at the prime rate, which at the time of the survey was 3%
TABLE 5
AVERAGE !NTEREST RATES BY S!ZE OF BORROWER
Estimated—-October 5, 1955
Asset Size of Borrower IncorporatedUnincorporated Total
Less than $50,000.................. 5.76% 6.13% 6.06%$50,000 to $250,000.............. 4.84 5.16 4.99$250,000 to $1,000,000 4.62 4.59 4.61
$1,000,000 to $5,000,000 4.02 4.10 4.03$5,000,000 to $25,000,000 . . . 3.73 4.19 3.75$25,000,000 to $100,000,000 3.36 3.05 3.35$100,000,000 and over......... 3.08 3.21 3.09
All Business Sizes................ 4.08% 5.01% 4.32%
Page 62
Digitized for FRASER http://fraser.stlouisfed.org/ Federal Reserve Bank of St. Louis

per cent. For each succeeding smaHer category of borrower the average rate of interest tended to be somewhat higher, reaching a peak of about 6 per cent on credit extended to Rrms with less than $50,000 of total assets.
Interest rates on loans to corporations were generally lower than on loans to individual proprietorships or partnerships. On the average, corporations were required to pay just over 4 per cent for borrowed money, whereas unincorporated concerns were asked to pay about 5 per cent. The bulk of this difference was accounted for by the fact that the corporate form of business organization was used most frequently by the larger business Rrms, and the unincorporated form by the smaller concerns.
Interest rates also varied greatly by type of business. Again, however, the major reason for the difference appeared to be attributable to the size of the typical borrower in the various commercial and industrial groups. Lowest average rates were on loans to food, liquor, and tobacco manufacturers, sales Rnance companies, and commodity dealers. Relatively high rates, on the average, were charged to transportation companies, service Rrms, contractors, real estate concerns, retail stores, and producers of petroleum and coal.
. . .
The length of maturity of a note was usually determined in the light of the purpose for which the
TABLE 6
BUS!NESS LOANS BY MATURtTY
Estimated—-October 5, 1955
MiHions p ^No. of
Distri.
Demand 206 19.9% 5,329 11.0%43 4.2 1,649 3.4
1 pionth to 3 months 223 21.6 9,801 20.1
3 months to 6 months . 243 23.5 10,655 21.96 months to 9 months . 48 4.6 1,604 3.39 months to 12 months 43 4.2 5,505 11.3
Total 1 year or less 806 78.0% 34,543 71.0%
1 year to 2 years........... 34 3.3% 5,122 10.5%2 years to 3 years......... 24 2.3 2,665 5.53 years to 4 years 12 1.2 1,106 2.3
4 years to 5 years........... 49 4.7 2,184 4.55 years to 10 years......... 94 9.1 2,699 5.5Over 10 years................ 14 1.4 354 0.7
Total over 1 year 227 22.0% 14,130 29.0%
All Maturities 1,033 100.0% 48,673 100.0%
loan was made and the Row of funds into the borrower s business. The typical business loan made by district banks was for one year or less, these advances accounting for an estimated 78 per cent of the total amount of business loans outstanding. However, it might be pointed out that in certain cases renewals were anticipated at the time of the original extension of credit, so that in effect some of these loans actually were considered longer-term credit by both borrowers and lenders.
By amount outstanding, loans callable on demand accounted for one-Rfth of the total business indebtedness at district member banks. In addition, advances due in three months or less amounted to one-quarter of the total, and loans maturing within three to six months accounted for another one-quarter.
. . . 7̂*773
Along with the short maturity loans, there was a large number of term loans (over one year maturity) outstanding at district member banks on the survey date. In total, over 14,000 loans, aggregating $227 million were granted on terms longer than one year. About half of these loans, in dollar amount, were for more than Rve years. Available evidence indicates that although the dollar volume of term loans in late 1955 was much larger than in 1946, the ratio of term to total loans was about the same as in the earlier postwar year.
Relatively, partnerships, and individual proprietors received slightly more term loans (25 per cent of their
TABLE 7
BUS!NESS LOANS BY TYPE AND MATURITY
Estimated—-October 5, 1955
Business of Borrower ^
Shortterm year or
Longterm
Shortterm
(1 year or less)
Longterm (over
1 year)
Manufacturing and Mining 205 80 71.9 28.181 11 88.0 12.035 4 89.7 10.341 25 62.1 37.9
9 21 30.0 70.0
and mining 39 19 67.2 32.8
Wholesale trade........................... 75 14 84.3 15.7Retail trade.................................. 109 33 76.8 23.2
Commodity dealers.................... 58 1 98.3 1.7Sales Rnance companies........... 125 2 98.4 1.6
15 31 32.6 67.457 9 86.4 13.6
Real estate.................................... 104 23 81.9 18.1Service Rrms................................ 37 24 60.7 39.3All other non-Rnancial.............. 22 9 71.0 29.0
AH Businesses.................... 807 226 78.1 21.9
Page 63
Digitized for FRASER http://fraser.stlouisfed.org/ Federal Reserve Bank of St. Louis
total volume) than incorporated Brms (21 per cent). By business-of-borrower groups, more than two- thirds of the advances to transportation, communication and other public utilities and producers of petroleum, coal, chemicals and rubber were term loans. Also, metals and metal products Brms, "other" manufacturing and mining concerns and service companies were relatively heavy users of long-term credit. On the other hand, advances to commodity dealers and sales Bnance companies were almost entirely shortterm.
By size of bank, the total volume of loans granted with maturities over a year was somewhat greater at the smaller banks, those with less than $20 million deposits, (29 per cent) than at the larger banks (21 per cent). Similarly, the smaller business Brm, assets $250,000 and under, used term credit more frequently (32 per cent of total volume) than the bigger organizations (19 per cent). One explanation for this difference is that the larger Rrms probably had better access to other means of longer-term Bnancing. A sizable proportion of the term loans to small concerns was undoubtedly secured by real estate, trucks or automobiles.
. . .
Another condition that varies from one loan to another is the type of collateral used to secure the loan. The pledge of collateral can be beneBcial to both the lender and borrower. To the bank, it is helpful in reducing the likelihood of loss. To the customer, availability and use of collateral is an aid to obtaining larger advances, lower interest rates, or some other favorable term. Nevertheless, a sizable number of loans, both large and small, are made on an unsecured basis.
On advances where collateral was used, the type of security pledged varied widely, primarily depending on what the borrower could o#er. Some borrowers gave a mortgage on their plant, home or other real estate. Others pledged personal property, such as stocks, bonds, life insurance or savings accounts. Chattel mortgages and assignments of title were also used in a number of cases. Some borrowers obtained endorsers, co-makers or guarantors; others pledged inventories (including trust receipts, warehouse receipts, and factors' liens) or assigned claims, contracts, accounts receivable or oil runs. In a few
cases other types of security were used, and in some instances several diBerent types of collateral were given for the same loan.
. . . . . .
The repayment method also differed from one loan to another. A large number of the advances, especially the shorter-term loans, were repayable in one lump sum. Others w e r e payable in instalments, either regular or irregular, and with interest computed on the original amount or the unpaid balance. Longer-term loans of a large size were frequently in the form of serial notes. Other large extensions of credit were often made by a number of advances over a period of time, with each note frequently maturing at a different date.
In determining the arrangements for paying off loans, the parties considered such factors as the purpose of the loan, the anticipated Bow of cash into the business, and the risk involved. Although the traditional single-payment loan form was quite widely used, many were actually being paid oB in instalments. In some cases it was expected that these single-payment loans would be renewed for a somewhat smaller sum upon reaching maturity if there were no signiBcant changes over the period in the borrowers' or the banks' positions.
It was found that over 20 per cent of the banks extended lines of credit or gave Brm commitments to make loans up to a speciBc amount to individual businesses. In addition, certain other banks indicated that such commitments would be given if prospective borrowers requested them. The demand for lines of credit or commitments apparently focused on the larger banks, since nearly all of the large banks extended lines of credit. On the other hand, it was typical in the smaller banks (those with less than $10 million deposits) to analyze each loan application at the time of the request for credit.
Extensions of lines of credit and Brm commitments were usually given on the basis of earning capacity, Bnancial condition, character, vulnerability to economic changes, seasonal demands and experience. In virtually all cases, lines of credit were reviewed at least annually and in many instances more frequently. Some banks charged a small fee for granting sizable commitments.
Page 64
Digitized for FRASER http://fraser.stlouisfed.org/ Federal Reserve Bank of St. Louis
The wide variety of loan characteristics reported in the October 5, 1955, business loan survey indicates clearly that district member banks adapt the terms of their loans to the requirements of borrowers, both big and little. Size of loan, maturity, collateral, repayment method and lines of credit are, in most cases, tailored individually to customers' needs. In so adapt
ing their lending to the dynamic requirements of their customers, especially the smaller firms, the banks profit two ways: from a greater loan volume and from business development in the local community.
NORMAN N . BOWSHER
MARIE C . WAHLIC
Savings Bonds( ) N May 1, 1956, the Series E Savings Bond Program was fifteen years old. Thanks to the efforts of many volunteer workers, the program has been a success from the very start. At the present time there are about $40 billion of Series E and H Savings Bonds in the hands of 40 million owners. Stated in other terms, one person in every four owns Savings Bonds.
During 1955, sales of Series E and Series H Savings Bonds totaled nearly $5.4 billion, a postwar record, and redemptions were about the same as in 1954, or about $3.9 billion. As a result, net sales in the year were roughly $1.4 billion, the largest except for the war years 1942 through 1945. Series H Bonds accounted for $1.2 billion of sales, with less than $0.1 billion of redemptions. Series E Bonds experienced sales of $4.2 billion, the highest volume in seven years, but these were offset to a great extent by redemptions of nearly $3.9 billion.
The rate of redemptions of unmatured Series E and H Bonds has been falling almost steadily since 1950, from $3.7 billion that year to $2.5 billion in 1955. The decline suggests that the bonds today are in more stable hands than in the earlier postwar period. Looking at redemptions from another angle, about two-thirds, or $19.9 billion, of the E Bonds maturing since 1951 (when the first group matured) have not been redeemed and thus have automatically been extended for another nine years, eight months.
Digitized for FRASER http://fraser.stlouisfed.org/ Federal Reserve Bank of St. Louis

Qp CURRENT CONDiHONS
B u S I N E S S ACTIVITY in the Eighth Federal Reserve District started the second quarter of the year at about the same high rate as maintained in the Srst quarter, after allowance for seasonal changes. Consumer spending at district department stores continued at an advanced level during the Srst part of April. A strong demand for bank credit continued, as inventories were built up further and tax payments became due. And with total activity increasing seasonally, the district's major labor markets showed about the usual improvement in April. Contractors stepped up operations after having received a large, but not record, volume of awards in the Srst quarter. However, industrial output declined slightly in early April and new car sales evidently failed to show the customary spring improvement.
The future trend of inventories promises to be one of the main determinants of business activity in the months ahead. Inventory accumulation in the Srst quarter apparently continued at about the same pace as in the fourth quarter of 1955, after seasonal adjustment. Business sales, however, have changed little since last August on an adjusted basis. As a result, the ratio of stocks to sales for manufacturing and trade has risen in recent months, although in February it was no larger than a year earlier.
During April there was evidence that the downward adjustment of automobile production, due to large dealer inventories and slow sales, had not yet run its full course. From November to March seasonally adjusted automobile output was reduced 24 per cent. Despite this cutback, dealer inventories of new cars on April 1 were at near record levels, as production in the Srst quarter outran sales. Output was reduced in April, and with sales in the Srst ten days of the month showing no seasonal increase, automobile producers were reported to be scheduling further cutbacks in May to bring dealer inventories into better relationship with current and prospective sales.
In addition to automobiles, stocks of steel have been augmented in anticipation of higher prices and the possibility of a work stoppage in that industry when negotations begin on a new wage contract. Consequently, many observers anticipate some down
ward adjustment in steel operations in the next few months, unless consumption rises sharply.
The volume of industrial output in early April declined slightly, according to available indicators. The steel ingot rate at St. Louis was at about 96 per cent of capacity. Southern pine and hardwood output were off a shade from early March. Livestock slaughter at St. Louis area stockyards dropped 25 per cent. Crude oil production was off 1 per cent in the Srst two weeks of the month. Coal output dropped seasonally. Also, it was reported that auto asembly might be cut further. These declines, however, were from generally exceptionally high levels of activity during the Srst quarter of the year. District steel ingot output, for example, averaged above 100 per cent of rated capacity during this quarter for the Srst time since 1951. Production of both Southern pine and hardwood lumber was well above that of any recent year. Hog r e c e i p t s at National Stockyards, Illinois, were the largest since 1944 during the quarter. And crude oil output was 9 per cent above the previous record of 1955.
With a large volume of construction contracts awarded during the Srst quarter, builders took advantage of the April weather to step up their operations. In March, and in the Srst quarter as a whole, total construction contracts awarded in the district lagged somewhat behind the level a year earlier. However, the seasonally adjusted rate of awards for the Srst quarter was larger than in the last three quarters of 1955. Residential construction contracts^ awarded in March were larger than a year earlier. The Srst quarter total also was at a higher seasonally adjusted rate than in the last three quarters of 1955, although 6 per cent less than a year earlier. All other than residential construction contracts awarded in the Srst quarter were virtually the same as a year ago.
The usual spring expansion in activity in many lines was reSected in the decrease in insured unemploy
Page 66
Digitized for FRASER http://fraser.stlouisfed.org/ Federal Reserve Bank of St. Louis
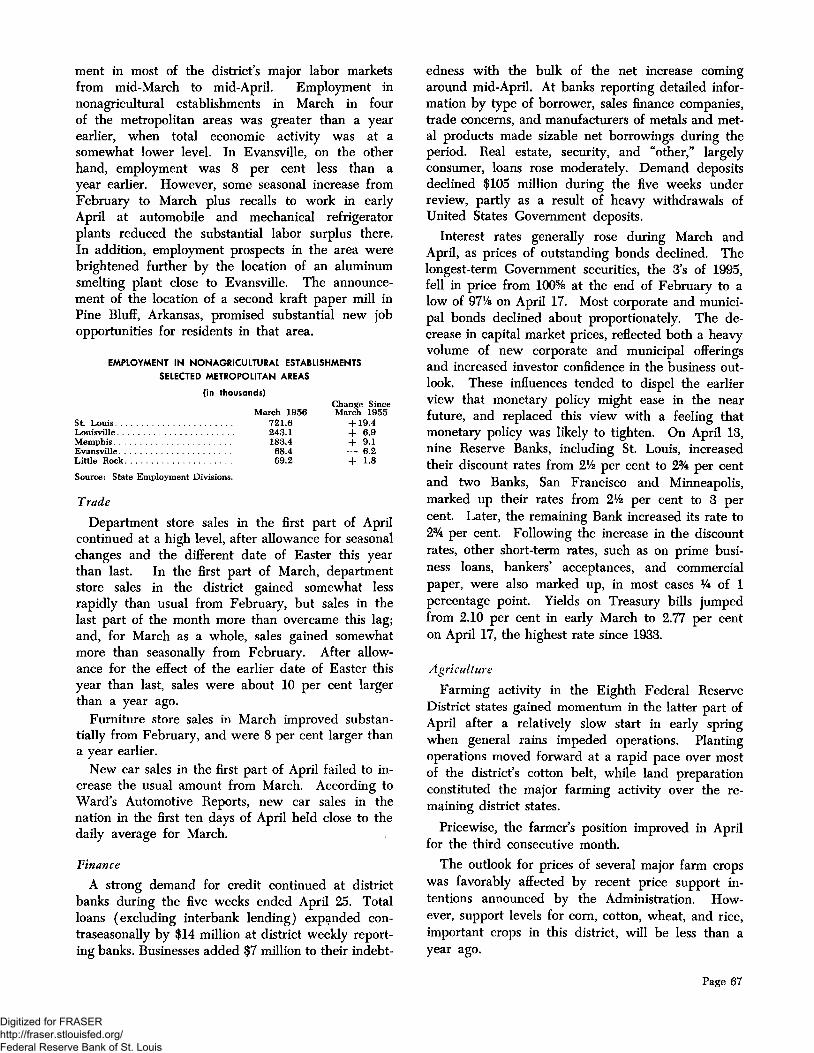
ment in most of the district's major labor markets from mid-March to mid-April. Employment in nonagricultural establishments in March in four of the metropolitan areas was greater than a year earlier, when total economic activity was at a somewhat lower level. In Evansville, on the other hand, employment was 8 per cent less than a year earlier. However, some seasonal increase from February to March plus recalls to work in early April at automobile and mechanical refrigerator plants reduced the substantial labor surplus there. In addition, employment prospects in the area were brightened further by the location of an aluminum smelting plant close to Evansville. The announcement of the location of a second kraft paper mill in Pine Bluff, Arkansas, promised substantial new job opportunities for residents in that area.
EMPLOYMENT !N NONAGRtCULTURAL ESTABUSHMENTS SELECTED METROPOHTAN AREAS
(in thousands)Change Since
March 1956 March 1955St. Louis.................................................. 721.6 + 1 9 .4Louisville.................................................. 243.1 + 6.9Memphis.................................................. 183.4 + 9 . 1Evansville............................................... 68.4 — 6.2Little Rock............................................. 69.2 + 1 . 8
Source: State Employment Divisions.
Department store sales in the Rrst part of April continued at a high level, after allowance for seasonal changes and the different date of Easter this year than last. In the first part of March, department store sales in the district gained somewhat less rapidly than usual from February, but sales in the last part of the month more than overcame this lag; and, for March as a whole, sales gained somewhat more than seasonally from February. After allowance for the effect of the earlier date of Easter this year than last, sales were about 10 per cent larger than a year ago.
Furniture store sales in March improved substantially from February, and were 8 per cent larger than a year earlier.
New car sales in the first part of April failed to increase the usual amount from March. According to Ward's Automotive Reports, new car sales in the nation in the first ten days of April held close to the daily average for March.
A strong demand for credit continued at district banks during the Rve weeks ended April 25. Total loans (excluding interbank lending) expanded con- traseasonally by $14 million at district weekly reporting banks. Businesses added $7 million to their indebt
edness with the bulk of the net increase coming around mid-April. At banks reporting detailed information by type of borrower, sales finance companies, trade concerns, and manufacturers of metals and metal products made sizable net borrowings during the period. Real estate, security, and "other," largely consumer, loans rose moderately. Demand deposits declined $105 million during the Rve weeks under review, partly as a result of heavy withdrawals of United States Government deposits.
Interest rates generally rose during March and April, as prices of outstanding bonds declined. The longest-term Government securities, the 3's of 1995, fell in price from 100% at the end of February to a low of 97% on April 17. Most corporate and municipal bonds declined about proportionately. The decrease in capital market prices, reHected both a heavy volume of new corporate and municipal offerings and increased investor conRdence in the business outlook. These influences tended to dispel the earlier view that monetary policy might ease in the near future, and replaced this view with a feeling that monetary policy was likely to tighten. On April 13, nine Reserve Banks, including St. Louis, increased their discount rates from 2% per cent to 2% per cent and two Banks, San Francisco and Minneapolis, marked up their rates from 2% per cent to 3 per cent. Later, the remaining Bank increased its rate to 2% per cent. Following the increase in the discount rates, other short-term rates, such as on prime business loans, bankers' acceptances, and commercial paper, were also marked up, in most cases % of 1 percentage point. Yields on Treasury bills jumped from 2.10 per cent in early March to 2.77 per cent on April 17, the highest rate since 1933.
Farming activity in the Eighth Federal Reserve District states gained momentum in the latter part of April after a relatively slow start in early spring when general rains impeded operations. Planting operations moved forward at a rapid pace over most of the district's cotton belt, while land preparation constituted the major farming activity over the remaining district states.
Pricewise, the farmer's position improved in April for the third consecutive month.
The outlook for prices of several major farm crops was favorably affected by recent price support intentions announced by the Administration. However, support levels for corn, cotton, wheat, and rice, important crops in this district, will be less than a year ago.
Page 67
Digitized for FRASER http://fraser.stlouisfed.org/ Federal Reserve Bank of St. Louis
VAR!OUS !ND!CATORS OF !NDUSTR!AL ACT!V!TY Mar. 1956*
Industrial Use of Electric Power (thousands of KWH per working day, selectedindustrial Rrms in 6 district cities)..................................................................................
Steel Ingot Rate, St. Louis area (operating rate, per cent of capacity).....................Coal Production Index— 8th Dist. (Seasonally adjusted, 1947-49=100).....................Crude Oil Production— 8th Dist. (Daily average in thousands of bbls.)................Freight Interchanges at RRs— St. Louis. (Thousands of cars— 25 railroads—
Terminal R. R. Assn.).........................................................................................................Livestock Slaughter— St. Louis area. (Thousands of head— weekly average).........Lumber Production— S. Pine (Average^weekly production— thousands of bd. ft.) . .
capacity. ^p Preliminary. N.A. Not available.
Mar.1956 F e b .^ 5 6 ^ Man* 1955
N.A. N.A. N.A.102 - 0 - + 994 p + 2 + 15
384.7 + 2 + 9115.3 + 6 + 4130.8 + 12 + 24213.3 + 1 + 1
88 — 4 — 4
BANK DEB!TS*
1956
ir" )
Mar. ^ 9 56^
Six Largest Centers: East St. Louis—
National Stock Yards, 111..........................................
Little Rock, Ark..........Louisville, Ky...............Memphis, Tenn...........St. Louis, Mo...........
Total— Six Largest
Alton, 111............
El Dorado, Ark. . Fort Smith, Ark. . Greenville, Miss. . Hannibal, Mo. . . .Helena, Ark...........Jackson, Tenn. . . . Jefferson City, Mo. Owensboro, Ky. . .Paducah, Ky...........Pine Bluff, Ark. . .
Sedalia, Mo...........SpringReld, Mo. . . Texarkana, Ark. .
Total— Other Centers ...........
$ 130.3 161.6 192.2 896.9 696.6
2,491.6
Feb.1956
+ 10% + 10 + 12
± 1 + 16
1955
— 75+ 2 + 3+ s— 5 + 7
Total— 22 Centers
$4,572.2 + 11% + 4%
. $ 43.5 + 22% + 2%15.9 + 12 + 430.7 + 11 + 458.5 + 13 + 1027.4 — 2 + 610.9 + 16 + 129.2 + 22 + 14
28.2 + 8 + 2063.6 — 7 - 0 -46.3 + 6 + 127.4 + 7 — 1239.4 + 8 + 2238.8 + 13 — 315.3 + 9 + 1085.7 + 18 + 721.4 + 16 + 16
. $ 562.3 + 10% + 6%
$5,134.5 + 11% + 5%
INDEX OF BANK DEBITS— 22 Centers Seasonally Adjusted (1947-1949=100)
1956 1955
le&i Feb.170.3
Mar.156.0
CASH FARM !NCOME
Percentage Change
(In thousands of dollars)
Arkansas. . .
Feb. '56
_ 1 9 5 6 _ Feb. '55 $ 23,520
150,874 81,629 23,231 20,376 57,087 25,865
+ 10%+ 20 — 4 + 2 + 5 + 1 + 9
1956*^'" l9 5 5 ^ 1 9 5 4 ' + 29%
— 34 + 13 + 4 + 8
— 16% — 8 — 18 — 38 — 15 —12 — 19
!NDEX OF CONSTRUCHON CONTRACTS AWARDED E!GHTH FEDERAL RESERVE D!STR!CT*
(1947-1949 = 100)Feb. 1956 Jan. 1956 Feb. 1955
Total 210.3 p274.8 p 180.3 p
177.3223.5155.9
215.9292.6180.2
280.1365.8240.3
7 States . . 382,582 + 8 + 2 — 17 8th District 150,487 + 7 + 4 — 17
T otal........... 273.1 p 234.1Residential 343 5 p 302.0 AUOther . . . 240.4 p 202.5
(centered on mid-month) of value of awards, as reported by F. W. Dodge Corporation.
p Preliminary
ASSETS AND L!AB!L!T!ES EIGHTH D!STR!CT MEMBER BANKS(In Millions of Dollars)
Mar. 21, 1956Apr. 25,1956
$1,592826
59277453893232
9859
47$3,632
$ + 14+ 2
± 2 5------ 1— 13 — 18 + 2
$— 41
Mar. 28, 1956
$2,549
1,870487
1,37968
$6,353
Feb. 29, 1956
$ + 43
-12- 0-
$ + 21Liabilities and CapitalDemand Deposits of Banks ................ $ 630 $— 18Other Demand Deposits ....................... 2,048 — 87Time Deposits ....................................... 569 + 2
Total Capital Accounts ......................... 273 + 2Total Liabilities and Capital ......... $3,632 $— 41
$ 686 3,896 1,227
70 474
$6,353
± 3 ̂+ 2
$ + 2 1
DEPARTMENT STORES
Net SalesStocks Sales Outstanding Mar. 1, '56,
Mar., 1956
Feb., '56 Mar.,
, 3 mos. '56 Mar., 30,'56 Jan. 1 to Excl.to same comp, with Mar. Mar. Instal. Installment
'55 period '55 Mar. 30,'55 1956 1955 Accounts Accounts8th F.R. District Total . Fort Smith Area, Ark.i.
Louisville Area, Ky., Ind. Louisville (city), Ky. .
Paducah, Ky....................St. Louis Area, Mo., 111. SpringReld Area, M o.. . .
All Other Cities^...........
+ 32 + 16 + 10 + 14 2.96 3.02 ]L7 47+ 48 + 19 + 9 + 3 2.76 3.20 43+ 23 + 15 + 12 + 6 3.15 3.40 ][3 42+ 30 + 5 — 1 + 21 4.03 3.76
53+ 31 + 19 + 11 + 12 2.74 2.87 f!0 * "+ 27 + 13 + 7 + 8 2.79 2.90 S10 50+ 48 + 17 + 2 — 1 2.79 3.28+ 31 + 17 + 11 + 20 2.96 2.88 ]L8 ' 52+ 44 + 3 + 11 + 1 3.19 3.25+ 27 + 12 + 7 + 5 2.97 3.19 ]L4 36+ 52 + 16 + 11 + 8 3.17 3.41ication of Rgures for this city (or area), a special sample has been con-*
structed which is not conRned exclusively to department stores. Figures for any such nondepartment stores, however, are not used in computing the district percentage changes or in computing department store indexes.
2 Fayetteville, Pine Blu#, Arkansas; Harrisburg, Mt. Vernon, Illinois; Vincennes, Indiana; Danville, Hopkinsville, MayReld, Owensboro, Kentucky; Chillicothe, Missouri; Greenville, Mississippi; and Jackson, Tennessee.
INDEXES OF SALES AND STOCKS— 8TH DISTRICTMar. Feb. fan. Mar.1956 1956 1956 1955115 95 95 101128 122 ]L26 116140 130 ]L20 124132 137 JL38 117
3 Daily average 1947-49= 1004 End of Month average 1947-49 = 100Outstanding orders of reporting stores at the end of March, 1956, were 16 per cent larger than
on the corresponding date a year ago.Trading days: March, 1956— 27; Feb., 1956— 25; March, 1955— 27.
RETA!L FURN!TURE STORES
Net SalesMar., 1956 Mar., 1956
Feb./56^ M an/55 F ^ b .^ 6 ^ M a r .^ 58th Dist. Totali . + 14% + 8% + 4% + 7%
. + 21 + 8 + 1 + 8+ 10 + 4 + 6— 11 + 7— 15 + 24 + 8 + 9
SpringReld Area . + 4 1 + 60 + 8 + 5
PERCENTAGE DISTRIBUTION OF FURNITURE SALES
Mar., '56 Feb., '56 Mar., '55Cash Sales ................ 13% 13% 12%Credit Sales .............. 87 87 88
Total Sales ........... 100% 100% 100%
Digitized for FRASER http://fraser.stlouisfed.org/ Federal Reserve Bank of St. Louis