a summary of the scientific literature on the effects of ... of literature review ... shed with...
TRANSCRIPT
A Summary of the Scientific Literature on the Effects of Fire on the Concentration of Nutrients in Surface Waters
By Anthony J. Ranalli
Open-File Report 2004–1296
U.S. Department of the InteriorU.S. Geological Survey
Prepared in cooperation with theFederal Emergency Management Agency andCity of Fort Collins
U.S. Department of the InteriorGale A. Norton, Secretary
U.S. Geological SurveyCharles G. Groat, Director
U.S. Geological Survey, Reston, Virginia: 2004
For sale by U.S. Geological Survey, Information ServicesBox 25286, Denver Federal CenterDenver, CO 80225
For more information about the USGS and its products:Telephone: 1-888-ASK-USGSWorld Wide Web: http://www.usgs.gov/
Any use of trade, product, or firm names in this publication is for descriptive purposes only and does not imply endorsement by the U.S. Government.
Although this report is in the public domain, permission must be secured from the individual copyright owners to reproduce any copyrighted materials contained within this report.
iii
ContentsAbstract.........................................................................................................................................................1Introduction.................................................................................................................................................. 1Literature review..........................................................................................................................................2Chemical changes in soil during a wildfire............................................................................................. 2Transfer of nutrients and cations from ash to streams and lakes.......................................................7Temporal effects on streamwater nitrogen during and following wildfires...................................... 9Other forms of nitrogen.............................................................................................................................14Temporal effects on streamwater phosphorus during and following wildfires.............................. 15Temporal effects on nitrogen and phosphorus concentrations in lake and reservoir water
during and following wildfires....................................................................................................17Summary of literature review.................................................................................................................. 19References..................................................................................................................................................21
Figures
Figure 1. Examples of the temporal variability of nitrate concentrations and load in rivers among burned and unburned watersheds.............................................................. 11
Tables
Table 1. Description of watersheds........................................................................................................3Table 2. Nutrient concentration data for selected studies.................................................................4

iv
Conversion Factors
Multiply by To obtain
inch 2.54 centimeterfoot (ft) 0.3048 metermile (mi) 1.609 kilometersquare mile (mi2) 2.590 square kilometergallon (gal) 3.785 litermicrometer (µm) 0.00003937 inchmillimeter (mm) 0.03937 inchcentimeter (cm) 0.3937 inchmilliliter (mL) 0.0610 cubic inchliter (L) 0.2642 gallon (gal)gram (g) 0.035 ounce
Temperature in degrees Celsius (ºC) can be converted to degrees Fahrenheit (ºF) using the formula ºF = (1.8 xºC) + 32.
Temperature in degrees Fahrenheit (ºF) may be converted to degrees Celsius (ºC) using the formula ºC = (ºF -32) /1.8
Vertical coordinate information is referenced to National Geodetic Vertical Datum of 1929 (NGVD 29); horizontal coordinate information is referenced to North American Datum of 1927 (NAD 27) except as noted.
ADDITIONAL ABBREVIATIONSgal/min gallon per minute
mg milligrams
mg/g milligrams per gram
µg/L micrograms per liter
µS/cm microsiemens per centimeter at 25 degrees Celsius
mg/kg milligrams per kilogram
mg/L milligrams per liter
ρCi/L picocuries per literρCi/g picocuries per gram
ROE residue on evaporation
DOC dissolved organic carbon
N nitrogen
TN total nitrogen
P phosphorus
SRP soluble reactive phosphorus
TP total phosphorus
TDP total dissolved phosphorus
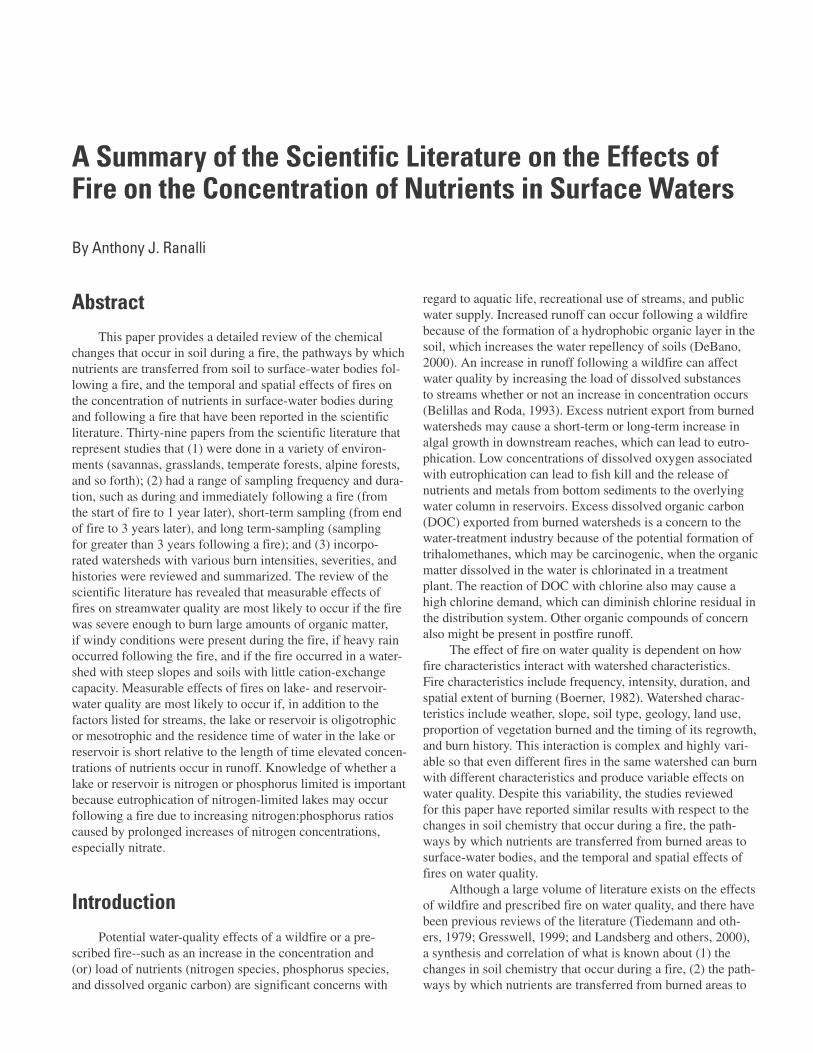
AbstractThis paper provides a detailed review of the chemical
changes that occur in soil during a fire, the pathways by which nutrients are transferred from soil to surface-water bodies fol-lowing a fire, and the temporal and spatial effects of fires on the concentration of nutrients in surface-water bodies during and following a fire that have been reported in the scientific literature. Thirty-nine papers from the scientific literature that represent studies that (1) were done in a variety of environ-ments (savannas, grasslands, temperate forests, alpine forests, and so forth); (2) had a range of sampling frequency and dura-tion, such as during and immediately following a fire (from the start of fire to 1 year later), short-term sampling (from end of fire to 3 years later), and long term-sampling (sampling for greater than 3 years following a fire); and (3) incorpo-rated watersheds with various burn intensities, severities, and histories were reviewed and summarized. The review of the scientific literature has revealed that measurable effects of fires on streamwater quality are most likely to occur if the fire was severe enough to burn large amounts of organic matter, if windy conditions were present during the fire, if heavy rain occurred following the fire, and if the fire occurred in a water-shed with steep slopes and soils with little cation-exchange capacity. Measurable effects of fires on lake- and reservoir-water quality are most likely to occur if, in addition to the factors listed for streams, the lake or reservoir is oligotrophic or mesotrophic and the residence time of water in the lake or reservoir is short relative to the length of time elevated concen-trations of nutrients occur in runoff. Knowledge of whether a lake or reservoir is nitrogen or phosphorus limited is important because eutrophication of nitrogen-limited lakes may occur following a fire due to increasing nitrogen:phosphorus ratios caused by prolonged increases of nitrogen concentrations, especially nitrate.
IntroductionPotential water-quality effects of a wildfire or a pre-
scribed fire--such as an increase in the concentration and (or) load of nutrients (nitrogen species, phosphorus species, and dissolved organic carbon) are significant concerns with
A Summary of the Scientific Literature on the Effects of Fire on the Concentration of Nutrients in Surface Waters
By Anthony J. Ranalli
regard to aquatic life, recreational use of streams, and public water supply. Increased runoff can occur following a wildfire because of the formation of a hydrophobic organic layer in the soil, which increases the water repellency of soils (DeBano, 2000). An increase in runoff following a wildfire can affect water quality by increasing the load of dissolved substances to streams whether or not an increase in concentration occurs (Belillas and Roda, 1993). Excess nutrient export from burned watersheds may cause a short-term or long-term increase in algal growth in downstream reaches, which can lead to eutro-phication. Low concentrations of dissolved oxygen associated with eutrophication can lead to fish kill and the release of nutrients and metals from bottom sediments to the overlying water column in reservoirs. Excess dissolved organic carbon (DOC) exported from burned watersheds is a concern to the water-treatment industry because of the potential formation of trihalomethanes, which may be carcinogenic, when the organic matter dissolved in the water is chlorinated in a treatment plant. The reaction of DOC with chlorine also may cause a high chlorine demand, which can diminish chlorine residual in the distribution system. Other organic compounds of concern also might be present in postfire runoff.
The effect of fire on water quality is dependent on how fire characteristics interact with watershed characteristics. Fire characteristics include frequency, intensity, duration, and spatial extent of burning (Boerner, 1982). Watershed charac-teristics include weather, slope, soil type, geology, land use, proportion of vegetation burned and the timing of its regrowth, and burn history. This interaction is complex and highly vari-able so that even different fires in the same watershed can burn with different characteristics and produce variable effects on water quality. Despite this variability, the studies reviewed for this paper have reported similar results with respect to the changes in soil chemistry that occur during a fire, the path-ways by which nutrients are transferred from burned areas to surface-water bodies, and the temporal and spatial effects of fires on water quality.
Although a large volume of literature exists on the effects of wildfire and prescribed fire on water quality, and there have been previous reviews of the literature (Tiedemann and oth-ers, 1979; Gresswell, 1999; and Landsberg and others, 2000), a synthesis and correlation of what is known about (1) the changes in soil chemistry that occur during a fire, (2) the path-ways by which nutrients are transferred from burned areas to
2 A Summary of the Scientific Literature on the Effects of Fire on the Concentration of Nutrients in Surface Waters
surface-water bodies, and (3) the temporal and spatial effects of fires on water quality have not been done. An understanding of the chemical changes that occur in soil during a fire and the pathways by which nutrients are transferred from burned areas to surface-water bodies is essential to understanding the causes of the temporal and spatial effects of fires on water quality reported in the literature. Accumulation of this knowledge can be viewed as the first step needed to be able to predict the effects of wildfire on water quality in a variety of environ-ments given any set of fire characteristics. This information would be useful to (1) forest managers trying to mitigate wildfire-related water-quality impacts by helping them evalu-ate forest management practices and emergency watershed-stabilization measures, (2) public water suppliers who may need to plan for changes in water-treatment practices that may be needed to treat water contaminated with postfire runoff, and (3) public water suppliers who may not have any or very little data on prefire and postfire water quality from previous wildfires and need to develop a sampling protocol (parameters to be sampled, frequency of sampling, duration of sampling) to assess the impacts of future fires on water quality.
The purpose of this paper is to provide a detailed review of the scientific literature dealing with changes that occur in soil during a fire, the pathways by which nutrients are trans-ferred from soil to surface-water bodies following a fire, and the temporal and spatial effects of fires on the concentration of nutrients in surface-water bodies during and following a fire. The 39 papers reviewed for this article represent studies that (1) were done in a variety of environments (savannas, grass-lands, temperate forests, alpine forests, and so forth), (2) had a range of sampling frequencies and durations, such as during and immediately following a fire (from the start of fire to 1 year later), short-term sampling (from the end of fire to 3 years later) and long-term sampling (greater than 3 years follow-ing a fire), and (3) incorporated watersheds with various burn intensities, severities, and histories.
Literature Review
This literature review is divided into several sections. The first section discusses the chemical changes in soil that occur during fire, and the second section discusses the various pathways by which nutrients and cations enter surface-water bodies following a fire. A discussion of cations is included in these sections to illustrate how the fate of various ions/compounds in postfire drainage is dependent upon the physical and chemical properties of an ion or compound. The summary of the effects of wildfires on nutrients in streams is divided into sections on nitrogen and phosphorus and includes studies that discuss cation concentrations but not nutrient concentra-tions. These studies are included because they demonstrate that not all fires produce measurable effects on water quality. To facilitate the presentation of the results of the literature review, information regarding the location, dates of fire, and
names of streams draining burned and unburned watersheds is given in table 1.
Nitrate and ammonium are the forms of nitrogen that have been investigated most frequently in the studies reviewed for this literature synthesis. A few other studies also have examined other forms of nitrogen such as suspended nitrogen, total dissolved nitrogen, organic nitrogen, and total nitrogen. In the discussion that follows, the work done on nitrate and ammonium in streams will be discussed first followed by a discussion of the other forms of nitrogen. Then phosphorus in streams will be discussed. The final section of the literature review is a review of studies done in lakes and reservoirs.
Chemical changes in soil during a wildfire
During burning, organic matter is converted to ash and charred materials, and the amount and nature of the ash pro-duced varies greatly among ecosystems due to differences in maximum fire temperatures and the amount of above-ground biomass and detritus available as fuel for conversion to ash (Boerner, 1982). If the organic matter is completely burned, a white ash forms that is called wood ash, and it constitutes the inorganic component of wood that remains after burning (Ulery and others, 1993). Few natural fires, however, burn hot enough and long enough for complete combustion of organic material. Therefore, the soil is usually covered with a black, partially organic ash mixed with charred plant parts rather than with white, inorganic ash (Boerner, 1982). The ash that is pro-duced in vegetation fires usually has a grey or black color due to the significant amount (30-90 percent by weight) of organic matter it contains (Raison and others, 1990).
Laboratory studies have shown that the inorganic com-ponent of ash consists mostly of carbonates and oxides of the alkali and alkaline earth metals, silica, and much smaller amounts of phosphorus, sulfur, and nitrogen (Raison and McGarity, 1980; Raison and others, 1990; and Soto and Diaz-Fierros, 1993). X-ray diffraction analysis of the ashes from three plant species (Ulex, Pinus, and Eucalyptus) by Soto and Diaz-Fierros (1993) showed the principal components of the ash were carbonates and oxides of calcium and mag-nesium, chlorides and carbonates of sodium and potassium, and polyphosphates of calcium and magnesium. The relative concentrations of these compounds varied according to plant species. Inorganic nitrogen was present in ash leachates in very low concentrations because nitrogen is present in ash mostly in organic forms of low solubility and the inorganic nitrogen forms are largely volatilized. The amount of inor-ganic phosphorus in ash leachates did not exceed 3 percent of the total phosphorus present in the ash. This low solubility of phosphorus in the ash leachates was attributed to the phospho-rus in the ash being present mainly as low-solubility calcium and magnesium polyphosphates.
Raison and others (1990) state that the volatilization of nitrogen from organic-rich surface soil can occur where temperatures exceed 200oC and that heating of soils results in

2 A Summary of the Scientific Literature on the Effects of Fire on the Concentration of Nutrients in Surface Waters Literature Review 3
Study Study Location Burned Watersheds Unburned WatershedsBayley and others (1992)
Rawson Lakes watershed in the Experimental Lakes Area in Ontario, Canada
NE, E, and NW subbasins of the Rawson Lake Watershed
Belillas and Roda (1993)
Montseny National Park and Biosphere Reserve in northeast Spain
SN and SB catchments TB catchment
Brass and others (1996)
Yellowstone National Park, Wyoming, USA
Blacktail Deer Creek, Cache Creek, The Lamar River, The Snake River, and Soda Butte Creek
Amphitheatre Creek
Carignan and others (2000)
9 burnt lakes 16 reference lakes
Chessman (1996) East Gippsland region of Victoria, south-eastern Australia
Bemm River, Cann River, Combienbar River, Drummer Creek, East Cann River, Fiddlers Green Creek, Genoa River, Thurra River, West Cann River, Wingan River
Errinundra River
Davis (1989) Three Bar Wildlife Area within the Tonto National Forest in central Arizona, USA
Watershed F Watershed D
Enache and Prairie (2000)
Abitibi region, northwestern Quebec, Canada
Lac Francis
Feller and Kimmins (1984)
The University of British Columbia Research Forest at Haney, about 60 km east of Vancouver, British Columbia
A and B watersheds C watershed
Gerla and Galloway (1998)
Near the east-central boundary of Yellowstone National Park, Wyoming
Jones Creek Crow Creek (<2)
Gluns and Toews (1989)
Near the city of Kimberly in southeast British Columbia, Canada
Downstream reaches of East Fork and Middle Fork
West Fork, upstream reaches of East Fork and Middle Fork
Johnson and Needham (1966)
Sagehen Creek, California, USA Upstream reach of Sagehen Creek Downstream reach of Sagehen Creek
Lathrop (1994) Yellowstone National Park, Wyoming, USA
Yellowstone and Lewis Lakes
MacKay and Robinson (1987)
Southeastern New South Wales, Australia
Germans, Grevillea, Peppermint, and Stringybark
Pomaderris
Lakes are located in a 30,000 km2 area surrounding Gouin Reservoir in Haute-Maurice, Quebec, Canada
Dogfish Lake
14 headwater lakes
One stream
Watershed No. 80
Upper Bowman Creek and Logging Creek
Lake Creek
Catchment U
Log Creek
Meander Lake
10 headwater lakes in burnt peatland-conifer catchments
20 streams with varying watershed areas burned
Watershed No. 77
Akokala Creek and Bowman Creek
Lexington Reservoir
Fox Creek, Burns Creek, and McCree
Catchments E and L
Swartboskloof catchment
Tharp's Creek
McColl and Grigal (1975)
McEachern and others (2000)
Minshall and others (1997)
Richter and others (1982)
Spencer and Hauer (1991)
Taylor and others (1993)
Tiedmemann and others (1978)
Townsend and Douglas (2000)
van Wyk and others (1992)
Williams and Melack (1997)
Superior National Forest in northeastern Minnesota, USA
The Caribou Mountains in northern Alberta, Canada
Yellowstone National Park, Wyoming, USA
Santee Experimental Forest in South Carolina, USA
The watershed of the North Fork Flathead River in northwest Montana, USA
Santa Cruz Mountains in Santa Clara County, California, USA
Entiat Experimental Forest in north-central Washington, USA
Kapalga Research Station in Kakadu National Park, northern Australia
Jonkershoek valley in South Africa
Sequoia National Park, California, USA
Table 1. Description of watersheds.

4 A Summary of the Scientific Literature on the Effects of Fire on the Concentration of Nutrients in Surface Waters
Ash calcium Organic carbonWood ash pH of ash carbonate present in
Site present in soil equivalent % ashSanta Rose Plateau (SRP) Yes 12.0 95 No
Stanislaus National Forest (SNF) Yes 9.3 34 No
Tahoe National Forest (TNF) Yes 7.8 12 Yes (20.8 g/kg)
Kalamath National Forest (KNF-1) No - - -Kalamath National Forest (KNF-2) No - - -
2a. Data for ash chemistry from Ulery and others (1993).
2b. Postfire nitrate and ammonium concentration data from Tiedemann and others (1978). (Concentrations in µg/L)
Maximum nitrate Average ammoniumconcentration concentrationwithin the first from
Stream 3 years after the fire 1973 to 1975Fox Creek 0.750 0.010
Burns Creek 0.540 0.005
McCree Creek 1.475 0.006
Lake Creek 0.066 0.002
Date Stream A Stream B Stream C1972/1973 0.37 0.17 0.19
1973/1974 (clearcut) 0.72 0.19 0.13
1974/1975 (slash burn) 2.33 0.75 0.10
2c. Mean annual nitrate concentration data from Feller and Kimmins(1984). (Concentrations in mg/L)
Mean annual nitrateMean annual nitrate concentration for the
concentration before 3 years following theSubbasin the 1974 fire
E 22.5 173.4
NE 6.0 14.4
NW 24.6 161.1
2d. Nitrate and ammonium concentration data from Bayley and others (1992). (Concentrations in µg/L as N)
Note - Fire in the NW subbasin did not occur until 1980. The prefire data presentedfor the NW subbasin is for the period 1971-1980. The postfire data presented forthe NW subbasin is for the period 1980 - 1983.
Mean annual ammoniumMean annual
ammonium concentrationconcentration for the
before the 1974 fire 3 years following the
Subbasin 1974 fire
1974 fire
E 16.1 39.7
NE 18.1 41.3
NW -- 23.5
Table 2. Nutrient concentration data for selected studies.

4 A Summary of the Scientific Literature on the Effects of Fire on the Concentration of Nutrients in Surface Waters
immediate release of significant amounts of ammonium (as nitrogen) owing to oxidation of organic matter. The ammo-nium released by heating is retained in an exchangeable form in the soil, and the amount released increases with an increase in the total nitrogen content of the soil and with temperatures up to 400oC. Raison and others (1990) also state that heat-ing and addition of phosphorus in ash usually increases the level of extractable phosphorus in surface soils after burning. Although significant quantities of phosphorus may be added to the surface soil in ash, much of the phosphorus is in the form of calcium polyphosphates, which have a low solubility in water. The solubility of this phosphorus can increase markedly if the ash becomes incorporated into the soil, with the resulting neutralization of ash alkalinity. Over the long term, reductions in exchangeable aluminum, an increase in soluble silica, and increased rates of organic-matter decomposition after fire in some soils also will enhance the availability of phosphorus. In soils with high sesquioxide content and hence high phospho-rus-fixing capacity, however, little of the mobilized phospho-rus may persist in an extractable form.
Large increases in pH also have been measured in ash slurries (Raison and McGarity, 1980; Raison and others, 1990; and Soto and Diaz-Fierros, 1993). Raison and others (1990) state that the pH of an ash slurry can exceed 12, and the pH of surface soils after deposition of ash can be increased by three or more units. Soto and Diaz-Fierros (1993) measured a range in pH from 7.3 to 9.6 in the leachates of Ulex, Pinus, and
Eucalyptus ashes and attributed this to the presence of alkaline compounds, mainly calcium carbonate, magnesium oxide, cal-cium oxide, magnesium hydroxide, and magnesium carbonate.
Field studies of burned sites have shown similar results to the laboratory studies. Ulery and others (1993) measured the chemical composition of wood ash (0.5-7 cm thick) produced by severe burning at five sites (KNF-1, KNF-2, TNF, SRP, and SNF) in California (table 2). Erosion and leaching due to precipitation since the wildfires ended may have controlled the amount of woodash at these sites. The KNF-2 site has steep slopes (30-percent gradient) and was sampled almost 3 years after burning. The wood ash collected from the TNF site was also 3 years old, but the gentler slopes (5 percent gradient) favored retention of the ash on the soil surface. The wood ash at the TNF site was darker, less abundant, and less distinguish-able from the surface soil than the woodash collected from the SRP and SNF sites, both of which had burned within 60 days of collecting samples (22 days for the SRP site and 60 days for the SNF site). The major inorganic component of wood ash from the SRP site was calcite. The high concentration of calcite in this wood ash was attributed to the mineralization of basic cations from organic compounds in wood during the fire, which form oxides that subsequently convert to hydrox-ides and carbonates upon exposure to ambient environmental conditions. Rapid evaporation during burning of plant cell water, which concentrates the mineral elements and precipi-tates well-developed CaCO
3 crystals from a saturated solution
Mean annual TDPMean annual TDP concentration for the
concentration before 3 years following theSubbasin the 1974 fire 1974 fire
E 11.7 16.5
NE 13.4 36.6
Mean annual TPMean annual TP concentration for the
concentration before 3 years following theSubbasin the 1974 fire 1974 fire
E 18.4 26.0
NE 20.9 44.7
2f. Mean nutrient concentration data from Taylor and others (1993).
2e. Total dissolved phosphorus (TDP) and total phosphorus concentration data from Bayley and others (1992). (Concentrations in µg/L as P)
Before flood After floodParameter and fire and fire Change
Total nitrite plus nitrate 0.05 0.40 700%
Total organic nitrogen 0.53 0.37 -30%
Dissolved organic nitrogen 0.37 0.24 -35%
Dissolved orthophosphate 0.05 0.10 100%
(Concentrations in mg/L)
Table 2. Nutrient concentration data for selected studies—Continued
Literature Review 5
6 A Summary of the Scientific Literature on the Effects of Fire on the Concentration of Nutrients in Surface Waters
that is typically high in calcium, also could have been a factor. The greater concentrations of water-extractable potassium and higher pH in the SRP and SNF wood ash samples were attributed to the oxides, hydroxides, and carbonates that form during or soon after combustion. These compounds are very soluble and are readily leached. The SRP site did not receive any rain between the end of the fire and sample collection, so the compounds were still abundant in the wood ash. The SNF site did receive 9 mm of precipitation since burning, so some compounds probably were leached from the wood ash. The TNF wood ash was subjected to three wet seasons (winters), so most of the soluble compounds probably were leached from the wood ash, leaving only a calcite residue.
Kutiel and Inbar (1993) measured soil nutrients and cations in two, 200-m2 plots in the Mediterranean region of Israel for 8 months following a moderate wildfire in October 1988, which burned one of the plots. Within 1 month after the fire, the amount of soil nutrients in the burned plot increased significantly compared with the unburned plot. From 1 to 8 months after the fire, the amount of nutrients in the burned plot decreased but was still greater than in the unburned plot. Total nitrogen decreased by 24 percent in the burned plot compared to the unburned plot (p<0.01) immediately after the fire, but 5 months after the fire, there was no significant differ-ence between the two plots. The initial loss of total nitrogen was attributed to volatilization during the fire. There were, however, significant increases in ammonium and nitrate in the burned plot compared to the unburned plot. One month after the fire, the amount of ammonium in the burned plot was 13 times greater than the amount of ammonium in the unburned plot. The amount of ammonium in the burned plot declined after the first month of the study but remained higher than in the unburned plot during the 8 months of the study (p<0.001). The initial increase in ammonium was attributed to decomposition of organic materials caused by the heat of the fire. The amount of nitrate in the burned plot 1 month after the fire was also significantly higher than in the unburned plot (p<0.001). The amount of nitrate in the burned plot began to decline after the first month, but 5 months after the fire the nitrification rate increased significantly, and nitrate concentra-tions started to increase between 5 and 8 months after the fire. In an earlier study, Kutiel and Kutiel (1989) suggested that the source of the nitrate after the fire was the conversion of ammonium to nitrate. In this study, however, ammonium and nitrate levels were low in the unburned soil. Nitrification was observed only after the fire. As a result, the authors suggested that in a mature and dense pine-forest plantation with a heavy needle layer (1,180 kg dry needles per 1,000 m2) there is an inhibition of nitrogen mineralization and nitrification due to the presence of organic compounds such as terpenoids. These compounds are removed or inactivated by fire.
The amount of total phosphorus in the burned plot was 15 times greater than in the unburned plot 1 month after the fire (p<0.001). The initial increase in total phosphorus was attributed to the combustion of organic phosphorus and to mineralization, which occurred as a result of the high soil
temperatures during the fire. The amount of total phosphorus in the soil of the burned plot decreased 1 to 4 months after the fire, increased 5 to 6 months after the fire, and then declined again 6 to 8 months after the fire. The amount of total phos-phorus in the soil of the burned plot was always greater than the amount of total phosphorus in the soil of the unburned plot. The overall decrease in total phosphorus observed 1 to 8 months after the fire was attributed to adsorption by calcium carbonate or the precipitation of phosphorus as insoluble calcium compounds.
Electrical conductivity was significantly higher (p<0.001) in the burned soil compared to the unburned soil for the 8 months following the fire. The increase in electrical conduc-tivity was attributed to the combustion of plants and the litter layer, which released soluble ions. The amounts of calcium, magnesium, sodium, and potassium were all significantly greater in the burned plot compared to the unburned plot 1 month after the fire. The amounts of all four of these ele-ments in the burned plot decreased during 1 to 8 months after the fire, and the amounts of magnesium and sodium became about equal in the two plots by the fourth month after the fire. The amounts of calcium and potassium remained slightly greater in the burned plot compared to the unburned plot for the duration of the study.
Overby and Perry (1996) measured the concentrations of exchangeable ammonium (as nitrogen) and nitrate (as nitro-gen), and extractable phosphorus in soil under two Arizona chaparral shrubs (Cercocarpus betuloides and Quercus turbi-nella) before and after a prescribed fire. A significantly greater amount of exchangeable ammonium (as nitrogen) and extract-able phosphorus was found in the 0-10 and 10-20 cm soil layers under both shrubs after the fire, with greater amounts of both nutrients found in the soil under Cercocarpus betuloides. Analysis of the exchangeable nitrate (as nitrogen) data was not done because 75 percent of the analyses for nitrate (as nitrogen), both before and after fire, were below detection limits. The higher concentrations of exchangeable ammonium (as nitrogen) and extractable phosphorus found in soil after the fire compared with prefire concentrations was attributed to condensation of volatilized organic matter and ash deposition of small but significant amounts of these com-pounds in the soil surface during the fire. The thermal decom-position of amino acids contained in organic matter at 200oC could be the source of ammonium (as nitrogen). The greater concentration of these nutrients in the soil under Cercocarpus betuloides following the fire was attributed to the greater accu-mulation of litter and higher concentrations of nitrogen and phosphorus in the litter and standing biomass of Cercocarpus betuloides.
The direct effect of heat on soil chemical properties generally is confined to the upper 5 cm, except under piles of woody residues because the uppermost soil will be strongly heated, whereas heat penetration is limited because tempera-ture gradients generated in surface soils are very steep, espe-cially when soils are dry or high in organic matter (Raison and others, 1990). Ulery and others (1993), however, measured the

6 A Summary of the Scientific Literature on the Effects of Fire on the Concentration of Nutrients in Surface Waters
pH of a severely burned surface soil (1-8 cm thick), which was redder than the unburned soil, and the blackened layer (1-15 cm thick) underneath the severely burned surface soil and demonstrated that the pH of the soil down to as much as 15 cm can be affected by fire. The severely burned, reddened surface soils at all sites had significantly higher pH values than the unburned soils. At the SRP, TNF, and KNF-2 sites in Cali-fornia, the blackened soil layers also had significantly higher pH values than the unburned soils. Calcium carbonate equiva-lent in the reddened soils at the SRP, SNF, and TNF sites was significantly higher than in the unburned soils, indicating the presence of calcite, which can maintain soil pH in the range of 8.0 to 8.4. The calcium carbonate equivalent of the KNF-1 and KNF-2 soils (reddened, blackened, and unburned) was zero. The absence of organic acids in the most recently burned soil (SRP) due to complete combustion also may contribute to the higher soil pH, although inorganic controls on soil pH are most likely dominant. The pH of the blackened layer of the TNF and KNF-2 soils was significantly greater than the unburned soil even though the organic carbon and calcium carbonate equivalent were not significantly different between the two layers. These sites had been burned 3 years before sampling, so perhaps the pH increase in the burned layer relative to the unburned layer is due to leaching of hydroxide, bicarbonate, and carbonate through the reddened layer and into the blackened layer.
Transfer of nutrients and cations from ash to streams and lakes
Measurement of the concentration of nutrients and cat-ions in precipitation during and following a wildfire, in litter and litter leachate, in storm runoff, in soil water, and in ground water in burned and unburned areas has been used to deter-mine the pathway each nutrient and cation follows from ash to a stream or lake and the magnitude of that transfer (Lewis, 1974; Grier, 1975; Clayton, 1976; Debano and Conrad, 1978; Spencer and Hauer, 1991; Cook 1994; Gimeno-Garcia and others, 2000; and Caldwell and others, 2002).
Clayton (1976) measured concentrations of calcium, magnesium, potassium, and sodium in precipitation falling through smoke during the Pine Creek fire in the Middle Fork of the Payette River in south-central Idaho that were 20 to 70 times greater than in normal precipitation.
Lewis (1974) collected samples of rainwater, runoff, ground water, and litter at four sites within a burned area and at four sites within an unburned area adjacent to Par Pond, a reservoir near the United States Atomic Energy Commission’s Savannah River Plant in South Carolina. The concentration of nitrate and orthophosphate was much higher in the first rainfall following burning in the burned area compared to the unburned area but not in subsequent rains. The concentration of cations in rainfall was consistently twice as high in the burned area compared to the unburned area. Leaching of litter collected from burned and unburned areas immediately follow-
ing the fire showed that fire increased the solubility of calcium by twentyfold; magnesium by tenfold; sodium by 2.3-fold; and potassium by 2.2-fold. Leaching of litter collected after 80 mm of rain fell within 30 days of the fire reduced the ion yield of burned litter by 80 to 83 percent for divalent cations and 45 to 63 percent for monovalent cations. The amount of nitrate and orthophosphate leached from litter in the burned and unburned areas was identical. Thus, all cations were rendered soluble in large amounts by burning because the amount of total cations leached from burned litter was much greater than the amount of total cations leached from unburned litter. About 70 percent of the total amount of leachable cations was removed by 80 mm of rain within 30 days following the burn. The con-sistently higher concentrations of cations in rainfall in burned areas compared to unburned areas were attributed to ash con-vection (ash redistributed by wind and turbulent updrafts). The most likely explanation for the high concentrations of nitrate and orthophosphate in the first rainfall following the fire in the burned area is fallout of a small portion of volatile or fine particulate matter that did not leave the immediate vicinity of the burn. Thus, the burned and unburned areas are essentially identical in movement of nitrate and orthophosphate after the first postfire rain, whereas cations are steadily moved by wind from the burned area for at least a month following the fire.
Grier (1975) measured concentrations of total nitrogen and major cations in soil collected from the forest floor and B1 horizon and in soil solutions collected with tension lysimeters in three study plots, each 2 m x 4 m, that were established in an unburned and a burned area following a fire in north-central Washington. During the fire, 855 kg/ha nitrogen, 75 kg/ha calcium, 33 kg/ha magnesium, 282 kg/ha potassium, and 698 kg/ha sodium were lost from the soil. These losses occurred from a combination of volatilization and ash convection. Leaching of the ash layer in the first year after burning transferred a trace amount of nitrogen, 149 kg/ha cal-cium, 50 kg/ha magnesium, 92 kg/ha potassium, and 33 kg/ha sodium from the ash layer to the soil. About 3 percent of the nitrogen originally in the forest floor remained after the fire, and the amount of nitrogen in the A1 horizon of the mineral soil was reduced to about two-thirds of its original value. The forest floor losses of nitrogen were proportional to dry-weight loss. The concentrations of total nitrogen in ash leachates from both burned plots were below detection limits, and nitrogen leaching from the litter of the unburned plot was equivalent to 2.9 kg/ha/year. Leaching of cations from the forest floor and B1 soil horizon by rain and melting snow was greater from both burned plots than from the unburned forest floor. Water-percolation volumes primarily regulate leaching of cations from the ash layers.
Debano and Conrad (1978) measured the distribution of nutrients in plants, litter, soil, and runoff water before and after a prescribed burn in the southern California chaparral. A net loss of nitrogen from the soil surface following the burn was measured with an estimated 146 kg/ha of nitrogen lost by volatilization from plants, litter, and soil during the burn and another 15 kg/ha lost by erosion following the burn. Almost
Literature Review 7

8 A Summary of the Scientific Literature on the Effects of Fire on the Concentration of Nutrients in Surface Waters
all of the nitrogen lost by erosion was as particulates (ash, charred plant material, and soil particles) with trace amounts being measured in runoff water. Almost all of the phosphorus in the plants, in contrast to nitrogen, was deposited on the soil surface as ash during the fire. Volatilization of phosphorus did not occur, but 3 kg/ha of phosphorus was lost by erosion as particulates with trace amounts being measured in runoff water following the burn.
Gimeno-Garcia and others (2000) measured the changes in soil organic matter content, total and mineral soil nitrogen, available phosphorus, and exchangeable cations produced by experimental fires of different intensities on plots in Valencia, Spain. Both the intense and moderate fires caused an increase of ammonium, available phosphorus, sodium, potassium, and magnesium, a decrease in nitrate and exchangeable calcium, and cation exchange capacity on the soil surface. The con-centration increase measured for ammonium and available phosphorus was greater for the high-intensity fire and was attributed to the combustion and mineralization of soil organic matter that occurs at temperatures greater than 210oC. Losses of ammonium and nitrate in sediments eroded by water in storms following the fires from the moderate fire were greater than losses following the intense fire. This was attributed to differences in volatilization that occurred in the two fires. The nitrogen lost by volatilization in the moderate fire was less than in the intense fire. This was supported by chemical analy-sis of the ash, as the ash from the moderate fire had a higher concentration of ammonium than ash from the intense fire. In the intense and moderate fires, the losses of ammonium in the eroded sediments were greater than the losses of nitrate. The loss of available phosphorus in the eroded sediments from the intense fire plot was twice as much as that lost from the mod-erate fire plot. Soluble nutrient losses were not considered in the water balance because they were much smaller than losses in the sediments.
Cook (1994) compared nutrient loads in grassy fuel before fires, in ash, and the flux of nutrients during fire at Kapalga in Kakadu National Park, Australia. More than 90 percent of the nitrogen but less than 60 percent of phospho-rus, calcium, magnesium, and potassium were transferred to the atmosphere from the soil during the fire. The proportion of these elements transferred to the atmosphere as ash ranged from less than 25 percent for nitrogen to 60 to 100 percent for phosphorus, magnesium, and potassium. Calcium was assumed not to volatilize, so all calcium transferred from the soil to the atmosphere was in the form of ash. Assuming that the transfer of entrained ash represents local redistribution only, Cook (1994) concluded that deposition of entrained ash particles due to rainfall and settling should replace most of the losses of all elements analyzed in his study except nitrogen.
Caldwell and others (2002) estimated the loss of nitrogen by volatilization from the forest floor during a fire at three sites in the eastern Sierra Nevada. It was found that nitrogen volatilization during prescribed fire is the dominant mecha-nism of nitrogen loss from these systems. Furthermore, the nitrogen losses by volatilization were found to be significant
compared with nitrogen fluxes in atmospheric deposition and leaching in these systems.
Laboratory experiments by Spencer and Hauer (1991) confirmed the observations from field studies that nitrogen is lost primarily through volatilization rather than by leaching of ash and partially combusted litter, whereas phosphorus is lost primarily by leaching of ash. Laboratory experiments indi-cated that the source of nitrogen in the streams during a fire in northwestern Montana was from smoke that diffused into the streams. Little ammonium or nitrate was leached from ash suspended in deionized water. Diffusion of smoke into deion-ized water, however, resulted in ammonium concentrations exceeding 60 µg/L within 20 minutes under low ventilation conditions in a combustion chamber. After the first 20 minutes of the experiment, ammonium concentrations continued to increase but at a much slower rate. Only minor increases in nitrate concentration occurred under low ventilation condi-tions. Under high ventilation conditions, however, the con-centration of nitrate increased to 75 µg/L after 120 minutes. Ammonium concentrations under high ventilation increased to levels as high as those measured under low ventilation but at a slower rate. The small nitrate concentrations measured under low ventilation conditions are thought to result from incomplete oxidation of volatile nitrogenous compounds such as ammonia. The greater nitrate concentrations under high ventilation conditions are thought to result from the greater air circulation and resulting higher oxygen levels, which lead to enhanced formation of more oxidized forms of nitrogen.
The source of phosphorus in the streams during the fire was from the leaching of ash deposited into the streams during the fire. Within 20 minutes of placing ash in deionized water, the concentration of soluble reactive phosphorus exceeded 15 µg P/L and reached in excess of 30 µg P/L after 120 minutes. The concentration of soluble reactive phospho-rus remained near background levels when smoke diffused into deionized water during the low ventilation experiment, whereas small increases in concentration were measured dur-ing the high ventilation experiment. The increase in soluble reactive phosphorus measured under high ventilation was attributed to small amounts of ash carried into the beaker con-taining the deionized water by air currents circulating through the combustion chamber. The results from the leaching experi-ment were similar to those observed in the streams as the concentration of soluble reactive phosphorus in streamwater increased rapidly initially then declined steadily.
Laboratory experiments by Raison and McGarity (1980) showed that the organic carbon in a podzol soil sample was dissolved by the leachate from ash added to the sample. The dissolution of the organic carbon in the soil was attributed to the high pH of the ash leachate. At high pH, acidic functional groups in the organic carbon are ionized, which renders the organic carbon compounds more water soluble.
These studies have shown that nutrients and cations released from the combustion of organic matter can follow several pathways to streams and lakes: (1) volatilization fol-lowed by diffusion and dissolution of smoke into a stream or

8 A Summary of the Scientific Literature on the Effects of Fire on the Concentration of Nutrients in Surface Waters
lake or the dissolution of smoke in precipitation; (2) erosion of ash by wind and water from hillslopes to a stream or lake and subsequent leaching of the ash in a stream or lake; or (3) leaching of ash left on the soil surface by precipitation and subsequent movement over or through the upper soil horizons by storm runoff or through the entire soil profile to ground water. Nitrogen enters streams and lakes exclusively by pathway 1 because it volatilizes at relatively low temperatures (~200oC). Phosphorus enters streams and lakes primarily by pathway 2, and cations can enter streams and lakes by all three pathways but pathway 3 is the dominant one. Volatilization is not a dominant pathway for phosphorus or cations because they volatilize at higher temperatures: phosphorus (777oC), calcium (1,240oC), magnesium (1,107oC), potassium (760oC), and sodium (880oC) (Grier, 1975; and Caldwell and others, 2002).
Temporal effects on streamwater nitrogen during and following wildfires
Most studies that have measured the concentration of the various forms of nitrogen in streams following a fire have found that an increase above prefire concentrations occurs. The magnitude of the difference between pre- and postfire nitrogen concentration and the duration of the postfire concentration increase is dependent upon a number of fire and watershed characteristics. These characteristics include the intensity and severity of the fire (the amount of organic matter burned), the amount of wind during the fire, the amount of rainfall following the fire, slope steepness, cation exchange capacity of soil, timing of the regrowth of vegetation, and burn history.
Studies that have measured water quality during and immediately following a fire have found that the increase in the concentration of nitrogen above prefire levels occurs immediately. For example, Spencer and Hauer (1991) measured the concentration of nitrate and dissolved ammonium in two streams as a fire passed through their watersheds and in two streams in unburned watersheds. The concentration of nitrate in streams in the burned watersheds was elevated relative to the control stream immediately after the fire but was highly variable and was sometimes greater in the control stream than in the streams in burned watersheds. The concentration of ammonium in the streams in the burned watersheds was more than 40 times greater than the concentration measured in the control stream during the early days of the fire. The maximum ammonium concentrations measured in the streams in the burned watershed were 261 and 264 µg-N/L. Ammonium concentrations fluctuated greatly during the 6-week fire, especially in one of the rivers in the burned watersheds, before declining to background concentrations (<10 µg-N/L) by mid-October.
Spencer and Hauer (1991) suggested the results from their laboratory experiments, as described earlier, could explain the fluctuating concentrations of nitrate and ammo-
nium measured in two streams during the 6 weeks the fire burned. Smoke persisted over the burned watersheds, with iso-lated flareups, through mid-October. The fluctuating concen-trations of the smoke-derived ammonium and nitrate measured in the streams in the burned watersheds could have resulted from varying levels of smoke resulting from alterations in wind direction, windspeed, and flareup activity. Increased rates of nitrification following the dissolution of large amounts of ammonium into the streams also could have contributed to the increased concentrations of nitrate.
Chessman (1986) measured the concentration of various forms of nitrogen and other parameters in 11 river sites (10 burned and 1 unburned) during a 3-month interval in 1983 following a prolonged drought and intense and extensive wild-fires in Victoria, southeastern Australia. Nitrate concentrations generally were positively correlated with discharge but varied widely in all streams. The highest concentrations of nitrate were measured in 4 of the 10 streams in the burned watersheds during the first storm following the fire, but in some streams, concentrations remained very low until the second or third storm. The greatest ammonia nitrogen concentrations ranged from 0.77 to 3.1 mg N/L. Maximum ammonia concentrations for some streams in the burned watershed were 0.06, 0.12, and 0.27 mg N/L. The highest concentrations were measured dur-ing the third storm in most streams; however, concentrations in three streams in the burned watershed were also high during the first and second storms. The difference in the timing of the peak of nitrate and ammonium concentrations during the storms was thought to result from nitrite and ammonia genera-tion due to decomposition after the first or second storm, with subsequent mobilization as a result of the third storm.
Chessman (1986) suggested that the severity of the effect of wildfires on streamwater quality is governed by a number of factors including fire intensity, watershed topography, geol-ogy, soils, post-wildfire climate, and revegetation patterns. Differences in water quality among the rivers sampled in this study were considerable and likely were due to variations in watershed characteristics, extent of area burned, and fire intensity because post-wildfire rainfall patterns were broadly similar across the study area, and sampling was completed before significant growth of vegetation occurred in the burned areas.
Many studies that have monitored streamwater quality for longer periods of time following a fire have reported a consistent temporal trend in nitrate concentration during and after a wildfire. This trend consists of an increase in nitrate concentration during storms in the months immediately fol-lowing a wildfire with maximum monthly, monthly mean, or monthly volume-weighted mean nitrate concentrations and loads continuing to increase until a peak is reached in the first or second year after the wildfire during spring snowmelt followed by a slow decline thereafter (Tiedemann and others, 1978; Feller and Kimmins, 1984; MacKay and Robinson, 1987; Gluns and Toews, 1989; Bayley and others, 1992; Brass and others, 1996; Minshall and others 1997; Williams and Melack 1997; and Gerla and Galloway, 1998). Figure 1 taken
Literature Review 9

10 A Summary of the Scientific Literature on the Effects of Fire on the Concentration of Nutrients in Surface Waters
from Tiedemann and others (1978), Gluns and Toews (1989), Williams and Melack (1997), and Gerla and Galloway (1998) illustrates this pattern. Although the temporal pattern of nitrate concentration following a fire was similar in these studies, the magnitude of the concentration increase varied. Each of these studies will be reviewed briefly to illustrate this point. A discussion of ammonium concentrations will be done for those studies that measured ammonium concentrations in addition to nitrate concentrations.
Tiedemann and others (1978) reported that before a fire in the Entiat Experimental Forest in north-central Washington in late summer 1970, the average concentration of nitrate (as nitrogen) in four rivers was 0.002 mg/L, with a maximum value of 0.016 mg/L. After the fire, fertilizer was applied to the watersheds of two rivers from October 30 to November 12, 1970. The concentrations of nitrate in these two rivers during this period increased to 0.046 mg/L and 0.134 mg/L. This was the only time during the study the authors were able to dis-tinguish the effects of fertilization from those of fire. During spring runoff in 1971, the maximum nitrate concentrations in the three streams in the burned watersheds ranged from 0.008 to 0.210 mg/L. The highest concentration of nitrate in two riv-ers in the burned watersheds occurred during the spring runoff in 1972 (fig. 1 and table 2). The highest concentration of nitrate in the third river in a burned watershed occurred during the spring runoff in 1973 (fig. 1 and table 2).
Tiedemann and others (1978) stated that the increase in nitrate concentrations in the three rivers in the burned water-sheds following the fire and fertilization were most likely due to reduced uptake of nitrate by vegetation and increased nitrification in the soil as the concentration of nitrate in the river in the burned and unfertilized watershed was similar to concentrations in the rivers in the burned and fertilized watersheds. Low soil pH and low concentrations of electro-lytes limit nitrification in forest soils. Fire provides favorable conditions for nitrification by causing an increase in soil pH and in the concentration of electrolytes. The yearly decrease in the peak nitrate concentration during spring runoff coincided with the growth of vegetation. During the first and second years after the fire, plant cover on the three burned watersheds was 9 and 20 percent, respectively, and had increased to 31 percent by the fourth year. A decline in the nitrification rate also may have contributed to the declining nitrate concentra-tions in the years following the fire as the soil pH decreased to prefire levels of 5.9.
Tiedemann and others (1978) report that the average concentrations of ammonium (as nitrogen) in the three rivers draining burned watersheds from 1973 to 1975 were 0.010, 0.005, and 0.006, whereas the average concentration in the river in the unburned watershed during the same period was 0.002 mg/L. The maximum concentration of ammonium mea-sured in the burned watersheds was 0.125 mg/L, whereas the highest maximum concentration of ammonium measured in the unburned watershed was 0.013 mg/L. The lack of response of ammonium following fire relative to nitrate (table 2) was attributed to the fact that ammonium is not as mobile as nitrate
because it is a monovalent ion that is retained on soil cation-exchange complexes.
Feller and Kimmins (1984) studied a clearcut water-shed, a clearcut and slash burned watershed, and an unburned watershed (control) in British Columbia, Canada. Feller and Kimmins (1984) reported that in both disturbed watersheds, concentrations and loads, especially of potassium and nitrate, increased for the first 2-3 years following the fire followed by a decline to, and sometimes below, prefire concentrations. The mean annual nitrate concentrations for three streams, one clearcut and burned, one clearcut and slash burned, and one control for the period immediately before and after clearcutting and burning are listed in table 2. Concentrations of nitrate in streams in the watersheds that were clearcut and burned declined the following 2 to 8 years. Greater nitrogen losses occurred in the watershed that was clearcut and burned (1,293 kg/ha) than in the watershed that was clearcut only (245 kg/ha) for the first 2 years following the clearcut and burn. Ammonium concentrations for all three streams were too low to interpret.
Mackay and Robinson (1987) studied rivers in severely burned areas after a fire in Australia. They reported that nitrate concentrations increased by about a factor of 10 in streamwa-ter in the severely burned watersheds in the 12 months follow-ing the wildfire. In the one watershed, which was burned at low to moderate intensities, nitrate concentrations were close to expected concentrations based on prewildfire data. The maximum nitrate concentrations from all the data collected during the study were higher in all burned watersheds than in the unburned watershed. The highest nitrate concentration (0.130 meq/L) was measured in a river in a burned watershed during the first substantial stormflow following the wildfire. The concentration was about 25 times the maximum con-centration measured in the unburned watershed. Overall, the maximum concentrations of nitrate measured in the burned watersheds occurred during the first substantial stormflow fol-lowing the wildfire.
Gluns and Toews (1989) evaluated the water quality in the headwaters of a watershed in British Columbia, Canada, used as a domestic water supply for 3 years following a wild-fire in July 1985. Water-sampling stations were established on tributaries in two burned and one unburned watershed to measure differences between upstream and downstream concentrations of various water-quality parameters. Although the wildfire produced detectable changes in water quality, only color and turbidity exceeded Canadian drinking-water standards. Specific conductance, alkalinity, total hardness, calcium, magnesium, total nitrogen, nitrate-nitrogen, total phosphorus, and pH differed significantly between the burned and unburned watersheds. The greatest increase measured, however, was in nitrate-nitrogen. The maximum difference in nitrate (as nitrogen) occurred immediately prior to the second-year peak snowmelt runoff. The peak differences between downstream (burned) and upstream (unburned) concentrations of nitrate (as nitrogen) at this time were 0.84 and 0.87 mg/L for nitrate (as nitrogen). Seasonal trends for total nitrogen

10 A Summary of the Scientific Literature on the Effects of Fire on the Concentration of Nutrients in Surface Waters
Figure 1. Examples of the temporal variability of nitrate concentrations and load in rivers among burned and unburned watersheds.
1/1/931/2/921/1/911/1/901/1/89
0
0.5
1.0
1.5
2.0
2.5
NIT
RA
TE
, IN
MM
OL
HA
S
-1-1
D. Transport rates for nitrate. (Gerla and Galloway, 1998.)
������
����������������������������
�
��
���
���
�������������������
������������������
���������
������������������������������������������������������������������������������������������������������������������������������������������������������������������������������������������������������������������������������������������������������������������������������������������������������������������������������������������������������������������������������������������
��
��������������������������������������������������������� �����������������������������������������������������������
����
�
���
���
���
���
���
���
���
���
���
���
����������������������
�������������������
� � � � � � ������� � � � � � ������� � � � � � ������� � � ����� ���� ���� ����
�������������������������������������������������������������������������������������������������������������������������������������
���������������������������������������������������������������������������������������������������������������������������������������������������������������������������������
����������
�
����
���
���
���
���
���
���
���
���
���
���
���
���
���
���
����������������
��������������������
��������������������������������
�����������������������
����
������������������
������������������
����� ������������ ������������ ������������ ���������������������������� ���� ���� ����
�������������� ����
������������������
����������������
Literature Review 11
12 A Summary of the Scientific Literature on the Effects of Fire on the Concentration of Nutrients in Surface Waters
were similar to seasonal trends for nitrate (as nitrogen) due to the dependence of total nitrogen on nitrate (as nitrogen). Each seasonal peak in concentration difference occurred during the rising limb of the hydrograph, coincident with the melting of the snowpack in the burned parts of the watershed. No significant differences in ammonia-nitrogen and organic nitrogen between watersheds were detected. Gluns and Toews (1989) suggested that the increased concentration of nitrate in streamwater from burned areas is a result of accelerated miner-alization of organic nitrogen to nitrate and reduced demand by plants. The maximum response of nitrate (as nitrogen) in the second year was attributed to the time delay in migration of soil water containing nitrate (as nitrogen). Gluns and Toews (1989), however, stated that insufficient information exists to determine the exact cause of nitrogen loss.
Bayley and others (1992) calculated mean annual concen-trations and loads of nitrate (as nitrogen) and ammonium (as nitrogen) in rivers in three watersheds in Ontario, Canada, fol-lowing wildfires in 1974 and 1980. Both the type of watershed (one watershed has a large area of wetland whereas the other two watersheds do not) and fire intensity appear to determine the extent of nutrient losses. Losses of nitrate were higher from the watersheds without wetlands than from the watershed with the wetland, although losses of total dissolved nitrogen and total nitrogen were higher from the watershed with the wetland. Fire intensity was thought to be a factor in control-ling nutrient loss because in the watershed without a wetland, which burned twice with a high intensity, concentrations of nitrate, total dissolved nitrogen, and total nitrogen were higher than prefire concentrations for 6 years between fires and remained higher than prefire concentrations for 9 years follow-ing the second fire. The watershed without a wetland burned with a lower intensity and had no significant increase in annual concentrations of most forms of nitrogen in the 3 years following the fire; only concentrations of nitrate increased. In general, for the two watersheds that burned twice, losses of nutrients following the second fire were not as high as losses after the first fire.
Changes in the mean annual nitrate concentration follow-ing the 1974 fire and after the 1980 fire are listed in table 2. In the watershed without a wetland, the concentrations of nitrate did not return to prefire levels before the second fire in 1980. The second fire in 1980 did not cause an increase of similar magnitude in nitrate concentrations. In the watershed with a wetland, nitrate concentrations increased after both fires com-pared to the prefire period, but the concentrations were much lower than those in the two watersheds without a wetland. The effect of fire on monthly mean nitrate concentrations also was investigated. Overall, the greatest effect of fire on monthly nitrate concentrations in all three streams was during the nonvegetative season when concentrations were greater and had a greater degree of variability than in the summer months. In the summer months, uptake of the nitrate by vegetation was enough so that concentrations did not differ significantly from summer months in preburn years.
Mean annual ammonium concentrations increased after the 1974 fire in the two watersheds that burned, and peak concentrations occurred in 1977 (table 2). After 1977, the concentrations remained above the prefire concentrations but were little affected by the 1980 fire. In the twice-burned water-shed with a wetland, there was little increase in ammonium concentration after the 1980 fire. However, concentrations of ammonium in all three watersheds increased during the dry years of 1984, 1986, and 1987.
Loads of nitrate and ammonium from each watershed also increased after the fire. In the once-burned watershed without a wetland loads of nitrate increased fifteenfold over background loads in 1981 (1 year after the 1980 fire) but returned to near-normal loads in 1983-86. In the twice-burned watershed without a wetland, loads of nitrate increased seven fold over background loads (550 g N/ha/yr) in 1975 (1 year after the first fire) and did not return to prefire loads before the second fire. The second fire caused a smaller increase in nitrate load in 1980-83, and loads remained higher than background through 1988. In the twice-burned watershed with a wetland, nitrate load doubled after the first fire in 1974 and increased slightly after the 1980 fire. Nitrate load was tenfold lower after both fires in this watershed than in the two watersheds with no wetlands. The load of ammonium in the twice-burned watershed without a wetland increased from 30 g-N/ha/yr for the 3 years before the 1980 fire to 51 g-N/ha/yr for the 3 years following the fire and remained above prefire levels through 1989. In the twice-burned watershed (with wet-land), the highest loads of ammonium occurred after the first fire with peaks in 1974-75 and 1977 at 150 to 180 g-N/ha/yr (2 times the prefire load values). Ammonium load after the 1980 fire did not increase compared with the prefire period. In the twice-burned watershed without a wetland, ammonium loads increased more after the windstorm and during 1983-86 than during the periods immediately following each fire.
The increase in the load of nitrate and ammonium from these three watersheds appeared to result from an increase in annual water yield (discharge/precipitation) and from an increase in concentration. After the 1974 fire, the annual water yield remained higher in the twice-burned watersheds com-pared with the once-burned watershed for 5 years after the fire. The annual water yields in the twice-burned watersheds were close to that from the once-burned watershed by 1979, but after the 1980 fire, yields increased in the watersheds that did not have a major wetland. The annual water yield after the second fire from the watershed without a wetland was lower than the annual water yield after the first fire.
Brass and others (1996) found that nitrate concentra-tions were still elevated 5 years after a fire in Yellowstone National Park, Wyoming, and that the magnitude of the increase depended on the intensity of the fire. In a stream draining an intensely burned watershed, the average nitrate concentration was 4 to 10 times greater than in the unburned watershed; short-term concentrations were 20 to 30 times the average in the unburned watershed. The short-term elevated concentrations generally occurred during precipitation events.

12 A Summary of the Scientific Literature on the Effects of Fire on the Concentration of Nutrients in Surface Waters
In the other severely burned watershed, average (3.5 mg/L) and short-term peak-nitrate concentrations were 10-33 times greater than those measured in the unburned watershed. Some of the short-term peak concentrations exceeded 10.0 mg/L. In a watershed that was less intensely burned, average nitrate concentrations were 5 times higher than those measured in the unburned watershed, and peak concentrations were 8 times higher. Some of the short-term peak concentrations exceeded 8.0 mg/L. In a moderately burned watershed, average nitrate concentrations (1.5 mg/L) were 5 times higher than those mea-sured in the unburned watershed, and peak concentrations (5.0 –5.2 mg/L) were 5.2 times higher. In a lightly burned watershed, average nitrate concentrations (0.8 mg/L) were 2.6 times higher than those measured in the unburned water-shed, and peak concentrations were 4 to 27 times higher. Many of the short-term peak concentrations ranged from 4 to 8 mg/L.
Minshall and others (1997) measured postfire nitrate-nitrogen concentrations in the same area as Brass and others (1996) but in a larger number of streams. The wildfire had a strong influence on instream nitrate-nitrogen concentrations because in streams in burned watersheds, the concentration of nitrate-nitrogen displayed 20 percent more temporal change (measured as among-year coefficient of variation) than con-centrations in unburned watersheds (p<0.11). It was noted that temporal changes in instream nitrate levels typically reflected recovery by adjacent terrestrial vegetation.
Williams and Melack (1997) reported that the volume-weighted mean concentration of nitrate in the first year after burning was 2,000-fold greater than preburn baseline and remained above prefire concentrations by the end of the third year after burning in a watershed in California. In January 1991, the first month of streamwater runoff after the burn, the maximum concentration of nitrate briefly exceeded 60 µeq/L, whereas in March 1991, nitrate concentrations exceeded 140 µeq/L. In the following spring (1992), nitrate concentra-tions increased above 120 µeq/L and remained above 60 µeq/L for several weeks. In contrast, prefire concentrations seldom exceeded 0.5 µeq/L. Streamwater nitrate remained above preburn concentrations until the middle of the third year after burning. The load of nitrate in the burned watershed increased from an annual average of less than 0.03 kg/ha/yr during the 7-year preburn period to 1.6 kg/ha/yr in the first 3 years after the burn. Increased streamflow following the burn and an increase in nitrate concentrations caused an increase in nitrate load. Streamflow in the burned watershed increased fortyfold in 1991, 1 year after the burn relative to the preburn year of 1990, whereas streamflow in the unburned watershed increased by a factor of 1.5 during the same time period. Rapid increases in ammonium after the burn also were mea-sured in the burned watershed. The concentration of ammo-nium increased to about 25 µeq/L immediately after the burn occurred but decreased to the preburn concentration several months later, although with more variability until the end of the study than before the burn.
Gerla and Galloway (1998) calculated the load of nitrate in an unburned watershed and a burned watershed from 1989 through 1993 in Wyoming, USA (fig. 1). During 1989, 1 year after the fire, nitrate transported from the unburned watershed peaked at 2 mmol/ha/s, which was twice as much as the nitrate transported from the burned watershed. The nitrate load in the unburned watershed rapidly returned to normal transport rates following the 1990 summer season, and by 1992 the rate fell to 0.1 mmol/ha/s. Nitrate load in the burned watershed in 1989 appeared similar to the small load of the unburned watershed 5 years after the fire but increased in summer 1991 when more than 1.5 mmol/ha/s were transported from the watershed and peaked at 1.8 mmol/ha/s in 1992. After 1991, nitrate loads appeared to be slowly returning to possibly normal seasonal maximum loads of about 0.2 mmol/ha/s. The initial high rates of nitrate transport in the unburned water-shed may have occurred from atmospheric fallout of ash. The timelag observed in the transport of nitrate from the burned watershed may be due to nitrogen fixed by postfire establish-ment of Ceanothus, the gradual breakdown of charred wood, the slow leaching of volatile nitrogen that had been driven to greater depth in soils during the fire, or a combination of these processes. Gerla and Galloway (1998) reported that the incom-plete record for ammonium and organic nitrogen in the burned watershed appeared to parallel the trend in nitrate transport.
The temporal patterns in the concentration of nitrate and ammonium following fires reported in watersheds in North America also has been reported in other burned watersheds around the world. Belillas and Roda (1993) reported that the concentration of nitrate in overland flow on burned slopes (mean = 27.8 µequiv/L) was significantly higher than on unburned slopes (mean = 4.9 µequiv/L) (p< 0.15) in a water-shed in Spain. Belillas and Roda (1993) advised caution in the interpretation of the overland-flow chemistry data due to the small number of samples and the high variability of the concentrations of dissolved parameters. The concentration of nitrate in streamwater in the burned watershed after the burn was significantly greater than concentrations before the burn (p=0.028). Relative to the unburned watershed, increases in the arithmetric mean concentration of nitrate in the spring and in the autumn-winter season immediately after the fire ranged from 0.6 to 2.5 µeq/L. Belillas and Roda, (1993) also found that fire in a heathland watershed increased mean annual streamflow in the burned watershed by 36 percent compared to the unburned watershed during the 2 years following the fire. The increase in mean annual streamflow in the burned watershed relative to the unburned watershed was attributed to (1) reduced interception and transpiration after the removal of vegetation, (2) decreased soil wettability, and (3) decreased porosity of the upper soil layers. Even though there was little or no change in the concentration of dissolved parameters fol-lowing the fire, the increased annual streamflow increased the flux of dissolved parameters by at least 36 percent in the first 2 years following the fire.
Belillas and Roda (1993) attributed the small effect of the fire on stream chemistry to (1) efficient retention by the
Literature Review 13

14 A Summary of the Scientific Literature on the Effects of Fire on the Concentration of Nutrients in Surface Waters
soil of nutrients leached from the ash due to cation- exchange reactions in the upper soil of these low base saturation soils, (2) uptake by regrowing vegetation, and (3) the weather after the fire (four small to moderate snowfalls in the first 12 days after the fire produced a negligible increase in streamflow, and rainfall in the spring following the burn was much lower than average). Belillas and Roda, (1993) suggested that greater effects on water chemistry following a fire should occur when the fire is severe enough to burn the soil organic layer, when fire occurs on steeper slopes, and when heavy rainfall occurs shortly after the fire.
Van Wyk and others (1992) calculated mean monthly mass loads of 15 chemical parameters from a watershed in South Africa from January 1986 to December 1988. Data from the prefire period (January 1986 to February 1987) were compared with data from the postfire period (April 1987 to December 1988) to determine the effects of fire on the streamwater chemistry of the watershed. Significant differ-ences (p<0.05) between the monthly mean mass load for a given constituent before the fire and the monthly mean mass export after the fire were detected only for potassium and nitrate (loads for both constituents were significantly greater after the fire).
Not all studies, however, report an increase in the concentration of nitrate and ammonia in streams follow-ing a fire. Richter and others (1982) summarized the effects of prescribed fires on experimental watersheds in the lower Coastal Plain of South Carolina. The effects of prescribed fire were evaluated by estimating losses of forest-floor nutrients by volatilization and particulate transport in turbulent updrafts and by measuring the concentrations of nutrients and major ions in streamwater from paired watersheds, one subjected to a prescribed fire and one not burned, before and after burning. Weekly sampling of paired watersheds over 3-1⁄2 years for total nitrogen, ammonium, nitrate, phosphate, sulfate, chloride, calcium, magnesium, potassium, sodium, bicarbonate, and pH indicated no changes in streamwater chemistry as a result of fire. Losses of nitrogen by volatilization and particulate trans-port in turbulent updrafts were found to be small. The small loss of nitrogen during prescribed fires was attributed to the fact that combustion tends to be restricted to surficial litter lay-ers because of a steep moisture gradient between the surface of the forest floor and the mineral soil. Thus, most prescribed fires consume less than one-third of the total forest-floor mass. This surface organic layer has low concentrations of nitrogen because most nitrogen is concentrated in the basal layers of the forest floor due to decomposition processes. Richter and others (1982) stated three reasons why prescribed fires did not produce any detectable changes in the chemical composi-tion of streams. First, the prescribed fires consumed less than one-third of the forest floor mass, which is composed of pine litter having low ash contents. Therefore, small quantities of ash elements were released by burning. Second, suspensions of ash particulates and solutions of water-soluble elements in runoff were filtered by unburned litter and soil layers before emerging as streamflow. Finally, 20-m-wide unburned buffer
strips adjacent to stream channels provided additional filtration.
Davis (1989) also observed no measurable effect of a pre-scribed fire on streamwater quality in a paired watershed study in the Arizona chaparral. The differences in the concentration of nitrate and the concentrations of sulfate, bicarbonate, chlo-ride, calcium, magnesium, sodium, and potassium between the stream draining the burned watershed and the stream draining the unburned watershed were the same before and after the prescribed fire. Davis (1989) attributed the lack of response by the stream to the prescribed fire to adsorption of the ions released by the fire on humic and clay complexes in the soil and uptake by vigorously growing vegetation.
Johnson and Needham (1966) observed no measurable effects of a wildfire on the water chemistry (pH and dissolved bicarbonate, calcium, magnesium, sodium, and potassium) between the upper unburned and lower burned areas of a watershed in California. The combination of light rainfall fol-lowing the fire and the acid, highly permeable soils of the area was thought to be the reason that the fire produced no measur-able change in water quality. The light rainfall after the fire caused little or no direct carry-off of ash to the stream. Soluble cations leached from the ash were exchanged for hydrogen and adsorbed on the soil complex rather than washed directly into the stream. Johnson and Needham (1966) speculated that heavy rains and less-permeable soil conditions might have resulted in a temporarily elevated ionic concentration in the stream.
Other forms of nitrogen
Spencer and Hauer (1991) noted that the concentra-tion of total nitrogen also increased in the streams in burned watersheds relative to streams in the unburned watersheds immediately after the firestorm. The maximum nitrogen concentrations in streams in the burned watersheds were 349 and 344 µg-N/L. The concentration of total nitrogen in the unburned watershed streams was less than 100 µg-N/L. The dissolved forms of nitrogen made up the majority of the total nitrogen measured in the fire-impacted streams, sometimes exceeding 90 percent.
Bayley and others (1992) also measured concentrations and loads of suspended nitrogen, total dissolved nitrogen and total nitrogen. In the twice-burned watersheds, the concentra-tion of suspended nitrogen increased significantly after the 1974 fire compared with the prefire period of 1971-73. After the 1980 fire, the concentration of suspended nitrogen in the twice-burned watershed with no wetland increased signifi-cantly compared with the prefire period but did not increase in the twice-burned watershed with a wetland. In the once-burned watershed without a wetland, suspended nitrogen concentra-tions were relatively constant from 1971 to 1978 and were erratic thereafter without apparent cause.
In the twice-burned watersheds, loads of suspended nitro-gen increased significantly after the 1974 fire. After the 1980

14 A Summary of the Scientific Literature on the Effects of Fire on the Concentration of Nutrients in Surface Waters
fire, however, loads of suspended nitrogen did not increase significantly compared with those in the prefire period of June 1971 to June 1973 in these two watersheds. In the once-burned watershed, loads of suspended nitrogen following the 1980 fire were not significantly different from the prefire period of 1971-80.
In the twice-burned watersheds, the 1974 fire caused about a twofold increase in total dissolved nitrogen concentra-tion. Concentrations decreased in 1977, but concentrations of total dissolved nitrogen increased again after the 1980 fire. In the once-burned watershed, total dissolved nitrogen concentra-tions in the 3 years following the 1980 fire were not signifi-cantly different from the prefire period of 1971-80 but during the fire year (1980), the concentration of total dissolved nitro-gen increased dramatically and then declined to prefire con-centrations within a year. The concentrations of total dissolved nitrogen in the once-burned watershed for 1974-80, before the fire occurred, were significantly higher than in 1971-73, most likely because of leaching of ash blown into the watershed from the 1974 fires. There was not much of a seasonal pattern observed for total dissolved nitrogen concentrations in the twice-burned watersheds. In the once-burned watershed, total dissolved nitrogen concentrations showed a spring maximum and a summer minimum, similar to nitrate concentrations.
In the twice-burned watersheds, the load of total dis-solved nitrogen increased significantly after the 1974 fire. After the 1980 fire, the load of total dissolved nitrogen in the twice-burned watershed with no wetland was significantly higher than prefire loads, but no increase occurred in the twice-burned watershed with a wetland. In the once-burned watershed without a wetland, there was a significant increase in the load of total dissolved nitrogen after the 1980 fire.
The concentrations of total nitrogen in all three water-sheds were similar to those observed for total dissolved nitrogen. In the twice-burned watersheds, the annual export of total nitrogen increased significantly after the first fire in1974. The annual export of total nitrogen also increased significantly after the 1980 fire, but there was no significant increase in the twice-burned watershed with a wetland. In the once-burned watershed without a wetland, the annual export of total nitrogen increased significantly after the 1980 fire, primarily because of the increased export of total dissolved nitrogen.
Chessman (1986) noted the highest concentrations of total nitrogen were measured in the first and third storms. Chessman (1986) estimated watershed loads per unit area were two to three times greater for the burned watersheds than for the largely unburned Bemm watershed.
Tiedemann and others (1978) noted that the average concentration of organic nitrogen remained near background concentrations in 1971 for the three burned watersheds but doubled in 1972 to concentrations ranging from 0.10 to 0.11 mg/L. By the fourth year after the fire, the average organic nitrogen concentrations in the burned watersheds were approaching prefire levels (0.05 and 0.04 mg/L). The aver-age concentration of organic nitrogen in one of the burned watersheds remained above prefire levels through 1975. The
average concentration of organic nitrogen in the unburned watershed remained constant at 0.06 mg/L from 1972 to 1974 and declined to 0.03 mg/L in 1975. The average yearly load (kg/ha) of total nitrogen from the three burned watersheds was 0.27 kg/ha in 1971, 3.35 kg/ha in 1972, 0.70 kg/ha in 1973, 1.48 kg/ha in 1974, and 0.86 kg/ha in 1975. Thus, in 1975, the load of nitrate was still three times greater than the load in 1971. Nitrate accounted for 60 to 80 percent of the total nitrogen load.
Gluns and Toews (1989) stated that the peak differences between downstream (burned area) and upstream (unburned area) concentrations of total nitrogen were 0.88 and 0.92 mg/L for total nitrogen in the burned downstream watersheds.
Townsend and Douglas (2000) studied the effects of fire on water quality, water yield, and export coefficients (load/watershed area) of three intermittent streams that flow between December and June in a tropical savanna in northern Australia. The increased susceptibility to erosion in the burned watershed L [due to less canopy cover (50 percent less), less riparian tree density (80 percent less), less litter cover, and increased amounts of bare ground] resulted in episodic runoff events in November and December, before a continuous wet-season flow. These episodic runoff events did not occur in two of the watersheds (one burned and one unburned). The concentrations of total suspended sediment, volatile suspended sediment, total nitrogen, total phosphorus, total iron, and total manganese in the episodic events were as much as 10 times greater than concentrations measured later in the wet season. Differences in water quality occurred among all three watersheds only during times of high flow. Base-flow water quality of the three streams was similar during continuous wet-season flow between December and May. Storm-runoff concentrations of total nitrogen and total phosphorus also were similar; however, storm-runoff concentrations of total sus-pended sediment, volatile suspended sediment, total iron, and total manganese in one burned watershed were 2 to 5 times higher than those measured in the other burned and unburned watersheds. Despite these differences in concentration, only the export coefficient for total suspended sediment was significantly higher in one burned watershed relative to the other two watersheds. The apparently negligible effect of the fire regimes on the export coefficients of volatile suspended sediment, total nitrogen, total phosphorus, total iron, and total manganese and the overall low sediment export coefficients for the three watersheds were attributed to the low watershed slopes (average 0.5 percent), low soil fertility, a protective surface gravel lag, the negligible effect of the fire on water yield, and the sometimes lengthy period (maximum 6 months) between burning and runoff.
Temporal effects on streamwater phosphorus during and following wildfires
Similar to nitrogen, most studies that have measured the concentration of the various forms of phosphorus in streams
Literature Review 15
16 A Summary of the Scientific Literature on the Effects of Fire on the Concentration of Nutrients in Surface Waters
following a wildfire have found that an increase above prefire concentrations occurs. The magnitude of the difference between pre- and postfire phosphorus concentration and the duration of the postfire concentration increase also is depen-dent on the intensity and severity of the fire (the amount of organic matter burned), the amount of wind during the fire, the amount of rainfall following the fire, slope steepness, soil cation-exchange capacity, and timing of the regrowth of vegetation.
Studies that have measured water quality during and immediately following a fire have found that the increase in the concentration of phosphorus above prefire levels also occurs immediately. Spencer and Hauer (1991) noted that the concentration of soluble reactive phosphorus in streamwater from a burned watershed increased by greater than fortyfold relative to the streams in the unburned watersheds and reached a maximum concentration of 135 µg-P/L within 24 hours of the start of the fire. The concentration of soluble reactive phosphorus in streams in unburned watersheds remained consistently less than 3 µg-P/L. The concentration of soluble reactive phosphorus in one burned watershed increased by four to five fold relative to the unburned watersheds. Soluble reac-tive phosphorus made up a majority of the total phosphorus measured and accounted for as much as 84 percent of the total phosphorus measured in the burned watersheds following the firestorm. In the unburned watersheds, soluble reactive phos-phorus usually accounted for less than 25 percent of the total phosphorus measured. The maximum concentration of total phosphorus in one of the burned watersheds was 206 µg-P/L, and the maximum concentration of total phosphorus in the other burned watershed was 26.5 µg-P/L. The concentration of soluble reactive phosphorus and total phosphorus declined steadily in both burned watersheds, reaching background concentrations (less than 6 µg-P/L) within 2 weeks of the firestorm’s passage.
Tiedemann and others (1978) found the average annual concentration of orthophosphorus and total phosphorus from 1973 to 1975 (measurement of phosphorus did not begin until 1973) to be 1.5 to 3 times greater in the burned watersheds compared to the unburned watershed. The highest annual average concentrations of orthophosphorus (0.025 mg/L-P) and total phosphorus (0.042 mg/L-P) in the burned water-sheds were measured in 1974. In the unburned watershed, the highest annual average concentration of orthophosphorus was 0.007 mg/L-P in 1974 and the highest annual average concen-tration of total phosphorus was 0.015 mg/L-P in 1973.
Gluns and Toews (1989) found no significant differ-ences in orthophosphorus after 2 years. During the first runoff period, differences between downstream and upstream concentrations of 0.004 and 0.001 mg/L were measured in the burned watersheds; but all other samples were below the detection limit of 0.003 mg/L. All samples of orthophosphorus in the unburned watershed were below the detection limit. A significant difference was found for total phosphorus in the burned watersheds with the greatest differences, 0.014 mg/L and 0.012 mg/L, occurring during the first runoff period, con-
current with the detectable concentrations of orthophosphorus. These peaks coincided with snowmelt in the burned areas of the watershed. The increase of total phosphorus in the tributar-ies in burned watersheds was low in the second runoff season and was undetectable in the third runoff season.
Bayley and others (1992) reported an increase in the con-centration of total dissolved phosphorus and total phosphorus in the twice-burned watersheds following the 1974 fire (table 2). In the twice-burned watershed with a wetland, the increase in the total dissolved phosphorus concentration following the 1974 fire was greater than the concentration increase following the 1980 fire. In the twice-burned watershed with no wetland, the total dissolved phosphorus concentrations increased by 30 percent after both fires. Average monthly concentrations of total dissolved phosphorus in the twice-burned watershed with a wetland were 5 times greater than prefire concentra-tions in winter, whereas during the rest of the year the postfire concentrations were 2 times greater than prefire concentra-tions. The pattern of total phosphorus concentrations was simi-lar to those for total dissolved phosphorus. The load of total dissolved phosphorus increased in the twice-burned watershed with a wetland after the 1974 fire with the peak load occurring in 1975 (152 g/ha/yr). There was no significant increase in the annual load of total dissolved phosphorus from the twice-burned watershed with no wetland after the 1974 fire or from both twice-burned watersheds after the 1980 fire. The load of total phosphorus increased in the twice-burned watershed with a wetland after the 1974 fire with the peak load occurring in 1975 (183 g/ha/yr). There was no significant increase in the annual load of total dissolved phosphorus from the twice-burned watershed with no wetland after the 1974 fire or from both twice-burned watersheds after the 1980 fire. The 1980 fire had no apparent effect on the concentration or load of total dissolved phosphorus and total phosphorus in the twice-burned watershed with no wetland.
Brass and others (1996) found that elevated concentra-tions of orthophosphate in streams depended on the intensity of the fire. In a stream draining an intensely burned watershed, the average orthophosphate concentration was 0.3 mg/L, with peak concentrations greater than 2.0 mg/L. These concentra-tions were 2 to 10 times greater than concentrations in the unburned watershed. In another severely burned watershed, the average orthophosphate concentration was 0.4 mg/L. Two of the highest peak concentrations were 3.2 mg/L and 8.74 mg/L. These concentrations were 2.7 to 29 times greater than in the unburned watershed. In a watershed that was less intensely burned, the average orthophosphate concentration was 0.2 mg/L, although the highest peak concentration was 12.66 mg/L. The average concentration was 1.3 times higher than the average for the unburned watershed, and the highest measured peak concentration was 42 times higher than the peak concentrations in the unburned watershed. In a moder-ately burned watershed, the average orthophosphate concentra-tion was below that of the unburned watershed. Peak concen-trations, which occurred during storms, ranged from 0.1 to 0.8 mg/L and were 2.6 times higher than those measured in the

16 A Summary of the Scientific Literature on the Effects of Fire on the Concentration of Nutrients in Surface Waters
unburned watershed. In a lightly burned watershed, average orthophosphate concentration was similar to those measured in the unburned watershed, but periodic peak concentrations were 8.4 to 11.8 times higher.
Gerla and Galloway (1998) stated that total phosphorus transported from the burned watershed averaged 0.011 mmol/ha/s during summer 1989 but decreased to 0.004 mmol/ha/s in subsequent years. Total phosphorus trans-ported from the burned and unburned watersheds was gener-ally similar for the years 1990-93, although transport from the burned watershed was slightly greater in 1990 and 1992. In the summer season immediately following the fire (1989), greater rates of phosphorus transport punctuated the water-quality record for the burned watershed. Apparently, phosphorus was readily transported from the burned watershed the summer fol-lowing the fire, but not 2 years later, presumably due to uptake by newly established vegetation.
Temporal effects on nitrogen and phosphorus concentrations in lake and reservoir water during and following wildfires
Studies that have assessed the effect of wildfire on the water quality of lakes and reservoirs have indicated that the trophic status of the lake or reservoir and the residence time of water in a lake or reservoir in addition to the fire and water-shed characteristics noted for streams can affect the postfire response of a lake or reservoir.
Enache and Prairie (2000) used diatoms collected from a 2.98-m sediment core in a diatom-based quantitative inference model to reconstruct the fire history and temporal changes in pH, total phosphorus, and DOC for the past 2,165 years in Lac Francis, Quebec, Canada. The diatom-based quantitative inference model is a weighted averaging partial least-squares transfer function developed from a calibration set of 42 lakes from the Abitibi region in northwestern Quebec, Canada. Four fire events within the sediment core occurring about 186 years ago, 242 years ago, 1,448 years ago, and 2,165 years ago were studied. Relative to prefire concentrations, the diatom-inferred concentration of total phosphorus increased by about 13 µg/L for the fire occurring 1,448 years ago, and by about 4 µg/L for the fire occurring 2,165 years ago. Increases in the concentra-tion of total phosphorus during the two most recent fires were less than those for the two oldest fires.
Differences in trophic status, climatic conditions, and length of the fire cycle over time were thought to be the reasons why the magnitude of the effect of wildfire on total phosphorus concentrations varies considerably from fire to fire. Lac Francis is more eutrophic now than it was 2,165 years ago (concentration of total phosphorus has increased from 7 to 8 µg/L 2,165 years ago to about 25 µg/L today). Addi-tional inputs of nutrients from a wildfire may not be as readily detectable in samples from a eutrophic lake as they are from an oligotrophic lake. The two recent fires occurred within a moist and warm period with shorter fire cycles. These recent
fires may have been less intense than the older fires because of the more humid climate and smaller fuel load due to the short fire cycles. The less intense fire would have contributed lower nutrient loads to the lake because of reduced evapotrans-piration and the reduced availability of inorganic phosphorus generated by the less efficient burning of nutrient-rich plant matter. It was found that the maximum temporal extent of the impact of the fires does not significantly exceed the time-frame covered by a 1-cm accumulation of sediment, which corresponds to between 13 and 16 years. Little wildfire effect on diatom-based reconstruction of DOC was noticed. It is pos-sible that wildfire effect on pH and DOC concentration is sig-nificant but that it is much more short-lived than the effect on total phosphorus and therefore is less readily detectable from sediment slices representing several years. Enache and Prairie (2000) suggested that the trophic status of the lake before a wildfire and the length of the fire cycle are important factors in the biogeochemical response of a lake to a wildfire.
McEachern and others (2000) measured chlorophyll-a, total and dissolved nutrients, major ions, color, and pH in 10 headwater lakes in burned peatland-conifer watersheds and 14 headwater lakes in unburned watersheds throughout a summer 2 years following a forest fire in a boreal subarctic region of northern Alberta. Five headwater lakes in watersheds burned between 1961 and 1985 and three streams (two in burned watersheds, one in an unburned watershed) also were sampled.
Lakes in burned watersheds had 1.2-fold higher dissolved nitrogen (p = 0.02), threefold higher nitrate (as nitrogen) (p = 0.04), and 1.4-fold higher ammonium (as nitrogen) (Mann-Whitney p = 0.03) than reference lakes in unburned watersheds. Mean total nitrogen and dissolved nitrogen con-centrations in the two reference streams in unburned water-sheds (MS1 and MS2) were 710 and 650 µg/L, respectively, whereas the stream draining the burned watershed (MS3) contained 2.2-fold higher total nitrogen and 1.2-fold higher dissolved nitrogen concentrations. Increased load of nitrogen from the MS3 watershed relative to the MS1 and MS3 water-sheds was likely given the two- to fourfold higher watershed-weighted discharge from MS3.
Lakes in burned watersheds had 2.6-, 3.2-, and 6.8-fold higher total phosphorus, dissolved phosphorus, and soluble reactive phosphorus concentrations, respectively, than lakes in unburned watersheds (p<0.01). Mean total phosphorus and dissolved phosphorus in the two streams draining unburned watersheds were 48 and 28 µg/L, respectively, whereas the stream draining the burned watershed contained 5.4-fold higher total phosphorus and one-half the dissolved phospho-rus. Increased load of phosphorus from the burned watershed relative to the unburned watersheds was likely, given the two to four fold higher watershed-weighted discharge from the burned watershed. The phosphorus concentration in water in the lakes in watersheds burned between 1961 and 1985 were intermediate between those of the lakes in the recently burned watersheds and the lakes in unburned watersheds. Total phos-phorus and dissolved phosphorus appeared to decline with
Literature Review 17

18 A Summary of the Scientific Literature on the Effects of Fire on the Concentration of Nutrients in Surface Waters
the natural logarithm of time since disturbance. DOC con-centrations in lakes in burned watersheds (mean = 25 mg/L) were significantly greater (p<0.01) than in lakes in unburned watersheds (mean = 16 mg/L). Mean DOC concentration in the two streams draining the unburned watersheds were 33 and 37 mg/L, whereas the stream draining the burned watershed had a mean DOC concentration of 28 mg/L. Increased load of DOC from the burned watershed relative to the two unburned watersheds was likely, given the 2- to 4-fold higher watershed-weighted discharge from the burned watershed. An analysis of various watershed physical characteristics indicated that it is unlikely for the chemical differences between lakes in unburned and burned watersheds to have resulted from physi-cal characteristics alone.
Total phosphorus concentration explained 86 percent of the variance in lake chlorophyll-a concentration in unburned watersheds but was not related to chlorophyll-a concentration in lakes in burned watersheds. Algae in the lakes in burned watersheds are thought to be light-limited because of the higher concentrations of DOC, which reduced light transpar-ency, as is evident from the negative correlation of Secchi transparencies to color in the lakes in burned watersheds. Color was related to DOC in all lake waters. Time since dis-turbance and percentage of disturbance combined explained 74 percent of the variance in total phosphorus among lakes in burned watersheds when the total phosphorus data from the lakes in burned watersheds between 1961 and 1985 were included in the analysis.
Carignan and others (2000) found results similar to that of McEachern and others (2000) in their study of lakes in burned, logged, and unburned watersheds in the Boreal Shield region of Canada. Median concentrations of total nitrogen for lakes in burned watersheds were twofold higher compared with lakes in unburned watersheds. Nitrate concentrations were as much as sixtyfold higher in lakes in burned watersheds than in lakes in logged and unburned watersheds. Median con-centrations for lakes in burned watersheds had two to threefold higher concentrations of total phosphorus compared with lakes in unburned watersheds.
DOC concentrations in lakes in burned watersheds were not significantly different from those of lakes in unburned watersheds 1 year after fire, but DOC concentrations increased significantly during the following years. Carignan and others (2000) concluded that mobile ions released by fire, such as potassium, chloride, sulfate, and nitrate, are rapidly flushed out of the watershed (50-percent decrease in 3 years), whereas other parameters, such as total phosphorus, total organic nitrogen, DOC, calcium, and magnesium show little change or are still increasing after 3 years and will take a longer time to reach normal concentrations.
Lamontagne and others (2000) calculated loads of total nitrogen and total phosphorus into the lakes studied by Cari-gnan and others (2000) and found that the loads of these two elements increased by 33 percent and 64 percent, respectively, into the lakes in burned watersheds compared to loads into the lakes in unburned watersheds following the wildfire. The
loads were highest in the year following the fire but were still above loads to lakes in unburned watersheds 3 years later. This increase in nutrient loads to lakes draining burned watersheds is thought to be affecting the ecology of these lakes. Changes in the pelagic and benthic algal biomass and zooplankton biomass in these lakes have accompanied the increase in nutri-ent loads. The pelagic and benthic algal biomass was higher in lakes draining burned watersheds compared to lakes draining unburned watersheds. Zooplankton biomass was higher in lakes draining burned watersheds compared to lakes draining unburned watersheds in the second year following the wildfire.
Taylor and others (1993) evaluated the water-qual-ity effects of a wildfire that occurred in the drainage basin upstream from Lexington Reservoir in California. Storms during February 12-19, 1986, produced 25.5 inches of rain, and the resulting runoff filled the empty Lexington Reservoir within 36 hours. In the spring of 1986, water of low conductiv-ity, low chloride, and high turbidity entered the reservoir and suppressed the numbers of phytoplankton by two orders of magnitude. This decrease in phytoplankton numbers occurred despite increases in the concentrations of nitrogen and phos-phorus by one and two orders of magnitude, respectively. During the growing season, as the sediment load from the runoff began to settle and the reservoir warmed up, the water transparency increased as did the phytoplankton population, which increased to one to two orders of magnitude greater than that measured during the previous summer and autumn months. The average nitrogen to phosphorus ratio before the fire and flood was 77.0 and decreased to 45.9 after the fire and flood. These ratios indicate an increase in phosphorus relative to nitrogen after the fire and flood and may be a result of the extensive use of diammonium phosphate as a fire retardant. Changes in the mean concentrations of several nutrients in Lexington Reservoir following the fire and flood are listed in table 2.
Not all studies, however, report measurable effects on lake water quality following a fire. McColl and Grigal (1975) measured the concentration and load of total phosphorus in overland flow in burned and unburned watersheds following a wildfire in the Superior National Forest of northeastern Min-nesota. The concentration of total phosphorus in overland flow in the burned watershed, compared to the unburned watershed, was significantly greater in the first year following the wild-fire. In the second and third years following the fire, however, the concentration of total phosphorus in overland flow in the burned watershed declined and was less than the concentration of total phosphorus in overland flow in the unburned water-shed in both years. The load of total phosphorus in overland flow in the burned watershed, compared to the unburned watershed, was greater during the 2 years following the fire, with the greatest difference occurring in the first year. By the third year, the load of total phosphorus in overland flow in the burned watershed was less than the load of total phosphorus in overland flow in the unburned watershed.
The concentration and load of total phosphorus in soil water in the burned and unburned watersheds also were
18 A Summary of the Scientific Literature on the Effects of Fire on the Concentration of Nutrients in Surface Waters
measured. The total phosphorus concentration of soil water in the burned watershed, compared to the unburned watershed, was greater in each of the 3 years following the fire, with the greatest difference occurring in the first year. The load of total phosphorus in soil water in the burned watershed, compared to the unburned watershed, was greater during the 2 years follow-ing the fire, with the greatest difference occurring in the sec-ond year. By the third year, the load of total phosphorus in soil water in the unburned watershed was greater than the load of total phosphorus in soil water in the burned watershed. Despite the increase in total phosphorus in overland flow and in soil water during the first year following the fire, there was no increase in the total phosphorus concentration of the lake and its input stream. The following reasons were given to explain why the concentration of total phosphorus remained low in the lake and its input stream despite increased concentrations of phosphorus in runoff:
1. Overland flow is a negligible fraction of total runoff and is transient and discontinuous. Subsurface flow is in intimate contact with the soil, and phosphorus is immobilized in the soil.
2. Large parts of both watershed areas are lake surfaces (33 and 21 percent). Thus, inputs to the lakes from runoff are considerably diluted by precipitation falling directly on the lake surface.
3. The relatively large volumes of lake water can dilute input streamwaters (in the unburned area, mean phos-phorus concentrations of the input stream and lake were 26 and 14 parts per billion, respectively).
4. The fire occurred in early spring and vegetative regeneration was vigorous immediately after it. The prolific vegetative growth used some phosphorus released by burning and thus reduced losses to the aquatic environment.
McColl and Grigal (1975) advised caution in interpret-ing these results because the wildfire occurred in early spring, before new vegetative growth had begun and when the forest floor was still cool and moist. The slopes of the watershed are not steep; little erosion occurred following the fire, and there was no noticeable hydrophobic effects that might have inhib-ited water infiltration into the soil. McColl and Grigal (1975) speculated that a fire in summer or early fall might burn more intensely, exposing soil to erosion and preventing recycling by vegetative uptake. A fire of this type or a fire in a large water-shed with a small lake might have measurable effects.
Based on work done in the Experimental Lakes Area in Ontario, Canada, Bayley and others (1992) concluded that forest fires would have minimal effect on the quality of any lakes with water renewal times long enough to minimize the effect of a few years of slightly elevated nutrient input. Bayley and others (1992) noted that because Precambrian Shield lakes
are phosphorus limited, the relatively small and short duration (2-3 years) of elevated phosphorus losses from upland water-sheds makes it unlikely that a fire would cause eutrophication of larger lakes. In small streams and lakes with small turnover times, however, eutrophication could occur for several years following a fire. The highest likelihood of eutrophication in lakes would be in watersheds with high proportions of burned wetlands and where these drained to lakes with short residence times, that is, in watersheds where new, higher steady-state nutrient concentrations could be reached in a short time. Increasing ratios of nitrogen:phosphorus might be expected following fire due to prolonged increases in nitrogen, which might cause eutrophication of nitrogen-limited lakes.
Lathrop (1994) found little effect of a wildfire on the chemistry of Yellowstone and Lewis Lakes even though 25 percent of the watersheds were heavily burned. Comparison of prefire (1976-85) and postfire (1989-91) measurements of Secchi depth, conductivity, pH, total dissolved solids, hard-ness, and dissolved calcium, sodium, potassium, chlorine, and sulfate revealed no clear and consistent trend among sampling stations except for a significant decrease in calcium and sulfate concentrations. Lathrop (1994) attributed the apparent lack of response to the wildfire to the large size of the lake. The large volume and long water-residence time (about 10 years) helps to buffer the lake from short-term impacts by diluting increased postfire inputs. The decrease in calcium and sulfate concentrations in the lake following the fire was thought to be due to changes in atmospheric deposition rather than fire-mediated inputs from the upland watersheds. A slight decrease in precipitation-weighted mean concentrations of calcium and sulfate was observed in data from the Yellowstone National Park National Atmospheric Deposition Program, monitoring station (NADP/National Trends Network 1992) during the same time period as the lake study. Lathrop (1994) speculated that smaller lakes with a large burned watershed area to lake-volume ratio might be expected to exhibit a larger sensitivity to fire impact.
Summary of Literature ReviewThis literature review has shown that the magnitude of the
effects of fire on water quality is dependent on how fire char-acteristics (frequency, intensity, duration, and spatial extent of burning) interact with watershed characteristics (weather, slope, soil type, geology, land use, timing of regrowth of vegetation, and burn history). This interaction is complex and highly variable so that even different fires in the same watershed can burn with different characterisitics and produce variable effects on water quality. Despite this variability, the studies reviewed for this paper have reported similar results with respect to the changes in soil chemistry that occur during a fire, the pathways by which nutrients are transferred from burned areas to surface-water bodies, and the temporal and
Summary of Literature Review 19
20 A Summary of the Scientific Literature on the Effects of Fire on the Concentration of Nutrients in Surface Waters
spatial effects of fires on water quality. These results include the following:
1. Ash is the inorganic residue of organic matter that has been completely combusted. It consists mostly of car-bonates and oxides of the alkali and alkaline earth metals, silica, and much smaller amounts of phospho-rus, sulfur, and nitrogen. Few natural fires, however, burn hot enough and long enough for complete com-bustion of organic material. Therefore, the ash that is produced is usually not a white, inorganic ash but has a grey or black color due to the significant amount (30-90 percent by weight) of organic matter it contains, such as charred plant parts.
2. Rain and snowmelt that percolates through ash has a high pH due to the leaching of alkaline compounds, such as calcium carbonate, magnesium oxide, calcium oxide, magnesium hydroxide, and magnesium carbon-ate from the ash.
3. The major source of ammonium to surface water during and immediately following a fire is the dissolu-tion of ammonium volatilized from the combustion of organic matter into precipitation or into a stream or lake. The major source of nitrate immediately follow-ing a fire is the nitrification of ammonium released from the combustion of organic matter. The major source of nitrate in the months to years following a fire is the reduced demand by fewer plants remaining after a fire and the establishment of conditions favorable to nitrification. Postfire conditions favorable to nitrifica-tion include the destruction of organic compounds in the soil, such as terpenoids, that can inhibit nitrifica-tion, an increase in soil pH, and an increase in the concentration of electrolytes in the soil.
4. In the literature reviewed, many of the highest nitrate concentrations in streamwater have been measured during storms in the weeks to months immediately following a fire. Maximum monthly, mean monthly, or monthly volume-weighted mean nitrate concentration and load continue to increase until a peak is reached in the first or second year after the fire during spring snowmelt, followed by a slow decline thereafter. The lag in the peak of average nitrate concentrations fol-lowing a wildfire has been attributed to the time delay in migration of soil water containing nitrate. The slow decline in nitrate concentration following the peak in the second year after a wildfire often has been attrib-uted to nitrate uptake by reemerging vegetation and a decrease in soil pH in the years following a fire.
5. The major source of phosphorus to surface water during and following a wildfire is the dissolution of ash deposited into streams or lakes. Leaching of ash in the soil will mobilize phosphorus, but the literature
indicates that little phosphorus reaches surface-water bodies because of uptake by vegetation and the forma-tion of insoluble phosphorus-containing compounds.
6. In general, elevated concentrations of phosphorus decline 1 to 2 years postfire, whereas the elevated concentrations of nitrogen, particularly nitrate, decline 3 to 5 years postfire.
7. Cations (calcium, magnesium, sodium, and potas-sium), in contrast to nitrogen and phosphorus, are mobilized through a combination of volatilization, ash convection, and leaching of ash and partially burned litter on the forest floor. Dissolution of cations by leaching of ash and partially burned litter on the forest floor is the predominant pathway for cations to enter streams and lakes.
8. Surface waters in unburned watersheds can be sus-ceptible to the effects of fire if wind and rain during and following a fire deposit ash and smoke into the watersheds.
9. Loads of nutrients in streams can increase even if concentrations do not increase due to the increase in streamflow that normally follows a fire. Increased streamflow has been attributed to the formation of a hydrophobic organic layer in the soil surface, which increases the water repellency of soils, and to reduced interception and transpiration after the removal of vegetation.
10. The degree of the effect of fire on surface-water qual-ity is dependent on factors that determine the intensity and severity of a fire (climate, fire history-fire cycle), slope steepness, weather (wind and rainfall patterns) during and immediately following the fire, and the cation exchange capacity of the soil. For lakes and reservoirs, additional factors include trophic status and the residence time of water in the lake or reservoir.
11. Measurable effects of fires on streamwater quality are most likely to occur if the fire was severe enough to burn large amounts of organic matter, if windy conditions were present during the fire, if heavy rain occurred following the fire, and if the fire occurred in a watershed with steep slopes and soils with little cation-exchange capacity.
12. Measurable effects of fires on lake and reservoir water quality are most likely to occur if, in addition to the factors listed in number 11, the lake or reservoir is oligotrophic or mesotrophic, and the residence time of water in the lake or reservoir is short relative to the length of time-elevated inputs of nutrients occur.
20 A Summary of the Scientific Literature on the Effects of Fire on the Concentration of Nutrients in Surface Waters
13. Knowledge of whether a lake or reservoir is nitrogen or phosphorus limited is important because eutrophi-cation of nitrogen-limited lakes may occur following a fire due to increasing nitrogen:phosphorus ratios caused by prolonged increases of nitrogen concentra-tions, especially nitrate.
14. Nitrate composes most of the total nitrogen and soluble reactive phosphorus composes most of the total phosphorus measured in surface waters following a fire.
15. Concentrations of DOC in lakes also have been shown to increase following a fire. In one study, the DOC concentration increased immediately; in another study the increase did not occur until the second year after the fire, and the increase continued in the third year after the fire. The concentration of DOC in sur-face water can increase following a fire because of the high pH of rain and snowmelt that percolates through the ash. At high pH, acidic functional groups in the soil organic carbon are ionized, which renders the soil organic-carbon compounds more water soluble.
16. Growth of algae in response to increased nutrient inputs may be delayed if much erosion of sediment occurs following a fire. Increased levels of turbidity caused by sediment can limit light penetration into a lake or reservoir, thus limiting algal growth. Once the sediment settles out of the water column, algal popula-tions can respond to increased nutrient inputs.
References
Bayley, S.E., Schindler, D.W., Beaty, K.G., Parker, B.R., and Stainton, M.P., 1992, Effects of multiple fires on nutrient yields from streams draining boreal forest and fen water-sheds–nitrogen and phosphorus: Canadian Journal of Fish and Aquatic Sciences, v. 49, p. 584–596.
Belillas, C.M., and Roda, F., 1993, The effects of fire on water quality, dissolved nutrient losses and the export of par-ticulate matter from dry heathland catchments: Journal of Hydrology, v. 150, p. 1–17.
Boerner, R.E.J., 1982, Fire and nutrient cycling in temperate ecosystems: Bioscience, v. 32, no. 3, p. 187–192.
Brass, J.A., Ambrosia, V.G., Riggan, P.J., and Sebesta, P.D., 1996, Consequences of fire on aquatic nitrate and phos-phate dynamics in Yellowstone National Park, in Greenlee, Jason M., ed. The Ecological Implications of Fire in Greater Yellowstone, Proceedings of the Second Biennial Confer-ence on the Greater Yellowstone Ecosystem, Yellowstone National Park, p. 53–57.
Caldwell, T.G., Johnson, D.W., Miller, W.W., and Qualls, R.G., 2002, Forest floor carbon and nitrogen loss due to prescription fire: Soil Science Society of America Journal, v. 66, p. 262–267.
Carignan, Richard, D’Arcy, Pierre, and Lamontagne, Sebas-tien, 2000, Comparative effects of fire and forest harvesting on water quality in Boreal Shield lakes: Canadian Journal of Fish and Aquatic Sciences, v. 57, suppl. 2, p. 105–117.
Chessman, B.C., 1986, Impact of the 1983 wildfires on river water quality in East Gippsland, Victoria: Australian Journal of Marine and Freshwater Resources, v. 37, p. 399–420.
Clayton, J.L, 1976, Nutrient gains to adjacent ecosystems dur-ing a forest fire–an evaluation: Forest Science, v. 22, no. 2, p. 162–166.
Cook, G.D., 1994, The fate of nutrients during fires in a tropi-cal savanna: Australian Journal of Ecology, v. 19, p. 359–365.
Davis, E.A., 1989, Prescribed fire in Arizona Chaparral—effects on stream water quality: Forest Ecology and Man-agement, v. 26, p. 189–206.
Debano, L.F., and Conrad, C.E., 1978, The effect of fire on nutrients in a chaparral ecosystem: Ecology, v. 59, no. 3, p. 489–497.
Debano, L.F., 2000, The role of fire and soil heating on water repellency in wildland environments—a review: Journal of Hydrology v. 231-232, p. 195–206.
Enache, M., and Prairie, Y.T., 2000, Paleolimnoligical recon-struction of forest fire induced changes in lake biogeochem-istry (Lac Francis, Abitibi, Quebec, Canada): Canadian Journal of Fish and Aquatic Sciences, v. 57, suppl. 2, p. 146–154.
Feller, M.C, and Kimmins, J.P., 1984, Effects of clearcutting and slash burning on streamwater chemistry and watershed nutrient budgets in southwestern British Columbia: Water Resources Research, v. 20, no.1, p. 29–40.
Gerla, P.J. and Galloway, J.M., 1998, Water quality of two streams near Yellowstone Park, Wyoming, following the 1988 Clover-Mist wildfire: Environmental Geology, v. 36, p. 127–136.
Gimeno-Garcia, E., Andreu, V., and Rubio, J.L., 2000, Changes in organic matter, nitrogen, phosphorus, and cat-ions as a result of fire and water erosion in a Mediterranean landscape: European Journal of Soil Science, v. 51,p. 201–210.
Gluns, D.R., and Toews, D.A., 1989, Effects of a major wild-fire on water quality in southeastern British Columbia: In Woessner, William W., and Potts, D.F., Proceedings of the Symposium on Headwaters Hydrology, p. 487–499.
References 21

22 A Summary of the Scientific Literature on the Effects of Fire on the Concentration of Nutrients in Surface Waters
Gresswell, R.E., 1999, Fire and aquatic ecosystems in forested biomes of North America: Transactions of the American Fisheries Society, v. 128, p. 193–221.
Grier, C.C., 1975, Wildfire effects on nutrient distribution and leaching in a coniferous ecosystem: Canadian Journal of Fish and Aquatic Sciences, v. 5, p. 599–607.
Johnson, C.M. and Needham, P.R., 1966, Ionic composition of Sagehen Creek, California, following an adjacent fire: Ecology, v. 42, p. 636–639.
Kutiel, P., and Kutiel, H., 1989, The effect of a wildfire on soil nutrients and vegetation in an Aleppo pine forest, on Mount Carmel, Isreal: Pirineos, v. 134, p. 59–74.
Kutiel, P., and Inbar, M., 1993, Fire impacts on soil nutrients and soil erosion in a Mediterranean pine forest plantation: Catena, v. 20, p. 129–139.
Lamontagne, S., Carignan, R., D’Arcy, P., Prairie, Y.T., and Pare, D., 2000, Element export in runoff from eastern Cana-dian Boreal Shield drainage basins following forest harvest-ing and wildfires: Canadian Journal of Fish and Aquatic Sciences, v. 57, Suppl. 2, p. 118–128.
Landsberg, J.D., and Tiedemann, A.R., Fire Management in: Dissmeyer, G.E., ed. Drinking Water from Forests and Grasslands—A synthesis of the Scientific literature. United States Department of Agriculture, Forest Service, Southern Research Station, General Technical Report SRS-39; 2000; p. 124–138.
Lathrop, R.G. Jr., 1994, Impacts of the 1988 wildfires on the water quality of Yellowstone and Lewis Lakes, Wyoming: International Journal of Wildland Fire, v. 4, no. 3, p. 169–175.
Lewis, W.M., 1974, Effects of fire on nutrient movement in a South Carolina pine forest: Ecology, v. 55, p. 1120–1127.
MacKay, S.M., and Robinson, G., 1987, Effects of wildfire and logging on streamwater chemistry and cation exports of small forested catchments in southeastern New South Wales, Australia: Hydrological Processes, v. 1, p. 359–384.
McColl, J.G., and Grigal, D.F., 1975, Forest fire—effects on phosphorus movement to lakes: Science, v. 188, no. 4193, p. 1109–1111.
McEachern, P., Prepas, E.E., Gibson, J.J., and Dinsmore, W.P., 2000, Forest fire induced impacts on phosphorus, nitrogen, and chlorophyll a concentrations in boreal subarctic lakes of northern Alberta: Canadian Journal of Fish and Aquatic Sciences, v. 57, Suppl. 2, p. 73–81.
Minshall, G.W., Robinson, C.T., and Lawrence, D.E., 1997, Postfire responses of lotic ecosystems in Yellowstone National Park, U.S.A.: Canadian Journal of Fish and Aquatic Sciences, v. 54, p. 2509–2525.
Overby, S.T., and Perry, H.M., 1996, Direct effects of pre-scribed fire on available nitrogen and phosphorus in an Ari-zona Chaparral watershed: Arid Soil Research and Rehabili-ation, v. 10, p. 347–357.
Raison, R.J., and McGarity, J.W., 1980, Some effects of plant ash on the chemical properties of soils and aqueous suspen-sions: Plant and Soil, v. 55, p. 339–352.
Raison, R.J., Khanna, P.K., and Woods, P.V., 1985a, Mecha-nisms of element transfer to the atmosphere during vegeta-tion fires: Canadian Journal of Forest Research, v. 15, p. 132–140.
Raison, R.J., Keith, H., and Kanna, P.K., 1990, Effects of fire on the nutrient-supplying capacity of forest soils, in: W.J. Dyck and C.A. Mees, Ed., Impact of intensive harvesting on forest site productivity: Proceedings, IEA/BE A3 Work-shop, South Island, New Zealand, March 1989, IEA/BE T6/A6 Report No. 2. Forest Research Institute, Rotorua, New Zealand, FRI Bulletin no. 159. p. 39–54.
Richter, D.D., Ralston, C.W., and Harms, W.R., 1982, Pre-scribed fire—effects on water quality and forest nutrient cycling: Science, v. 215, no. 5, p. 661–663.
Soto, B., and Diaz-Fierros, F., 1993, Interactions between plant ash leachates and soil: International Journal of Wild-land Fire, v. 3, no. 4, p. 207–216.
Spencer, C.N., and Hauer, F.R., 1991, Phosphorus and nitro-gen dynamics in streams during a wildfire: Journal of the North American Benthological Society, v. 10, no. 1, p. 24–30.
Taylor, M.J., Shay, J.M., and Hamlin, S.N., 1993, Changes in water-quality conditions in Lexington Reservoir, Santa Clara County, California, following a large fire in 1985 and flood in 1986: U.S. Geological Survey Water-Resources Investigations Report 92–4172, 23 p.
Tiedemann, A.R., Helvey, J.D., and Anderson, T.D., 1978, Stream chemistry and watershed nutrient economy follow-ing wildfire and fertilization in eastern Washington: Journal of Environmental Quality, v. 7, no. 4, p. 580–588.
Tiedemann, A.R., Conrad, C.E., Dieterich, J.H., Hornbeck, J.W., Megahan, W.F., Viereck, L.A., and Wade, D.D., Effects of fire on water—a state-of-knowledge review: Washington, D.C.: U.S. Department of Agriculture Forest Service, General Technical Report WO-10, 1979, 28 pages.
Townsend, S.A., and Douglas, M.M., 2000, The effect of three fire regimes on stream water quality, water yield and export coefficients in a tropical savanna (northern Australia): Jour-nal of Hydrology, v. 229, p. 118–137.
Ulery, A.L., Graham, R.C., and Amrhein, C., 1993, Woodash composition and soil pH following intense burning: Soil Science, v. 156, no. 5, p. 358–364.
22 A Summary of the Scientific Literature on the Effects of Fire on the Concentration of Nutrients in Surface Waters
van Wyk, D.B., Lesch, W., and Stock, W.D., 1992, Fire and catchment chemical budgets: Ecological Synthesis—Analy-sis and Synthesis, Springer-Verlag, v. 93, p. 240–257.
Williams, M.R. and Melack, J.M., 1997, Effects of prescribed burning and drought on the solute chemistry of mixed-coni-fer forest streams of the Sierra Nevada, California: Biogeo-chemistry, v. 39, p. 225–253.
Abbreviations used in this paper include N (nitrogen), TN (total nitrogen), TDN (total dissolved nitrogen), P (phospho-rus), SRP (soluble reactive phosphorus), TP (total phospho-rus), TDP (total dissolved phosphorus), and DOC (dissolved organic carbon).
References 23