a survey of emerging trend detection in textual data - citeseer
TRANSCRIPT
This is page �Printer� Opaque this
�
A Survey of Emerging TrendDetection in Textual DataMining
April KontostathisLeon M� GalitskyWilliam M� PottengerSoma RoyDaniel J� Phelps
Abstract
In this chapter we describe several systems that detect emerg�ing trends in textual data� Some of the systems are semi�automatic�requiring user input to begin processing� others are fully�automatic�producing output from the input corpus without guidance� For eachEmerging Trend Detection �ETD� system we describe componentsincluding linguistic and statistical features� learning algorithms�training and test set generation� visualization and evaluation� Wealso provide a brief overview of several commercial products withcapabilities for detecting trends in textual data� followed by an in�dustrial viewpoint describing the importance of trend detection tools�and an overview of how such tools are used�
This review of the literature indicates that much progress hasbeen made toward automating the process of detecting emergingtrends� but there is room for improvement� All of the projects wereviewed rely on a human domain expert to separate the emergingtrends from noise in the system� Furthermore� we discovered that fewprojects have used formal evaluation methodologies to determine thee�ectiveness of the systems being created� Development and use ofe�ective metrics for evaluation of ETD systems is critical�
Work continues on the semi�automatic and fully�automatic sys�tems we are developing at Lehigh University �HDD�� In addition toadding formal evaluation components to our systems� we are also re�searching methods for automatically developing training sets and for
� Kontostathis et al�
merging machine learning and visualization to develop more e�ectiveETD applications�
��� INTRODUCTION
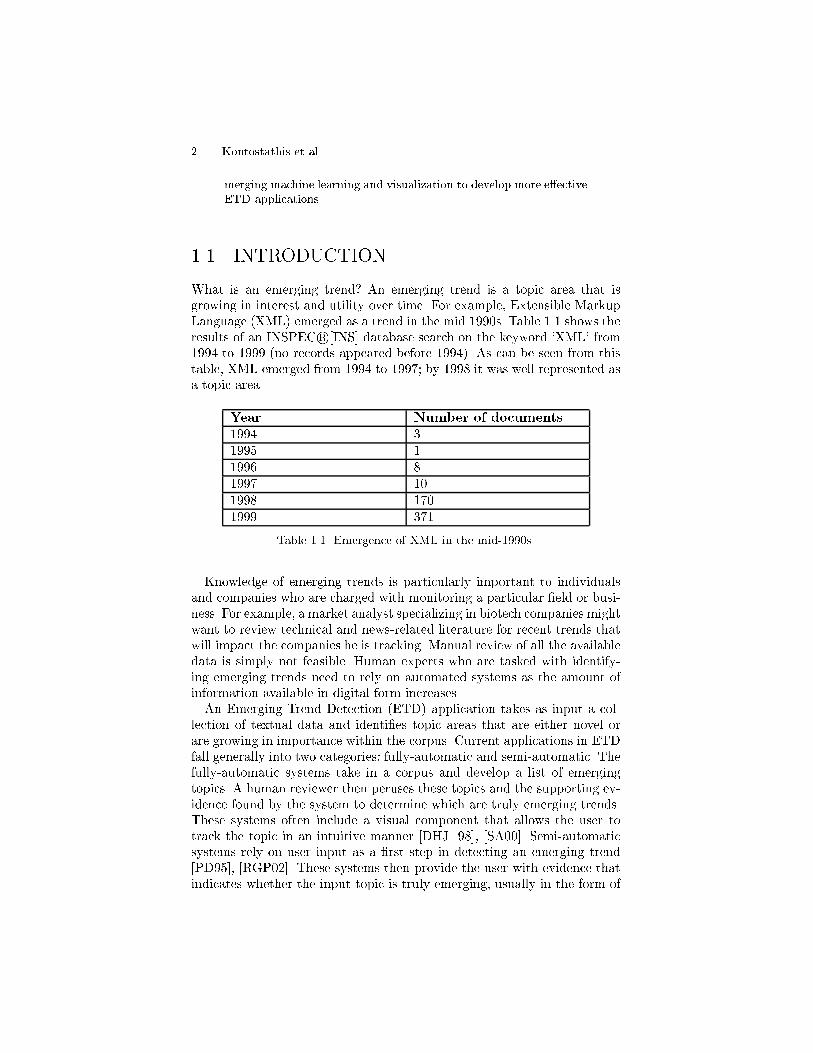
What is an emerging trend� An emerging trend is a topic area that isgrowing in interest and utility over time� For example� Extensible MarkupLanguage �XML� emerged as a trend in the mid ����s� Table ��� shows theresults of an INSPEC r�INS database search on the keyword �XML� from��� to ���� �no records appeared before ��� �� As can be seen from thistable� XML emerged from ��� to ����� by ���� it was well represented asa topic area�
Year Number of documents
��� ����� �
���� �
���� ��
���� ���
���� ���
Table �� Emergence of XML in the mid��s�
Knowledge of emerging trends is particularly important to individualsand companies who are charged with monitoring a particular �eld or busi�ness� For example� a market analyst specializing in biotech companies mightwant to review technical and news�related literature for recent trends thatwill impact the companies he is tracking� Manual review of all the availabledata is simply not feasible� Human experts who are tasked with identify�ing emerging trends need to rely on automated systems as the amount ofinformation available in digital form increases�An Emerging Trend Detection �ETD� application takes as input a col�
lection of textual data and identi�es topic areas that are either novel orare growing in importance within the corpus� Current applications in ETDfall generally into two categories� fully�automatic and semi�automatic� Thefully�automatic systems take in a corpus and develop a list of emergingtopics� A human reviewer then peruses these topics and the supporting ev�idence found by the system to determine which are truly emerging trends�These systems often include a visual component that allows the user totrack the topic in an intuitive manner DHJ���� SA��� Semi�automaticsystems rely on user input as a �rst step in detecting an emerging trendPD��� RGP��� These systems then provide the user with evidence thatindicates whether the input topic is truly emerging� usually in the form of
� A Survey of Emerging Trend Detection in Textual Data Mining �
user�friendly reports and screens that summarize the evidence available onthe topic�We begin with a detailed description of several semi�automatic and fully�
automatic ETD systems in Section ���� We discuss the components ofan ETD system including linguistic and statistical features� learning al�gorithms� training and test set generation� visualization and evaluation�In Section ��� we review the ETD capabilities in commercial products�Our conclusions are presented in Section �� � In Section ���� Dr� DanielJ� Phelps� Leader of Eastman Kodak�s Information Mining Group� de�scribes the role of ETD systems in modern corporate decision�makingenvironments�
��� ETD SYSTEMS
As mentioned above� ETD systems can be classi�ed as either fully�automatic or semi�automatic� Semi�automatic systems require user input asa �rst step in detecting the emerging trends in a topic area� As part of ourongoing research at Lehigh University� we have developed both fully� andsemi�automatic systems that have successfully identi�ed emerging trends�In this section we provide an overview of the components that are includedin most ETD systems �input data sets� attributes used for processing� learn�ing algorithms� visualization� evaluation�� followed by a detailed descriptionof several ETD systems�We begin with a discussion on the data that is used in ETD systems�
The most commonly used data repository for ETD emerged from the TopicDetection and Tracking �TDT� project TDT that began in ����� TDT re�search develops algorithms for discovering and threading together topicallyrelated material in streams of data� such as newswire and broadcast news�in both English and Mandarin Chinese� The TDT project� while not di�rectly focused on emerging trend detection� has nonetheless encouraged thedevelopment of various fully�automated systems that track topic changesthrough time� Several of those algorithms will be described in this section�As part of the TDT initiative several data sets have been created�
The TDT data sets are sets of news stories and event descriptors� Eachstory�event pair is assigned a relevance judgment� A relevance judgment isan indicator of the relevance of the given story to an event� Table ���portrays several examples of the relevance judgment assignment to astory�event pair� Thus� the TDT data sets can be used as both trainingand test sets for ETD algorithms� The Linguistic Data Consortium �LDC�Lin currently has three TDT corpora available for system development�the TDT Pilot study �TDT�Pilot�� the TDT Phase � �TDT��� the TDTPhase � �TDT��� as well as the TDT� Arabic supplement�

Kontostathis et al�
Story Description Event Relevance
Judgment
Story describes sur�vivor�s reaction afterOklahoma City Bombing
Oklahoma CityBombing
Yes
Story describes sur�vivor�s reaction afterOklahoma City Bombing
US TerrorismResponse
No
Story describes FBI�sincreased use of surveil�lance in governmentbuildings as a resultof the Oklahoma CityBombing
Oklahoma CityBombing
Yes
Story describes FBI�sincreased use of surveil�lance in governmentbuildings as a resultof the Oklahoma CityBombing
US TerrorismResponse
Yes
Table ��� Story�event pairs�
Not all of the systems we describe rely on the TDT data sets� Otherapproaches to creation of test data have been used� such as manually as�signing relevance judgments to the input data and comparing the systemresults to the results produced by a human reviewer� This approach is te�dious and necessarily limits the size of the data set� Some of the systems wepresent use databases such as INSPECr�� which contains engineering ab�stracts� or the United States patent database US � which allows searchingof all published US patents� The input data set� along with the selectionof appropriate attributes that describe the input� is a critical componentof an ETD system� Attribute selection is at the core of the tracking pro�cess� since it is the attributes that describe each input item and ultimatelydetermine the trends�The attributes obtained from the corpus data are input to the meth�
ods�techniques employed by each ETD system we describe below� As willbecome apparent� some research groups use traditional Information Re�trieval �IR� methodologies to detect emerging trends� while others havefocused more on traditional machine learning approaches such as thoseused in data mining applications�Work in the areas of visualization�supported trend detection has explored
multiple techniques for identifying topics� When a user is trying to under�stand a large amount of data� a system that allows an overview� at multiple
� A Survey of Emerging Trend Detection in Textual Data Mining �
levels of detail and from multiple perspectives� is particularly helpful� Oneof the simplest approaches is a histogram� where bars indicate discrete val�ues of actual data at some discrete point in time� Information visualizationis meant to complement machine learning approaches for trend detection�Plotting the patterns along a timeline allows one to see the rate of changeof a pattern over time� For each algorithm described below� we will dis�cuss the visualization component� showing how the component enhancesthe trend detection capabilities of the system�The evaluation of an emerging trend detection system can be based on
formal metrics� such as precision �the percentage of selected items thatthe system got right� and recall �the proportion of the target items thatthe system found�� or by less formal� subjective means �e�g�� answers tousability questions such as� Is the visualization understandable��� The par�ticulars of an evaluation are related to the goals of the method and thuscan vary greatly� but some justi�cation and interpretation of the resultsshould always exist to validate a given system�
����� Technology Opportunities Analysis �TOA�
Alan L� Porter and Michael J� Detampel describe a semi�automatictrend detection system for technology opportunities analysis in PD���The �rst step of the process is the extraction of documents �such asINSPEC r�abstracts� from the knowledge area to be studied� The extrac�tion process requires the development of a list of potential keywords by adomain expert� These keywords are then combined into queries using appro�priate Boolean operators to generate comprehensive and accurate searches�The target databases are also identi�ed in this phase �e�g�� INSPEC r��COMPENDEX r�COM� US Patents� etc���The queries are then input to the Technology Opportunities Analysis
Knowbot �TOAK�� a custom software package also referred to as TOAS�Technology Opportunities Analysis System�� TOAK extracts the relevantdocuments �abstracts� and provides bibliometric analysis of the data� Bib�liometrics uses information such as word counts� date information� wordco�occurrence information� citation information and publication informa�tion to track activity in a subject area� TOAK facilitates the analysis of thedata available within the documents� For example� lists of frequently occur�ring keywords can be quickly generated� as can lists of author a�liations�countries� or states�In PD��� the authors present an example of how the TOAK system can
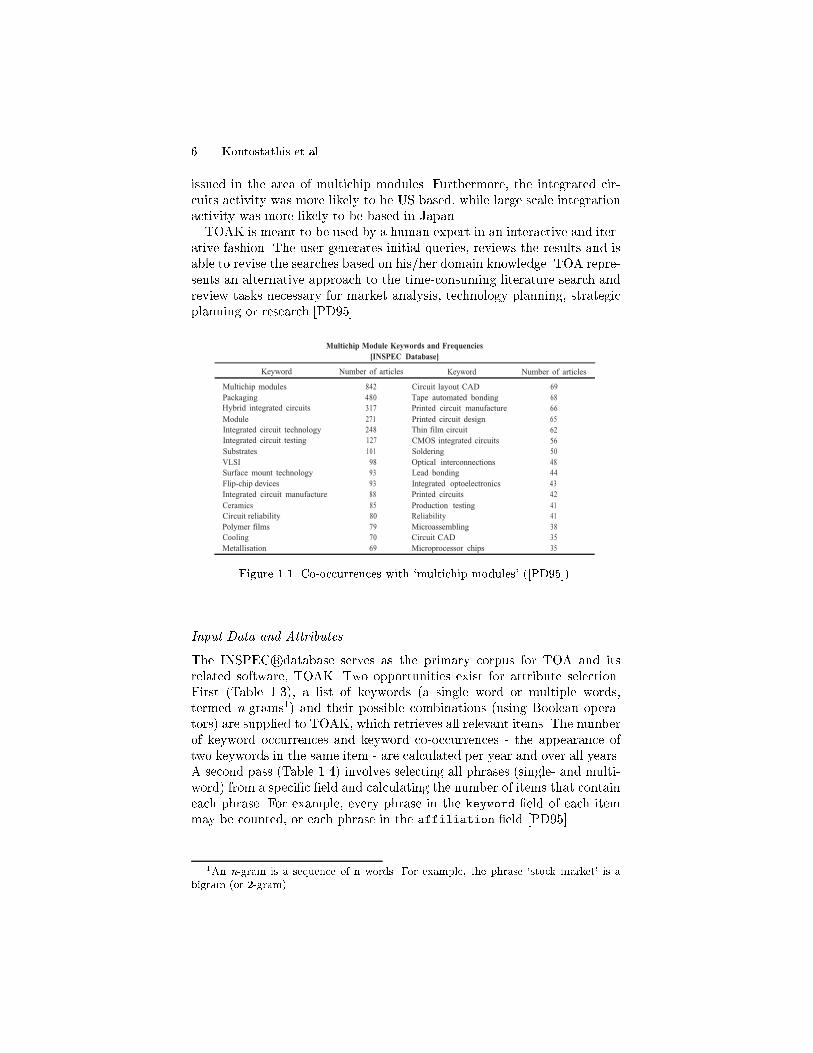
be used to track trends in the multichip module sub �eld of electronic man�ufacturing and assembly� Figure ��� �PD��� shows a list of keywords thatappear frequently with �multichip module� in the INSPEC r�database� Theauthors observed that multichip modules and integrated circuits �particu�larly hybrid integrated circuits� co�occurred very frequently� An additionalsearch using the US Patent database showed that many patents had been
� Kontostathis et al�
issued in the area of multichip modules� Furthermore� the integrated cir�cuits activity was more likely to be US based� while large scale integrationactivity was more likely to be based in Japan�TOAK is meant to be used by a human expert in an interactive and iter�
ative fashion� The user generates initial queries� reviews the results and isable to revise the searches based on his�her domain knowledge� TOA repre�sents an alternative approach to the time�consuming literature search andreview tasks necessary for market analysis� technology planning� strategicplanning or research PD���
Keyword
Multichip Module Keywords and Frequencies[INSPEC Database]
Number of articles Keyword Number of articles
Multichip modules 842Packaging 480Hybrid integrated circuits 317Module 271Integrated circuit technology 248Integrated circuit testing 127Substrates 101VLSI 98Surface mount technology 93Flip-chip devices 93Integrated circuit manufacture 88Ceramics 85Circuit reliability 80Polymer films 79Cooling 70Metallisation 69
Circuit layout CAD 69Tape automated bonding 68Printed circuit manufacture 66Printed circuit design 65Thin film circuit 62CMOS integrated circuits 56Soldering 50Optical interconnections 48Lead bonding 44Integrated optoelectronics 43Printed circuits 42Production testing 41Reliability 41Microassembling 38Circuit CAD 35Microprocessor chips 35
Figure �� Co�occurrences with �multichip modules� ��PD����
Input Data and Attributes
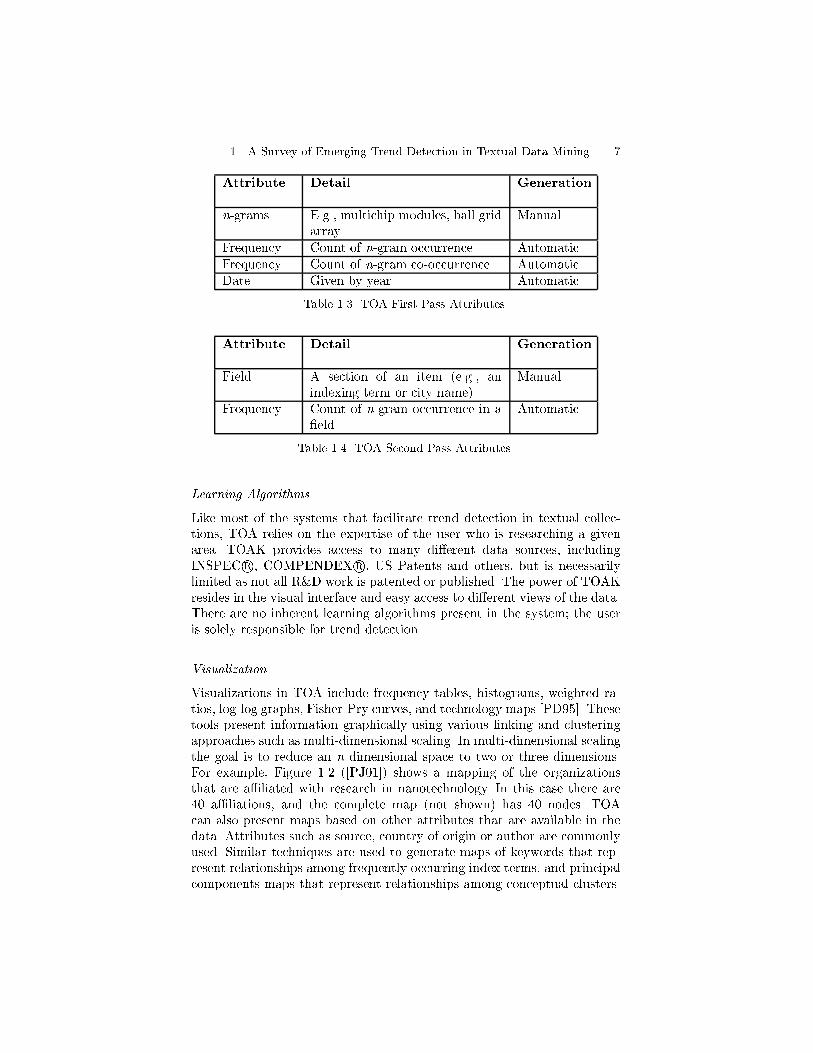
The INSPEC r�database serves as the primary corpus for TOA and itsrelated software� TOAK� Two opportunities exist for attribute selection�First �Table ����� a list of keywords �a single word or multiple words�termed n�grams�� and their possible combinations �using Boolean opera�tors� are supplied to TOAK� which retrieves all relevant items� The numberof keyword occurrences and keyword co�occurrences � the appearance oftwo keywords in the same item � are calculated per year and over all years�A second pass �Table �� � involves selecting all phrases �single� and multi�word� from a speci�c �eld and calculating the number of items that containeach phrase� For example� every phrase in the keyword �eld of each itemmay be counted� or each phrase in the affiliation �eld PD���
�An n�gram is a sequence of n words� For example� the phrase �stock market� is abigram �or ��gram��
� A Survey of Emerging Trend Detection in Textual Data Mining �
Attribute Detail Generation
n�grams E�g�� multichip modules� ball gridarray
Manual
Frequency Count of n�gram occurrence Automatic
Frequency Count of n�gram co�occurrence AutomaticDate Given by year Automatic
Table ��� TOA First Pass Attributes�
Attribute Detail Generation
Field A section of an item �e�g�� anindexing term or city name�
Manual
Frequency Count of n�gram occurrence in a�eld
Automatic
Table � � TOA Second Pass Attributes�
Learning Algorithms
Like most of the systems that facilitate trend detection in textual collec�tions� TOA relies on the expertise of the user who is researching a givenarea� TOAK provides access to many di�erent data sources� includingINSPEC r�� COMPENDEX r�� US Patents and others� but is necessarilylimited as not all R�D work is patented or published� The power of TOAKresides in the visual interface and easy access to di�erent views of the data�There are no inherent learning algorithms present in the system� the useris solely responsible for trend detection�
Visualization
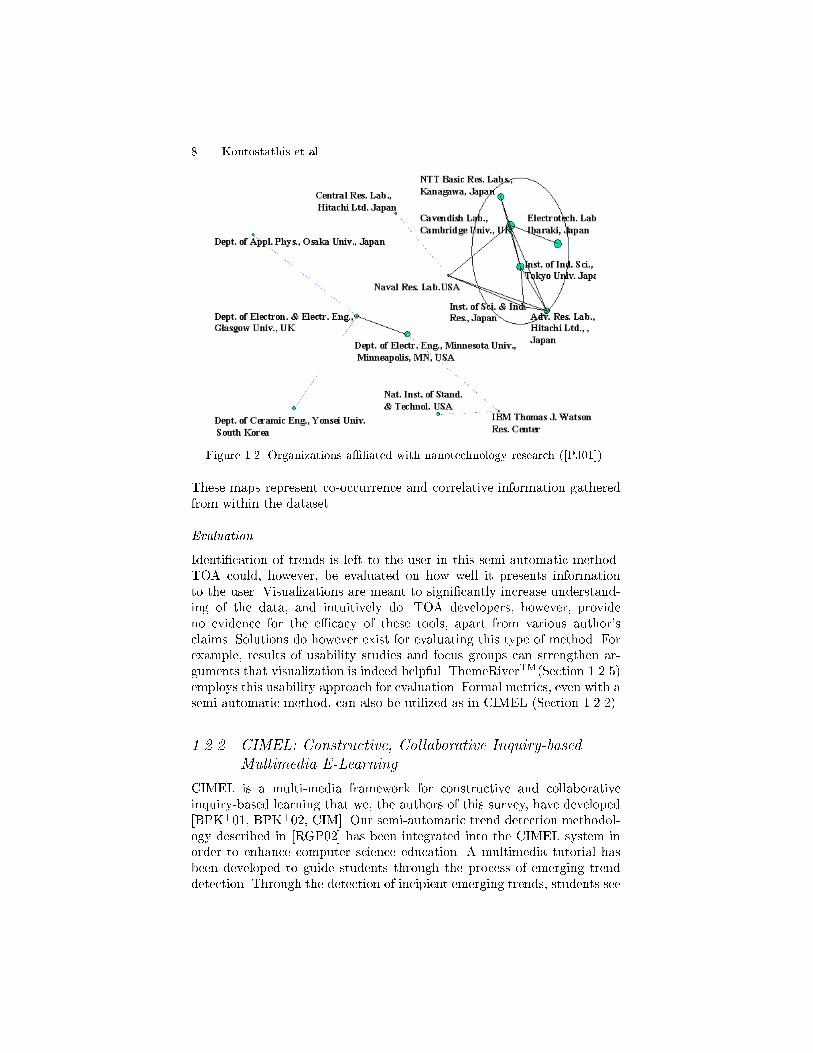
Visualizations in TOA include frequency tables� histograms� weighted ra�tios� log�log graphs� Fisher�Pry curves� and technology maps PD��� Thesetools present information graphically using various linking and clusteringapproaches such as multi�dimensional scaling� In multi�dimensional scalingthe goal is to reduce an n dimensional space to two or three dimensions�For example� Figure ��� �PJ��� shows a mapping of the organizationsthat are a�liated with research in nanotechnology� In this case there are � a�liations� and the complete map �not shown� has � nodes� TOAcan also present maps based on other attributes that are available in thedata� Attributes such as source� country of origin or author are commonlyused� Similar techniques are used to generate maps of keywords that rep�resent relationships among frequently occurring index terms� and principalcomponents maps that represent relationships among conceptual clusters�
� Kontostathis et al�
Figure ��� Organizations a�liated with nanotechnology research ��PJ����
These maps represent co�occurrence and correlative information gatheredfrom within the dataset�
Evaluation
Identi�cation of trends is left to the user in this semi�automatic method�TOA could� however� be evaluated on how well it presents informationto the user� Visualizations are meant to signi�cantly increase understand�ing of the data� and intuitively do� TOA developers� however� provideno evidence for the e�cacy of these tools� apart from various author�sclaims� Solutions do however exist for evaluating this type of method� Forexample� results of usability studies and focus groups can strengthen ar�guments that visualization is indeed helpful� ThemeRiverTM�Section ������employs this usability approach for evaluation� Formal metrics� even with asemi�automatic method� can also be utilized as in CIMEL �Section �������
����� CIMEL� Constructive� Collaborative Inquiry�basedMultimedia E�Learning
CIMEL is a multi�media framework for constructive and collaborativeinquiry�based learning that we� the authors of this survey� have developedBPK���� BPK���� CIM� Our semi�automatic trend detection methodol�ogy described in RGP�� has been integrated into the CIMEL system inorder to enhance computer science education� A multimedia tutorial hasbeen developed to guide students through the process of emerging trenddetection� Through the detection of incipient emerging trends� students see
� A Survey of Emerging Trend Detection in Textual Data Mining
the role that current topics play in course�related research areas� Earlystudies of this methodology� using students in an upper�level computer sci�ence course� show that use of the methodology improves the number ofincipient emerging trends identi�ed�Our semi�automatic algorithm employs a more robust methodology than
TOA because the user base is assumed to be individuals who are learning aparticular area� as opposed to domain experts� The methodology relies onweb resources to identify candidate emerging trends� Classroom knowledge�along with automated �assistants�� help students to evaluate the identi�edcandidate trends� This methodology is particularly focused on incipienttrends�
�� Identify a main topic area for research �e�g�� Objectdatabases��� Identify recent conferences and workshops in this area�e�g�� OOPSLA for Object Oriented Programming
�� Review content and create a list of candidate emergingtrends
� Evaluate each emerging trend identi�ed in step �� usinggeneral web research tools �e�g�� GoogleTMsearch�
�� For each candidate emerging trend remaining after step � verify the trend using an INSPEC r�database search
Table ��� Methodology for detecting emerging trends�
The methodology is outlined in Table ���� In step two of this methodology�after a main topic area has been identi�ed� the user is directed to recentconferences and workshops online and instructed to review the content anddevelop a list of candidate emerging trends� Next� the user is directed toa general�purpose web search engine to �nd other references to candidateemerging trends identi�ed in step three� Searches using the candidate trendphrase� along with terms such as �recent research�� �approach�� etc�� areemployed to improve the precision of the search results� The user is providedwith a detailed algorithm that includes parameters for evaluation of thepages returned from the search engine� The candidate emerging trend maybe rejected as a result of this search� In addition� other candidate emergingtrends may be identi�ed in this step�Finally� the user is asked to verify candidate emerging trends using
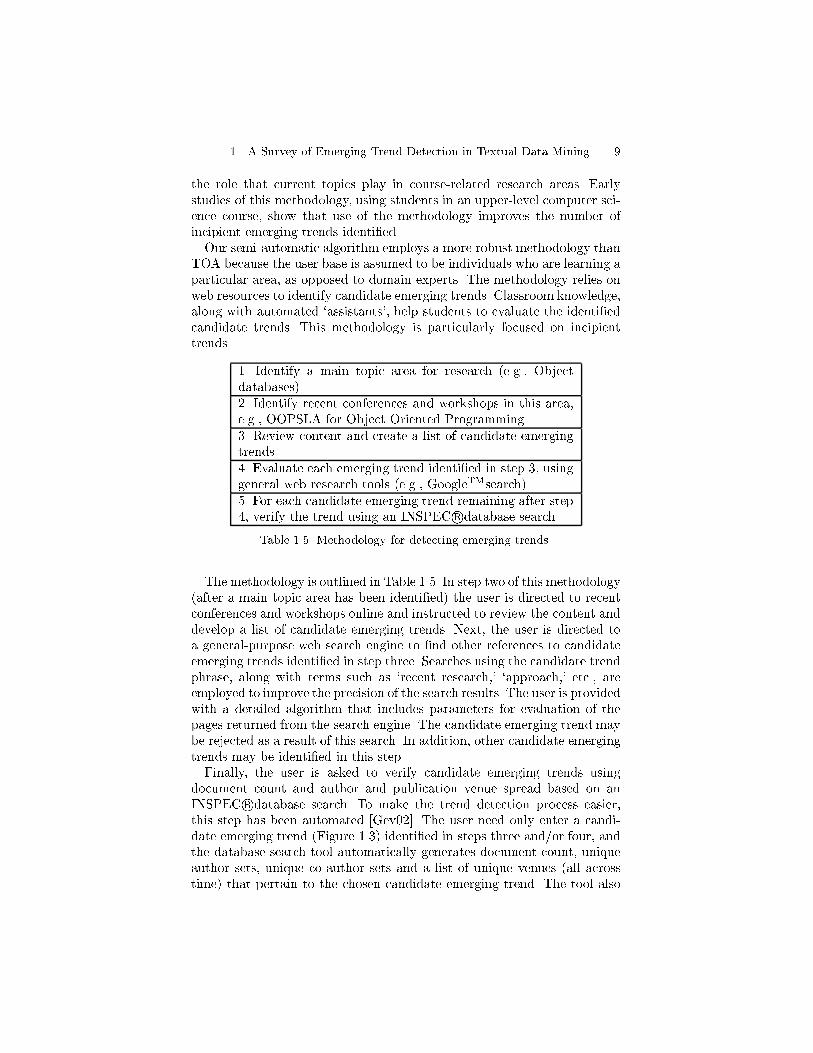
document count and author and publication venue spread based on anINSPEC r�database search� To make the trend detection process easier�this step has been automated Gev��� The user need only enter a candi�date emerging trend �Figure ���� identi�ed in steps three and�or four� andthe database search tool automatically generates document count� uniqueauthor sets� unique co�author sets and a list of unique venues �all acrosstime� that pertain to the chosen candidate emerging trend� The tool also

� Kontostathis et al�
Figure ��� Emerging Trend Detection Tutorial ��CIM���
provides a link to the corresponding abstracts� which can be accessed byclicking on individual document titles� This feature of the tool is impor�tant� as the user still has to decide whether a given candidate trend is trulyemerging based on heuristics provided in the tutorial�For example� students in an upper�level Object Oriented Software En�
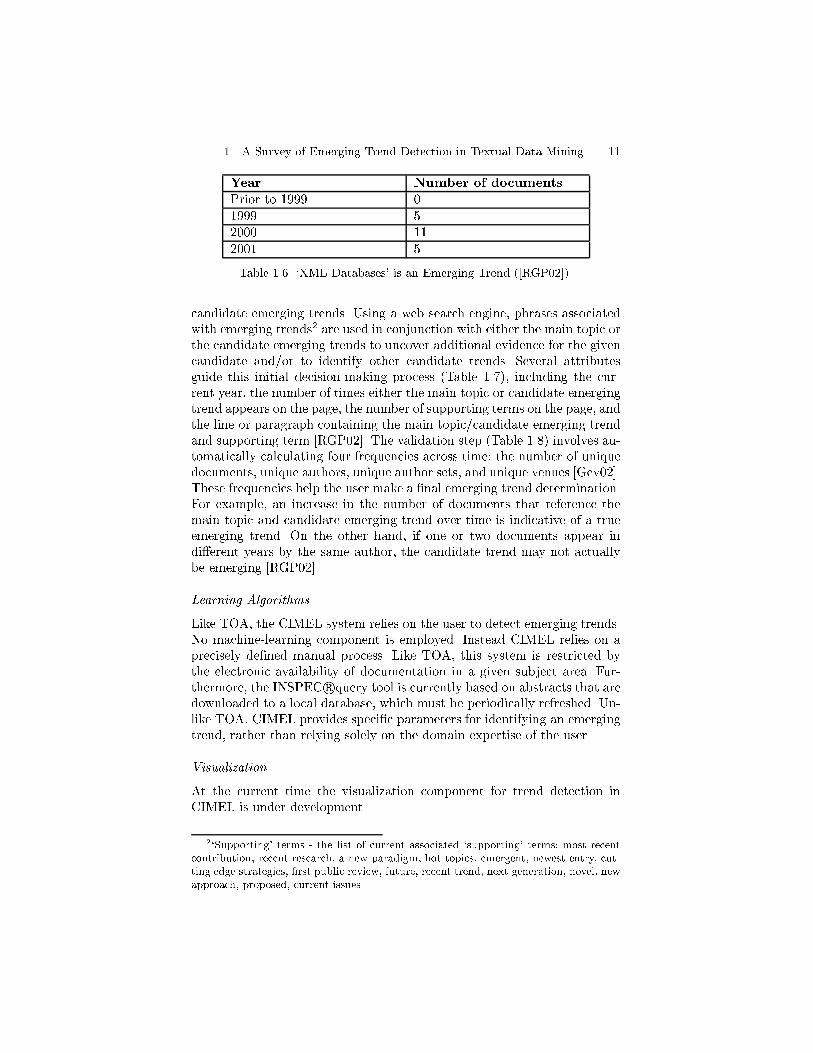
gineering course might be asked to �nd an emerging trend in the �eld ofObject Databases� Several conference web sites would be provided� includ�ing the Conference on Object�Oriented Programming� Systems� Languages�and Applications �OOPSLA� website� A manual review of the content of pa�pers presented at OOPSLA ��� leads the student to the candidate emergingtrend �XML Databases�� A search of the web using GoogleTMresults in ad�ditional papers related to XML databases� providing further evidence that�XML Databases� is an emerging trend� Finally� the student is directed tothe INSPEC r�database� A search using XML �and� Databases �and�Object�oriented reveals the information depicted in Table ���� Further in�spection reveals multiple author sets and publication venues� con�rmingthat �XML Databases� is an incipient emerging trend in the �eld of ObjectDatabases�
Input Data and Attributes
The corpus for this semi�automatic methodology can be any web resource�A description of the main topic is chosen� which can consist of any text� Aninitial search of recent conferences and workshops is performed to identify
� A Survey of Emerging Trend Detection in Textual Data Mining
Year Number of documents
Prior to ���� �
���� ����� ��
���� �
Table ��� �XML Databases� is an Emerging Trend ��RGP�����
candidate emerging trends� Using a web search engine� phrases associatedwith emerging trends� are used in conjunction with either the main topic orthe candidate emerging trends to uncover additional evidence for the givencandidate and�or to identify other candidate trends� Several attributesguide this initial decision�making process �Table ����� including the cur�rent year� the number of times either the main topic or candidate emergingtrend appears on the page� the number of supporting terms on the page� andthe line or paragraph containing the main topic�candidate emerging trendand supporting term RGP��� The validation step �Table ���� involves au�tomatically calculating four frequencies across time� the number of uniquedocuments� unique authors� unique author sets� and unique venues Gev���These frequencies help the user make a �nal emerging trend determination�For example� an increase in the number of documents that reference themain topic and candidate emerging trend over time is indicative of a trueemerging trend� On the other hand� if one or two documents appear indi�erent years by the same author� the candidate trend may not actuallybe emerging RGP���
Learning Algorithms
Like TOA� the CIMEL system relies on the user to detect emerging trends�No machine�learning component is employed� Instead CIMEL relies on aprecisely de�ned manual process� Like TOA� this system is restricted bythe electronic availability of documentation in a given subject area� Fur�thermore� the INSPEC r�query tool is currently based on abstracts that aredownloaded to a local database� which must be periodically refreshed� Un�like TOA� CIMEL provides speci�c parameters for identifying an emergingtrend� rather than relying solely on the domain expertise of the user�
Visualization
At the current time the visualization component for trend detection inCIMEL is under development�
��Supporting� terms � the list of current associated �supporting� terms� most recentcontribution� recent research� a new paradigm� hot topics� emergent� newest entry� cut�ting edge strategies� rst public review� future� recent trend� next generation� novel� newapproach� proposed� current issues�

� Kontostathis et al�
Attribute Detail Generation
n�grams Main topic� e�g�� �objectdatabases�
Manual
n�grams Candidate trend� e�g�� �XMLDatabases�
Manual
n�grams Supporting terms Automaticn�grams Search item � any Boolean
�and� combination of theprevious attributes� e�g�� �XML�and� novel�
Automatic
Date Given by year Automatic
Frequency Count of main topic�candidatetrend in page
Automatic
Frequency Count of �supporting� terms Automatic
n�grams Line or paragraph containing themain topic�candidate trend and�supporting� term in a givendocument
Manual
Table ��� CIMEL Initial Step Attributes�
Attribute Detail Generation
Frequency Count of unique authors� per year Automatic
Frequency Count of unique documents� peryear
Automatic
Frequency Count of unique author sets� peryear
Automatic
Frequency Count of unique venues� per year Automatic
Table ��� CIMEL Validation Step Attributes�
Evaluation
Several experiments have been conducted to evaluate the utility of the ETDcomponent of the CIMEL system� In one such experiment� two groups ofstudents in a Programming Languages class were asked to identify emerg�ing trends in the area of Inheritance in Object Oriented Programming�Group B �experimental� viewed a multimedia tutorial on the methodol�ogy that included a case study� Group A �control� did not� Hypothesistesting was performed using the standard metric of precision� Precisionfor a student was calculated by dividing the number of actual emergingtrends found �zero� one or two for this experiment� by the number of total
� A Survey of Emerging Trend Detection in Textual Data Mining �
trends found �two� if the student completed the assignment successfully��Recall was not determined since a complete list of emerging trends wasnot available� A lower tail t�test concluded with ��� con�dence that themean precision of students that used the methodology �Group B� was sig�ni�cantly greater than the mean precision of students that did not use themethodology �Group A�� These results provide convincing evidence that theETD methodology employed in the CIMEL system is e�ective at detectingemerging trends Roy���
����� TimeMines
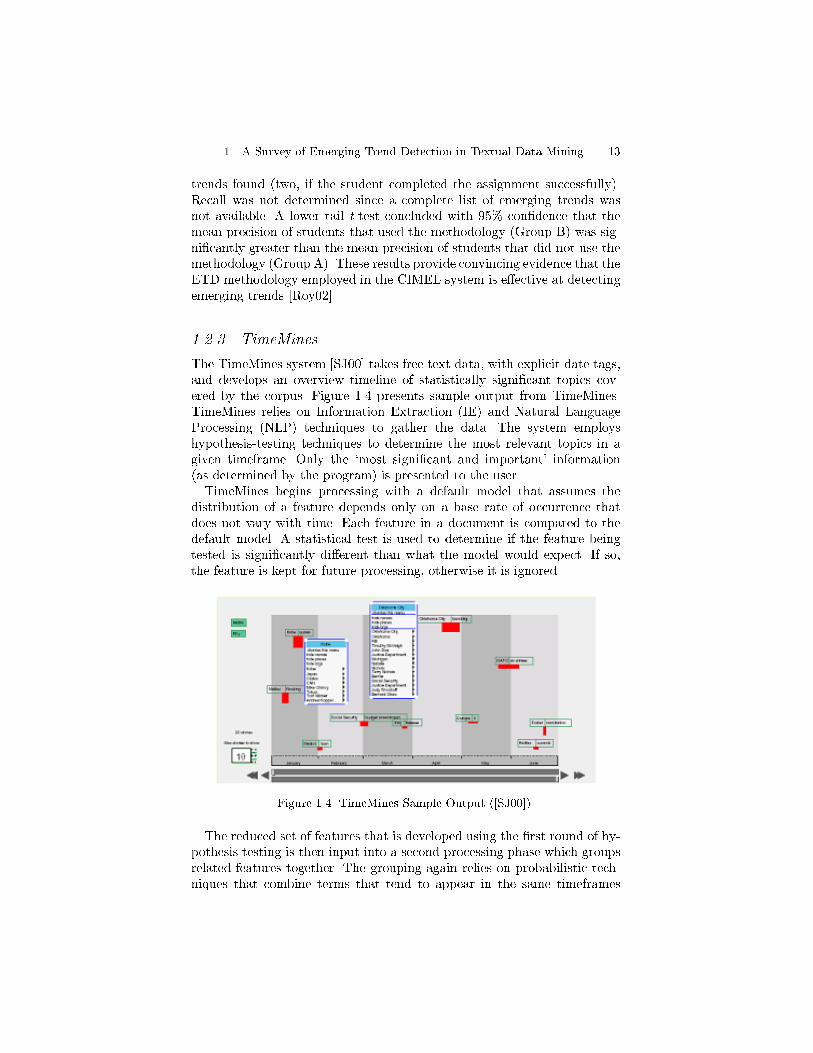
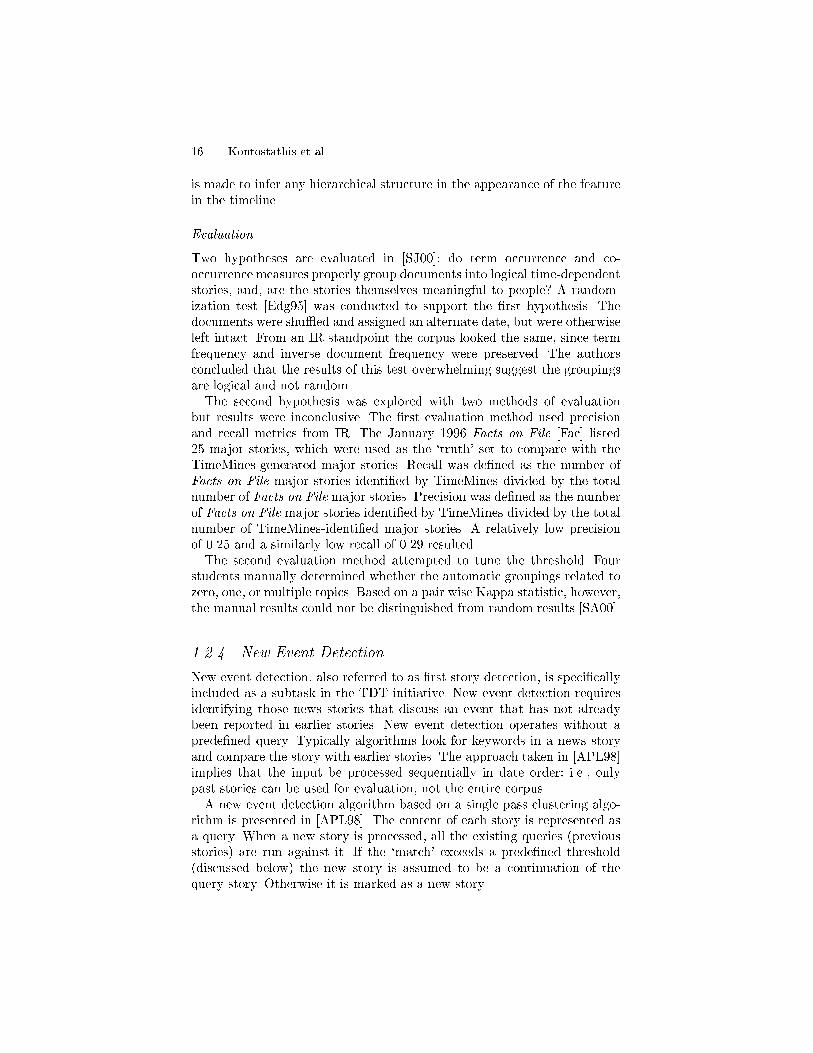
The TimeMines system SJ�� takes free text data� with explicit date tags�and develops an overview timeline of statistically signi�cant topics cov�ered by the corpus� Figure �� presents sample output from TimeMines�TimeMines relies on Information Extraction �IE� and Natural LanguageProcessing �NLP� techniques to gather the data� The system employshypothesis�testing techniques to determine the most relevant topics in agiven timeframe� Only the �most signi�cant and important� information�as determined by the program� is presented to the user�TimeMines begins processing with a default model that assumes the
distribution of a feature depends only on a base rate of occurrence thatdoes not vary with time� Each feature in a document is compared to thedefault model� A statistical test is used to determine if the feature beingtested is signi�cantly di�erent than what the model would expect� If so�the feature is kept for future processing� otherwise it is ignored�
Figure � � TimeMines Sample Output ��SJ�����
The reduced set of features that is developed using the �rst round of hy�pothesis testing is then input into a second processing phase which groupsrelated features together� The grouping again relies on probabilistic tech�niques that combine terms that tend to appear in the same timeframes
Kontostathis et al�
into a single topic� Finally� a threshold is used to determine which top�ics are most important and these are displayed via the timeline interface�Figure �� �� The threshold is set manually� and is determined empirically�Like TOA� TimeMines presents a model of the data without drawing any
speci�c conclusions about whether or not a topic is emergent� It simplypresents the most statistically signi�cant topics to the user� and relies onthe user�s domain knowledge for evaluation of the topics�
Input Data and Attributes
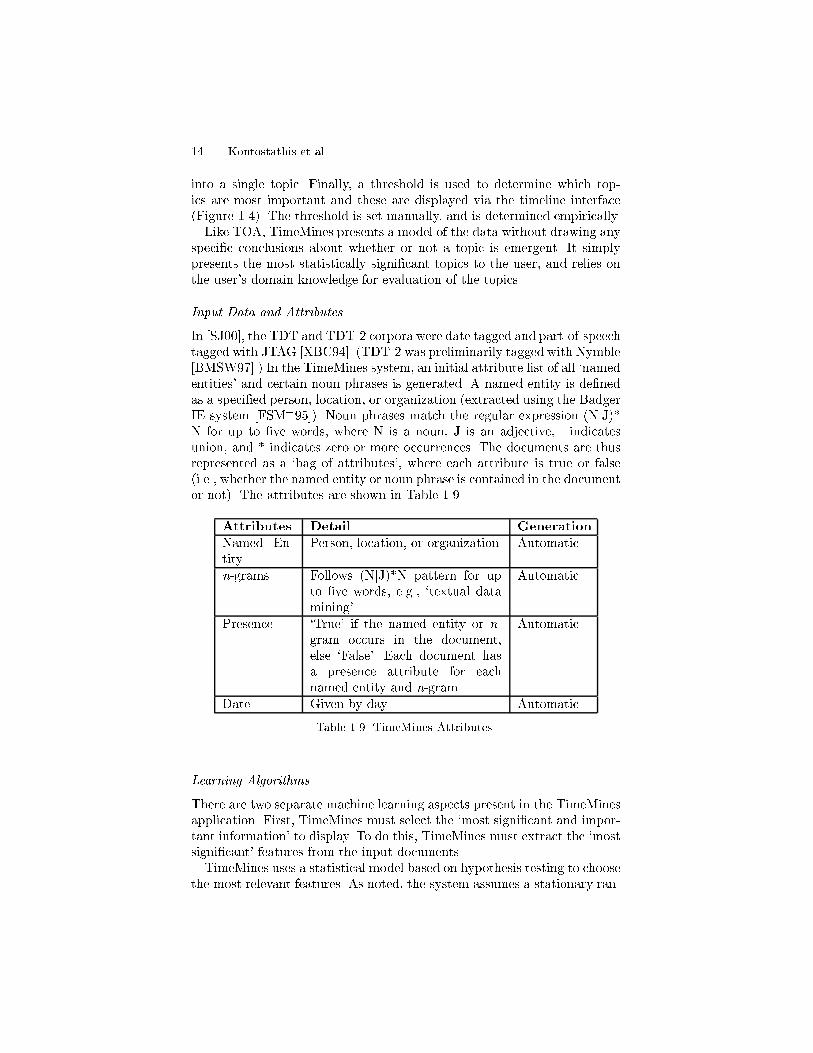
In SJ��� the TDT and TDT�� corpora were date tagged and part�of�speechtagged with JTAG XBC� � �TDT�� was preliminarily tagged with NymbleBMSW���� In the TimeMines system� an initial attribute list of all �namedentities� and certain noun phrases is generated� A named entity is de�nedas a speci�ed person� location� or organization �extracted using the BadgerIE system FSM����� Noun phrases match the regular expression �NjJ��N for up to �ve words� where N is a noun� J is an adjective� j indicatesunion� and � indicates zero or more occurrences� The documents are thusrepresented as a �bag of attributes�� where each attribute is true or false�i�e�� whether the named entity or noun phrase is contained in the documentor not�� The attributes are shown in Table ����
Attributes Detail Generation
Named En�tity
Person� location� or organization Automatic
n�grams Follows �NjJ��N pattern for upto �ve words� e�g�� �textual datamining�
Automatic
Presence �True� if the named entity or n�gram occurs in the document�else �False�� Each document hasa presence attribute for eachnamed entity and n�gram�
Automatic
Date Given by day Automatic
Table �� TimeMines Attributes�
Learning Algorithms
There are two separate machine learning aspects present in the TimeMinesapplication� First� TimeMines must select the �most signi�cant and impor�tant information� to display� To do this� TimeMines must extract the �mostsigni�cant� features from the input documents�TimeMines uses a statistical model based on hypothesis testing to choose
the most relevant features� As noted� the system assumes a stationary ran�
� A Survey of Emerging Trend Detection in Textual Data Mining �
dom model for all features �n�grams and named entities� extracted fromthe corpus� The stationary random model assumes that all features are sta�tionary �meaning their distributions do not vary over time� and the randomprocesses generating any pair of features are independent� Features whoseactual distribution matches this model are considered to contain no new in�formation and are discarded� Features that vary greatly from the model arekept for further processing� The hypothesis testing is time dependent� Inother words� for a speci�c block of time� a feature either matches the model�at a given threshold� or violates the model� Thus the phrase �OklahomaCity Bombing� may be signi�cant for one time slice� but not signi�cant foranother�After the feature set has been pruned in this manner� TimeMines uses
another learning algorithm� again based on hypothesis testing� Using thereduced feature set� TimeMines checks for features within a given timeperiod that have similar distributions� These features are grouped into asingle �topic�� Thus each time period may be assigned a small number oftopic areas� represented by a larger number of features�One potential drawback of ranking the general topics derived from the
signi�cant attributes is discussed in SJ��� The occurrence of an attributeis measured against all other occurrences of it in the corpus� As a resulta consistently heavily used attribute may not distinguish itself properly�The Kenneth Starr�President Clinton investigation is unquestionably themost covered story in the TDT�� corpus� yet ranked ��th because it is soprevalent throughout� Against a longer time period� including time aftercoverage had died down� the story probably would have ranked �st�Like all of the algorithms we present here� the �nal determination of
whether or not a topic is emerging is left to the user� but unlike CIMELand TOA� the user does not direct the TimeMines system� This systemis completely automated� given a time�tagged corpus it responds with agraphical representation of the topics that dominate the corpus duringspeci�c time periods�
Visualization
TimeMines generates timelines automatically for both visualization of tem�poral locality of topics and the identi�cation of new information within atopic� The x�axis represents time� while the y�axis represents the relativeimportance of a topic� The most statistically signi�cant topic appears nearthe top of the visualization �Figure �� �� Each block in the visualizationinterface includes all the terms used to describe a topic and thus indicatesthe coverage within the corpus� Clicking on a term �named entity or n�gram� pops up a menu of all the associated features of that type within thetopic� and a sub�menu option allows the user to choose this feature as thelabel� or to obtain more information about the feature� However no e�ort
� Kontostathis et al�
is made to infer any hierarchical structure in the appearance of the featurein the timeline�
Evaluation
Two hypotheses are evaluated in SJ��� do term occurrence and co�occurrence measures properly group documents into logical time�dependentstories� and� are the stories themselves meaningful to people� A random�ization test Edg�� was conducted to support the �rst hypothesis� Thedocuments were shu�ed and assigned an alternate date� but were otherwiseleft intact� From an IR standpoint the corpus looked the same� since termfrequency and inverse document frequency were preserved� The authorsconcluded that the results of this test overwhelming suggest the groupingsare logical and not random�The second hypothesis was explored with two methods of evaluation
but results were inconclusive� The �rst evaluation method used precisionand recall metrics from IR� The January ���� Facts on File Fac listed�� major stories� which were used as the �truth� set to compare with theTimeMines�generated major stories� Recall was de�ned as the number ofFacts on File major stories identi�ed by TimeMines divided by the totalnumber of Facts on File major stories� Precision was de�ned as the numberof Facts on File major stories identi�ed by TimeMines divided by the totalnumber of TimeMines�identi�ed major stories� A relatively low precisionof ���� and a similarly low recall of ���� resulted�The second evaluation method attempted to tune the threshold� Four
students manually determined whether the automatic groupings related tozero� one� or multiple topics� Based on a pair wise Kappa statistic� however�the manual results could not be distinguished from random results SA���
���� New Event Detection
New event detection� also referred to as �rst story detection� is speci�callyincluded as a subtask in the TDT initiative� New event detection requiresidentifying those news stories that discuss an event that has not alreadybeen reported in earlier stories� New event detection operates without aprede�ned query� Typically algorithms look for keywords in a news storyand compare the story with earlier stories� The approach taken in APL��implies that the input be processed sequentially in date order� i�e�� onlypast stories can be used for evaluation� not the entire corpus�A new event detection algorithm based on a single pass clustering algo�
rithm is presented in APL��� The content of each story is represented asa query� When a new story is processed� all the existing queries �previousstories� are run against it� If the �match� exceeds a prede�ned threshold�discussed below� the new story is assumed to be a continuation of thequery story� Otherwise it is marked as a new story�

� A Survey of Emerging Trend Detection in Textual Data Mining �
An interesting characteristic of news stories is that events often occurin bursts� Figure ��� �YPC��� portrays a temporal histogram of an eventwhere the x�axis represents time in terms of days �� through ���� and they�axis is the story count per day�
Figure ��� Temporal histogram of news data ��YPC����
News stories discussing the same event tend to be in temporal proximityand hence lexical similarity and temporal proximity are considered to betwo criteria for document clustering� Also� a time gap between the burstsas exempli�ed in Figure ��� discriminates between distinct events� and thesystem is more likely to match stories that appear in the same timeframe�As reported in APL��� with proper tuning the algorithm was able to
separate news stories related to the Oklahoma City Bombing from thoseabout the World Trade Center bombing� However� some stories could notbe detected� For example� the crash of Flight �� could not be distin�guished from other airplane accidents� and the OJ Simpson trial could notbe separated from other court cases�
Input Data and Attributes
All stories in the TDT corpus deemed relevant to �� selected �events� wereprocessed� For new event detection� each story is represented by a queryand threshold� Table ���� lists all the attributes required for computingthe query and threshold� The n most frequent single words comprise thequery� and are weighted and assigned a �belief� value by the Inquery systemABC���� indicating the relevance of each word in the story to the query�Belief is calculated using term frequency and inverse document frequency�Term frequency is derived from the count of times the word occurs in thestory� the length of the story� and the average length of a story in thecollection� Inverse document frequency is derived from the count of storiesin the collection and the count of stories that contain the word�

� Kontostathis et al�
Attribute Detail Generation
Unigram A single word Automatic
Frequency Number of times unigram occurs�per story
Automatic
Count Total number of unigrams� perstory
Automatic
Mean Average number of unigrams perstory
Automatic
Frequency Number of stories in whichunigram occurs
Automatic
Count Number of stories Automatic
Date Given by available granularities Automatic
Table ��� New Event Detection Attributes
Learning Algorithms
As noted� the approach presented in APL�� is based on a single�passclustering algorithm that detects new stories by comparing each story pro�cessed to all of the previous stories�queries detected� As each incomingstory is processed� all previous �queries� are run against it� If a story doesnot match any of the existing queries� the story is considered a new event�The system relies on a threshold to match the queries to the incoming
stories� The initial threshold for a query is set by evaluating the query withthe story from which it originated� If a subsequent story meets or exceedsthis initial threshold for the query� the story is considered a match� Thethreshold is used as input to a thresholding function based on the Inquerysystem described above ABC���� Since new event detection implies thatdocuments are processed in order� however� traditional IR metrics that areusually applied to an entire corpus �such as the number of documents con�taining the term and average document length� are not readily available�To overcome this problem� an auxiliary collection is used to provide thisinformation to the Inquery system� The thresholding function takes advan�tage of the time dependent nature of the news story collection by using atime penalty that increases the value required to �match� a story as storiesgrow further apart in time�Like the TimeMines system� the new event detection system described
here is completely automated� Given a corpus� it provides a list of �newevents� in the form of news stories that �rst describe an occurrence ofan event� New event detection di�ers somewhat from ETD in that it isfocused on the sudden appearance of an unforeseen event rather than the�more gradual� emergence of a trend�

� A Survey of Emerging Trend Detection in Textual Data Mining
Visualization
The new event detection system is based on Lighthouse LA��b� LA��a�an interactive information retrieval system that provides a ranked list ofsearch results together with two and three�dimensional visualizations ofinter�document similarities� After events are extracted� a visual timelineis constructed to show how these events occur in time and relate to oneanother�
Evaluation
APL�� evaluated their system using miss �false negative� and false alarm�false positive� rates as well as the metrics of precision and recall� Arrivingat meaningful thresholds for these rates was di�cult� and as a comple�ment� Detection Error Tradeo� �DET� curves MDOP�� were studied�DET curves highlight how miss and false alarm rates vary with respect toeach other �each is plotted on an axis in a plane�� A perfect system withzero misses and false alarms would be positioned at the origin� thus� DETcurves �closer� to the origin are generally better� �Close� was de�ned as theEuclidean distance from the DET curve to the origin in APL��� Usingnearly all � ��� single�word attributes in the queries resulted in averages of �� for the miss rate� �� �� for the false alarm rate� � � for recall� and �� for precision�
���� ThemeRiverTM
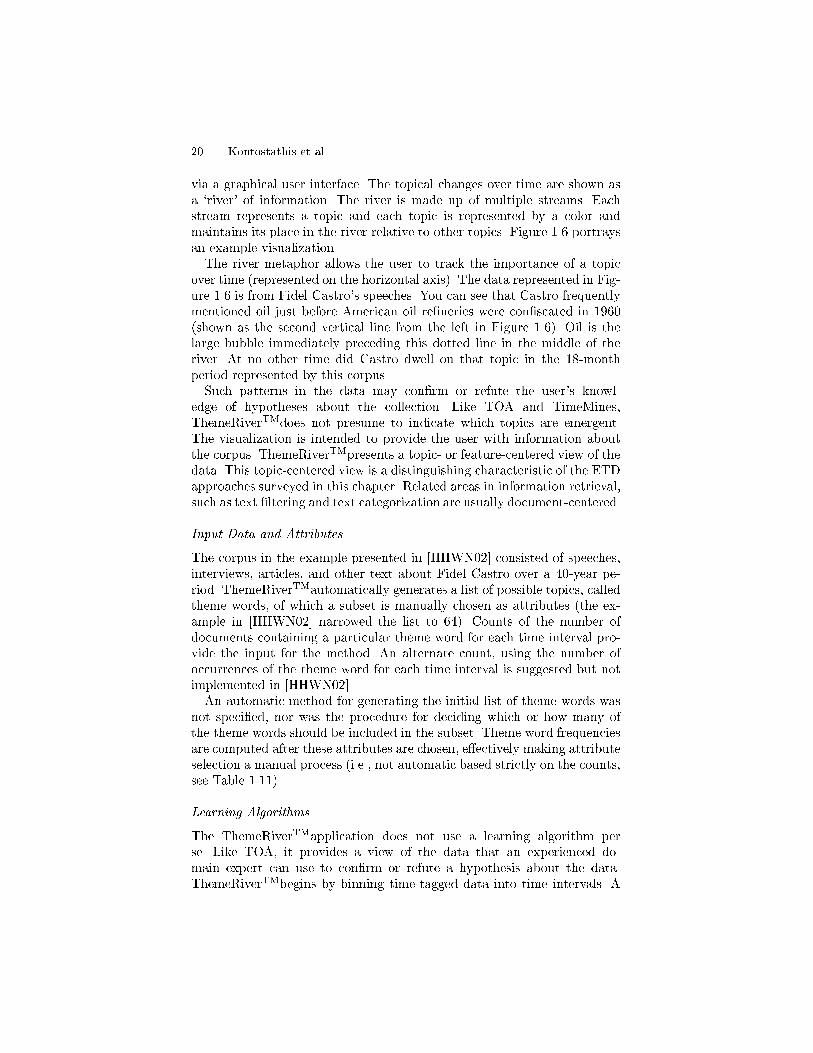
Figure ��� ThemeRiverTMsample output ��HHWN�����
Similar to TimeMines� ThemeRiverTMHHWN�� summaries the main top�ics in a corpus and presents a summary of the importance of each topic
�� Kontostathis et al�
via a graphical user interface� The topical changes over time are shown asa �river� of information� The river is made up of multiple streams� Eachstream represents a topic and each topic is represented by a color andmaintains its place in the river relative to other topics� Figure ��� portraysan example visualization�The river metaphor allows the user to track the importance of a topic
over time �represented on the horizontal axis�� The data represented in Fig�ure ��� is from Fidel Castro�s speeches� You can see that Castro frequentlymentioned oil just before American oil re�neries were con�scated in �����shown as the second vertical line from the left in Figure ����� Oil is thelarge bubble immediately preceding this dotted line in the middle of theriver� At no other time did Castro dwell on that topic in the ���monthperiod represented by this corpus�Such patterns in the data may con�rm or refute the user�s knowl�
edge of hypotheses about the collection� Like TOA and TimeMines�ThemeRiverTMdoes not presume to indicate which topics are emergent�The visualization is intended to provide the user with information aboutthe corpus� ThemeRiverTMpresents a topic� or feature�centered view of thedata� This topic�centered view is a distinguishing characteristic of the ETDapproaches surveyed in this chapter� Related areas in information retrieval�such as text �ltering and text categorization are usually document�centered�
Input Data and Attributes
The corpus in the example presented in HHWN�� consisted of speeches�interviews� articles� and other text about Fidel Castro over a ��year pe�riod� ThemeRiverTMautomatically generates a list of possible topics� calledtheme words� of which a subset is manually chosen as attributes �the ex�ample in HHWN�� narrowed the list to � �� Counts of the number ofdocuments containing a particular theme word for each time interval pro�vide the input for the method� An alternate count� using the number ofoccurrences of the theme word for each time interval is suggested but notimplemented in HHWN���An automatic method for generating the initial list of theme words was
not speci�ed� nor was the procedure for deciding which or how many ofthe theme words should be included in the subset� Theme word frequenciesare computed after these attributes are chosen� e�ectively making attributeselection a manual process �i�e�� not automatic based strictly on the counts�see Table ������
Learning Algorithms
The ThemeRiverTMapplication does not use a learning algorithm perse� Like TOA� it provides a view of the data that an experienced do�main expert can use to con�rm or refute a hypothesis about the data�ThemeRiverTMbegins by binning time�tagged data into time intervals� A
� A Survey of Emerging Trend Detection in Textual Data Mining �
Attribute Detail Generation
Unigram A single word Manual
Frequency Number of documents in whichunigram occurs� per time interval
Automatic
Date Given by month Automatic
Table �� ThemeRiverTMAttributes�
set of terms� or themes� that represent the data is chosen and the river isdeveloped based on the strength of each theme in the collection� As noted�the themes are chosen by automatically developing a list of words that arepresent in the data and then manually selecting a subset that representvarious topics� The number of documents containing the word determinesthe strength of each theme in each time interval� Other methods of de�veloping the themes and strengths are possible� The visual component ofThemeRiverTMis the most important aspect of this work� particularly as itapplies to trend detection�
Visualization
The ThemeRiverTMsystem uses the river metaphor to show the �ow of dataover time �Figure ����� While the river �ows horizontally� vertical sections ofthe river contain colored currents that identify topics or themes� The widthof the river changes with the emergence or disappearance of topics� therebymaking the system e�ective in cases where there is no major variation intopic�The curves in Figure ��� show how interpolation is done to obtain a
river metaphor� The idea is to produce a smooth curve with positive streamwidth for better visual tracking of the stream across time� Even though thistechnique aids human pattern recognition� a simple histogram can be moreaccurate� The algorithm interpolates between points to generate smoothcurves �continuity in the �ow of the river��ThemeRiverTMmakes judicious use of color� leveraging human perceptual
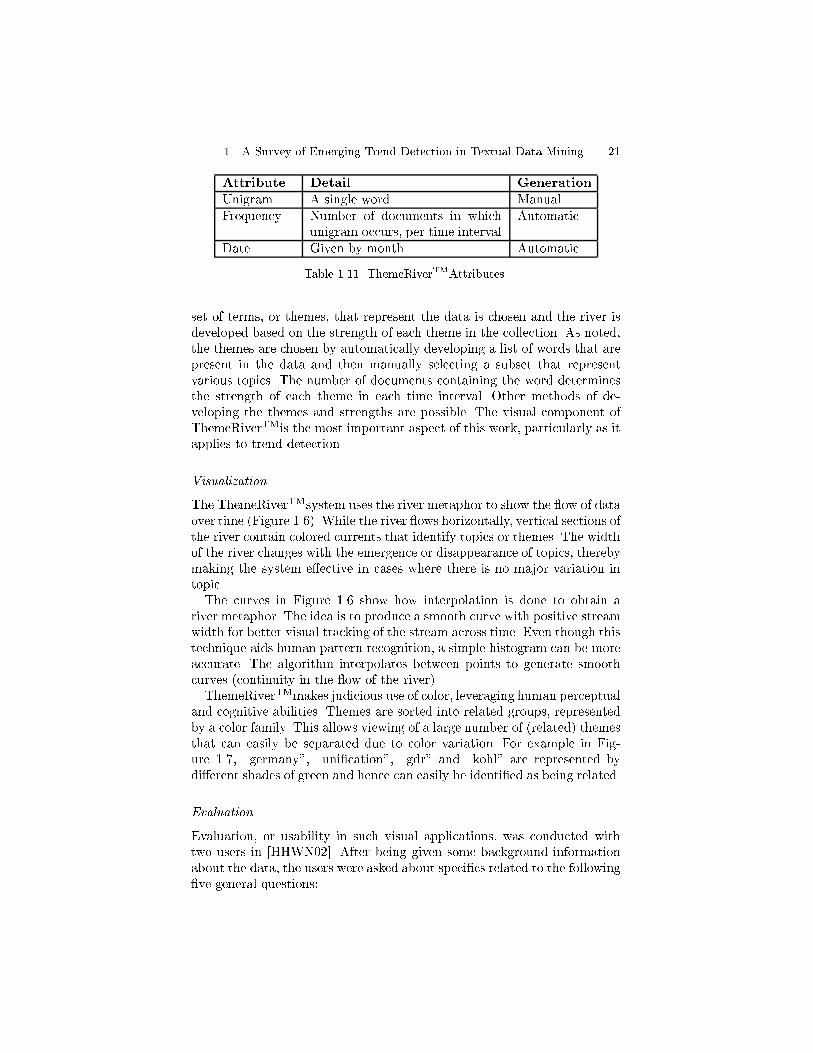
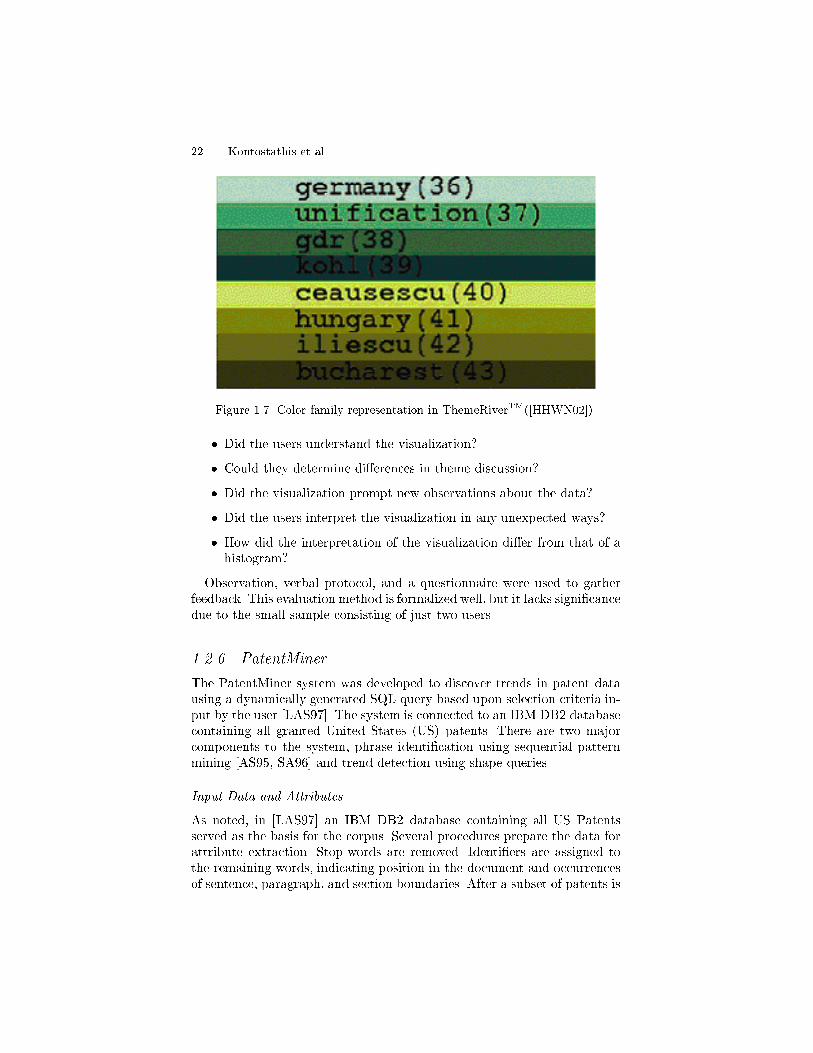
and cognitive abilities� Themes are sorted into related groups� representedby a color family� This allows viewing of a large number of �related� themesthat can easily be separated due to color variation� For example in Fig�ure ���� �germany � �uni�cation � �gdr and �kohl are represented bydi�erent shades of green and hence can easily be identi�ed as being related�
Evaluation
Evaluation� or usability in such visual applications� was conducted withtwo users in HHWN��� After being given some background informationabout the data� the users were asked about speci�cs related to the following�ve general questions�
�� Kontostathis et al�
Figure ��� Color family representation in ThemeRiverTM��HHWN�����
� Did the users understand the visualization�
� Could they determine di�erences in theme discussion�
� Did the visualization prompt new observations about the data�
� Did the users interpret the visualization in any unexpected ways�
� How did the interpretation of the visualization di�er from that of ahistogram�
Observation� verbal protocol� and a questionnaire were used to gatherfeedback� This evaluation method is formalized well� but it lacks signi�cancedue to the small sample consisting of just two users�
����� PatentMiner
The PatentMiner system was developed to discover trends in patent datausing a dynamically generated SQL query based upon selection criteria in�put by the user LAS��� The system is connected to an IBM DB� databasecontaining all granted United States �US� patents� There are two majorcomponents to the system� phrase identi�cation using sequential patternmining AS��� SA�� and trend detection using shape queries�
Input Data and Attributes
As noted� in LAS�� an IBM DB� database containing all US Patentsserved as the basis for the corpus� Several procedures prepare the data forattribute extraction� Stop�words are removed� Identi�ers are assigned tothe remaining words� indicating position in the document and occurrencesof sentence� paragraph� and section boundaries� After a subset of patents is

� A Survey of Emerging Trend Detection in Textual Data Mining ��
Figure ��� PatentMiner Sample Output ��LAS����
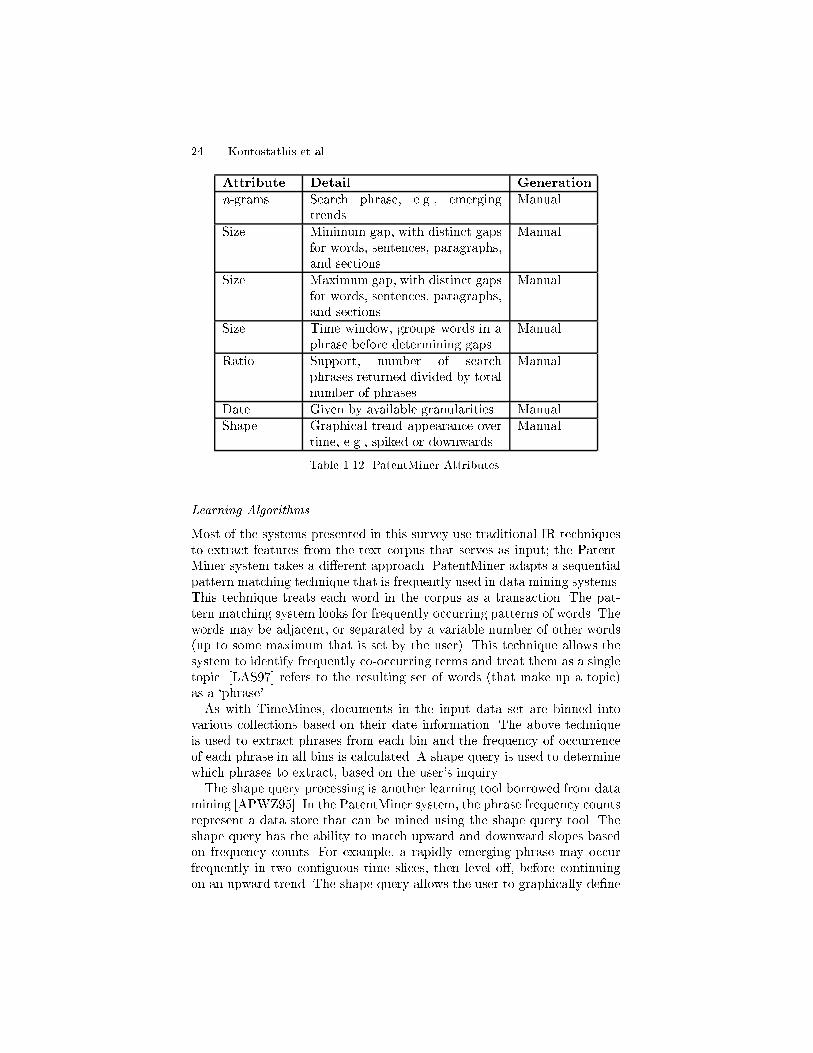
speci�ed by category and date range� the Generalized Sequential Patterns�GSP� algorithm SA�� selects user�de�ned attributes� called �phrases��Only phrases with support greater than a user�de�ned minimum are con�sidered� A phrase can be any sequence of words� with a minimum andmaximum �gap� between any of the words� Gaps can be described in termsof words� sentences� paragraphs� or sections� For example� if the minimumsentence gap is one for the phrase �emerging trends�� than �emerging� and�trends� must occur in separate sentences� Or if the maximum paragraphgap is one� than �emerging� and �trends� must occur in the same paragraph�A time window indicates the number of words to group together beforecounting gap length� Finally� a shape de�nition language �SDL� APWZ��speci�es which types of trends �e�g�� upwards� spiked� etc�� are displayed�Table ���� summarizes these attributes�The number of phrases selected can be substantial� given their very open�
ended nature� Two pruning methods are discussed in LAS��� A sub�phraseof a phrase may be ignored if the support of the two phrases is similar� Or�a sub�phrase �general� higher�level� might be preferred over a longer phrase�speci�c� lower�level� initially� after which speci�c lower�level phrases couldbe easier to identify� This has the �avor of the technique used in CIMELin which a �main topic� is combined with a �candidate trend� in order toimprove the precision of the results�
� Kontostathis et al�
Attribute Detail Generation
n�grams Search phrase� e�g�� emergingtrends
Manual
Size Minimum gap� with distinct gapsfor words� sentences� paragraphs�and sections�
Manual
Size Maximum gap� with distinct gapsfor words� sentences� paragraphs�and sections�
Manual
Size Time window� groups words in aphrase before determining gaps
Manual
Ratio Support� number of searchphrases returned divided by totalnumber of phrases
Manual
Date Given by available granularities ManualShape Graphical trend appearance over
time� e�g�� spiked or downwardsManual
Table ��� PatentMiner Attributes�
Learning Algorithms
Most of the systems presented in this survey use traditional IR techniquesto extract features from the text corpus that serves as input� the Patent�Miner system takes a di�erent approach� PatentMiner adapts a sequentialpattern matching technique that is frequently used in data mining systems�This technique treats each word in the corpus as a transaction� The pat�tern matching system looks for frequently occurring patterns of words� Thewords may be adjacent� or separated by a variable number of other words�up to some maximum that is set by the user�� This technique allows thesystem to identify frequently co�occurring terms and treat them as a singletopic� LAS�� refers to the resulting set of words �that make up a topic�as a �phrase��As with TimeMines� documents in the input data set are binned into
various collections based on their date information� The above techniqueis used to extract phrases from each bin and the frequency of occurrenceof each phrase in all bins is calculated� A shape query is used to determinewhich phrases to extract� based on the user�s inquiry�The shape query processing is another learning tool borrowed from data
mining APWZ��� In the PatentMiner system� the phrase frequency countsrepresent a data store that can be mined using the shape query tool� Theshape query has the ability to match upward and downward slopes basedon frequency counts� For example� a rapidly emerging phrase may occurfrequently in two contiguous time slices� then level o�� before continuingon an upward trend� The shape query allows the user to graphically de�ne

� A Survey of Emerging Trend Detection in Textual Data Mining ��
various shapes for trend detection �or other applications� and retrieves thephrases with frequency distributions that match the query�Like ThemeRiverTM� TimeMines and others� the PatentMiner system
presents a list of phrases to the user� The domain expert must then identifythose that represent emerging trends�
Visualization
The system is interactive� a histogram is displayed showing the occurrencesof patents by year based on the user�s selection criteria� The user has theability to focus on a speci�c time period and to select various shape queriesto explore the trends as described above�The phrases that match an increasing usage query on US patents in the
category �Induced Nuclear Reactions� Processes� Systems and Elements are shown in Figure ����
Evaluation
Like TOA� the presentation of PatentMiner in LAS�� lacks an evaluationcomponent� While it automatically generates and displays potential trends�no claim is made as to the validity of these trends� The visualization isintuitive� but no user study on its e�ectiveness is reported in LAS��� Inaddition� no metrics are employed in LAS�� to verify that the trendsdiscovered are correctly identi�ed�
����� HDDITM
Our research has led to the development of the Hierarchical Dis�tributed Dynamic Indexing �HDDITM� system PKM��� BCG���� BP���The HDDITMsystem supports core text processing including informa�tion�feature extraction� feature subset selection� unsupervised and super�vised text mining � machine learning as well as evaluation for manyapplications� including ETD HDD�In PY�� we describe our approach to the detection of emerging trends
in text collections based on semantically determined clusters of terms� TheHDDITMsystem is used to extract linguistic features from a repository oftextual data and to generate clusters based on the semantic similarity ofthese features� The algorithm takes a snapshot of the statistical state of acollection at multiple points in time� The rate of change in the size of theclusters and in the frequency and association of features is used as inputto a neural network that classi�es topics as emerging or non�emerging�Initially we modeled the complex non�linear classi�cation process using
neural networks� The datasets� which included three years of abstracts re�lated to processor and pipelining patent applications� were separated byyear and a set of concepts and clusters was developed for each year� In or�der to develop a training set� � ���� concepts were extracted and manually
�� Kontostathis et al�
labeled� The system was� for example� able to correctly identify �Low powerCMOS with DRAM� as an emerging trend in the proper timeframe�In follow�on experiments we were able to duplicate the precision achieved
by the neural network with the C �� decision tree learning algorithmZho��� The run time performance for training was signi�cantly betterwith the decision tree approach� These experiments show that it is possibleto detect emerging concepts in an on�line environment�Like most other algorithms that we have reviewed� our approach relies on
a domain expert for the �nal determination� thus the goal of the system isto identify emerging topics whenever possible �i�e�� maximize recall� whilenot sacri�cing precision� Unlike the �rst story detection algorithms� ourresearch focuses on integrative or non�disruptive emergence of topics� asopposed to the sudden appearance of completely new topics�
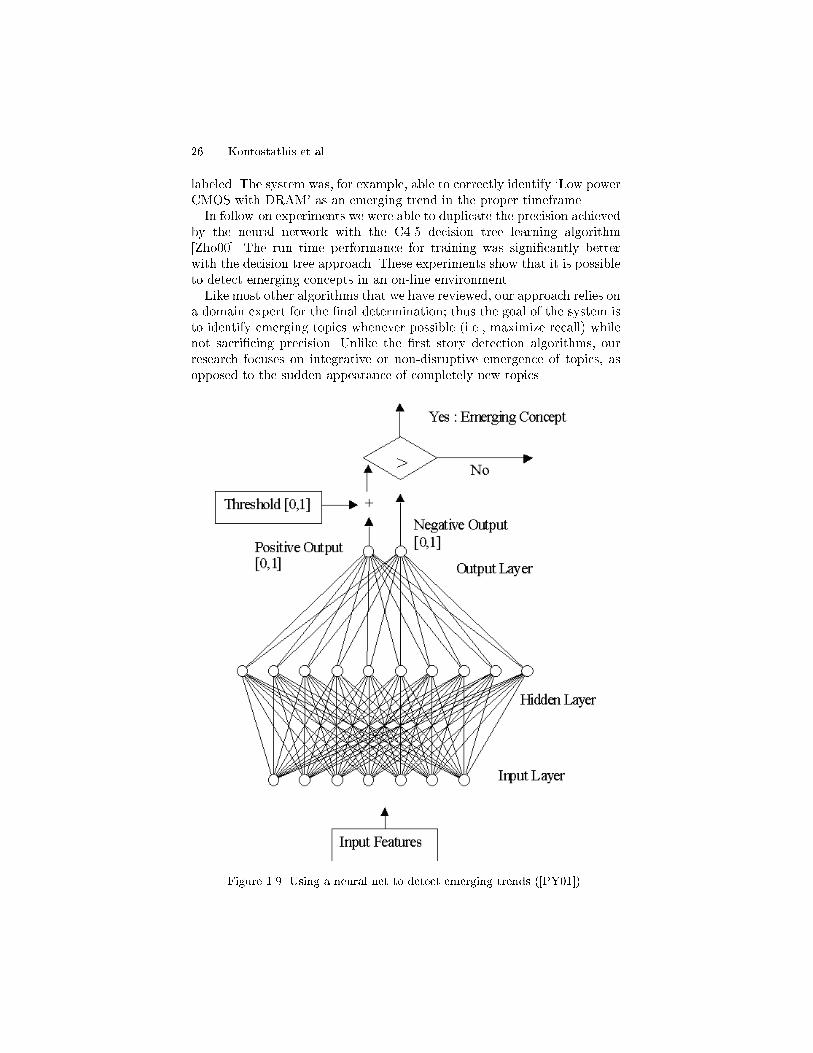
Figure �� Using a neural net to detect emerging trends ��PY����
� A Survey of Emerging Trend Detection in Textual Data Mining ��
Input Data and Attributes
Four databases were used to formulate a corpus in PY��� the US patentdatabase� the Delphion patent database Del� the INSPEC r�database�and the COMPENDEX r�database� Initial attribute selection �Table �����requires parsing and tagging before extraction� The parser retains only rel�evant sections of the original documents� The tagger maps a part�of�speechlabel to each word using lexical and contextual rules Bri��� A �nite�statemachine extracts complex noun phrases �concepts� according to the regularexpression
C��GjP jJ� �N ! �I �D�C��GjP jJ� �N!�� �����
where C is a cardinal number� G is verb �gerund or present participle�� Pis a verb �past participle�� J is an adjective� N is a noun� I is a preposition�D is a determiner� � indicates zero or one occurrence� j indicates union� �indicates zero or more occurrences� and ! indicates one or more occurrenceBCG���� Counts of each concept and counts of co�occurrence of conceptpairs are recorded at this point PY���An asymmetric similarity between concept pairs is calculated based on a
cluster weight function described in CL��� The concepts are then groupedinto regions of semantic locality using sLoc� an algorithm we describe inBP��� The maximum� mean and standard deviation of the similarity�along with a parameter � that is a multiplication factor of the numberof standard deviations� determine the threshold � used in the �rst step ofthe sLoc algorithm� Cluster size is used in the last step �both are pruningmechanisms�� As � decreases� � increases and the number of connectionsbetween pairs of concepts decreases� resulting in smaller but more focusedsemantic regions� Too small a value of � could produce too many regions�while too large a value may result in only a single� large region� Thus� statis�tically �nding the optimum value for � �and the threshold �� is worthwhile�and work continues in this area� Empirical research supports an optimumvalue of � " ���� Yan��� The identi�cation of regions of semantic localityis an unsupervised learning step that produces values used as attributesin the ETD supervised learning process discussed following �see Table ����for detail��An emerging concept satis�es two principles� it should grow semanti�
cally richer over time �i�e�� occur with more concepts in its region�� and itshould occur more often as more items reference it PY��� Using a cluster�based rather than an item�based approach� the arti�cial neural networkmodel takes seven inputs �and one tuning threshold parameter� to classifya concept as emerging or not PY��� The seven inputs are described inTable ��� �

�� Kontostathis et al�
Attribute Detail Generation
Regular ex�pression
A concept �see text for def�inition�� e�g�� �emerging trenddetection�
Automatic
Frequency Number of times each conceptoccurs over all documents
Automatic
Frequency Number of co�occurrences ofconcept pairs over all documents
Automatic
Similarity Arc weight between concepts AutomaticMean Average arc weight Automatic
StandardDeviation
Arc weight standard deviation Automatic
Table ��� HDDITMAttributes for Regions of Semantic Locality�
Attribute Detail Generation
Frequency Number of times concept occursin trial year
Automatic
Frequency Number of times concept occursin the year before trial year
Automatic
Frequency Number of times concept occursin the year two years before trialyear
Automatic
Frequency Total number of times conceptoccurs in all years before trialyear
Automatic
Count Number of concepts in regioncontaining the concept in trialyear
Automatic
Count Number of concepts in regioncontaining the concept in the yearbefore trial year
Automatic
Count Number of words in the conceptwith length at least four
Automatic
Table � � HDDITMAttributes for Emerging Trend Detection�
Learning Algorithms
As mentioned above� our fundamental premise is that computer algorithmscan detect emerging trends by tracing changes in concept frequency andassociation over time� Our approach involves separating the data into time�determined bins �like PatentMiner and TimeMines� and taking a snapshotof the statistical relationships between terms� Two particular features wereimportant in our model� Similar to other algorithms� the frequency of oc�
� A Survey of Emerging Trend Detection in Textual Data Mining �
currence of a term should increase if the term is related to an emergingtrend� Also� the term should co�occur with an increasing number of otherterms if it is an emerging trend� To our knowledge� only our system hasexploited term co�occurrence for automatic ETD�As noted above� the �rst learning model we employed is a feed�forward�
back�propagation arti�cial neural network �Figure ����� We used a standardthree�layer network �one input layer� one hidden layer� one output layer��The number of hidden neurons was varied to optimize our results�The attributes were extracted as described in the previous section and
used as input to both the neural network model PY��� and to various otherdata mining algorithms such as a decision tree� support vector machine� etc�Zho��� In all cases� we determined that the algorithms could be trainedto detect emerging trends� As with other systems� precision was fairly low�although much better than the baseline� and �nal determination as towhether or not a term displayed by the system represents an emergingtrend must be left to a domain expert�
Visualization
Visualization is ongoing for trend detection within the HDDITMsystem�
Evaluation
Both concept extraction and trend detection evaluations were performed�For concept extraction BCG���� mean precision �number of system iden�ti�ed correct concepts � total number of system identi�ed concepts� andmean recall �number of system identi�ed correct concepts � total numberof human expert�identi�ed concepts� were calculated for several collections�Two of the test collections �drawn from the Grainger DLI database UIU�the US Patent O�ce and the aforementioned commercial patent databaseDelphion� had precision ranges of ����� ���� and ����� ���� respectively�and recall ranges of ��� � ���� and ����� ���� respectively� with ���con�dence�Automatic trend detection performance in the HDDITMsystem was mea�
sured by precision� recall� and F� PY��� An average precision of �����constituted a ��� factor of improvement over random baseline precision�recall averaged ������ Either metric could be improved by altering the neu�ral network threshold parameter� Since good recall was the primary focus�F� � a weighted average of precision and recall with parameter �� was alsoexamined� � is the precision weight and
F� "�� ! ��� � precision � recall
�� � precision! recall� �����

�� Kontostathis et al�
���� Other Related Work
FD�� proposes a technique for development of a hierarchical data struc�ture from text databases� This data structure then facilitates the study ofconcept distributions in text� The authors propose comparing the conceptdistributions from adjacent time periods� This approach to trend analy�sis seems promising� however� we were not able to obtain a more detaileddescription of the approach� or the experimental results� so we are unableto present a more comprehensive summary� Feldman has also been activein the development of commercial products for emerging trend detection�Section �����We have focused on research e�orts that identify trends based primarily
on the use of words and phrases� however� several research groups are usinga di�erent approach� CC��� PFL��� and Ley�� present algorithms thatprimarily employ citation information for trend detection�Several systems focus more on the visualization of textual data and can
be adapted to trend detection at the discretion of the user� One such system�Envision NFH���� allows users to explore trends graphically in digital li�brary metadata �including publication dates� to identify emerging concepts�It is basically a multimedia digital library of computer science literature�with full�text searching and full�content retrieval capabilities� The systememploys the use of colors and shapes to convey important characteristicsof documents� For example� the interface uses color to show the degree ofrelevance of a document�Plaisant et al� describe a visual environment called LifeLines for review�
ing personal medical histories in PMS���� The visualization environmentpresented in their work exploits the timeline concept to present a summaryview of patient data�The EAnalyst LSL��� analyzes two types of data� textual and numeric�
both with timestamps� The system predicts trends in numeric data basedon the content of textual data preceding the trend� For example� the systempredicts the trend in stock prices based on articles published prior to theappearance of the �numeric� trend�
��� COMMERCIAL SOFTWARE OVERVIEW
Commercial software products are available to aid a company interestedin ETD� Some companies specialize in providing content Lex� Mor� Nor�IDC� Gar� Fac� some provide general purpose information retrieval capa�bilities such as feature extraction Appa� Cap� Loc� document managementHyB� Ban� search and retrieval Ban� HyB� Lex� Tex� categorization INS�Int� Sem� Ser� SPSb� Str� Ver� and clustering Appb� Cle� INS� Tex� Tho�Although all of these products can be used to facilitate an ETD e�ort�
� A Survey of Emerging Trend Detection in Textual Data Mining �
only a few have capabilities speci�cally geared toward trend analysis anddetection� These products are brie�y introduced in this section�
����� Autonomy
The ClusterizerTMtool provided by Autonomy Appb provides support forETD� ClusterizerTMClu takes a corpus as input and produces a set ofclusters of information from the data� These clusters can be used to identifynew topics in the data by taking a set of clusters from a previous timeperiod and comparing it to a set of clusters in the current period� In essence�ClusterizerTMdisplays a view of clusters over time� The tool is thus designedto show trends in clusters� including the appearance and disappearance ofclusters� as well as changes in cluster size�The pattern�matching algorithms of non�linear adaptive digital signal
processing� Claude Shannon�s principles of information theory� Bayesianinference� and neural networks form the core of Autonomy�s technologyCla��� Since natural language contains much duplication� concepts thatare repeated less frequently in a document are assumed to correspond tothe essence of that document� Autonomy thus describes a document withpatterns based on usage and frequency of terms� Adaptive probabilisticconcept modeling is used to determine relevance between documents andfurther train the system Aut�The Autonomy ClusterizerTMmodule assists a human domain expert in
detecting trends� The Breaking News pane automatically �nds new clus�ters of information by comparing clusters from di�erent time periods� TheSpectrograph pane is a visualization tool that plots clusters as lines overtime� The color and width of the lines indicate the size and quality of thecluster� changes signal an increase or decrease in signi�cance�Like the research tools described in the previous section� Spectrograph
is designed to provide the user with a view into the data� The domainexpert must then use the data to form conclusions as to the validity of agiven trend� In terms of evaluation� to the best of our knowledge no formalassessment has been conducted of the performance of these tools when usedfor ETD�
����� SPSS LexiQuest
LexiQuest products use advanced natural language processing technologyto access� manage and retrieve textual information SPSb� LexiQuest Lex�iMine is a text mining tool designed to help the user obtain new insights byidentifying key concepts and the relationships between them� It employs acombination of dictionary�based linguistic analysis and statistical proxim�ity matching to identify key concepts �i�e�� terms� as well as the degree ofrelationship between concepts Bry���
�� Kontostathis et al�
Concept identi�cation is achieved through the use of unabridged dictio�naries and thesauri that contain �multi�word� terms used to match termsin LexiMine�s input text� Term occurrences and term co�occurrences arecounted either by paragraph or document and are used to build relationalconcept maps� Although no machine learning algorithms are employedper se� LexiQuest�s term similarity formulas are akin to those used inassociation mining Bry���The concept relationships are portrayed in a graphical map that displays
the cumulative occurrence of concepts� The map can be utilized to investi�gate trends� Further analysis can be achieved by importing LexiMine datainto the related Clementine SPSa tool� As with many of the research andcommercial tools discussed in this survey� the validity of trends is ultimatelyleft to a human domain expert and tool performance is neither quanti�ednor evaluated in any formal way Bry���
����� ClearForest
ClearForest provides a platform and products to extract relevant informa�tion from large amounts of text and to present summary information tothe user Cle� Two products� ClearResearch and ClearSight� are useful forETD applications� ClearResearch is designed to present a single�screen viewof complex inter�relationships� enabling users to view news and researchcontent in context� ClearSight provides simple� graphic visualizations ofrelationships between companies� people and events in the business world�It also provides real�time updates of new product launches� managementchanges� emerging technologies� etc� in any speci�ed context� Users candrill down further into each topic to view more information or read relatedarticles Gra���ClearForest uses a rule�based approach to identify �entities� and �facts��
An entity is a sequence of one or more words corresponding to a singleconcept� A fact is a relationship between entities� Rules can contain part�of�speech or stem identi�ers for words� references to dictionaries and lexicons�and structural characteristics� The extraction engine applies rules to inputdocuments and outputs tagged information� The precise location of all in�formation extracted is recorded� Occurrence and co�occurrence of conceptsare used by the analytic engine to summarize information� Visualizationtools display this information in various levels of detail Gra���ClearForest divides the detection process into four stages� The �rst� gath�
ering information� is performed by search engines� The second and third�extracting and consolidating information� is managed by ClearForest� Thelast� identifying a valid trend� is handled by a human domain expert usingClearForest�s Trends Graph display� In terms of evaluation� like LexiQuest�ClearForest has not performed formal evaluation of the ETD componentGra���
� A Survey of Emerging Trend Detection in Textual Data Mining ��
��� CONCLUSIONS AND FUTURE WORK
We have described several semi�automatic and fully�automatic ETD sys�tems� providing detailed information related to linguistic and statisticalfeatures� training and test set generation� learning algorithms� visualizationand evaluation� This review of the literature indicates that much progresshas been made toward automating the process of detecting emerging trends�but there remains room for improvement� All of the systems surveyed relyon human domain expertise to separate emerging trends from noise inthe system� As a result� research projects that focus on creating e�ectiveprocesses to both semi� and fully�automatically detect emerging trends� de�velop e�ective visualizations� and applying various learning algorithms toassist with ETD can and should continue�In addition� we discovered that few systems� whether research or commer�
cial in nature� have employed formal evaluation metrics and methodologiesto determine e�ectiveness� The development and use of metrics for evalua�tion of ETD systems is critical� The results published to date simply do notallow us to compare systems to one another� In a step designed to addressthis issue we are in the process of building the HDDITMtextual data min�ing software infrastructure that includes algorithms for formal evaluationof ETD systems �hddi�cse�lehigh�edu��Wider use of the TDT TDT data sets will also be helpful in the pro�
cess of standardizing evaluation of ETD systems� In addition� usabilitystudies need to be conducted for visualization systems� Additional trainingsets geared speci�cally toward trend detection also need to be developed�Toward this end� we have developed a back end to our CIMEL system�Section ������ that gathers data generated by students who use the ETDcomponent of CIMEL� This will aid us in developing techniques to auto�matically generate training sets for use in machine learning approaches toETD�We also note that projects tend to focus either on applying machine
learning techniques to trend detection� or on the use of visualization tech�niques� Both techniques� when used alone� have proved inadequate thusfar� Techniques that blend the use of visualization with machine learningmay hold more promise� As a result� we are extending our HDDITMsystemto include a visualization component for trend detection� Early prototypeshold promise� but� as noted above� usability studies must be conducted toprove the e�ectiveness of our approach�A �nal point� to the best of our knowledge� no formal studies have been
conducted of the �manual� processes employed by domain experts in ETD�Such a study would employ standard tools such as surveys and focus groups

� Kontostathis et al�
to develop a �manual� methodology for ETD�� We plan to pursue the execu�tion of such a study in the near term in order to de�ne a robust methodologythat can be automated using extensions of the various techniques employedin our previous work BCG���� BPK���� BPK���� BP��� PY��� PCP���PKM��� RGP���
��� INDUSTRIAL COUNTERPOINT� IS ETDUSEFUL� Dr� Daniel J� Phelps� Leader�Information Mining Group� Eastman KodakCompany
Background� The Information Mining Group at Eastman Kodak Companyhas been following developments in the text mining �eld since ����� Ini�tially� our interest was in using text mining tools to help us do a better jobof understanding the content of patents� More recently� we have expandedour interest to include mining science and technology literature� We havehad practical experience identifying suitable data sources� working withboth custom and commercial tools� and presenting information in a formthat our clients �nd useful� This background gives me a good perspectivefor commenting on the potential usefulness of Emerging Trend Detection�ETD� tools and some of the challenges that will arise in trying to use themin the corporate environment�The objective of ETD is to provide an automated alert when new devel�
opments are happening in a speci�c area of interest� It is assumed that adetected trend is an indication that some event has occurred� The personusing the ETD software will look at the data to determine the underly�ing development� Whether the development is important or not is a callof judgment that depends on the situation and the particular informationneeds of the person evaluating the data�The need to become aware of new developments in science� technology�
or business is critical to decision makers at all levels of a corporation�These people need to make better data�driven decisions as part of theirdaily work� They need data that is complete and available in a timelymanner� Traditionally� people have learned about a majority of the newdevelopments by reading various types of text documents or by gettingthe information from others who have read the documents� As the paceof new developments accelerates and the number of documents increasesexponentially� it will no longer be possible for an individual to keep up withwhat is happening by using manual processes� There is a clear need for new
�Note that in RGP��� we developed such a methodology� which has been partiallyautomated in the CIMEL system �Section ������
� A Survey of Emerging Trend Detection in Textual Data Mining ��
tools and methodologies to bring some level of automation to detect trendsand new developments� ETD tools have the potential to play an importantrole in identifying new developments for corporate decision makers� Thesetools should help make it possible to look through more data sources fornew developments and do it in less time than with current manual methods�To better understand what capabilities an ETD tool must have to be
useful� one has to look at who will be using the tool� There are three broadgroups of potential users in a corporation� The �rst group is the analystsor information professionals who work to ful�ll the information needs ofothers� The second is the individual contributors looking for informationrelevant to their own projects� The third is the managers who need to makestrategic and�or tactical decisions�Analysts work with information as the main component of their jobs�
These people work on projects speci�ed by clients� The output of a givenproject will be a report delivered to the client for use in the decision�makingprocess� Analysts are trained in information retrieval techniques� text min�ing techniques� etc�� and are familiar with the various information sourcesneeded to complete a given project� They have to be able to communicatethe results of the work in a form clients can easily use and understand�Taking time to learn new tools and methodologies is an expected part ofthe job�An ETD tool that is targeted for use by analysts can be complex� The
analysts will have to be given su�cient training to become pro�cient inits use� Because the analysts will use the tool for multiple projects� theywill learn the capabilities and limitations of the tool and be able to rec�ognize those areas where its application is appropriate� One would expecta sophisticated user interface that would allow analysts to access the rel�evant data sources� process the underlying text� and display the results ina meaningful way using computer graphics visualization techniques� Thevisualization scheme used must draw the analysts� attention to trends andallow them to drill down into the data to �nd out what developments leadto what trends� The determination of whether or not a detected trend isimportant is complicated by the fact that the analysts do not always knowwhat clients will judge to be important� Interaction between the analystsand the clients is critical to ensure the needs of the clients are met� Thisis typically an iterative process as the analysts learn more about what in�formation the clients need� and the clients �nd out what information isactually available� Once the analysis is done� the ETD tool should have theability to export information to facilitate report generation�The scientists� engineers� or business people who want to use ETD tools
to obtain project�speci�c information need a tool that is easy to learn andintuitive to use� Connecting to the appropriate data sources and processingthe data must be transparent to the users� This user group will typicallyhave limited training in the tool and will use it only occasionally� They willnot have the time to learn all the nuances of using the software� The infor�
�� Kontostathis et al�
mation that is used will be that which is delivered automatically� A simple�graphical user interface with easily interpreted graphical visualizations isrequired� These people have the advantage that they are performing thework for themselves� therefore� they can make the determination whethernewly detected trends are actually important�An ETD tool meant to be used by management personnel must automat�
ically be connected to the appropriate data sources� have an intuitive userinterface� be very easy to learn� and provide output in a consistent formatwith which the managers are comfortable� Extremely sophisticated visual�izations that are di�cult to interpret and require high levels of interactionwill not be useful in this environment� In the current corporate culture�managers do not have the time to engage in anything but the most cursorytraining in new tools� This means they will probably not be able to operatethe ETD tool e�ectively enough to complete the analysis themselves� Theyare generally more comfortable with having an analyst assemble the infor�mation and provide an executive summary� The summarized informationand the underlying data could be presented to them using a browser formatthat would allow them to look at the high�level results and then drill downinto the detail when they �nd something in which they are particularlyinterested�No matter how capable an ETD tool becomes� the quality of the output
will depend upon the quality of the input data� Because ETD tools aresupposed to identify new developments� the data processed through thetool must be current� There are several news services� like Factiva� thatsupply all types of news on a continuous basis� Currently� there are notequivalent services for fundamental science and technology information�One has to search a variety of sources to �nd the required information�The sampling frequency used to extract the data from the news feed needsto re�ect the rapidity in which things change in the area� Business and�nancial events happen much more frequently than changes in technology�One might set up the ETD tool to collect news data each day and processit to look for new trends� Since developments in science and technologyoccur at a slower pace� it might be appropriate to work in blocks of oneweek or one month� Processing information in one�year blocks is adequatefor a retrospective look at what has happened� but it is not acceptable formost decision�making situations�ETD systems will have to be customizable to meet the needs of spe�
ci�c clients� The ETD algorithms will eventually become pro�cient atdetermining when something has happened� However� whether or not thedevelopment is important depends on the needs of the person who is lookingat the data� Broadly speaking� there are two types of client pro�le informa�tion that must be obtained� The �rst is the de�nition of the area of interest�and the second de�nes what is characterized as an important developmentin that area� Traditional alerting systems handle the �rst problem by set�ting up a user pro�le containing a search query that is run on a periodic

� A Survey of Emerging Trend Detection in Textual Data Mining ��
basis against speci�ed data sources� Typically� the query is built on a trial�and�error basis by the information professional and the client� This is aniterative process� Some of the newer knowledge�management systems usetraining sets to determine the characteristics of the documents of interestand build the �query�� Each new document is checked against the targetcharacteristics and a decision is automatically made whether the docu�ment belongs to the area of interest or not� What remains to be seen iswhich approach will work best with a given ETD tool� Either process cantake a signi�cant amount of time for the client who wants the information�There is also the problem that the client�s areas of interest will expand andchange over time� Each time this happens� an existing pro�le will have tobe modi�ed or a new pro�le will have to be generated�The problem of determining what is a signi�cant event in a given area is
handled in interactive systems by having the decision makers operate thetools themselves� If the decision makers are unable or unwilling to work di�rectly with the tool� analysts will have to interview the decision makers andobtain the basic guidelines with which to work� The analysts will performthe analysis and compile a list of potentially signi�cant developments forthe decision maker�s review� It would be best if this processed informationwere presented in a browser format that would allow the decision makersto drill down into the detail underlying any development they �nd to be ofinterest�It is too early to predict the cost of a commercial ETD software system�
If it is comparable to the knowledge management and text database miningsoftware of today� it will cost tens of thousands to hundreds of thousandsof dollars� It probably will carry the same sort of fee structure as the high�end software packages available today� Vendors charge an initial licensepurchase price and require an annual maintenance fee to provide techni�cal support and updates of the software� Sometimes it is possible to buythe software individually by the �seat�� but often the vendors push to sella corporate license� If only a few people will be using the software� thenpurchasing seats makes sense� If the software is actually going to be usedacross the enterprise� then a corporate license is probably the better choice�Another cost that is often overlooked is the impact on the corporate IT in�frastructure� There can be a capital cost to purchase the high�performancehardware needed to run calculation�intensive ETD applications� Even whenthe application is run on existing in�house servers� there is usually the needto have a system administrator� and possibly a database administrator�available to keep the application up and running�To get a picture of what an ETD tool might look like in the future� it
is helpful to examine a perfect�world scenario for an executive informationsystem that would include an ETD capability� The characteristics of sucha scenario are depicted in Table �����Executive decision makers are extremely busy and want to make good�
data�driven decisions as fast as possible� This means they cannot take the
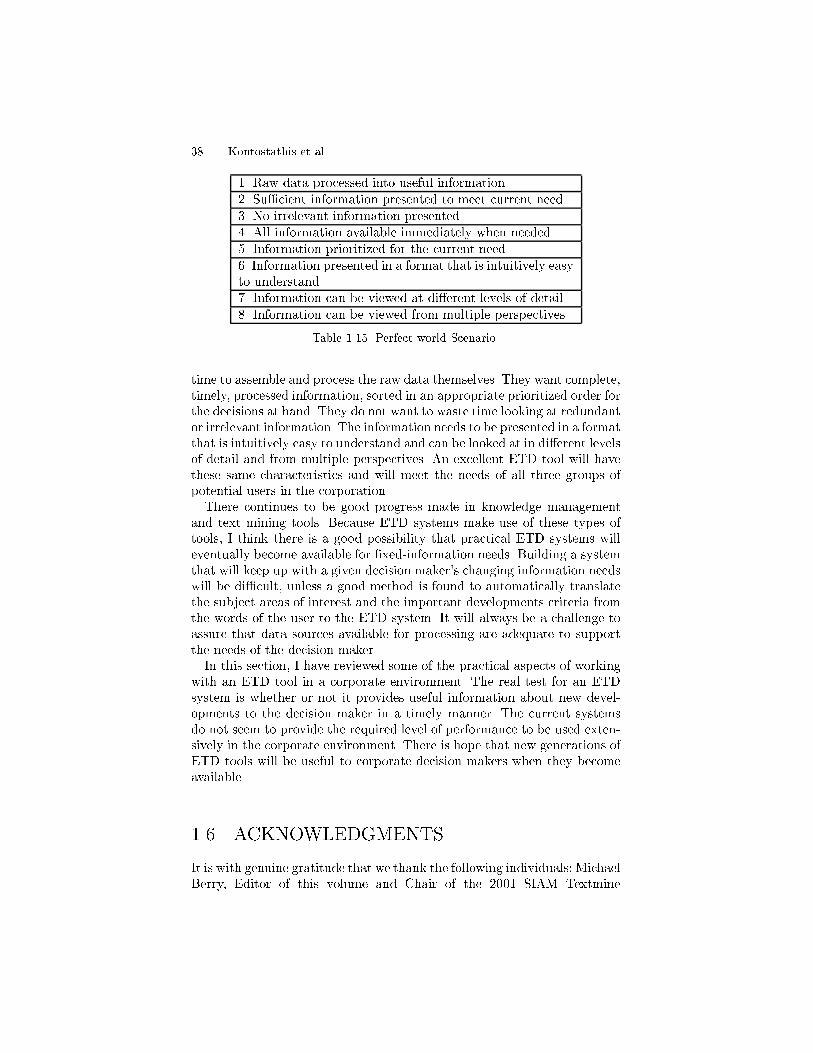
�� Kontostathis et al�
�� Raw data processed into useful information
�� Su�cient information presented to meet current need
�� No irrelevant information presented � All information available immediately when needed
�� Information prioritized for the current need
�� Information presented in a format that is intuitively easyto understand�� Information can be viewed at di�erent levels of detail
�� Information can be viewed from multiple perspectives
Table ��� Perfect�world Scenario�
time to assemble and process the raw data themselves� They want complete�timely� processed information� sorted in an appropriate prioritized order forthe decisions at hand� They do not want to waste time looking at redundantor irrelevant information� The information needs to be presented in a formatthat is intuitively easy to understand and can be looked at in di�erent levelsof detail and from multiple perspectives� An excellent ETD tool will havethese same characteristics and will meet the needs of all three groups ofpotential users in the corporation�There continues to be good progress made in knowledge management
and text mining tools� Because ETD systems make use of these types oftools� I think there is a good possibility that practical ETD systems willeventually become available for �xed�information needs� Building a systemthat will keep up with a given decision maker�s changing information needswill be di�cult� unless a good method is found to automatically translatethe subject areas of interest and the important developments criteria fromthe words of the user to the ETD system� It will always be a challenge toassure that data sources available for processing are adequate to supportthe needs of the decision maker�In this section� I have reviewed some of the practical aspects of working
with an ETD tool in a corporate environment� The real test for an ETDsystem is whether or not it provides useful information about new devel�opments to the decision maker in a timely manner� The current systemsdo not seem to provide the required level of performance to be used exten�sively in the corporate environment� There is hope that new generations ofETD tools will be useful to corporate decision makers when they becomeavailable�
�� ACKNOWLEDGMENTS
It is with genuine gratitude that we thank the following individuals� MichaelBerry� Editor of this volume and Chair of the ���� SIAM Textmine

� A Survey of Emerging Trend Detection in Textual Data Mining �
Workshop� and Doug Bryan at SPSS �LexiQuest� and Barry Graubart atClearForest for providing timely information included in our commercialproducts section� We also wish to acknowledge the National Science Foun�dation for their role in funding the CIMEL project �Section ������ and ourHDDITMtextual data mining software infrastructure HDD under GrantNumber �������� Finally� co�author William M� Pottenger would like toexpress his sincere gratitude to his Lord and Savior� Jesus Christ� for Hiscontinuing help in his life�
References
�ABC��� J� Allan� L� Ballesteros� J� Callan� W� Croft� and Z� Lu�Recent ex�periments with inquery�In Proceedings of the Fourth Text RetrievalConference �TREC���� pages ���� ��
�APL�� J� Allan� R� Papka� and V� Lavrenko�On�line new event detectionand tracking�In Proceedings of ACM SIGIR� pages ��� �� ��
�Appa� Applied Semantics�Applied Semantics �online� cited July ������Avail�able from World Wide Web� www�appliedsemantics�com�
�Appb� Applied Semantics�Autonomy �online� cited July ������Availablefrom World Wide Web� www�autonomy�com�
�APWZ�� R� Agrawal� G� Psaila� E�L� Wimmers� and M� Zait�Querying shapesof histories�In Proceedings of the ��st International Conference onVery Large Databases� Zurich� Switzerland� Sep ��
�AS�� R� Agrawal and R� Srikant�Mining sequential patterns�In Proceedingsof the International Conference on Data Engineering �ICDE�� Taipei�Taiwan� Mar ��
�Aut� Autonomy�Autonomy �online� cited July ������Available from WorldWide Web� www�autonomy�com�Content�Technology�Background�
IntellectualFoundations�
�Ban� Banter�Banter �online� cited July ������Available from World WideWeb� www�banter�com�
�BCG��� R� Bader� M� Callahan� D� Grim� J� Krause� N� Miller� and W�M�Pottenger�The Role of the HDDITMCollection Builder in HierarchicalDistributed Dynamic Indexing�In Proceedings of the Textmine ���Workshop� First SIAM International Conference on Data Mining�Apr ����
�BMSW�� D� Bikel� S� Miller� R� Schwartz� and R� Weischedel�Nymble� ahigh�performance learning name��nder�In Proceedings of the FifthConference on Applied Natural Language Processing� pages ������
�BP��� F� Bouskila and W�M� Pottenger�The Role of Semantic Local�ity in Hierarchical Distributed Dynamic Indexing�In Proceedings ofthe ���� International Conference on Articial Intelligence �IC�AI������ Las Vegas� Nevada� Jun �����

� Kontostathis et al�
�BPK��� G�D� Blank� W�M� Pottenger� G�D� Kessler� M� Herr� H� Ja�e�S� Roy� D� Gevry� and Q� Wang�Cimel� Constructive� collaborativeinquiry�based multimedia e�learning�In Proceedings of the th An�nual Conference on Innovation and Technology in Computer ScienceEducation �ITiCSE�� Jun ����
�BPK���� G�D� Blank� W�M� Pottenger� G�D� Kessler� S� Roy� D�R� Gevry�J�J� Heigl� S�A� Sahasrabudhe� and Q� Wang�Design and evalu�ation of multimedia to teach java and object�oriented softwareengineering�ASEE� Jun �����
�Bri�� E� Brill�A simple rule�based part of speech tagger�In Proceedings ofthe Third Conference on Applied Natural Language Processing� ACL���
�Bry��� D� Bryan� Jul �����Email correspondence�
�Cap� Captiva�Captiva �online� cited July ������Available fromWorld WideWeb� www�captivacorp�com�
�CC� C� Chen and L� Carr�A semantic�centric approach to informationvisualization�In Proceedings of the ���� International Conference onInformation Visualization� pages ����� �
�CIM� CIMEL�CIMEL �online� cited July ������Available from World WideWeb� www�cse�lehigh�edu��cimel�
�CL�� H� Chen and K�J� Lynch�Automatic construction of networks ofconcepts characterizing document databases�IEEE Transaction onSystems� Man and Cybernetics� ���������� ��
�Cla� S� Clarke�Knowlege Suite �Review� �online�� �cited July ������Avail�able fromWorldWideWeb� www�autonomy�com�Extranet�Marketing�AnalystWhitePapers�ButlerReportonAutonomySuite�������pdf�
�Cle� ClearForest�ClearForest �online� cited July ������Available fromWorld Wide Web� www�clearforest�com�
�Clu� ClusterizerTM �ClusterizerTM �online� cited July ������Available fromWorldWide Web� www�autonomy�com�Extranet�Technical�Modules�TBAutonomyClusterizer�pdf�
�COM� COMPENDEX r��COMPENDEX r� �online� cited July ������Avail�able from World Wide Web� edina�ac�uk�compendex�
�Del� Delphion�Delphion �online� cited July ������Available from WorldWide Web� www�delphion�com�
�DHJ��� G�S� Davidson� B� Hendrickson� D�K� Johnson� C�E� Meyers� andB�N� Wylie�Knowledge mining with VxInsightTM� Discovery throughinteraction�Journal of Intelligent Information Systems� ����������� ��
�Edg�� E� Edgington�Randomization Tests�Marcel Dekker� New York� NY���
�Fac� Factiva�Factiva �online� cited July ������Available from World WideWeb� www�factiva�com�
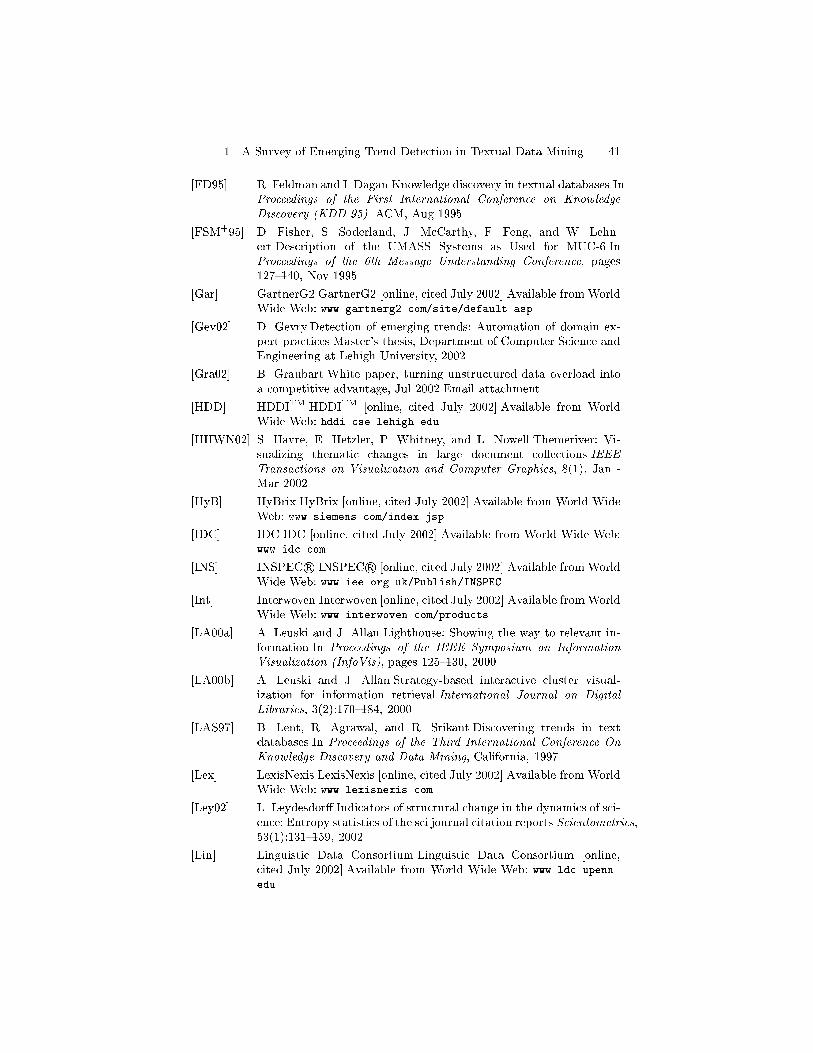
� A Survey of Emerging Trend Detection in Textual Data Mining
�FD�� R� Feldman and I� Dagan�Knowledge discovery in textual databases�InProceedings of the First International Conference on KnowledgeDiscovery �KDD����� ACM� Aug ��
�FSM��� D� Fisher� S� Soderland� J� McCarthy� F� Feng� and W� Lehn�ert�Description of the UMASS Systems as Used for MUC���InProceedings of the th Message Understanding Conference� pages��� �� Nov ��
�Gar� GartnerG��GartnerG� �online� cited July ������Available fromWorldWide Web� www�gartnerg��com�site�default�asp�
�Gev��� D� Gevry�Detection of emerging trends� Automation of domain ex�pert practices�Master�s thesis� Department of Computer Science andEngineering at Lehigh University� �����
�Gra��� B� Graubart�White paper� turning unstructured data overload intoa competitive advantage� Jul �����Email attachment�
�HDD� HDDITM�HDDITM �online� cited July ������Available from WorldWide Web� hddi�cse�lehigh�edu�
�HHWN��� S� Havre� E� Hetzler� P� Whitney� and L� Nowell�Themeriver� Vi�sualizing thematic changes in large document collections�IEEETransactions on Visualization and Computer Graphics� ���� Jan �Mar �����
�HyB� HyBrix�HyBrix �online� cited July ������Available from World WideWeb� www�siemens�com�index�jsp�
�IDC� IDC�IDC �online� cited July ������Available from World Wide Web�www�idc�com�
�INS� INSPEC r��INSPEC r� �online� cited July ������Available fromWorldWide Web� www�iee�org�uk�Publish�INSPEC�
�Int� Interwoven�Interwoven �online� cited July ������Available fromWorldWide Web� www�interwoven�com�products�
�LA��a� A� Leuski and J� Allan�Lighthouse� Showing the way to relevant in�formation�In Proceedings of the IEEE Symposium on InformationVisualization �InfoVis�� pages ������ �����
�LA��b� A� Leuski and J� Allan�Strategy�based interactive cluster visual�ization for information retrieval�International Journal on DigitalLibraries� ��������� � �����
�LAS�� B� Lent� R� Agrawal� and R� Srikant�Discovering trends in textdatabases�In Proceedings of the Third International Conference OnKnowledge Discovery and Data Mining� California� ��
�Lex� LexisNexis�LexisNexis �online� cited July ������Available from WorldWide Web� www�lexisnexis�com�
�Ley��� L� Leydesdor��Indicators of structural change in the dynamics of sci�ence� Entropy statistics of the sci journal citation reports�Scientometrics���������� �����
�Lin� Linguistic Data Consortium�Linguistic Data Consortium �online�cited July ������Available from World Wide Web� www�ldc�upenn�edu�

� Kontostathis et al�
�Loc� Lockheed�Martin�Lockheed�Martin �online� cited July ������Avail�able from World Wide Web� www�lockheedmartin�com�
�LSL���� V� Lavrenko� M� Schmill� D� Lawrie� P� Ogilvie� D� Jensen� and J� Al�lan�Mining of concurrent text and time�series�In ACM KDD�����Text Mining Workshop� �����
�MDOP�� A� Martin� T�K�G� Doddington� M� Ordowski� and M� Przybocki�Thedet curve in assessment of detection task performance�In Proceedingsof EuroSpeech� � volume � pages ������ ��
�Mor� Moreover�Moreover �online� cited July ������Available from WorldWide Web� www�moreover�com�
�NFH��� L�T� Nowell� R�K� France� D� Hix� L� S Heath� and E�A� Fox�Visualizingsearch results� Some alternatives to query�document similarity�InProceedings of SIGIR��� Zurich� ��
�Nor� Northern Light�Northern Light �online� cited July ������Availablefrom World Wide Web� www�northernlight�com�
�PCP�� W�M� Pottenger� M�R� Callahan� and M�A� Padgett�Distributed in�formation management�Annual Review of Information Science andTechnology �ARIST�� ��� ����
�PD�� A�L� Porter and M�J� Detampel�Technology opportunities analy�sis�Technological Forecasting and Social Change� ��������� ��
�PFL���� A� Popescul� G�W� Flake� S� Lawrence� L� Ungar� and C�L�Giles�Clustering and identifying temporal trends in document databases�InProceedings of IEEE Advances in Digital Libraries� �����
�PJ�� A�L� Porter and D� Jhu�Technological mapping for management oftechnology�In International Symposium on Technology� ����
�PKM�� W�M� Pottenger� Y� Kim� and D�D� Meling�HDDITM� HierarchicalDistributed Dynamic Indexing�Data Mining for Scientic and Engi�neering Applications� Robert Grossman� Chandrika Kamath� VipinKumar and Raju Namburu� Eds�� Jul ����
�PMS��� C� Plaisant� R� Mushlin� A� Snyder� J� Li� D� Heller� and B� Shneider�man�Lifelines� Using visualization to enhance navigation and analysisof patient records�In Proceedings of the ���� American MedicalInformatic Association Annual Fall Symposium� pages ������ ��
�PY�� W�M� Pottenger and T� Yang�Detecting emerging concepts in textualdata mining�Computational Information Retrieval� Michael Berry�Ed�� Aug ����
�RGP��� S� Roy� D� Gevry� and W�M� Pottenger�Methodologies for trend de�tection in textual data mining�In Proceedings of the Textmine ���Workshop� Second SIAM International Conference on Data Mining�Apr �����
�Roy��� S� Roy�A multimedia interface for emerging trend detection ininquiry�based learning�Master�s thesis� Department of ComputerScience and Engineering at Lehigh University� May �����
�SA�� R� Srikant and R� Agrawal�Mining sequential patterns� Gener�alizations and performance improvements�In Proceedings of the
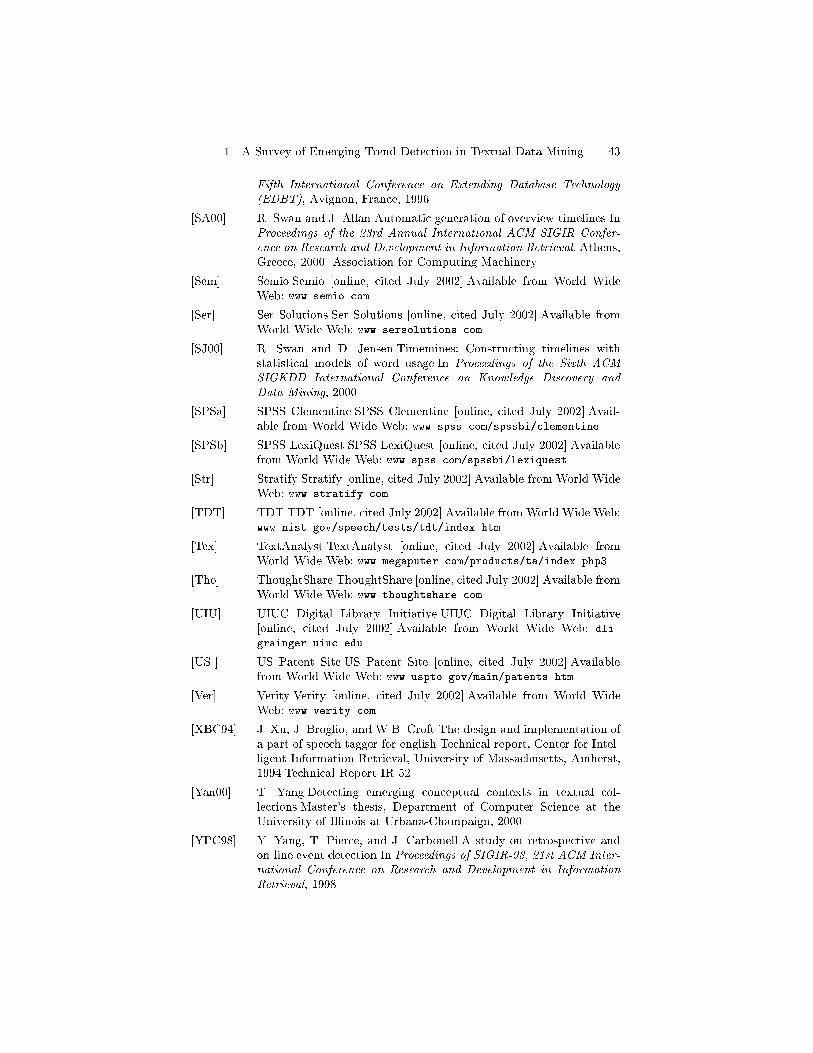
� A Survey of Emerging Trend Detection in Textual Data Mining �
Fifth International Conference on Extending Database Technology�EDBT�� Avignon� France� ��
�SA��� R� Swan and J� Allan�Automatic generation of overview timelines�InProceedings of the ��rd Annual International ACM SIGIR Confer�ence on Research and Development in Information Retrieval� Athens�Greece� ����� Association for Computing Machinery�
�Sem� Semio�Semio �online� cited July ������Available from World WideWeb� www�semio�com�
�Ser� Ser Solutions�Ser Solutions �online� cited July ������Available fromWorld Wide Web� www�sersolutions�com�
�SJ��� R� Swan and D� Jensen�Timemines� Constructing timelines withstatistical models of word usage�In Proceedings of the Sixth ACMSIGKDD International Conference on Knowledge Discovery andData Mining� �����
�SPSa� SPSS Clementine�SPSS Clementine �online� cited July ������Avail�able from World Wide Web� www�spss�com�spssbi�clementine�
�SPSb� SPSS LexiQuest�SPSS LexiQuest �online� cited July ������Availablefrom World Wide Web� www�spss�com�spssbi�lexiquest�
�Str� Stratify�Stratify �online� cited July ������Available from World WideWeb� www�stratify�com�
�TDT� TDT�TDT �online� cited July ������Available fromWorld Wide Web�www�nist�gov�speech�tests�tdt�index�htm�
�Tex� TextAnalyst�TextAnalyst �online� cited July ������Available fromWorld Wide Web� www�megaputer�com�products�ta�index�php��
�Tho� ThoughtShare�ThoughtShare �online� cited July ������Available fromWorld Wide Web� www�thoughtshare�com�
�UIU� UIUC Digital Library Initiative�UIUC Digital Library Initiative�online� cited July ������Available from World Wide Web� dli�
grainger�uiuc�edu�
�US � US Patent Site�US Patent Site �online� cited July ������Availablefrom World Wide Web� www�uspto�gov�main�patents�htm�
�Ver� Verity�Verity �online� cited July ������Available from World WideWeb� www�verity�com�
�XBC � J� Xu� J� Broglio� and W�B� Croft�The design and implementation ofa part of speech tagger for english�Technical report� Center for Intel�ligent Information Retrieval� University of Massachusetts� Amherst� �Technical Report IR����
�Yan��� T� Yang�Detecting emerging conceptual contexts in textual col�lections�Master�s thesis� Department of Computer Science at theUniversity of Illinois at Urbana�Champaign� �����
�YPC�� Y� Yang� T� Pierce� and J� Carbonell�A study on retrospective andon�line event detection�In Proceedings of SIGIR���� ��st ACM Inter�national Conference on Research and Development in InformationRetrieval� ��

Kontostathis et al�
�Zho��� L� Zhou�Machine learning classi�cation for detecting trends in tex�tual collections�Master�s thesis� Department of Computer Science atthe University of Illinois at Urbana�Champaign� December �����