a survey of energy related behaviour and perceptions in ... · a survey of energy related behaviour...
TRANSCRIPT

A Survey of Energy Related Behaviour and Perceptions in South Africa
The Residential Sector
2013
A s
urv
ey o
f en
ergy-
rela
ted
beh
avi
ou
r a
nd
per
cep
tio
ns
in S
ou
th A
fric
a
T
he R
esid
entia
l Sec
tor
2013

A Survey of Energy Related Behaviour and Perceptions in South Africa
The Residential Sector
2013

2

i
Minister’s Foreword
The delivery of energy services are extremely important since,
perhaps more than any other facet of development, energy
touches upon virtually every aspect of society. At the United
Nations Millennium Summit in September 2000, world leaders
placed development at the heart of the global agenda by adopting
the Millennium Development Goals (MDGs). The MDGs provide
concrete, time-bound objectives for dramatically reducing extreme
poverty in its many dimensions by 2015 while promoting gender
equality, education, health, and environmental sustainability. Although
none of the MDG refers to energy explicitly, improved energy services
are necessary for meeting all these goals. For instance, cooking with
coal, firewood, crop residues or dung is associated with significantly
higher child mortality rates, diminishing maternal health and general
disease burden from smoke. More and better energy service are
needed to end poverty, hunger, educational disparity between boys
and girls, the marginalization of women, major disease and health
service deficits, as well as environmental degradation.
Even though South Africa has been lauded by the international community as a successful example of sustained
political commitment to creating incentive frameworks that have led to significant expansion of electrification to all
South Africans, we cannot rest on our laurels. Since 1994 the Integrated National Electrification Programme (INEP)
has been able to connect 5.4 million households and to date about 85% of all households in South Africa have access
to electricity. From 1994 to 2011, government had successfully increased the proportions of households that have
access to energy from 30% to 85%. It is now striving to realise universal access by 2025 using a combination of grid
and non-grid technologies. This timeline is coherent with the National Development Plan.
In striving towards universal access to energy and quality services it is imperative to conduct annual residential sector
surveys, gathering information about energy related perception and behaviour in South Africa. The ultimate aim
of these surveys is to provide the Department with valuable empirical evidence that will assist the Department to
deliver on its mandate. These surveys contribute to understanding, monitoring, measuring and evaluating the impact
and progress of the department. The execution of the actual surveys provides temporary job opportunities to the
unemployed in the sampled areas and also provides training opportunities. This is done in a bid to improve people’s
chances of getting employment of a similar nature in future. The outcome and results of this survey, together with
the recommendations, are cited in detail in this report.
Mr. Dikobe Ben Martins, MP
Minister of Energy
ii

iii
Deputy Minister’s Foreword
As a developing country the effectiveness of our programmes
should not be assessed on the benefits to the most prosperous of
South Africans but should be measured by the improvement of the
quality of life among those most vulnerable. While there has been
substantial progress in servicing high income households, a significant
proportion of low income households still do not have access to
electricity. In addition, on average, South African households spend
14% of their total monthly household income on energy needs
which is higher than the international benchmark of 10% for
energy poverty. Furthermore, results show that close to half of all
South African households is energy poor. Almost three quarters
(72%) of households in the poorest quintile are energy poor. Even
high income households are suffering under the burden of higher
electricity prices with 18% of households among the richest quintile
being energy poor.
Poorer households in South Africa are carrying an enormous energy burden. Remarkable strides have been
accomplished by the Department in cushioning the poor against high energy costs. Policies such as the Free Basic
Electricity (FBE), Free Basic Alternative Energy (FBAE) and Inclined Block Tariff (IBT) have been developed and offer
welcome relief to ensure that these households do not get trapped even deeper into poverty and vulnerability.
Currently, the FBE policy allows electrified households 50kWh of electricity free of charge. Non-electrified households
benefit from the FBAE. In April 2010 the IBT was also introduced, implying that lower-consuming customers benefit
from a lower tariff rate. All of these policies are designed to assist poor households.
Going forward, as guided by this study, the Department will examine an official definition of energy poverty for
the country. This will be used as a baseline to monitor and track energy poverty levels in South Africa. Energy price
reviews are continuously being examined to ensure that households do not get further entrapped in energy poverty.
As a matter of urgency, residential energy pricing models and tariff structures will be reviewed.
We hope that this report will help the Department to further assess and assist households with the provision of
energy and will also help achieve an energy-literate South Africa, who would make well-reasoned decisions about
energy options and who would use the national resources more optimally. The outcome and results of this survey,
together with the recommendations, are cited in detail in this report.
Ms. Barbara Thompson, MP
Deputy Minister of Energy
iv
Contents
Acknowledgements xiExecutive Summary 11. Overview 71.1. Progress on Electricity Provision 71.2. Satisfaction with Electricity Provision 91.3. Pricing of Electricity 101.4. Assisting the Poor with Electricity Provision 121.5. Future Energy Needs 121.6. Energy Saving 162. Introduction 142.1. Primary Study Objectives 152.2. Structure of the Report 153. Research Methodology 173.1. The Research Universe 173.2. The Sample Design 173.3. Navigation to the Selected Areas 183.4. Data Collection Protocol 183.5. Introduction of the Project to the Communities 193.6. Selecting a Household and Individual 193.7. The Questionnaire 193.8. Training 203.9. Quality Control 203.10. Data Capturing and Cleaning 203.11. Data Weighting 214. Access to Energy 235. Household Energy Consumption and Poverty 255.1. Household Energy Sources 255.1.1. Living Standard Differences 285.1.2. Geographic Differences 295.2. Main Uses of Energy Sources 315.2.1. Main Energy Source for Lighting 315.2.2. Main Energy Source for Cooking 335.2.3. Main Energy Source for Heating Spaces and Keeping Warm 355.2.4. Main Energy Source for Operating Appliances 385.3. A Closer Examination of Multiple Energy Use 445.3.1. Lighting 445.3.2. Cooking 475.3.3. Heating Spaces and Keeping Warm 505.3.4. Heating Water for Bathing 535.3.5. Heating Water for Other Purposes 585.4. Energy Expenditure and Energy Poverty 615.4.1. Expenditure-Based Approach 625.4.2. Subjective Approach 665.4.3 Thermal Inefficiency Approach 726. Satisfaction, Quality and Pricing of Electricity 796.1. Satisfaction with the Provision of Electricity in the Neighbourhood 796.2. Quality of Electricity 826.3. Pricing of Electricity 866.4. Strategies Employed by Households to Cope with Increasing Electricity Prices 897. Energy Saving 938. Support for different energy related activities 999. Policy preferences 1019.1. Government Priorities in Supplying Electricity to the People 1019.2. Future Sources of Electricity Supply 1039.3. Government Policies 10510. Conclusion and Recommendations 10711. References 110

v
List of Tables
Table 1: Imputed Average Monthly Income for Each Living Standard Measure (LSM) Category viiiTable 2: Proportion of Population Using Solid Fuel as Primary Energy: Cooking 8Table 3: Proportion of Population Using Solid Fuel as Primary: Heating 9Table 4: Average % Electricity Price Increase 2010-2013. 12Table 5: Current Generation Capacity, New Electricity Generation Capacity and Envisaged Total by 2030 13Table 6: Sample Realisation 21Table 7: Sample Weighted to the Adult Population (16 Years and Older) and Households in South Africa 21Table 8: Access to Electricity by Select Socio-Demographic Attributes (Percentage) 24Table 9: Main Energy Source Used for Lighting, by Socioeconomic Characteristics (Cell Percent, Row Percent) 29Table 10: Households Reporting Use of Energy Source, by Geographic Location and Province (Cell Percent,
Multiple Response Table)30
Table 11: Main Energy Source Used for Lighting, by Socioeconomic Characteristics (Cell Percent, Row Percent) 32Table 12: Main Energy Source Used for Cooking, by Electrification Status (Cell Percent, Multiple Response Table) 33Table 13: Main Energy Source Used for Cooking, by Socioeconomic Characteristics (Cell Percent, Multiple
Response Table)34
Table 14: Main Energy Source Used for Heating Rooms and Keeping Warm, by Electrification Status, Living Standard and Location (Row Percent)
37
Table 15: Main Energy Source Used for Operating a Radio/Hi-Fi , by Socioeconomic Characteristics (Row Percent) 39Table 16: Main Energy Source Used for Operating a Television, by Socioeconomic Characteristics (Row Percent) 40Table 17: Main Energy Source Used for Operating Refrigerators, by Socioeconomic Characteristics (Row Percent) 41Table 18: Main Energy Source Used for Operating Irons, by Socioeconomic Characteristics (Row Percent) 43Table 19: Energy Choice for Lighting, by Electrification Status and Living Standard (Column Percent) 45Table 20: Energy Choice for Lighting, by Province (Column Percent) 46Table 21: Energy Choice for Lighting, by Geographic Location (Column Percent) 47Table 22: Energy Choice for Cooking, by Electrification Status and Living Standard (Column Percent) 48Table 23: Energy Choice for Cooking, by Province (Column Percent) 49Table 24: Energy Choice for Cooking, by Geographic Location (Column Percent) 50Table 25: Energy Choice for Heating Rooms and Keeping Warm, by Electrification Status and Living Standard
(Column Percent)51
Table 26: Energy Choice for Heating Rooms and Keeping Warm, by Province (Column Percent) 52Table 27: Energy Choice for Heating Rooms and Keeping Warm, by Geographic Location (Column Percent) 53Table 28: Energy Choice for Heating Water for Bathing Purposes, by Electrification Status and Living Standard
(Column Percent)54
Table 29: Energy Choice for Heating Water for Bathing Purposes, by Province (Column Percent) 55Table 30: Energy Choice for Heating Water for Bathing Purposes, by Geographic Location (Column Percent) 57Table 31: Energy Choice for Heating Water for Other Purposes, by Electrification Status and Living Standard
(Column Percent)59
Table 32: Energy Choice for Heating Water for Other Purposes, by Province (Column Percent) 60Table 33: Energy Choice for Heating Water for Other Purposes, by Geographic Location (Column Percent) 61Table 34: Energy Expenditure as a Percentage of Total Monthly Household Income (Mean Scores) 63Table 35: Energy Poverty Among South African Households, by Household Attributes (Percent) 65Table 36: Principal Reason Offered for Perceived Inadequacy of Available Energy to Meet Domestic Requirements,
2011-12 (Column Percent)67
Table 37: Frequency of Households Reported Having to Reduce Energy Expenditure on Specific End Uses in the Last 12 Months (Column Percent)
68
Table 38: Subjective Energy Poverty Among South African Households in 2011 and 2012, by Household Attributes (Percent)
70
Table 39: Subjective Energy Poverty Compared to the Expenditure-Based Energy Poverty Among South African Households, 2011 and 2012 (Cell Percentages)
71
Table 40: Thermal Inefficiency Among South African Households, by Household Attributes (Mean Scores) 75Table 41: Low Income and Thermal Inefficiency Among South African Households, by Household Attributes
(Mean Scores)77
Table 42: Satisfaction with the Provision of Electricity (Percentage; Mean) 81Table 43: Perception about the Quality of Electricity (Percentage; Mean) 84Table 44: Perceptions about the Pricing of Electricity (Percentage; Mean) 87Table 45: Strategies Employed to Cope with Rising Energy Prices in The Past 12 Months -Strategies Employed by
Households (Percentage)90
Table 46: Awareness and Performance Regarding the Various Energy-Saving Measures (Percentage) 96Table 47: Policy Preferences by Select Socio-Demographic Attributes (Percent) 102Table 48: Policy Preferences in Meeting South Africa’s Future Energy Needs by Select Sociodemographic Attributes 104Table 49: Policy Preferences (Percentage) 105

vi
List of Figures
Figure 1: Total Number of Households and Total Number of Electrified Households in South Africa (Millions)
7
Figure 2: Level of Satisfaction with Different Areas of Government Performance, 2003 – 2012
(% Satisfied or Very Satisfied)
10
Figure 3: Electricity Price Increase and GDP 11
Figure 4: A Graphical Representation of 500 Selected Enumeration Areas 17
Figure 5: An Example of an EA Map used to Assist the Field Teams to Navigate to the Correct Areas 18
Figure 6: Access to Electricity (Percent) 23
Figure 7: Use of Energy Sources Among South African Households, by Electrification Status (Percent Using)
26
Figure 8: Use of Energy Sources Among South African Households, by Electrification Status 2011-2012 (Percent Using)
27
Figure 9: Use of Energy Sources for Any Purpose, by Living Standard Level (Percent Using) 28
Figure 10: Use of Select Energy Sources, by Quintiles of Per Capita Monthly Income (Percent Using) 28
Figure 11: Main Energy Source for Cooking, by Living Standard Level and Quintiles of Per Capita Monthly Income (Percent Using)
33
Figure 12: Main Energy Source for Heating Spaces and Keeping Warm in 2011 and 2012, by Electrification Status (Percent Using)
36
Figure 13: Subjective Domestic Energy Adequacy in 2011 and 2012 (Percent) 67
Figure 14: Subjective Energy Poverty in 2011 and 2012, by Household Attributes (Percent) 69
Figure 15: Thermal Inefficiency of Homes, by Household Attributes (Percent) 73
Figure 16: Thermal Inefficiency of Homes 2011-12, by Dwelling Type (Percent) 74
Figure 17: Satisfaction with the Provision of Electricity in The Neighbourhood 79
Figure 18: Electricity Satisfaction Index by Select Socio-Demographic Attributes (Ranked Means Scores) 82
Figure 19: Quality of Electricity in Residential Areas 83
Figure 20: Electricity Quality Index Scores by Select Socio-Demographic Attributes (Ranked Means Scores) 85
Figure 21: Perceptions about the Pricing of Electricity 86
Figure 22: Electricity Pricing Index Scores by Select Socio-Demographic Attributes (Ranked Mean Scores) 88
Figure 23: Strategies Employed to Cope with the Current Electricity Price Increase 89
Figure 24: Strategies Employed to Cope with Future Electricity Price Hikes 91
Figure 25: Strategies Employed by Households to Cope with Future Electricity Increases by Select Socio-Demographic Attributes (Percentage)
92
Figure 26: Awareness of the Various Energy Saving Measures for 2011 and 2012 94
Figure 27: Awareness of the Different Energy-Saving Measures by Socio-Economic Attributes (Mean) 95
Figure 28: Ratio Between Awareness of an Energy-Saving Measure and Taking Action 97
Figure 29: Protesting about Electricity (Percentage) 99
Figure 30: The Protest Action Index (Ranked Mean Scores) 100
Figure 31: Policy Preferences in Terms of Government Priorities in The Supply of Electricity (Multiple Response - Percent)
101
Figure 32: Policy Preferences in Meeting South Africans’ Future Energy Needs (Percent) 103
Figure 33: Support for the Inclined Block Tarrif Structure by LSM (Percentage) 106

vii
Acronyms
49M 49 Million CampaignAgriSA Agriculture South AfricaAmps AmperesANOVA Analysis of VarianceCOSATU Congress of South African Trade UnionsCPI Consumer Price IndexCSP Concentrated Solar PowerDME Department of Minerals and EnergyEA Enumerator AreaEAI Energy Awareness Index EC Eastern CapeEPI Electricity Pricing IndexEQI Electricity Quality IndexESI Electricity Satisfaction IndexESI Electricity Supply IndustryESKOM South African Electricity Supply CompanyFBAE Free Basic Alternative EnergyFBE Free Basic ElectricityFS Free StateGDP Gross Domestic ProductGHG Greenhouse GasGP Gauteng ProvinceGW GigawattsHSRC Human Sciences Research CouncilIBT Inclined Block TariffIEA International Energy AgencyINEP Integrated National Electrification ProgrammeIPP Independent Power ProducersIRP Integrated Resource PlanKZN KwaZulu-NatalLP Limpopo ProvinceLSM Living Standard MeasurementMDG Millennium Development GoalsMP Mpumalanga ProvinceMW MegawattMYPD Multi-Year Price DeterminationNERSA National Energy Regulator of South AfricaNC Northern CapeNDP National Development PlanNW North WestPAI Protest Action IndexPV Photo-voltaicTAC Treatment Action CampaignSABRE-GEN South African Bulk Renewable Energy Generation SACP South African Communist PartySANCO South African National Civic OrganisationSASAS South African Social Attitudes SurveySECC Soweto Electricity Crisis CommitteeSHS Solar Home SystemStats SA Statistics South AfricaTAC Treatment Action CampaignTWh Terawatt hoursWC Western CapeYCL Young Communist League
viii
Concepts
DecileA decile is one tenth or 10% of a given amount or number.
Energy PovertyExpenditure-based approach: A household that spends more than 10% of their net income on energy is regarded as energy poor or in energy poverty.
Subjective approach: a household is considered energy poor if it is characterised by one or more of the following attributes: (i) the amount of energy the household uses is reported as being less than adequate for its needs; (ii) the amount of energy the household uses for lighting is reported as being less than adequate for its needs; (iii) the amount of energy the household uses for cooking is reported as being less than adequate for its needs; (iv) the amount of energy the household uses for heating rooms and keeping warm is reported as being less than adequate for its needs.
Thermal inefficiency approach: Another measure of energy poverty relies on assessments of the condition of one’s place of residence, focusing particularly on thermal comfort levels relative to social needs. In essence, this involves rating the thermal efficiency of dwelling units, since this influences the amount of energy required to heat the home to an acceptable standard and typically represents a notable determinant of domestic energy costs.
Low income and thermal inefficiency: a household is considered energy poor if it has less than 60% of South Africa’s median per capita monthly income, and meets one or more of the following conditions: (i) the household reports that it is dissatisfied or very dissatisfied with its accommodation; (ii) the state of repair of the household’s accommodation is described as “poor”; (iii) one or more of the following problems are reported with the accommodation: lack of adequate heating, a leaky roof, damp walls, floor or foundations, or damaged or broken windows or doors; (iv) the health of a household member has deteriorated due to the housing conditions.
Household Monthly Income The amount of income accruing to a household per month.
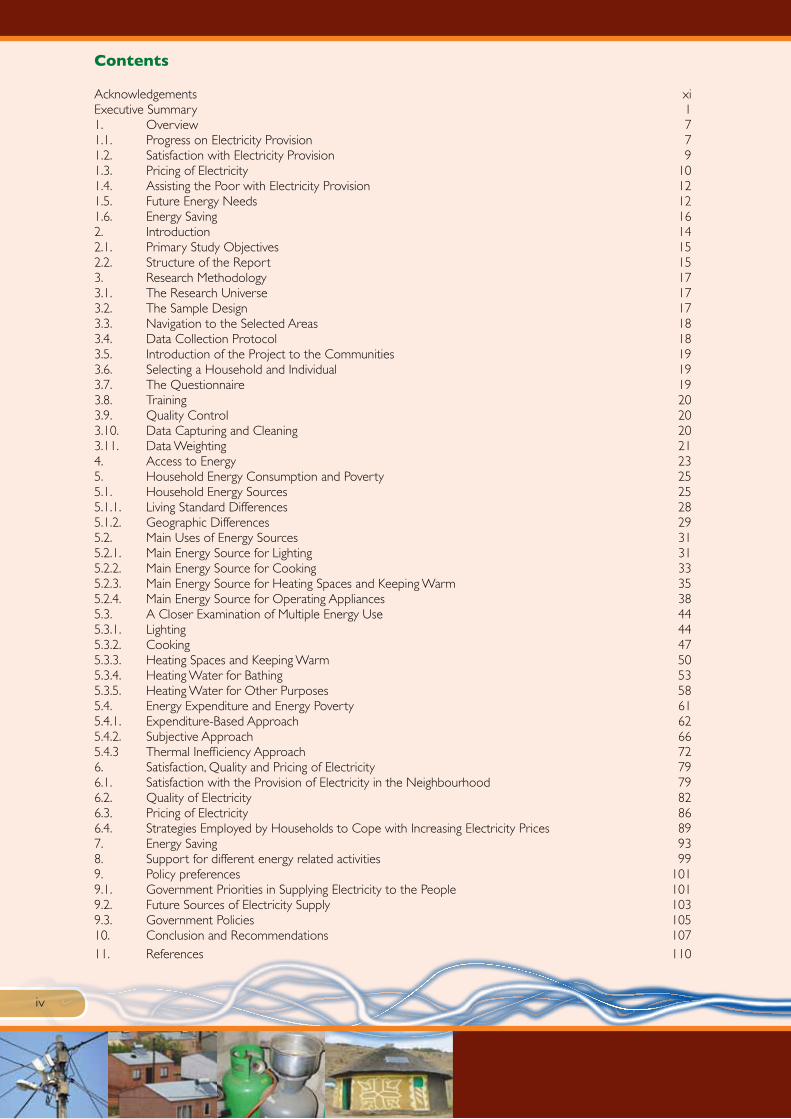
Kish GridIt is a technique/grid used in equal-probability SAMPLING for selecting cases at random when more than one case is found to be eligible for inclusion when the interviewer calls at a sampled address or household. Living Standard Measurement (LSM) A wealth indicator which uses assets or basic services to determine a living standard measure. The measurement is classified from LSM 1 to LSM 10.Low LSM: This group comprise LSM 1-LSM 3 categories.Medium LSM: This group comprise LSM 4-LSM 6 categories.High LSM: This group comprise LSM 7-LSM 10 categories.
Table 1: Imputed Average Monthly Income for Each Living Standard Measure (LSM) Category
LSM 2001/02 2003/04 2005/06 2007/08 2009 2010 2011
LSM1 R 804 R 878 R 999 R 1 080 R 1 386 R 1 448 R 1 369
LSM2 R 963 R 1 076 R 1 214 R 1 401 R 1 564 R 1 859 R 1 952
LSM3 R 1 200 R 1 412 R 1 521 R 1 795 R 2 116 R 2 153 R 2 545
LSM4 R 1 596 R 1 792 R 1 940 R 2 536 R 2 580 R 2 966 R 3 141
LSM5 R 2 239 R 2 436 R 2 681 R 3 122 R 3 627 R 3 965 R 4 200
LSM6 R 3 625 R 4 057 R 4 404 R 5 386 R 5 990 R 6 573 R 6 454
LSM7 R 5 662 R 6 437 R 6 841 R 8 677 R 9 694 R10 081 R11 022
LSM8 R 7 537 R 8 429 R 9 252 R12 337 R13 188 R13 979 R14 877
LSM9 R10 234 R11 499 R12 558 R16 296 R17 809 R18 860 R20 667
LSM10 R15 072 R18 643 R19 817 R23 054 R26 602 R28 038 R30 559
Source: Developmental Indicators (2012)

ix
Per Capita Monthly Income
The amount of money accruing to a household per month
Quintile
A quintile is one fifth or 20% of a given amount or number.
Poorest per capita quintile
The poorest quartile represents the lowest fifth of the data (1-20%).
Quintile 2 (Q2)
The second quartile represents the second fifth (21% - 40%) of the data.
Quintile 3 (Q3)
The third quartile represents the third fifth (41% - 60%) of the data.
Quintile 4 (Q4)
The fourth quartile represents the fourth fifth (61% - 80%) of the data.
Richest per capita quintile
The richest quartile represents the highest fifth (81% - 100%) of the data.
Solid Fuel
Solid fuel refers to various types of solid material that are used as fuel to produce energy and heating, usually released
through combustion (eg. firewood, coal, animal dung).
Universal household access to energy
All households to have access to modern energy sources which includes electricity and a range of renewable energy
sources while it excludes health and environmental hazardous energy sources such as paraffin, candles, firewood.
Year of Study
The 2011 results in this study refer to the 2011/2012 financial year.
The 2012 results in this study refer to the 2012/2013 financial year.
x
xi
Acknowledgements
The Department of Energy would like to express its appreciation to the following individuals who contributed to the
successful completion of this study on energy related behaviour and perceptions in South Africa:
• Ms Machwene Molomo from the Department of Energy who conceptualised and guided the project through the various phases, from inception to completion. Ms Portia Tjotola for administrative assistance and support.
• The Human Sciences Research Council (HSRC) team, consisting of Mr Benjamin Roberts and Ms Jarè Struwig, for conceptualising the study design, as well as analysing the quantitative data and drafting the report.
• The 2518 South African households who participated and made time available to answer the questions.
• The HSRC’s provincial supervisors, sub-supervisors and data collectors who traversed the country - often under difficult circumstances - to ensure that high quality information was collected from all those who were interviewed.
• Thanks are also due to Ms Anneke Jordaan of the HSRC’s Data Curation unit, who ensured that the data used for analysis was of high quality, as well as Professor Dawid Stoker for weighting the data and Ms Mercy Ngungu for all the data edits and data cleaning. Also thanks to Mr Gift Molefe the data editors and coders for coding open questions, preparing the questionnaire for data capture and also for quality control.
• The role played by the HSRC project administrator, Ms Busisiwe Mamba, who worked tirelessly to ensure that all contractual and logistical issues were in place before, during and after the survey period. Also thanks to Ms Hermien Bolton who assisted with administrative issues and Ms Koshen Govender who gave financial oversight.

xii
1
Executive Summary
The primary objective of this survey was to gather information about energy related behaviour in South Africa.
A similar survey was conducted in 2011 and the intention is that this study will become an annual study with a survey
on energy related behaviour conducted every year. This survey intended to explore multiple energy use and energy
poverty in South Africa and also explored satisfaction with electricity provisions as well as perceptions about the
quality and pricing of electricity and other energy sources. In addition, the survey gathered views on electricity-saving
strategies and policy preferences. Two thousand five hundred and eighteen South Africans participated in the survey,
a sample representative of the country’s population.
Despite the stated problems as well as some delays with universal access, the Department of Energy as the provider
of electricity is generally hailed as successful by South Africans. The South African Social Attitudes Survey (SASAS)
has been monitoring satisfaction with key services in the country since 2003 and results show that South Africans
are relatively satisfied with the provision of electricity. The provision of electricity is rated second highest,
after the provision of social grants.
For those that have access to electricity, it is mainly in the form of an in-house pre-paid meter (60%)
or an in- house convention meter (30%). Those households which do not have electricity were primarily found in
KwaZulu-Natal (15%) and Eastern Cape (19%). This finding is consistent with national figures which indicate that
these provinces have the biggest backlog. One percent indicated that they are connected to some other source
which they either pay for or don’t pay for. Speculations about the existence of illegal connections are rife but in this
survey only 1% of households reported having an illegal connection. Although there might be some underreporting
(since this is not a socially desirable response) the number of households using illegal connections to gain access to
electricity is not common. According to this finding approximately 144 501 households in South Africa therefore
have an illegal electricity connection with most of these illegal connections found in informal settlements.
Looking at household energy sources, it is evident that considerable patterns of difference exist between
electrified and non-electrified households in the range of energy sources that they employ to meet their basic
needs. Those with electricity all reported that they used this source either for lighting, cooking or heating, though
it is apparent that other sources such as candles, paraffin, firewood and gas continue to be relied upon in at least
a fifth of cases. Conversely, in the absence of a domestic connection, non-electrified households rely primarily on
candles, firewood and with more nominal shares reporting the use of coal and gas. The use of solar power is used
by approximately a tenth of electrified and non-electrified households. Dry cell batteries are used by almost a third
(31%) of non-electrified households-mostly to run appliances such as radios. Car batteries or generators hardly
feature for electrified and non-electrified households alike, being reported in fewer than 7% of cases. Socio-economic
differences continue to play a role in domestic energy use with candles, firewood and paraffin present in more than
70% of low income households whilst almost near universal access is noted in medium and high income households.
While one may not expect considerable year-on-year changes in this pattern of energy use, it is important
to compare the extent of stability and change in domestic energy consumption patterns between 2011 and 2012.
During this period, electricity usage has remained the same, but the use of candles and paraffin in both electrified and
non-electrified households decreased. This is an encouraging sign, pointing to the diminishing use of hazardous energy
sources and illustrating progress toward fulfilling development goals. However, somewhat concerning is the fact that
firewood usage (especially among non-electrified households) has increased. Although this increase might be due to
economic pressures and the fact that wood is often freely available, this is a trend that is concerning and should be
monitored. In relation to gas, coal, dry cell and car batteries as well as generator usage little observable differences
were noted. Encouraging however is the finding that, in line with the Department of Energy’s long-term priorities, use
of solar power appears to be increasing, rising from 4% of electrified households and 2% non-electrified households
in 2011 to 9% in 2012.
2
In terms of lighting, households that have been electrified almost exclusively use electricity for lighting purposes
(97%), with a marginal contingent specifying that they continue to rely on candles (1%). By contrast, three fifths of
non-electrified households (59%) rely on candles as the main source of lighting, with paraffin accounting for the
predominant energy source for this purpose in most of the remaining cases (36%). Other energy sources hardly
feature, and no single option is mentioned in more than 2% of cases. These findings are broadly similar to 2011
findings, the only exception being that for non-electrified households the use of candles for lightning decreased from
67% in 2011 to 59% in 2012, with an accompanying increase in paraffin use from 26% to 36%.
Since cooking represents one of the most energy-intensive applications it is unsurprising that more than three-
quarters (77%) of households in South Africa use electricity as the main energy source for cooking with only a
tenth of households continue to depend on firewood as a main cooking source, with marginal shares reporting use
of gas, solar electricity, paraffin and coal. For non-electrified households, firewood and paraffin predominate as the
main energy source for cooking purposes (54% and 38% respectively). As with lighting, gas, coal, solar electricity and
electricity from generators are used in a small percentage of households as the primary source to meet their cooking
needs. Again these findings are broadly similar to 2011 findings, the only exception being that for non-electrified
households the use of firewood for cooking increased from 40% in 2011 to 54% in 2012 and the use of paraffin
decreased from 50% in 2011 to 38% in 2012. Given the recent increase in paraffin prices, this finding is not at all
surprising and firewood is in all likelihood a compensation for higher paraffin prices. Although the decrease in the
use of paraffin is positive, the increased use of firewood remains a concern.
Apart from cooking, another energy-intensive thermal application is domestic space heating. On aggregate,
three fifths of South African households (60%) use an energy source to heat spaces and keep warm, with the
remainder not using energy sources but opting mainly to wear warm clothing and to use blankets. When the main
energy source for space heating was examined by electrification status, it was found that in electrified households,
45% primarily use electricity, with nominal shares reporting firewood, paraffin and other energy sources (7%, 4% and
5% respectively). A considerable share of electrified households (39%) use no energy source for heating, choosing
instead to make use of blankets, warm clothing or nothing at all. In non-electrified households, firewood is the
primary form of energy relied on for space heating, present in 29% of homes. The share using paraffin is 11%, with
‘other sources’ consisting mainly of coal (5%). More than half (53%) of non-electrified households do not make use
of any energy source to stay warm – thus rather using blankets and warm clothing. In 2011 the percentage of non-
electrified households not making use of any form of energy to heat rooms was only 36%. The increase in 2012 can
again be a function of escalating energy costs.
In terms of heating water for bathing purposes, a large proportion (80%) of households is reliant on a single
energy source with two thirds (66%) of households using some form of electrical appliance to heat water for this
purpose. In electrified households, the most common appliance used to heat water for bathing is an electric geyser
(31%) followed by and electric kettle (23%) or an electric kettle and stove (7%). Conversely, although the majority
(79%) of non-electrified households also use a single source to heat up water for bathing, the sources are mostly
exclusively firewood (46%) with about a quarter (27%) households also exclusively using paraffin. A combination of
firewood and paraffin is used by 16% of non-electrified households.
With respect to energy choices and preferences for heating water for purposes other than bathing, the
survey shows that 95% of South African households on average rely on a single energy source, with a small share
(5%) characterised by multiple energy use. In the case of electrified households, 83% use some electrical appliance to
heat water. In the case of non-electrified households, firewood is exclusively used in 52% of households followed by
a further 38% that exclusively use paraffin.
In addition to multiple energy use, the study also focused on energy poverty and provides a profile of energy
poverty among South African households using three different approaches: namely, the commonly-applied energy
3
poverty ratio based on household energy expenditure relative to income, a subjective approach, and an approach
based on the energy (thermal) efficiency of households. The profile of energy poverty using the expenditure approach,
compared with that generated by the subjective and thermal efficiency approaches provides differences in terms of
both the overall incidence of energy poverty, as well as the identification of sub-groups as energy poor.
Using the energy expenditure approach, results show that more than two-fifths (43%) of all South African
households are classified as energy poor. This result indicates a modest decline in energy poverty since 2011 when
47% of households were classified as energy poor. There is little variation based on electrification status, while material
deprivation is clearly associated with energy poverty. Around a third (34%) of high living standard households are
energy poor, compared with 38% of households with a low living standard and 50% of those with medium living
standard. As for income status, nearly three-quarters (72%) of households in the poorest quintile are energy poor,
compared to barely a fifth of households (18%) in the richest quintile. Slightly under half (48%) of households in
rural traditional authority areas are energy poor compared with a slighter lower share (40%) in formal urban areas.
Households in the Western Cape are less likely to be energy poor (27%) than those in the Eastern Cape (50%),
Gauteng (49%) and KwaZulu-Natal (48%) provinces.
Using the subjective approach, results show that a quarter of households (26%) indicated that the amount of
energy available was generally inadequate for its needs, a figure that has remained virtually unchanged since 2011
(25%). Slightly lower shares feel that the energy available for lighting is inadequate, mentioned by 23% in 2011 and
19% in 2012, while approximately a quarter of households in both years expressed the view that the energy available
for cooking was inadequate for domestic needs. Slightly higher perceived inadequacy was observed in relation to
the energy available to meet the requirements of heating rooms and keeping warm, though again this has shown a
modest decline between the rounds of interviewing. For all four indicators, less than a quarter of households suggest
that the energy available to them is more than adequate to accommodate their domestic energy requirements.
Using the low income and low energy efficiency definition, results show that 26% of households were
energy poor in 2012. This represents a modest increase from 22% in 2011. Households that are non-electrified, and
those with a lower living standard level and income status are predisposed towards being identified as energy poor.
Households in rural traditional authority areas have a considerably higher incidence of energy poverty, while those
in informal urban settlements and on rural farms are more inclined to be energy poor than those based in formal
urban areas.
The majority (67%) of South Africans were satisfied with electricity provision in their neighbourhoods, with
20% being dissatisfied. The rest were neither satisfied nor dissatisfied (12%) or unsure (1%). In order to determine
who was most likely to be satisfied or dissatisfied, an Electricity Satisfaction Index (ESI) was constructed. The average
means score for the Electricity Satisfaction Index (ESI) out of a 100 is 63.8, indicating that satisfaction with electricity
tends to lean towards the positive side. However, it is evident that satisfaction levels differ for the various socio-
demographic groups and that satisfaction with electricity has an economic gradient. People who have a low living
standard, who live on farms or in informal settlements or reside in the Free State tend to be much less satisfied with
electricity than other groups. In contrast, whites, people residing in the Western Cape, Indians/Asians, people older
than 60 years or people who have a high living standard are most satisfied with the provision of electricity.
In order to further the analysis about the provision of electricity in South Africa, an explicit question about the
quality of electricity was included. Just over half (51%) rated the quality of electricity in their area as “very
high” or “good”. A further third (30%) rated the electricity as acceptable. The rest felt the quality was either poor
(15%) or very poor (3%). The ranked mean scores from the Electricity Quality Index (EQI) indicate similar findings
to the preceding issue about satisfaction with electricity provision in the neighbourhood. Although the mean EQI
score of 60.1 out of a 100 indicates a positive skew, certain groups are generally much less satisfied with the quality
of electricity than others. Again an economic gradient is notable, with people with a low living standard or those
4
residing on farms or in urban informal areas most likely to state that their electricity is of a poor quality. By contrast,
Indians/Asians, whites, or people with a high living standard are much more likely to experience electricity of a very
high or good quality.
South Africans generally feel they pay too much for electricity. More than a third (34%) of
households felt that they pay “far too much” for what they receive, with another 38% saying they pay “too much”. Just
under a quarter (22%) felt they pay “about the right amount” for what they receive. Very few (3%) said they “pay too
little” and 3% were uncertain. In order to determine who were most inclined to feel electricity prices are too high,
an Electricity Pricing Index (EPI) was created. Free State residents, people living in urban informal areas, youngsters
aged between 16-19 years, people living in Limpopo and black Africans were least inclined than other groups to
rate the price of electricity as too high. On the other hand, Indians/Asians, whites, Coloureds and residents from the
Western and Eastern Cape as well as those with a high living standard were much more inclined to rate the price
of electricity as too high.
In order to gauge how South Africans handled the last electricity price increase, they were asked to indicate which
of the following strategies they employed to deal with the last price increase. The options were
(a) continue to use the same level of electricity and pay the extra amount for it (b) reduce the amount of electricity
used (c) use other energy sources such as paraffin, gas, coal, wood or candles (d) other strategies. The strategy
employed by most South Africans in the past year to cope with the rising electricity costs was to reduce the amount
of electricity used. Almost half of South Africans (48%) employed this strategy. A further 26% continue to use the
same level of electricity and pay the extra amount for it. Under a quarter of South Africans (22%) had to use other
energy sources to cope with increasing electricity prices, thus encouraging energy switching and energy diversification.
This trend was similar to the 2011 trend; however, in 2012 notably more households were embarking on strategies
to reduce the amount of electricity used.
A question about electricity price increases in the future revealed that 45% of South Africans would reduce
the amount of electricity used, 31% would revert to energy switching or multiple energy use, 20% would continue to
use the same levels of energy, “if electricity prices were increased tomorrow”. These results clearly show that future
energy price increases will have a bearing on the types of energies used and would encourage more energy switching.
Further analysis revealed that it was mostly households with a medium and high living standard that stated they would
reduce the amount of energy used. Energy switching was the preferred strategy for households with a low living
standard and households on farms. This trend was very similar to trends found in the 2011 survey.
In the 2011 study, respondents were given a list of energy-saving measures and asked to indicate if they were
aware of the specific measures and, if so, whether they actually implemented them. These questions were repeated in
the 2012 study and very encouraging results are noted, with awareness as well as implementing increasing significantly
between the two years. Messages pertaining to energy saving strategies have therefore definitely impacted on more
households in 2012 and have on average increased awareness by 10%. Consistent with 2011 levels, the energy-saving
measures that households are most aware of are the switching off of lights when leaving the house (89%), followed
by switching off appliances (81%) and using energy-saving light bulbs (76%). Fewer people (37%) were aware that
the installation of a solar water heater rather than an electric geyser would result in energy saving and only (28%)
were aware that the insulation of geysers and hot pipes would lead to energy saving. The energy-saving measure
that households utilise most is switching off of lights when leaving the house. Seven in ten households that are aware
of this measure actually use this energy saving measure. The national campaign of distributing and marketing energy
saving light bulbs has also had an impact, with almost 70% of all people aware of this energy saving measure actually
embarking on it. Large proportions of people (60%) also clothed themselves in warm clothes or blankets and
switched off appliances at the walls order to save electricity.

5
An Energy Awareness Index (EAI) was created and it was found that education played a critical role in predicting or
determining awareness levels of energy saving measures. People with a tertiary education were almost three times
more likely to be aware of energy saving measures than people with no schooling. A socio-economic gradient was
also noted; people with a low living standard were much less likely to be aware of energy saving measures than people
with a high living standard.
The 2012 national results indicate that there is strong opposition to illegal connections with nine in ten people
(86%) indicated that it is always wrong to steal electrical cables. A further 6% had a conditional response, saying that it
was almost always wrong. Insignificant proportions (3%) said it was not wrong at all. However, protesting about
energy services (price and access) was a much more acceptable activity and considered to be “not wrong at all”
by almost half of the population. Just under half (49%) of people felt it was not wrong at all to protest about the price
of electricity, with a fifth (20%) of respondents stating that it was “wrong only sometimes”. Just over a quarter (29%)
was of the opinion that it was mostly wrong to protest about the price of electricity. The rest (3%) were undecided
(stating “Don’t know”). Similarly, a large proportion of South Africans (44%) felt that it was acceptable to protest
about access to electricity. Slightly more than a fifth (22%) conditionally accepted protest action about access to
electricity, stating that “it was wrong only sometimes”. Conversely, 12% said it was almost always wrong and 20% said
it was always wrong. A small percentage (2%) did not have an opinion about the matter.
In terms of policy preferences of government priorities, three-quarters of all adult South Africans stated
that the priority of the Department should be to keep electricity prices low. Economic considerations outweighed
other priorities by a considerable margin. A further priority, shared by just over half of South Africans (51%), was that
the Department should help poor households by giving more free electricity. The third priority, mentioned by 46%
of the population, was that the Department should ensure that load-shedding and power cuts are minimised. These
were the top three priorities listed by South African people.
In choosing future sources for electricity generation, South Africans are clear that economic imperatives
are the most important, hence the response of 31%: “It does not matter which source, as long as it is the cheapest”.
Having said this, a sizeable 24% of South Africans also support renewable energy sources, such as solar, wind and
water, with a further 14% explicitly placing emphasis on sources that are not damaging to the environment. Economic
and environmental considerations are thus important to South Africans when considering future energy sources. Less
than a tenth supported other energy sources such as coal and oil (8%), natural gas (6%), nuclear power (7%) and
fuels made from crops (2%).
The most preferred government policy interventions at a national level were for government to give an
amount of free energy per month to all households (79%); to spend money to replace electric geysers with solar
geysers (78%); and on campaigns encouraging people to use less energy (73%). Fewer people (38%) were in favour
of the option of taxing households who use a lot of energy.

6
7
1. Overview
1.1. Progress on Electricity Provision
By most measures, South Africa’s electricity programme is remarkable. Before 1990 only a third of South Africans had
access to electricity but a decade later this figure had doubled and around two-thirds of South Africans had electricity
(Bekker, Eberhard, Gaunt & Marquard, 2008). This remarkable turnaround was achieved by policy and institutional shifts
that occurred as a result of the election of the new democratic government in 1994. One of the biggest challenges
the newly elected government had to deal with was the inequalities created by apartheid policies which benefitted
a small minority and left the majority of people neglected. The government was committed to providing the poor
with basic services such as water and energy. Modern energy sources, such as electricity was seen as one of the main
components of socio-economic development and prioritised as a basic service. Despite these commitments and
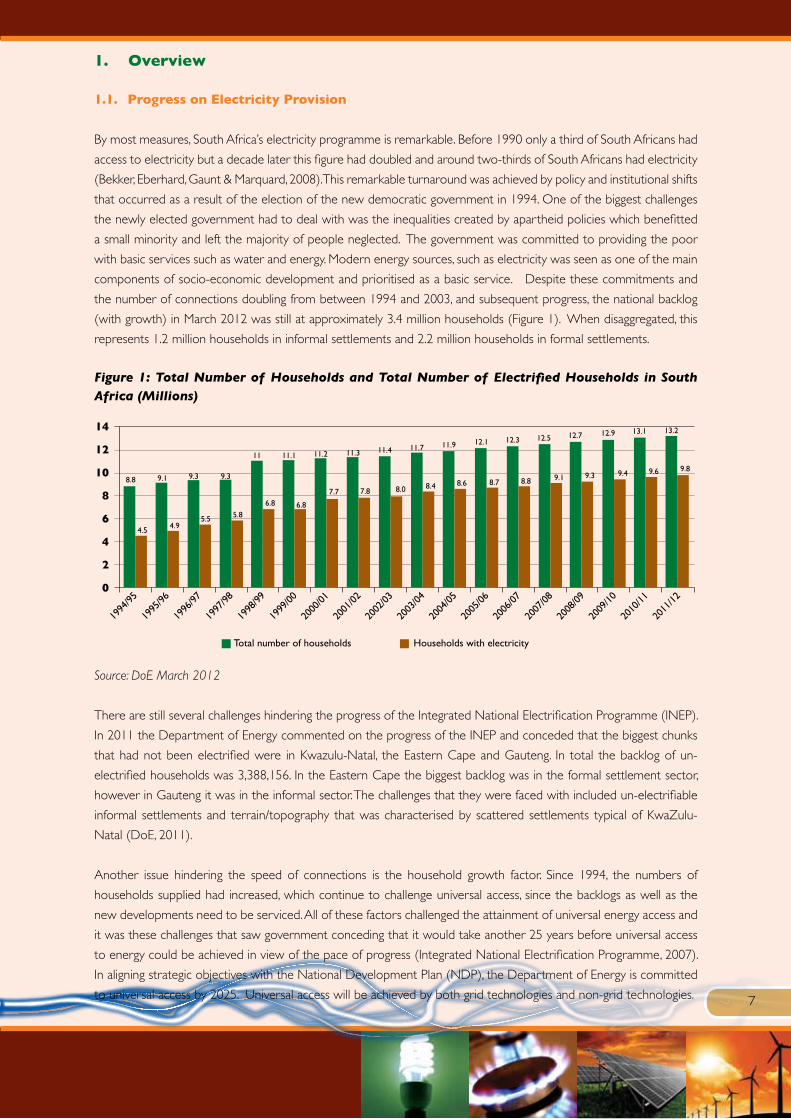
the number of connections doubling from between 1994 and 2003, and subsequent progress, the national backlog
(with growth) in March 2012 was still at approximately 3.4 million households (Figure 1). When disaggregated, this
represents 1.2 million households in informal settlements and 2.2 million households in formal settlements.
Figure 1: Total Number of Households and Total Number of Electrified Households in South Africa (Millions)
Source: DoE March 2012
There are still several challenges hindering the progress of the Integrated National Electrification Programme (INEP).
In 2011 the Department of Energy commented on the progress of the INEP and conceded that the biggest chunks
that had not been electrified were in Kwazulu-Natal, the Eastern Cape and Gauteng. In total the backlog of un-
electrified households was 3,388,156. In the Eastern Cape the biggest backlog was in the formal settlement sector,
however in Gauteng it was in the informal sector. The challenges that they were faced with included un-electrifiable
informal settlements and terrain/topography that was characterised by scattered settlements typical of KwaZulu-
Natal (DoE, 2011).
Another issue hindering the speed of connections is the household growth factor. Since 1994, the numbers of
households supplied had increased, which continue to challenge universal access, since the backlogs as well as the
new developments need to be serviced. All of these factors challenged the attainment of universal energy access and
it was these challenges that saw government conceding that it would take another 25 years before universal access
to energy could be achieved in view of the pace of progress (Integrated National Electrification Programme, 2007).
In aligning strategic objectives with the National Development Plan (NDP), the Department of Energy is committed
to universal access by 2025. Universal access will be achieved by both grid technologies and non-grid technologies.
Total number of households Households with electricity
1994
/95
1995
/96
1996
/97
1997
/98
1998
/99
1999
/00
2000
/01
2001
/02
2002
/03
2003
/04
2004
/05
2005
/06
2006
/07
2007
/08
2008
/09
2009
/10
2010
/11
2011
/12
8.8
4.5
9.1
4.9
9.3
5.5
9.3
5.8
11 11.1 11.2 11.3 11.4 11.7 11.9 12.1 12.3 12.5 12.7 12.9 13.1
9.8
6.8 6.8
7.7 7.8 8.0 8.4 8.6 8.7 8.8 9.1 9.3 9.4 9.6
13.214
12
10
8
6
4
2
0
8
At the United Nations Millennium Summit in September 2000, world leaders placed development at the heart of the
global agenda by adopting the Millennium Development Goals (MDGs). The MDGs provide concrete, time-bound
objectives for dramatically reducing extreme poverty in its many dimensions by 2015 income poverty, hunger, disease,
exclusion, and lack of infrastructure and shelter while promoting gender equality, education, health, and environmental
sustainability. Although none of the MDG refers to energy explicitly, improved energy services including modern
cooking fuels and expanded access to electricity are necessary for meeting all the goals. For instance, cooking with
coal, firewood, crop residues or dung is associated with significantly higher child mortality rates, diminishing maternal
health and general disease burden from smoke (Modi, McDade, Lallement & Saghir, 2006).
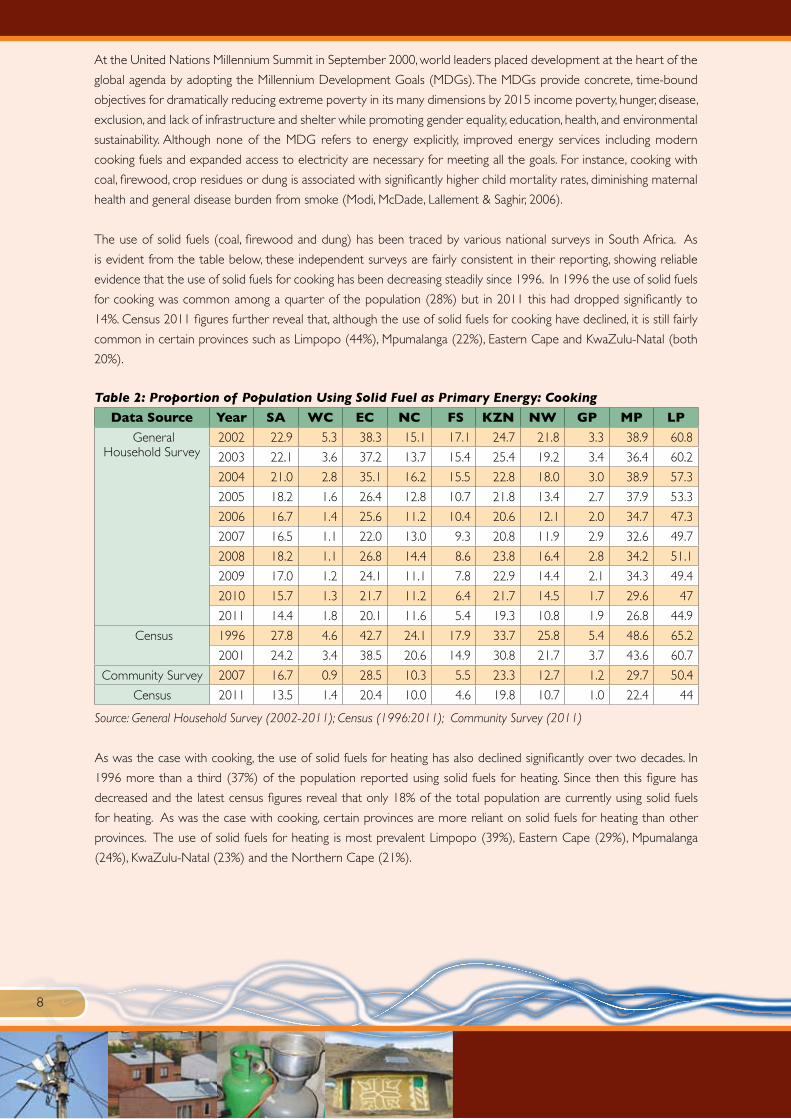
The use of solid fuels (coal, firewood and dung) has been traced by various national surveys in South Africa. As
is evident from the table below, these independent surveys are fairly consistent in their reporting, showing reliable
evidence that the use of solid fuels for cooking has been decreasing steadily since 1996. In 1996 the use of solid fuels
for cooking was common among a quarter of the population (28%) but in 2011 this had dropped significantly to
14%. Census 2011 figures further reveal that, although the use of solid fuels for cooking have declined, it is still fairly
common in certain provinces such as Limpopo (44%), Mpumalanga (22%), Eastern Cape and KwaZulu-Natal (both
20%).
Table 2: Proportion of Population Using Solid Fuel as Primary Energy: Cooking
Data Source Year SA WC EC NC FS KZN NW GP MP LP
General Household Survey
2002 22.9 5.3 38.3 15.1 17.1 24.7 21.8 3.3 38.9 60.8
2003 22.1 3.6 37.2 13.7 15.4 25.4 19.2 3.4 36.4 60.2
2004 21.0 2.8 35.1 16.2 15.5 22.8 18.0 3.0 38.9 57.3
2005 18.2 1.6 26.4 12.8 10.7 21.8 13.4 2.7 37.9 53.3
2006 16.7 1.4 25.6 11.2 10.4 20.6 12.1 2.0 34.7 47.3
2007 16.5 1.1 22.0 13.0 9.3 20.8 11.9 2.9 32.6 49.7
2008 18.2 1.1 26.8 14.4 8.6 23.8 16.4 2.8 34.2 51.1
2009 17.0 1.2 24.1 11.1 7.8 22.9 14.4 2.1 34.3 49.4
2010 15.7 1.3 21.7 11.2 6.4 21.7 14.5 1.7 29.6 47
2011 14.4 1.8 20.1 11.6 5.4 19.3 10.8 1.9 26.8 44.9
Census 1996 27.8 4.6 42.7 24.1 17.9 33.7 25.8 5.4 48.6 65.2
2001 24.2 3.4 38.5 20.6 14.9 30.8 21.7 3.7 43.6 60.7
Community Survey 2007 16.7 0.9 28.5 10.3 5.5 23.3 12.7 1.2 29.7 50.4
Census 2011 13.5 1.4 20.4 10.0 4.6 19.8 10.7 1.0 22.4 44
Source: General Household Survey (2002-2011); Census (1996:2011); Community Survey (2011)
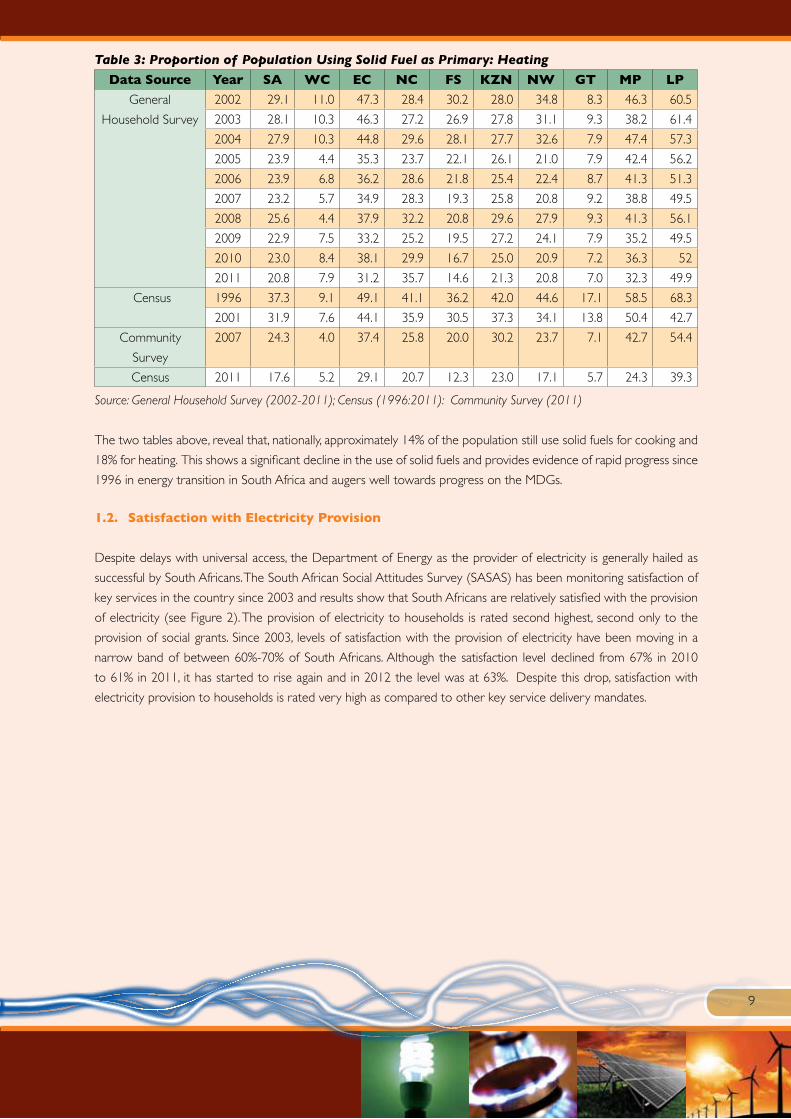
As was the case with cooking, the use of solid fuels for heating has also declined significantly over two decades. In
1996 more than a third (37%) of the population reported using solid fuels for heating. Since then this figure has
decreased and the latest census figures reveal that only 18% of the total population are currently using solid fuels
for heating. As was the case with cooking, certain provinces are more reliant on solid fuels for heating than other
provinces. The use of solid fuels for heating is most prevalent Limpopo (39%), Eastern Cape (29%), Mpumalanga
(24%), KwaZulu-Natal (23%) and the Northern Cape (21%).
9
Table 3: Proportion of Population Using Solid Fuel as Primary: Heating
Data Source Year SA WC EC NC FS KZN NW GT MP LP
General
Household Survey
2002 29.1 11.0 47.3 28.4 30.2 28.0 34.8 8.3 46.3 60.5
2003 28.1 10.3 46.3 27.2 26.9 27.8 31.1 9.3 38.2 61.4
2004 27.9 10.3 44.8 29.6 28.1 27.7 32.6 7.9 47.4 57.3
2005 23.9 4.4 35.3 23.7 22.1 26.1 21.0 7.9 42.4 56.2
2006 23.9 6.8 36.2 28.6 21.8 25.4 22.4 8.7 41.3 51.3
2007 23.2 5.7 34.9 28.3 19.3 25.8 20.8 9.2 38.8 49.5
2008 25.6 4.4 37.9 32.2 20.8 29.6 27.9 9.3 41.3 56.1
2009 22.9 7.5 33.2 25.2 19.5 27.2 24.1 7.9 35.2 49.5
2010 23.0 8.4 38.1 29.9 16.7 25.0 20.9 7.2 36.3 52
2011 20.8 7.9 31.2 35.7 14.6 21.3 20.8 7.0 32.3 49.9
Census 1996 37.3 9.1 49.1 41.1 36.2 42.0 44.6 17.1 58.5 68.3
2001 31.9 7.6 44.1 35.9 30.5 37.3 34.1 13.8 50.4 42.7
Community
Survey
2007 24.3 4.0 37.4 25.8 20.0 30.2 23.7 7.1 42.7 54.4
Census 2011 17.6 5.2 29.1 20.7 12.3 23.0 17.1 5.7 24.3 39.3
Source: General Household Survey (2002-2011); Census (1996:2011): Community Survey (2011)
The two tables above, reveal that, nationally, approximately 14% of the population still use solid fuels for cooking and
18% for heating. This shows a significant decline in the use of solid fuels and provides evidence of rapid progress since
1996 in energy transition in South Africa and augers well towards progress on the MDGs.
1.2. Satisfaction with Electricity Provision
Despite delays with universal access, the Department of Energy as the provider of electricity is generally hailed as
successful by South Africans. The South African Social Attitudes Survey (SASAS) has been monitoring satisfaction of
key services in the country since 2003 and results show that South Africans are relatively satisfied with the provision
of electricity (see Figure 2). The provision of electricity to households is rated second highest, second only to the
provision of social grants. Since 2003, levels of satisfaction with the provision of electricity have been moving in a
narrow band of between 60%-70% of South Africans. Although the satisfaction level declined from 67% in 2010
to 61% in 2011, it has started to rise again and in 2012 the level was at 63%. Despite this drop, satisfaction with
electricity provision to households is rated very high as compared to other key service delivery mandates.

10
Figure 2: Level of Satisfaction with Different Areas of Government Performance, 2003 – 2012 (% Satisfied or Very Satisfied)
Source: SASAS 2003-2012
The importance of satisfaction with service delivery becomes apparent when the article of Magidmisha, Roberts,
Gordon and Struwig (2011) is considered. The authors determined that satisfaction or dissatisfaction with service
delivery influences political attitudes. People who are dissatisfied with service delivery are generally less satisfied with
the way democracy is working in South Africa. They also found that discontent with service delivery has begun to
erode public confidence in political institutions and leaders. Given the attention devoted to service delivery protests
in recent years, they also examined the relationship between service perceptions and political behaviour. Fortunately
the finding was that discontent with service delivery has not yet translated into clearly discernible patterns of political
action such as participating in mass demonstrations. Despite this, the danger is that prolonged dissatisfaction with
services will eventually explode into public protests.
Johan Burger from the Institute for Security Studies described service delivery protests as fairly limited (Burger, 2009).
However, he maintained that should the situation of poor service delivery be allowed to continue over a prolonged
period it would have the potential to develop into a fully-fledged revolt. This statement seems to have been true, since
only two years later South Africa was named “the protest capital of the world” (Rodrigues, 2010) having one of the
highest rates of public protest in the world with the number of protests in 2010, 2011 and 2012 reaching an all-time
high. In line with commentary, results from the 2011 and 2012 survey showed that two-thirds of South Africans felt
that it was not wrong at all (44%) or wrong only sometimes (22%) to protest about access to electricity. People felt
even stronger about protesting against the price of electricity with almost three-quarters (70%) of people in both the
2011 and 2012 survey stating that it is not wrong to protest over the price of electricity. These issues are interrogated
further in the report.
1.3. Pricing of Electricity
Apart from the quality of services, cost factors also play a crucial role when it comes to accessibility and satisfaction.
One of the key mandates of the Department of Energy is to ensure the secure and sustainable provision of energy
to all. Critical for sustained provision of energy (especially to poorer households) is the cost factor. Up to 2008,
80
70
60
50
40
30
20
10
02003
Social grants Education Electricity
Water & Sanitation HIV/AIDS Treatment Affordable housing
Crime reduction Job creation
2004 2005 2006 2007 2008 2009 2010 2011 2012
11
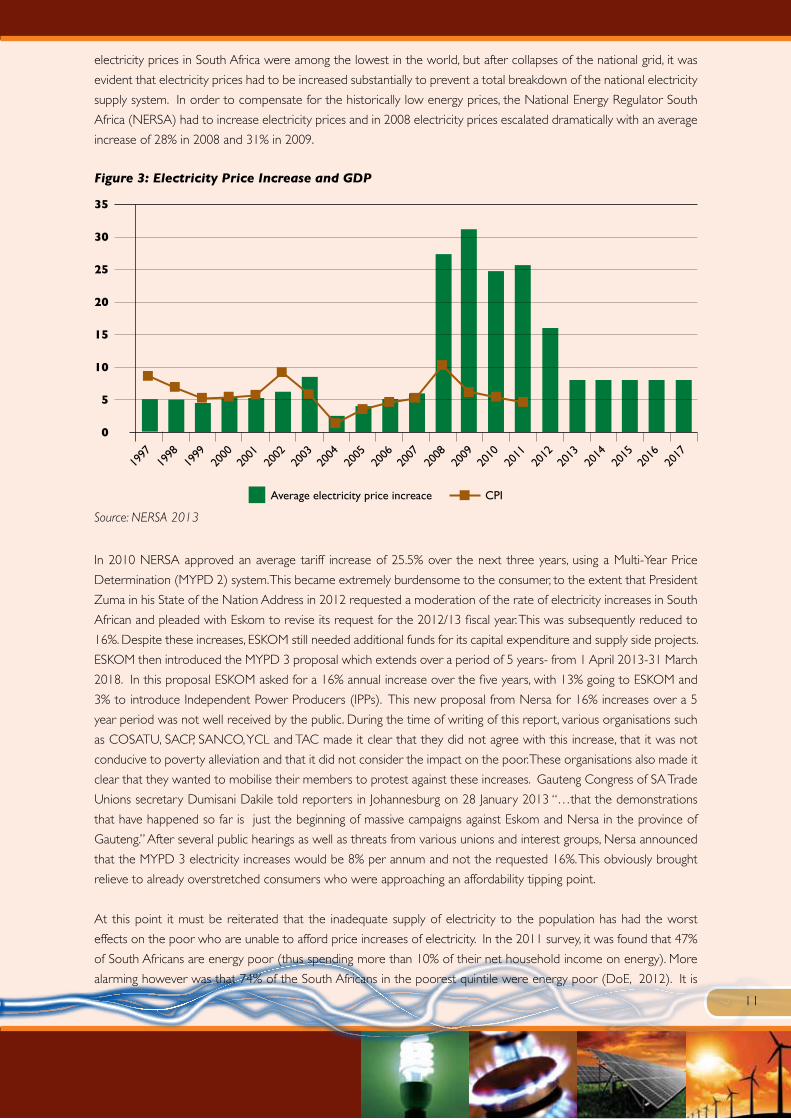
electricity prices in South Africa were among the lowest in the world, but after collapses of the national grid, it was
evident that electricity prices had to be increased substantially to prevent a total breakdown of the national electricity
supply system. In order to compensate for the historically low energy prices, the National Energy Regulator South
Africa (NERSA) had to increase electricity prices and in 2008 electricity prices escalated dramatically with an average
increase of 28% in 2008 and 31% in 2009.
Figure 3: Electricity Price Increase and GDP
Source: NERSA 2013
In 2010 NERSA approved an average tariff increase of 25.5% over the next three years, using a Multi-Year Price
Determination (MYPD 2) system. This became extremely burdensome to the consumer, to the extent that President
Zuma in his State of the Nation Address in 2012 requested a moderation of the rate of electricity increases in South
African and pleaded with Eskom to revise its request for the 2012/13 fiscal year. This was subsequently reduced to
16%. Despite these increases, ESKOM still needed additional funds for its capital expenditure and supply side projects.
ESKOM then introduced the MYPD 3 proposal which extends over a period of 5 years- from 1 April 2013-31 March
2018. In this proposal ESKOM asked for a 16% annual increase over the five years, with 13% going to ESKOM and
3% to introduce Independent Power Producers (IPPs). This new proposal from Nersa for 16% increases over a 5
year period was not well received by the public. During the time of writing of this report, various organisations such
as COSATU, SACP, SANCO, YCL and TAC made it clear that they did not agree with this increase, that it was not
conducive to poverty alleviation and that it did not consider the impact on the poor. These organisations also made it
clear that they wanted to mobilise their members to protest against these increases. Gauteng Congress of SA Trade
Unions secretary Dumisani Dakile told reporters in Johannesburg on 28 January 2013 “…that the demonstrations
that have happened so far is just the beginning of massive campaigns against Eskom and Nersa in the province of
Gauteng.” After several public hearings as well as threats from various unions and interest groups, Nersa announced
that the MYPD 3 electricity increases would be 8% per annum and not the requested 16%. This obviously brought
relieve to already overstretched consumers who were approaching an affordability tipping point.
At this point it must be reiterated that the inadequate supply of electricity to the population has had the worst
effects on the poor who are unable to afford price increases of electricity. In the 2011 survey, it was found that 47%
of South Africans are energy poor (thus spending more than 10% of their net household income on energy). More
alarming however was that 74% of the South Africans in the poorest quintile were energy poor (DoE, 2012). It is
35
30
25
20
15
10
5
0
1997
1998
1999
2000
2001
2002
2003
2004
2005
2006
2007
2008
2009
2010
2011
2012
2013
2014
2015
2016
2017
Average electricity price increace CPI
12
therefore not surprising that irate citizens are campaigning and holding the government responsible for the hardships
they endure, when their electricity is disconnected owing to their inability to pay for electricity usage.
1.4. Assisting the Poor with Electricity Provision
Having said this, it is important to acknowledge the efforts from government to assist the poor with electricity and
energy. In this respect, government has a Free Basic Electricity (FBE) policy whereby it provides 50-60 kWh of electricity
per month free to all poor South African households (DME 2003). The FBE is provided on the understanding that
people cannot live without energy, as it is a basic necessity needed for many tasks such as lighting, cooking, heating
and cooling.
In addition to the FBE policy, the Department of Minerals and Energy also introduced a Free Basic Alternative Energy
(FBAE) policy as a parallel intervention strategy specifically aimed at servicing indigent households (i.e. those who
suffer from energy poverty) in un-electrified areas. Subsidised alternative sources of energy include paraffin, liquefied
petroleum gas, coal, and bio-ethanol gel (FBAE, 2007). In assessing energy policies for a sustainable South Africa,
Winkler (2006) found that alternative energy sources such as this generated one-third of the energy consumed by
the residential sector.
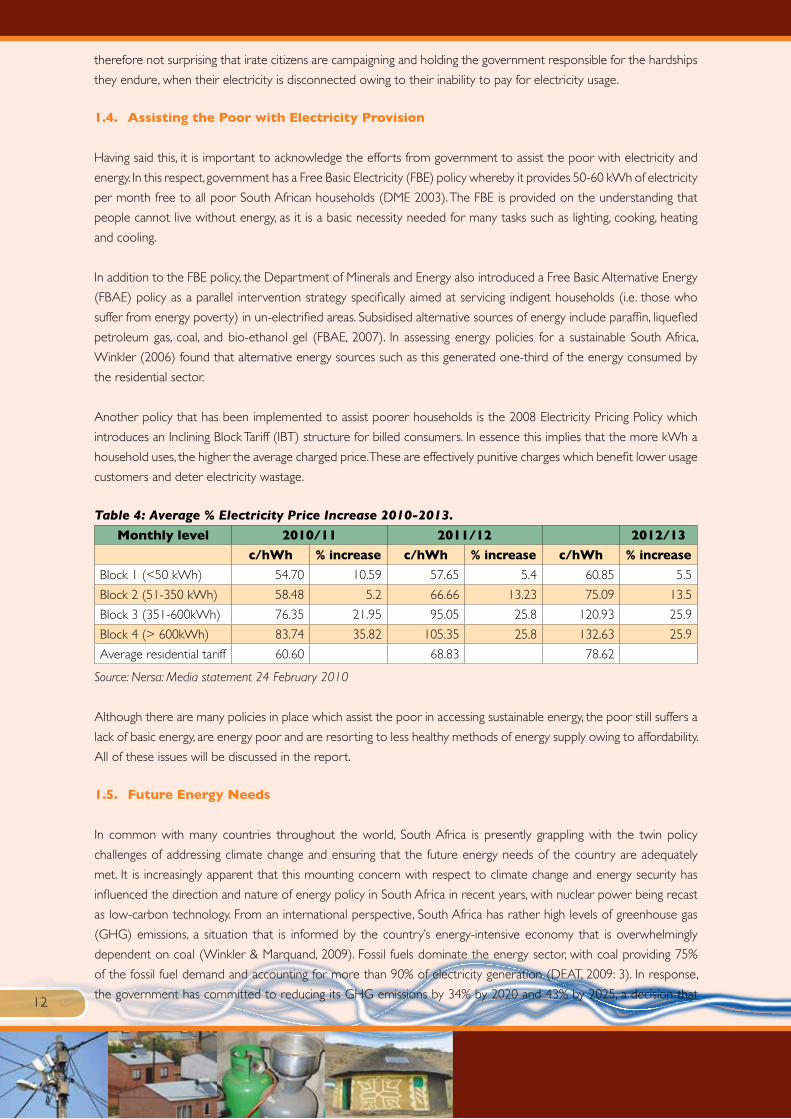
Another policy that has been implemented to assist poorer households is the 2008 Electricity Pricing Policy which
introduces an Inclining Block Tariff (IBT) structure for billed consumers. In essence this implies that the more kWh a
household uses, the higher the average charged price. These are effectively punitive charges which benefit lower usage
customers and deter electricity wastage.
Table 4: Average % Electricity Price Increase 2010-2013.
Monthly level 2010/11 2011/12 2012/13
c/hWh % increase c/hWh % increase c/hWh % increase
Block 1 (<50 kWh) 54.70 10.59 57.65 5.4 60.85 5.5
Block 2 (51-350 kWh) 58.48 5.2 66.66 13.23 75.09 13.5
Block 3 (351-600kWh) 76.35 21.95 95.05 25.8 120.93 25.9
Block 4 (> 600kWh) 83.74 35.82 105.35 25.8 132.63 25.9
Average residential tariff 60.60 68.83 78.62
Source: Nersa: Media statement 24 February 2010
Although there are many policies in place which assist the poor in accessing sustainable energy, the poor still suffers a
lack of basic energy, are energy poor and are resorting to less healthy methods of energy supply owing to affordability.
All of these issues will be discussed in the report.
1.5. Future Energy Needs
In common with many countries throughout the world, South Africa is presently grappling with the twin policy
challenges of addressing climate change and ensuring that the future energy needs of the country are adequately
met. It is increasingly apparent that this mounting concern with respect to climate change and energy security has
influenced the direction and nature of energy policy in South Africa in recent years, with nuclear power being recast
as low-carbon technology. From an international perspective, South Africa has rather high levels of greenhouse gas
(GHG) emissions, a situation that is informed by the country’s energy-intensive economy that is overwhelmingly
dependent on coal (Winkler & Marquand, 2009). Fossil fuels dominate the energy sector, with coal providing 75%
of the fossil fuel demand and accounting for more than 90% of electricity generation (DEAT, 2009: 3). In response,
the government has committed to reducing its GHG emissions by 34% by 2020 and 43% by 2025, a decision that
13
has salient implications for the energy sector. The International Energy Agency has defined energy security as ‘the
uninterrupted physical availability of energy at a price which is affordable, while respecting environmental concerns’
(IEA, 2001). Bearing this in mind, an over-reliance on coal, coupled with environmental considerations and a need for
a developmental approach in securing the energy requirements for all South Africans has resulted in a strong energy
policy emphasis on diversifying primary energy sources in coming decades.
The 1998 White Paper on Energy Policy in response listed the securing of energy supply through diversity as one of
five core policy objectives. A decade later, this priority is again reflected in the 2008 National Energy Act, which aims,
inter alia, to ‘ensure uninterrupted supply of energy’ and ‘promote diversity of supply of energy and its sources’ (DoE,
2008). This approach is found in the Department of Energy’s Integrated Electricity Resource Plan (IRP) for 2010-
2030 (DoE, 2011), which was promulgated by Cabinet in March 2011 and outlines the preferred scenario in relation
to medium- to long-term options for increasing the electricity supply and managing demand over a 20-year period
between 2010 and 2030. It is premised on estimates that electricity consumption over the interval will increase by
three-quarters from 260 terawatt hours (TWh) in 2010 to 454 terawatt hours by 2030. Similarly, peak electricity
demand is predicted to increase from 39 gigawatts (GW) to 68GW over the two decades. The Policy-Adjusted IRP
2010 scenario proposes a reduction in the share of coal in the country’s electricity generation and a corresponding
increase in the share represented by low-carbon technologies.
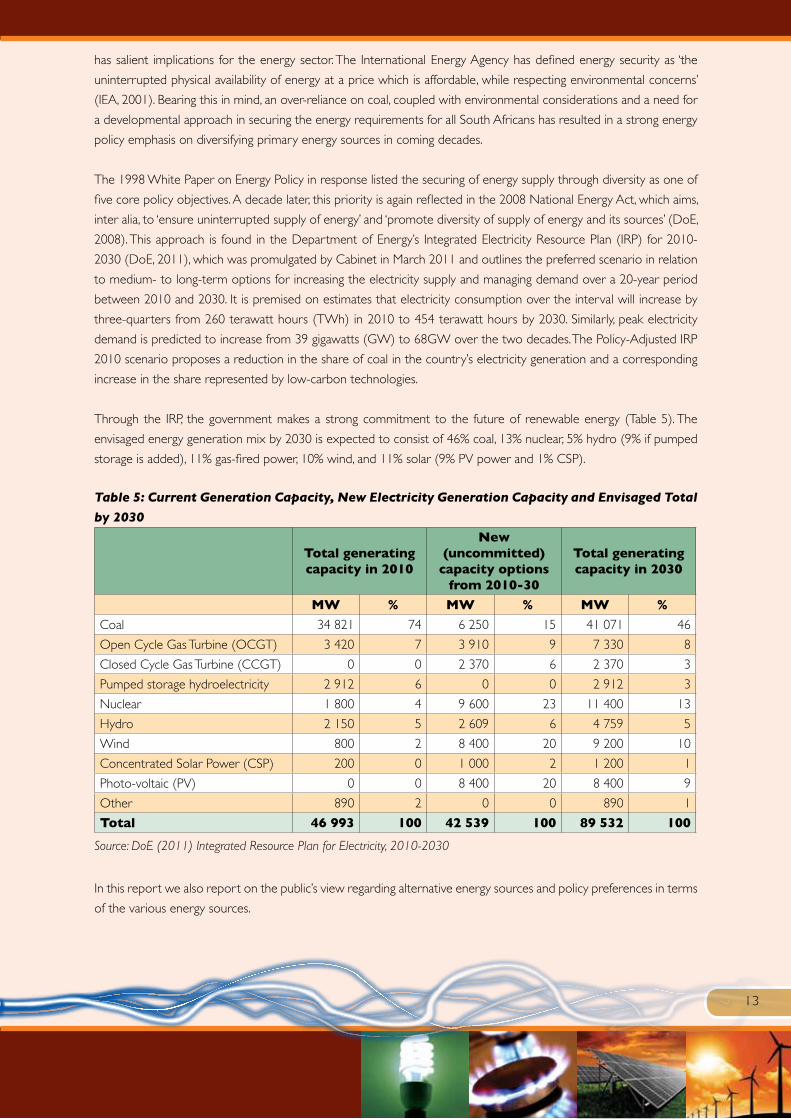
Through the IRP, the government makes a strong commitment to the future of renewable energy (Table 5). The
envisaged energy generation mix by 2030 is expected to consist of 46% coal, 13% nuclear, 5% hydro (9% if pumped
storage is added), 11% gas-fired power, 10% wind, and 11% solar (9% PV power and 1% CSP).
Table 5: Current Generation Capacity, New Electricity Generation Capacity and Envisaged Total
by 2030
Total generating capacity in 2010
New (uncommitted)
capacity options from 2010-30
Total generating capacity in 2030
MW % MW % MW %
Coal 34 821 74 6 250 15 41 071 46
Open Cycle Gas Turbine (OCGT) 3 420 7 3 910 9 7 330 8
Closed Cycle Gas Turbine (CCGT) 0 0 2 370 6 2 370 3
Pumped storage hydroelectricity 2 912 6 0 0 2 912 3
Nuclear 1 800 4 9 600 23 11 400 13
Hydro 2 150 5 2 609 6 4 759 5
Wind 800 2 8 400 20 9 200 10
Concentrated Solar Power (CSP) 200 0 1 000 2 1 200 1
Photo-voltaic (PV) 0 0 8 400 20 8 400 9
Other 890 2 0 0 890 1
Total 46 993 100 42 539 100 89 532 100
Source: DoE (2011) Integrated Resource Plan for Electricity, 2010-2030
In this report we also report on the public’s view regarding alternative energy sources and policy preferences in terms
of the various energy sources.

14
1.6. Energy Saving
As demand for electricity increased, and the national power grid became under pressure, public campaigns to promote
energy awareness increased. In a bid to decrease electricity usage, Eskom embarked on campaigns to educate society
about the importance of saving energy whenever possible. The latest drive for energy-saving tips, dubbed the “49
Million Campaign,” was launched by Deputy President, Kgalema Motlanthe, in March 2011. It calls upon all 49 million
South Africans to embrace energy-saving as a culture and to join the global movement towards ensuring a sustainable
future (website of the 49 Million Campaign). These strategies are important, targeting the demand side of the dilemma
as a short-term response, whilst supply side improvements are simultaneously pursued on a more long-term basis.
This report also determined public awareness with regards to attitudes and behaviour regarding energy saving.

15
2. Introduction
The overall objective of this survey was to gather information about energy- related behaviour and attitudes in South
Africa. This survey is similar to the baseline survey conducted in 2011 and it is envisaged that this project will become
part of the annual South African Social Attitudes Survey (SASAS) series, gathering longitudinal data on energy related
attitudes and behaviour. Longitudinal data will provide a long-term account of energy related behaviour in South
Africa, and indicate changes over time in order to guide policy and planning for energy provision towards the
residential sector.
2.1. Primary Study Objectives
The primary objective of the study was to gather information on energy-related behaviour and perceptions in South
Africa. More specifically, the survey intended to: • Determine levels of access• Explore single and multiple energy use in South Africa• Explore levels of energy poverty• Explore satisfaction with electricity provisions, perceptions about the quality of electricity and pricing of electricity • Explore views on electricity-saving strategies • Explore views on policy preferences of current and future energy issues
The ultimate aim of the study is therefore to provide the Department of Energy with valuable empirical evidence that
would assist the Department to deliver optimally on its mandate.
2.2. Structure of the Report
The first part of the report deals with the research methodology employed and discusses the research universe
and how the sample was designed. It examines the survey protocols with regards to area, household and individual
selection procedures. It gives a brief description of how the questionnaire was designed and the training that took
place prior to the data collection. Procedures employed to ensure quality control are also discussed, together with
data capturing and data cleaning measures. This is followed by a section on sample realisation and weighting of the
data. The next section (Section 4) is the first section that discusses results and specifically deals with electrification
status of households, detailing the number of households in South Africa with and without electricity. Section 5
deals with energy consumption and poverty. It discusses the energy sources that households generally use and then
minutiae the main energy sources for lighting, cooking and heating. It details single and multiple energy use, which gives
an assessment of the variety of energy sources that households use for lighting, cooking and heating. This discussion is
followed by a section on energy poverty, making use of three definitions of energy poverty: namely, energy poverty as
a percentage of spending (more than 10% of income); subjective energy poverty and energy poverty due to thermal
inefficiency. Section 6 discusses satisfaction with the provision of electricity, the quality of electricity and the pricing
of electricity. It also discusses strategies that households employ to cope with increasing electricity prices. Section 7
deals with energy saving, more specifically awareness of various energy-saving measures and also whether households
undertake any of the energy-saving measures. Section 8 is a section on civic actions that might impact on electricity
provision. We interrogate perceptions about illegal connections, protest actions about the price of electricity and
access to electricity. The last section of the report deals with policy issues and interrogates people’s perceptions
about what government’s priorities should be in supplying energy to the people, what sources of energy supply
should be considered for future supply and which government policies should be implemented to ensure that the
amount of energy used is reduced. The report ends with a last section on conclusions and recommendations.
16

17
3. Research Methodology
3.1. The Research Universe
The target population for the survey was individuals aged 16 and older who live in South Africa. Specifically, the target
population comprised people living in households, hostels and other structures. People living in special institutions
such as hospitals and prisons were excluded from the sample. The inclusion of people from these institutions would
have compromised the random selection procedure. Also, past experience has shown that access to people in these
institutions is extremely difficult, since obtaining permission can be cumbersome and complex.
3.2. The Sample Design
In order to achieve a national representative sample, the sample was designed to be representative of households
as well as people living in South Africa, 16 years and older regardless of population group, class, residential status
etc. A complex sample design was used that included stratification and multi-stage sampling procedures. The explicit
stratification variables that were used in the sample were provinces, urban/rural population and households in different
types of areas. To ensure that the sample was also representative in terms of the ethnic and cultural diversity of South
Africa, the HSRC’s geo-demographic categories, which have been developed from Statistics South Africa (Stats SA)
census data 2001 (updated in 2007 using the Community Survey), were used as the implicit stratification variable.
These geo-demographic categories reflect the diversity of the South African population based on their rural/urban,
income, education, “ethnicity” and geographic characteristics.
Figure 4: A Graphical Representation of 500 Selected Enumeration Areas
DEPARTMENT OF ENERGY SURVEY 2012
Botswana
Namibia
Zimbabwe
Mozambique
Western Cape
Eastern Cape
Free State KwaZulu-Natal
Northern Cape
Swaziland
0 50 100 200Kilometers
N
Lesotho
Nelspruit
Durban
Pietermaritzburg
North West
Bloemfontein
Bisho
Kimberley
Upington
Cape Town
Limpopo
Polokwane
Mmabatho
Pretoria
Johannesburg
Gauteng Mpumalanga
Legend Sample ESs Main Towns Provinces
300
18
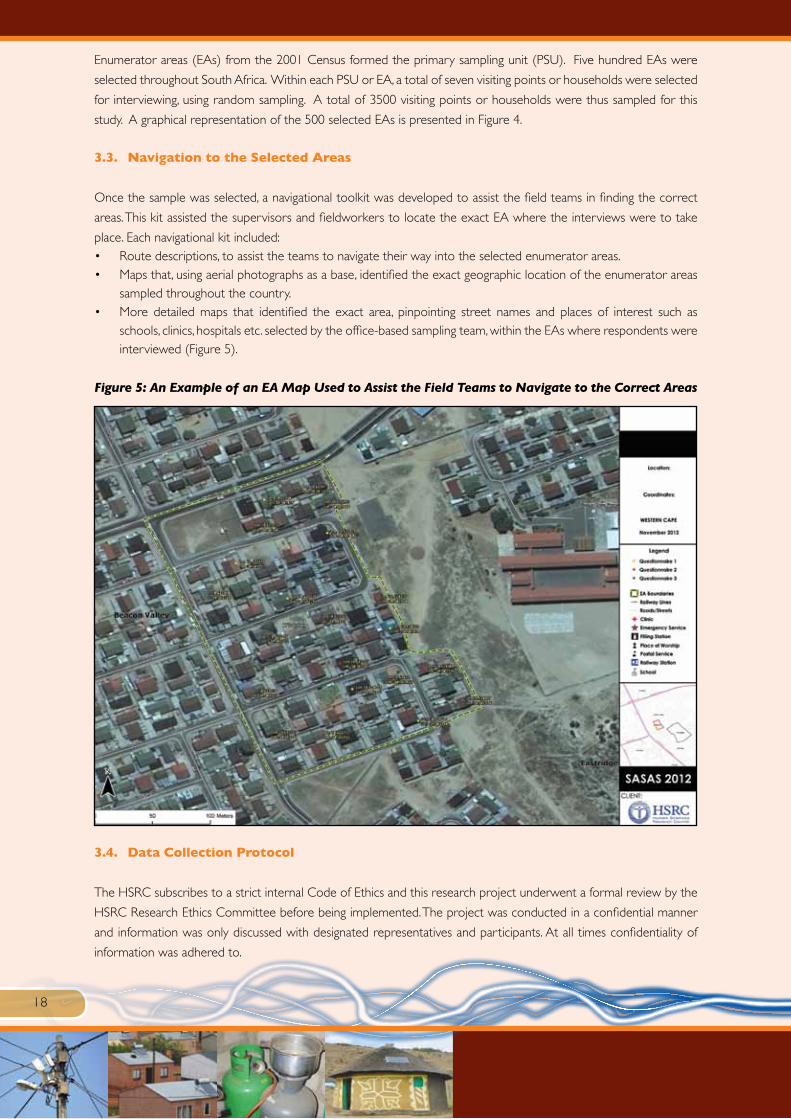
Enumerator areas (EAs) from the 2001 Census formed the primary sampling unit (PSU). Five hundred EAs were
selected throughout South Africa. Within each PSU or EA, a total of seven visiting points or households were selected
for interviewing, using random sampling. A total of 3500 visiting points or households were thus sampled for this
study. A graphical representation of the 500 selected EAs is presented in Figure 4.
3.3. Navigation to the Selected Areas
Once the sample was selected, a navigational toolkit was developed to assist the field teams in finding the correct
areas. This kit assisted the supervisors and fieldworkers to locate the exact EA where the interviews were to take
place. Each navigational kit included:• Route descriptions, to assist the teams to navigate their way into the selected enumerator areas.• Maps that, using aerial photographs as a base, identified the exact geographic location of the enumerator areas
sampled throughout the country. • More detailed maps that identified the exact area, pinpointing street names and places of interest such as
schools, clinics, hospitals etc. selected by the office-based sampling team, within the EAs where respondents were interviewed (Figure 5).
Figure 5: An Example of an EA Map Used to Assist the Field Teams to Navigate to the Correct Areas
3.4. Data Collection Protocol
The HSRC subscribes to a strict internal Code of Ethics and this research project underwent a formal review by the
HSRC Research Ethics Committee before being implemented. The project was conducted in a confidential manner
and information was only discussed with designated representatives and participants. At all times confidentiality of
information was adhered to.

19
The following general protocol guidelines for data gathering were implemented: • Fieldworkers and supervisors were required to notify the relevant local authorities that they would be working
in the specific area. The purpose was to assist with their own safety and to reassure respondents, especially the elderly or suspicious, that the survey was official.
• Supervisors were advised to inform the iNkosi or iNduna in a rural traditional authority area, whilst in urban formal or urban informal areas a visit to the local police and, if possible, the local councillor was done prior to commencing work in the area.
• Supervisors were further advised that farms should be entered with caution and that they should report to the local AgriSA offices before doing so. Field supervisors were issued with ‘Farm letters’ which contained information on the purpose of the study and contact details in case they had queries.
• Consent forms needed to be completed upon successfully finishing each interview. While verbal consent was to be secured from the respondent before beginning with the interview, a written consent form had to be signed afterwards.
• Fieldworkers were issued with name tags and letters of introduction to be used in the field. • The introduction letter was translated into different languages.• Fieldworkers and supervisors had to present their identity cards when introducing themselves.
3.5. Introduction of the Project to the Communities
Prior to starting the actual interviewing process, supervisors were instructed to visit the local police stations, iNdunas,
chiefs or other role players in the various areas to ensure that the authorities were aware of the project and to inform
the communities of their intent. Official letters describing the project and its duration and relevant ethical issues were
distributed to the authorities. This was done not only as a form of research and ethical protocol, but also to ensure
the safety of the field teams as well as to ensure buy-in from communities included in the survey.
3.6. Selecting a Household and Individual
After driving through the EA and introducing the project to the local authorities, supervisors had to identify the
selected households. The selected households were pre-selected (randomly) in the office by the GIS technician and
were clearly marked on the aerial maps with a coloured dot. Once the selected household had been identified, a
household member needed to be selected randomly as a respondent. This household member (respondent) needed
to be 16 years or older. For the purpose of this survey, the KISH grid was used to randomly select the respondent in
the household. (See Kish Grid on Page iii of the Questionnaire – Appendix A).
3.7. The Questionnaire
The first survey on energy related behaviour and attitudes was undertaken in 2011. Since the intention of this project
is longitudinal, the 2012 questionnaire had to be similar. Only a few changes were therefore made to the 2012
questionnaire. These involved eliminating questions on Free Basic Electricity (FBE) while adding questions on policy
issues. All of these changes were discussed and made in collaboration with Department of Energy. These questions
were piloted in urban, peri-urban and rural areas. Subsequent to the pilot, feedback was given to the Department of
Energy and a final questionnaire was designed. (Appendix A). A training manual was also developed that explained
difficult concepts in the questionnaire. The questionnaire was translated into six languages - namely, isiZulu, isiXhosa,
Tshivenda, Xitsonga, Setswana and Afrikaans. Fieldworkers were issued with hard copies of the translated templates
to ensure consistency of translations for the various languages.

20
3.8. Training
A two-day training session was held in the various provinces. The main training session took place in Pretoria and
covered the following provinces: namely, Gauteng, Limpopo, Mpumalanga and North West. All relevant remarks and
instructions discussed during the training session were included in the training manual. Other training sessions were
held in East London, Durban, Kimberley and Western Cape.
The training session included sessions on selection and sampling of households; fieldwork operating procedures;
research protocol; and ethical considerations. The questionnaire was discussed in detail. As far as possible, the
training was designed to be participatory, practical and interactive, and gave fieldworkers the opportunity to seek
clarification on all issues pertaining to the survey. A training manual was also developed as part of the training toolkit.
The fieldwork commenced in October 2012 and ended in December 2012. However, due to low response rates,
some field teams were send back into the field in January 2013. A network of locally-based fieldwork supervisors in
all parts of the country assisted in data collection. A total of 166 fieldworkers, 33 sub-supervisors and 11 supervisors
were employed by the HSRC as freelance employees for a period of six weeks. These fieldworkers and supervisors
had a thorough understanding of the local areas where they were deployed and could speak the local languages.
3.9. Quality Control
The Department of Energy and HSRC researchers conducted random visits to selected areas and worked with
the fieldworkers for a period of time, to ensure that they adhered to ethical research practices and that they
understood the intent of the questions in the questionnaire. Department of Energy officials and HSRC researchers
also made sure that the fieldworkers correctly selected the identified households and respondents in the household.
The researchers also checked on procedures followed in administering the research instrument. Field back checks
were also conducted in eight of the nine provinces. Telephonic back checks were done on 15% of the total sample.
3.10. Data Capturing and Cleaning
The data-capturing function was outsourced to an external company. The process was carefully monitored by the
Data Managers within the Research Use and Impact Assessment Unit of the HSRC. The HSRC required 100%
verification of the data from the data-capturing company. This meant that all variables were captured twice to ensure
100% accuracy. After receiving the data, the Data Managers embarked on a data-cleaning exercise. Data were
checked and edited for logical consistency, for permitted ranges, for reliability on derived variables and for filter
instructions. After the data-cleaning exercise, the analytical team received the realisation rates of the survey. As can
be seen from Table 6 below, a realisation rate of 72% was achieved. This realisation rate is lower than the 2011
realisation figures (86%) due to a stricter methodology that was followed in identifying households. In the 2012
survey, households were pre-selected by GIS technicians using aerial maps and field teams were not allowed to select
households randomly in the area.
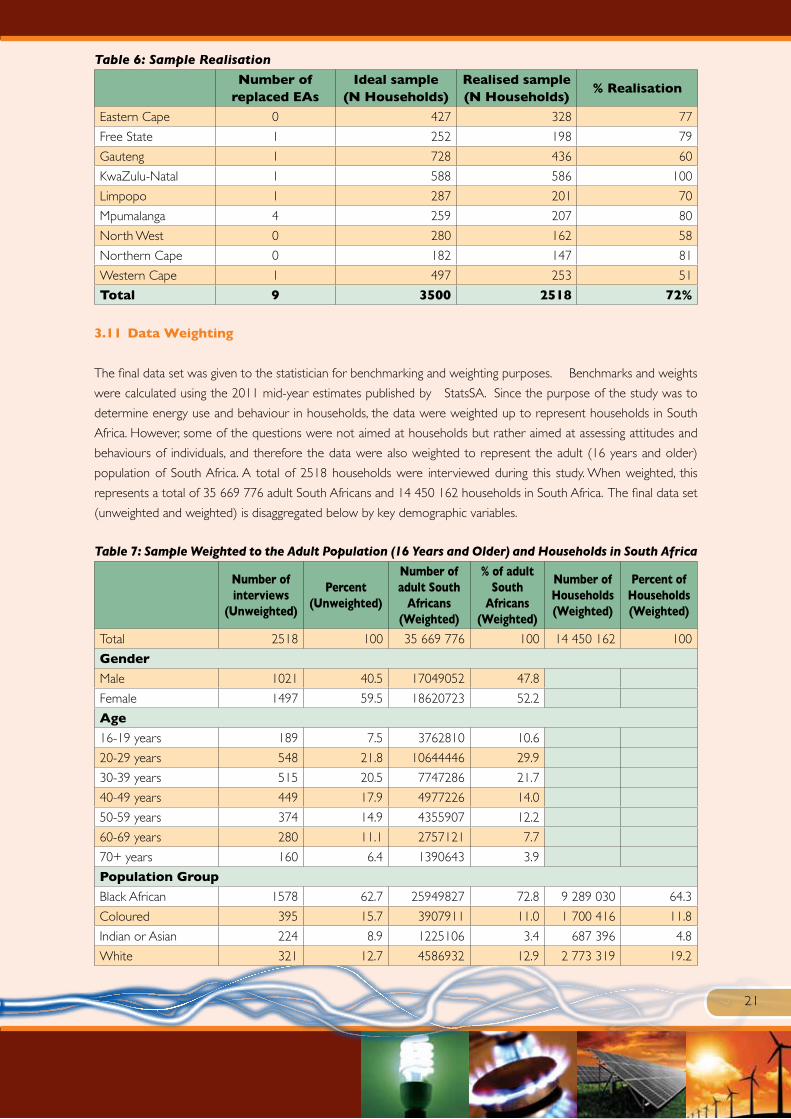
21
Table 6: Sample Realisation
Number of
replaced EAsIdeal sample
(N Households)Realised sample(N Households)
% Realisation
Eastern Cape 0 427 328 77
Free State 1 252 198 79
Gauteng 1 728 436 60
KwaZulu-Natal 1 588 586 100
Limpopo 1 287 201 70
Mpumalanga 4 259 207 80
North West 0 280 162 58
Northern Cape 0 182 147 81
Western Cape 1 497 253 51
Total 9 3500 2518 72%
3.11 Data Weighting
The final data set was given to the statistician for benchmarking and weighting purposes. Benchmarks and weights
were calculated using the 2011 mid-year estimates published by StatsSA. Since the purpose of the study was to
determine energy use and behaviour in households, the data were weighted up to represent households in South
Africa. However, some of the questions were not aimed at households but rather aimed at assessing attitudes and
behaviours of individuals, and therefore the data were also weighted to represent the adult (16 years and older)
population of South Africa. A total of 2518 households were interviewed during this study. When weighted, this
represents a total of 35 669 776 adult South Africans and 14 450 162 households in South Africa. The final data set
(unweighted and weighted) is disaggregated below by key demographic variables.
Table 7: Sample Weighted to the Adult Population (16 Years and Older) and Households in South Africa
Number of interviews
(Unweighted)
Percent(Unweighted)
Number of adult South
Africans (Weighted)
% of adult South
Africans(Weighted)
Number of Households (Weighted)
Percent of Households(Weighted)
Total 2518 100 35 669 776 100 14 450 162 100
Gender
Male 1021 40.5 17049052 47.8
Female 1497 59.5 18620723 52.2
Age
16-19 years 189 7.5 3762810 10.6
20-29 years 548 21.8 10644446 29.9
30-39 years 515 20.5 7747286 21.7
40-49 years 449 17.9 4977226 14.0
50-59 years 374 14.9 4355907 12.2
60-69 years 280 11.1 2757121 7.7
70+ years 160 6.4 1390643 3.9
Population Group
Black African 1578 62.7 25949827 72.8 9 289 030 64.3
Coloured 395 15.7 3907911 11.0 1 700 416 11.8
Indian or Asian 224 8.9 1225106 3.4 687 396 4.8
White 321 12.7 4586932 12.9 2 773 319 19.2

22
Number of interviews
(Unweighted)
Percent(Unweighted)
Number of adult South
Africans (Weighted)
% of adult South
Africans(Weighted)
Number of Households (Weighted)
Percent of Households(Weighted)
Living Standard Level
Low 200 8.8 2331268 7.2 824546 6.3
Medium 1130 49.8 16864583 52.4 6 222 715 47.9
High 939 41.4 13010287 40.4 5 938 307 45.7
Geographic location
Urban, formal 1552 61.6 20496890 57.5 8 603 041 59.5
Urban, informal 223 8.9 3309047 9.3 1 103 229 7.6
Rural trad. auth. areas 536 21.3 9485012 26.6 3 460 356 23.9
Farms 207 8.2 2378826 6.7 1 283 536 8.9
Province
Western Cape 253 10.0 4258801 11.9 1 634 000 11.3
Eastern Cape 328 13.0 4242371 11.9 1 687 385 11.7
Northern Cape 147 5.8 778203 2.2 301 405 2.1
Free State 198 7.9 1892271 5.3 823 316 5.7
KwaZulu-Natal 586 23.3 6757364 18.9 2 539 429 17.6
North West 162 6.4 2424871 6.8 1 062 015 7.3
Gauteng 436 17.3 9183009 25.7 3 909 022 27.1
Mpumalanga 207 8.2 2691813 7.5 175 488 7.4
Limpopo 201 8.0 3441072 9.6 1 418 102 9.8

23
4. Access to Energy
Access to electricity is generally seen as an important step in socio-economic development (Prasad, 2006) and many
countries, including South Africa are aiming at universal access. However, despite the huge successes and achievements
of the electrification programme in South Africa, universal access has not yet been achieved. The General Household
Survey (2011) found that 83% of households in South Africa have been electrified whilst the Census 2011 showed
a figure of 85%. These figures are fairly consistent and it can readily be assumed that over 80% of all households in
South Africa are electrified. In the 2013/2014 performance plan from the Department of Energy, it was conceded
that South Africa should have an adequate supply of electricity and liquid fuels by 2025 and that at least 95% of the
population should have access to grid and non-grid electricity by then.
In this energy related behaviour and perception survey, household members were asked if they have access to
electricity in their households. In this survey, 90% of households indicated that they have access to electricity. Access
is mainly in the form of an in-house pre-paid meter (60%) or an in- house convention meter (30%). Just under a tenth
(8%) of individuals indicated that they have no access to electricity. This electrification figure is slightly higher than the
2011 Census and General Household Survey. Large proportions of these un-electrified households were found in
Eastern Cape (19%) and KwaZulu- Natal (15%) and this finding is consistent with the national figures which indicate
that these provinces have the biggest backlog. One percent of households indicated that they are connected to
some other source for which they either pay or do not pay. Speculations about the existence of illegal connections
are rife but in this survey only 1% of households reported having an illegal connection. This is very consistent with
2011 findings where 2% illegal connections were reported. Although there might be some underreporting (since this
is not a socially desirable response), households using illegal connections to gain access to electricity is not common.
According to this finding approximately 144 501 households in South Africa therefore have an illegal electricity
connection with most of these illegal connections found in informal settlements. These illegal connections pose a
danger and can be fatal.
Figure 6: Access to Electricity (Household Percent)
Source: SASAS Energy related behaviour and perception survey (2012)
The high percentage of households that gain access to electricity via a pre-paid meter is not surprising. During the
1980s, the majority of households had conventional metering systems, but due to payment boycotts and difficulties
in collecting arrears, a pre-paid metering system was introduced and promoted, inter alia, as part of the “Electricity
for All” campaign. This campaign was successful, with the result that the majority of electrified households in South
70
60
50
40
30
20
10
011
8
30
60
In-house pre-paid meter
In-house perconventional meter
No access to electricity
Connected to other source (e.g. connected
to neighbour’s line)
Illegal connection
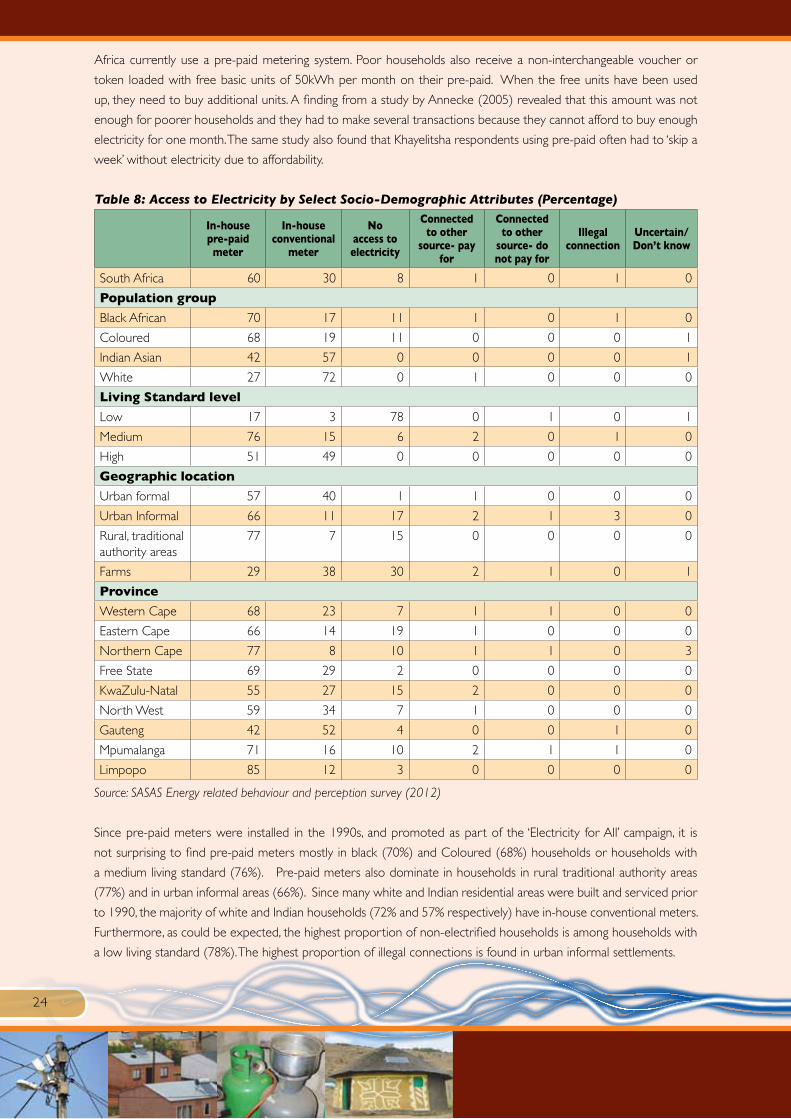
24
Africa currently use a pre-paid metering system. Poor households also receive a non-interchangeable voucher or
token loaded with free basic units of 50kWh per month on their pre-paid. When the free units have been used
up, they need to buy additional units. A finding from a study by Annecke (2005) revealed that this amount was not
enough for poorer households and they had to make several transactions because they cannot afford to buy enough
electricity for one month. The same study also found that Khayelitsha respondents using pre-paid often had to ‘skip a
week’ without electricity due to affordability.
Table 8: Access to Electricity by Select Socio-Demographic Attributes (Percentage)
In-house pre-paid
meter
In-house conventional
meter
No access to electricity
Connected to other
source- pay for
Connected to other
source- do not pay for
Illegal connection
Uncertain/ Don’t know
South Africa 60 30 8 1 0 1 0
Population group
Black African 70 17 11 1 0 1 0
Coloured 68 19 11 0 0 0 1
Indian Asian 42 57 0 0 0 0 1
White 27 72 0 1 0 0 0
Living Standard level
Low 17 3 78 0 1 0 1
Medium 76 15 6 2 0 1 0
High 51 49 0 0 0 0 0
Geographic location
Urban formal 57 40 1 1 0 0 0
Urban Informal 66 11 17 2 1 3 0
Rural, traditional authority areas
77 7 15 0 0 0 0
Farms 29 38 30 2 1 0 1
Province
Western Cape 68 23 7 1 1 0 0
Eastern Cape 66 14 19 1 0 0 0
Northern Cape 77 8 10 1 1 0 3
Free State 69 29 2 0 0 0 0
KwaZulu-Natal 55 27 15 2 0 0 0
North West 59 34 7 1 0 0 0
Gauteng 42 52 4 0 0 1 0
Mpumalanga 71 16 10 2 1 1 0
Limpopo 85 12 3 0 0 0 0
Source: SASAS Energy related behaviour and perception survey (2012)
Since pre-paid meters were installed in the 1990s, and promoted as part of the ‘Electricity for All’ campaign, it is
not surprising to find pre-paid meters mostly in black (70%) and Coloured (68%) households or households with
a medium living standard (76%). Pre-paid meters also dominate in households in rural traditional authority areas
(77%) and in urban informal areas (66%). Since many white and Indian residential areas were built and serviced prior
to 1990, the majority of white and Indian households (72% and 57% respectively) have in-house conventional meters.
Furthermore, as could be expected, the highest proportion of non-electrified households is among households with
a low living standard (78%). The highest proportion of illegal connections is found in urban informal settlements.
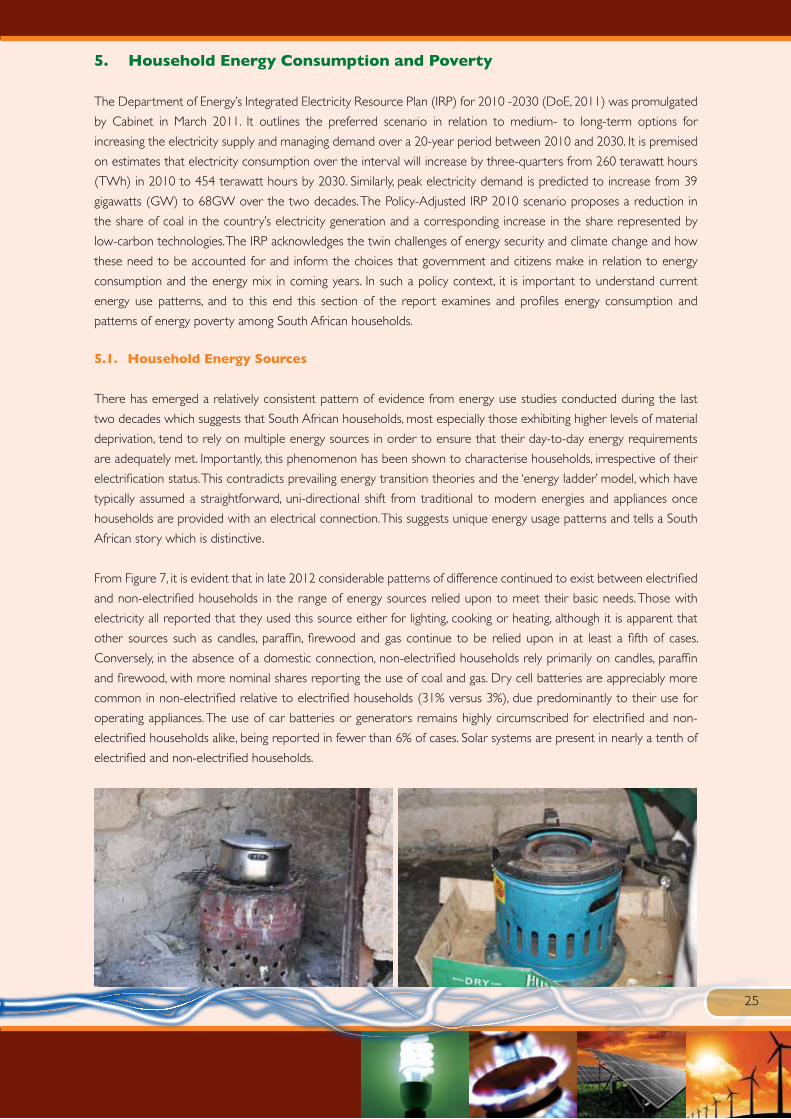
25
5. Household Energy Consumption and Poverty
The Department of Energy’s Integrated Electricity Resource Plan (IRP) for 2010 -2030 (DoE, 2011) was promulgated
by Cabinet in March 2011. It outlines the preferred scenario in relation to medium- to long-term options for
increasing the electricity supply and managing demand over a 20-year period between 2010 and 2030. It is premised
on estimates that electricity consumption over the interval will increase by three-quarters from 260 terawatt hours
(TWh) in 2010 to 454 terawatt hours by 2030. Similarly, peak electricity demand is predicted to increase from 39
gigawatts (GW) to 68GW over the two decades. The Policy-Adjusted IRP 2010 scenario proposes a reduction in
the share of coal in the country’s electricity generation and a corresponding increase in the share represented by
low-carbon technologies. The IRP acknowledges the twin challenges of energy security and climate change and how
these need to be accounted for and inform the choices that government and citizens make in relation to energy
consumption and the energy mix in coming years. In such a policy context, it is important to understand current
energy use patterns, and to this end this section of the report examines and profiles energy consumption and
patterns of energy poverty among South African households.
5.1. Household Energy Sources
There has emerged a relatively consistent pattern of evidence from energy use studies conducted during the last
two decades which suggests that South African households, most especially those exhibiting higher levels of material
deprivation, tend to rely on multiple energy sources in order to ensure that their day-to-day energy requirements
are adequately met. Importantly, this phenomenon has been shown to characterise households, irrespective of their
electrification status. This contradicts prevailing energy transition theories and the ‘energy ladder’ model, which have
typically assumed a straightforward, uni-directional shift from traditional to modern energies and appliances once
households are provided with an electrical connection. This suggests unique energy usage patterns and tells a South
African story which is distinctive.
From Figure 7, it is evident that in late 2012 considerable patterns of difference continued to exist between electrified
and non-electrified households in the range of energy sources relied upon to meet their basic needs. Those with
electricity all reported that they used this source either for lighting, cooking or heating, although it is apparent that
other sources such as candles, paraffin, firewood and gas continue to be relied upon in at least a fifth of cases.
Conversely, in the absence of a domestic connection, non-electrified households rely primarily on candles, paraffin
and firewood, with more nominal shares reporting the use of coal and gas. Dry cell batteries are appreciably more
common in non-electrified relative to electrified households (31% versus 3%), due predominantly to their use for
operating appliances. The use of car batteries or generators remains highly circumscribed for electrified and non-
electrified households alike, being reported in fewer than 6% of cases. Solar systems are present in nearly a tenth of
electrified and non-electrified households.
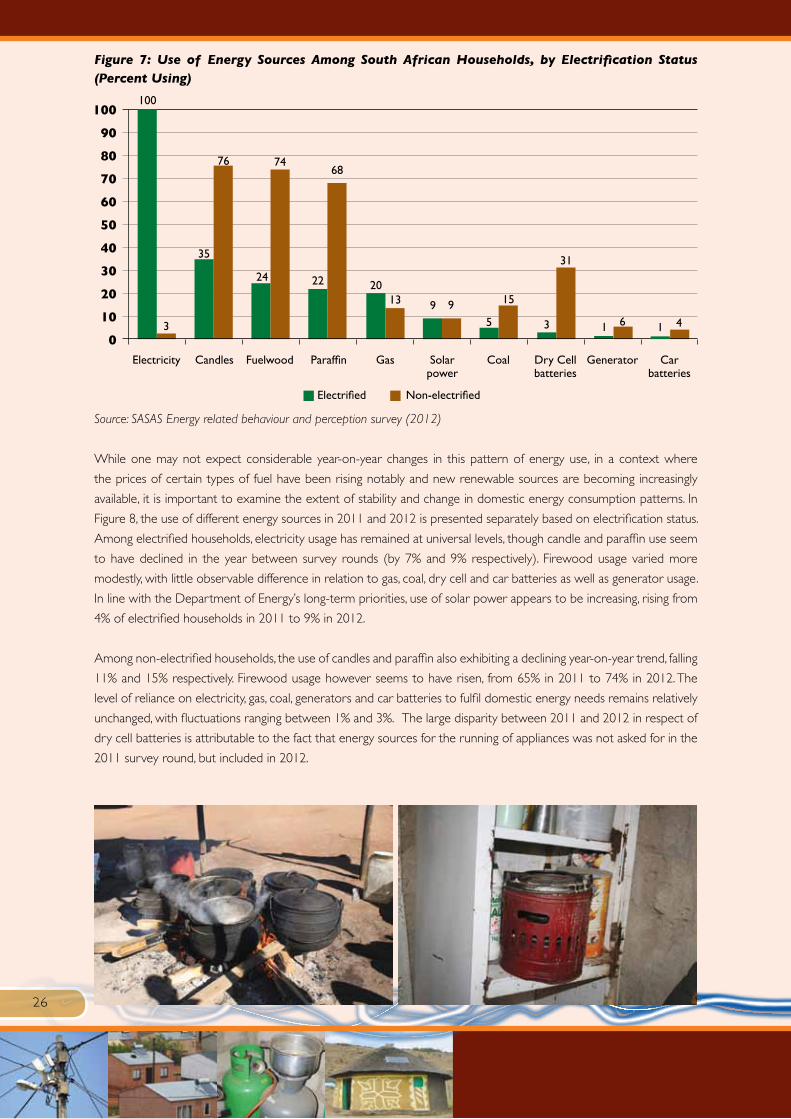
26
Figure 7: Use of Energy Sources Among South African Households, by Electrification Status (Percent Using)
Source: SASAS Energy related behaviour and perception survey (2012)
While one may not expect considerable year-on-year changes in this pattern of energy use, in a context where
the prices of certain types of fuel have been rising notably and new renewable sources are becoming increasingly
available, it is important to examine the extent of stability and change in domestic energy consumption patterns. In
Figure 8, the use of different energy sources in 2011 and 2012 is presented separately based on electrification status.
Among electrified households, electricity usage has remained at universal levels, though candle and paraffin use seem
to have declined in the year between survey rounds (by 7% and 9% respectively). Firewood usage varied more
modestly, with little observable difference in relation to gas, coal, dry cell and car batteries as well as generator usage.
In line with the Department of Energy’s long-term priorities, use of solar power appears to be increasing, rising from
4% of electrified households in 2011 to 9% in 2012.
Among non-electrified households, the use of candles and paraffin also exhibiting a declining year-on-year trend, falling
11% and 15% respectively. Firewood usage however seems to have risen, from 65% in 2011 to 74% in 2012. The
level of reliance on electricity, gas, coal, generators and car batteries to fulfil domestic energy needs remains relatively
unchanged, with fluctuations ranging between 1% and 3%. The large disparity between 2011 and 2012 in respect of
dry cell batteries is attributable to the fact that energy sources for the running of appliances was not asked for in the
2011 survey round, but included in 2012.
100
90
80
70
60
50
40
30
20
10
0
Electrified Non-electrified
100
76
35
3
74
24
68
22 2013 99 15
5
31
3 1 6 41
Electricity Candles ParaffinFuelwood Gas Coal Dry Cellbatteries
Solarpower
Generator Carbatteries
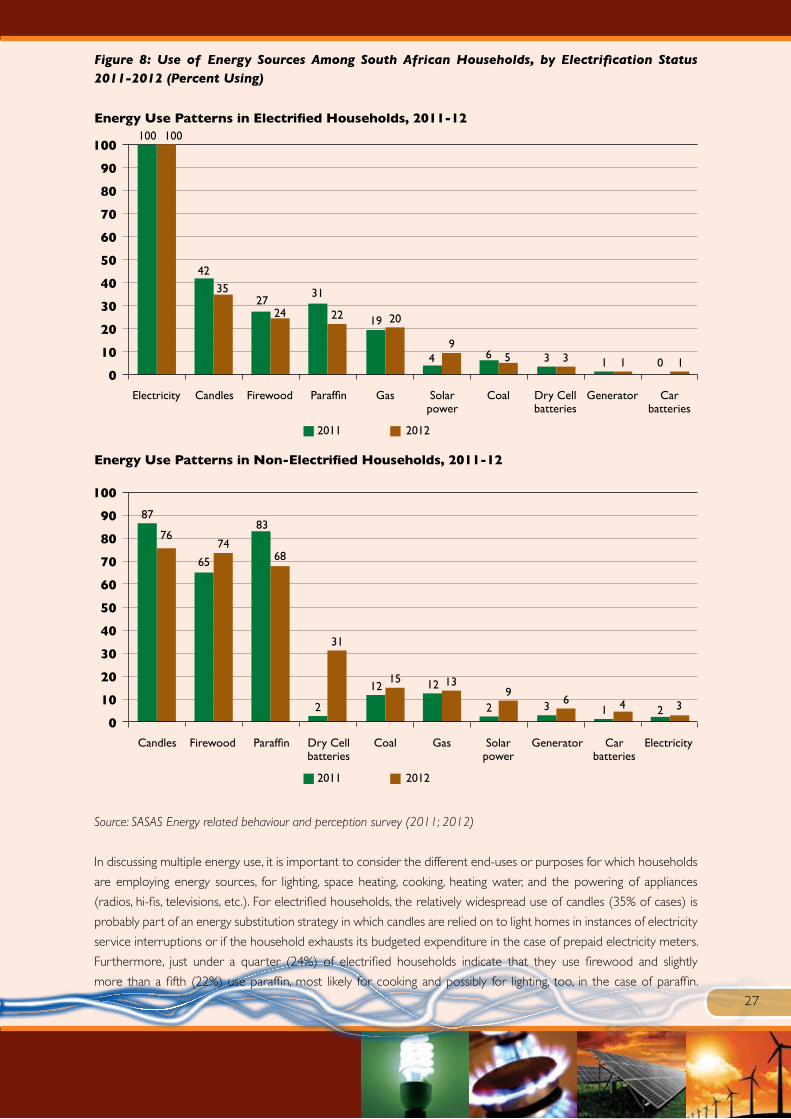
27
Figure 8: Use of Energy Sources Among South African Households, by Electrification Status 2011-2012 (Percent Using)
Energy Use Patterns in Electrified Households, 2011-12
Energy Use Patterns in Non-Electrified Households, 2011-12
Source: SASAS Energy related behaviour and perception survey (2011; 2012)
In discussing multiple energy use, it is important to consider the different end-uses or purposes for which households
are employing energy sources, for lighting, space heating, cooking, heating water, and the powering of appliances
(radios, hi-fis, televisions, etc.). For electrified households, the relatively widespread use of candles (35% of cases) is
probably part of an energy substitution strategy in which candles are relied on to light homes in instances of electricity
service interruptions or if the household exhausts its budgeted expenditure in the case of prepaid electricity meters.
Furthermore, just under a quarter (24%) of electrified households indicate that they use firewood and slightly
more than a fifth (22%) use paraffin, most likely for cooking and possibly for lighting, too, in the case of paraffin.
100
90
80
70
60
50
40
30
20
10
0
2011 2012
100
35
42
100
2427
22
31
19 20
94 56 33 1 1 10
Electricity Candles ParaffinFirewood Gas Coal Dry Cellbatteries
Solarpower
Generator Carbatteries
100
90
80
70
60
50
40
30
20
10
0
2011 2012
87
74
65
76
68
83
31
2
1215 1312
92
63 1 4 32
ElectricityCandles ParaffinFirewood GasCoalDry Cellbatteries
Solarpower
Generator Carbatteries

28
These statistics point starkly to the existence of barriers to energy-switching, a topic that is discussed in depth later
in the report. In non-electrified households, the use of candles (76%), firewood (74%) and paraffin (68%) remains
pronounced, obviously for lighting, cooking and heating. A fuller analysis of energy sources used for different end-uses
and how it varies according to location and other household characteristics will be provided later in this section of
the report.
5.1.1. Living Standard Differences
With regard to socioeconomic differences in this pattern of domestic energy use, Figure 9 reveals that marginally
more than a fifth (21%) of households with low living standards make use of electricity, compared with near-universal
usage among medium and high living standards (94% and 100% respectively). By contrast, candles, firewood and
paraffin are each present in more than two-thirds of low living standard households, and between a third and a half of
medium living standard households. From a multiple energy use perspective, it is also important to highlight that even
those with a high living standard rely on a range of energy sources other than electricity to meet their energy needs,
albeit to a lesser degree in most instances than those with greater material disadvantage.
Figure 9: Use of Energy Sources for Any Purpose, by Living Standard Level (Percent Using)
Source: SASAS Energy related behaviour and perception survey (2012)
100
90
80
70
60
50
40
30
20
10
0
Low living standard Medium living standard
21
100
24
73
46
31
76
27
37
12
11
33
571212 6
2
Electricity Candles ParaffinFirewood Gas Coal Dry Cellbatteries
Solarpower
Generator Carbatteries
94
11
68
912
31 29
35
15 3 2 4 0
High living standard

29
Table 9: Use of Energy Sources for Any Purpose, by Living Standard Level (Cell Percent, Multiple Response Table)
Low living standard Medium living standard High living standard
2011 2012 2011 2012 2011 2012
Electricity 28 21 93 94 100 100
Candles 84 73 53 46 25 24
Firewood 74 76 35 37 12 11
Paraffin 71 68 42 33 15 11
Gas 10 9 13 12 28 31
Solar power 3 7 3 5 4 12
Coal 11 12 8 6 4 5
Dry cell batteries 0 29 3 3 5 5
Generator 1 3 1 2 3 1
Car batteries 0 4 0 2 0 0
Source: SASAS Energy related behaviour and perception survey (2011; 2012)
Figure 10: Use of Select Energy Sources, by Quintiles of Per Capita Monthly Income (Percent Using)
Source: SASAS Energy related behaviour and perception survey (2012)
5.1.2. Geographic Differences
Another well-established trait of energy consumption patterns in the country pertains to the salience of the geographic
location of households. Traditionally, three factors have proven especially significant: namely, rural-urban location,
climatic conditions and the associated space heating requirements in winter months, and proximity to the country’s
coalfields (North West, Gauteng, Free State, Mpumalanga, Limpopo and northern KwaZulu-Natal) (Eberhard and Van
Horen, 1995). The extent to which such factors emerge as important in the 2012 survey is discussed below.
In Table 10, the statistics on multiple energy use are further disaggregated by the geographic location of the sampled
households. The purpose of the table is to illustrate all energy sources used by households. Households could
therefore report various energy sources and therefore the percentages do not sum up to 100%.
100
90
80
70
60
50
40
30
20
10
0Poorest quintile Q2 Q3 Q4 Richest quintile
Electricity Candles ParaffinFuelwood Gas Solar power

30
Rural households are clearly substantially more reliant on biomass resources, especially firewood, than those residing
in small towns and metropolitan cities. Just under two-thirds (65%) of households in rural traditional authority areas
and 52% of rural farm dwellers were using firewood as an energy source, compared to only 11% of households in
formal urban areas and 17% in informal settlements. Other forms of non-commercial biomass resources such as
dung and crop residue hardly feature at all in domestic energy consumption patterns.
Table 10: Households Reporting Use of Energy Source, by Geographic Location and Province (Cell Percent, Multiple Response Table)
Ele
ctri
city
Can
dle
s
Fir
ew
oo
d
Para
ffin
Gas
So
lar
po
we
r
Co
al
Dry
ce
ll b
atte
rie
s
Ge
ne
rato
r
Car
bat
teri
es
Un
we
igh
ted
N
South Africa 92 38 28 26 20 9 6 6 1 1 2518
Geographic location
Urban formal 99 26 11 18 24 11 4 4 1 1 1552
Urban informal 83 38 17 47 7 7 13 16 1 2 223
Rural trad. auth. areas 84 66 65 33 11 8 8 6 1 1 536
Farms 72 42 52 36 26 7 11 8 5 1 207
Province
Western Cape 93 3 10 16 25 6 1 3 1 1 253
Eastern Cape 81 28 34 50 17 8 4 4 2 0 328
Northern Cape 89 45 47 15 16 8 8 9 2 0 147
Free State 98 38 16 52 27 9 3 5 2 1 198
KwaZulu-Natal 85 39 31 24 16 13 8 7 2 1 586
North-West 95 67 41 33 24 12 8 4 3 8 162
Gauteng 96 28 11 18 21 10 6 6 1 0 436
Mpumalanga 90 55 29 21 22 7 12 9 2 0 207
Limpopo 97 80 80 18 12 7 6 5 2 0 201
Source: SASAS Energy related behaviour and perception survey (2012)
Candles and paraffin appear to be fairly common in both rural and urban households, though to different degrees.
Candles are employed by two-thirds (66%) of rural traditional authority households and by 42% of rural farm
households. They are also present in over a third (38%) of the households in informal settlements, though paraffin
is a more common energy source than candles, being used in 47% of informal settlement households. There is near-
universal usage of paraffin among non-electrified households in informal settlements. This is in spite of the rapid
rise in the price of paraffin alongside petrol costs in recent years. Paraffin is used in around a third of households in
rural traditional authority areas and rural farms (33% and 36% respectively). The domestic use of gas is reported by
a fifth of surveyed households, and tends to have a greater presence on rural farms and in formal urban areas, most
especially higher income electrified households, relative to informal settlements and rural traditional authority areas.
On aggregate, no other energy source had a prevalence exceeding 10%, including batteries, coal, solar system and
generator electricity. Worth reiterating is an earlier finding that solar power increased from 3% in 2011 to 9% in 2012.
Notable variation in the profile of energy consumption patterns also emerges when one examines energy sources
by province (Table 10). In Limpopo, North West and Mpumalanga relatively high electricity usage (97%, 95% and 90%
respectively) coexists with notable shares using candles and firewood. In Mpumalanga, the prevalence of coal, at 12%,
31
remains the highest of any of the nine provinces and stands at twice the national average (6%). This is a reflection of
the proximity to some of the country’s major coalfields which are situated around towns in Mpumalanga, i.e. Ermelo,
Witbank and Secunda. In KwaZulu-Natal and Eastern Cape, the provinces with relatively lower electrification rates
(85% and 81%), a broader range of energy sources are being used. In the Eastern Cape, firewood usage is above
average, while paraffin is found in half of homes (a figure that exceeds the average by more than 24 percentage
points). In Gauteng and the Western Cape, traditional non-commercial energy sources are used in a small share of
households and electricity remains the dominant energy source that is used by households in these two provinces.
Above-average use of gas as a domestic energy source is evident in the Free State (27%), Western Cape (25%), and
North West (24%) in particular, and to a lesser extent in Mpumalanga (22%) and Gauteng (21%).
5.2. Main Use of Energy Sources
The preceding analysis provides an overview of the different energy sources that South African households employed,
irrespective of purpose, in late 2012. We now direct attention to the main energy source that is being used for the
various domestic end-uses: namely, lighting, cooking, space heating, water heating and appliances.
5.2.1. Main Energy Source for Lighting
As Table 11 convincingly demonstrates, households that have been electrified almost exclusively use electricity for
lighting purposes (97%), with a marginal contingent specifying that they continue to rely on candles (1%). By contrast,
almost three-fifths of non-electrified households (59%) rely on candles as the main source of lighting, with paraffin
being the predominant energy source for this purpose in most of the remaining cases (36%). Other energy sources
hardly feature, and no single option is mentioned in more than three percent of cases.
As one would intuitively expect and consistent with findings in 2011, there is discernible variation in the energy
sources used for lighting, based on levels of material deprivation. Households characterised by low living standards
are more likely to approximate the pattern evident among non-electrified households, given the probability of lower
levels of access to mains electricity for the disadvantaged. By contrast, households with a medium or high living
standard rely almost entirely on electricity (92% and 98% respectively), with nominal shares (less than 5%) dependent
on other sources for their lighting requirements. This pattern is again present when examining energy use patterns
by income quintiles.
These class-based differences remain relatively consistent when one examines the results for rural-urban location and
province (Table 11). In formal urban areas, electricity is again almost exclusively used for lighting homes (96%), while
in informal urban settlements, rural traditional authority areas and rural farms, candles and paraffin are relatively more
common, due to the lower shares reporting access to electricity from the mains. The use of paraffin and candles for
lighting is most common on rural farms (15% and 16% respectively). It is worth mentioning that the use of energy
sources such as paraffin and candles in the household pose significant health risks, in that they have the potential to
cause accidents that result in injury or death - for instance, the poisoning of children who drink fluid fuels or when a
large block of shacks is razed after a paraffin stove triggers a fire in a single shack (Howells et al., 2006).
Electricity is generally viewed as the cleanest energy source for households, thereby reducing health risks, but also
bringing other gains such as providing a more efficient lighting source for children to perform homework tasks. At the
provincial level, electricity is used by more than 80% of households as the main source of energy for lighting in eight
of the nine provinces, with the figure increasing to more than 90% of households in Western Cape, Free State, North
West, Gauteng and Limpopo. The Eastern Cape is the only province where the use of electricity for lighting is below
the 80% threshold (at 79%) and it is also only in the Eastern Cape where more than a tenth of households (13%)
use paraffin for lighting, regardless of electrification status. In KwaZulu-Natal and the Northern Cape approximately

32
a tenth (12% and 9% respectively) of sampled households rely on candles for lighting, representing an important
supplementary source of lighting in these provinces
Table 11: Main Energy Source Used for Lighting, by Socioeconomic Characteristics (Cell Percent, Row Percent)
Ele
ctri
city
Can
dle
s
Para
ffin
Dry
ce
ll b
atte
rie
s
Gas
So
lar
syst
em
Car
Bat
teri
es
Ge
ne
rato
r
To
tal
Bas
e N
South Africa 89 6 3 1 1 0 0 0 100 2484
Electrification status
Electrified 97 1 0 1 0 0 0 0 100 2227
Non-electrified 1 59 36 0 2 1 0 0 100 244
Living standard level
Low 18 45 35 0 1 1 0 0 100 195
Medium 92 4 2 1 0 0 0 0 100 1117
High 98 0 0 1 1 0 0 0 100 936
Per capita income quintiles
Poorest quintile 81 10 7 2 0 0 0 0 100 421
Quintile 2 84 8 6 1 0 1 0 0 100 453
Quintile 3 91 5 2 1 1 0 0 0 100 539
Quintile 4 93 4 2 0 0 0 0 0 100 528
Richest quintile 97 1 0 0 1 1 0 0 100 500
Geographic location
Urban formal 96 1 1 1 1 0 0 0 100 1537
Urban informal 78 12 7 1 1 0 0 0 100 218
Rural trad. auth. areas 83 11 5 1 0 1 0 0 100 528
Farms 67 16 15 0 0 1 0 0 100 201
Province
Western Cape 92 0 6 1 1 0 0 0 100 251
Eastern Cape 79 7 13 0 1 0 0 0 100 324
Northern Cape 84 9 1 2 1 3 0 0 100 142
Free State 91 2 4 2 1 1 0 0 100 197
KwaZulu-Natal 83 12 2 2 0 1 0 0 100 578
North-West 93 6 0 0 0 0 0 0 100 161
Gauteng 93 3 1 1 1 0 0 0 100 428
Mpumalanga 88 9 2 1 0 0 0 0 100 205
Limpopo 96 2 1 1 0 0 0 0 100 198
Dwelling type
Formal dwelling or brick structure 94 3 1 1 0 0 0 0 100 2008
Traditional dwelling or hut 59 23 17 0 0 1 0 0 100 179
Informal dwelling or shack 68 17 13 0 1 0 0 0 100 233
Source: SASAS Energy related behaviour and perception survey (2012)
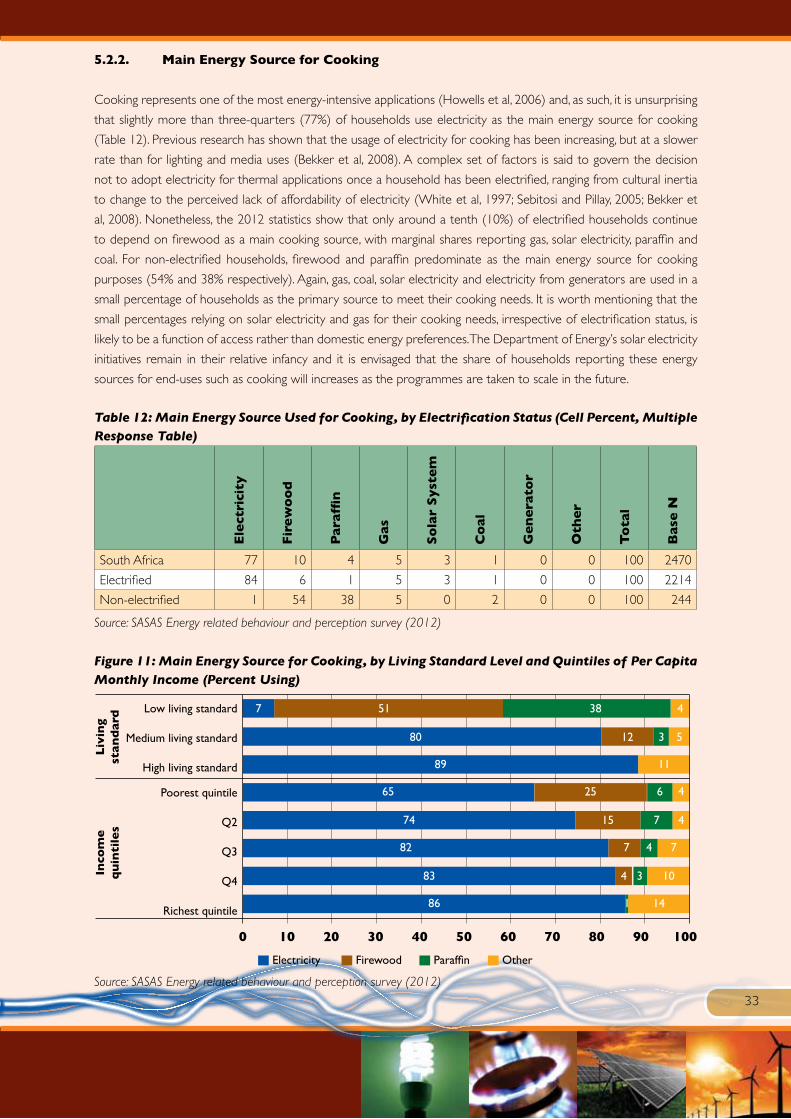
33
5.2.2. Main Energy Source for Cooking
Cooking represents one of the most energy-intensive applications (Howells et al, 2006) and, as such, it is unsurprising
that slightly more than three-quarters (77%) of households use electricity as the main energy source for cooking
(Table 12). Previous research has shown that the usage of electricity for cooking has been increasing, but at a slower
rate than for lighting and media uses (Bekker et al, 2008). A complex set of factors is said to govern the decision
not to adopt electricity for thermal applications once a household has been electrified, ranging from cultural inertia
to change to the perceived lack of affordability of electricity (White et al, 1997; Sebitosi and Pillay, 2005; Bekker et
al, 2008). Nonetheless, the 2012 statistics show that only around a tenth (10%) of electrified households continue
to depend on firewood as a main cooking source, with marginal shares reporting gas, solar electricity, paraffin and
coal. For non-electrified households, firewood and paraffin predominate as the main energy source for cooking
purposes (54% and 38% respectively). Again, gas, coal, solar electricity and electricity from generators are used in a
small percentage of households as the primary source to meet their cooking needs. It is worth mentioning that the
small percentages relying on solar electricity and gas for their cooking needs, irrespective of electrification status, is
likely to be a function of access rather than domestic energy preferences. The Department of Energy’s solar electricity
initiatives remain in their relative infancy and it is envisaged that the share of households reporting these energy
sources for end-uses such as cooking will increases as the programmes are taken to scale in the future.
Table 12: Main Energy Source Used for Cooking, by Electrification Status (Cell Percent, Multiple Response Table)
Ele
ctri
city
Fir
ew
oo
d
Para
ffin
Gas
So
lar
Syst
em
Co
al
Ge
ne
rato
r
Oth
er
To
tal
Bas
e N
South Africa 77 10 4 5 3 1 0 0 100 2470
Electrified 84 6 1 5 3 1 0 0 100 2214
Non-electrified 1 54 38 5 0 2 0 0 100 244
Source: SASAS Energy related behaviour and perception survey (2012)
Figure 11: Main Energy Source for Cooking, by Living Standard Level and Quintiles of Per Capita Monthly Income (Percent Using)
Source: SASAS Energy related behaviour and perception survey (2012)
Electricity
7
80
89
65
74
82
83
86
0 10 20 30 40 50 60 70 80 90 100
51
12
25
15
7
4
1
38
3
6
7
4
3
4
5
11
4
4
7
10
14
Low living standard
Medium living standard
High living standard
Poorest quintile
Q2
Q3
Q4
Richest quintile
Liv
ing
stan
dard
Inco
me
qu
inti
les
Firewood Paraffin Other

34
The socioeconomic gradient of difference in terms of main energy source for cooking is quite stark, especially when
one examines the patterns by living standard measure and income level (Figure 11). Households with a low living
standard and ranking among the poorest income quintiles are considerably more inclined to report the use of
firewood and paraffin relative to better-off households. This suggests the existence of barriers or practices among
poorer households that inhibit a fuller transition from firewood to electricity for this end use.
As for geographic variation, 90% of households in the Free State use electricity for cooking, while the figure exceeds
80% in North West, Gauteng and the Western Cape (Table 13). Only in Limpopo and the Eastern Cape is the share
of households using electricity for cooking purposes below the national average. Firewood is relied on in a majority of
provinces as the second most common main energy source for cooking. The case of Limpopo is somewhat atypical in
that more than two-fifths (44%) of households use wood as the main energy source for cooking compared to 49%
using electricity. In Mpumalanga, Northern Cape, Eastern Cape and KwaZulu-Natal firewood are used by at least a
tenth or more of households as the main energy source for cooking.
Table 13: Main Energy Source Used for Cooking, by Socioeconomic Characteristics (Cell Percent, Multiple Response Table)
Ele
ctri
city
Fir
ew
oo
d
Para
ffin
Gas
So
lar
Syst
em
Co
al
Ge
ne
rato
r
Oth
er
To
tal
Bas
e N
South Africa 77 10 4 5 3 1 0 0 100 2470
Geographic location
Urban formal 88 0 1 6 4 0 0 0 100 1528
Urban informal 72 3 21 3 1 0 0 0 100 215
Rural trad. auth. Areas 59 33 4 3 1 0 0 0 100 524
Farms 64 20 8 2 2 5 0 0 100 203
Province
Western Cape 81 5 1 12 1 0 0 0 100 251
Eastern Cape 71 13 11 1 3 1 0 0 100 320
Northern Cape 79 11 1 6 0 2 0 0 100 142
Free State 90 1 4 3 2 0 0 0 100 196
KwaZulu-Natal 77 13 4 4 3 0 0 0 100 575
North-West 85 5 3 2 1 4 0 0 100 160
Gauteng 84 0 4 6 5 0 1 0 100 422
Mpumalanga 79 10 6 2 1 1 0 0 100 206
Limpopo 49 44 0 4 3 0 0 0 100 198
Dwelling type
Formal dwelling or brick structure 82 8 2 5 2 1 0 0 100 1996
Traditional dwelling or hut 44 40 12 4 1 0 0 0 100 178
Informal dwelling or shack 62 6 24 4 1 3 0 0 100 233
Source: SASAS Energy related behaviour and perception survey (2012)
Paraffin is used as the primary source for cooking in around a tenth of households (11%) in the Eastern Cape while
gas features as the second most frequent energy source for cooking in the Western Cape and Gauteng

35
An equally significant variation in main cooking energy patterns is found when disaggregating by type of location. In
formal urban areas, electricity has become the energy source of choice for cooking, being used in 88% of cases. In
informal urban settlements, almost three quarters are using electricity (72%), but a sizeable 21% rely on paraffin. This
reflects the distinction between electrified and non-electrified households in informal settlements, with the former
opting to use electricity whereas the latter, left with constrained choices in the absence of electricity, are dependent
on paraffin to meet their cooking requirements. In rural traditional authority areas, 59% of households use electricity
for cooking, with a third (33%) using firewood and very few households reporting other energy sources for cooking
purposes. On rural farms, around two thirds (64%) use electricity for their cooking needs, with a fifth (20%) using
wood and less than a tenth (8%) relying on paraffin.
5.2.3. Main Energy Source for Heating Spaces and Keeping Warm
Apart from cooking, another energy-intensive thermal application is domestic space heating. On aggregate, three-
fifths of South African households (60%) use an energy source to heat spaces and keep warm, while the rest do not
use energy sources but opt mainly to wear warm clothing and use blankets (Table 14). More specifically, around two-
fifths (41%) use electricity as the main source for space heating, while 9% use firewood and 5% paraffin. Coal, gas and
other sources are mentioned in less than 5% of cases in general.
Examining the main energy source for space heating by electrification status (Figure 12), we find that in electrified
households 45% primarily use electricity, with nominal shares reporting firewood, paraffin and other energy sources
(7%, 4% and 5% respectively). A considerable share of electrified households (39%) use no energy source for heating,
choosing instead to make use of blankets, warm clothing or nothing at all. In non-electrified households, firewood is
the primary form of energy relied on for space heating, present in just more than a quarter (29%) of homes. The share
using paraffin is double the national average (11%), with ‘other sources’ consisting mainly of coal (5%).
Those with a low living standard exhibit a very similar pattern as non-electrified households in terms of main energy
source used for space heating. A marginal 3% use electricity, while 33% employ firewood and 14% paraffin (Table 14),
while 47% use no energy source. Higher electricity usage (37%) for space heating is evident in households classified
with a medium living standard, with wood and paraffin serving as the primary source for heating in around a tenth
of cases (12% and 7% in turn) and a similar share again indicating no energy source (40%). For households with high
living standards, half (50%) use electricity for space heating, with other energy sources hardly featuring. Two fifths
reportedly use no energy source, with an even split between warm clothing and blankets (21% and 18% respectively).
A similar positive association is discernible in relation to income status and electricity usage for heating purposes. Poor
households have a greater likelihood of using wood and paraffin for space heating, while the top two income quintiles
in particular are more inclined towards electricity usage for this end-use. Fairly similar levels of ‘no energy source’ are
present across the income distribution.

36
Figure 12: Main Energy Source for Heating Spaces and Keeping Warm in 2011 and 2012, by Electrification Status (Percent Using)
Source: SASAS Energy related behaviour and perception survey (2011; 2012)
At a provincial level, more than a quarter (29%) of households in Limpopo relies on firewood for heating, with this
energy source also being used by 15% of households in Mpumalanga and the Northern Cape (Table 14). In Eastern
Cape and the Free State, paraffin is particularly more common relative to the national average and other provinces,
being present in a fifth of households in the Free State. Coal continues to be more commonly used than average for
heating in Mpumalanga (8%), again reflecting closeness to coalfields.
Electricity Firewood Paraffin Other energy sources
35 34 36
6 6 6
128
40
9 718
39 44
South Africa(2011)
Electrified(2011)
Non-electrified(2011)
No energy source
South Africa(2012)
Electrified(2012)
Non-electrified(2012)
40
55
9
41
39
547
45
53
6
11
29
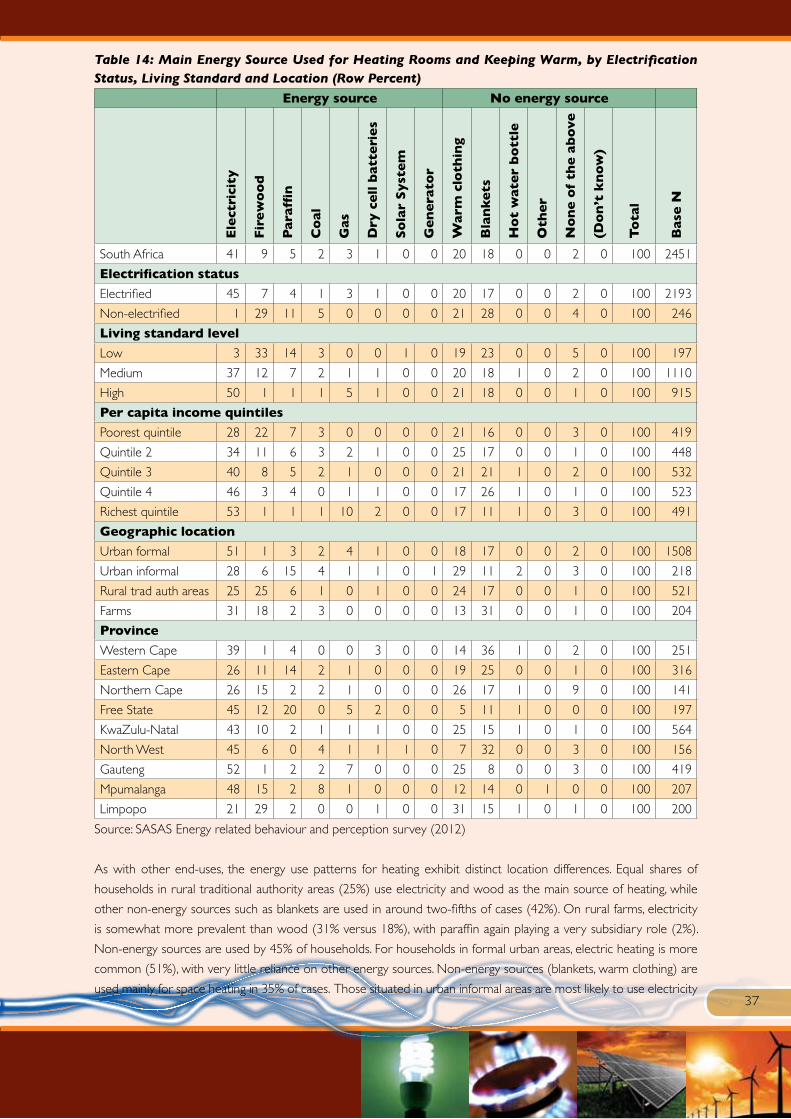
37
Table 14: Main Energy Source Used for Heating Rooms and Keeping Warm, by Electrification Status, Living Standard and Location (Row Percent)
Energy source No energy source
Ele
ctri
city
Fir
ew
oo
d
Para
ffin
Co
al
Gas
Dry
ce
ll b
atte
rie
s
So
lar
Syst
em
Ge
ne
rato
r
Warm
clo
thin
g
Bla
nk
ets
Ho
t w
ate
r b
ott
le
Oth
er
No
ne
of
the
ab
ove
(Do
n’t
kn
ow
)
To
tal
Bas
e N
South Africa 41 9 5 2 3 1 0 0 20 18 0 0 2 0 100 2451
Electrification status
Electrified 45 7 4 1 3 1 0 0 20 17 0 0 2 0 100 2193
Non-electrified 1 29 11 5 0 0 0 0 21 28 0 0 4 0 100 246
Living standard level
Low 3 33 14 3 0 0 1 0 19 23 0 0 5 0 100 197
Medium 37 12 7 2 1 1 0 0 20 18 1 0 2 0 100 1110
High 50 1 1 1 5 1 0 0 21 18 0 0 1 0 100 915
Per capita income quintiles
Poorest quintile 28 22 7 3 0 0 0 0 21 16 0 0 3 0 100 419
Quintile 2 34 11 6 3 2 1 0 0 25 17 0 0 1 0 100 448
Quintile 3 40 8 5 2 1 0 0 0 21 21 1 0 2 0 100 532
Quintile 4 46 3 4 0 1 1 0 0 17 26 1 0 1 0 100 523
Richest quintile 53 1 1 1 10 2 0 0 17 11 1 0 3 0 100 491
Geographic location
Urban formal 51 1 3 2 4 1 0 0 18 17 0 0 2 0 100 1508
Urban informal 28 6 15 4 1 1 0 1 29 11 2 0 3 0 100 218
Rural trad auth areas 25 25 6 1 0 1 0 0 24 17 0 0 1 0 100 521
Farms 31 18 2 3 0 0 0 0 13 31 0 0 1 0 100 204
Province
Western Cape 39 1 4 0 0 3 0 0 14 36 1 0 2 0 100 251
Eastern Cape 26 11 14 2 1 0 0 0 19 25 0 0 1 0 100 316
Northern Cape 26 15 2 2 1 0 0 0 26 17 1 0 9 0 100 141
Free State 45 12 20 0 5 2 0 0 5 11 1 0 0 0 100 197
KwaZulu-Natal 43 10 2 1 1 1 0 0 25 15 1 0 1 0 100 564
North West 45 6 0 4 1 1 1 0 7 32 0 0 3 0 100 156
Gauteng 52 1 2 2 7 0 0 0 25 8 0 0 3 0 100 419
Mpumalanga 48 15 2 8 1 0 0 0 12 14 0 1 0 0 100 207
Limpopo 21 29 2 0 0 1 0 0 31 15 1 0 1 0 100 200
Source: SASAS Energy related behaviour and perception survey (2012)
As with other end-uses, the energy use patterns for heating exhibit distinct location differences. Equal shares of
households in rural traditional authority areas (25%) use electricity and wood as the main source of heating, while
other non-energy sources such as blankets are used in around two-fifths of cases (42%). On rural farms, electricity
is somewhat more prevalent than wood (31% versus 18%), with paraffin again playing a very subsidiary role (2%).
Non-energy sources are used by 45% of households. For households in formal urban areas, electric heating is more
common (51%), with very little reliance on other energy sources. Non-energy sources (blankets, warm clothing) are
used mainly for space heating in 35% of cases. Those situated in urban informal areas are most likely to use electricity

38
(28%) or paraffin (15%) for heating while only 6% use wood, which is a reflection of the limited availability of biomass
in many informal settlements. More than two-fifths (42%) does not use an energy source for keeping warm but uses
blankets, warm clothing or hot water bottles.
Among electrified households, there is a discernible class gradient in fuel use for space heating (results not shown).
Those with higher living standards tend to reporting considerably higher usage of electricity and gas than electrified
household with lower living standards, but also hot water bottles. Conversely, electrified households with lower
living standards are more greatly predisposed towards reporting the use of paraffin and firewood for heating rooms
and keeping warm. There is also some evidence of a class gradient among non-electrified households, with poorer
households again more inclined to be using firewood and paraffin.
5.2.4. Main Energy Source for Operating Appliances
The 2011 survey of domestic energy attitudes and behaviour did not include questions about the use of different
energy sources for the operating of appliances. In the 2012 survey, respondents were asked about the energy
sources used to run four domestic appliances, specifically (i) a radio or hi-fi, (ii) a television, (iii) a refrigerator, and (iv)
an iron. The analysis is performed only on those households reporting that they possess the appliance in question,
which affects samples sizes when conducting subgroup analysis. In some instances, the number of cases for particular
categories is small (below 200), which means that the margin of error increases. It was ultimately decided to present
the tables since they nonetheless offer important insight into the different sources of energy households rely on to
run basic domestic appliances. The reader is cautioned that in cases when the base numbers are small (indicated in
each table by an asterisk), the results need to be treated judiciously.
Another consideration in examining and interpreting the energy use patterns for running the aforementioned
appliances is that the data collected ultimately provided hardly any instances where multiple fuels were collected –
fewer than 20 households reported using more than one energy source for each of the four appliances. While to
some degree this may reflect a social reality whereby households rely on one predominant energy source to power
appliances, fieldwork checks demonstrated that certain enumerators may have interpreted the question as requiring
a single main energy source rather than a capturing of all sources. For this reason, we have focused our analysis on
those reporting the main energy source employed and omitted the nominal set of cases where multiple sources are
listed.
From Table 15, it is readily apparent that electricity is by a considerable margin the predominant energy source for
powering radios and hi-fis (93%), with small shares of households relying on dry cell batteries (4%), solar system (2%),
and car batteries (1%). Among non-electrified households and those with a low living standard, dry cell batteries are
the main energy source employed, with a higher than average reported usage of solar system and car batteries too.
In the lowest three income quintiles, the use of dry cell batteries is above average but less pronounced. Although
electricity remains the primary energy source for radios and hi-fis in informal settlements and rural farms, at least
a tenth of households (13% and 11% respectively) make use of dry cell batteries. Provincially, electricity usage
ranges from 84% in North West to 98% in the Western Cape. Households in the Eastern Cape, KwaZulu-Natal and
Mpumalanga are most likely to be using dry cell batteries for this appliance (8% in the first two instances and 6% in
the latter), with car battery usage most prevalent in North West (10%). Finally, formal dwellings almost universally
power radios/hi-fis with electricity (96%), compared to approximately two-thirds of traditional or informal structures.

39
Table 15: Main Energy Source Used for Operating a Radio/Hi-Fi, by Socioeconomic Characteristics (Row Percent)
Ele
ctri
city
Dry
ce
ll b
atte
rie
s
So
lar
syst
em
Car
bat
teri
es
Ge
ne
rato
r
Oth
er
To
tal
Bas
e N
South Africa 93 4 2 1 0 0 100 1754
Electrification status
Electrified 97 1 1 1 0 0 100 1654
Non-electrified 7 75 10 5 1 2 100 91*
Living standard level
Low 29 58 8 5 0 0 100 96*
Medium 95 2 1 2 0 0 100 726
High 98 0 2 0 0 0 100 780
Per capita income quintiles
Poorest quintile 88 6 4 0 0 1 100 224
Quintile 2 90 8 1 1 0 0 100 278
Quintile 3 93 6 1 0 0 0 100 371
Quintile 4 93 3 1 4 0 0 100 416
Richest quintile 98 0 2 0 0 0 100 430
Geographic location
Urban formal 97 1 1 1 0 0 100 1210
Urban informal 86 13 1 0 0 0 100 129*
Rural trad. auth. areas 86 9 4 0 0 0 100 302
Farms 85 11 1 2 0 1 100 113*
Province
Western Cape 98 1 1 0 0 0 100 222
Eastern Cape 89 8 2 1 1 0 100 177*
Northern Cape 95 3 1 0 0 1 100 82*
Free State 97 3 0 0 0 0 100 155*
KwaZulu-Natal 88 8 3 1 0 0 100 436
North-West 84 3 3 10 0 0 100 122*
Gauteng 96 3 1 0 0 0 100 304
Mpumalanga 91 6 2 0 0 1 100 127*
Limpopo 97 1 1 0 0 0 100 129*
Dwelling type
Formal dwelling or brick structure 96 2 1 0 0 0 100 1513
Traditional dwelling or hut 66 22 8 4 0 0 100 77*
Informal dwelling or shack 67 20 1 12 1 0 100 120*
Source: SASAS Energy related behaviour and perception survey (2012)
Note: Analysis is restricted to those households reporting possession of the appliance. An asterisk (*) implies that caution
needs to exercised in interpretation due to the relatively small set of cases involved.
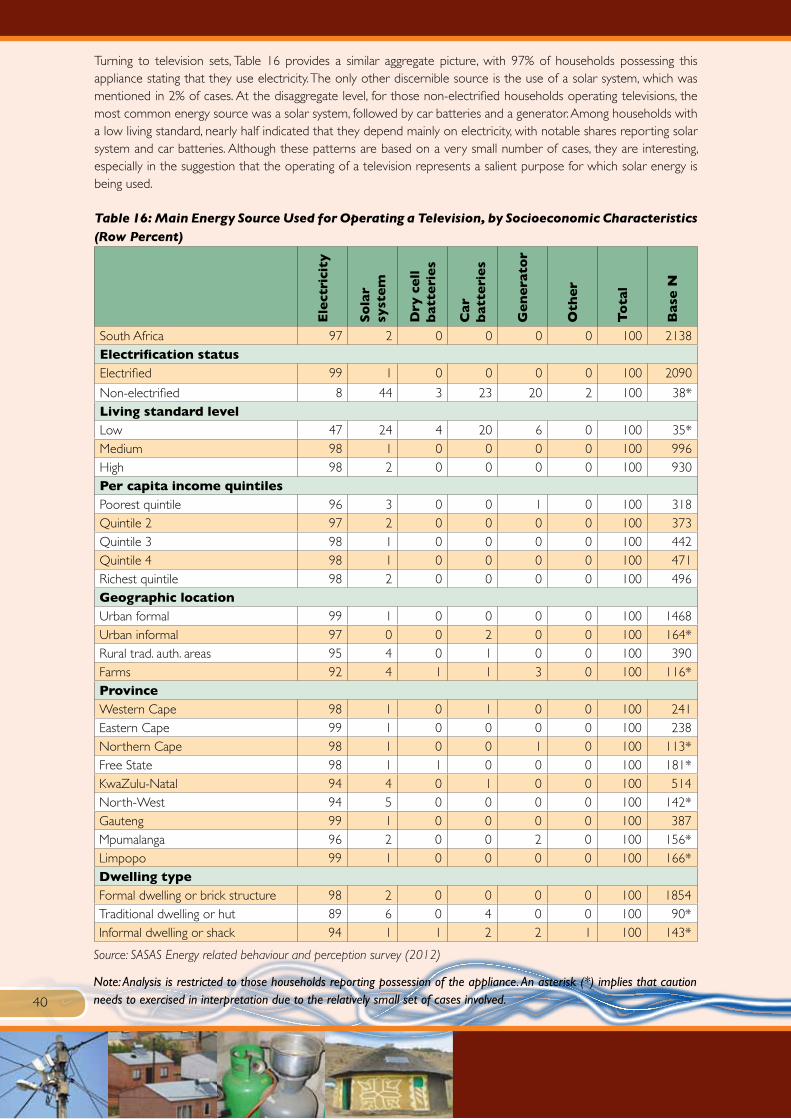
40
Turning to television sets, Table 16 provides a similar aggregate picture, with 97% of households possessing this appliance stating that they use electricity. The only other discernible source is the use of a solar system, which was mentioned in 2% of cases. At the disaggregate level, for those non-electrified households operating televisions, the most common energy source was a solar system, followed by car batteries and a generator. Among households with a low living standard, nearly half indicated that they depend mainly on electricity, with notable shares reporting solar system and car batteries. Although these patterns are based on a very small number of cases, they are interesting, especially in the suggestion that the operating of a television represents a salient purpose for which solar energy is being used.
Table 16: Main Energy Source Used for Operating a Television, by Socioeconomic Characteristics (Row Percent)
Ele
ctri
city
So
lar
syst
em
Dry
ce
ll
bat
teri
es
Car
bat
teri
es
Ge
ne
rato
r
Oth
er
To
tal
Bas
e N
South Africa 97 2 0 0 0 0 100 2138Electrification statusElectrified 99 1 0 0 0 0 100 2090
Non-electrified 8 44 3 23 20 2 100 38*Living standard levelLow 47 24 4 20 6 0 100 35*Medium 98 1 0 0 0 0 100 996High 98 2 0 0 0 0 100 930Per capita income quintilesPoorest quintile 96 3 0 0 1 0 100 318Quintile 2 97 2 0 0 0 0 100 373Quintile 3 98 1 0 0 0 0 100 442Quintile 4 98 1 0 0 0 0 100 471Richest quintile 98 2 0 0 0 0 100 496Geographic locationUrban formal 99 1 0 0 0 0 100 1468Urban informal 97 0 0 2 0 0 100 164*Rural trad. auth. areas 95 4 0 1 0 0 100 390Farms 92 4 1 1 3 0 100 116*ProvinceWestern Cape 98 1 0 1 0 0 100 241Eastern Cape 99 1 0 0 0 0 100 238Northern Cape 98 1 0 0 1 0 100 113*Free State 98 1 1 0 0 0 100 181*KwaZulu-Natal 94 4 0 1 0 0 100 514North-West 94 5 0 0 0 0 100 142*Gauteng 99 1 0 0 0 0 100 387Mpumalanga 96 2 0 0 2 0 100 156*Limpopo 99 1 0 0 0 0 100 166*Dwelling typeFormal dwelling or brick structure 98 2 0 0 0 0 100 1854Traditional dwelling or hut 89 6 0 4 0 0 100 90*Informal dwelling or shack 94 1 1 2 2 1 100 143*
Source: SASAS Energy related behaviour and perception survey (2012)
Note: Analysis is restricted to those households reporting possession of the appliance. An asterisk (*) implies that caution needs to exercised in interpretation due to the relatively small set of cases involved.

41
The reliance on a solar home system (SHS) for operating a television is also higher than average among households in the poorest income quintile, rural areas, in KwaZulu-Natal and North West, though in all cases it was mentioned as a predominant source by fewer than five percent. While bearing in mind that the use of electricity for running televisions in most instances remains near universal levels, car batteries are more common than average in informal urban settlements and among households constructed of traditional or informal materials, while generators are more likely than average to be mentioned on rural farms, in Mpumalanga and among households built of informal materials.
Table 17: Main Energy Source Used for Operating Refrigerators, by Socioeconomic Characteristics (Row Percent)
Ele
ctri
city
So
lar
syst
em
Gas
Para
ffin
Ge
ne
rato
r
To
tal
Bas
e N
South Africa 98 1 1 0 0 100 2041
Electrification status
Electrified 99 1 0 0 0 100 2009
Non-electrified 16 2 72 5 5 100 21*
Living standard level
Low 64 0 19 17 0 100 18*
Medium 98 0 1 0 0 100 926
High 98 2 0 0 0 100 935
Per capita income quintiles
Poorest quintile 98 1 1 0 0 100 275
Quintile 2 99 0 1 0 0 100 345
Quintile 3 98 1 0 0 0 100 429
Quintile 4 98 1 0 0 0 100 456
Richest quintile 98 2 0 0 0 100 498
Geographic location
Urban formal 99 1 0 0 0 100 1445
Urban informal 97 0 1 1 1 100 137*
Rural trad. auth. areas 97 1 2 0 0 100 357
Farms 96 4 0 0 0 100 102*
Province
Western Cape 98 1 1 0 0 100 237
Eastern Cape 100 0 0 0 0 100 202
Northern Cape 98 1 0 0 0 100 109*
Free State 99 1 0 0 0 100 170*
KwaZulu-Natal 97 1 2 0 0 100 488
North-West 95 5 0 0 0 100 135*
Gauteng 99 1 0 0 0 100 377
Mpumalanga 98 2 0 0 0 100 156*
Limpopo 100 0 0 0 0 100 167*
Dwelling type
Formal dwelling or brick structure 99 1 0 0 0 100 1818
Traditional dwelling or hut 91 0 7 2 0 100 65*
Informal dwelling or shack 96 1 1 1 1 100 112*
Source: SASAS Energy related behaviour and perception survey (2012)
Note: Analysis is restricted to those households reporting possession of the appliance. An asterisk (*) implies that caution
needs to exercised in interpretation due to the relatively small set of cases involved.

42
Refrigerators are relatively energy intensive appliances, despite the energy savings that have been brought on by the
introduction of efficient models of electric refrigerator in recent years. In South Africa, by late 2012 an estimated
95% of households with this appliance relied on electricity to operate it (Table 17). In non-electrified households, gas
refrigerators appear to be more common than average, with electricity, gas and solar home system used by modest
shares. However these figures need to be interpreted with caution to the small number of cases involved. Among
households with a low living standard, electricity was reportedly used by nearly two-thirds, with the balance fairly
evenly split between the use of gas and paraffin operated refrigerators. The use of solar home system was more
commonly used for refrigeration in North West province and on rural farms, though in both cases this represented
only around five percent of households.
With regard to the domestic use of irons, 95% of households with this appliance depend primarily on electricity
(Table 18), with negligible shares (1% each) registering the use of firewood, paraffin, coal and a solar home system.
Again, non-electrified households and households with low living standards differ the most from the national average.
In the case of the former, the main energy source used for irons is firewood, followed by paraffin and coal, while in the
latter instance virtually equivalent shares rely on electricity, firewood, paraffin and coal. Again we must treat the figures
with caution due to potential bias because of the small number of cases involved. Firewood is also more prevalent
than average among households built of traditional materials, in KwaZulu-Natal, in rural areas and among the poorest
quintiles, whereas paraffin tends to be widely employed in informal settlements and for households built of informal
and traditional materials, in the Eastern Cape and Mpumalanga, as well as the poorest income quintiles. Fitting this
pattern, coal usage tends to be more widespread (though still relatively circumscribed) among poorer, rurally based
households constructed with traditional materials.

43
Table 18: Main Energy Source Used for Operating Irons, by Socioeconomic Characteristics (Row Percent)
Ele
ctri
city
Fir
ew
oo
d
Para
ffin
Co
al
So
lar
syst
em
Gas
Ge
ne
rato
r
To
tal
Bas
e N
South Africa 95 1 1 1 1 0 0 100 2218
Electrification status
Electrified 98 0 0 0 1 0 0 100 2112
Non-electrified 3 36 29 26 2 2 0 100 95*
Living standard level
Low 25 23 24 26 2 0 0 100 84*
Medium 96 1 1 1 0 0 0 100 1000
High 98 0 0 0 2 0 0 100 935
Per capita income quintiles
Poorest quintile 90 4 2 3 1 0 0 100 355
Quintile 2 91 3 3 2 0 0 0 100 393
Quintile 3 96 1 1 0 1 0 0 100 458
Quintile 4 97 0 1 0 1 0 0 100 474
Richest quintile 97 0 0 0 2 0 0 100 499
Geographic location
Urban formal 98 0 0 0 1 0 0 100 1477
Urban informal 89 2 8 0 1 0 0 100 171*
Rural trad. auth. areas 89 4 2 4 1 0 0 100 442
Farms 87 5 2 3 3 0 0 100 128*
Province
Western Cape 99 0 0 0 1 0 0 100 214
Eastern Cape 92 1 5 2 0 0 0 100 251
Northern Cape 98 0 1 0 1 0 0 100 117*
Free State 99 1 0 0 1 0 0 100 190*
KwaZulu-Natal 87 6 0 5 1 1 0 100 549
North-West 92 0 2 1 5 0 0 100 150*
Gauteng 98 0 1 0 1 0 0 100 399
Mpumalanga 92 2 3 1 2 0 0 100 175*
Limpopo 100 0 0 0 0 0 0 100 173*
Dwelling type
Formal dwelling or brick structure 97 1 1 0 1 0 0 100 1893
Traditional dwelling or hut 70 10 5 13 1 0 0 100 114*
Informal dwelling or shack 84 3 10 2 0 0 0 100 156*
Source: SASAS Energy related behaviour and perception survey (2012)
Note: Analysis is restricted to those households reporting possession of the appliance. An asterisk (*) implies that caution
needs to exercised in interpretation due to the relatively small set of cases involved.
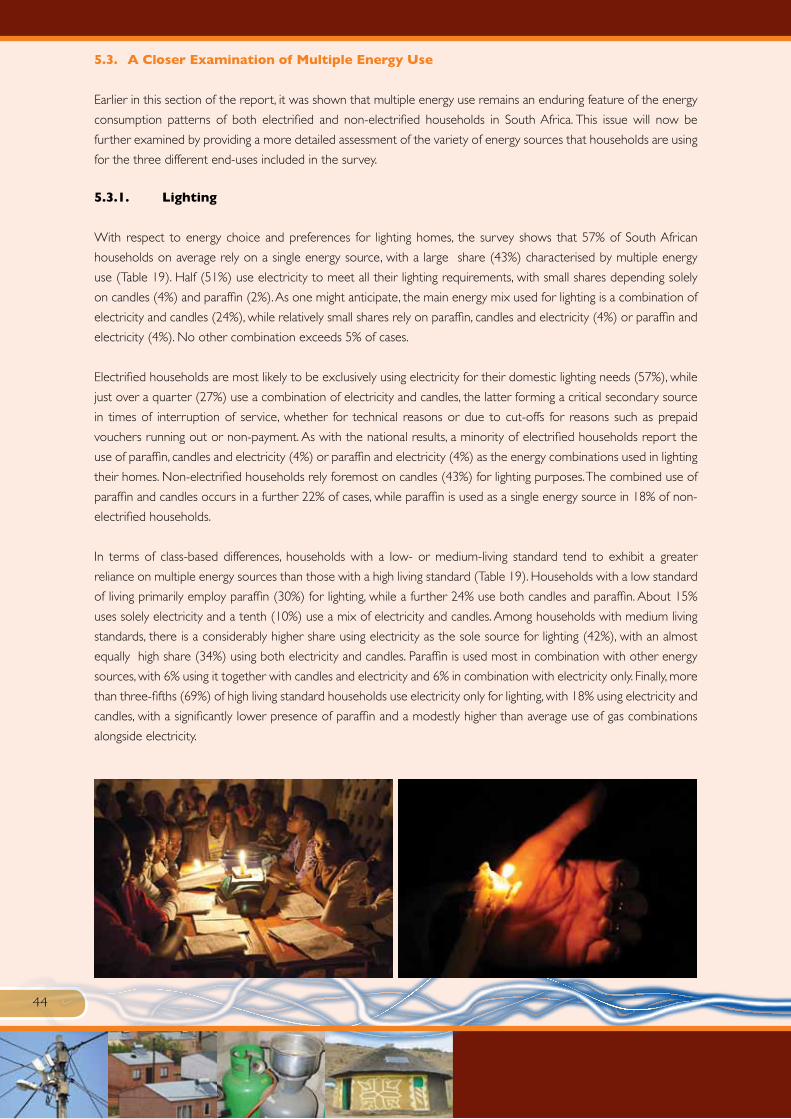
44
5.3. A Closer Examination of Multiple Energy Use
Earlier in this section of the report, it was shown that multiple energy use remains an enduring feature of the energy
consumption patterns of both electrified and non-electrified households in South Africa. This issue will now be
further examined by providing a more detailed assessment of the variety of energy sources that households are using
for the three different end-uses included in the survey.
5.3.1. Lighting
With respect to energy choice and preferences for lighting homes, the survey shows that 57% of South African
households on average rely on a single energy source, with a large share (43%) characterised by multiple energy
use (Table 19). Half (51%) use electricity to meet all their lighting requirements, with small shares depending solely
on candles (4%) and paraffin (2%). As one might anticipate, the main energy mix used for lighting is a combination of
electricity and candles (24%), while relatively small shares rely on paraffin, candles and electricity (4%) or paraffin and
electricity (4%). No other combination exceeds 5% of cases.
Electrified households are most likely to be exclusively using electricity for their domestic lighting needs (57%), while
just over a quarter (27%) use a combination of electricity and candles, the latter forming a critical secondary source
in times of interruption of service, whether for technical reasons or due to cut-offs for reasons such as prepaid
vouchers running out or non-payment. As with the national results, a minority of electrified households report the
use of paraffin, candles and electricity (4%) or paraffin and electricity (4%) as the energy combinations used in lighting
their homes. Non-electrified households rely foremost on candles (43%) for lighting purposes. The combined use of
paraffin and candles occurs in a further 22% of cases, while paraffin is used as a single energy source in 18% of non-
electrified households.
In terms of class-based differences, households with a low- or medium-living standard tend to exhibit a greater
reliance on multiple energy sources than those with a high living standard (Table 19). Households with a low standard
of living primarily employ paraffin (30%) for lighting, while a further 24% use both candles and paraffin. About 15%
uses solely electricity and a tenth (10%) use a mix of electricity and candles. Among households with medium living
standards, there is a considerably higher share using electricity as the sole source for lighting (42%), with an almost
equally high share (34%) using both electricity and candles. Paraffin is used most in combination with other energy
sources, with 6% using it together with candles and electricity and 6% in combination with electricity only. Finally, more
than three-fifths (69%) of high living standard households use electricity only for lighting, with 18% using electricity and
candles, with a significantly lower presence of paraffin and a modestly higher than average use of gas combinations
alongside electricity.

45
Table 19: Energy Choice for Lighting, by Electrification Status and Living Standard (Column Percent)
Multiple energy sources for lighting
South Africa Electrified Non-
electrified Low Medium High
Single energy use 57 57 63 49 47 69
Paraffin only 2 0 18 15 1 0
Gas only 0 0 1 0 0 0
Candles only 4 1 43 30 3 0
Solar system only 0 0 0 1 0 0
Electricity only 51 56 1 2 42 68
Dry cell batteries only 0 0 0 0 0 0
Generator only 0 0 0 0 0 0
Other source only 0 0 0 0 0 0
Multiple energy use 43 43 37 51 53 31
Candles & electricity 24 27 0 10 34 18
Paraffin, candles & electricity 4 4 0 2 6 2
Paraffin & electricity 4 4 0 5 6 2
Paraffin & candles 2 0 22 24 1 0
Gas & electricity 3 3 0 0 2 3
Gas, candles & electricity 1 1 0 0 1 1
Paraffin, gas & electricity 0 0 0 0 0 0
Paraffin, gas, candles & electricity 0 0 0 0 0 0
Other energy combinations 4 3 14 10 2 6
Total 100 100 100 100 100 100
Source: SASAS Energy related behaviour and perception survey (2012)
In the Western Cape, Eastern Cape, Northern Cape, KwaZulu- Natal and Gauteng more than half of households
are reliant on a single source of energy for lighting purposes, most of which is accounted for by the use of electricity
(Table 20). Comparatively very low levels of single energy use are observed in Limpopo (19%), North West (24%),
Free State (40%) and Mpumalanga (49%). This is related to lower use of electricity by households in these provinces
as a sole source for lighting.
Multiple energy use is above average for households in six provinces: namely, in descending rank order, Limpopo,
North West, Free State, Mpumalanga and Northern Cape. In all of these provinces, the most common multiple
energy source combination is candles and electricity. In the Free State and Eastern Cape, a higher than average share
was reported for the paraffin and electricity mix.

46
Table 20: Energy Choice for Lighting, by Province (Column Percent)
Multiple energy sources for lighting WC EC NC FS KZN NW GP MP LP
Single energy use 89 62 51 40 63 24 68 49 19
Paraffin only 5 6 0 0 0 0 1 0 0
Gas only 1 0 1 1 0 0 0 0 0
Candles only 0 5 6 0 9 5 2 7 4
Solar system only 0 0 1 0 0 0 0 0 0
Electricity only 83 51 43 39 52 19 65 41 14
Dry cell batteries only 1 0 0 0 0 0 0 1 0
Generator only 0 0 0 0 0 0 0 0 0
Other source only 0 0 0 0 0 0 0 0 0
Multiple energy use 11 38 49 60 37 76 32 51 81
Candles & electricity 2 6 33 28 16 49 21 32 68
Paraffin, candles & electricity 1 7 1 5 7 4 2 4 3
Paraffin & electricity 2 12 1 13 3 4 2 1 1
Paraffin & candles 0 7 1 1 2 3 1 3 1
Gas & electricity 1 2 1 3 2 7 3 3 2
Gas, candles & electricity 0 1 1 3 1 3 1 1 0
Paraffin, gas & electricity 0 0 0 1 0 0 0 0 1
Paraffin, gas, candles & electricity 0 1 0 0 0 0 0 2 1
Other energy combinations 4 2 12 7 5 6 3 5 5
Total 100 100 100 100 100 100 100 100 100
Source: SASAS Energy related behaviour and perception survey (2012)
Turning to type of geographic location, we find that urban areas are more likely to report a single energy source for
domestic lighting needs, particularly in formal urban areas (67%), while households based in rural, traditional authority
areas and on rural farms tend to demonstrate a substantially greater reliance on multiple energy combinations (65%
and 50% respectively). Households in formal urban areas are most likely to use electricity as the sole energy source
for lighting (65%) or electricity together with candles (19%) (Table 21). In informal urban settlements the most
common option for lighting is again the exclusive use of electricity (50%). Notable secondary categories are electricity
and candles (15%) and paraffin, candles and electricity (8%).

47
Table 21: Energy Choice for Lighting, by Geographic Location (Column Percent)
Multiple energy sources for lighting
Urban formal
Urban informal
Rural, traditional authority areas
Farms
Single energy use 67 63 35 50
Paraffin only 0 4 1 9
Gas only 0 0 0 0
Candles only 1 8 9 12
Solar system only 0 0 0 0
Electricity only 65 50 24 29
Dry cell batteries only 0 1 0 0
Generator only 0 0 0 0
Other source only 0 0 0 0
Multiple energy use 33 37 65 50
Candles & electricity 19 15 41 19
Paraffin, candles & electricity 2 8 7 3
Paraffin & electricity 3 5 5 6
Paraffin & candles 0 3 5 5
Gas & electricity 2 2 1 8
Gas, candles & electricity 1 1 1 2
Paraffin, gas & electricity 0 0 0 0
Paraffin, gas, candles & electricity 0 0 1 0
Other energy combinations 4 3 4 6
Total 100 100 100 100
Source: SASAS Energy related behaviour and perception survey (2012)
In rural traditional authority areas, two-fifths (41%) use a combination of electricity and candles, representing the
largest share of households. The single use of electricity is present in only 24% of households, while 9% only use
candles. Other notable multiple sources are paraffin, candles and electricity (7%). A broadly similar pattern is observed
in relation to rural farm households, with 29% exclusively using electricity and 19% using candles and electricity in
combination. Larger than average shares only use candles (12%) or paraffin (9%) for lighting.
5.3.2. Cooking
For cooking, three fifths of South African households (60%) employ a single energy to meet their daily needs, which is
comprised mainly of the use of electricity (47%) with nominal shares using wood, paraffin, gas or solar only (Table 22).
Of the remaining 40% that use a range of energy sources to fulfil their domestic cooking requirements, electricity and
firewood, gas and electricity, as well as electricity and paraffin, are the three most common mixes of sources (each
representing about a tenth of households). The energy choices for cooking amongst electrified households is virtually
identical to the national average, with the predominance of the single use of electricity at 51%, with combinations
of electricity together with wood, gas or paraffin assuming a subsidiary but nonetheless noteworthy role. Although
the balance between single and multiple energy use for cooking among non-electrified households does not differ
radically from that of electrified households, there are sizeable discrepancies in terms of the specific sources and
combinations that are relied upon. More than a third (37%) of non-electrified households solely use firewood for
cooking and almost a quarter (23%) solely uses paraffin. A sizeable 24%- use a mix of these two sources.

48
Table 22: Energy Choice for Cooking, by Electrification Status and Living Standard (Column Percent)
Multiple energy sources for cooking
South Africa Electrified Non-
electrified Low Medium High
Single energy use 60 60 66 58 54 66
Electricity only 47 51 1 2 41 61
Firewood only 6 4 37 34 7 0
Paraffin only 2 0 23 21 2 0
Gas only 2 2 3 0 2 3
Solar system only 2 2 0 0 1 2
Coal only 0 0 2 1 1 0
Other source only 0 0 0 0 0 0
Multiple energy use 40 40 34 42 46 34
Firewood & electricity 10 11 0 2 15 6
Gas & electricity 10 10 0 0 5 17
Paraffin & electricity 9 10 0 4 15 5
Paraffin, firewood & electricity 2 3 0 2 4 0
Paraffin & firewood 2 0 24 25 1 0
Paraffin, gas & electricity 1 1 0 0 1 1
Gas, firewood & electricity 1 1 0 0 1 1
Coal & electricity 1 1 0 0 1 0
Paraffin & gas 0 0 3 4 0 0
Paraffin, gas & firewood 0 0 2 2 0 0
Other energy combinations 4 4 5 3 4 4
Total 100 100 100 100 100 100
Source: SASAS Energy related behaviour and perception survey (2012)
The differences between electrified and non-electrified households in terms of the energy mix used for cooking are
again evident when comparing energy-use patterns by household living standard level. Only 2% of households with
a low living standard employ electricity exclusively, relative to 41% among those with a medium living standard and
61% for those with a high living standard. For households with a low living standard, the most common trend is to
only cook with firewood (34%) or use a combination of paraffin and firewood (25%). In more than a fifth of these
households (21%) cooking is done exclusively using paraffin. Among medium living standard households, apart from
the previously mentioned single electricity use, a further third (30%) use electricity combined with either firewood
or paraffin. While more than three-fifths (61%) of those with a high living standard only use electricity, an additional
17% cook with gas and electricity.

49
Table 23: Energy Choice for Cooking, by Province (Column Percent)
Multiple energy sources for cooking
WC EC NC FS KZN NW GP MP LP
Single energy use 74 59 49 48 63 34 72 51 43
Electricity only 63 46 41 47 48 23 60 41 11
Firewood only 5 5 3 0 9 4 0 6 31
Paraffin only 0 5 1 0 2 1 4 2 0
Gas only 6 1 3 0 3 0 3 0 1
Solar system only 0 2 0 1 2 1 5 1 0
Coal only 0 1 2 0 0 4 0 1 0
Other source only 0 0 0 0 0 0 0 0 0
Multiple energy use 26 41 51 52 37 66 28 49 57
Firewood & electricity 3 3 28 2 7 15 6 14 32
Gas & electricity 14 4 3 17 8 12 9 17 5
Paraffin & electricity 2 12 3 27 9 20 8 3 5
Paraffin, firewood & electricity 0 8 0 0 4 6 1 0 1
Paraffin & firewood 0 9 1 2 4 2 0 2 3
Paraffin, gas & electricity 2 1 0 0 0 1 0 2 1
Gas, firewood & electricity 0 1 2 0 0 4 0 2 1
Coal & electricity 0 0 1 1 0 1 1 1 0
Paraffin & gas 1 1 0 0 1 0 0 0 0
Paraffin, gas & firewood 0 0 3 0 0 0 0 0 0
Other energy combinations 3 2 8 2 4 6 2 7 10
Total 100 100 100 100 100 100 100 100 100
Source: SASAS Energy related behaviour and perception survey (2012)
In five of the nine provinces there is a greater share of households reporting single energy use for cooking than
multiple energy use: namely, Western Cape, Gauteng, KwaZulu-Natal, Eastern Cape and Mpumalanga, an attribute that
is again directly related to the share reporting exclusive use of electricity for this purpose (Table 23). In all provinces,
except Limpopo, electricity as a single source makes up the biggest share as the energy choice for cooking. In both
Western Cape and Gauteng more than three-fifths (63% and 60% respectively) rely on electricity only for cooking.
In the Eastern Cape the single use of electricity remains the most highly ranked option, but paraffin in combination
with electricity and/or firewood make up a sizeable 29%. In the Free State, the single use of electricity also remains
the most highly ranked option (48%), followed by electricity with paraffin (27%) and electricity with gas (17%). The
same applies to Mpumalanga, with 51% using only electricity but almost a fifth (17%) using gas and electricity and 14%
firewood and electricity. In the Northern Cape 49% exclusively use electricity but more than a quarter (28%) also use
a combination of electricity and firewood. In the North West, large shares (34%) use only electricity or a combination
of electricity and paraffin (20%). The combination of electricity and firewood is reported by 14% of households in
this province, with gas and electricity by another tenth (12%). Limpopo is the only province where a form of multiple
energy use is the main choice for cooking. In the case of Limpopo, 32% of households use a mix of electricity and
firewood, with a third (31%) using wood only and 11% electricity only. Therefore, in this province it would seem that
wood has not been displaced by electricity as the preferred energy source for cooking, with wood continuing to be
used alongside electricity.

50
Table 24: Energy Choice for Cooking, by Geographic Location (Column Percent)
Multiple energy sources for cooking
Urban formal
Urban informal
Rural, traditional authority areas
Farms
Single energy use 68 66 45 47
Electricity only 60 50 21 22
Firewood only 0 1 20 16
Paraffin only 1 14 2 3
Gas only 3 1 1 0
Solar system only 3 1 1 1
Coal only 0 0 0 5
Other source only 0 0 0 0
Multiple energy use 32 34 55 53
Firewood & electricity 6 5 21 9
Gas & electricity 11 3 4 19
Paraffin & electricity 9 13 10 7
Paraffin, firewood & electricity 1 4 6 2
Paraffin & firewood 0 2 6 7
Paraffin, gas & electricity 1 0 1 0
Gas, firewood & electricity 1 0 1 1
Coal & electricity 1 1 0 0
Paraffin & gas 0 1 1 0
Paraffin, gas & firewood 0 1 0 0
Other energy combinations 3 4 5 6
Total 100 100 100 100
Source: SASAS Energy related behaviour and perception survey (2012)
With respect to type of geographic location, there is a strong rural-urban divide in the balance between single and
multiple energy use (Table 24). Two-thirds or more of households in formal urban areas or informal settlements use
a single source for cooking, while multiple energy use is the norm in rural, traditional authority areas and on rural
farms. In formal urban areas, households are predisposed towards the single use of electricity (60%), with a tenth using
either electricity with gas (11%) or electricity with paraffin (9%). In informal settlements half (50%) use only electricity
for cooking, while 14% use only paraffin and 13% a mix of electricity and paraffin. In rural traditional authority areas
electricity only, or electricity with wood combined is the predominant energy option for cooking (21% respectively)
followed by the use of firewood (20%). Finally, on rural farms, electricity as well as electricity with gas are the two
dominant options, both present in approximately a fifth of cases (22% and 19% in turn), with smaller shares reported
for firewood only (16%) and wood with electricity (9%).
5.3.3. Heating Spaces and Keeping Warm
In terms of space heating, a greater proportion (61%) of households are reliant on a single energy use than is the case
with lighting and cooking (Table 25). Nonetheless, households are moderately less reliant on electricity (43%) than is
the case with the other two end-uses. Open fires are still used by 11% of households, while the use of paraffin solely
for heating purposes is found in under a tenth of households (4%). Less than a fifth (18%) of households employs
multiple energy sources for space heating, while 21% of households reported that they used no specific energy
source for heating, opting instead either to wrap themselves up with warm clothing and blankets or to do without.
Electrified households are marginally more inclined than average to use electricity only for heating (47%) and depend
less on wood and paraffin exclusively. Little discernible difference can be found between electrified households
and the national picture in terms of the share reporting multiple energy use and no energy source. Non-electrified

51
households are most likely to use firewood only as the energy source for heating rooms (39%), with a further 11%
solely reliant upon paraffin. The main multiple energy use reported is the combination of paraffin and wood (7%),
while almost a third (30%) use no energy source, instead choosing to keep warm with warm clothes and blankets.
When comparing households with low, medium or high living standards, we again see an increasing switch towards
electricity for space heating. Households with low living standards are most likely to use wood only to heat rooms
(44%), with paraffin used in 12% of cases and a mix of wood and paraffin in 7% of households. A fifth (21%) of
these households uses no energy source. A third of households (34%) with medium living standards use electricity
exclusively, with 15% using firewood. Just under a quarter (23%) reports no energy use. As for high living standard
households, more than half (57%) use electricity only, 7% use electricity with gas, and 21% report no energy use.
Table 25: Energy Choice for Heating Rooms and Keeping Warm, by Electrification Status and Living Standard (Column Percent)
Multiple energy sources for heating
South Africa
ElectrifiedNon-
electrifiedLow Medium High
Single energy use 61 62 54 61 57 64
Electricity only 43 47 1 1 34 57
Firewood only 11 8 39 44 15 1
Paraffin only 4 3 11 12 5 1
Gas only 2 2 0 0 1 3
Coal only 1 1 3 3 1 1
Dry cell batteries only 1 1 0 0 0 1
Solar system only 0 0 0 0 0 0
Generator only 0 0 0 0 0 0
Multiple energy use 18 18 16 18 20 15
Paraffin & electricity 4 5 0 1 8 1
Firewood & electricity 3 3 0 1 5 1
Gas & electricity 3 3 0 0 1 7
Paraffin & firewood 1 1 7 7 1 0
Paraffin, firewood & electricity 1 1 0 2 2 0
Paraffin, gas & electricity 0 0 0 0 0 0
Coal & electricity 1 1 0 0 1 1
Other energy combinations 4 3 8 7 3 4
No energy source used for space heating and keeping warm
21 20 30 21 23 21
Blankets, warm clothing & hot water bottles
19 19 27 16 21 19
None of the above 2 2 4 5 2 1
Total 100 100 100 100 100 100
Source: SASAS Energy related behaviour and perception survey (2012)
At the provincial level of analysis, at least 60% of households in four of the nine provinces (Mpumalanga, Gauteng,
Limpopo and the Free State) use a single energy source for space heating, with Eastern Cape following closely behind
(Table 26). In all the provinces except Limpopo, electricity is the main exclusive energy source used for heating. In
Limpopo the fuel that dominate is wood (42%). Electricity dominates as the single energy used among households
in the Western Cape, with a large share of households also using no energy source for heating (41%). Similarly, in
the Eastern Cape electricity dominate as a single source (31%) but with larger shares using firewood and paraffin
only (13% respectively). All other sources or combinations of sources constitute less than 10%. The Northern Cape,

52
KwaZulu Natal and North West exhibit similar energy choices for heating rooms, with electricity dominating (29%;
44% and 32% respectively) followed by firewood (16%; 10%; 14%). The use of firewood and electricity combined
constitute larger than average shares in these three provinces (9%; 6%; 8%) as does the use of no energy source (36%;
25%; 28%). In the Free State 37% of households use only electricity to heat up their rooms, 11% only use paraffin
and 10% only use firewood. Almost a fifth (18%) use both electricity and paraffin. In Gauteng electricity dominate
with more than half (58%) of households only using electricity to heat rooms. In Mpumalanga almost half (49%) of
the households only use electricity with another 15% who only use firewood. Just under a tenth (7%) of households
in this province use coal. Limpopo is the only province where electricity does not dominate as a single source to heat
rooms. In Limpopo, the majority of households (42%) use only firewood to heat up their rooms, followed by 21%
households who use electricity only.
Table 26: Energy Choice for Heating Rooms and Keeping Warm, by Province (Column Percent)
Multiple energy sources for heating
WC EC NC FS KZN NW GP MP LP
Single energy use 49 59 50 61 56 48 69 74 67
Electricity only 45 31 29 37 44 32 58 49 21
Firewood only 0 13 16 10 10 14 1 15 42
Paraffin only 3 13 2 11 1 0 2 2 2
Gas only 0 1 0 1 0 1 5 1 0
Coal only 0 1 3 0 0 1 1 7 1
Dry cell batteries only 0 0 0 0 0 0 2 0 0
Solar system only 0 0 0 0 0 1 0 0 1
Generator only 0 0 0 0 0 0 0 0 0
Multiple energy use 10 32 14 36 20 24 13 12 9
Paraffin & electricity 5 7 1 18 5 7 1 0 1
Firewood & electricity 1 1 9 1 6 8 1 3 4
Gas & electricity 1 8 1 7 1 3 5 3 2
Paraffin & firewood 0 7 0 1 1 0 0 0 0
Paraffin, firewood & electricity 0 6 0 0 2 2 0 0 1
Paraffin, gas & electricity 0 0 0 1 0 0 0 0 0
Coal & electricity 0 0 0 2 1 1 3 2 0
Other energy combinations 3 4 3 6 5 3 4 5 3
No energy source used for space heating and keeping warm
41 8 36 3 25 28 18 14 24
Blankets, warm clothing & hot water bottles
39 7 27 3 24 26 15 13 22
None of the above 2 1 9 0 1 2 3 0 2
Total 100 100 100 100 100 100 100 100 100
Source: SASAS Energy related behaviour and perception survey (2012)
From Table 27, it is evident that single energy use is more prevalent in formal urban areas relative to other locations,
due to the fact that more than half of households (56%) in these areas use only electricity to heat rooms. A further
22% of households in formal urban areas use multiple energy sources, with the highest shares reportedly using either
electricity with paraffin (8%) or electricity with gas (5%). Around a fifth (19%) uses no energy source. In households
based in informal urban settlements, the single use of electricity still accounts for the largest share of responses
(24%), which is equal to the share indicating that no energy source is employed for space heating. Paraffin is also
more common, either exclusively (16%) or coupled with electricity (10%). In rural, traditional authority areas and
on rural farms alike, the single use of firewood for space heating predominates, followed by the exclusive use of
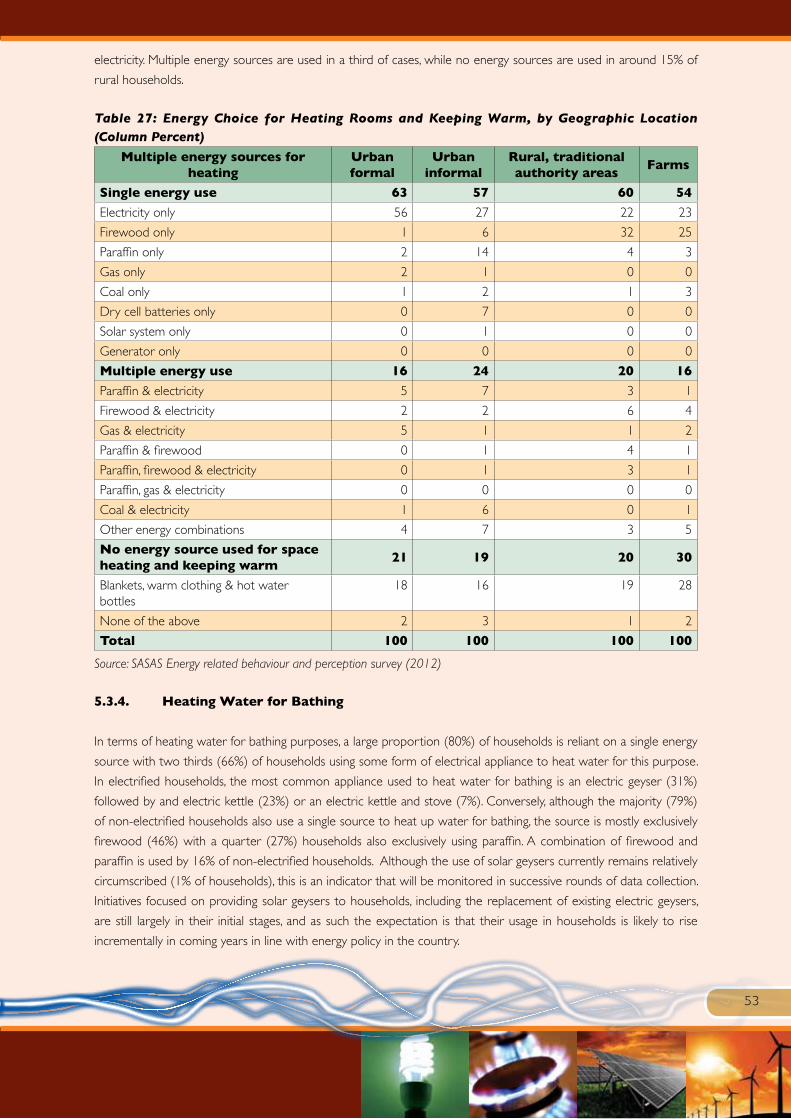
53
electricity. Multiple energy sources are used in a third of cases, while no energy sources are used in around 15% of
rural households.
Table 27: Energy Choice for Heating Rooms and Keeping Warm, by Geographic Location (Column Percent)
Multiple energy sources for heating
Urban formal
Urban informal
Rural, traditional authority areas
Farms
Single energy use 63 57 60 54
Electricity only 56 27 22 23
Firewood only 1 6 32 25
Paraffin only 2 14 4 3
Gas only 2 1 0 0
Coal only 1 2 1 3
Dry cell batteries only 0 7 0 0
Solar system only 0 1 0 0
Generator only 0 0 0 0
Multiple energy use 16 24 20 16
Paraffin & electricity 5 7 3 1
Firewood & electricity 2 2 6 4
Gas & electricity 5 1 1 2
Paraffin & firewood 0 1 4 1
Paraffin, firewood & electricity 0 1 3 1
Paraffin, gas & electricity 0 0 0 0
Coal & electricity 1 6 0 1
Other energy combinations 4 7 3 5
No energy source used for space heating and keeping warm
21 19 20 30
Blankets, warm clothing & hot water bottles
18 16 19 28
None of the above 2 3 1 2
Total 100 100 100 100
Source: SASAS Energy related behaviour and perception survey (2012)
5.3.4. Heating Water for Bathing
In terms of heating water for bathing purposes, a large proportion (80%) of households is reliant on a single energy
source with two thirds (66%) of households using some form of electrical appliance to heat water for this purpose.
In electrified households, the most common appliance used to heat water for bathing is an electric geyser (31%)
followed by and electric kettle (23%) or an electric kettle and stove (7%). Conversely, although the majority (79%)
of non-electrified households also use a single source to heat up water for bathing, the source is mostly exclusively
firewood (46%) with a quarter (27%) households also exclusively using paraffin. A combination of firewood and
paraffin is used by 16% of non-electrified households. Although the use of solar geysers currently remains relatively
circumscribed (1% of households), this is an indicator that will be monitored in successive rounds of data collection.
Initiatives focused on providing solar geysers to households, including the replacement of existing electric geysers,
are still largely in their initial stages, and as such the expectation is that their usage in households is likely to rise
incrementally in coming years in line with energy policy in the country.
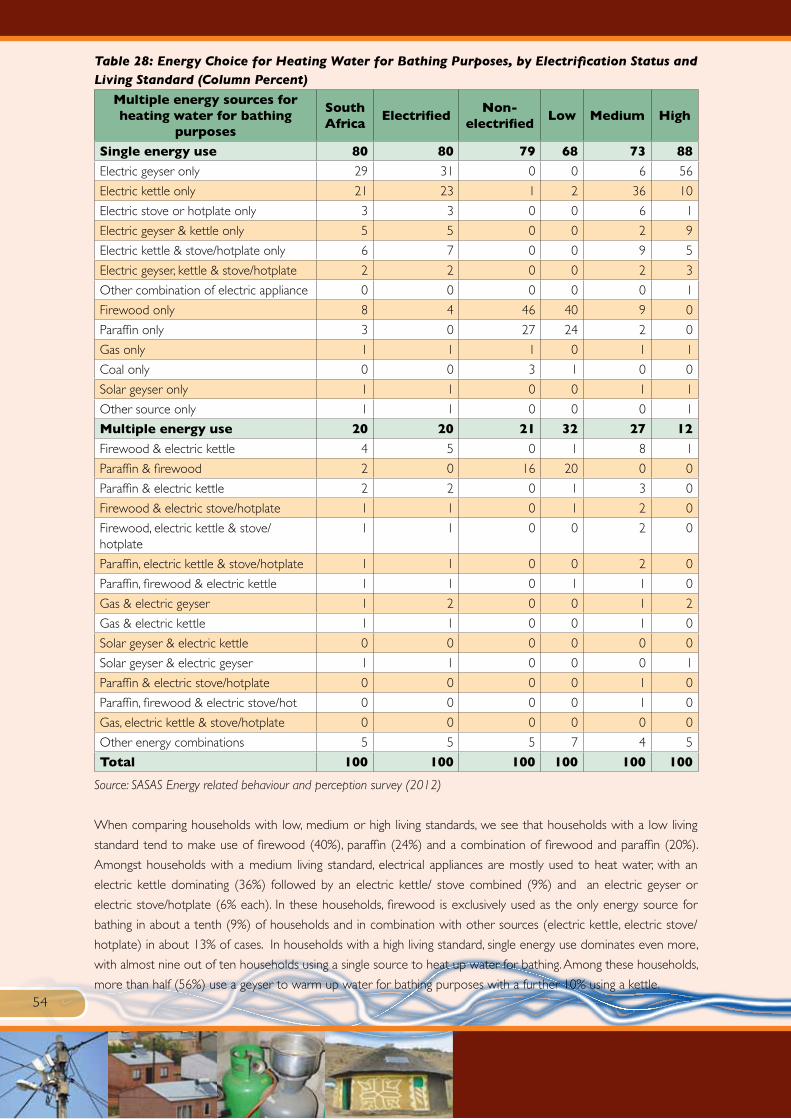
54
Table 28: Energy Choice for Heating Water for Bathing Purposes, by Electrification Status and Living Standard (Column Percent)
Multiple energy sources for heating water for bathing
purposes
South Africa
ElectrifiedNon-
electrifiedLow Medium High
Single energy use 80 80 79 68 73 88
Electric geyser only 29 31 0 0 6 56
Electric kettle only 21 23 1 2 36 10
Electric stove or hotplate only 3 3 0 0 6 1
Electric geyser & kettle only 5 5 0 0 2 9
Electric kettle & stove/hotplate only 6 7 0 0 9 5
Electric geyser, kettle & stove/hotplate 2 2 0 0 2 3
Other combination of electric appliance 0 0 0 0 0 1
Firewood only 8 4 46 40 9 0
Paraffin only 3 0 27 24 2 0
Gas only 1 1 1 0 1 1
Coal only 0 0 3 1 0 0
Solar geyser only 1 1 0 0 1 1
Other source only 1 1 0 0 0 1
Multiple energy use 20 20 21 32 27 12
Firewood & electric kettle 4 5 0 1 8 1
Paraffin & firewood 2 0 16 20 0 0
Paraffin & electric kettle 2 2 0 1 3 0
Firewood & electric stove/hotplate 1 1 0 1 2 0
Firewood, electric kettle & stove/hotplate
1 1 0 0 2 0
Paraffin, electric kettle & stove/hotplate 1 1 0 0 2 0
Paraffin, firewood & electric kettle 1 1 0 1 1 0
Gas & electric geyser 1 2 0 0 1 2
Gas & electric kettle 1 1 0 0 1 0
Solar geyser & electric kettle 0 0 0 0 0 0
Solar geyser & electric geyser 1 1 0 0 0 1
Paraffin & electric stove/hotplate 0 0 0 0 1 0
Paraffin, firewood & electric stove/hot 0 0 0 0 1 0
Gas, electric kettle & stove/hotplate 0 0 0 0 0 0
Other energy combinations 5 5 5 7 4 5
Total 100 100 100 100 100 100
Source: SASAS Energy related behaviour and perception survey (2012)
When comparing households with low, medium or high living standards, we see that households with a low living
standard tend to make use of firewood (40%), paraffin (24%) and a combination of firewood and paraffin (20%).
Amongst households with a medium living standard, electrical appliances are mostly used to heat water, with an
electric kettle dominating (36%) followed by an electric kettle/ stove combined (9%) and an electric geyser or
electric stove/hotplate (6% each). In these households, firewood is exclusively used as the only energy source for
bathing in about a tenth (9%) of households and in combination with other sources (electric kettle, electric stove/
hotplate) in about 13% of cases. In households with a high living standard, single energy use dominates even more,
with almost nine out of ten households using a single source to heat up water for bathing. Among these households,
more than half (56%) use a geyser to warm up water for bathing purposes with a further 10% using a kettle.

55
Table 29: Energy Choice for Heating Water for Bathing Purposes, by Province (Column Percent)
Multiple energy sources for heating water for bathing
purposesWC EC NC FS KZN NW GP MP LP
Single energy use 94 73 75 86 74 63 91 75 63
Electric geyser only 40 22 11 22 19 19 49 17 12
Electric kettle only 24 20 36 34 14 18 21 32 14
Electric stove or hotplate only 4 1 2 11 4 5 1 3 1
Electric geyser & kettle only 7 3 1 12 4 4 7 5 1
Electric kettle & stove/hotplate only 6 6 9 4 13 6 5 2 1
Electric geyser, kettle & stove/hotplate 3 4 1 1 4 3 1 0 0
Other combination of electric appliance 0 0 1 2 0 0 0 0 0
Firewood only 5 7 7 0 12 7 0 5 32
Paraffin only 0 7 0 1 1 1 3 8 0
Gas only 2 1 2 1 1 0 1 0 0
Coal only 0 1 2 0 0 0 0 2 0
Solar geyser only 2 2 2 0 1 1 1 1 1
Other source only 1 0 0 0 0 0 2 0 0
Multiple energy use 6 27 25 14 26 37 9 25 37
Firewood & electric kettle 0 1 10 0 3 15 1 8 17
Paraffin & firewood 0 6 1 2 3 2 0 0 1
Paraffin & electric kettle 2 3 1 5 1 7 1 1 2
Firewood & electric stove/hotplate 0 1 4 0 1 1 0 0 3
Firewood, electric kettle & stove/hotplate 0 1 1 0 2 1 0 1 3
Paraffin, electric kettle & stove/hotplate 0 2 0 0 4 0 0 0 0
Paraffin, firewood & electric kettle 0 3 0 0 1 1 0 0 0
Gas & electric geyser 0 0 0 1 0 0 2 8 1
Gas & electric kettle 0 0 0 0 1 4 0 1 0
Solar geyser & electric kettle 0 1 1 0 1 0 1 0 0
Solar geyser & electric geyser 1 0 0 0 0 1 1 0 0
Paraffin & electric stove/hotplate 0 1 0 0 1 0 0 0 1
Paraffin, firewood & electric stove/hotplate 0 2 0 0 1 0 0 0 0
Gas, electric kettle & stove/hotplate 0 0 0 0 1 1 0 1 0
Other energy combinations 3 7 6 4 6 3 3 5 9
Total 100 100 100 100 100 100 100 100 100
Source: SASAS Energy related behaviour and perception survey (2012)
More than eight in ten households (84%) in the Western Cape, Free State, and Gauteng exclusively use some form
of electricity to heat water for bathing purposes. In the case of Western Cape and Gauteng electric geysers dominate
(40% and 49% respectively) with around a quarter (24% and 21%) using an electric kettle. In the Free State the use
of an electric kettle dominates – used by more than a third (34%) of all households, followed by an electric geyser
(22%); electric geyser and kettle (12%); and an electric stove or hotplate (11%).
In the Eastern Cape, just more than half (56%) make use of some form of electricity with the single use of a geyser
(22%) and a kettle (20%) dominating. Almost a tenth (7%) of households in the Eastern Cape exclusively makes use
of firewood with a further 7% also exclusively making use of paraffin. More than a quarter of households in this
province make use of a combination of fuels. In the Northern Cape, more than three-fifths (61%) of households use
some form of electricity as a single source to heat up water for bathing with the use of a kettle dominating at 36%,
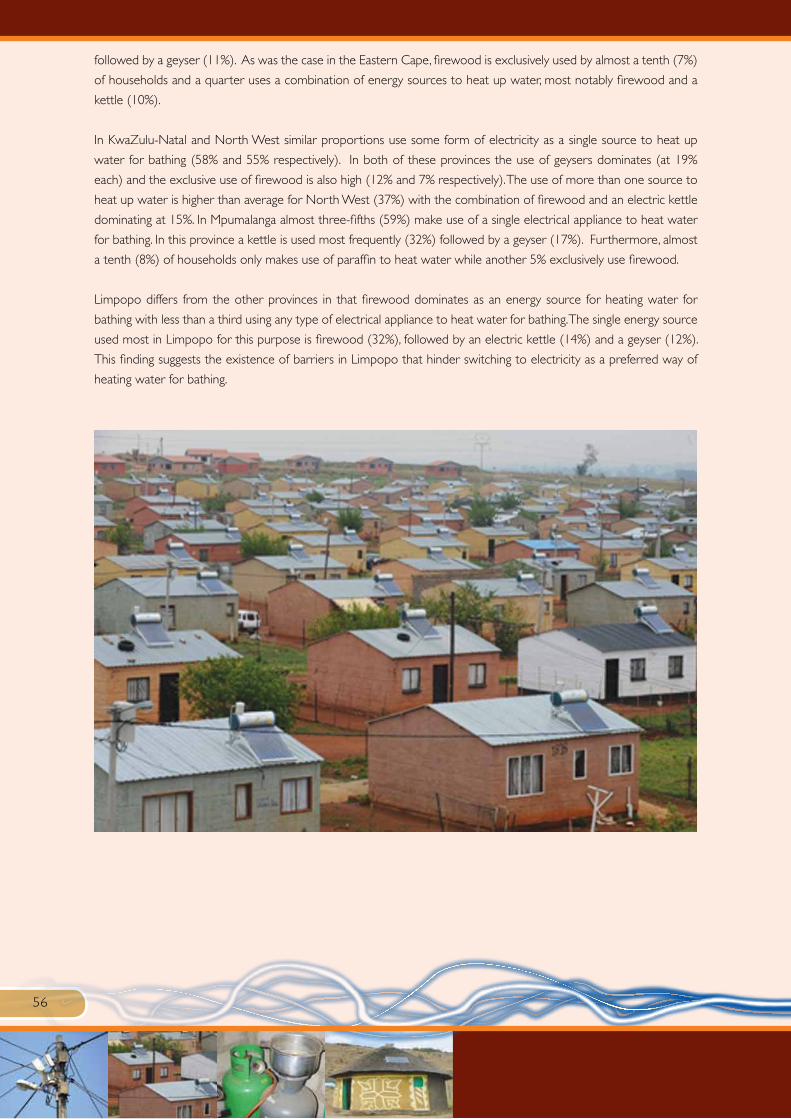
56
followed by a geyser (11%). As was the case in the Eastern Cape, firewood is exclusively used by almost a tenth (7%)
of households and a quarter uses a combination of energy sources to heat up water, most notably firewood and a
kettle (10%).
In KwaZulu-Natal and North West similar proportions use some form of electricity as a single source to heat up
water for bathing (58% and 55% respectively). In both of these provinces the use of geysers dominates (at 19%
each) and the exclusive use of firewood is also high (12% and 7% respectively). The use of more than one source to
heat up water is higher than average for North West (37%) with the combination of firewood and an electric kettle
dominating at 15%. In Mpumalanga almost three-fifths (59%) make use of a single electrical appliance to heat water
for bathing. In this province a kettle is used most frequently (32%) followed by a geyser (17%). Furthermore, almost
a tenth (8%) of households only makes use of paraffin to heat water while another 5% exclusively use firewood.
Limpopo differs from the other provinces in that firewood dominates as an energy source for heating water for
bathing with less than a third using any type of electrical appliance to heat water for bathing. The single energy source
used most in Limpopo for this purpose is firewood (32%), followed by an electric kettle (14%) and a geyser (12%).
This finding suggests the existence of barriers in Limpopo that hinder switching to electricity as a preferred way of
heating water for bathing.

57
Table 30: Energy Choice for Heating Water for Bathing Purposes, by Geographic Location (Column Percent)
Multiple energy sources for heating water for bathing purposes
Urban formal
Urban informal
Rural, traditional authority areas
Farms
Single energy use 87 79 60 81
Electric geyser only 43 16 1 19
Electric kettle only 20 35 20 14
Electric stove or hotplate only 2 3 3 10
Electric geyser & kettle only 8 0 0 5
Electric kettle & stove/hotplate only 6 8 7 3
Electric geyser, kettle & stove/hotplate 3 0 1 4
Other combination of electric appliance 0 0 0 0
Firewood only 0 2 24 17
Paraffin only 1 14 2 5
Gas only 1 0 0 1
Coal only 0 0 0 2
Solar geyser only 1 0 1 1
Other source only 1 0 0 0
Multiple energy use 13 21 40 19
Firewood & electric kettle 1 3 12 6
Paraffin & firewood 0 2 4 5
Paraffin & electric kettle 2 3 3 0
Firewood & electric stove/hotplate 0 1 2 1
Firewood, electric kettle & stove/hotplate 0 0 3 2
Paraffin, electric kettle & stove/hotplate 1 2 1 0
Paraffin, firewood & electric kettle 0 2 2 1
Gas & electric geyser 2 0 0 0
Gas & electric kettle 0 2 1 0
Solar geyser & electric kettle 1 1 0 0
Solar geyser & electric geyser 1 0 0 0
Paraffin & electric stove/hotplate 0 0 1 0
Paraffin, firewood & electric stove/hot 0 0 1 0
Gas, electric kettle & stove/hotplate 0 0 0 1
Other energy combinations 3 4 9 4
Total 100 100 100 100
Source: SASAS Energy related behaviour and perception survey (2012)
From Table 30 it is evident that single energy use is more prevalent in formal urban areas relative to other locations,
substantiated by the fact that almost five in ten (43%) households in these areas use an electric geyser to heat water,
followed by a fifth (20%) using an electric kettle. No other energy source or combination of sources constitutes
more than 10% in urban formal areas. Single energy use is also a reality in urban informal households with the use
of an electric kettle dominating (35%) followed by an electric geysers (16%). The use of paraffin as a single source to
heat water for bathing is also significantly higher in urban informal areas than in any other geographic area (at 14%).
In rural traditional areas multiple energy use is more common with 40% of all households in these areas using a
combination of sources to heat water for bathing. However, wood remains the single most dominant energy source,
with a quarter (24%) of households in these areas only using wood to heat water for bathing purposes followed by
an electric kettle (20%). On rural farms the use of a single source to heat water for bathing is common (81%) with a
variety of sources used. Almost a fifth (19%) of households on farms use electric geysers only, followed by firewood
(17%), electric kettles (14%) and an electric stove or hotplate (10%).

58
Among electrified households, those in formal urban areas were most like to report the use of electric geysers as
the predominant source for heating water for bathing (44%), while the use of an electric kettle was most common
in informal urban settlements (42%) (results not shown). In rural traditional authority areas, electric kettles are the
most reported source (24%) followed by firewood (17%) or a combination of the two (15%). For electrified rural
farm households, electric geysers, electric kettles and electric stoves or hotplates were the three main sources used
for heating bath water (26%, 19% and 15% respectively). For non-electrified households, those in formal or informal
urban areas mostly rely on paraffin (both 75%), while firewood is most common in rural traditional authority areas
and rural farms (64% and 53% respectively).
5.3.5. Heating Water for Other Purposes
With respect to energy choices and preferences for heating water for purposes other than bathing, the survey
shows that 95% of South African households on average rely on a single energy source, with a small share (5%)
characterised by multiple energy use (Table 31). Considerable effort will be required in coming years to ensure
that there is increasing diversification in the energy sources employed to heat water for general purposes. Given
the emphasis of South African energy policy on the proliferation of renewable energy sources and technologies, it is
somewhat concerning that households almost exclusively rely on electricity to heat water, especially recognising the
current excessive demand on the national electricity grid.
In the case of electrified households, 83% use some electrical appliance to heat water. In the case of non-electrified
households, firewood is exclusively used in 52% of households followed by a further 38% that exclusively use paraffin.
The pattern of energy use for non-electrified households is almost identical for households with a low living standard.
It is also noted, that an increase in living standard results in fuel switching, that is from firewood and paraffin to
electricity. As previously discussed, in spite of the low current reliance on solar geysers for the purpose of heating
water (2%), their usage needs to be monitored in future due to the increasing policy and programmatic emphasis on
the increasing uptake of this renewable technology.
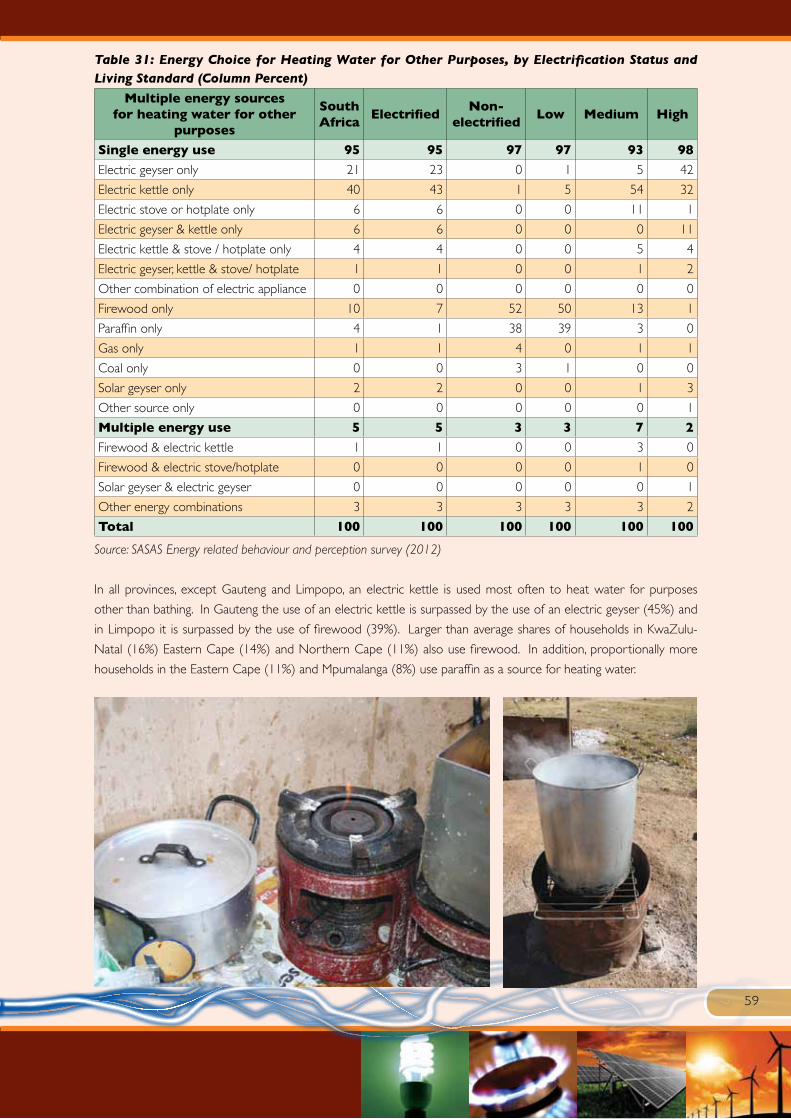
59
Table 31: Energy Choice for Heating Water for Other Purposes, by Electrification Status and Living Standard (Column Percent)
Multiple energy sources for heating water for other
purposes
South Africa
ElectrifiedNon-
electrifiedLow Medium High
Single energy use 95 95 97 97 93 98
Electric geyser only 21 23 0 1 5 42
Electric kettle only 40 43 1 5 54 32
Electric stove or hotplate only 6 6 0 0 11 1
Electric geyser & kettle only 6 6 0 0 0 11
Electric kettle & stove / hotplate only 4 4 0 0 5 4
Electric geyser, kettle & stove/ hotplate 1 1 0 0 1 2
Other combination of electric appliance 0 0 0 0 0 0
Firewood only 10 7 52 50 13 1
Paraffin only 4 1 38 39 3 0
Gas only 1 1 4 0 1 1
Coal only 0 0 3 1 0 0
Solar geyser only 2 2 0 0 1 3
Other source only 0 0 0 0 0 1
Multiple energy use 5 5 3 3 7 2
Firewood & electric kettle 1 1 0 0 3 0
Firewood & electric stove/hotplate 0 0 0 0 1 0
Solar geyser & electric geyser 0 0 0 0 0 1
Other energy combinations 3 3 3 3 3 2
Total 100 100 100 100 100 100
Source: SASAS Energy related behaviour and perception survey (2012)
In all provinces, except Gauteng and Limpopo, an electric kettle is used most often to heat water for purposes
other than bathing. In Gauteng the use of an electric kettle is surpassed by the use of an electric geyser (45%) and
in Limpopo it is surpassed by the use of firewood (39%). Larger than average shares of households in KwaZulu-
Natal (16%) Eastern Cape (14%) and Northern Cape (11%) also use firewood. In addition, proportionally more
households in the Eastern Cape (11%) and Mpumalanga (8%) use paraffin as a source for heating water.

60
Table 32: Energy Choice for Heating Water for Other Purposes, by Province (Column Percent)
Multiple energy sources for heating water for other purposes
WC EC NC FS KZN NW GP MP LP
Single energy use 99 95 93 98 93 94 97 93 93
Electric geyser only 13 6 11 28 10 18 45 17 9
Electric kettle only 52 42 48 45 37 50 28 52 38
Electric stove or hotplate only 4 6 7 14 10 10 2 4 3
Electric geyser & kettle only 13 10 1 3 2 1 9 0 0
Electric kettle & stove / hotplate only 6 4 8 1 9 2 2 0 2
Electric geyser, kettle & stove/ hotplate 2 1 0 2 3 0 1 0 0
Other combination of electric appliance 0 0 0 0 0 0 0 0 0
Firewood only 4 14 11 1 16 9 0 8 39
Paraffin only 1 11 0 1 4 2 4 8 0
Gas only 2 1 1 1 1 0 1 0 0
Coal only 0 1 2 0 0 0 0 2 0
Solar geyser only 3 1 3 1 2 1 2 1 1
Other source only 0 0 0 0 0 0 1 0 0
Multiple energy use 1 5 7 2 7 6 3 7 7
Firewood & electric kettle 0 1 2 0 1 3 1 1 4
Firewood & electric stove/hotplate 0 1 1 0 1 0 0 0 1
Solar geyser & electric geyser 0 0 0 0 0 0 1 0 0
Other energy combinations 1 3 4 2 4 3 1 6 2
Total 100 100 100 100 100 100 100 100 100
Source: SASAS Energy related behaviour and perception survey (2012)
In all geographical areas single fuel use dominates. In urban formal areas households predominantly use an electric
kettle (41%) or an electric geyser (31%) or a combination of the two (10%) to heat water. In urban informal
settlements a kettle is mostly used (49%), followed by paraffin (16%), an electric geyser (14%) or a stove or hotplate
(6%). In rural traditional areas an electric kettle is commonly used by 37% of households, closely followed by firewood,
used by almost a third of households (32%). On rural farms an electric kettle (33%), firewood (21%), electric geyser
(20%) or paraffin (7%) is mostly used to heat water for other purposes than bathing.
Among electrified households, the predominant source for heating water for non-bathing purposes in all geographic
locations is an electric kettle (ranging from 41% to 59%). In urban areas and rural farms, electric geysers form a
notable secondary source (ranging from 17% to 31%), while in rural traditional authority areas, firewood serves as
a key secondary source (26%). Among non-electrified households, those in formal or informal urban settings are
primarily reliant on paraffin for heating water for non-bathing purposes (65% in formal urban; 83% in informal urban),
while in rural areas firewood is the main source employed (64% in rural traditional authority areas; 70% on rural
farms).
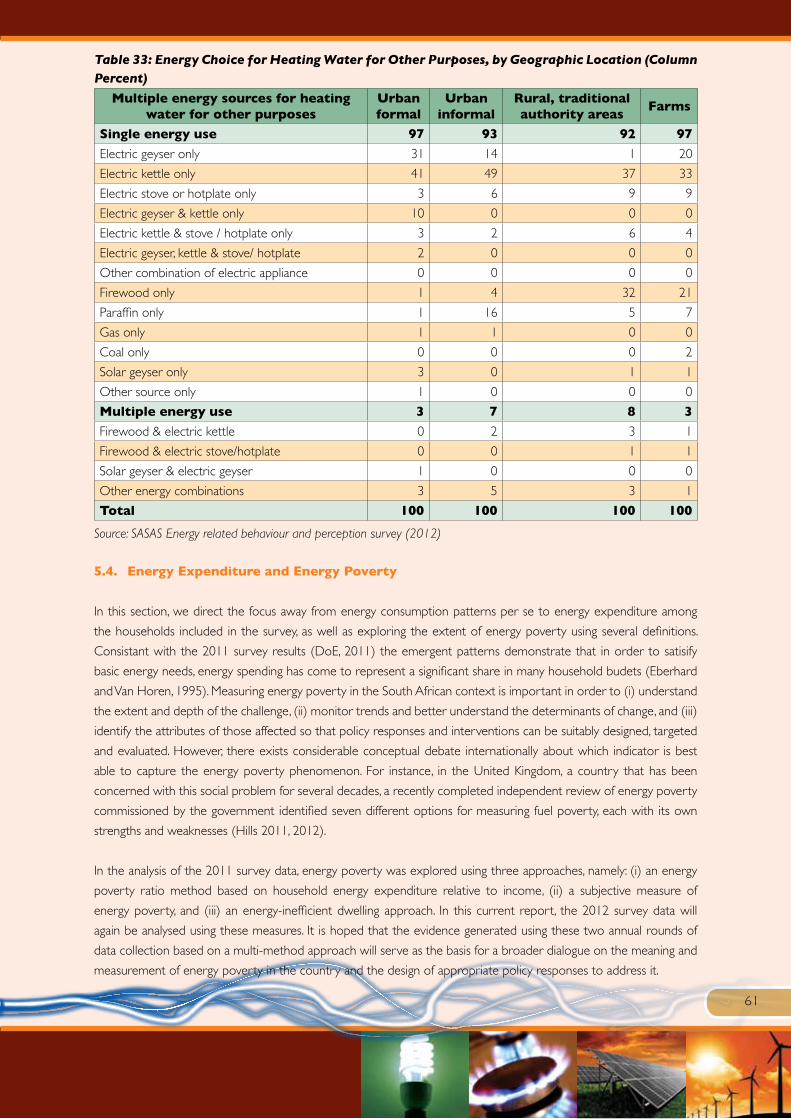
61
Table 33: Energy Choice for Heating Water for Other Purposes, by Geographic Location (Column Percent)
Multiple energy sources for heating water for other purposes
Urban formal
Urban informal
Rural, traditional authority areas
Farms
Single energy use 97 93 92 97
Electric geyser only 31 14 1 20
Electric kettle only 41 49 37 33
Electric stove or hotplate only 3 6 9 9
Electric geyser & kettle only 10 0 0 0
Electric kettle & stove / hotplate only 3 2 6 4
Electric geyser, kettle & stove/ hotplate 2 0 0 0
Other combination of electric appliance 0 0 0 0
Firewood only 1 4 32 21
Paraffin only 1 16 5 7
Gas only 1 1 0 0
Coal only 0 0 0 2
Solar geyser only 3 0 1 1
Other source only 1 0 0 0
Multiple energy use 3 7 8 3
Firewood & electric kettle 0 2 3 1
Firewood & electric stove/hotplate 0 0 1 1
Solar geyser & electric geyser 1 0 0 0
Other energy combinations 3 5 3 1
Total 100 100 100 100
Source: SASAS Energy related behaviour and perception survey (2012)
5.4. Energy Expenditure and Energy Poverty
In this section, we direct the focus away from energy consumption patterns per se to energy expenditure among
the households included in the survey, as well as exploring the extent of energy poverty using several definitions.
Consistant with the 2011 survey results (DoE, 2011) the emergent patterns demonstrate that in order to satisify
basic energy needs, energy spending has come to represent a significant share in many household budets (Eberhard
and Van Horen, 1995). Measuring energy poverty in the South African context is important in order to (i) understand
the extent and depth of the challenge, (ii) monitor trends and better understand the determinants of change, and (iii)
identify the attributes of those affected so that policy responses and interventions can be suitably designed, targeted
and evaluated. However, there exists considerable conceptual debate internationally about which indicator is best
able to capture the energy poverty phenomenon. For instance, in the United Kingdom, a country that has been
concerned with this social problem for several decades, a recently completed independent review of energy poverty
commissioned by the government identified seven different options for measuring fuel poverty, each with its own
strengths and weaknesses (Hills 2011, 2012).
In the analysis of the 2011 survey data, energy poverty was explored using three approaches, namely: (i) an energy
poverty ratio method based on household energy expenditure relative to income, (ii) a subjective measure of
energy poverty, and (iii) an energy-inefficient dwelling approach. In this current report, the 2012 survey data will
again be analysed using these measures. It is hoped that the evidence generated using these two annual rounds of
data collection based on a multi-method approach will serve as the basis for a broader dialogue on the meaning and
measurement of energy poverty in the country and the design of appropriate policy responses to address it.
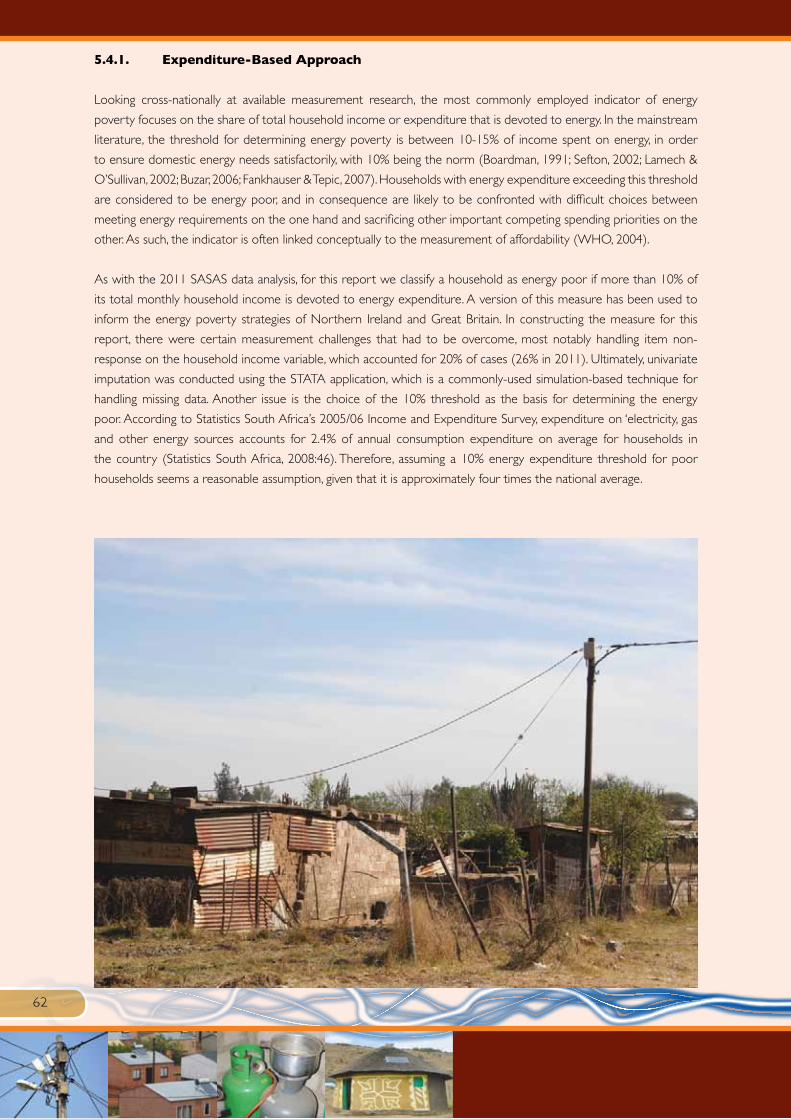
62
5.4.1. Expenditure-Based Approach
Looking cross-nationally at available measurement research, the most commonly employed indicator of energy
poverty focuses on the share of total household income or expenditure that is devoted to energy. In the mainstream
literature, the threshold for determining energy poverty is between 10-15% of income spent on energy, in order
to ensure domestic energy needs satisfactorily, with 10% being the norm (Boardman, 1991; Sefton, 2002; Lamech &
O’Sullivan, 2002; Buzar, 2006; Fankhauser & Tepic, 2007). Households with energy expenditure exceeding this threshold
are considered to be energy poor, and in consequence are likely to be confronted with difficult choices between
meeting energy requirements on the one hand and sacrificing other important competing spending priorities on the
other. As such, the indicator is often linked conceptually to the measurement of affordability (WHO, 2004).
As with the 2011 SASAS data analysis, for this report we classify a household as energy poor if more than 10% of
its total monthly household income is devoted to energy expenditure. A version of this measure has been used to
inform the energy poverty strategies of Northern Ireland and Great Britain. In constructing the measure for this
report, there were certain measurement challenges that had to be overcome, most notably handling item non-
response on the household income variable, which accounted for 20% of cases (26% in 2011). Ultimately, univariate
imputation was conducted using the STATA application, which is a commonly-used simulation-based technique for
handling missing data. Another issue is the choice of the 10% threshold as the basis for determining the energy
poor. According to Statistics South Africa’s 2005/06 Income and Expenditure Survey, expenditure on ‘electricity, gas
and other energy sources accounts for 2.4% of annual consumption expenditure on average for households in
the country (Statistics South Africa, 2008:46). Therefore, assuming a 10% energy expenditure threshold for poor
households seems a reasonable assumption, given that it is approximately four times the national average.
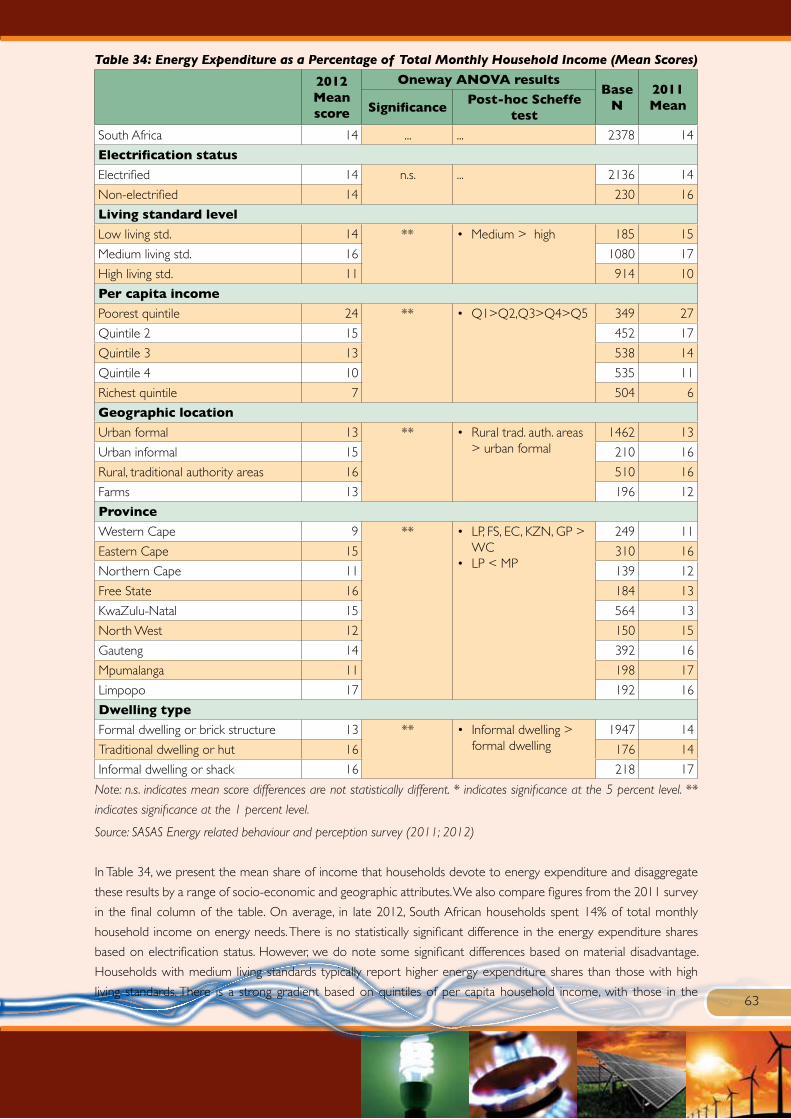
63
Table 34: Energy Expenditure as a Percentage of Total Monthly Household Income (Mean Scores)
2012Mean score
Oneway ANOVA resultsBase
N2011MeanSignificance
Post-hoc Scheffe test
South Africa 14 ... ... 2378 14
Electrification status
Electrified 14 n.s. ... 2136 14
Non-electrified 14 230 16
Living standard level
Low living std. 14 ** • Medium > high 185 15
Medium living std. 16 1080 17
High living std. 11 914 10
Per capita income
Poorest quintile 24 ** • Q1>Q2,Q3>Q4>Q5 349 27
Quintile 2 15 452 17
Quintile 3 13 538 14
Quintile 4 10 535 11
Richest quintile 7 504 6
Geographic location
Urban formal 13 ** • Rural trad. auth. areas > urban formal
1462 13
Urban informal 15 210 16
Rural, traditional authority areas 16 510 16
Farms 13 196 12
Province
Western Cape 9 ** • LP, FS, EC, KZN, GP > WC
• LP < MP
249 11
Eastern Cape 15 310 16
Northern Cape 11 139 12
Free State 16 184 13
KwaZulu-Natal 15 564 13
North West 12 150 15
Gauteng 14 392 16
Mpumalanga 11 198 17
Limpopo 17 192 16
Dwelling type
Formal dwelling or brick structure 13 ** • Informal dwelling > formal dwelling
1947 14
Traditional dwelling or hut 16 176 14
Informal dwelling or shack 16 218 17
Note: n.s. indicates mean score differences are not statistically different. * indicates significance at the 5 percent level. **
indicates significance at the 1 percent level.
Source: SASAS Energy related behaviour and perception survey (2011; 2012)
In Table 34, we present the mean share of income that households devote to energy expenditure and disaggregate
these results by a range of socio-economic and geographic attributes. We also compare figures from the 2011 survey
in the final column of the table. On average, in late 2012, South African households spent 14% of total monthly
household income on energy needs. There is no statistically significant difference in the energy expenditure shares
based on electrification status. However, we do note some significant differences based on material disadvantage.
Households with medium living standards typically report higher energy expenditure shares than those with high
living standards. There is a strong gradient based on quintiles of per capita household income, with those in the

64
poorest quintile possessing energy expenditure shares that are on average more than three times higher than those
in the richest quintile (24% versus 7%). Households in rural, traditional authority areas are more likely to spend a
greater share of income on meeting energy needs compared to those in formal urban areas. Provincially, households
based in Limpopo, Free State, Eastern Cape, KwaZulu-Natal and Gauteng possess a significantly higher mean energy
expenditure share (ranges from 14%-17%) relative to households in the Western Cape (mean=9%). Finally, those in
informal dwellings or shacks also tend to report higher or a moderately higher energy expenditure share on average
than formal urban areas. The pattern of results from the 2012 survey is broadly comparable with those from 2011. In
both years, the average energy expenditure share is 14% at the national level, while the association between higher
shares of domestic energy spending and material disadvantage is also a consistent finding across both rounds of the
survey.
Having established which types of households are more likely to be spending considerable proportions of their
material resources on securing domestic energy needs, we now turn attention to the energy poverty rate based on
this expenditure approach. Specifically, we profile the share of households that are classified as energy poor using this
definition (i.e. spending more than 10% of income on energy). The results presented in Table 35 show that more than
two-fifths (43%) of all South African households are classified as energy poor, based on this indicator. Again, there
is little variation based on electrification status, while material deprivation is clearly associated with energy poverty.
Around a third (34%) of high living standard households are energy poor, compared with 38% of households with a
low living standard and 50% of those with medium living standard. As for income status, nearly three-quarters (72%)
of households in the poorest quintile are energy poor, compared to less than a fifth of households (18%) in the richest
quintile. Slightly under half (48%) of households in rural traditional authority areas are energy poor compared with a
slighter lower share (40%) in formal urban areas. Again, households in the Western Cape are less likely to be energy
poor (27%) than those in the Eastern Cape, Gauteng and KwaZulu-Natal provinces.

65
Table 35: Energy Poverty Among South Africans, by Household Attributes (Percent)
2012 Energy poverty rate (% spending more
than 10% of net income on
energy)
Oneway ANOVA results
Base N
2011Energy poverty
rateSignificance
Post-hoc Scheffe
test
South Africa 43 ... ... 2378 47
Electrification status
Electrified 43 n.s. ... 2136 47
Non-electrified 44 230 47
Living standard level
Low living std. 38 ** • Medium > high, low living standards
185 45
Medium living std. 50 1080 56
High living std. 34 914 31
Per capita income
Poorest quintile 72 ** • All mean scores are significantly different
349 74
Quintile 2 53 452 65
Quintile 3 44 538 51
Quintile 4 32 535 38
Richest quintile 18 504 13
Geographic location
Urban formal 40 ** • Urban informal > urban formal
1462 44
Urban informal 52 210 49
Rural, traditional authority areas 48 510 53
Farms 43 196 43
Province
Western Cape 27 ** • EC, GP, KZN > WC
249 33
Eastern Cape 50 310 52
Northern Cape 40 139 42
Free State 43 184 43
KwaZulu-Natal 48 564 45
North West 32 150 48
Gauteng 49 392 51
Mpumalanga 36 198 55
Limpopo 44 192 52
Dwelling type
Formal dwelling or brick structure 42 ** • Traditional dwelling > formal dwelling
1947 47
Traditional dwelling or hut 56 176 44
Informal dwelling or shack 45 218 50
Note: n.s. indicates mean score differences are not statistically different. * indicates significance at the 5 percent level. **
indicates significance at the 1 percent level.
Source: SASAS Energy related behaviour and perception survey (2011; 2012)

66
5.4.2. Subjective Approach
Apart from the conventional 10% ratio indicator outlined above, another possible way of examining and measuring
energy poverty would be to rely on subjective indicators to survey questions concerning whether households are
experiencing difficulty in affording the cost associated with meeting their basic energy requirements. Again we draw
on measures that were initially designed for testing as part of the 2011 survey round, and which were replicated in
the 2012 survey. In both instances, the classification of households and by extension individuals as energy poor was
determined by the pattern of responses provided to four questions:
Is the amount of energy your household has less than adequate, just adequate or more than adequate for your
household’s needs?
And are the following inadequate, just adequate or more than adequate for your household’s needs? ...
...the amount of energy for lighting?
...the amount of energy for cooking?
...the amount of energy for heating rooms and keeping warm?
For each of the four items, the response codes were: 1=it is not adequate for your household’s needs; 2=it is just
adequate for your household’s needs; 3=it is more than adequate to meet your household’s needs.
The responses provided by each respondent were used to create a set of dummy variables, where 1=inadequate
for household needs and 0=just or more than adequate for needs. These were then added together into a five-point
summated scale ranging from 0 (adequate on all four items) to 4 (amount of energy deemed inadequate on all items).
For the descriptive analysis presented in this section, we have classified anyone with a value of 1 or higher on the scale
as energy poor and those with a value of 0 as energy secure.1
Before presenting the energy poverty estimates using this subjective measurement approach, it is important to
examine the national frequency distributions on the constituent single indicators to examine perceptions of domestic
energy adequacy and how stable these measures have been between 2011 and 2012. In Figure 13, the responses to
the overall energy adequacy question as well as the three items on energy adequacy in relation to specific end uses is
presented for the two rounds of surveying. Across all four measures and in both years, the modal response provided
by households is that they are ‘just getting by’ in the provisioning for their domestic energy needs, ranging between 50
and 62% of cases. In 2012, a quarter of households (26%) indicated that the amount of energy available was generally
inadequate for its needs, a figure that has remained virtually unchanged since 2011 (25%). Slightly lower shares feel
that the energy available for lighting is inadequate, mentioned by 23% in 2011 and 19% in 2012, while approximately
a quarter of households in both years expressed the view that the energy available for cooking was inadequate for
domestic needs. Slightly higher perceived inadequacy was observed in relation to the energy available to meet the
requirements of heating rooms and keeping warm, though again this has shown a modest decline between the rounds
of interviewing. For all four indicators, less than a quarter of households suggest that the energy available to them is
more than adequate to meet their domestic energy requirements.
1 By considering the full 0-4 rating scale, as opposed to the collapsed version employed here, it would be possible to provide
some additional insight into the depth of energy poverty by commenting on how consistently household respondents report that
the amount of energy used in general and for different end-uses is inadequate for their needs. This is an area requiring follow-up
investigation.

67
Figure 13: Subjective Domestic Energy Adequacy in 2011 and 2012 (Percent)
Source: SASAS Energy related behaviour and perception survey (2011; 2012)
For those specifying that the energy available for domestic needs was generally inadequate, a follow-up question
enquired the main reason why this response had been provided. In both years, the foremost reason offered was the
lack of financial resources to meet the cost to meet energy needs (Table 36). In 2011, more than three-quarters
(77%) offered this explanation, though by 2012 this had declined to 68%, which is rather surprising given the rising
costs of energy in the country. Those reporting that frequent electricity power cuts are the main reason why available
energy is inadequate for their needs doubled from 7% to 14% in inter-survey period, while those reporting concerns
about the load-limited electricity supply in their household rose from 4% to 9%. This change is largely attributable to
a rising concern about the quality and nature of electricity supply. Firewood scarcity increased nominally from a low
base, while gas and paraffin availability problems declined in importance.
Table 36: Principal Reason Offered for Perceived Inadequacy of Available Energy to Meet Domestic Requirements, 2011-12 (Column Percent)
Main reason why amount of energy is inadequate for household’s needs 2011 2012
Not enough money to pay for the energy we need 77 68
There are many electricity power cuts in my area 7 14
The supply of electricity to my household is limited 4 9
Firewood is very scarce 2 4
Gas or paraffin not always available in the shops 6 2
Other reason 2 2
(Uncertain/Don’t know) 1 2
Total 100 100
Base N 688 614
Source: SASAS Energy related behaviour and perception survey (2011; 2012)
25 26 23 1926 24
30 27
14 1913
19 15 20 1418
57 54 6259
57 5453
50
Just adequate for household’s needsNot adequate for household’s needs
More than adequate for household’s needs
Overall energy adequacy
Do not know
100
90
80
70
60
50
40
30
20
10
02011 2012 2011 2012 2011 2012 2011 2012
Lighting Cooking Heating

68
A final behavioural question that was posed to households was how often they had reduced energy expenditure
for lighting, cooking or space heating needs in the year prior to interview (Table 37). In 2011, a third of households
reported that they had done this often or very often, and by 2012 this had risen marginally to 36% of households. It is
important to draw attention the fact that those stating ‘very often’ as a response increased from 8% to 14% between
the two annual survey rounds, suggesting that in an inflationary context, households are more regularly having to
make tough decisions and reduce energy expenditure. Around two-fifths of households (38% in 2011; 40% in 2012)
were either never or rarely compelled to scale back on energy related expenditure in the preceding year. Those
households rating the available energy as inadequate for their domestic needs are more likely to have cut back on
energy spending (44%) than those for whom it is just adequate or more than adequate (32% and 36% respectively).
The implication of this is that gains in energy saving occurring in the domestic sector may be partially attributable
to necessary sacrifices in consumption expenditure during difficult economic times rather than exclusively from
behavioural responses to energy saving campaigns.
Table 37: Frequency of Households Reported Having to Reduce Energy Expenditure on Specific End Use in The Last 12 Months (Column Percent)
How often household has cut back on energy spending in last year 2011 2012
Very often 8 14
Often 24 22
Occasionally 27 22
Rarely 14 18
Never 24 22
(Do not know) 3 2
Total 100 100
Base N 2,981 2,500
Source: SASAS Energy related behaviour and perception survey (2011; 2012)
Returning to the subjective approach to measuring energy poverty, it becomes clear that non-electrified households
rate much higher than electrified households on the subjective energy poverty scale (66% vs. 36%) and can therefore
be considered as more energy poor than electrified households. A relationship between material disadvantage and
subjective energy poverty is clearly evident when one examines the results by living standard level. For instance,
people with a low living standard rate much higher on the subjective energy poverty scale (61%) than those with a
medium (54%) or high living standard (20%), indicating that households with a low living standard are more energy
poor. In terms of the spatial concentration of energy poverty, people residing in rural traditional authority areas have
the highest energy poverty score (60%), followed by people residing in urban informal areas (55%), with the lowest
recorded levels in formal urban areas (26%). Provincially, people from the Limpopo, Eastern Cape, Northern Cape
and KwaZulu-Natal have the highest subjective energy poverty scores, while residents of the Western Cape and
Gauteng are least energy poor using this approach.

69
Figure 14: Subjective Energy Poverty In 2011 and 2012, by Household Attributes (Percent)
Source: SASAS Energy related behaviour and perception survey (2011; 2012)
Figure 14 presents differences in the level of self-reported energy poverty across a select set of socio-demographic
attributes in both 2011 and 2012. The results show that although there is discernible year-on-year variation in the
extent to which respondents classify their households as energy poor, there is broad consistency in the distributional
patterns that emerge. For instance, households that are non-electrified, have a low living standard level or are in the
poorest income quintile, are constructed using traditional materials, and that are located in the Eastern Cape and
Limpopo were most likely to be assessed as energy poor in both rounds of interviewing. Conversely, households
with a high living standard or in the wealthiest income quintile, and situated in Gauteng or the Western Cape were
characterised by the lowest levels of self-reported energy poverty.
Electrified
Limpopo
Mpumalanga
Gauteng
North West
KwaZulu-Natal
Free State
Northern Cape
Eastern CapeWestern Cape
Farms
Non-electrified
Low living std.
Medium living std.
High living std.
Urban formal
Urban informalRural, traditional authority areas
Energy poor 2012
Energy poor 2011
Formal dwelling
Traditional dwelling
Informal dwelling or shack
Poorest quintile
Richest quintile
Quintile 2
Quintile 3
Quintile 4
2012 National avg. (M=38%)
2011 National avg. (M=42%)
70
60
50
40
30
20
10
0
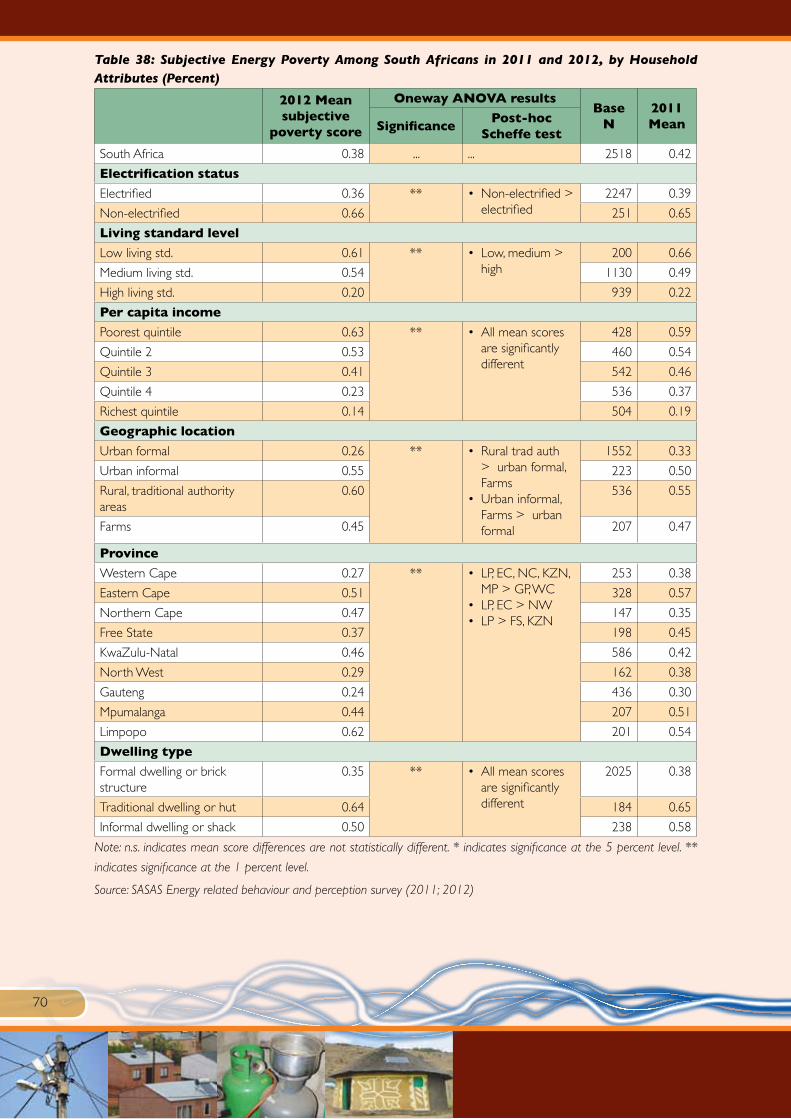
70
Table 38: Subjective Energy Poverty Among South Africans in 2011 and 2012, by Household Attributes (Percent)
2012 Mean subjective
poverty score
Oneway ANOVA resultsBase
N2011MeanSignificance
Post-hoc Scheffe test
South Africa 0.38 ... ... 2518 0.42
Electrification status
Electrified 0.36 ** • Non-electrified > electrified
2247 0.39
Non-electrified 0.66 251 0.65
Living standard level
Low living std. 0.61 ** • Low, medium > high
200 0.66
Medium living std. 0.54 1130 0.49
High living std. 0.20 939 0.22
Per capita income
Poorest quintile 0.63 ** • All mean scores are significantly different
428 0.59
Quintile 2 0.53 460 0.54
Quintile 3 0.41 542 0.46
Quintile 4 0.23 536 0.37
Richest quintile 0.14 504 0.19
Geographic location
Urban formal 0.26 ** • Rural trad auth > urban formal, Farms
• Urban informal, Farms > urban formal
1552 0.33
Urban informal 0.55 223 0.50
Rural, traditional authority areas
0.60 536 0.55
Farms 0.45 207 0.47
Province
Western Cape 0.27 ** • LP, EC, NC, KZN, MP > GP, WC
• LP, EC > NW• LP > FS, KZN
253 0.38
Eastern Cape 0.51 328 0.57
Northern Cape 0.47 147 0.35
Free State 0.37 198 0.45
KwaZulu-Natal 0.46 586 0.42
North West 0.29 162 0.38
Gauteng 0.24 436 0.30
Mpumalanga 0.44 207 0.51
Limpopo 0.62 201 0.54
Dwelling type
Formal dwelling or brick structure
0.35 ** • All mean scores are significantly different
2025 0.38
Traditional dwelling or hut 0.64 184 0.65
Informal dwelling or shack 0.50 238 0.58
Note: n.s. indicates mean score differences are not statistically different. * indicates significance at the 5 percent level. **
indicates significance at the 1 percent level.
Source: SASAS Energy related behaviour and perception survey (2011; 2012)
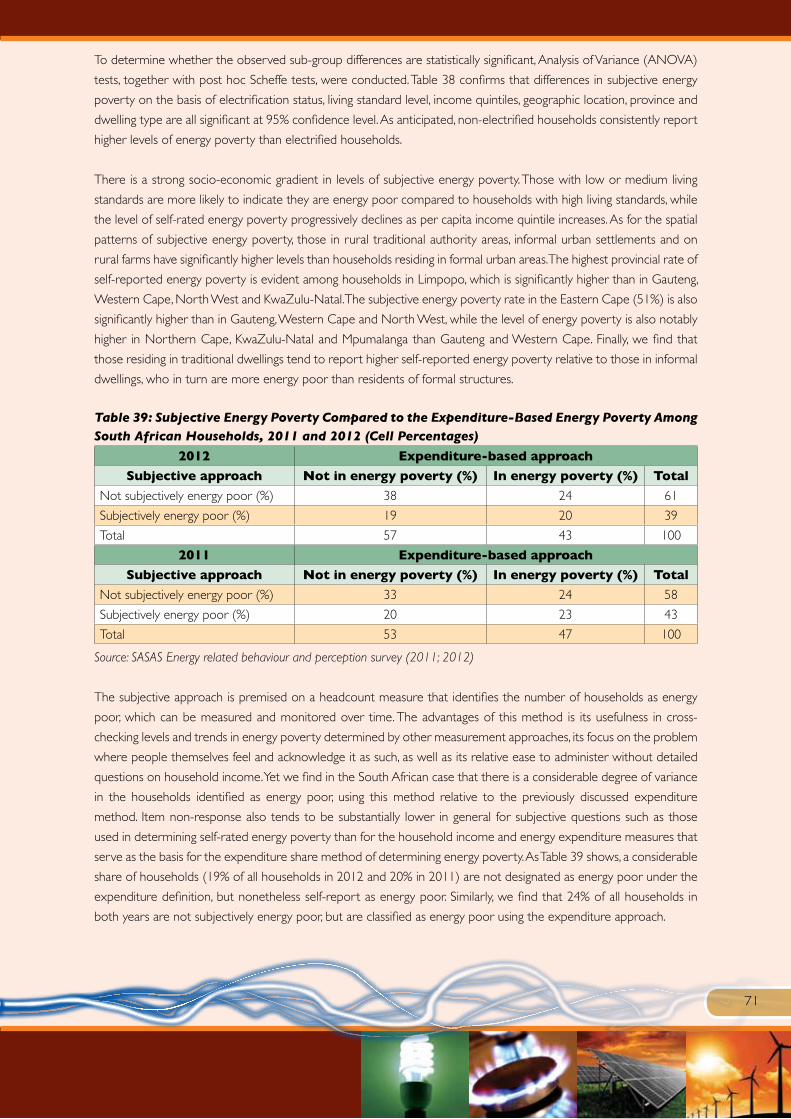
71
To determine whether the observed sub-group differences are statistically significant, Analysis of Variance (ANOVA)
tests, together with post hoc Scheffe tests, were conducted. Table 38 confirms that differences in subjective energy
poverty on the basis of electrification status, living standard level, income quintiles, geographic location, province and
dwelling type are all significant at 95% confidence level. As anticipated, non-electrified households consistently report
higher levels of energy poverty than electrified households.
There is a strong socio-economic gradient in levels of subjective energy poverty. Those with low or medium living
standards are more likely to indicate they are energy poor compared to households with high living standards, while
the level of self-rated energy poverty progressively declines as per capita income quintile increases. As for the spatial
patterns of subjective energy poverty, those in rural traditional authority areas, informal urban settlements and on
rural farms have significantly higher levels than households residing in formal urban areas. The highest provincial rate of
self-reported energy poverty is evident among households in Limpopo, which is significantly higher than in Gauteng,
Western Cape, North West and KwaZulu-Natal. The subjective energy poverty rate in the Eastern Cape (51%) is also
significantly higher than in Gauteng, Western Cape and North West, while the level of energy poverty is also notably
higher in Northern Cape, KwaZulu-Natal and Mpumalanga than Gauteng and Western Cape. Finally, we find that
those residing in traditional dwellings tend to report higher self-reported energy poverty relative to those in informal
dwellings, who in turn are more energy poor than residents of formal structures.
Table 39: Subjective Energy Poverty Compared to the Expenditure-Based Energy Poverty Among South African Households, 2011 and 2012 (Cell Percentages)
2012 Expenditure-based approach
Subjective approach Not in energy poverty (%) In energy poverty (%) Total
Not subjectively energy poor (%) 38 24 61
Subjectively energy poor (%) 19 20 39
Total 57 43 100
2011 Expenditure-based approach
Subjective approach Not in energy poverty (%) In energy poverty (%) Total
Not subjectively energy poor (%) 33 24 58
Subjectively energy poor (%) 20 23 43
Total 53 47 100
Source: SASAS Energy related behaviour and perception survey (2011; 2012)
The subjective approach is premised on a headcount measure that identifies the number of households as energy
poor, which can be measured and monitored over time. The advantages of this method is its usefulness in cross-
checking levels and trends in energy poverty determined by other measurement approaches, its focus on the problem
where people themselves feel and acknowledge it as such, as well as its relative ease to administer without detailed
questions on household income. Yet we find in the South African case that there is a considerable degree of variance
in the households identified as energy poor, using this method relative to the previously discussed expenditure
method. Item non-response also tends to be substantially lower in general for subjective questions such as those
used in determining self-rated energy poverty than for the household income and energy expenditure measures that
serve as the basis for the expenditure share method of determining energy poverty. As Table 39 shows, a considerable
share of households (19% of all households in 2012 and 20% in 2011) are not designated as energy poor under the
expenditure definition, but nonetheless self-report as energy poor. Similarly, we find that 24% of all households in
both years are not subjectively energy poor, but are classified as energy poor using the expenditure approach.
72
The subjective approach may also be affected by misreporting due to the possible stigma associated with declaring
oneself to be in poverty, concerns about robustness of results based on the use of different subjective measures and
the choice of household respondent. For this reason, based on an evaluation of the relative strengths and weaknesses
of the subjective method, the Hills Commission (2011: 132) concluded that “such questions are probably most useful
as a way of complementing more objective approaches, giving a reality check on them”. This makes intuitive sense in
the South African context, where subjective measures could be used as a means of enhancing our understanding of
the nature, extent and temporal dynamics of energy poverty in the country.
5.4.3. Thermal Inefficiency Approach
Another measure of energy poverty relies on assessments of the condition of one’s place of residence, focusing
particularly on thermal comfort levels relative to social needs. In essence, this involves rating the thermal efficiency of
dwelling units, since this influences the amount of energy required to heat the home to an acceptable standard and
typically represents a notable determinant of domestic energy costs. Most common in European countries, housing
energy efficiency data are usually obtained through expert evaluations, 2 though in the case of the present survey, this
was not feasible. Instead, we have used four survey questions on the physical state of dwellings to determine a thermal
efficiency rating. The specific items and the associated response codes are listed below:
I would now like to ask you some questions about your accommodation.
How satisfied are you with your accommodation?
(1=very satisfied, 2=satisfied, 3=neither satisfied nor dissatisfied, 4=dissatisfied, 5=very dissatisfied, 8=don’t know)
Would you describe the state of repair of your home as good, adequate or poor?
(1=good, 2=adequate, 3=poor, 8=do not know)
Do you have any of the following problems with your accommodation? (Code all that apply)
Lack of adequate heating
Leaky roof
Damp walls, floors, foundations, etc.
Damaged or broken windows or doors
None of these problems with accommodation
Has your health or the health of anyone in your household been made worse by your housing situation?
(1=Yes, 2=No)
A set of four dummy variables was created, based on responses to each of the four survey items. Firstly, households
were assigned a value of 1 if respondents noted that they were dissatisfied or very dissatisfied (Code 4 or 5) with
their accommodation, with all other responses being coded as zero. For the second variable, a value of 1 was assigned
to cases where the state of repair of the home was described as “poor” (Code 3). The third dummy variable was
coded as 1 if households reported one or more of the following: “lack of adequate heating”, a “leaky roof ”, “damp
walls, floors or foundations”, or “damaged or broken windows or doors”. The final dummy variable was created for
2 For example, in the United Kingdom, use is made of the Standard Assessment Procedure (SAP), a Government-recommended
measure used for assessing the energy performance of dwellings. The SAP rating of a dwelling is an indicator of energy consumption
per unit of floor space and includes the costs associated with space heating, water heating, ventilation and lighting, minus any cost
savings from self-generated energy.

73
those reporting that the housing condition had resulted in the deteriorating health of someone in the household.
Based on these four items, a summated thermal efficiency scale was constructed by adding together the responses,
so that the highest possible score was 4 (highest level of thermal inefficiency) and the lowest was 0 (lowest level of
thermal inefficiency). In turn, a dummy variable was created where values of one or higher were recoded as 1 and
zero values were retained. This was employed as the thermal inefficiency rating measure used for the analysis in this
section.
Figure 15: Thermal Inefficiency of Homes, by Household Attributes (Percent)
Source: SASAS Energy related behaviour and perception survey (2011; 2012)
Based on this measurement approach we find that in late 2012, on aggregate, 49% of households were categorised
as thermally inefficient and 51% thermally efficient. In Figure 15, we present the incidence of residential thermal
inefficiency by various household attributes in 2011 and 2012. In both survey years, South Africans who lived
in households which are not electrified or who have a low living standard are the most likely to suffer thermal
inefficiencies (80% or higher). Likewise, residents of the Eastern Cape and North West (65% and 62% respectively),
people who reside in rural traditional authority areas (69%), informal urban settlements (66%), or on rural farms
(54%) are also likely to suffer from thermal inefficiency. As one would expect, households in the wealthiest income
quintile (21%) or with a high living standard (28%), as well as those located in the Western Cape (31%) and formal
urban areas (38%) are least likely to suffer such thermal inefficiencies. Patterns of thermal inefficiency again tend to be
broadly similar in both years, though there does appear to be a modest upward trend. On the one hand, households
in poorer provinces such as North West and Limpopo reported notable increases in thermal inefficiency. On the
other hand, certain better-off households also demonstrate a tendency towards higher thermal inefficiency in 2012
relative to 2011. This is case with those with high and medium living standards, those in formal urban areas, those in
Gauteng, and those in formal dwellings and brick structures.
90
80
70
60
50
40
30
20
10
0
ElectrifiedLimpopo
Mpumalanga
Gauteng
North West
KwaZulu-Natal
Free State
Northern Cape
Eastern Cape
Western Cape
Farms
Non-electrified
Low living std.
Medium living std.
High living std.
Urban formalUrban informalRural, traditional
authority areas
Poorest quintile
Richest quintile
Quintile 2
Quintile 3
Quintile 4
Thermally inefficient 2012
Thermally inefficient 2011
2012 National avg. (M=49%)
2011 National avg. (M=42%)

74
Since the thermal inefficiency classification is based on evaluating the physical structure and conditions of a dwelling
unit, one would expect a significant gradient of difference based on the type of dwelling that households occupy. In
Figure 16 we test out this assertion, and find that there is substantial variation in level of thermal inefficiency in both
rounds of interviewing.
Figure 16: Thermal Inefficiency of Homes 2011-12, by Dwelling Type (Percent)
Source: SASAS Energy related behaviour and perception survey (2011; 2012)
In 2012, slightly more than two-fifths (42%) of formal dwellings or brick structures were classified as thermally-
inefficient, based on this definitional approach. This is appreciably lower than informal dwellings or shacks, of which
94% are deemed thermally inefficient. Similarly, 85% of traditional dwellings, huts or structures of traditional materials
are not energy efficient. Again there are signs of a rising trend between the two survey evaluations.
80
70
60
50
40
30
20
10
0
Traditional dwelling, hut or structure of traditional
materials
Formal dwelling or brick structure
South Africa
4249
3242
78 85 8694
Informal dwelling or shack
Thermally inefficient homes 2011 Thermally inefficient homes 2012
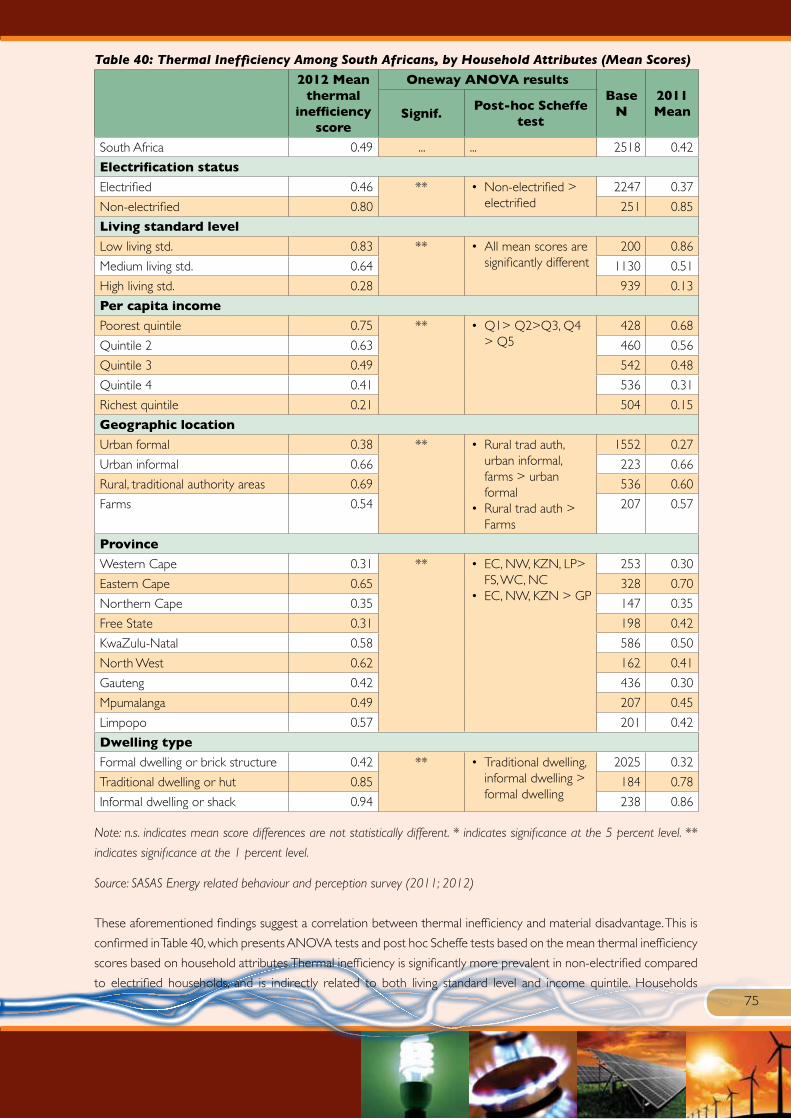
75
Table 40: Thermal Inefficiency Among South Africans, by Household Attributes (Mean Scores)
2012 Mean thermal
inefficiency score
Oneway ANOVA resultsBase
N2011MeanSignif.
Post-hoc Scheffe test
South Africa 0.49 ... ... 2518 0.42
Electrification status
Electrified 0.46 ** • Non-electrified > electrified
2247 0.37
Non-electrified 0.80 251 0.85
Living standard level
Low living std. 0.83 ** • All mean scores are significantly different
200 0.86
Medium living std. 0.64 1130 0.51
High living std. 0.28 939 0.13
Per capita income
Poorest quintile 0.75 ** • Q1> Q2>Q3, Q4 > Q5
428 0.68
Quintile 2 0.63 460 0.56
Quintile 3 0.49 542 0.48
Quintile 4 0.41 536 0.31
Richest quintile 0.21 504 0.15
Geographic location
Urban formal 0.38 ** • Rural trad auth, urban informal, farms > urban formal
• Rural trad auth > Farms
1552 0.27
Urban informal 0.66 223 0.66
Rural, traditional authority areas 0.69 536 0.60
Farms 0.54 207 0.57
Province
Western Cape 0.31 ** • EC, NW, KZN, LP> FS, WC, NC
• EC, NW, KZN > GP
253 0.30
Eastern Cape 0.65 328 0.70
Northern Cape 0.35 147 0.35
Free State 0.31 198 0.42
KwaZulu-Natal 0.58 586 0.50
North West 0.62 162 0.41
Gauteng 0.42 436 0.30
Mpumalanga 0.49 207 0.45
Limpopo 0.57 201 0.42
Dwelling type
Formal dwelling or brick structure 0.42 ** • Traditional dwelling, informal dwelling > formal dwelling
2025 0.32
Traditional dwelling or hut 0.85 184 0.78
Informal dwelling or shack 0.94 238 0.86
Note: n.s. indicates mean score differences are not statistically different. * indicates significance at the 5 percent level. **
indicates significance at the 1 percent level.
Source: SASAS Energy related behaviour and perception survey (2011; 2012)
These aforementioned findings suggest a correlation between thermal inefficiency and material disadvantage. This is
confirmed in Table 40, which presents ANOVA tests and post hoc Scheffe tests based on the mean thermal inefficiency
scores based on household attributes. Thermal inefficiency is significantly more prevalent in non-electrified compared
to electrified households, and is indirectly related to both living standard level and income quintile. Households
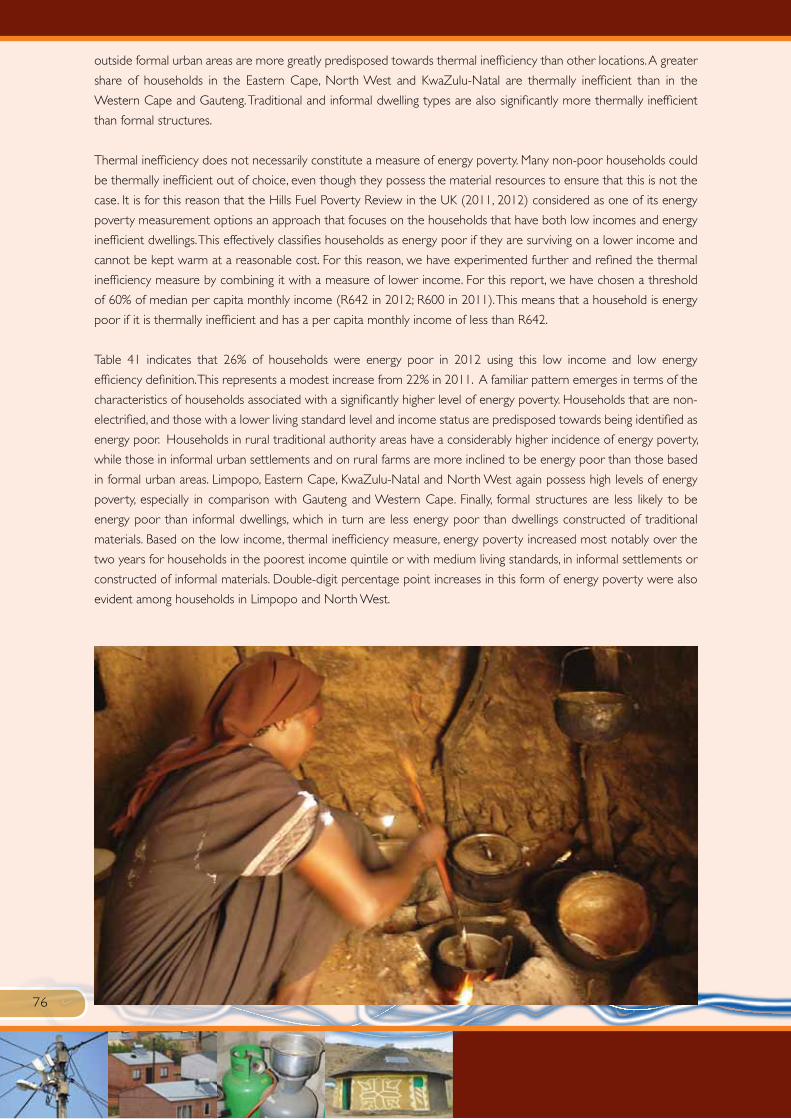
76
outside formal urban areas are more greatly predisposed towards thermal inefficiency than other locations. A greater
share of households in the Eastern Cape, North West and KwaZulu-Natal are thermally inefficient than in the
Western Cape and Gauteng. Traditional and informal dwelling types are also significantly more thermally inefficient
than formal structures.
Thermal inefficiency does not necessarily constitute a measure of energy poverty. Many non-poor households could
be thermally inefficient out of choice, even though they possess the material resources to ensure that this is not the
case. It is for this reason that the Hills Fuel Poverty Review in the UK (2011, 2012) considered as one of its energy
poverty measurement options an approach that focuses on the households that have both low incomes and energy
inefficient dwellings. This effectively classifies households as energy poor if they are surviving on a lower income and
cannot be kept warm at a reasonable cost. For this reason, we have experimented further and refined the thermal
inefficiency measure by combining it with a measure of lower income. For this report, we have chosen a threshold
of 60% of median per capita monthly income (R642 in 2012; R600 in 2011). This means that a household is energy
poor if it is thermally inefficient and has a per capita monthly income of less than R642.
Table 41 indicates that 26% of households were energy poor in 2012 using this low income and low energy
efficiency definition. This represents a modest increase from 22% in 2011. A familiar pattern emerges in terms of the
characteristics of households associated with a significantly higher level of energy poverty. Households that are non-
electrified, and those with a lower living standard level and income status are predisposed towards being identified as
energy poor. Households in rural traditional authority areas have a considerably higher incidence of energy poverty,
while those in informal urban settlements and on rural farms are more inclined to be energy poor than those based
in formal urban areas. Limpopo, Eastern Cape, KwaZulu-Natal and North West again possess high levels of energy
poverty, especially in comparison with Gauteng and Western Cape. Finally, formal structures are less likely to be
energy poor than informal dwellings, which in turn are less energy poor than dwellings constructed of traditional
materials. Based on the low income, thermal inefficiency measure, energy poverty increased most notably over the
two years for households in the poorest income quintile or with medium living standards, in informal settlements or
constructed of informal materials. Double-digit percentage point increases in this form of energy poverty were also
evident among households in Limpopo and North West.
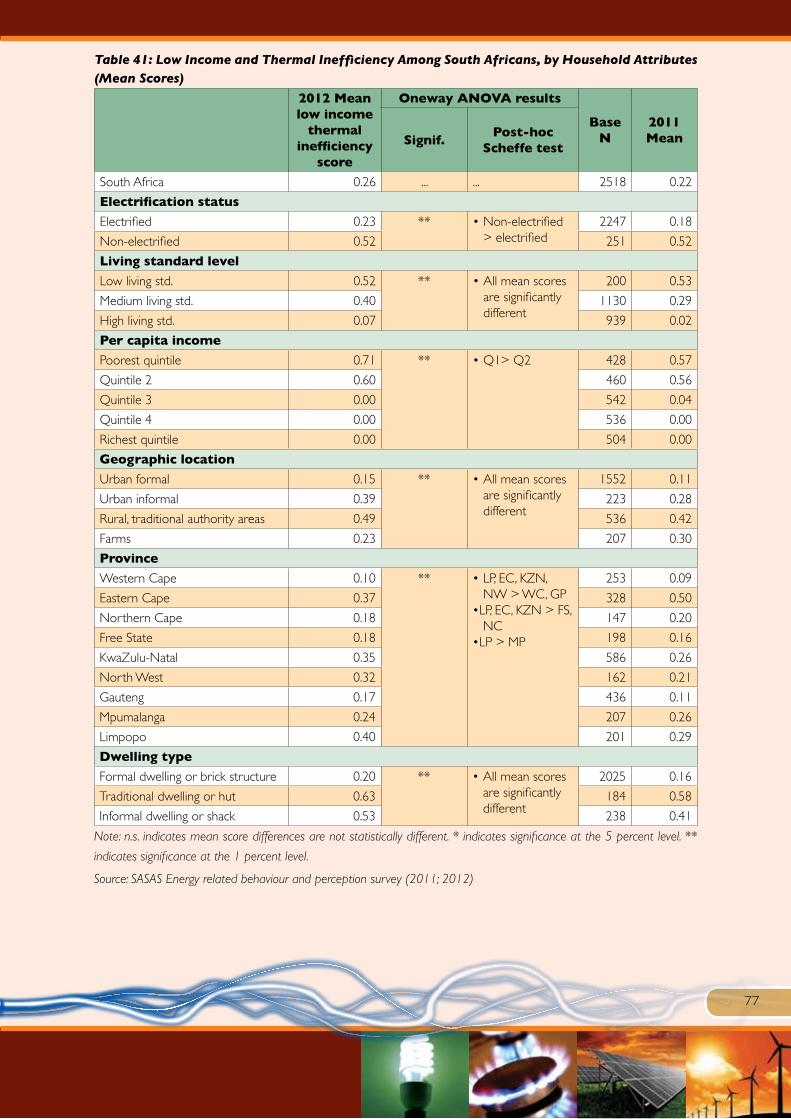
77
Table 41: Low Income and Thermal Inefficiency Among South Africans, by Household Attributes (Mean Scores)
2012 Mean low income
thermal inefficiency
score
Oneway ANOVA results
Base N
2011MeanSignif.
Post-hoc Scheffe test
South Africa 0.26 ... ... 2518 0.22
Electrification status
Electrified 0.23 ** • Non-electrified > electrified
2247 0.18
Non-electrified 0.52 251 0.52
Living standard level
Low living std. 0.52 ** • All mean scores are significantly different
200 0.53
Medium living std. 0.40 1130 0.29
High living std. 0.07 939 0.02
Per capita income
Poorest quintile 0.71 ** • Q1> Q2 428 0.57
Quintile 2 0.60 460 0.56
Quintile 3 0.00 542 0.04
Quintile 4 0.00 536 0.00
Richest quintile 0.00 504 0.00
Geographic location
Urban formal 0.15 ** • All mean scores are significantly different
1552 0.11
Urban informal 0.39 223 0.28
Rural, traditional authority areas 0.49 536 0.42
Farms 0.23 207 0.30
Province
Western Cape 0.10 ** • LP, EC, KZN, NW > WC, GP
•LP, EC, KZN > FS, NC
•LP > MP
253 0.09
Eastern Cape 0.37 328 0.50
Northern Cape 0.18 147 0.20
Free State 0.18 198 0.16
KwaZulu-Natal 0.35 586 0.26
North West 0.32 162 0.21
Gauteng 0.17 436 0.11
Mpumalanga 0.24 207 0.26
Limpopo 0.40 201 0.29
Dwelling type
Formal dwelling or brick structure 0.20 ** • All mean scores are significantly different
2025 0.16
Traditional dwelling or hut 0.63 184 0.58
Informal dwelling or shack 0.53 238 0.41
Note: n.s. indicates mean score differences are not statistically different. * indicates significance at the 5 percent level. **
indicates significance at the 1 percent level.
Source: SASAS Energy related behaviour and perception survey (2011; 2012)

78
This section has attempted to provide a profile of energy poverty among South African households using three
different measurement approaches that had initially been field tested in a nationally representative survey conducted
on behalf of the Department of Energy in late 2011, namely: a commonly-employed expenditure approach, a
subjective approach, and an approach based on residence condition. These approaches each have their relative
advantages and limitations. The results do show that the overall incidence of energy poverty does fluctuate somewhat
and the identification of sub-groups as energy poor in not entirely consistent across all three methods and across
years. There are, nonetheless, some repeated findings. These include the greater propensity to be categorised as
energy poor if a household: • Is located in the Eastern Cape, Limpopo or Mpumalanga, is or in a rural traditional authority area;• Has a lower living standard level or falls in the lowest per capita income quintiles.
The subjective and thermal inefficiency measures, unlike the expenditure method, also commonly identify non-
electrified households and those without a formal dwelling or brick structure as more likely to be energy poor.
Considering the evidence provided, two broad recommendations need to be made. Firstly, given the policy significance
of this social phenomenon from a poverty, health and well-being aspect, as well as an environmental point-of-view,
it is critical that the Department of Energy as a matter of urgency examine and decide upon an official definition
of energy poverty for the country. Secondly, different options for measuring energy poverty need to be examined
and a decision made regarding which of these alternatives is the preferred approach for classifying households and
individuals as energy poor, in a manner that is consistent with the official definition that is chosen. This would not
preclude the fielding of other supplementary measures for cross-validation purposes, but an official definition and
measurement approach in respect of energy poverty is required for effective monitoring and policymaking purposes.

79
6. Satisfaction, Quality and Pricing of Electricity
As part of its manifesto, the democratically elected government made a promise that all South Africans should have
basic services and that poor South Africans should have a quantum of free basic services. Free basic electricity was
quantified as up to 50 kWh of electricity per household per month. This approach is generally supported and seen
as a step in the right directions, although some critics maintain that this is only meant to help the state to contain and
control the poor and promote a ‘culture of payment’ for services (Ruiters, 2011). Other stakeholders are concerned
about the small amounts of services, therefore questioning the impact of such initiatives stating that the government
has set the level of ‘basic needs’ so low that it will keep people poor, rather than uplift them.
Given these debates, it is important to determine attitudes around electrification and to determine satisfaction
levels. In this survey, South Africans were asked to rate electricity provision in terms of levels of satisfaction, quality
of electricity and pricing of electricity. Only households with access to electricity were required to respond to these
questions.
6.1. Satisfaction with the Provision of Electricity in the Neighbourhood
In order to determine satisfaction with electricity provision, South Africans were asked how satisfied or dissatisfied
they are with the way electricity is being provided in their neighbourhood. In the 2012 round of the survey, more
than two-thirds (67%) of South Africans indicated that they were either very satisfied or satisfied with the provision of
electricity in their neighbourhood. Just more than a tenth (12%) were neither satisfied nor dissatisfied with two-fifths
(20%) stating they were either dissatisfied (14%) or very dissatisfied (6%). Compared to 2011, the 2012 results are
fairly similar and even encouraging with a larger proportion (67%) being satisfied with electricity provision in 2012
as opposed to 2011 (64%).
Figure 17: Satisfaction with the Provision of Electricity in the Neighbourhood
Source: SASAS Energy related behaviour and perception survey (2011; 2012)
In order to understand which groups profiled as least or most satisfied, this question was analysed by select socio-
demographic variables. Also, in order to establish a comparative scale for this question, an Electricity Satisfaction Index
(ESI) was developed which calculated a mean satisfaction score. The responses which varied from “very satisfied”
to “very dissatisfied” were recorded to represent a satisfaction score ranging from 5 (very satisfied) to 1 (very
dissatisfied). A high score therefore represented a higher satisfaction rating. In the calculation of the ESI, the don’t
know responses were not considered. The score was then converted to a 0-100 scale. The higher the mean score,
the higher the satisfaction with electricity provision in the neighbourhood. The percentages and mean satisfaction
scores are displayed in Table 42.
Very satisfied
Satisfied
Neutral
Dissatisfied
Very dissatisfied
Don’t know
0% 20% 40% 60% 80% 100%
1414 53 12 6
2011
2012
2159 55 15 4
1
80
Statistically significant (p<0.000) differences in perceptions were identifiable across population group, living standard,
location and province. Although no statistical significant differences were found for age group, it is evident that the
youngest age group (16-19 years) were much less satisfied with electricity provision than the older age groups.
Between group significant testing showed they were less satisfied- a trend worth examining since the younger age
cohorts (the so called born frees) often tend to have higher expectations than older cohorts. This trend is worth
monitoring since unrealistic expectations or expectations that are not met could lead to civil unrest and unhappiness.
An analysis of satisfaction of electricity provision by population group revealed that whites and Indians were more
satisfied with the provision of electricity than blacks and coloureds. Around three-quarters of whites and Indians (80%
and 76% respectively) were satisfied with the provision of electricity, whilst smaller shares of coloureds (69%) and
blacks (64%) were satisfied. This trend is confirmed by the mean scores, being highest for whites (M=71.4) and Indians
(M=68.4), followed by blacks (M=62.3) and coloureds (M=61.9).
From the living standard analysis it is clear that a steep economic gradient is present with regards to satisfaction
with electricity provision. Results showed that the higher the living standard, the higher the levels of satisfaction
with electricity provision. Just more than two-fifths (43%) of people with a low living standard were satisfied with
electricity provision, followed by people with a medium living standard, amongst whom 61% were satisfied. Among
people with a high living standard, three-quarters (75%) indicated satisfaction. This trend was also clearly portrayed
in the analysis of the mean scores, with people in the low living standard measurement category recording low
levels of satisfaction (M=48.7), followed by people in the medium living standard category (M=60.7) and high living
standard category (M=68.2). A clear linear relationship therefore existed between living standard and satisfaction with
electricity provision.

81
Table 42: Satisfaction with the Provision of Electricity (Percentage; Mean)
Very Satisfied Satisfied
Neither satisfied
nor dissatisfied
Dissatisfied Very Dissatisfied
Don’t know
Electricity Satisfaction Index (ESI)Mean Score
(0-100)
South Africa 14 53 12 14 6 0 63.8
Gender n.s.
Male 15 56 10 12 7 0 64.9
Female 13 51 13 16 6 1 62.8
Age n.s.
16-19 years 12 49 12 17 9 2 59.5
20-29 years 17 51 13 12 6 0 65.1
30-39 years 11 53 11 20 6 0 60.9
40-49 years 15 51 11 14 9 0 62.7
50-59 years 10 63 11 11 5 1 65.2
60-69 years 18 55 14 10 3 0 68.7
70+ years 19 59 9 11 2 0 70.7
Population group *
Black African 14 50 12 16 6 0 62.3
Coloured 8 61 9 12 9 1 61.9
Indian / Asian 17 59 9 11 4 0 68.4
White 18 62 11 5 4 1 71.4
Living standard *
Low 5 38 10 38 8 0 48.7
Medium 12 49 15 16 7 0 60.7
High 17 58 8 11 5 1 68.2
Geographic location *
Urban formal 15 55 11 12 6 1 65.4
Urban Informal 16 38 13 17 15 0 56.1
Rural, traditional authority areas
12 56 13 16 3 0 64.3
Farms 9 42 12 27 10 0 53.5
Province *
Western Cape 14 57 19 5 3 2 68.8
Eastern Cape 9 60 11 12 8 0 62.7
Northern Cape 12 50 10 25 2 0 61.2
Free State 22 35 5 17 21 0 55.3
KwaZulu-Natal 10 51 19 15 6 0 61.2
North West 10 45 12 24 9 0 56.1
Gauteng 18 55 7 13 7 0 66.0
Mpumalanga 12 58 8 19 2 2 65.3
Limpopo 17 54 12 15 3 0 67.0
Mean of a five-point Likert scale, where 1=’very dissatisfied’, 2=’dissatisfied’, 3=’neither satisfied nor dissatisfied’,
4=’satisfied’ and 5=’very satisfied’ converted to a 0-100 scale. n.s. means that the mean scores are not statistically
significant based on ANOVA testing, while * indicates that the mean scores are significant different (p<0.05
Source: SASAS Energy related behaviour and perception survey 2012

82
People on farms were least satisfied with electricity provision with just more than half (51%) satisfied with the
provision of electricity. This was lower than residents of urban informal areas (54%), rural traditional authority areas
(68%) and urban formal areas (70%). The mean scores also indicated that households on rural farms were less
satisfied (M=53.5) than people in informal settlements (M=56.1), rural traditional authority areas (M=64.3) and
urban formal areas (M=65.4).
Turning to provinces, it was evident that the highest proportion of satisfied residents was found in Gauteng (73%),
Western Cape and Limpopo (71%). The highest proportion of dissatisfied residents was found in North West (55%)
and Free State. Mean scores corroborated this finding, indicating that households in Free State were least satisfied
(M=55.3) followed by North West (M=56.1). Western Cape had the highest mean score (M=68.8), indicating the
highest level of satisfaction with electricity provision. In Figure 18, the mean electrification satisfaction score is ranked
an displayed.
Figure 18: Electricity Satisfaction Index by Select Socio-Demographic Attributes (Ranked Means Scores)
Source: SASAS Energy related behaviour and perception survey (2012)
The average means score for the Electricity Satisfaction Index (ESI) out of a 100 is 63.8, indicating that satisfaction
with electricity tends to lean towards the positive side. However, it is evident that satisfaction levels differ for the
various socio-demographic groups and that satisfaction with electricity has an economic gradient. People who have
a low living standard or who live on farms or in informal settlements tend to be much less satisfied with electricity
than other groups. In contrast, people with a high living standard, those who are Indian/Asian, or older than 60 years
or white are most satisfied with the provision of electricity.
6.2. Quality of Electricity
In order to further the debate on satisfaction of electricity provision in South Africa, an explicit question about the
quality of electricity was included. South Africans were asked: “In your opinion, what is the quality of electricity in the
area where you live?” Results from the 2012 survey reveal that just more than a tenth (11%) rated the quality of
electricity in their area as very high. The largest proportion, two-fifths (40%), rated the electricity in their area either as
good, with under a third (30%) rating the quality as acceptable. The rest felt the quality was either poor (15%) or very
poor (3%). A significant share (82% in 2011 and 81% in 2012) of South Africans therefore rates the quality of their
electricity as acceptable. Less than a fifth of South Africans regard the quality of their electricity as poor or very poor.
Low
LSM
Farm
s FS
Urb
an, in
form
al
NW
16-1
9 ye
ars
Med
iuim
LSM
30-3
9 ye
ars
NC
KZN
Col
oure
d
Blac
k A
fric
an
40-4
9 ye
ars
EC
Fem
ale
Sout
h A
fric
a
Rur
al t
rad.
aut
h. a
reas
Mal
e
20-2
9 ye
ars
50-5
9 ye
ars
MP
Urb
an, f
orm
al
GP LP
Hig
h LS
M
Indi
an o
r Asia
n
60-6
9 ye
ars
WC
70+
yea
rs
Whi
te
80
70
60
50
40
30
20
10
0

83
Figure 19: Quality of Electricity in Residential Areas
Source: SASAS Energy related behaviour and perception survey (2011; 2012)
In order to determine who were more likely to rate the quality of electricity as low or high, the question was analysed
by select socio-demographic attributes. Also, in order to establish a comparative scale for this question, an Electricity
Quality Index (EQI) was developed which calculated satisfaction with the quality of electricity. The response options
ranged from “very high quality” to “very poor quality” which was recoded to represent a quality score ranging from
1 (very poor quality) to 5 (very high quality). The score was then converted to a 0-100 scale. The higher the mean
score, the higher the perceived quality of electricity in the area. The scores are displayed in Table 43.
Very high quality
Good quality
Acceptable quality
Poor quality
Very poor quality
Don’t know
0% 20% 40% 60% 80% 100%
1511 40 30 3
2011
2012
2136 41 35 3
1
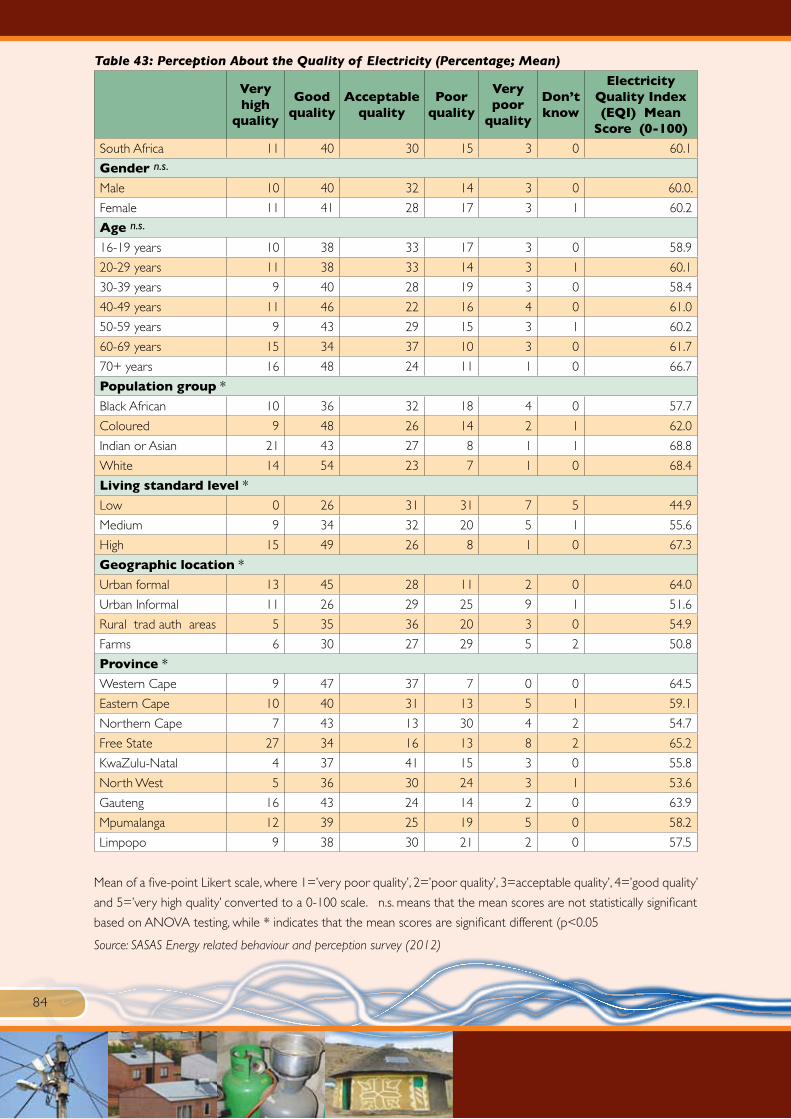
84
Table 43: Perception About the Quality of Electricity (Percentage; Mean)
Very high
quality
Good quality
Acceptable quality
Poor quality
Very poor
quality
Don’t know
Electricity Quality Index (EQI) Mean
Score (0-100)
South Africa 11 40 30 15 3 0 60.1
Gender n.s.
Male 10 40 32 14 3 0 60.0.
Female 11 41 28 17 3 1 60.2
Age n.s.
16-19 years 10 38 33 17 3 0 58.9
20-29 years 11 38 33 14 3 1 60.1
30-39 years 9 40 28 19 3 0 58.4
40-49 years 11 46 22 16 4 0 61.0
50-59 years 9 43 29 15 3 1 60.2
60-69 years 15 34 37 10 3 0 61.7
70+ years 16 48 24 11 1 0 66.7
Population group *
Black African 10 36 32 18 4 0 57.7
Coloured 9 48 26 14 2 1 62.0
Indian or Asian 21 43 27 8 1 1 68.8
White 14 54 23 7 1 0 68.4
Living standard level *
Low 0 26 31 31 7 5 44.9
Medium 9 34 32 20 5 1 55.6
High 15 49 26 8 1 0 67.3
Geographic location *
Urban formal 13 45 28 11 2 0 64.0
Urban Informal 11 26 29 25 9 1 51.6
Rural trad auth areas 5 35 36 20 3 0 54.9
Farms 6 30 27 29 5 2 50.8
Province *
Western Cape 9 47 37 7 0 0 64.5
Eastern Cape 10 40 31 13 5 1 59.1
Northern Cape 7 43 13 30 4 2 54.7
Free State 27 34 16 13 8 2 65.2
KwaZulu-Natal 4 37 41 15 3 0 55.8
North West 5 36 30 24 3 1 53.6
Gauteng 16 43 24 14 2 0 63.9
Mpumalanga 12 39 25 19 5 0 58.2
Limpopo 9 38 30 21 2 0 57.5
Mean of a five-point Likert scale, where 1=’very poor quality’, 2=’poor quality’, 3=acceptable quality’, 4=’good quality’
and 5=’very high quality’ converted to a 0-100 scale. n.s. means that the mean scores are not statistically significant
based on ANOVA testing, while * indicates that the mean scores are significant different (p<0.05
Source: SASAS Energy related behaviour and perception survey (2012)

85
No significant differences regarding the quality of electricity were found for gender and age groups. Statistically
significant (p<0.000) differences were, however, found for population group, level of living standard, geographic
location and province. Black South Africans rated the quality of electricity much lower than other population groups,
with only 46% stating that electricity is of a very high or good quality compared to coloured people (57%), Indians
(64%) and whites (68%). The mean scores from the Electricity Quality Index (EQI) confirmed that among South
Africans, blacks were least satisfied (M=57.7), followed by coloureds (M=62), whites (M=68.4) and Indians (M=68.8).
Concerns about the quality of electricity were most common among people with a low living standard. None of
them indicated that they regard their electricity of a very high quality, with only a quarter (26%) indicating that their
electricity was of a good quality. Almost two fifths (38%) of this group indicated that the electricity that they received
was of a poor or very poor quality. In contrast, the majority of people with a high living standard indicated that their
electricity is of a very high or good quality (64%) with less than a tenth (9%) indicating that it is of poor or very
poor quality. The EQI mean score confirmed this trend with people with a low living standard scoring the quality of
electricity as a 44.9 out of 100, followed by people with a medium living standard (M=55.6) and high living standard
(M=67.3). In figure 20, the mean scores for the EQI are ranked and displayed.
Figure 20: Electricity Quality Index Scores by Select Socio-Demographic Attributes (Ranked Means Scores)
Source: SASAS Energy related behaviour and perception survey (2012)
The ranked mean scores from the Electricity Quality Index (EQI) indicate similar findings to the preceding question
about satisfaction with electricity provision in the neighbourhood. Although the mean EQI score of 60.1 out of a 100
indicates a positive skew, certain groups are generally much less satisfied with the quality of electricity than others.
Again an economic gradient is notable, with people with a low living standard, specifically residing on farms or in
urban informal areas, most likely to state that their electricity is of a poor quality. By contrast, older people (70+years),
people with a high living standard, Whites or Indian/Asians are much more likely to experience electricity of a very
high or good quality.
Low
LSM
Farm
s
Urb
an, in
form
al
NW NC
Rur
al t
rad.
aut
h. a
reas
Med
iuim
LSM
KZN LP
Blac
k A
fric
an MP
30-3
9 ye
ars
16-1
9 ye
ars
EC
Mal
e
Sout
h A
fric
a
20-2
9 ye
ars
Fem
ale
50-5
9 ye
ars
40-4
9 ye
ars
60-6
9 ye
ars
Col
oure
d
GP
Urb
an, f
orm
al
WC FS
70+
yea
rs
Hig
h LS
M
Whi
te
Indi
an o
r Asia
n
80
70
60
50
40
30
20
10
0

86
6.3. Pricing of Electricity
Households in South Africa were asked if they felt that electricity prices were far too high, too high, about right or
too low. This question is particularly relevant, given the escalated electricity price increases in South Africa since 2008.
In 2008, the average residential electricity price increases averaged 28%, followed by a 31% increase in 2009, 25% in
2010, 26% in 2011 and 16% in 2012. Although ESKOM asked for a 16% increase in 2013, this was disregarded and
an 8% increase was awarded by NERSA. Despite this lower increase, households and especially poorer households
are likely to suffer under the cumulative electricity price burden. As illustrated in the first section of the report, large
shares of households are already considered as energy poor, spending more than 10% of their income on energy.
Asking people about their perceptions of the pricing of electricity was therefore extremely important.
As can be seen from Figure 21, more than a third (34%) of households felt they pay far too much for what they
receive, with another 38% saying they pay too much. Under a quarter (22%) felt they pay about the right amount for
what they receive. Very few (3%) said they pay too little and 3% said they do not know. Clearly, people’s perception
about the price they pay for electricity is skewed towards the feeling that they are paying too much for electricity. On
aggregate, almost three-quarters (72%) are of the opinion that they are paying too much for electricity. These findings
are similar to the 2011 survey.
Figure 21: Perceptions about the Pricing of Electricity
Source: SASAS Energy related behaviour and perception survey (2011; 2012)
In order to determine who were more likely to rate the price of electricity as being too low or too high, the question
was broken down by select socio-demographic attributes. The differences in perceived levels of pricing vary between
people of different genders, ages, population groups, living standards, residential locations and provinces of South
Africa. These differences are portrayed in Table 45. Also, in order to establish a comparative scale for this question,
an Electricity Pricing Index (EPI) was developed which calculated perceptions about the pricing of electricity. The
response options ranged from “far too high” to “too low” which was recoded to represent a pricing score ranging
from 1 (too low) to 4 (far too high). The higher the score, the higher people perceived the price to be. “Don’t know”
options were coded as missing data. The score was then converted to a 0-100 scale.
Table 44: Perceptions about the Pricing of Electricity (Percentage; Mean)
Far too high
Too high
About right
Too low
Don’t know
227 43 24 4
0% 20% 40% 60% 80% 100%
2234 38 3
2011
2012 3
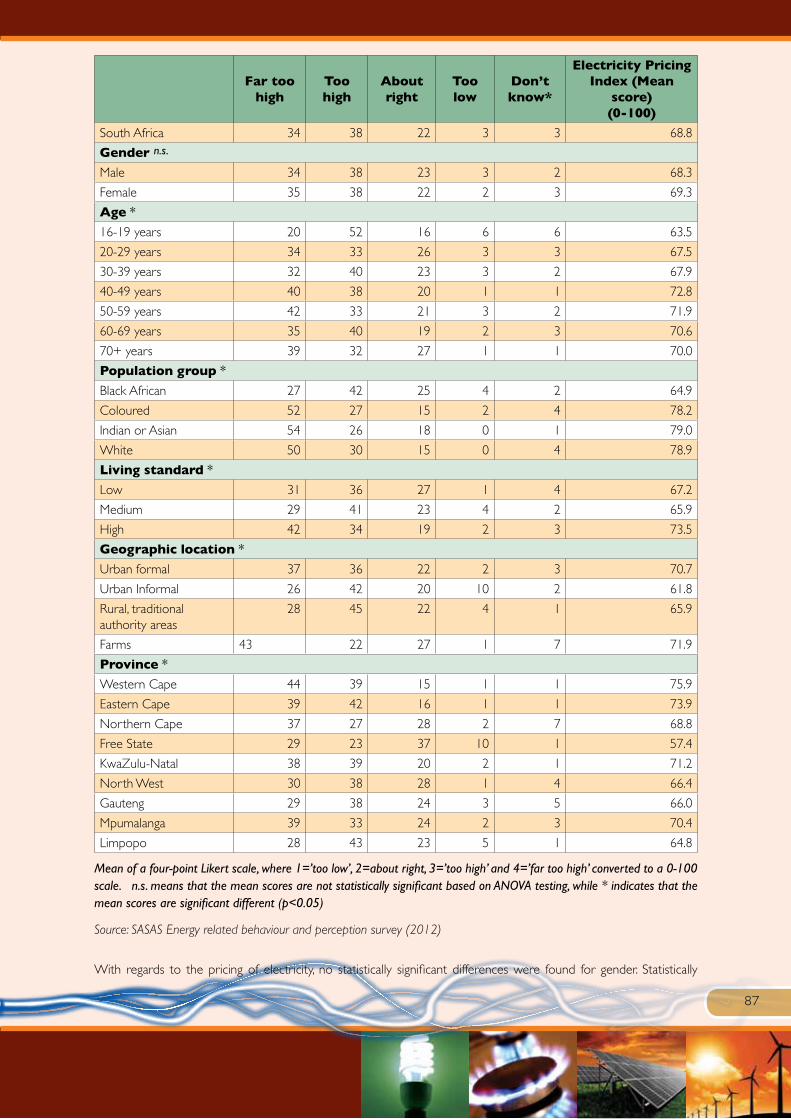
87
Far too high
Too high
About right
Too low
Don’t know*
Electricity Pricing Index (Mean
score)(0-100)
South Africa 34 38 22 3 3 68.8
Gender n.s.
Male 34 38 23 3 2 68.3
Female 35 38 22 2 3 69.3
Age *
16-19 years 20 52 16 6 6 63.5
20-29 years 34 33 26 3 3 67.5
30-39 years 32 40 23 3 2 67.9
40-49 years 40 38 20 1 1 72.8
50-59 years 42 33 21 3 2 71.9
60-69 years 35 40 19 2 3 70.6
70+ years 39 32 27 1 1 70.0
Population group *
Black African 27 42 25 4 2 64.9
Coloured 52 27 15 2 4 78.2
Indian or Asian 54 26 18 0 1 79.0
White 50 30 15 0 4 78.9
Living standard *
Low 31 36 27 1 4 67.2
Medium 29 41 23 4 2 65.9
High 42 34 19 2 3 73.5
Geographic location *
Urban formal 37 36 22 2 3 70.7
Urban Informal 26 42 20 10 2 61.8
Rural, traditional authority areas
28 45 22 4 1 65.9
Farms 43 22 27 1 7 71.9
Province *
Western Cape 44 39 15 1 1 75.9
Eastern Cape 39 42 16 1 1 73.9
Northern Cape 37 27 28 2 7 68.8
Free State 29 23 37 10 1 57.4
KwaZulu-Natal 38 39 20 2 1 71.2
North West 30 38 28 1 4 66.4
Gauteng 29 38 24 3 5 66.0
Mpumalanga 39 33 24 2 3 70.4
Limpopo 28 43 23 5 1 64.8
Mean of a four-point Likert scale, where 1=’too low’, 2=about right, 3=’too high’ and 4=’far too high’ converted to a 0-100 scale. n.s. means that the mean scores are not statistically significant based on ANOVA testing, while * indicates that the mean scores are significant different (p<0.05)
Source: SASAS Energy related behaviour and perception survey (2012)
With regards to the pricing of electricity, no statistically significant differences were found for gender. Statistically

88
significant differences were found for the age groups. A trend emerged where an increase in age also resulted in an
increase in perceptions that electricity prices were too high. In terms of population group, very large proportions of
Indians and whites (80% respectively), and coloureds (79%) felt that the price of electricity was too high. Significantly
fewer black South Africans (69%) were of the opinion that electricity prices are too high. Mean scores confirmed the
finding, with the EPI score for blacks at 64.9, followed by whites (78.2), Indians (78.9) and coloureds (79).
Large proportions of people with a high or medium living standard felt that electricity prices were too high (76% and
70% respectively). A smaller proportion (67%) of people with a low living standard felt that electricity prices were too
high. Mean scores confirmed that people with a high living standard are more likely to think the price of electricity is
too high (73.5) compared to people with a low living standard (67.2) or medium living standard (65.9). Residents in
urban formal and rural traditional areas (73%) were much more inclined to state that electricity prices are too high,
compared to residents in urban informal areas (68%) or rural farms (65%).
People in the Western Cape (83%) and Eastern Cape (81%) were most likely to think that electricity prices were too
high. By contrast, people in the Free State were least likely to feel that they are paying too much (52%), with more
than a third of households in this province indicating that electricity prices are “about right”. This finding was also
confirmed by the EPI. In Figure 22 the mean scores for the EPI are ranked and displayed.
Figure 22: Electricity Pricing Index Scores by Select Socio-Demographic Attributes (Ranked Mean Scores)
Source: SASAS Energy related behaviour and perception survey (2012)
The average EPI score out of a hundred is 68.8, indicating that the majority of South Africans feel that electicity prices
are too high. Free State residents, people living in urban informal areas, aged between 16-19 years, people living in
Limpopo and black Africans tended to score lowest on the Electricity Pricing Index, indicating that they were much
less inclined than other groups to rate the price of electricity as too high. On the other hand, people with a high living
standard, or people residing in the Western Cape, as well as Coloureds, whites and Indians were much more inclined
to rate the price of electricity as too high. This might be due to the fact that these groups tend to use more electricity
and therefor pay higher rates as per the Inclined Block Tariff structure.
FS
Urb
an, in
form
al
16-1
9 ye
ars
LP
Blac
k A
fric
an
Med
iuim
LSM
Rur
al t
rad.
aut
h. a
reas GP
NW
Low
LSM
20-2
9 ye
ars
30-3
9 ye
ars
Mal
e
Sout
h A
fric
a
NC
Fem
ale
70+
yea
rs MP
60-6
9 ye
ars
Urb
an, f
orm
al
KZN
50-5
9 ye
ars
Farm
s
40-4
9 ye
ars
Hig
h LS
M EC WC
Col
oure
d
Whi
te
Indi
an o
r Asia
n
90
80
70
60
50
40
30
20
10
0

89
6.4. Strategies Employed by Households to Cope with Increasing Electricity Prices
In order to understand the strategies employed to manage increases in electricity prices, South Africans were asked
which strategies they engaged to cope with the last electricity price increase. Respondents had the opportunity to
choose one of three options, namely: (a) continue to use the same level of electricity and pay the extra amount for it;
(b) reduce the amount of electricity used; or (c) use other energy sources such as paraffin, gas, coal, wood or candles.
Respondents also had the option of specifying “other strategies” or to state “don’t know”.
Figure 23: Strategies Employed to Cope with the Current Electricity Price Increase
Source: SASAS Energy related behaviour and perception survey (2011; 2012)
As evident from Figure 23, the strategy employed by most South Africans in the past year to cope with the rising
electricity costs was to reduce the amount of electricity used. In 2012, almost half (48%) of South Africans saved
electricity by reducing the amount of electricity used. This represents an increase of 7% from 2011, indicating that
energy saving is becoming common practice in South Africa. This might partly be due to the fact that people are
financially strained and therefore forced to change behaviour and take up energy saving strategies propagated by
energy efficiency campaigns.
The second strategy, embarked upon by 26% of South Africans, was to continue to use the same level of electricity
and pay the extra amount for it. Just more than a fifth (22%) had to use other energy sources to cope with
increasing electricity prices. Increased electricity prices therefore resulted in almost half of all households in South
Africa resorting to energy savings strategies and other strategies to reduce the amount of electricity used. In a fifth
of cases, higher electricity price increases encouraged energy switching and multiple energy use. The 2012 pattern
was similar to 2011, however, in 2012, notably more households were embarking on strategies to reduce the amount
of electricity used.
Reduce the amount ofelectricity we use
Continue to use same levelof electricity and pay extra amount for it
Use other energy sources, suchas paraffin, gas, coal, wood and candles
Other
0 20 40 60 80 100
41 29 26 4
48 26 22 4
2011
2012

90
Table 45: Strategies Employed to Cope with Rising Energy Prices in the Past 12 Months -Strategies
Employed by Households (Percentage)
Reduce the amount of electricity
we use
Continue to use the same level of
electricity and pay the extra amount
for it
Use other energy sources, such as paraffin, gas, coal wood
and candles
Other Don’t know
Total
South Africa 48 26 22 1 3 100
Population group
Black African 44 28 23 1 4 100
Coloured 52 21 23 1 3 100
Indian or Asian 47 23 29 0 1 100
White 55 25 15 4 2 100
Living standard
Low 28 9 26 6 32 100
Medium 43 25 28 1 3 100
High 51 28 17 2 2 100
Geographic location
Urban, formal 52 27 18 2 2 100
Urban, informal 37 35 20 0 8 100
Rural traditional authority areas
40 24 32 1 4 100
Farms 38 20 33 2 7 100
Province
Western Cape 58 25 16 0 1 100
Eastern Cape 58 19 20 1 3 100
Northern Cape 32 39 22 1 6 100
Free State 47 27 22 0 4 100
KwaZulu-Natal 61 19 16 0 3 100
North West 25 41 26 1 6 100
Gauteng 49 28 17 3 3 100
Mpumalanga 30 32 37 0 2 100
Limpopo 32 24 40 1 3 100
Source: SASAS Energy related behaviour and perception survey (2012)
As was expected, different strategies were employed by different types of households. The strategy “to reduce the
amount of electricity used” was most prevalent among White (55%) and Asian households (47%). Reducing the
amount of electricity used was mostly employed by high LSM households – most likely a function of the fact that they
had the option of reducing spare capacity whilst low income households were in all likelihood already surviving on
the bare minimum. Residents of urban formal areas are also much more likely than those in other areas to reduce
the amount of electricity used. Of all provinces, households from KwaZulu-Natal (61%) as well Western Cape and
Eastern Cape (58%) were most likely to employ reduce the amount of electricity used. The largest contingent of
households that said they would continue to use the same level of electricity and pay the extra amount were Black
African households, high LSM households, households in urban informal areas and also households in North West
and Northern Cape. Fuel switching as an option was mostly implemented by Indian or Asian households, households
in the medium living standard category, households in rural traditional authority areas and on rural farms as well as
in Mpumalanga and Limpopo.
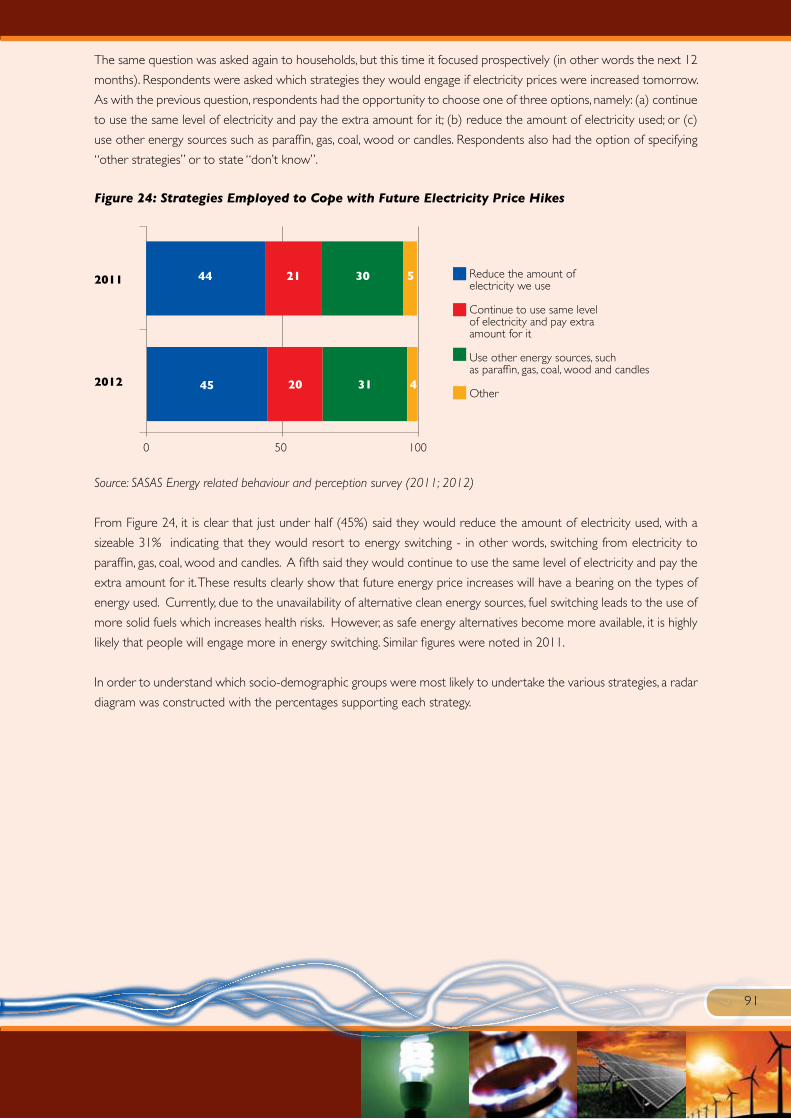
91
The same question was asked again to households, but this time it focused prospectively (in other words the next 12
months). Respondents were asked which strategies they would engage if electricity prices were increased tomorrow.
As with the previous question, respondents had the opportunity to choose one of three options, namely: (a) continue
to use the same level of electricity and pay the extra amount for it; (b) reduce the amount of electricity used; or (c)
use other energy sources such as paraffin, gas, coal, wood or candles. Respondents also had the option of specifying
“other strategies” or to state “don’t know”.
Figure 24: Strategies Employed to Cope with Future Electricity Price Hikes
Source: SASAS Energy related behaviour and perception survey (2011; 2012)
From Figure 24, it is clear that just under half (45%) said they would reduce the amount of electricity used, with a
sizeable 31% indicating that they would resort to energy switching - in other words, switching from electricity to
paraffin, gas, coal, wood and candles. A fifth said they would continue to use the same level of electricity and pay the
extra amount for it. These results clearly show that future energy price increases will have a bearing on the types of
energy used. Currently, due to the unavailability of alternative clean energy sources, fuel switching leads to the use of
more solid fuels which increases health risks. However, as safe energy alternatives become more available, it is highly
likely that people will engage more in energy switching. Similar figures were noted in 2011.
In order to understand which socio-demographic groups were most likely to undertake the various strategies, a radar
diagram was constructed with the percentages supporting each strategy.
Reduce the amount ofelectricity we use
Continue to use same levelof electricity and pay extra amount for it
Use other energy sources, suchas paraffin, gas, coal, wood and candles
Other
0 50 100
44 21 30 5
45 20 31 4
2011
2012

92
Figure 25: Strategies Employed by Households to Cope with Future Electricity Increases by Select Socio-Demographic Attributes (Percentage)
Source: SASAS Energy related behaviour and perception survey (2012)
The most common strategy that would be employed if electricity were increased “tomorrow” was to reduce the
amount of energy used. The largest shares who mentioned this option were found among Indian households (63%),
households in urban informal areas (53%), and households in Gauteng (49%). Fuel switching as an option was
understandably more feasible for people living on rural farms (42%) or in rural traditional authority areas (38%).
A high percentage of Indian or Asian households (38%) also indicated that they would switch fuel sources should
electricity prices go up. This was also an option for more than a third of households with a low living standard (37%).
Interestingly, the highest proportions of households that would continue to use the same level of electricity and pay
the extra amount for it were found in Northern Cape (38%) and North West (29%). Although the average of the
don’t know response was 3% it was alarming to see that more than a quarter (27%) of households with a low living
standard measure indicated that they did not know what they would do if electricity prices would be increased again.
This reflected certain desperation from low income households.
Black AfricanLP
MP
GT
NW
KZN
FS
NC
EC
WCFarms
Coloured
Low living std.
Medium living std.
High living std.
Urban formal
Urban informal
Rural, traditional authority areas
Indian or Asian
White
Continue to use same level of electricity and pay extra amount for itReduce the amount of electricity we useUse other energy sources, such as paraffin, gas, coal, wood and candles
70
60
50
40
30
20
10
0

93
7. Energy Saving
In 2011 ESKOM launched its 49M campaign, which was the country’s biggest energy-saving movement, seeking to
address the issue of the country’s constrained power system. The idea behind the 49M, based on 49-million people,
the population of the country, was that each and every South African has a responsibility to exercise some saving in
the supply and use of electricity so that there is a greater amount available to the country.
In the 2011 study, respondents were given a list of energy-saving measures and asked to indicate if they are aware
of the specific measure and, if so, whether they actually undertake it. These questions were repeated in the 2012
study and in the next section awareness of the various measures are compared for the two years. Not only does
this section compare awareness for the two years it also compares the actual undertaking of the various energy
saving measures between the years. In both instances, very encouraging results are noted, with awareness as well as
undertaking increasing significantly between the two years.
Messages pertaining to energy saving strategies have therefore definitely impacted on more people in 2012 and have
on average increased awareness by 10%. When compared to 2011 it was noted that levels of awareness generally
increased for all energy savings measures but that the ranking of awareness of the various measures had not changed.
Therefore consistent with 2011 levels, the energy-saving measures of which households are most aware are switching
off of lights when leaving the house (89%), followed by switching off appliances (81%) and using energy-saving light
bulbs (76%).
Fewer households in South Africa are aware of the following energy-saving measures: switching off lights in the home
when not in use (65%), boiling only small amounts of water in a pot or kettle (63%), using stove plates and the oven
as little as possible (60%), using warm clothes instead of an electric blanket (59%) and switching off the geyser at
certain times during the day or night (56%). Fewer than half (47%) were aware that taking a short shower or bathing
in little water would save energy and more than two-fifths (44%) were aware that closing the windows and doors
when a heater is on constitutes an energy-saving measure. A fifth (40%) was aware that drip drying of clothes rather
than ironing would result in energy-saving measures. Similar proportions (37%) were aware that the installation of a
solar water heater rather than electric geysers would result in energy saving. Fewer people (28%) were aware that
the insulation of geysers and hot pipes would lead to energy saving.

94
2011 2012
Difference in awareness 2011/2012 Linear (Difference in awareness 2011/2012)
Figure 26: Awareness of the Various Energy Saving Measures for 2011 and 2012
Source: SASAS Energy related behaviour and perception survey (2011; 2012)
In terms of the difference in awareness between 2011 and 2012, the following was observed. The highest increase
in awareness between 2011 and 2012 of energy saving was noted for basic everyday actions, which is encouraging
since these would be applicable to and achievable by the majority. This highest increase in awareness between the two
years (19%) involved only boiling required amounts of water and not more, or using warm clothes or blankets instead
of heaters (18%). The smallest increase in awareness was noted at 12% and this was for awareness regarding energy
savings when insulating geysers and hot pipes. This finding is not surprising since this application is very technical and
also only applicable to households where geysers are available.
In order to further the analysis on energy-saving measures and how it relates to various household characteristics,
an Energy Awareness Index (EAI) was developed. Each energy-saving measure that households were aware of was
coded as a 1 and then summed together to get a total score. Households could therefore score a minimum of a
0, implying they are not aware of any of the cost-saving measures, or a maximum of 13, implying they are aware of
all the energy-saving measures. These scores were converted to a 0 -100 scale. The mean scores for various socio-
demographic variables were calculated and are portrayed in the radar gram below.
Switching off your lights when you leave your house
Switch off appliances at the wall
Use energy saving light bulbs
Switch off all your lights when not in use
Boil only as much water as needed
Use electric stove as little as possible
Use warm clothes/blankets instead of heater
Switch off geyser at certain times during the day
Shower or bath with as less water
Close windows and doors when heater is on
Drip-dry clothes instead of ironing
Solar water heater instead of electric geyser
Insulate your geyser and hot pipes
0 10 20 30 40 50 60 70 80 90 100
7589
6781
14
14
17
17
19
15
18
16
1731
30
1324
1623
1416
2812
37
40
44
47
5640
5941
6045
6344
6548
5976
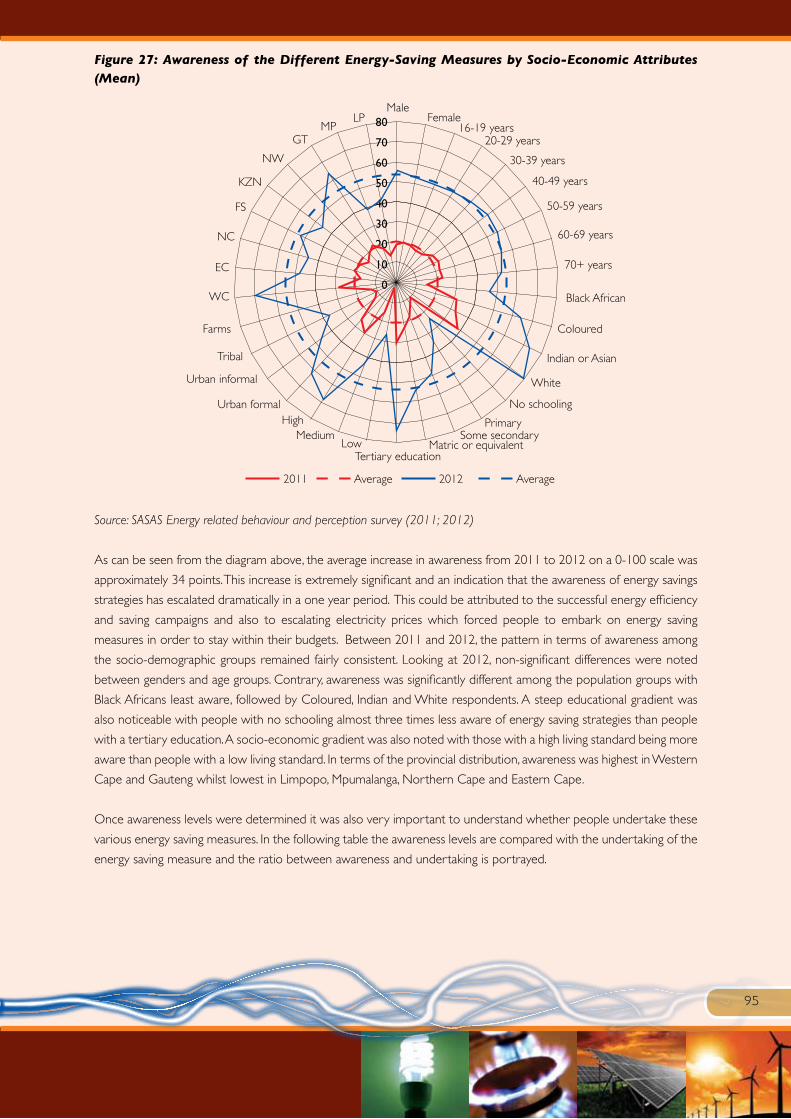
95
Figure 27: Awareness of the Different Energy-Saving Measures by Socio-Economic Attributes (Mean)
Source: SASAS Energy related behaviour and perception survey (2011; 2012)
As can be seen from the diagram above, the average increase in awareness from 2011 to 2012 on a 0-100 scale was
approximately 34 points. This increase is extremely significant and an indication that the awareness of energy savings
strategies has escalated dramatically in a one year period. This could be attributed to the successful energy efficiency
and saving campaigns and also to escalating electricity prices which forced people to embark on energy saving
measures in order to stay within their budgets. Between 2011 and 2012, the pattern in terms of awareness among
the socio-demographic groups remained fairly consistent. Looking at 2012, non-significant differences were noted
between genders and age groups. Contrary, awareness was significantly different among the population groups with
Black Africans least aware, followed by Coloured, Indian and White respondents. A steep educational gradient was
also noticeable with people with no schooling almost three times less aware of energy saving strategies than people
with a tertiary education. A socio-economic gradient was also noted with those with a high living standard being more
aware than people with a low living standard. In terms of the provincial distribution, awareness was highest in Western
Cape and Gauteng whilst lowest in Limpopo, Mpumalanga, Northern Cape and Eastern Cape.
Once awareness levels were determined it was also very important to understand whether people undertake these
various energy saving measures. In the following table the awareness levels are compared with the undertaking of the
energy saving measure and the ratio between awareness and undertaking is portrayed.
MaleLP
MPGT
NW
KZN
FS
NC
EC
WC
Farms
Female
LowMedium
HighUrban formal
Urban informal
Tribal
16-19 years20-29 years
30-39 years
40-49 years
50-59 years
60-69 years
70+ years
Black African
Coloured
Indian or Asian
White
No schooling
PrimarySome secondary
Matric or equivalentTertiary education
80
70
60
50
40
30
20
10
0
2011 Average 2012 Average

96
Table 46: Awareness and Performance Regarding the Various Energy-Saving Measures (Percentage)
Awareness %
Often do %
Ratiobetween
awareness and doing
Switching off your lights when you leave you house 89 64 0.71
Using energy saving light bulbs 76 53 0.69
Use warm clothing or blankets instead of an electric heater 59 38 0.63
Switch off appliances (TV, radio, hi-fi) at the wall (not the remote control) when not in use
81 51 0.62
Boil only as much water with a pot or kettle that is needed 63 36 0.57
Switch off all your lights except security lights in home when not in use
65 36 0.56
Take a short shower or bath with as little water as possible 47 26 0.55
Switch off geyser at certain times during the day or at night 56 28 0.51
Electric stoves use a lot of electricity, so use the plates and oven as little as possible
60 30 0.49
Allow clothes to drip-dry instead of ironing 40 19 0.47
Close windows and doors when a heater is on 44 19 0.44
Insulate your geyser and hot pipes 28 6 0.22
Install a solar water heater instead of an electric geyser 37 4 0.12
Source: SASAS Energy related behaviour and perception survey (2012)
The energy-saving measures of which households are most aware and actually do most often are switching off of
lights when leaving the house. Seven in ten people that are aware of this measure actually embark and use this energy
saving measure. The national campaign of distributing and marketing energy savings light bulbs has also impacted with
almost 70% of all people aware of this energy saving measure actually implementing it. Higher than 0.6 ratios were
also noted for people using warm clothing or blankets rather than electric heaters and people switching off appliances
at the wall when not in use. Lower ratios (between .50 and .60) were noted for boiling only as much water as is
needed; switching off all lights except security lights when not in use; taking a short shower or bath with as little water
as possible and switching off the geyser at certain times during the day or night. The lowest rations (less than .50)
were noted for using the electric plates and the oven sparingly; allowing clothes to drip dry instead of ironing; closing
windows and doors when the heater is on; insulating geysers and hot pipes as well as installing a solar water heater
instead of an electric geyser.
It has been established that awareness of all energy saving measures has increased significantly from 2011 to 2012. In
an attempt to understand if this increase in awareness has actually translated into actions, and to determine if this has
increased from 2011 to 2012, the ratio between awareness and action for the 2011 and 2012 years are portrayed
below. As can be seen from Figure 28, in 2012 the ratio between awareness and undertaking is higer on all energy
saving measures. This implies that energy saving behaviour for all these measures had increased on a year to year basis.
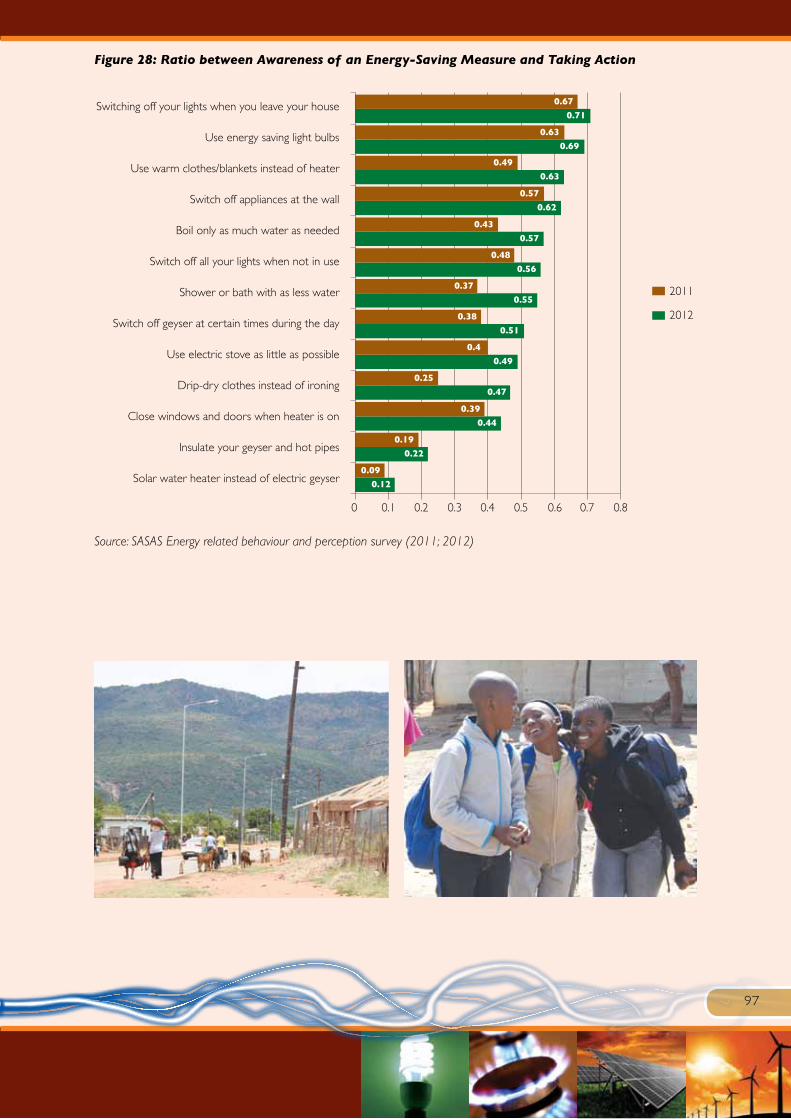
97
Figure 28: Ratio between Awareness of an Energy-Saving Measure and Taking Action
Source: SASAS Energy related behaviour and perception survey (2011; 2012)
Switching off your lights when you leave your house
Use energy saving light bulbs
Use warm clothes/blankets instead of heater
Switch off appliances at the wall
Boil only as much water as needed
Switch off all your lights when not in use
Shower or bath with as less water
Switch off geyser at certain times during the day
Use electric stove as little as possible
Drip-dry clothes instead of ironing
Close windows and doors when heater is on
Insulate your geyser and hot pipes
Solar water heater instead of electric geyser
0 0.1 0.2 0.3 0.4 0.5 0.6 0.7 0.8
0.09
0.19
0.39
0.25
0.4
0.38
0.37
0.48
0.43
0.57
0.49
0.63
0.67
0.12
0.22
0.44
0.47
0.49
0.51
0.55
0.56
0.57
0.62
0.63
0.69
0.71
2011
2012

98

99
8. Support for Different Energy-Related Activities
South Africa has been dubbed “the protest capital of the world” (Rodrigues, 2010) since it has one of the highest
rates of public protest in the world. During the 2004/05 financial year about 6,000 protests were officially recorded,
approximately 1000 were illegal and banned and an unknown number of protests went unrecorded. Since 2005
the number of protests has escalated dramatically and Heese and Allan (2011) report that “2009 and 2010 together
account for about two-thirds of all protests since 2004”. The number of protests reached an all time high between
2010 and 2012 and can therefore be said to be escalating.
These protests are usually referred to as service delivery protests in the media and it is evident that there is growing
unhappiness with service delivery. Zwelinzima Vavi, COSATU Secretary General, has described the increasing rate of
popular protest as a “ring of fire” closing in on major cities that could result in a revolution. As these protests continue
some analysts take the view that protests are also becoming increasingly radical. Some commentators have concluded
that “a large majority of South Africans feel that conventional mechanisms of engaging the state are failing and that
alternatives may be more effective (Pillay, 2011). Some commentators have also been stating that service delivery
protests are part of a broader Rebellion of the Poor.
In the light of the escalating protests, it was important to include questions about perceptions around protest action
in the questionnaire. South Africans were asked if it was “not wrong at all”, “wrong only sometimes”, “almost always
wrong” or “always wrong” to connect to electricity without paying for it, to protest about access to electricity or the
price of electricity. Similar questions were also asked in 2011 and the results are portrayed below.
In line with commentary, results from the 2011 and 2012 survey showed that two-thirds of South Africans felt that
it was not wrong at all (44%) or wrong only sometimes (22%) to protest about access to electricity (Figure 29). The
rest (under a third) stated that it almost always wrong or always wrong to protest over this issue. People felt even
stronger about protesting against the price of electricity with almost half (49%) of people in both the 2011 and 2012
survey stating that it is not wrong at all to protest over the price of electricity. Furthermore, a fifth of people in the
2012 survey and just more than a fifth (21%) in 2011 stated that it was “wrong only sometimes”. About a quarter
(27% in 2011 and 28% in 2012) felt that it was almost always or always wrong to protest about the price of electricity.
However strong opposition was voiced against illegal connections with national results indicating that the majority
(nine in ten) South Africans in both the 2011 and 2012 surveys were of the opinion that it is almost always wrong
or always wrong to connect to electricity without paying for it.
Figure 29: Protesting about Electricity (Percentage)
Source: SASAS Energy related behaviour and perception survey (2011; 2012)
3
22
22
9
44
Protesting about theprice of electricity
Not wrong at all Wrong only sometimes Almost always wrong Always wrong Do not know
100908070605040302010
0
Protesting about access to electricity
Connecting to electricitywithout paying for it
2
20
22
12
44
320
21
7
49
319
20
9
49
2
84
3 83
1
86
4 63
2011 2012 2011 2012 2011 2012
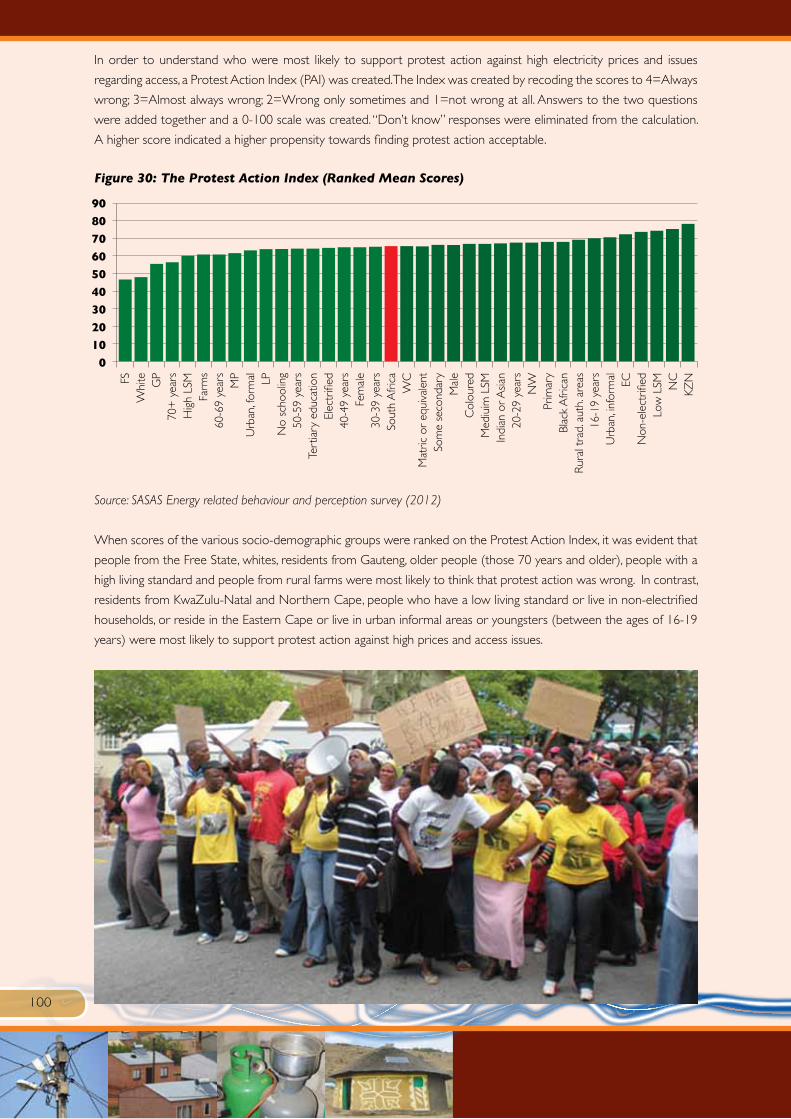
100
In order to understand who were most likely to support protest action against high electricity prices and issues
regarding access, a Protest Action Index (PAI) was created. The Index was created by recoding the scores to 4=Always
wrong; 3=Almost always wrong; 2=Wrong only sometimes and 1=not wrong at all. Answers to the two questions
were added together and a 0-100 scale was created. “Don’t know” responses were eliminated from the calculation.
A higher score indicated a higher propensity towards finding protest action acceptable.
Figure 30: The Protest Action Index (Ranked Mean Scores)
Source: SASAS Energy related behaviour and perception survey (2012)
When scores of the various socio-demographic groups were ranked on the Protest Action Index, it was evident that
people from the Free State, whites, residents from Gauteng, older people (those 70 years and older), people with a
high living standard and people from rural farms were most likely to think that protest action was wrong. In contrast,
residents from KwaZulu-Natal and Northern Cape, people who have a low living standard or live in non-electrified
households, or reside in the Eastern Cape or live in urban informal areas or youngsters (between the ages of 16-19
years) were most likely to support protest action against high prices and access issues.
FSW
hite GP
70+
yea
rsH
igh
LSM
Farm
s60
-69
year
sM
PU
rban
, for
mal LP
No
scho
olin
g50
-59
year
sTe
rtia
ry e
duca
tion
Elec
trifi
ed40
-49
year
sFe
mal
e30
-39
year
sSo
uth
Afr
ica
WC
Mat
ric o
r eq
uiva
lent
Som
e se
cond
ary
Mal
eC
olou
red
Med
iuim
LSM
Indi
an o
r Asia
n20
-29
year
sN
WPr
imar
yBl
ack
Afr
ican
Rur
al t
rad.
aut
h. a
reas
16-1
9 ye
ars
Urb
an, in
form
al ECN
on-e
lect
rified
Low
LSM N
CKZ
N
90
80
70
60
50
40
30
20
10
0

101
9. Policy Preferences
9.1. Government Priorities in Supplying Electricity to the People
Government has various demands and priorities when it comes to providing people with electricity. In order to
understand what mandate the people of South Africa would give government, some priorities were listed and the
South Africans were asked to choose three top priorities that government should prioritise. These responses were
combined and are listed in Figure 31.
Figure 31: Policy Preferences in terms of Government Priorities in the Supply Of Electricity (Multiple Response - Percent)
Source: SASAS Energy related behaviour and perception survey (2011; 2012)
In 2011 and 2012, three-quarters of all adult South Africans stated that the priority of the Department should be
to keep electricity prices low. Economical considerations outweighed other priorities by a considerable margin.
The second priority, mentioned by just more than half (52%) in 2011 and 46% in 2012, was that the Department
should ensure that load-shedding and power cuts are minimised. A further priority, shared by almost half of South
Africans (49% in 2011 and 51% in 2012), was that the Department should help poor households by giving more free
electricity. Keeping electricity prices down, avoiding load-shedding and giving more free electricity to help the poor
are the top three policy preference in relation to electricity provision. Fewer South Africans (40%) supported the
idea that the Department should prioritise dissemination of information about energy-saving measures. Even smaller
shares of people (29% in 2011 and 31% in 2012) felt that the priority should be to get non-electrified households
electrified or that renewable energy should be subsidised (22% in 2011 and 25% in 2012).
80
70
60
50
40
30
20
10
0
Subs
idise
ren
ewab
le
ener
gy
22G
et n
on-e
lect
rified
hous
ehol
ds e
lect
rified
29
Giv
e in
form
atio
n on
how
to
save
ele
ctric
ity
41
Hel
p po
or h
ouse
hold
s an
d gi
ve m
ore
free
ele
ctric
ity
49
Avo
id lo
adsh
eddi
ng /
pow
er c
uts
52
Keep
ele
ctric
ity
pric
es lo
w
75
Oth
er
3
Do
not
know
1
75
46 5140 31
253 1
2011 2012
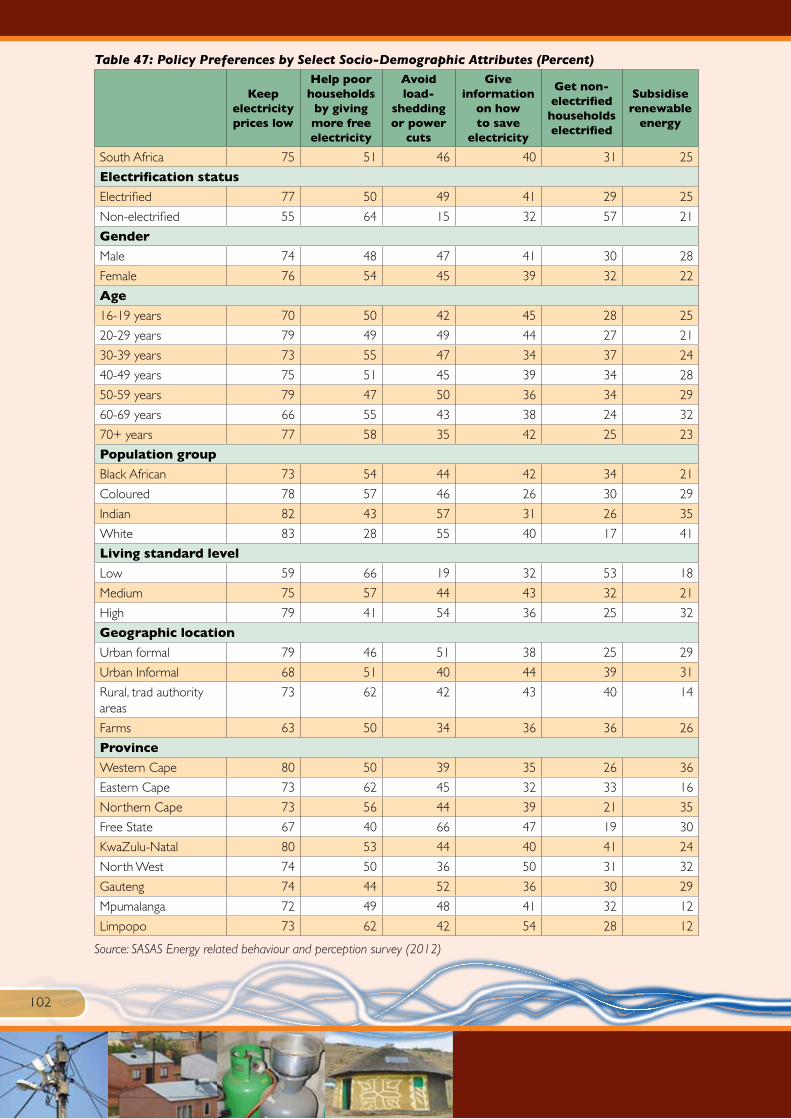
102
Table 47: Policy Preferences by Select Socio-Demographic Attributes (Percent)
Keep electricity prices low
Help poor households
by giving more free electricity
Avoid load-
shedding or power
cuts
Give information
on how to save
electricity
Get non-electrified households electrified
Subsidise renewable
energy
South Africa 75 51 46 40 31 25
Electrification status
Electrified 77 50 49 41 29 25
Non-electrified 55 64 15 32 57 21
Gender
Male 74 48 47 41 30 28
Female 76 54 45 39 32 22
Age
16-19 years 70 50 42 45 28 25
20-29 years 79 49 49 44 27 21
30-39 years 73 55 47 34 37 24
40-49 years 75 51 45 39 34 28
50-59 years 79 47 50 36 34 29
60-69 years 66 55 43 38 24 32
70+ years 77 58 35 42 25 23
Population group
Black African 73 54 44 42 34 21
Coloured 78 57 46 26 30 29
Indian 82 43 57 31 26 35
White 83 28 55 40 17 41
Living standard level
Low 59 66 19 32 53 18
Medium 75 57 44 43 32 21
High 79 41 54 36 25 32
Geographic location
Urban formal 79 46 51 38 25 29
Urban Informal 68 51 40 44 39 31
Rural, trad authority areas
73 62 42 43 40 14
Farms 63 50 34 36 36 26
Province
Western Cape 80 50 39 35 26 36
Eastern Cape 73 62 45 32 33 16
Northern Cape 73 56 44 39 21 35
Free State 67 40 66 47 19 30
KwaZulu-Natal 80 53 44 40 41 24
North West 74 50 36 50 31 32
Gauteng 74 44 52 36 30 29
Mpumalanga 72 49 48 41 32 12
Limpopo 73 62 42 54 28 12
Source: SASAS Energy related behaviour and perception survey (2012)

103
Three quarters of the South African public (75%) believes that the policy priority in terms of electrification should
be to keep prices low. As illustrated in Table 47, this conviction is mostly found among Whites (83%), Indians (82%),
residents of KwaZulu-Natal and Western Cape (80% respectively). The redistributive policy “give free electricity
to poorer households” was most important to people with a low living standard (66%) or living in non-electrified
households (64%), people residing in Eastern Cape, Limpopo or rural traditional authorities (all 62%). Avoiding load-
shedding or power cuts was most important to people living in the Free State (66%), Indians (57%), whites (55%),
people with a high living standard (54%) or living in urban formal areas (51%). Giving information on energy-saving
measures was most supported by people living in Limpopo (54%), North West (50%) and Free State (47%). As could
be expected, the highest preference for getting non-electrified households electrified were found among people
living in non-electrified households (57%) or poorer households with a low living standard (53%). Highest support
for subsidising renewable energy was found among whites (41%), residents of the Western Cape (36%), Indians or
people that live in the Northern Cape (both 35%).
9.2. Future Sources of Electricity Supply
In common with many countries throughout the world, South Africa is presently grappling with the twin policy
challenges of addressing climate change and ensuring that the future energy needs of the country are adequately
met. It is increasingly apparent that this mounting concern with respect to climate change and energy security has
influenced the direction and nature of energy policy in South Africa in recent years, with nuclear power being recast
as low-carbon technology (DoE, 2012). From an international perspective, South Africa has rather high levels of
greenhouse gas (GHG) emissions, a situation that is informed by the country’s energy-intensive economy that is
overwhelmingly dependent on coal (Winkler & Marquand, 2009). Fossil fuels therefore dominate the energy sector,
with coal providing 75% of the fossil fuel demand and accounting for more than 90% of electricity generation (DEAT,
2009: 3). In response, the government has committed to reducing its GHG emissions by 34% by 2020 and 43%
by 2025, a decision that has salient implications for the energy sector. The International Energy Agency has defined
energy security as ‘the uninterrupted physical availability of energy at a price which is affordable, while respecting
environmental concerns’ (IEA, 2001). Bearing this in mind, an over-reliance on coal, coupled with environmental
considerations and a need for a developmental approach in securing the energy requirements for all South Africans
has resulted in a strong energy policy emphasis on diversifying primary energy sources in coming decades. South
Africans were asked about their policy preferences regarding future sources of energy supply.
Figure 32: Policy Preferences in Meeting South Africans’ Future Energy Needs (Percent)
Source: SASAS Energy related behaviour and perception survey (2011; 2012)
35
30
25
20
15
10
5
055
911
25
30
2
Do not know
13
31
2414
8 6 7 2 8
2011 2012
Fuel madefrom crops
Nuclearpower
Naturalgas
Coal andoil
Any, as longas it does not damage theenvironment
Solar, windor water
Any, as longas it is the cheapestoption
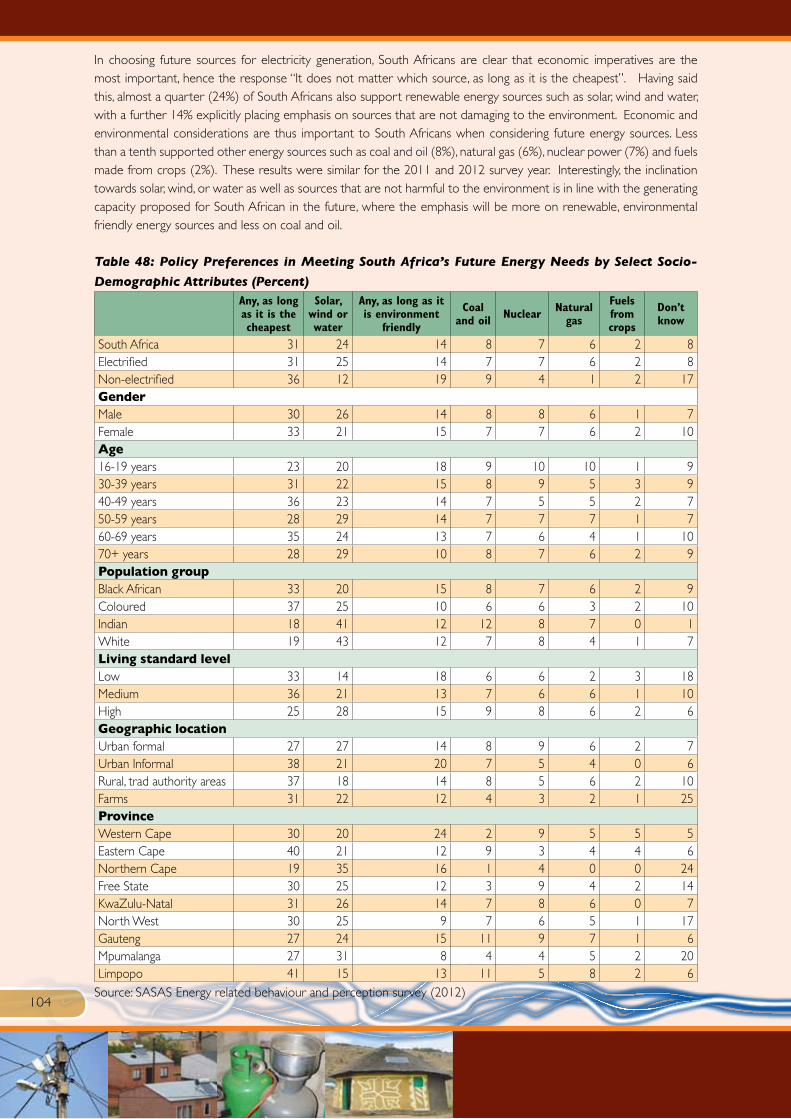
104
In choosing future sources for electricity generation, South Africans are clear that economic imperatives are the most important, hence the response “It does not matter which source, as long as it is the cheapest”. Having said this, almost a quarter (24%) of South Africans also support renewable energy sources such as solar, wind and water, with a further 14% explicitly placing emphasis on sources that are not damaging to the environment. Economic and environmental considerations are thus important to South Africans when considering future energy sources. Less than a tenth supported other energy sources such as coal and oil (8%), natural gas (6%), nuclear power (7%) and fuels made from crops (2%). These results were similar for the 2011 and 2012 survey year. Interestingly, the inclination towards solar, wind, or water as well as sources that are not harmful to the environment is in line with the generating capacity proposed for South African in the future, where the emphasis will be more on renewable, environmental friendly energy sources and less on coal and oil.
Table 48: Policy Preferences in Meeting South Africa’s Future Energy Needs by Select Socio-
Demographic Attributes (Percent)Any, as long as it is the cheapest
Solar, wind or water
Any, as long as it is environment
friendly
Coal and oil Nuclear Natural
gas
Fuels from crops
Don’t know
South Africa 31 24 14 8 7 6 2 8Electrified 31 25 14 7 7 6 2 8Non-electrified 36 12 19 9 4 1 2 17GenderMale 30 26 14 8 8 6 1 7Female 33 21 15 7 7 6 2 10Age16-19 years 23 20 18 9 10 10 1 930-39 years 31 22 15 8 9 5 3 940-49 years 36 23 14 7 5 5 2 750-59 years 28 29 14 7 7 7 1 760-69 years 35 24 13 7 6 4 1 1070+ years 28 29 10 8 7 6 2 9Population groupBlack African 33 20 15 8 7 6 2 9Coloured 37 25 10 6 6 3 2 10Indian 18 41 12 12 8 7 0 1White 19 43 12 7 8 4 1 7Living standard levelLow 33 14 18 6 6 2 3 18Medium 36 21 13 7 6 6 1 10High 25 28 15 9 8 6 2 6Geographic locationUrban formal 27 27 14 8 9 6 2 7Urban Informal 38 21 20 7 5 4 0 6Rural, trad authority areas 37 18 14 8 5 6 2 10Farms 31 22 12 4 3 2 1 25ProvinceWestern Cape 30 20 24 2 9 5 5 5Eastern Cape 40 21 12 9 3 4 4 6Northern Cape 19 35 16 1 4 0 0 24Free State 30 25 12 3 9 4 2 14KwaZulu-Natal 31 26 14 7 8 6 0 7North West 30 25 9 7 6 5 1 17Gauteng 27 24 15 11 9 7 1 6Mpumalanga 27 31 8 4 4 5 2 20Limpopo 41 15 13 11 5 8 2 6
Source: SASAS Energy related behaviour and perception survey (2012)

105
Of all the different socio-demographic variables that this preference was examined by, the highest proportion
indicating a preference for the cheapest energy was found among people living in Limpopo (41%), Eastern Cape
(40%), people living in urban informal areas (38%) and rural traditional authority areas (37%) or coloured people.
Preference for renewable energy such as solar, wind, or water was highest among whites (43%) and Indians (41%)
or people living in the Northern Cape (35%). People in the Western Cape (24%), in urban informal areas (20%), in
non-electrified areas (19%) were mostly in favour of environmentally-friendly solutions. Coal and oil as sources of
electricity were mostly favoured by Indians (12%), and residents of Limpopo (11%) and Gauteng. Youngsters (aged
between 16 and 19 years) were particularly in favour of nuclear energy and natural gas.
9.3. Government Policies
One of the main priorities of the department is the provision of accessible, affordable, and reliable energy to the
people of South Africa. In order to achieve this, certain policies and strategies are crafted. In this section we look at
some of the policies and strategies employed by the Department and determine to what extent these policies and
strategies are supported by South Africans. Respondents had the opportunity to rate to what extent they were
strongly in favour, in favour, neither nor, against or strongly against the strategy.
Table 49: Policy Preferences (Percentage)
The South African government should:
Strongly in
favour
In favour
Neither in favour
nor against
AgainstStrongly against
(Do not
know)
Mean score
Spend money to replace electric geysers with solar geysers
41 37 12 5 2 4 78.4
Give all households an amount of free energy per month
46 33 10 6 4 3 77.8
Spend money on campaigns to encourage people to use less energy
28 45 9 10 5 3 71.1
Make the price of electricity higher for rich households than for poor households
15 23 20 24 14 4 49.9
Source: SASAS Energy related behaviour and perception survey (2012)
The two most preferred strategies in terms of energy-saving initiatives were to replace electric geysers with solar
geysers and to give households an amount of free energy per month. More than three-quarters (78%) of South
Africans were strongly in favour or in favour of the option of replacing electric geysers with solar geysers. Similarly a
large proportion (79%) was in favour of allocating an amount of free energy per month to all households. Another
popular policy preference option, nominated by 73%, was to spend money on campaigning to encourage people to
use less energy. Just more than a third (38%) of people was in favour of making the price of electricity higher for
richer households.
Interestingly, support for campaigns to encourage people to use less energy was forthcoming from people with no
schooling (76%) or a primary school qualification (74%) or people living on farms and in KwaZulu-Natal (74%) or
Mpumalanga (74%). People with a lower educational status felt that education regarding the better use of electricity
was important. Furthermore, South Africans were generally in agreement that money should be spend to replace

106
electric geysers with solar geysers and this feeling was most prevalent among whites, people with no schooling and
people residing in the Northern Cape (83%). As could be expected, people with a low living standard (86%) were
most in favour of households receiving free electricity whilst Whites and those with a high living standard were least
in favour of this. This trend was similar for making the electricity price higher for rich households.
Figure 33: Support for the Inclined Block Tarrif Structure by LSM (Percentage)
Source: SASAS Energy related behaviour and perception survey (2011; 2012)
In 2008 the inclined block rate structure was implemented which implied that households that use more electricity
would be charged at a higher tarrif price. In Figure 33, we determine support for this policy and find that nationally,
just more than half (52%) of South Africans support his policy with just over a quarter 26% opposing it by disagreeing
or strongly disagreeing with the policy. When analysed by living standard measure, it is not surprising to find that
support for this policy is lowest among households with a high living standard – in all likelihood motivated by the
fact that they are the households that use more electricity and would be penalised by paying higher tarrrif prices. A
large proportion of low income households was unsure about whether to support this policy with 16% stating “don’t
know”.
From this section it is clear that South Africans are broadly in favour of current policies that are being implemented
by government. The majority of South Africans favour campaigns to encourage people to use less energy and also
support the instalment of new energy saving devices such as solar geysers. As could be expected, policies that
implied increasing the rates for higher income households or paying escalating tariffs for increased usage were
accepted by fewer people, especially the high income earners most affected by these policies.
100
90
80
70
60
50
40
30
20
10
0
10
16
35
18
17
Strongly agree Agree Neutral Disagree Do not knowStrongly disagree
4
5
14
28
14
24
16 6
14
39
18
20
4
16
19
31
19
12
3
South Africa Low Medium High
107
10. Conclusion and Recommendations
Progress towards providing greater access to modern energy services in South Africa has generally been hailed a
success, but despite this, certain obstacles still remain in achieving universal access. Some of these obstacles include the
lack of financial resources to build infrastructure and reduce first-cost barriers to access; remote inaccessible terrain;
and low income levels among the un-served population. Despite all these challenges, the Department has committed
itself to increase access to modern energy sources to 92% by 2014 and, in line with the national development plan,
universal access by 2025. In order to achieve this, various strategies needs to be employed. This report interrogated
important issues around energy-related behaviour and perceptions in South Africa and gave some guidance in terms
of strategies for the department.
From this report it is evident that in late 2012, considerable patterns of difference continued to exist between
electrified and non-electrified households in the range of energy sources relied upon to meet basic needs. Those
with electricity all reported that they used this source either for lighting, cooking or heating, although it is apparent
that other sources such as candles, paraffin, firewood and gas continue to be relied upon in at least a fifth of cases.
Conversely, in the absence of a domestic connection, non-electrified households rely primarily on candles, paraffin
and firewood, with more nominal shares reporting the use of coal and gas. Dry cell batteries are more common in
non-electrified households owing predominantly to their use for operating appliances.
Poorer households use electricity mainly for lighting but often cannot afford to use it for cooking or heating. For
cooking, almost half of all electrified households in South Africa use electricity in combination with other energy
sources such as firewood, paraffin and gas for cooking. This is also the case with heating, where wood and coal are
widely used for heating rather than electricity. Non-electrified households depend mostly on paraffin and candles for
lighting, firewood and paraffin for cooking and firewood for heating. Water heating for bathing purposes and non-
bathing purposes is mostly done by using an electric kettle or geyser. Firewood and paraffin is mostly used in these
households to heat water for bathing and other purposes. This enforced dependence on solid fuels has a number of
negative impacts on health, environmental degradation and energy poverty. Poorer households might well be aware
of the burden, inconvenience and health detriments of cooking over smoky fires, but their economic choices are very
limited.
From this report it is evident that the use of solid fuels has been decreasing steadily over the past 15 years, with only
about 13% of all households currently relying solely on solid fuels for cooking and 17% relying solely on solid fuels
for heating. This signifies a positive trend, not only in terms of energy but also in terms of general development goals
such as achieving millennium development goals. Despite this progress, it is important to note that progress is uneven
with less than 5% of households using solid fuels for cooking in Western Cape, Free State and Gauteng, but more than
20% still using solid fuels for cooking in Eastern Cape, Mpumalanga and Limpopo. The over reliance on solid fuels in
the more rural provinces is concerning and alternative energy sources should be sought to provide energy in these
rural provinces.
Multiple energy use in South Africa remains a reality, especially in poorer households in South Africa. Given this
reality, it is important that the Department adopts energy strategies that focus on diversification as well as issues of
affordability, reliability, clean and safe energy services. The answer is therefore not in only stand-alone grid connected
electricity but rather a combination of sources, i.e. a kerosene lamp or PV panel providing home lighting. The approach
should be to determine the most effective way of delivering services to remote rural areas, and what combination of
sources could be used most effectively. The idea is that multiple technologies are required depending on the resource
availability and cost effectiveness of the delivery systems available. An example of such a diversification strategy could
be to diversify ways of heating water for general purposes. From this report it is evident that 95% of households
use a single energy source for heating water for purposes other than bathing and in a majority of cases an electrical
108
appliance is involved. This creates an opportunity for the Department to employ a diversification strategy where
devices such as solar panels can relieve pressure on the national grid. Also, as can be seen from the report, the uptake
of solar geysers among affluent households has been slow. It is therefore recommended that campaigning for a switch
to solar geysers be intensified in order to reduce reliance on the national grid.
Evidence linking the provision of energy services with achievements of social objectives and economic progress
is well documented with the opposite also being true. Extreme energy poverty leads to malnutrition, disease and
even child and adult mortality. This study measured energy poverty and used three approaches namely, household
energy expenditure relative to household income, a subjective measure and an energy-inefficient dwelling approach.
The most common indicator of the three - namely, the household energy expenditure relative to income approach
- stipulates that a household is energy poor if it uses more than 10% of its income on energy. Households with
energy expenditure exceeding this threshold are considered to be energy poor and in consequence are likely to
be confronted with difficult choices between meeting energy requirements and other basic competing spending
priorities. Results show that close to half of all South African households are energy poor, with almost three-quarters
(72%) of households in the poorest quintile being energy poor. Furthermore, this report shows that high income
households also suffer under the burden of higher electricity prices and that even among the richest quintile, 18% of
households are energy poor. These findings are consistent with the 2011 survey and can therefore be regarded as
reliable. In the 2011 and 2012 surveys it was also consistently found that between a quarter and a third of households
felt that their energy was not sufficient and this was mostly due to affordability issues. Increasing electricity prices are
a threat to all South Africans and energy price reviews are urgently needed to ensure that households do not get
further entrapped in energy poverty. This calls for a review of the current electricity pricing increase model and the
current tariff structures.
The profile of energy poverty using the all three energy poverty approaches revealed that energy poor households
are found disproportionately in the Eastern Cape, Limpopo or KwaZulu-Natal, and in rural traditional authority areas.
There was also an increased likelihood of being energy poor if a household has a lower living standard level or falls
in the poorest per capita income quintiles. Poorer households in South Africa are therefore carrying an enormous
energy burden and current policies of subsidisation of energy sources to electrified and non-electrified households
by policies such as the FBE, FBAE and IBT are a step in the right direction and a welcome relief to ensure that these
households do not get trapped even deeper into poverty and vulnerability. All of these policies are designed to assist
poor households, but many authors argue that this is still not enough. Whereas the FBE subsidy paid to consumers is
certainly a contribution to affordable electricity, some researchers have reservations about the amount and claim that
the 50 kW/h are not sufficient. They argue that the wider socio-economic development benefits of electrification
and other energy relief initiatives seem disappointing, partly because of the fact that poorer households are still not
able to meet basic needs with the amounts subsidised by government. Consideration needs to be given to these
issues and it is recommended that targeted interventions need to be made with regards to municipalities with no or
low revenues where a significant majority of households are poor. The recommendation is for government to increase
the fiscal allocation to these types of municipalities. However, this fiscal increase should be done in a conditional grant
manner that restricts them to FBE and FBAE aimed at indigent households.
It is evident from the report that the IRP should take economic imperatives seriously when planning for future energy
choices. The majority of households indicated that they wanted the cheapest energy alternative, regardless of the
energy source option, be it solar, wind, coal, oil, natural gas, nuclear power or fuels made from crops, etc. Ideological
sentiment seems to vanish in the wake of economic realities. The desperation in terms of energy price increases is
even more evident if it is considered that more than a quarter of poor households said “they would not know what
to do if electricity prices would be increased again”. Although this study found that households are willing to pay
and have an aversion to illegal connections, the reality of raising energy prices is desperately burdensome.
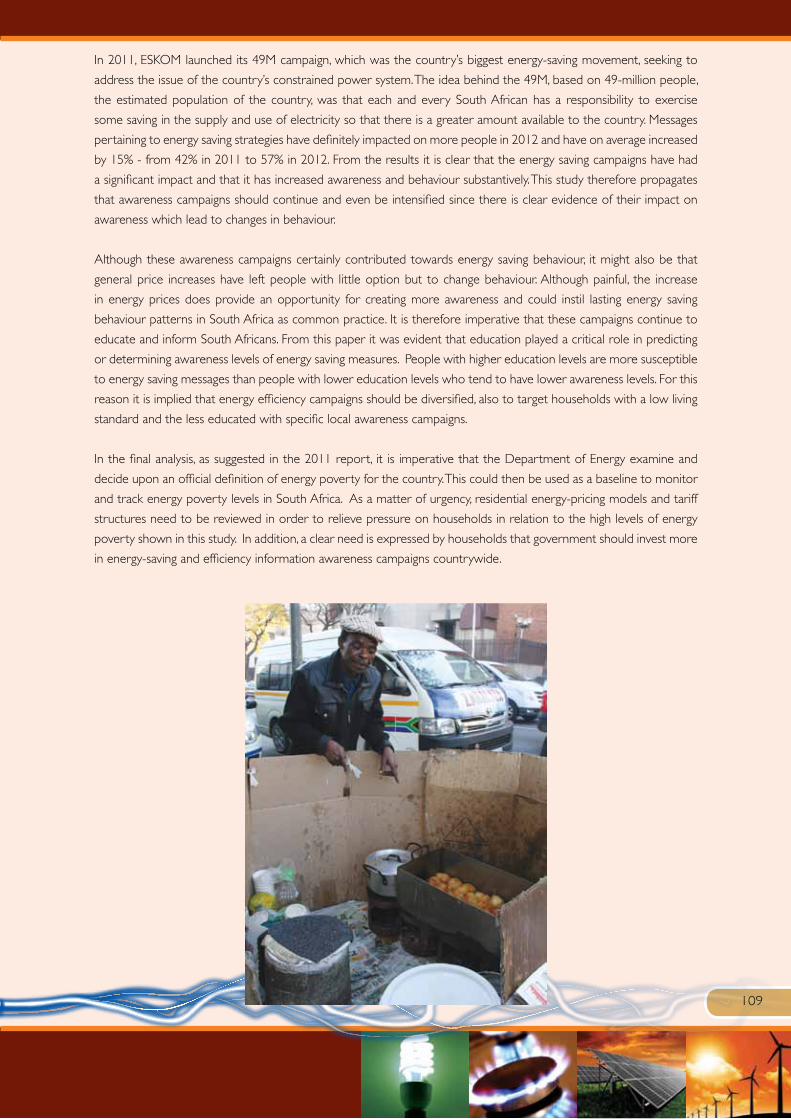
109
In 2011, ESKOM launched its 49M campaign, which was the country’s biggest energy-saving movement, seeking to
address the issue of the country’s constrained power system. The idea behind the 49M, based on 49-million people,
the estimated population of the country, was that each and every South African has a responsibility to exercise
some saving in the supply and use of electricity so that there is a greater amount available to the country. Messages
pertaining to energy saving strategies have definitely impacted on more people in 2012 and have on average increased
by 15% - from 42% in 2011 to 57% in 2012. From the results it is clear that the energy saving campaigns have had
a significant impact and that it has increased awareness and behaviour substantively. This study therefore propagates
that awareness campaigns should continue and even be intensified since there is clear evidence of their impact on
awareness which lead to changes in behaviour.
Although these awareness campaigns certainly contributed towards energy saving behaviour, it might also be that
general price increases have left people with little option but to change behaviour. Although painful, the increase
in energy prices does provide an opportunity for creating more awareness and could instil lasting energy saving
behaviour patterns in South Africa as common practice. It is therefore imperative that these campaigns continue to
educate and inform South Africans. From this paper it was evident that education played a critical role in predicting
or determining awareness levels of energy saving measures. People with higher education levels are more susceptible
to energy saving messages than people with lower education levels who tend to have lower awareness levels. For this
reason it is implied that energy efficiency campaigns should be diversified, also to target households with a low living
standard and the less educated with specific local awareness campaigns.
In the final analysis, as suggested in the 2011 report, it is imperative that the Department of Energy examine and
decide upon an official definition of energy poverty for the country. This could then be used as a baseline to monitor
and track energy poverty levels in South Africa. As a matter of urgency, residential energy-pricing models and tariff
structures need to be reviewed in order to relieve pressure on households in relation to the high levels of energy
poverty shown in this study. In addition, a clear need is expressed by households that government should invest more
in energy-saving and efficiency information awareness campaigns countrywide.
110
11. References
Annecke, W. (2005). ‘Prepayment Meters in Merlo, Argentina and Khayelitsha, South Africa’, in Electricity Supply
Industry Africa, Issue 2.
Bekker, B., Gaunt, C.T., Eberhard, A., & Marquard, A. (2008). Uncertainties within South Africa’s goal of universal access
to electricity by 2012., Journal of Energy in Southern Africa, 19(2) May 2008, pp4-13
Boardman, B. (1991). Fuel poverty: from cold homes to affordable warmth. Belhaven Press, London
Burger, J. (2009). The Reasons Behind Service Delivery Protests in South Africa. Institute for Security Studies 29 July
2009. http://www.issafrica.org/topics/corruption).
Buzar, S. (2006). Estimating the extent of domestic energy deprivation through household expenditure surveys. CEA
Journal of Economics, 1: 5-14.
Department of Environmental Affairs and Tourism. (2009). Greenhouse Gas inventory South Africa 1990 to 2000:
National Inventory Report, Pretoria: Department of Environmental Affairs and Tourism.
Department of Minerals and Energy . (2003). Electricity Basis Support Services Tariff Policy, 30 June, Pretoria.
Department of Minerals and Energy (DME),
Department of Energy . (2011). Integrated National Electrification Programme: briefing by Department of Energy.
Parliamentary Monitoring Group. 7 March 2011.
Department of Energy . (2012). A survey of energy-related behaviour and perceptions in South Africa: The Residential
Sector. http://www.energy.gov.za/files/media/Pub/Survey
Free Basic Alternative Energy Policy. (2007). Household Energy Support Programme. Government Gazette 2 April
2007. Notice 391 of 2007.
Fankhauser, S., & Tepic, S. (2007). Can poor consumers pay for energy and water? An affordability analysis for transition
countries. Energy Policy, 35(2), 1038-1049.
Heese, K & Allan, K (2011). Are fiery street protests replacing the vote? Business Day.18 February 2011.
Hills, J. (2011). Fuel poverty: The problem and its measurement. Interim report of the Fuel Poverty Review. London:
Department for Energy and Climate Change (DECC).
Hills, J. (2012). Getting the measure of fuel poverty: Final report of the Fuel poverty Review. London: Department for
Energy and Climate Change (DECC).
Howells, M., Victor, D. G., Gaunt, T., Elias, R. J., & Alfstad, T. (2006). Beyond free electricity: The costs of electric cooking
in poor households and a market-friendly alternative. Energy Policy, 34(17), 3351-3358.
International Energy Agency. ( 2001). Toward a sustainable energy future. OECD/IEA, Paris.

111
Lamech, R., & O’Sullivan, K. (2002) Energy. Chapter 21 in Klugman, J. (ed.) A sourcebook for poverty reduction
strategies. Washington, D.C: World Bank.
Magidmisha, H., Roberts, B., Gordon, S., & Struwig, J. (2011). Are you being served? Perceptions of service delivery.
HSRC Review. Volume 10. September 2012.
Modi, V., McDade, S., Lallement, D., & Saghir, J. (2006). Energy services for the millennium development goals Energy
Sector Management Assistance Programme (New York: United Nations Development Programme, UN Millennium
Project, and World Bank)
National Energy Regulator of South Africa, (2010). Media Statement http://www.nersa.org.za/Admin/Document/
Editor/file/News and Publications. 24 February 2010
National Development Plan. (2011). National Development Plan- Vision for 2013. http://www.npconline.co.za /
medialib/downloads/home/NPC National Development Plan Vision 2030.pdf
Pillay, U. (2011). Delivery protests National problem requires local, tailor-made solutions, Business Day, 1 April 2011
Prasad, G. (2006). Social issues. In: H. Winkler, ed. Energy policies for sustainable development in South Africa: Options
for the future. Cape Town, Energy Research Centre University. pp 61 – 76.
Rodrigues, C. (2010). “Black boers” and other revolutionary songs. News and Politics-Perspective. Mail and Guardian.
5 April 2010.
Ruiters, G. (2011). Developing or Managing the Poor: The Complexities and Contradictions of Free Basic Electricity
in South Africa (2000-2006). Africa Development, Vol. XXXVI, No.1, 2011, pp. 119–14
Sebitos, A.B., & Pillay, P. (2005). Energy services in sub-Saharan Africa: how conducive is the environment? Energy Policy,
33 (16) (2005), pp. 2044–2051
Sefton, T. (2002). Targeting fuel poverty in England: is the government getting warm?. Fiscal Studies, 23(3), 369-399.
Winkler, H. (2006). Renewable Energy Policy in South Africa: Policy Options for Renewable Electricity. Energy Policy
Vol. 33, pp.27-38
Winkler, H., & Marquand, A. (2009), Changing development paths: From an energy-intensive to low-carbon economy
in South Africa, Climate and Development, 1 (1), pp47-65.
White, C., Bank, L., Jones, S., & Mehlwana, M. (1997). Restricted electricity use among poor urban households.
Development Southern Africa, 14(3), 413-423.
World Health Organization (WHO). (2004). Energy, Sustainable Development and Health. Background document for
the Fourth Ministerial Conference on Environment and Health, Budapest, Hungary, 23–25 June 2004. . Geneva: WHO.

112
Appendix A
SOUTH AFRICAN SOCIAL ATTITUDES SURVEYQuestionnaire 2: September 2012
RESPONDENTS AGED 16 YEARS +
Good (morning/afternoon/evening), I’m __________ and we are conducting a survey for the Human Sciences Research Council (HSRC). The HSRC regularly conducts surveys of opinion amongst the South African population. Topics include a wide range of social matters such as communications, politics, education, unemployment, the problems of the aged and inter-group relations. As a follow-up to this earlier work, we would like to ask you questions on a variety of subjects that are of national importance. To obtain reliable, scientific information we request that you answer the questions that follow as honestly as possible. Your opinion is important in this research. The area in which you live and you yourself have been selected randomly for the purpose of this survey. The fact that you have been chosen is thus quite coincidental. The information you give to us will be kept confidential. You and your household members will not be identified by name or address in any of the reports we plan to write.
PARTICULARS OF VISITS
DAY MONTH TIME STARTED TIME COMPLETED **RESPONSE
HR MIN HR MIN
First visit / / 2012
Second visit / / 2012
Third visit / / 2012
**RESPONSE CODES
Completed questionnaire = 01
Partially completed questionnaire (specify reason) = 02
Revisit
Appointment made = 03
Selected respondent not at home = 04
No one home = 05
Do not qualify
Vacant house/flat/stand/not a house or flat/demolished = 06
No person qualifies according to the survey specifications = 07
Respondent cannot communicate with interviewer because of language = 08
Respondent is physically/mentally not fit to be interviewed = 09
Refusals
Contact person refused = 10
Interview refused by selected respondent = 11
Interview refused by parent = 12
Interview refused by other household member = 13
OFFICE USE = 14
STRICTLY CONFIDENTIAL

113
Name of Interviewer …………………………………………………………………………………………………………
Number of interviewer
Checked by
Signature of supervisor
FIELDWORK CONTROL
CONTROL YES NO REMARKS
Personal 1 2
Telephonic 1 2
Name SIGNATURE
…………………………… DATE …………………………… / ……………………………… / ………………2012
RESPONDENT SELECTION PROCEDURE Number of households at visiting point
Number of persons 16 years and older at visiting point
Please list all persons at the visiting point/on the stand who are 16 years and older and were resident 15 out of the past 30 days. Once this is completed, use the Kish grid on next page to determine which person is to be interviewed.
Names of Persons Aged 16 and Older
01
02
03
04
05
06
07
08
09
10
11
12
13
14
15
16
17
18
19 NAME OF RESPONDENT:
20 ADDRESS OF RESPONDENT:
21 . . . . . . . . . . . . . . . . . . . . . . . . . . . . . . . . . . . . . . . . . . . . . . . . . . . . . . . . . . . . . . . . . . . . . . . . . . . . . . . . . . . . . . . . . . . . . . . . . . . . . . . . . . . .
. . . . . . . . . . . . . . . . . . . . . . . . . . . . . . . . . . . . . . . . . . . . . . . . . . . . . . . . . . . . . . . . . . . . . . . . . . . . . . . . . . . . . . . . . . . . . . . . . . . . . . . . . . . .
. . . . . . . . . . . . . . . . . . . . . . . . . . . . . . . . . . . . . . . . . . . . . . . . . . . . . . . . . . . . . . . . . . . . . . . . . . . . . . . . . . . . . . . . . . . . . . . . . . . . . . . . . . . .22
23
24
25 TEL NO.:
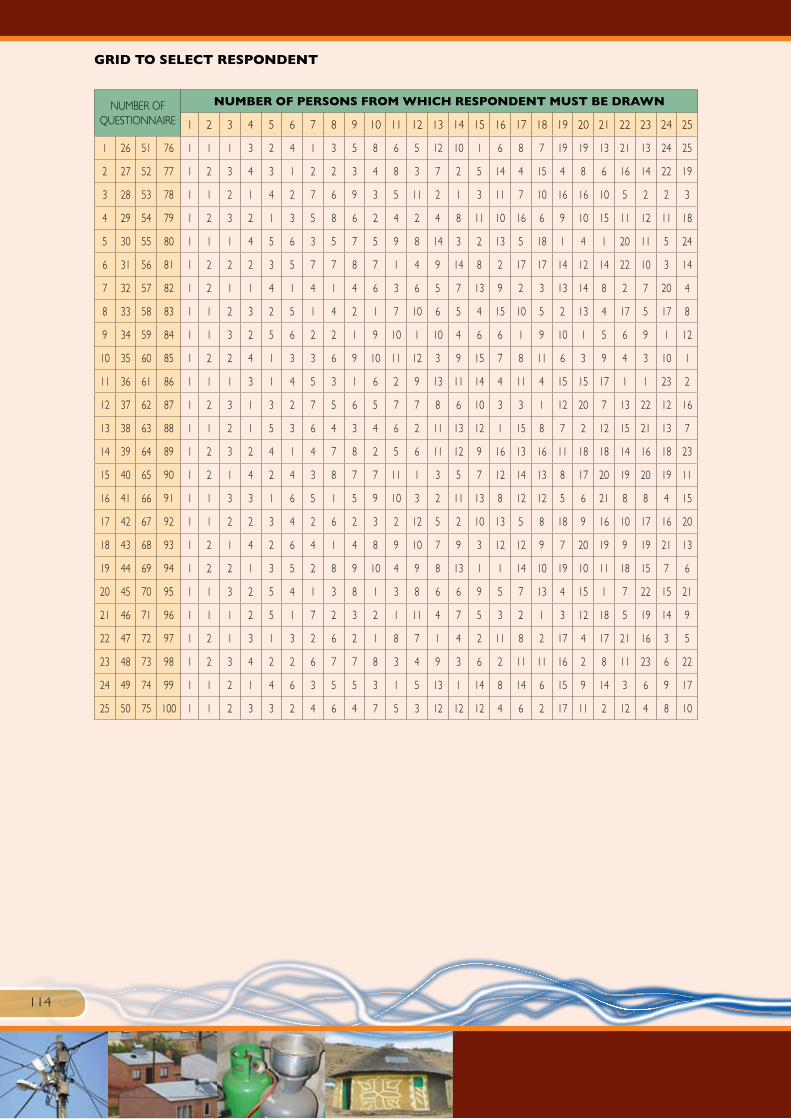
114
GRID TO SELECT RESPONDENT
NUMBER OF QUESTIONNAIRE
NUMBER OF PERSONS FROM WHICH RESPONDENT MUST BE DRAWN
1 2 3 4 5 6 7 8 9 10 11 12 13 14 15 16 17 18 19 20 21 22 23 24 25
1 26 51 76 1 1 1 3 2 4 1 3 5 8 6 5 12 10 1 6 8 7 19 19 13 21 13 24 25
2 27 52 77 1 2 3 4 3 1 2 2 3 4 8 3 7 2 5 14 4 15 4 8 6 16 14 22 19
3 28 53 78 1 1 2 1 4 2 7 6 9 3 5 11 2 1 3 11 7 10 16 16 10 5 2 2 3
4 29 54 79 1 2 3 2 1 3 5 8 6 2 4 2 4 8 11 10 16 6 9 10 15 11 12 11 18
5 30 55 80 1 1 1 4 5 6 3 5 7 5 9 8 14 3 2 13 5 18 1 4 1 20 11 5 24
6 31 56 81 1 2 2 2 3 5 7 7 8 7 1 4 9 14 8 2 17 17 14 12 14 22 10 3 14
7 32 57 82 1 2 1 1 4 1 4 1 4 6 3 6 5 7 13 9 2 3 13 14 8 2 7 20 4
8 33 58 83 1 1 2 3 2 5 1 4 2 1 7 10 6 5 4 15 10 5 2 13 4 17 5 17 8
9 34 59 84 1 1 3 2 5 6 2 2 1 9 10 1 10 4 6 6 1 9 10 1 5 6 9 1 12
10 35 60 85 1 2 2 4 1 3 3 6 9 10 11 12 3 9 15 7 8 11 6 3 9 4 3 10 1
11 36 61 86 1 1 1 3 1 4 5 3 1 6 2 9 13 11 14 4 11 4 15 15 17 1 1 23 2
12 37 62 87 1 2 3 1 3 2 7 5 6 5 7 7 8 6 10 3 3 1 12 20 7 13 22 12 16
13 38 63 88 1 1 2 1 5 3 6 4 3 4 6 2 11 13 12 1 15 8 7 2 12 15 21 13 7
14 39 64 89 1 2 3 2 4 1 4 7 8 2 5 6 11 12 9 16 13 16 11 18 18 14 16 18 23
15 40 65 90 1 2 1 4 2 4 3 8 7 7 11 1 3 5 7 12 14 13 8 17 20 19 20 19 11
16 41 66 91 1 1 3 3 1 6 5 1 5 9 10 3 2 11 13 8 12 12 5 6 21 8 8 4 15
17 42 67 92 1 1 2 2 3 4 2 6 2 3 2 12 5 2 10 13 5 8 18 9 16 10 17 16 20
18 43 68 93 1 2 1 4 2 6 4 1 4 8 9 10 7 9 3 12 12 9 7 20 19 9 19 21 13
19 44 69 94 1 2 2 1 3 5 2 8 9 10 4 9 8 13 1 1 14 10 19 10 11 18 15 7 6
20 45 70 95 1 1 3 2 5 4 1 3 8 1 3 8 6 6 9 5 7 13 4 15 1 7 22 15 21
21 46 71 96 1 1 1 2 5 1 7 2 3 2 1 11 4 7 5 3 2 1 3 12 18 5 19 14 9
22 47 72 97 1 2 1 3 1 3 2 6 2 1 8 7 1 4 2 11 8 2 17 4 17 21 16 3 5
23 48 73 98 1 2 3 4 2 2 6 7 7 8 3 4 9 3 6 2 11 11 16 2 8 11 23 6 22
24 49 74 99 1 1 2 1 4 6 3 5 5 3 1 5 13 1 14 8 14 6 15 9 14 3 6 9 17
25 50 75 100 1 1 2 3 3 2 4 6 4 7 5 3 12 12 12 4 6 2 17 11 2 12 4 8 10

115
SASAS QUESTIONNAIRE 1: 2012
Number of persons in this household
Number of persons 16 years and older in this household
INTERVIEWER: PLEASE CIRCLE APPROPRIATE CODES
Household schedule
Write in from oldest (top) to youngest
(bottom) Pers
on
num
ber
How old is [name]? (in completed
years; less than 1 year =00)
Is [name] a male or a female?
M=1 F=2
What population group does
[name] belong to?
What is [name]’s
relationship to the respondent
Please list all persons in the household who eat from the same cooking pot and who were resident 15 out of the past 30 days
Note: Circle the number next to the name of the household head.
01
02
03
04
05
06
07
08
09
10
11
12
13
14
15
16
17
18
19
20
21
22
23
24
25
Population Group Relationship to respondent codes
1 = Black African 1 = Respondent
2 = Coloured 2 = Wife or husband or partner
3 = Indian or Asian 3 = Son/daughter/stepchild/adopted child
4 = White 4 = Father/mother/ step father/step mother
5 = Other (specify) 5 = Brother/sister/step brother/step sister
6 = Grandchild/great grandchild
7 = Grandparent/great grandparent
8 = Mother- or father-in-law
9 = Son- or daughter-in-law
10 = Brother- or sister-in-law
11 = Other relation (e.g. aunt/uncle)
12 = Non-relation

116
ENERGY
I would like to ask you some questions about the energy sources that you use in your household.
1. Do you have access to electricity in your household? In-house conventional meter 1
In-house pre-paid meter 2
Connected to other source which I pay for (e.g. connected to neighbour’s line and paying neighbour) 3
Connected to other source which I do not pay for (e.g. connected to neighbour’s line and not paying) 4
No access to electricity 8
(Uncertain/Don’t know) 9
2. What sources of energy are used for lighting in this household? 3. What is the main source of energy for lighting in this household?
2.(a)-(j) All sources used for lighting
3. Main source for lighting
INTERVIEWER: MULTIPLE RESPONSE
INTERVIEWER: CIRCLE ONE OPTION ONLY
a. Paraffin 01 01
b. Gas 02 02
c. Candle 03 03
d. Solar System 04 04
e. Electricity 05 05
f. Batteries 06 06
g. Car batteries 07 07
h. Generator (petrol/diesel) 08 08
i. Other (specify) 09 09
j. (Don’t know) 98 98
4. What sources of energy are used for cooking in this household?5. What is the main source of energy for cooking in this household?
4.(a)-(j) All sources used for cooking
5. Main source for cooking
INTERVIEWER: MULTIPLE RESPONSE
INTERVIEWER: CIRCLE ONE OPTION ONLY
Paraffin 01 01
Gas 02 02
Coal 03 03
Firewood 04 04
Solar System 05 05
Electricity 06 06
Generator (petrol/diesel) 07 07
Other (specify) 08 08
(Don’t know) 98 98
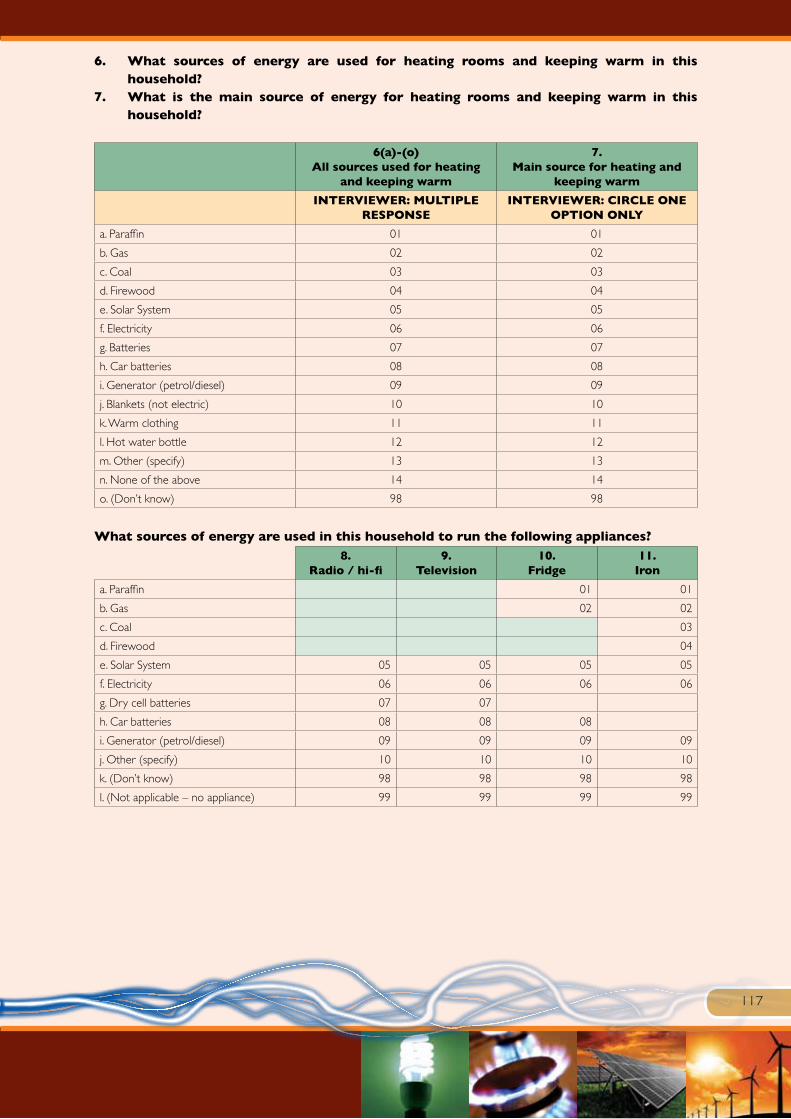
117
6. What sources of energy are used for heating rooms and keeping warm in this household?
7. What is the main source of energy for heating rooms and keeping warm in this household?
6(a)-(o) All sources used for heating
and keeping warm
7. Main source for heating and
keeping warm
INTERVIEWER: MULTIPLE RESPONSE
INTERVIEWER: CIRCLE ONE OPTION ONLY
a. Paraffin 01 01
b. Gas 02 02
c. Coal 03 03
d. Firewood 04 04
e. Solar System 05 05
f. Electricity 06 06
g. Batteries 07 07
h. Car batteries 08 08
i. Generator (petrol/diesel) 09 09
j. Blankets (not electric) 10 10
k. Warm clothing 11 11
l. Hot water bottle 12 12
m. Other (specify) 13 13
n. None of the above 14 14
o. (Don’t know) 98 98
What sources of energy are used in this household to run the following appliances?8.
Radio / hi-fi9.
Television10.
Fridge11.
Iron
a. Paraffin 01 01
b. Gas 02 02
c. Coal 03
d. Firewood 04
e. Solar System 05 05 05 05
f. Electricity 06 06 06 06
g. Dry cell batteries 07 07
h. Car batteries 08 08 08
i. Generator (petrol/diesel) 09 09 09 09
j. Other (specify) 10 10 10 10
k. (Don’t know) 98 98 98 98
l. (Not applicable – no appliance) 99 99 99 99

118
12. What sources of energy are used in this household to heat water for bathing purposes?13. What sources of energy are used in this household to heat water for other purposes?
12.Heating water for
bathing
13.Heating water for
other purposes
INTERVIEWER: MULTIPLE RESPONSE
INTERVIEWER: MULTIPLE RESPONSE
a. Paraffin 01 01
b. Gas 02 02
c. Coal 03 03
d. Firewood 04 04
e. Solar geyser 05 05
f. Electricity – electric geyser 06 06
g. Electricity – electric kettle 07 07
h. Electricity – electric stove / hotplate 08 08
i. Generator (petrol/diesel) 09 09
j. Other (specify) 10 10
k. (Don’t know) 98 98
l. (Not applicable – water is never heated in the household) 99 99
14. How much did your household spend on energy in the last month? This would include expenses on all energy sources (electricity and other fuels)
INTERVIEWER: PLEASE TRY YOUR BEST TO AT LEAST GET A ROUGH ESTIMATE
OF THE HOUSEHOLD’S EXPENDITURE ON ENERGY.
Amount (In Rands)
R
15. On average, how much does your household spend each month on the following energy sources?
INTERVIEWER: THE AMOUNTS GIVEN IN Q.14 - 26 SHOULD ADD UP TO THE
TOTAL PROVIDED IN Q.15. PLEASE REPORT AMOUNTS TO THE NEAREST RAND –
DO NOT INCLUDE CENTS.
Energy cost (Rands)
16. Paraffin R
17. Gas R
18. Candle R
19. Coal R
20. Firewood R
21. Solar system R
22. Electricity R
23. Batteries R
24. Car batteries R
25. Generator (petrol/diesel) R
26. Other (specify) R

119
27. Is the amount of energy your household has less than adequate, just adequate or more than adequate for your household’s needs?
It is not adequate for your household’s needs 1
It is just adequate for your household’s needs 2 • Skip to Q.29
It is more than adequate for your household’s needs 3 • Skip to Q.29
(Do not know) 8 • Skip to Q.29
28. What is the main reason why you feel that the amount of energy is inadequate to meet your household’s needs?
Not enough money to pay for the energy we need 1
There are many electricity power cuts in my area 2
The supply of electricity to my household is limited 3
Firewood is very scarce 4
Gas or paraffin not always available in the shops 5
Other (specify) 8
(Uncertain/Don’t know) 9
And are the following inadequate, just adequate or more than adequate for your household’s needs?
It is not adequate for your
household’s needs
It is just adequate for your
household’s needs
It is more than adequate
for your household’s
needs
(Do not
know)
29. The amount of energy for lighting 1 2 3 8
30. The amount of energy for cooking 1 2 3 8
31. The amount of energy for heating rooms and keeping warm
1 2 3 8
32. In the last 12 months, how often has your household cut back on spending on energy for lighting, cooking or heating in order to make ends meet?
Very often 1
Often 2
Occasionally 3
Rarely 4
Never 5
(Do not know) 8
INTERVIEWER: SKIP TO QUESTION 41 IF HOUSEHOLD IS
NOT ELECTRIFIED (CODE 8 IN Q5)
33. How satisfied or dissatisfied are you with the way that electricity is being providing in your neighbourhood? [Showcard 2]
Very satisfied 1
Satisfied 2
Neither nor 3
Dissatisfied 4
Very dissatisfied 5
(Do not know) 8

120
34. In your opinion, what is the quality of electricity in the area where you live?
Very high quality 1
Good quality 2
Acceptable quality 3
Poor quality 4
Very poor quality 5
(Do not know) 8
35. In your opinion, is the price you pay each month for electricity too high, too low, or about right for what you receive?
Far too high 1
Too high 2
About right 3
Too low 4
(Do not know) 8
36. What did your household do as a result of the increase in electricity prices in the last 12 months?
Continued to use the same level of electricity and paid the extra amount for it 1
Reduced the amount of electricity used 2
Used other energy sources, such as paraffin, gas, coal, wood and candles 3
Other (specify) 4
(Do not know) 8
37. If electricity prices were increased again tomorrow, which one of the following actions would your household do in order to meet its basic energy needs?
Continue using the same level of electricity and pay the extra amount for it 1
Reduce the amount of electricity we use 2
Use other energy sources, such as paraffin, gas, coal wood and candles 3
Other (specify) 4
(Do not know) 8
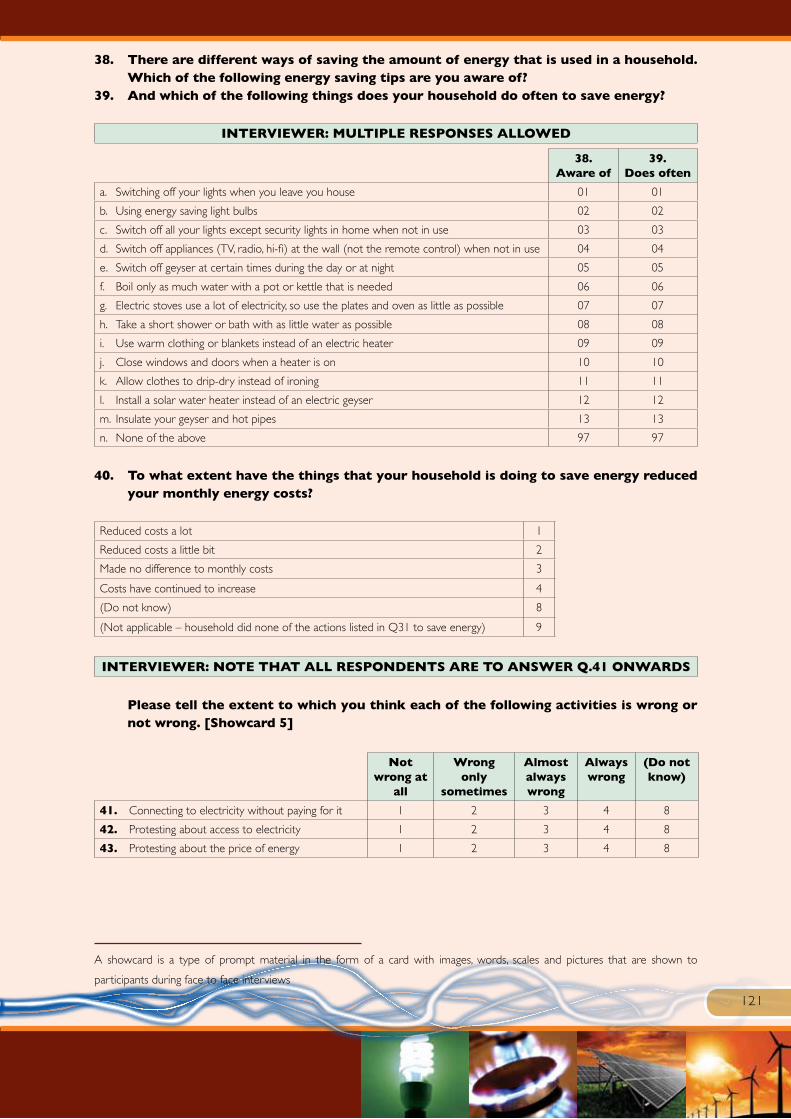
121
38. There are different ways of saving the amount of energy that is used in a household. Which of the following energy saving tips are you aware of?
39. And which of the following things does your household do often to save energy?
INTERVIEWER: MULTIPLE RESPONSES ALLOWED
38. Aware of
39. Does often
a. Switching off your lights when you leave you house 01 01
b. Using energy saving light bulbs 02 02
c. Switch off all your lights except security lights in home when not in use 03 03
d. Switch off appliances (TV, radio, hi-fi) at the wall (not the remote control) when not in use 04 04
e. Switch off geyser at certain times during the day or at night 05 05
f. Boil only as much water with a pot or kettle that is needed 06 06
g. Electric stoves use a lot of electricity, so use the plates and oven as little as possible 07 07
h. Take a short shower or bath with as little water as possible 08 08
i. Use warm clothing or blankets instead of an electric heater 09 09
j. Close windows and doors when a heater is on 10 10
k. Allow clothes to drip-dry instead of ironing 11 11
l. Install a solar water heater instead of an electric geyser 12 12
m. Insulate your geyser and hot pipes 13 13
n. None of the above 97 97
40. To what extent have the things that your household is doing to save energy reduced your monthly energy costs?
Reduced costs a lot 1
Reduced costs a little bit 2
Made no difference to monthly costs 3
Costs have continued to increase 4
(Do not know) 8
(Not applicable – household did none of the actions listed in Q31 to save energy) 9
INTERVIEWER: NOTE THAT ALL RESPONDENTS ARE TO ANSWER Q.41 ONWARDS
Please tell the extent to which you think each of the following activities is wrong or not wrong. [Showcard 5]
Not wrong at
all
Wrong only
sometimes
Almost always wrong
Always wrong
(Do not know)
41. Connecting to electricity without paying for it 1 2 3 4 8
42. Protesting about access to electricity 1 2 3 4 8
43. Protesting about the price of energy 1 2 3 4 8
A showcard is a type of prompt material in the form of a card with images, words, scales and pictures that are shown to
participants during face to face interviews

122
44. What do you think should be the THREE top priorities for the Department of Energy in providing electricity?
INTERVIEWER: MULTIPLE RESPONSES ALLOWED. CIRCLE A MAXIMUM OF 3 OPTIONS
Avoid load-shedding or power cuts 1
Keep electricity prices low 2
Help poor households by giving more free electricity 3
Get non-electrified households electrified 4
Give information on how to save electricity 5
Subsidise renewable energy 6
Other (specify) 7
(Do not know) 8
45. Which of the following should be South Africa main priority in order to meet its future energy needs?
Coal and oil 1
Natural gas 2
Nuclear power 3
Solar, wind or water 4
Fuels made from crops (i.e. mielies, corn) 5
Does not matter, as long as it is the cheapest option 6
Does not matter, as long as it does not damage the environment 7
(Do not know) 8
There are various ways governments might try to get people to use less energy. To what extent would you be in favour or against the following options? The South African government should . . . . . [Showcard 21]
The South African government should....
Strongly in
favour
In favour
of
Neither in favour
nor against
AgainstStrongly against
(Do not
know)
46. ...spend money on campaigns to encourage people to use less energy
1 2 3 4 5 8
47. ...spend money to replace electric geysers with solar geysers
1 2 3 4 5 8
48. ...give all households an amount of free energy each month
1 2 3 4 5 8
49. ...make the price of electricity higher for rich households than for poor households
1 2 3 4 5 8
50. To what extent would you agree or disagree that households that use a lot of electricity should be charged a higher price for electricity than those that use less? [Showcard 1]
Strongly agree 1
Agree 2
Neither agree nor disagree 3
Disagree 4
Strongly disagree 5
(Do not know) 8

123
HOUSEHOLD CHARACTERISTICS
51. Indicate the type of main dwelling that the household occupies?
Dwelling/House or brick structure on a separate stand or yard or on farm 01
Traditional dwelling/ Hut/ Structure made of traditional materials 02
Flat or apartment in a block of flats 03
Town/cluster/semi-detached house (simplex, duplex or triplex) 04
Unit in retirement village 05
Dwelling/House/Flat/room in backyard 06
Informal dwelling/Shack in backyard 07
Informal dwelling/Shack not in backyard, e.g. in an informal/squatter settlement or on farm 08
Room/Flatlet 09
Caravan/Tent 10
Other, specify 11
52. How satisfied are you with your accommodation? [Showcard 2]
Very satisfied 1
Fairly satisfied 2
Neither satisfied nor dissatisfied 3
Slightly dissatisfied 4
Very dissatisfied 5
(Do not know) 8
53. Would you describe the state of repair of your home as good, adequate or poor?
Good 1
Adequate 2
Poor 3
(Do not know) 8
54. Do you have any of the following problems with your accommodation?
INTERVIEWER: MULTIPLE RESPONSES ALLOWED.
Shortage of space 1
Too dark, not enough light 2
Lack of adequate heating 3
Leaky roof 4
Damp walls, floors, foundations, etc. 5
Damaged or broken windows or doors 6
Other (specify) 7
None of these problems with accommodation 8
55. Has your health or the health of anyone in your household been made worse by your housing situation?
Yes 1
No 2

124
Notes

125
Notes

126
Regional Office
Northern CapeThe Director: Northern CapePrivate Bag X 6093, Kimberley, 830065- Phakamile Mabija Street, Perm Building,3rd floor, Kimberley
Tel: 053 807 1752 / 1721 / 1765Fax: 086 562 7065
LimpopoDepartment of EnergyPrivate Bag X 9712, Polokwane, 0700
101 Dorp street, PolokwaneTel: 015 287 4727Fax 086 628 0069
MpumalangaDepartment of EnergyPrivate Bag X17851, Witbank, 1035Cnr Botha and Kruger StreetProvince HouseWitbank
Tel: (013) 653-0500 / 656 1448Fax: 013 656 3288
Western CapeDepartment of EnergyPrivate Bag X 31, Roggebaai, 801234 The Terraces Building C/oRiebeeck & Bree StreetCape Town CBD, 8001
Tel: 021 418 3724
Free StateThe Director: Free StatePrivate Bag X 3658, Welkom 9460
The Strip Building314 Stateway StreetCnr Stateway and Bok StreetsWelkom
Tel: 057 391 1326 / 1300Fax: 057 352 2673
Kwa Zulu NatalDepartment of EnergyPrivate Bag X 54307, Durban,4000
333 Anton Lembede Street3rd FloorDurban Bay HouseDurban
Tel: 031 335 9647Fax: 086 610 6380
Eastern CapeThe Director: Eastern CapePrivate Bag X 6013, Port Elizabeth, 6000Eastern Cape Mount Croix690 Crispin hallCorner of Mount and Diaz Road Port Elizabeth
Tel: 041 396 3910Fax: 086 517 2574
North WestPrivate Bag X A1, Klerksdrop, 2570Vaal University of Technology BuildingCnr Voortrekker & MargaretaPrinsloo Street, Klerksdorp
Tel: 018 487 9857Fax: 018 464 2460
GautengPrivate Bag X 96, Pretoria, 0001192 Visagie Street, Corner Paul Kruger & Visagie StreetPretoria, 0002
Tel: 012 406 8000 (Switchboard)Tel: 012 406 7788 (Petroleum Licensing Helpdesk)

Department of Energy192 Visagie StreetCorner Paul Kruger & Visagie StreetPretoria0002
Private Bag X96, Pretoria, 0001
www.energy.gov.za
Pretoria: 012 406 8000 (Switchboard)Cape Town: 021 427 1017
ISBN: 978-1920435-05-92nd edition
Design, Layout & Printing: Seriti PrintingPhotography, Jarè Struwig & Machwene Molomo