a survey on big data research in fighting covid-19
TRANSCRIPT

A Survey on Big Data Research in Fighting COVID-19: Contributions and TechniquesDianadewi Riswantini ( [email protected] )
Indonesian Institute of Sciences: Lembaga Ilmu Pengetahuan Indonesia https://orcid.org/0000-0001-9968-5924Ekasari Nugraheni
Indonesian Institute of Sciences: Lembaga Ilmu Pengetahuan IndonesiaDevi Munandar
Indonesian Institute of Sciences: Lembaga Ilmu Pengetahuan IndonesiaAndria Arisal
Indonesian Institute of Sciences: Lembaga Ilmu Pengetahuan IndonesiaWiwin Suwarningsih
Indonesian Institute of Sciences: Lembaga Ilmu Pengetahuan Indonesia
Survey paper
Keywords: Big Data, COVID-19, Research contribution area, Analytical techniques, Data source
Posted Date: June 8th, 2021
DOI: https://doi.org/10.21203/rs.3.rs-504124/v1
License: This work is licensed under a Creative Commons Attribution 4.0 International License. Read Full License

Riswantini et al.
SURVEY PAPER
A Survey on Big Data Research in FightingCOVID-19: Contributions and TechniquesDianadewi Riswantini*, Ekasari Nugraheni, Devi Munandar, Andria Arisal and Wiwin Suwarningsih
*Correspondence: di-
Research Center for Informatics,
Indonesian Institute of Sciences,
Bandung, Indonesia
Full list of author information is
available at the end of the article
Abstract
COVID-19 has induced many problems in various sectors of life for humanity
around the world. After one year of pandemic, many studies have been carried
out in exposing various technology innovations and applications to combat the
coronavirus that has killed more people than most. The pandemic has accelerated
the use of Big Data technology to mitigate the threats of COVID-19. This survey
aims to explore the Big Data research for COVID-19. We collected and analyzed
the relevant academic articles to identify how Big Data technology can cover the
challenges faced in overcoming the pandemic. In determining the research areas
addressed by the past studies, we highlight the technology contributions to five
major areas of healthcare, social life, government policy, business and
management, and the environment. We discuss how analytical techniques of
machine learning, deep learning, statistics, and mathematics can solve pandemic
issues. The Big Data research for COVID-19 used a wide variety of data sources
available publicly or privately. At the end of the discussion, we present the data
source used in the past studies encompassing government official data,
institutional service data, IoT generated data, online media data, and open data.
We hope that this survey will clarify the role of Big Data technology in enhancing
the research for COVID-19.
Keywords: Big Data; COVID-19; Research contribution area; Analytical
techniques; Data source
Introduction
Today the world is facing very formidable challenges. In the world history of the
last century, the Coronavirus disease 2019 (COVID-19) pandemic is a health threat
and the world’s most severe humanitarian catastrophe, in addition to the Second
World War. The COVID-19 outbreak is an acute respiratory syndrome and was de-
clared a pandemic on 11 March 2020 by the World Health Organization (WHO)[1].
The outbreak first appeared in Wuhan in December 2019 and continues to spread
rapidly throughout mainland China and world wide, causing global panic and sig-
nificant losses to people’s lives and economies. The virus is transmitted through
direct person-to-person contact and has caused many deaths. Based on COVID-19
dashboard data [2] as of 28 March 2021, it is confirmed that more than 126 mil-
lion cases of COVID-19 have spread to 192 countries, with 2,777,684 deaths and
71,789,826 recoveries worldwide.
More than a year this pandemic has hit globally. Many countries have issued var-
ious policies to control the spread of the pandemic, such as working from home,
learning from home, lockdown, travel restrictions, limiting the number of people in

Riswantini et al. Page 2 of 28
public places, and others [3, 4, 5, 6, 7, 8, 9, 10]. This pandemic created a new norm
in society to always wear masks, wash hands frequently, maintain physical distance.
This condition certainly affects almost all aspects of life, especially healthcare, so-
cial, environmental, economic, and business areas. Organizations and businesses are
accelerating digital transformation programs during the pandemic [11]. Shopping
online and cashless transaction to avoid physical contact has now become a neces-
sity. The daily activities of meetings, lectures, graduations, seminars, or conferences
must be held online to prevent spreading the virus due to crowds of people [12, 13].
Pandemic has affected the environment. Air pollution is reduced during the pan-
demic. The lockdown and work from home policies make many people prefer to stay
at home, which impacts reducing traffic on the roads and improving air quality in
urban areas [9]. Besides, people like to ride bicycles over public transportation to
avoid close contact among passengers on the local trip [14].
The war against COVID-19 is not only carried out by paramedics and volunteers
at the forefront, but also researchers take part by following their expertise areas
to help find solutions to win against COVID-19. This pandemic provides many
opportunities for researchers to offer technology-based solutions. Digital technol-
ogy and big data play an essential role in adapting a new normal life by reducing
the risk of spreading through teleworking, online learning, online shopping, webi-
nars, telemedicine, and others [15, 16, 17, 18]. More than one year of research on
Big Data for COVID-19 has shown that this technology has contributed to case
tracking, epidemic surveillance, virus spread monitoring, precautionary measures,
medical treatment, and drug developments [19, 20]. Advanced technology and archi-
tectures have encouraged big data to solve various life problems and are currently
unavoidably utilized to cope with the pandemic. Past studies have been conducted
to control the spread of the virus through surveillance and contact tracing. Big
data offers a solution to analyze human mobility and their contact data to iden-
tify confirmed cases and locations that the coronavirus may contaminate. Big data
analysis on social media related to COVID-19 contributes to solving social life prob-
lems in gaining opinion, concern, and public response to the policies implemented
[21, 22, 23]. Moreover, big data applications have benefited the quality of care by
accelerating disease detection and providing better health care services to patients
[24].
Many studies have been carried out since the discovery of the first case of the
Coronavirus in Wuhan. This study aims to explore what research has been done
regarding the pandemic and its impact, which utilized big data technology. The
next part of this article contains several sections, starting with a methodology dis-
cussed literature review process and literature analysis. The review on Big Data
research related to COVID-19 will be described in three concerns. The first review
concern is the research contribution areas targeted by the studies. Based on the
reviewed articles, we cluster the past studies into five areas: healthcare, social life,
government policy, business and management, and the environment described in
the ”Research Contribution Area” section. The literature review undertaken em-
phasizes the technology offered by big data coping with the pandemic described
in the ”Analytical Techniques” section. In general, we found several methods and
techniques used in big data research related to COVID-19. The section explains the

Riswantini et al. Page 3 of 28
methods and techniques along with the application built and the analysis carried
out. The final concern of review from this study is the types of data sources and
datasets used to support the application and analysis of big data related to COVID-
19, described in the ”Data Source” section. The conclusions of all reviews will be
provided at the end of this article.
Methodology
Literature Review Process
A literature review aims to synthesize the previous research. The study collected
and analyzed the relevant academic articles to identify how Big data technology
can be applied to cover the challenges faced in overcoming the pandemic. The
study intended to understand the current state of research facing the COVID-19
pandemic. As a unit of analysis, we selected academic articles from the Scopus cita-
tion database with the searching key terms ”Big Data” and ”COVID-19” published
from December 2019 until January 2021. The searching process applied the key-
words throughout the title, abstract, and authors’ keywords. In this study, Scopus
was chosen because it has been identified that this citation database has a broader
range of academic articles and most extensive in the engineering and management
field [25, 26, 27]. The selection process resulted in 446 articles that matched the
searching key terms distributed in several areas, primarily computer science and
medicine. Further, we selected articles with inclusion criteria of journal, and pro-
ceeding articles in English language resulting in 258 articles. Among these studies,
223 articles were published in 2020, 35 articles were published in January 2021, while
only one article was published in 2019. The systematic literature review process is
shown in Figure 1.
The qualitative analysis applied to the second criteria by reading the full paper
form. In this stage, we excluded the articles that are not firmly related to the con-
text and research questions and the articles that cannot be accessed in the form
of a full paper. During this stage, 110 articles were filtered for final review. These
articles were analyzed and distinguished into research articles and review articles.
Articles discussing empirical studies that applied Big Data analytics using various
techniques were grouped into research articles. We identified 92 articles as research
articles, and the rest are review articles. The distribution of the articles selected
for systematic review across journals is presented in Figure 2. Selected articles en-
compassed different multi-discipline areas of studies determined by Scopus, includ-
ing computer science, medicine, engineering, social sciences, environmental science,
business management and accounting, material science, and energy.
Literature Analysis
After selecting the articles, we conducted a preliminary analysis to overview the
themes concerned. Word Cloud is a valuable tool for document analysis by display-
ing text data visually and in an easy-to-understand manner. Word cloud allows us
to understand the frequency of words in a document and compare the occurrence
among words [28]. A word cloud approach was adopted to get the dominant topics
of the articles reviewed. We applied world cloud techniques on the dataset contain-
ing all abstracts of all reviewed articles. Figure 2 illustrates the result of using a

Riswantini et al. Page 4 of 28
Figure 1 Selection process of the literature review.
word cloud to the dataset in which the words were stemmed beforehand. Avoid-
ing the key term ”Big Data” and ”COVID-19”, the figure shows that the words:
health, pandemic, disease, technology, model, and analysis are dominant. For the
preliminary examination, we get insight that the previous research on Big Data
for COVID-19 explores more about healthcare technology. China, the country that
reported the first case of COVID-19 globally, is the most-mentioned country in the
articles. Social issues related to pandemics are also widely discussed, in addition to
health issues.
Further, we analyzed the relationship and the co-occurrence among keywords.
Semantic network analysis was applied to the keywords dataset for this purpose.
Figure 3 presents the investigation results of applying semantic network analysis
on the keywords dataset. It reveals that artificial intelligence, machine learning,
and deep learning are the most used Big Data analytics methods mentioned in the
keywords. Surveillance, infoveillance, and infodemics are key terms that appear with
high dominance. The terms describe continuous activities comprising of systematic
data collection, data analysis, and data interpretation towards an event related to
health. These activities engage with public health measures in reducing morbidity
and mortality and health improvement.

Riswantini et al. Page 5 of 28
Figure 2 Distribution of the selected articles across journals and research types.
Research Contribution Area
The articles were reviewed based on the objectives achieved. We classified the ar-
ticles into health care, social life, business and management, government policy,
and the environment. Out of the 92 research articles reviewed, some covered more
than one area. The health care area includes 37 articles, 30 articles on social life,
20 articles on business and management, 12 articles on government policies, and 9
articles on the environment. Descriptions of contribution area and the number of
related articles are presented in Table 1.
Healthcare
The COVID-19 pandemic has caused many deaths and spread so fast. This virus
spreads from person to person, and in a few months, the virus has been extended
to various countries in the world with severe losses. Research and development have

Riswantini et al. Page 6 of 28
Figure 3 Word cloud of the abstracts of the selected articles.
Table 1 Description of the contribution area and the number of related articles
Contribution Area DescriptionHealth care (37 articles) Covering medical science, medicine and pharmacology,
epidemiology and health care services.Social life (30 articles) Covering behavioral sciences, psychology, and social
changeBusiness and management(20 articles)
Covering hospitality and tourism, transportation, and fi-nance.
Government policy (12 arti-cles)
Covering policy and strategy, monitoring, and controlling.
Environment (9 articles) Discussing how big data research assists the environmen-tal sector, including the influence of the global climateon the spread of Covid-19, the impact of the pandemicon the environment (air quality and river pollution).
leveraged the advances in data science and big data technology for tracking and
obtaining a fast and accurate understanding of pandemic spread trends to take
more precise prevention and control measures.
Various studies related to virus transmission and its influence factors have been
carried out to predict (a) the spread of the virus [29, 30, 31, 32, 33]; (b) the person
suspected of being infected [34]; (c) new infection areas [35]; (d) the likelihood of the
second and third waves of the epidemic [36]; (e) COVID-19 contamination scenario
based on people movement [37]; and (f) the increased number of cases [38]. COVID-
19 task-force stakeholders can use these epidemiological predictions to prepare the
necessary measures and policies.
Pandemic control is essential to prevent the spread of this outbreak from getting
worse more widely. The literature suggests some official data sources issued by the
government or agencies to be used to capture the evolutionary trajectory of COVID-
19 [39], analyze infodemiology data for surveillance [40], formulate case patterns [41],
and arranging appropriate quarantines activities [42]. Apart from official COVID-19
data, health insurance data can also be used to analyze the risk of being exposed

Riswantini et al. Page 7 of 28
Figure 4 Keywords relationship of the selected articles.
to COVID-19. For example, by tracking those hospitalized for pneumonia and not
reporting to health authorities based on insurance claims data [43].
Monitoring in public facilities prone to the transmission of disease through person-
to-person contact must also be considered. Disease transmission in multi-modal
transportation networks can be estimated using traffic flow data and cases of
COVID-19 incidence [7]. Therefore the density of transport passengers must be
monitored and controlled [44].
Artificial intelligence and big data technologies are supporting medical science in
fighting the pandemic. Previous studies attempted to improve the speed and accu-
racy of the medical diagnostics and find the best treatment methods for COVID-19
disease [45]. A diagnostic tool was developed for the early detection of COVID-19
pneumonia infection based on radiological images (pneumonic and non-pneumonic
x-rays) [46]. Optical Char- acter Recognition (OCR) technology supported by deep
learning can extract image data into text data to classify and itemize medical im-
ages [47]. A combination of some clinical variables can predict whether COVID-19
patients require ICU admission [48]. Research to find effective treatments without
harmful side effects is still ongoing in pharmacology and medicine. An analysis of
chloroquine derivatives proved that these derivative medicines effectively improve

Riswantini et al. Page 8 of 28
clinical outcomes and reduce mortality for COVID-19 patients [49]. Furthermore,
data from the Korea National Health Insurance Service show that patients who
claim antihypertensive medicine tend to have a lower risk of exposure to COVID-19
[50].
Smart medical technology can be applied to develop IoT applications in the health
area. An application that utilizes mobile devices was designed to access information
on people’s health conditions dynamically. This application supports health care
professionals to monitor public health remotely. Clinical symptoms of COVID-19
infected people can be detected by smart wearable gadgets [6, 51]. A smartwatch
can monitor the movement of COVID-19 patients [52], and their health parameters
(such as heart rate, blood pressure, blood oxygen), providing COVID-19 signals to
paramedics sent through mobile applications [37]. Past studies showed that many
infected people are asymptomatic. The technology detects the extent of this viral
infection of asymptomatic people [53].
Social Life
The corona pandemic has affected the economic sector and caused many social prob-
lems [54, 55]. Public opinion and concerns towards pandemics are interesting to be
investigated in this health emergency condition. A massive amount of data available
on social media can be used to study this issue [56, 57, 58, 59, 60, 23, 61, 62]. Big
data analytics can reveal the public reaction to some government policies and rec-
ommendations about the lockdown policy, work from home, and social distancing
guidelines [8, 3, 63]. User-generated content (UGC) in social media can be extracted
to detect critical events and public response to government measures in tackling the
pandemic [22]. Social media conversation can also be utilized to expose COVID-19-
related symptoms and experiences on disease recovery [64].
Moreover, the adherence to home confinement during the pandemic to maintain
physical distancing and avoid crowds can be monitored through an activity tracker
device analyzing the effect of physical interaction limitation policy on people’s ac-
tivity [10]. The adherence to health protocol can be inspected from the video data
obtained from the camera device [65, 66]. Analysis of people’s geolocation can scru-
tinize the human mobility changes, and contact tracking [67, 68, 5, 69].
COVID-19 has increased the anxiety of many people and can cause mental health
problems. Studies on COVID-19 discussed social psychology, examining people’s
behavior in social situations and their capability to adapt to certain conditions’
social environments [14]. Research topics in social psychology covered in the past
studies include the relationship between trust and the presence of infectious disease
[70]; psychological needs and their satisfaction level during the pandemic [71]; the
effect of fear and collectivism on the public prevention against COVID-19 [72];
peoples’ preferences to protect the environment they live in [73]. Some of the harmful
effects of the pandemic have been studied, including family violence [21], increasing
racial sentiment toward Asian people [23], the emergence of incivility and fake news
on social media [74, 29], and emotional tendency and emotional symptoms of mental
disorder facing the outbreak [75, 76].

Riswantini et al. Page 9 of 28
Government Policy
COVID-19 attacks almost all sectors of life and is a burden on the government.
Various policies and scenarios must be implemented to control the COVID-19 in-
creasing case rate overcoming this outbreak. Big data analytics can be useful for the
government in making decisions and policies. Some of the government’s policies to
limit community activities are working from home [3], lockdown, and confinement
at home. The decision to lock people at home is necessary to disinfect areas with
high contamination levels [34]. The lockdown policy during a pandemic has made
people more restrict themselves for treatment or continuing their routine treatment.
This is indicated by a drastic decrease in total health care expenditures based on
bank transaction data [77].
COVID-19 attacks almost all sectors of life and is a burden on the government.
Various policies and scenarios must be implemented to control the COVID-19 in-
creasing case rate overcoming this outbreak. Big data analytics can be useful for the
government in making decisions and policies. Some of the government’s policies to
limit community activities are working from home [3], lockdown, and confinement
at home. The decision to lock in people at home is necessary to disinfect areas with
high contamination levels [34]. The lockdown policy during a pandemic has made
people more restricting themselves for their health treatment or continuing their
routine treatment. The previous research has shown that the total health expendi-
tures decrease indicated by the reduction of the bank transaction related to health
services [77].
Scenario policies can differ in each region depending on the COVID-19 conditions
and environmental and climatic factors [78]. Population-based strategies based on
ecological predictors can be used to reduce the risk of spread [79]. And in the tourism
sector, the government has initiated an intelligent contact tracking system to limit
tourist visits to avoid contact from potentially infected tourists [43, 80]. Moreover,
that rational decision-making needs to be done to find new tourism potentials [81]
and improve conditions of hotel industry [82].
The implementation of public policies still has to be analyzed to see how the poli-
cies affect the spread of disease [4]. The government’s key actions were evaluated
to make the next policy-making becomes more appropriate[83]. Government directs
the regulations and policies to monitor and control the number of infections. Op-
timization of monitoring techniques in infection areas is necessary to support the
goal [84].
Business and Management
The business sector has faced many obstacles during the pandemic. It is identified
that many factors influence strongly on the survivability of the business. Chaves
et. al [85] develop a prediction model to measure the probability of entrepreneurial
survival and business success based on environmental variables and public support
programs by applying artificial neural networks. Entrepreneurs must be agile to
anticipate the changes in customer behavior. Pandemic has shifted the customers’
behavior and buying pattern in this uncertain business environment [74]. Zhang Y
et al. [77] developed a model for figuring out healthcare products and utilization to
get insight into customers’ shifting of healthcare needs.

Riswantini et al. Page 10 of 28
Entrepreneurs had to adjust the strategy and practices to survive and stay com-
petitive. Digital transformation is one solution and has been accelerated during
the pandemic. Both parties of customers and entrepreneurs moved to benefit online
channel. Online platforms that facilitate the providers and customers have enhanced
intelligent services like a product recommendation to improve online customer expe-
rience [86, 87]. Continuous observation of product or service quality regarding user
engagement is essential to keep business going in this hard situation [88, 89, 90].
Increasing health product needs has led to fraud in supplying products. Health
product providers need to protect their customers from illicit products by applying
intelligent fraud detection[91].
The outbreak has not only impacted all businesses but has also weakened the
pace of investment. Investment portfolio is volatile due to the effect of panic in-
vestors [92]. Some investors hold their stake, and some others take advantage of
this situation. Sentiment analysis and time series regression are applied to predict
the future condition of the stock market [93]. Zhang B. et.al [94] investigated the
effect of investors’ attention to stock market movements.
The tourism and hospitality sector Pandemic have been impacted significantly
by the outbreak. Big Data analytics can reveal the impact of the pandemic on
this market from various tourism data. Getting valuable insight from data-driven
analysis, entrepreneurs and Government can make rational decisions to formulate
the right tourism strategy and policy [95, 82]. Tourism behaviors have changed in
response to the new Government tourism policy [96]. Rejuvenation of the tourism
area needs to be done by exploring the potential of the existing tourism for COVID-
19-appliance tourism development [81]. Aside from tourism behavior, passenger, and
traffic behaviors have also changed [97]. The changes are essential to be scrutinized
to control the contamination risk at the airport and on the plane as well [44, 7].
Environment
People have changed their lives during the pandemic.. Their activities must adapt
to the situation to inhibit the coronavirus’s spread. Apart from impacting people’s
way of life, the pandemic also has an impact on the environment. Previous research
has explored to what extent the pandemic changes the earth’s condition. Lin et al.
[98], and Ibrahim et al. [99] figured out the meteorological factors that influence
coronavirus transmission. Environmental predictors that influence the COVID-19
can be determined by surveillance of the infected area’s street view image [79]. Spa-
tiotemporal data can reveal the distribution pattern of PM2.5 air pollution during
the pandemic [100]. Using Big Data, the exposure of PM2.5 and its evolution can
be identified and further used to assess the potential health risk [101]. Besides air
pollution, researchers have paid attention to water pollution. Yan [102] proposed a
reference model to prevent and control river pollution by applying microbial treat-
ment technology. The technology can be utilized to reduce river pollutants after the
outbreak.
More about the environment during the pandemic, lockdown policy, and mobility
restrictions have reduced road traffic globally. The reduction implies decreasing
world gas emissions. Research on Big Data has quantified the impact of this traffic
reduction on air quality based on meteorological and road mobility observations

Riswantini et al. Page 11 of 28
[9]. The data of road traffic reduction can be used to predict energy consumption
during the pandemic [103]. The outbreak has changed people’s behavior to choose
healthier transportation. Shang et al. [14] exposed that the use of bikes increases
environmental benefits regarding emission reduction and energy conservation.
Figure 5 Knowledge mapping of the methods and application of the COVID-19 research
Analytical Techniques
This research emphasizes exploring the advancing Big Data technology solutions
conducted by previous research in fighting the COVID-19 pandemic. This section
highlights computational methods that can facilitate Government and other social
organizations in figuring out the current state of the COVID-19, forecasting the
spread, and predicting the socio-economic impact on people and society. All the re-
search is intended to respond to the coronavirus threats and reduce the pandemic’s
risks. Available methods adopted from previous experiences are exposed to cover
many aspects to recover the condition. Our survey identified that various machine
learning algorithms are the most used method in COVID-19 research in addition
to statistics and mathematics. Deep learning, a branch of machine learning (ML)
that uses deep neural networks to solve problems, is also a sophisticated solution
to tackle more significant problems with greater ease and efficiency due to its ad-
vanced feature engineering. Figure 5 presents the methods used in the past studies
concerning applications underpinned.
Machine learning is an artificial intelligence (AI) approach with the ability to
learn and improve automatically from the experiences in processing data. Machine
learning accesses data and uses it for self-learning in building a computational
model. Machine learning methods can be distinguished into supervised learning,
unsupervised learning, and reinforcement learning. A supervised learning approach
is a learning method that uses the information to get the proper insight from a set
of data by learning the mapping between outputs and related inputs. This method
retains the input/output and process to build a mathematical relationship model

Riswantini et al. Page 12 of 28
that can make predictions or classification based on an existing dataset, called
training data. Besides, the unsupervised learning approach does not use training
data to find any observable dataset pattern. Based on the mathematical model,
this algorithm does not have any target variable. One of this algorithm’s goals is
to group objects in the same area based on their proximity. Unlike the two-stated
learning approach, reinforcement learning is intended to enable computers to learn
on their way from the environment through an agent. This agent, a single authority,
can understand the behavioral changes of the domain. Thus, the system will do
self-discovery by interacting with the environment and responding to the changes
[104]. Exploring the methods and techniques of the COVID-19 research, the study
identified that the past research generally exposed the data mining approaches
of regression, classification, clustering, association, and social network analytics.
Statistical analysis is also used widely, and we discern them in the discussion into
the descriptive and inferential analysis. Special issue of SEIR (Susceptible, Exposed,
Infected, and Recovered) mathematical model of disease spread will be discussed in
the next paragraph, followed by IoT and other Big Data applications.
Classification
Classification is a supervised learning approach that produces a model for deter-
mining an individual belongs to a particular class. For this purpose, many cat-
egories or classes are defined in the early stages of model building. The classes
are usually mutually exclusive. Regarding COVID-19 research, deep learning us-
ing techniques of RNN (Recurrent Neural Network) and LSTM (Long Short Term
Memory) are used to classify the Pulmonary Function Test (PFT) image data. Op-
tical Character Recognition technology was applied to extract text data from PFT
data for classification purposes [47]. To determine suspected cases and areas, cell-
phone Spatio-temporal data can be processed using a decision tree algorithm for
classification [35, 32]. An application of artificial intelligence was developed to de-
termine the diagnosis and treatment of the COVID-19 disease for high-risk groups.
The application adopted several algorithms, including Extreme Learning Machine
(ELM), Generative Adversarial Networks (GANs), deep learning techniques RNN
and LSTM using clinical data and medical images [45].
Sun et al. [76] developed a psychological computing model to identify the contin-
uous emotional symptoms of mental disorders caused by the epidemic. This mental
health recognition application performs visual analysis and considers speech and fa-
cial expression images as multimodal data. The application explores a relationship
between short-term basic emotions and long-term complex emotions. This emotion-
sensing model used Bi-directional LSTM and Three-Dimensional CNN in building
the model. Further, people’s psychological needs during the pandemic in a particular
area can be observed from user-generated content posted on Twitter. Long et al. [71]
applied Natural Language Processing (NLP) and Support Vector Machine (SVM)
algorithm to research this subject. A similar technique was utilized to investigate
the shifts in anti-Asian racial sentiment regarding the emergence of COVID-19 [23].
Mackey et al.[64] conducted infoveillance research on Twitter and Instagram to ex-
pose counterfeit COVID-19 health products and characterize in terms of product
types, selling claims, and sellers types by combining Fine-tuned-pre trained LSTM
and Bi-Term Topic Modeling.

Riswantini et al. Page 13 of 28
A computer vision application that detects objects and distances among things
was developed using the Kubeflow machine learning platform and OpenCV library
to analyze crowd conditions from the video streaming data [65]. Still, in attempt-
ing to monitor and enforce the health protocol adherence, an application of face
recognition was developed by adopting CNN (Convolution Neural Network) deep
learning to determine if someone is wearing the mask or not [66].
A classification learning technique of MLP (Multi-Layer Perceptron) could be
applied to predict the resilience of entrepreneurs facing the pandemic. Five clusters
of entrepreneurs were categorized into three classes: success, survive and fail. The
study used SOM (Self-Organizing Map) for the clustering [85]. CNN was also applied
to determine the industry category based on the economic indicators using a single
and hybrid database [95]. Sentiment analysis complemented with regression was
used in several studies to predict the stock market movements during the pandemic
[105, 93].
Clustering and Topic Modeling
As an unsupervised learning approach, clustering group entities in a population-
based on their similarity. K-means algorithms integrated with correlation techniques
can be employed to cluster the countries based on their stages in facing COVID-19
and then examine the relationship between their public policy and the spread of
diseases [4]. Hussien et al. [35] used K- Means clustering to allocate positive case
areas and classify the risk status using decision trees algorithms. The K-modes
clustering algorithm, the extended version of K-means, was used to help physicians
group the patients to get insight into their health and the treatments that might be
needed. Then, chronic disease distribution amongst clusters can be scrutinized [106].
K-means clustering can be employed to allocate infected areas, classify a person’s
risk in an area using decision tree algorithm [44], and identify the coronavirus
spreading [32]. Hierarchical clustering was applied to identify the actual groups
of infected COVID-19 [84] and the effects of chloroquine derivatives in patients,
based on medical articles [49].
Bi-Term Topic Model (BTM), a topic clustering model, was applied to analyze
Twitter microblogging (tweets) to identify the Government’s social distancing guide-
lines’ public pros and cons. Combined with social network analysis, the study in-
vestigated the networked structure of the Twitter communities’ communication dy-
namics [63]. A survey on public opinions on remote work during the pandemic used
the K-means algorithm to cluster tweets to identify shared concerns. Naive Bayes
sentiment analysis to get the tendency of the clusters [3]. Some studies revealed
hidden themes from the Twitter dataset to explore the public concern to some
pandemic issues using the topic cluster model of LDA (Latent Dirichlet Analysis)
[22, 60].
Association and Semantic Network Analysis
Association is unsupervised learning that aims to find the relationship between en-
tities from a large dataset. An application of association for COVID-19 was used
Frequent-Pattern growth (FP-growth) algorithm to analyze the relationship among
various diseases and the complications, cover other possible complications, and ex-
plore the relationship between complications and causality. Almaslamani et al. [87]

Riswantini et al. Page 14 of 28
developed an association rule algorithm based on cosine similarity to identify cus-
tomers’ shopping behavior by examining associations between items purchased on
their shopping cart.
Semantic Network Analysis (SNA) is generally used in text mining to analyze
social media data. To explore the public opinion represented by Twitter users about
COVID-19, SNA was used. A study on figuring out the incivility factors on social
media was conducted using mixed SNA with binary logistic regression classification
[57]. SNA technique can be utilized to explore social behavior and social changes.
Sung et al. [96]employed SNA to explore travelers’ perceptions and interests after
the extensive spread of COVID-19. Centrality analysis and convergent correlation
analysis were equipped for this semantic network analysis in this study.
Regression and Time Series Forecasting
Regression is used to estimate value based on several variables and determine the
causal relationship between one variable and other variables. In comparison, time
series forecasting is a technique for predicting events concerning the time sequence.
This technique predicts future events by analyzing past trends, assuming that future
trends will be similar to historical trends. A study on COVID-19 has applied a
regression model to predict infected cases and compared the model with another
prediction model of ANN [31]. ANN is also used to indicate the spread and the
peak number of COVID-19 cases. Differential Private ANN was developed to make
predictions with the feature to protect individual data privacy. This extended model
has proven that by introducing laplacian noise at the activation function level. The
model gives results that are similar to the base ANN [107]. A study on the spread
prediction model was performed by creating an ensemble model from the Decision
Tree and Logistic Regression models to develop a tree-based regressor model to
gain higher accuracy [30]. Ye and Lyu [70] studied the impact of trust and risk
perception on the infection rate. Multilevel regression was applied in the study to
determine the city and province-level analysis. Multiple regression was adopted to
observe the preventive intention based on social media data. The study proved that
fear and collectivism positively impact community prevention intentions but reduce
each other’s positive influence on community prevention intentions [72].
Lee [93] exploited the impact of COVID-19 sentiment on the US stock market
differentiated by industries. The study developed time series regression models and
used the data from Google Trends on coronavirus-related searches and daily news
sentiment index for the analysis. Another study on the stock market has also em-
ployed a regression model to reveal the impact of investor attention and the number
of media reports about masks on the rate of return of 40 mask concept stocks [94].
Further, we identified several studies on time series prediction, including energy
consumption [103] and electricity consumption prediction [108].
Descriptive and Inferential Statistics
The study of human mobility during the pandemic has been conducted by taking
into account three fundamental metrics of trip per person, person-miles traveled,
and proportion of staying home. Based on these metrics, the effect of policies across
regions under diversified socio-demographics was observed. In this study, a Gener-
alized Additive Mixed Model (GAMM) was generated for inferential analysis, and

Riswantini et al. Page 15 of 28
the results were compared with ones from other models [67]. Still, about human
mobility, the flight traffic behavior was monitored for countries worldwide to exam-
ine the relationship between the number of flights and the COVID-19 infection. For
this purpose, descriptive statistics were used in this study [97]. Descriptive analysis
expanded with repeated-measures analysis of variance (ANOVA), and correlation
analysis was implemented to study the hotel industry’s turbulence impacted by
COVID-19 [82].
More about the use of descriptive statistics, a past study has discovered the cor-
relation between the incidence of COVID-19 and search data provided by Google
Trends. Afterward, the regression lines can be derived to predict the evolution of the
COVID-19 pandemic [36]. A similar study was conducted using Pearson correlation
and ARIMA (Auto-Regressive Integrated Moving Average) to reveal the relation
between Google Trends data and COVID-19 cases [33, 40]. Descriptive statistics
were further employed to exploit the effect of lockdown on people’s activities repre-
sented by the number of steps per day regarding the adherence of staying at home
policy [10]. The lockdown policy has led to lowering the road traffic trend. Gualtieri
[9] observed the impact of road traffic on air quality in several urban areas. The
analysis has taken into account the time series of traffic mobility to reveal the associ-
ation among meteorological parameters, road traffic, and pollutant concentrations.
Some other research on the air quality, the pollution risk, and health city conditions
during the outbreak was conducted using various statistical descriptive techniques
[88, 89, 100, 54].
Study on the evaluation of eco-tourism resources employed PCA’s statistical tech-
nique (Principal Component Analysis) to diminish the indicators to develop the
tourism index system. The method was integrated into the AHP (Analytical Hier-
archy Process) in generating an evaluation index system of urban tourism competi-
tiveness intended for tourism development facing the pandemic [81]. PCA was also
applied for evaluation of online service-learning that is distinctively raised during the
outbreak. It is used to develop a user-engagement score system and then discovered
the association of the score with the number of subscribers and their reviews by ap-
plying the Pearson correlation technique [90]. Another statistical analysis performed
by past studies was DID (Difference-In Difference) techniques. DID technique was
employed to identify the effect of the medicine on the risk groups of COVID-19 [50]
and the individual changes in health care utilization from different risk groups [77].
SIR Mathematical Model
The prediction and control of disease spread can be analyzed using mathematical
models for infectious diseases. The SIR model (Susceptible, Infected, and Recovered)
is a mathematical model which is one of the core epidemiological models. It is a
basic statistical tool for analyzing infectious disease outbreaks with more specificity
in modeling population subsets for accurate forecasting [109]. This model can be
extended to an SEIR model by including various sizes of the Exposed (E) population
and more detailed data.
The prediction of the epidemic situation based on COVID-19 data was carried
out by Wang R et al. [29] by comparing several models. The optimized SIR model
uses the least square and particle swarm optimization method and the classical

Riswantini et al. Page 16 of 28
logistic regression model. Prediction of the number of patients was performed after
obtaining a trained model or parameter estimation. The logistic regression model
provides results that are more in line with actual conditions than the SIR model
based on particle swarm.
Figure 6 SIR and SEIR model
Liu M et al. [39] developed the SEIR model for capturing the trajectory of COVID-
19 evolution in Wuhan using various assumptions. The assumption is that Suscep-
tible (S) people who ’move in’ to Wuhan are Susceptible (Sin), people who ’move
out’ from Wuhan are Susceptible (Sout) and Exposed (Eout). And people who are
exposed without symptoms are Infectious (I). The two components for infected peo-
ple are hospitalized and quarantined (Ih) cannot infect people outside the hospital.
Those who remain in the community and are not hospitalized (Io) will spread the
disease. Individuals of these two components were included as recoverable (Rr) and
death case (Rd). This model considers influencing factors such as city closures,
shelters, and the addition of new hospitals, resulting in an adequate forecast of the
peak, size, and duration of the epidemic.
Figure 7 Modification of the SEIR model[39]
The SEIR model was developed by Isarapong [78] to estimate pandemic condi-
tions by adapting the actual COVID-19 data for each province in Thailand. The
SEIR model is modified by dividing the Exposed (E) Phase into E1 for exposed,
non-infectious, no symptoms, and E2 for exposed, pre-symptomatic, infectious. The
infectious (I) phase is divided into Is for infectious, symptomatic, and Ia for infec-
tious, asymptomatic. This model starts from Susceptible (S) to E1. There are two
possible routes to the Recovery (R) phase from E1: E2-Is-R and Ia-R. Apart from
considering the different recovery rates and transmission for each province, this
model also considers the mobility factor between areas that can contribute to the
spread of disease to other places.

Riswantini et al. Page 17 of 28
Figure 8 Modification of the SEIR model [78]
IoT and Other Big Data Application
The IoT system integrates several components, consisting of sensors/devices that
send data to the cloud through several connectivity types. The application soft-
ware will process the cloud data to produce output such as alerts or adjusting sen-
sors/devices automatically. IoT technology provides the solution for various prob-
lems, especially concerning activities that need to be monitored and controlled
remotely. IoT technology related to COVID-19 big data research is mainly carried
out in health area. The use of smart devices connected to the patients so that their
conditions can be monitored remotely by medical officers/doctors in real-time via
a mobile application.
The digital transformation for the public health care system is carried out by
Nascimento et al. [37] by adopting a fog environment that connects several local
devices and connects to the cloud infrastructure via a communication network. It
is stated that this environment will improve the quality of the data to be uploaded
to the cloud. Meanwhile, a new IoT-fog-cloud-based architecture is proposed by [4]
for the monitoring system for autism and COVID-19. It is stated that the proposed
architecture has several advantages: it can handle IoT data flow processes in real-
time, data integrity in a multi-tenant environment, and applies business processes
to the cloud and the appropriate cloud resources.
Ashraf et al. [6] introduced a strategy of layered edge computing mechanisms to
identify medical health status and track people suspected of being infected with
COVID-19. This layered mechanism helps reduce the system delay factor and get a
quick response. Data computing and rule-based analysis at the cloud layer will com-
pare sensor data from several edge layers with predetermined conditions. According
to the appropriate action trigger module, notifications, awareness, recommenda-
tions, and assistance will appear on the application layer.
Efficient control of the pandemic spread by isolating and disinfecting rapid sus-
picious sites is offered by [34]. Proposes a big data architecture that automatically
and continuously collects geolocation data from people’s outdoor activities via IoT
devices. The infected person is the main target for finding all the individuals who
that person may have infected. In anticipation of data loss due to internet connec-
tion problems, data is collected locally on the device and sent to the system when
it is reconnected to the network.

Riswantini et al. Page 18 of 28
Another application that uses a big data approach is smart power grids. Govern-
ment policies to stay at home or lock themselves in have affected electrical energy
consumption in areas affected by COVID-19 and in industrial cities. A more resilient
smart grid analysis through a big data-based approach using a smart grid semantic
platform was carried out by Bionda E et al. [110]. The research shows the smart
grid can manage sudden anomalies by updating the load profile based on forecast
data in the medium short term.
Data source and dataset
Big data is classically characterized by ”4Vs”, representing: (1) Velocity refers to
the speed of data transfer and processing; (2) Volume point out the fact that a huge
amount of data are now produced and available every time; (3) Variety represents
the number of data sources that provide data in various types and formats; (4)
Veracity concerns with the accuracy and the validity of data [111, 112]. Big data
analytics is advanced analytic techniques to extract knowledge from a huge volume
of various data. The skyrocketing amount of data and the advance of computing
technology have accelerated big data applications in processing large data stored in
a distributed file system.
Several applications developed related to COVID-19 examine massive amounts of
data on several distributed servers, requiring a supporting storage system.The ex-
istence of a cloud network will provide higher performance for a large dataset [113].
Distributed NoSQL database technology has scalability, flexibility, and high per-
formance, which is considered most suitable for processing big data. This database
system is non-relational, so it can manage databases with a flexible schema and
does not require complex queries. Some of the NoSQL database technologies used
in the reviewed articles include Cassandra, MongoDB, Hbase, and Neo4j as shown
in Table 2. Obtaining information insights requires multiple perspectives from a
large amount of data from various sources.
MySQL and PostgreSQL are relational database management systems, where the
data search process is linear with the amount of data held. The greater the volume
of data requires certainly more execution time for the search process. Regarding
the management of big volumes of data that the server may become overload and
possibly cause bottlenecks; the data needs to be integrated into a big data library
framework (Apache Hadoop software library) as Sirinaovakul et al. [4], Bo Y [53]
and Nimpattanavong et al. [97] have done in their study. Partitions are one of the
framework’s main features. The feature can distribute data to predefined partition
nodes adjusted to business requirements. Hence, the query process on massive data
remains reliable.
Hadoop is a big data framework managing distributed storage systems that enable
access and processing of an immense volume of data. The principle is a cluster of
nodes, where one cluster coordinates many nodes, and each node has its own data
storage and processing. This technology provides a solution for relational databases
to manage large volumes of data. The data are transferred from relational databases
to Hadoop and vice versa through the Apache Sqoop (SQL(Structured Query Lan-
guage) to Hadoop) tool [25]. Apache Kafka is an open-source streaming platform
in the middle layer that separates data streams and transmits them in real-time to

Riswantini et al. Page 19 of 28
Hadoop big data lakes, applications, and systems analysis. Kafka is usually used for
data streaming, website activity tracking, and real-time analytics, as was done by
Albadawi [21] and Zhang X et al. [58] in their study on analyzing Twitter data.
Table 2 Databases technology with their applications used by previous research
Technology Description ApplicationsCassandra Distributed NoSQL databases designed
to handle large amounts of data spreadacross multiple servers
Smartwatch for monitoring sys-tem [52].
Databricks Cloud-based data engineering tool usedfor processing and transforming massivequantities of data under Apache-Sparkbased platform.
Analysis of the needs of the dis-tribution system operator for theelectricity grid [110].
Hbase An open source non-relational dis-tributed database system, column-oriented capable of processing large-scale data and is built on top ofthe Hadoop Distributed File System(HDFS).
Video streaming data analysis[65].
Kafka An open-source distributed eventstreaming platform used for high-performance data developed by theApache Software Foundation.
Twitter sentiment prediction[58, 21].
Neo4j An open source graph database manage-ment system developed by Neo4j, Inc.
Insight-driven learning (IDL) forhealthcare [59].
MongoDB Document oriented, NoSQL, cross-platform distributed database to storedata in JSON-like documents
Healthcare monitoring remotesystem [37]. Classification of res-idents’ psychological needs [71].Detection of public concern [22]
MySQL An open-source relational database man-agement system to store structured dataunder the licence of GPLv2 or proprietary
Analysis of flight traffic behav-ior [97]. Analysis of health data[53].
PostgreSQL An open-source relational database man-agement system to store structured dataunder the licence of PostGreSQL for freeand open-source of permissive.
Cluster analysis to identify datapatterns of the public policy im-plementation [4]
The literature review shows that research on big data related to COVID-19 uses
a wide variety of data sources available publicly or privately. We categorized the
data sources into six classes: government official data, institutional service data,
IoT generated data, online media data, public/open data, and others [111]. Table
3 presents the dataset used in the previous research. It is shown that Government
official data on COVID-19 cases and social media data are the most widely used in
the research.
Johns Hopkins Coronavirus Research Center data and statistics are the main
references for the COVID-19 pandemic, in addition to WHO official data. The
data expose the situation of viruses spread by country, territory, or area. This data
is beneficial for policymakers and researchers to monitor and carry out various
activities to control the spread of this deadly virus [98, 4, 30, 40]. The government
of each country is updating their COVID-19 case data daily to officially inform the
public about the official data of infected, recovered, and died, regional risk zones,
and distribution of cases and transmission [31, 36]. This information is useful for
people to understand the conditions of the pandemic and to take preventive actions.
In addition to medical data, which is certainly widely used in past research, the
data of transportation, tourism, and industries have also become the concerns in
the research [81, 7, 98, 74].
IoT technology makes it possible to dynamically access big data generated from
sensing devices available in real-time. IoT data is collected from a variety of devices

Riswantini et al. Page 20 of 28
and sensors, such as GPS, CCTV, cameras, smart/mobile devices, and monitoring
devices, to be processed. The advanced technology of IoT and smart devices has
driven the development of intelligent systems that can monitor human mobility,
geolocation of suspected and infected people, health condition, and health protocol
compliance, see Table 3. The use of smart wearable devices, which have now become
daily necessities, makes personal physical health data easier to be obtained and
monitored [6, 37, 10]. Not only public health conditions, IoT research also pays
attention to the changes in environmental quality and energy consumption due to
the human behavior shifts during the pandemic [101, 100, 102]. Applying IoT and
artificial intelligence, we can analyze the natural conditions in real-time [114].
Social media contributes significantly to the development of big data. Pandemic
has forced people to limit their mobility and direct human contact. This situation
makes social media the preferred means of communication for human interaction.
Social media have connected and supported awareness and pandemic updates. User-
generated content in social media can be explored to obtain public information
regarding the pandemic. Microblogging platforms such as Twitter and Facebook
are the most social media network platform that supports the research on COVID-
19in revealing public opinion [8, 22, 64], public concern [83, 72], and psychological
condition towards the pandemic [23, 71, 60]. Users’ comments on social media can
be analyzed to scrutinize people’s behavioral changes due to the outbreak from
many perspectives [96].
Public or open datasets are used to handle various research on COVID-19. The
stock market, weather, and climate data are identified in the previous study. Misra
M et al. [46] developed a model for early detection of COVID-19 using a pulmonary
X-ray image dataset available for public use. Image data of people wearing masks
are used to detect the compliance of personal prevention [66]. Sun et al. [76] develop
a model for exposing people’s mental health using audio and video data.
Conclusion
We have discussed how big data technology contributes to tackling the COVID-
19 outbreak. COVID-19 has induced many problems in various sectors of life for
humanity around the world. To capture the landscape of the COVID-19 research,
reviewed articles were categorized into contribution research areas that appeared
substantial in previous big data research. Methods and techniques were discussed to
show the role of big data analytics in solving the problem and their contribution to
the body of knowledge. The analytical techniques refer to computational domains,
including machine learning, deep learning, statistical analysis, and mathematical
analysis. Artificial intelligence fields of computer vision, remote sensing, the inter-
net of things, and natural language processing have testified to solve COVID-19
problems. We address data sources with different data types used in the past study
to guide future research in developing the data-driven application for COVID-19.
Big Data technology has demonstrated its significant role in tackling COVID-
19. We identified that the previous studies had contributed mainly to research
areas of healthcare, social life, government policy, business and management, and
the environment. Many analytical techniques have been applied for handling many
issues, including epidemic surveillance, medical treatment, social changes, consumer

Riswantini et al. Page 21 of 28
and market behavior, and the effects of the pandemic on earth systems. There are
still many challenges ahead in dealing with COVID-19. The emerging new variants,
vaccine effectiveness and side effects, relaxation of health protocols, and new normal
challenges are issues to be resolved in the future. We hope that this survey will give
insights into current states of knowledge on Big Data technology for COVID-19 and
references for further development or starting new research.

Risw
antin
ietal.
Page22of28
Table 3 Data source and dataset
Data Source Dataset ReferencesGovernment Official Data
Public HealthCOVID-19 cases and events [42, 106, 78, 84, 31, 41, 115, 77, 36, 39, 70]Clinical, demographical, and laboratory data [45, 98, 106, 47]
Insurance Services Medical prescription and Health insurance claim [50, 43]Energy Consumption Electricity and total energy consumption [108, 110, 103]
TransportationDaily health condition of passenger [44]Traffic flow and Traffic density [7, 98, 14, 9]Residential car park [68]
Tourism Urban tourism data [81]Institution Official Data
WHO, John Hopkins, and ECDC COVID-19 global cases [98, 30, 4, 99, 40]Bank cards transactions Healthcare expenditure [77]Andalucia Emprende Foundation Entrepreneur data [85]Yale Industrial Economic Industry statistical data [95, 89]Mob-Tech Research Institute Internet usage data [83]International hotel chain CRM public data [74]European Society of Radiology Covid-19 negative X-ray images [74]
IoT DataGPS data Position location [43]Camera Video Video streaming [65]
Smart/Mobile DevicesHuman mobility and human steps records [69, 67, 52, 10]Physical health records [6, 53, 37]Geolocation of suspected/infected [34, 35, 43]
Monitoring devices Water quality and PM2.5 concentration [101, 102, 100]Online Media Data
Social networking service Twitter, Weibo, Instagram, Facebook, and WeChat data [5, 59, 73, 21, 72, 60, 63, 56, 3, 57, 29, 71, 83, 58]Navigation Google data, Baidu data [54, 115, 49, 39, 33, 40, 70, 94, 79, 93]Online news Fox news, Koren and China news and magazine [116, 73, 61]E-commerce Online shopping data, Tripadvisor data [86, 82]
Public/Open DataStock Exchange Stock market data [105, 92]Kaggle Covid-19 cases [32, 107, 30]Scientific data Weather and climate data [99]
Other datasetMasked face head pose image data [66]Facial expression video and speech audio data [76]

Riswantini et al. Page 23 of 28
Abbreviations
AHP: Analytical Hierarchy Process; AI: Artificial Intelligence; ARIMA: Auto-Regressive Integrated Moving Average;
BTM: Generative Adversarial Networks; CNN: Convolution Neural Network; COVID-19: Coronavirus Disease 2019;
DID: Difference-In Difference; ELM: Extreme Learning Machine; FP-growth: Frequent-Pattern growth; GAMM:
Generalized Additive Mixed Model; GANs: Generative Adversarial Networks; HDFS: Hadoop Distributed File
System; LDA: Latent Dirichlet Analysis; LSTM: Long Short Term Memory; ML: Machine Learning; MLP:
Multi-Layer Perceptron; NLP: Natural Language Processing; OCR: Optical Character Recognition; PCA: Principal
Component Analysis; PFT: Pulmonary Function Test; RNN: Recurrent Neural Network; SEIR: Susceptible, Exposed,
Infected, and Recovered; SIR: Susceptible, Infected, and Recovered; SNA: Semantic Network Analysis; SOM:
Self-Organizing Map; SQL: Structured Query Language; SVM: Support Vector Machine; UGC: User-Generated
Content; WHO: World Health Organization.
Acknowledgements
The authors wish to thank the other members of the information retrieval research group at Research Center for
Informatics, Indonesian Institute for Sciences, for their help and supportive discussions throughout this work.
Authors’ contributions
DR and DM introduced conceptualization. Literature review, drafted, and writing the manuscript were performed by
DR and EN. Literature collection, review, and editing of manuscripts were carried out by DR and EN. Visualization
and data processing were prepared by AA and EN. WS supervised all the work of the literature review. All authors
have reviewed and agreed to the published version of the manuscript.
Funding
Not applicable (This work received no specifc grant from any funding agency, commercial or not-for-proft sectors).
Availability of data and materials
Not applicable
Declarations
Ethics approval and consent to participate
Not applicable
Consent for publication
Not applicable
Competing interests
The authors declare that they have no competing interests.
Author details
Research Center for Informatics, Indonesian Institute of Sciences, Bandung, Indonesia.
References
1. WHO: Coronavirus disease (COVID-2019) situation reports. World Health Organization. (2020).
https://www.who.int/emergencies/diseases/novel-coronavirus-2019/situation-reports Accessed 22
March 2021
2. University, J.H.: COVID-19 Dashboard The Center for Systems Science and Engineering (2020).
https://coronavirus.jhu.edu/map.html Accessed 30 March 2021
3. Maslankowski, J., Wrycza, S.: Social media users’ opinions on remote work during the covid-19 pandemic.
thematic and sentiment analysis. Information Systems Management 37 (2020).
doi:10.1080/10580530.2020.1820631
4. Sirinaovakul, W., Eiamyingsakul, T., Tubtimtoe, N., Prom-on, S., Taetragool, U.: The relations between
implementation date of policies and the spreading of covid-19. In: 2020 1st International Conference on Big
Data Analytics and Practices (IBDAP), pp. 1–6 (2020). doi:10.1109/IBDAP50342.2020.9245459
5. P., B., Lunkar, V.: Presence and mobility of the population during the first wave of covid-19 outbreak and
lockdown in italy. Sustainable Cities and Society (2021). doi:10.1016/j.scs.2020.102616
6. Ashraf, M.U., Hannan, A., Cheema, S.M., Ali, Z., Jambi, K.M., Alofi, A.: Detection and tracking contagion
using iot-edge technologies: Confronting covid-19 pandemic. In: 2nd International Conference on Electrical,
Communication and Computer Engineering, ICECCE 2020 (2020). doi:10.1109/ICECCE49384.2020.9179284
7. Zheng, Y.: Estimation of disease transmission in multimodal transportation networks. Journal of Advanced
Transportation 2020, 1–16 (2020). doi:10.1155/2020/8898923
8. Suratnoaji, C., Nurhadi, D., I.: Public opinion on lockdown (psbb) policy in overcoming covid-19 pandemic in
indonesia: Analysis based on big data twitter. Asian Journal for Public Opinion Research (2020).
doi:10.15206/ajpor.2020.8.3.393
9. Gualtieri, G., Brilli, L., Carotenuto, F., Vagnoli, C., Zaldei, A., Gioli, B.: Quantifying road traffic impact on air
quality in urban areas: A covid19-induced lockdown analysis in italy. Environmental Pollution 267, 115682
(2020). doi:10.1016/j.envpol.2020.115682
10. Pepin, J.-L., Bruno, R., Yang, R., Vercamer, V., Jouhaud, P., Escourrou, P., Boutouyrie, P.: Wearable activity
trackers for monitoring adherence to home confinement during the covid-19 pandemic worldwide: Data
aggregation and analysis. Journal of Medical Internet Research 22 (2020). doi:10.2196/19787
11. Hannah-Ramsden, M., Linda, S., White3, P.J.: How does a (smart) age-friendly ecosystem look in a
post-pandemic society? International journal of environmental research and public health 17(21), 8276 (2020).
doi:10.3390/ijerph17218276

Riswantini et al. Page 24 of 28
12. Manalu, E.P.S., Muditomo, A., Adriana, D., Trisnowati, Y., Kesuma, Z.P., Dwiyani, R.H.: Role of information
technology for successful responses to covid-19 pandemic. In: 2020 International Conference on Information
Management and Technology (ICIMTech), pp. 415–420 (2020). doi:10.1109/ICIMTech50083.2020.9211290
13. Villegas-Ch, W., Roman-Canizares, M., Jaramillo-Alcazar, A., Palacios-Pacheco, X.: Data analysis as a tool for
the application of adaptive learning in a university environment. Applied Sciences 10(20) (2020).
doi:10.3390/app10207016
14. Shang, W.-L., Jinyu, C., Bi, H., Sui, Y., Chen, Y., Yu, H.: Impacts of covid-19 pandemic on user behaviors
and environmental benefits of bike sharing: A big-data analysis. Applied Energy 285, 116429 (2021).
doi:10.1016/j.apenergy.2020.116429
15. Shangguan, Z., Wang, M., Sun, W.: What caused the outbreak of covid-19 in china: From the perspective of
crisis management. International Journal of Environmental Research and Public Health 17, 3279 (2020).
doi:10.3390/ijerph17093279
16. Hoosain, M., Paul, B.S., Ramakrishna, S.: The impact of 4ir digital technologies and circular thinking on the
united nations sustainable development goals. Sustainability 12, 10143 (2020). doi:10.3390/su122310143
17. Doyle, R., Conboy, K.: The role of is in the covid-19 pandemic: A liquid-modern perspective. International
Journal of Information Management 55, 102184 (2020). doi:10.1016/j.ijinfomgt.2020.102184
18. Dwivedi, Y., Hughes, D.L., Coombs, C., Constantiou, I., Duan, Y., Edwards, J., Gupta, B., Lal, B., Misra, S.,
Prashant, P., Raman, R., Rana, N., Sharma, S., Upadhyay, N.: Impact of covid-19 pandemic on information
management research and practice: Transforming education, work and life. International Journal of
Information Management 55, 102211 (2020). doi:10.1016/j.ijinfomgt.2020.102211
19. Wu, J., Wang, J., Nicholas, S., Maitland, E., Fan, Q.: Application of big data technology for covid-19
prevention and control in china: Lessons and recommendations. Journal of Medical Internet Research 22,
21980 (2020). doi:10.2196/21980
20. He, W., Zhang, J., Li, W.: Information technology solutions, challenges, and suggestions for tackling the
covid-19 pandemic. International Journal of Information Management 57 (2020).
doi:10.1016/j.ijinfomgt.2020.102287
21. Albaldawi, W.S., Almuttairi, R.M.: Comparative study of classification algorithms to analyze and predict a
twitter sentiment in apache spark. In: IOP Conference Series: Materials Science and Engineering, vol. 928
(2020). doi:10.1088/1757-899x/928/3/032045. https://doi.org/10.1088/1757-899x/928/3/032045
22. Alomari, E., Katib, I., Albeshri, A., Mehmood, R.: Covid-19: Detecting government pandemic measures and
public concerns from twitter arabic data using distributed machine learning. International Journal of
Environmental Research and Public Health 18, 282 (2021). doi:10.3390/ijerph18010282
23. Nguyen, T., Criss, S., Dwivedi, P., Huang, D., Keralis, J., Hsu, E., Phan, L., Nguyen, L., Yardi, I., Glymour,
M., Allen, A., Chae, D., Gee, G., Nguyen, Q.: Exploring u.s. shifts in anti-asian sentiment with the emergence
of covid-19. International Journal of Environmental Research and Public Health 17, 7032 (2020).
doi:10.3390/ijerph17197032
24. Ahir, S., Telavane, D., Thomas, R.: The impact of artificial intelligence, blockchain, big data and evolving
technologies in coronavirus disease - 2019 (covid-19) curtailment. In: 2020 International Conference on Smart
Electronics and Communication (ICOSEC), pp. 113–120 (2020). doi:10.1109/ICOSEC49089.2020.9215294
25. Grover, P., Kar, A.K.: Big data analytics: A review on theoretical contributions and tools used in literature.
Global Journal of Flexible Systems Management 18, 203–229 (2017). doi:10.1007/s40171-017-0159-3
26. Gavel, Y., Iselid, L.r.: Web of science and scopus: a journal title overlap study. Online Information Review
32(1), 8–21 (2008). doi:10.1108/14684520810865958
27. Aghaei Chadegani, A., Salehi, H., Yunus, M., Farhadi, H., Fooladi, M., Farhadi, M., Ale Ebrahim, N.: A
comparison between two main academic literature collections: Web of science and scopus databases. Asian
Social Science 9, 18–26 (2013). doi:10.5539/ass.v9n5p18
28. Atenstaedt, R.: Word cloud analysis of the bjgp. British Journal of General Practice 62(596), 148–148 (2012).
doi:10.3399/bjgp12X630142. https://bjgp.org/content/62/596/148.full.pdf
29. Wang, R., Hu, G., Jiang, C., Lu, H., Zhang, Y.: Data analytics for the covid-19 epidemic. In: 2020 IEEE 44th
Annual Computers, Software, and Applications Conference (COMPSAC), pp. 1261–1266 (2020).
doi:10.1109/COMPSAC48688.2020.00-83
30. Ngie, H.M., Nderu, L., Mwigereri, D.G.: Tree-based regressor ensemble for viral infectious diseases spread
prediction. 3rd African Conference on Software Engineering, ACSE 2020 2689 (2020)
31. Prakash, A., Sharma, P., Sinha, I.K., Singh, U.P.: Spread peak prediction of covid-19 using ann and
regression. In: 2020 IEEE 6th International Conference on Multimedia Big Data, BigMM 2020, pp. 356–365
(2020). doi:10.1109/BigMM50055.2020.00062
32. Rivai, M.A., Sfenrianto: Analysis of corona virus spread uses the crisp-dm as a framework: Predictive
modelling. International Journal of Advanced Trends in Computer Science and Engineering (2020).
doi:10.30534/ijatcse/2020/76932020
33. Mavragani, A.: Tracking covid-19 in europe: Infodemiology approach. JMIR Public Health and Surveillance 6,
18941 (2020). doi:10.2196/18941
34. Benreguia, B., Hamouma, M., Merzoug, M.A.: Tracking covid-19 by tracking infectious trajectories. IEEE
Access PP, 1–1 (2020). doi:10.1109/ACCESS.2020.3015002
35. Shahata, H., Khafagy, M., Omara, F.: Case study: Spark gpu-enabled framework to control covid-19 spread
using cell-phone spatio-temporal data. Computers, Materials & Continua 65, 1303–1320 (2020).
doi:10.32604/cmc.2020.011313
36. Tosi, D., Campi, A.: How data analytics and big data can help scientists in managing covid-19 diffusion: A
model to predict the covid-19 diffusion in italy and lombardy region (preprint). Journal of Medical Internet
Research 22 (2020). doi:10.2196/21081
37. do Nascimento, M.G., Iorio, G., Thome, T.G., Medeiros, A.A.M., Mendonca, F.M., Campos, F.A., David,
J.M., Stroele, V., Dantas, M.A.R.: Covid-19: A digital transformation approach to a public primary healthcare
environment. In: 2020 IEEE Symposium on Computers and Communications (ISCC), pp. 1–6 (2020).

Riswantini et al. Page 25 of 28
doi:10.1109/ISCC50000.2020.9219643
38. Alwaeli, Z.A.A., Ibrahim, A.A.: Predicting covid-19 trajectory using machine learning. In: 2020 4th
International Symposium on Multidisciplinary Studies and Innovative Technologies (ISMSIT), pp. 1–4 (2020).
doi:10.1109/ISMSIT50672.2020.9255149
39. Liu, M., Ning, J., Du, Y., Cao, J., Zhang, D., Wang, J., Chen, M.: Modeling the evolution trajectory of
covid-19 in wuhan, china: Experience and suggestions. Public Health, 76–80 (2020).
doi:10.1016/j.puhe.2020.05.001
40. Higgins, T., Wu, A., Sharma, D., Illing, E., Rubel, K., Ting, J.: Correlations of online search engine trends
with coronavirus disease (covid-19) incidence: Infodemiology study. JMIR Public Health and Surveillance 6
(2020). doi:10.2196/19702
41. Dsouza, J., S., S.: Using exploratory data analysis for generating inferences on the correlation of covid-19
cases. (2020). doi:10.1109/ICCCNT49239.2020.9225621
42. Zhao, J., Ahmad, Z., Almaspoor, Z., Elmorshedy, M., Afify, A.: Modeling covid-19 pandemic dynamics in two
asian countries. Computers, Materials and Continua 67, 965–977 (2021). doi:10.32604/cmc.2021.014553
43. Chen, C.-M., Jyan, H.-W., Chien, S.-C., Jen, H.-H., Hsu, C.-Y., Lee, P.-C., Lee, C.-F., Yang, Y.-T., Chen,
M.-Y., Chen, S., Chen, H.-H., Chan, C.-C.: Containing covid-19 among 627,386 persons contacting with
diamond princess cruise ship passengers disembarked in taiwan: Big data analytics. Journal of Medical Internet
Research 22 (2020). doi:10.2196/19540
44. Liu, Q., Huang, Z.: Research on intelligent prevention and control of covid-19 in china’s urban rail transit
based on artificial intelligence and big data. Journal of Intelligent and Fuzzy Systems (2020).
doi:10.3233/JIFS-189307
45. Jamshidi, M., Lalbakhsh, A., Talla, J., Peroutka, Z., Hadjilooei, F., Lalbakhsh, P., Jamshidi, M., Spada, L.,
Mirmozafari, M., Dehghani, M., Sabet, A., Roshani, S., Roshani, S., Bayat-Makou, N., Mohamadzade, B.,
Malek, Z., Jamshidi, A., Kiani, S., Hashemi-Dezaki, H., Mohyuddin, W.: Artificial intelligence and covid-19:
Deep learning approaches for diagnosis and treatment. IEEE Access PP, 1–1 (2020).
doi:10.1109/ACCESS.2020.3001973
46. Mishra, M., Parashar, V., Shimpi, R.: Development and evaluation of an ai system for early detection of
covid-19 pneumonia using x-ray (student consortium). In: 2020 IEEE 6th International Conference on
Multimedia Big Data, BigMM 2020 (2020). doi:10.1109/BigMM50055.2020.00051
47. Kim, T., Lee, S.-J., Lee, H., Chang, D.-J., Yoon, C., Choi, I.-Y., Yoon, K.-H.: Cimi: Classify and itemize
medical image system for pft big data based on deep learning. Applied Sciences 10, 8575 (2020).
doi:10.3390/app10238575
48. Izquierdo, J., Ancochea, J., Soriano, J.B.: Clinical characteristics and prognostic factors for intensive care unit
admission of patients with covid-19: Retrospective study using machine learning and natural language
processing. Journal of Medical Internet Research 22, 21801 (2020). doi:10.2196/21801
49. Million, M., Gautret, P., Colson, P., Roussel, Y., Dubourg, G., Chabriere, E., Honore, S., Rolain, J.-M.,
Fenollar, F., Fournier, P.-E., Lagier, J.-C., Parola, P., Brouqui, P., Raoult, D.: Clinical efficacy of chloroquine
derivatives in covid-19 infection: Comparative meta-analysis between the big data and the real world. New
Microbes and New Infections 38, 100709 (2020). doi:10.1016/j.nmni.2020.100709
50. Kim, J., Kim, D., Kim, K.-I., Kim, H., Kim, J.-H., Lee, Y.-G., Byeon, K., Cheong, H.-K.: Compliance of
antihypertensive medication and risk of coronavirus disease 2019: a cohort study using big data from the
korean national health insurance service. Journal of Korean Medical Science 35 (2020).
doi:10.3346/jkms.2020.35.e232
51. Sambhav, S., bhavya, r.: Role of mobile communication with emerging technology in covid’19. International
Journal of Advanced Trends in Computer Science and Engineering 9, 3338–3344 (2020).
doi:10.30534/ijatcse/2020/131932020
52. Kallel, A., Rekik, M., Khemakhem, M.: Iot-fog-cloud based architecture for smart systems: Prototypes of
autism and covid-19 monitoring systems. Software: Practice and Experience 51(1), 91–116 (2021).
doi:10.1002/spe.2924
53. Bo, Y., Chunli, W.: Health data analysis based on multi-calculation of big data during covid-19 pandemic.
Journal of Intelligent & Fuzzy Systems 39(6), 8775–8782 (2020). doi:10.3233/JIFS-189274
54. Liu, H., Fang, C., Gao, Q.: Evaluating the real-time impact of covid-19 on cities: China as a case study.
Complexity 2020, 1–11 (2020). doi:10.1155/2020/8855521
55. Varotsos, C., Krapivin, V., Xue, Y.: Diagnostic model for the society safety under covid-19 pandemic
conditions. Safety Science 136, 105164 (2021). doi:10.1016/j.ssci.2021.105164
56. Sari, I., Ruldeviyani, Y.: Sentiment analysis of the covid-19 virus infection in indonesian public transportation
on twitter data: A case study of commuter line passengers, pp. 23–28 (2020).
doi:10.1109/IWBIS50925.2020.9255531
57. Bumsoo, K.: Effects of social grooming on incivility in covid-19. Cyberpsychology, Behavior, and Social
Networking. 23(8), 519–525 (2020). doi:10.1089/cyber.2020.0201
58. Zhang, X., Saleh, H., Younis, E., Sahal, R., Ali, A.: Predicting coronavirus pandemic in real-time using
machine learning and big data streaming system. Complexity 2020, 1–10 (2020). doi:10.1155/2020/6688912
59. Fiaidhi, J.: Envisioning insight-driven learning based on thick data analytics with focus on healthcare. IEEE
Access 8, 114998–115004 (2020). doi:10.1109/ACCESS.2020.2995763
60. Xue, J., Chen, J., Chen, C., Hu, R., Zhu, T.: The hidden pandemic of family violence during covid-19:
Unsupervised learning of tweets. Journal of Medical Internet Research 22 (2020). doi:10.2196/24361
61. Jung, J.-H., Shin, J.-I.: Big data analysis of media reports related to covid-19. International Journal of
Environmental Research and Public Health 17(16) (2020). doi:10.3390/ijerph17165688
62. Katapally, T.: Global digital citizen science policy to tackle pandemics like covid-19 (preprint). Journal of
Medical Internet Research 22 (2020). doi:10.2196/19357
63. Haupt, M.R., Jinich-Diamant, A., Li, J., Nali, M., Mackey, T.K.: Characterizing twitter user topics and
communication network dynamics of the “liberate” movement during covid-19 using unsupervised machine

Riswantini et al. Page 26 of 28
learning and social network analysis. Online Social Networks and Media 21, 100114 (2021).
doi:10.1016/j.osnem.2020.100114
64. Mackey, T., Purushothaman, V.L., Li, J., Shah, N., Nali, M., Bardier, C., Liang, B., Cai, M., Cuomo, R.:
Machine learning to detect self-reporting of symptoms, testing access, and recovery associated with covid-19
on twitter: Retrospective big data infoveillance study. JMIR Public Health and Surveillance 6 (2020).
doi:10.2196/19509
65. Melenli, S., Topkaya, A.: Real-time maintaining of social distance in covid-19 environment using image
processing and big data. In: 2020 Innovations in Intelligent Systems and Applications Conference (ASYU), pp.
1–5 (2020). doi:10.1109/ASYU50717.2020.9259891
66. Li, S., Ning, X., Yu, L., Zhang, L., Dong, X., Shi, Y., He, W.: Multi-angle head pose classification when
wearing the mask for face recognition under the covid-19 coronavirus epidemic. In: 2020 International
Conference on High Performance Big Data and Intelligent Systems (HPBD IS), pp. 1–5 (2020).
doi:10.1109/HPBDIS49115.2020.9130585
67. Hu, S., Xiong, C., Yang, M., Younes, H., Luo, W., Zhang, L.: A big-data driven approach to analyzing and
modeling human mobility trend under non-pharmaceutical interventions during covid-19 pandemic.
Transportation Research Part C: Emerging Technologies 124, 102955 (2021). doi:10.1016/j.trc.2020.102955
68. Jiang, P., Fu, X., Fan, Y.V., Klemes, J.J., Chen, P., Ma, S., Zhang, W.: Spatial-temporal potential exposure
risk analytics and urban sustainability impacts related to covid-19 mitigation: A perspective from car mobility
behaviour. Journal of Cleaner Production (2021). doi:10.1016/j.jclepro.2020.123673
69. Arimura, M., Vinh Ha, T., Okumura, K., Asada, T.: Changes in urban mobility in sapporo city, japan due to
the covid-19 emergency declarations. Transportation Research Interdisciplinary Perspectives 7, 1–14 (2020).
doi:10.1016/j.trip.2020.100212
70. Ye, M., Lyu, Z.: Trust, risk perception, and covid-19 infections: Evidence from multilevel analyses of combined
original dataset in china. Social Science and Medicine (2020). doi:10.1016/j.socscimed.2020.113517
71. Long, Z., Alharthi, R., Saddik, A.E.: Needfull – a tweet analysis platform to study human needs during the
covid-19 pandemic in new york state. IEEE Access 8, 136046–136055 (2020).
doi:10.1109/ACCESS.2020.3011123
72. Huang, F., Ding, H., Liu, Z., Wu, P., Li, A., Zhu, T.: How fear and collectivism influence public’s preventive
intention towards covid-19 infection: A study based on big data from the social media. BMC Public Health 20
(2020). doi:10.1186/s12889-020-09674-6
73. Gang, L., Fang, W., Sishi, Q.: The impact of covid-19 on the protection of rural traditional village. Journal of
Intelligent and Fuzzy Systems (2020). doi:10.3233/JIFS-189264
74. Gonzalez-Serrano, L., Talon-Ballestero, P., Munoz-Romero, S., Soguero-Ruiz, C., Rojo-Alvarez, J.L.: A big
data approach to customer relationship management strategy in hospitality using multiple correspondence
domain description. Applied Sciences 11(1) (2021). doi:10.3390/app11010256
75. Zhang, C.: A study on academic emotional tendency of online learning for foreign language majors under the
background of epidemic prevention and control. In: 2020 International Conference on Big Data and
Informatization Education, ICBDIE 2020 (2020). doi:10.1109/ICBDIE50010.2020.00087
76. Sun, X., Song, Y., Wang, M.: Toward sensing emotions with deep visual analysis: A long-term psychological
modeling approach. IEEE MultiMedia 27(4), 18–27 (2020). doi:10.1109/MMUL.2020.3025161
77. Zhang, Y.-N., Chen, Y., Wang, Y., Li, F., Pender, M., Wang, N., Yan, F., Ying, X.-H., Tang, S.-L., Fu,
C.-W.: Reduction in healthcare services during the covid-19 pandemic in china. BMJ Glob Health 5(11)
(2020). doi:10.1136/bmjgh-2020-003421
78. Eksinchol, I.: Monitoring the covid-19 situation in thailand. In: 2020 1st International Conference on Big Data
Analytics and Practices (IBDAP), pp. 1–6 (2020). doi:10.1109/IBDAP50342.2020.9245465
79. Nguyen, Q.C., Huang, Y., Kumar, A., Duan, H., Keralis, J.M., Dwivedi, P., Hsien-Wen, M., Brunisholz, K.D.,
Jay, J., Javanmardi, M., Tasdizen, T.: Using 164 million google street view images to derive built environment
predictors of covid-19 cases. International Journal of Environmental Research and Public Health 17(17)
(2020). doi:10.3390/ijerph17176359
80. Zhaoguo, L., Tingting, L., Wenzhan, W.: Traditional village protection based on big data under the impact of
covid-19. Journal of Intelligent & Fuzzy Systems 39(6), 8655–8664 (2020). doi:10.3233/JIFS-189261
81. Wang, Z.: Eco-tourism benefit evaluation of yellow river based on principal component analysis. Journal of
Intelligent and Fuzzy Systems 39(6), 8907–8915 (2020). doi:10.3233/JIFS-189288
82. Wu, F., Zhang, Q., Law, R., Zheng, T.: Fluctuations in hong kong hotel industry room rates under the 2019
novel coronavirus (covid-19) outbreak: Evidence from big data on ota channels. Sustainability 12, 7709
(2020). doi:10.3390/su12187709
83. Hua, J., Shaw, R.: Corona virus (covid-19) “infodemic” and emerging issues through a data lens: The case of
china. International Journal of Environmental Research and Public Health 17(7) (2020).
doi:10.3390/ijerph17072309
84. Sanjay, K.: Monitoring novel corona virus (covid-19) infections in india by cluster analysis. Annals of Data
Science 1(9) (2020). doi:10.1007/s40745-020-00289-7
85. Chaves-Maza, M., Martel, E.M.F.: Entrepreneurship support ways after the covid-19 crisis. Entrepreneurship
and Sustainability Issues 8(2), 662–681 (2020). doi:10.9770/jesi.2020.8.2(40)
86. Shahbazi, Z., Hazra, D., Park, S., Byun, Y.C.: Toward improving the prediction accuracy of product
recommendation system using extreme gradient boosting and encoding approaches. Symmetry 12(9) (2020).
doi:10.3390/sym12091566
87. Almaslamani, F., Abuhussein, R., Saleet, H., AbuHilal, L., Santarisi, N.: Using big data analytics to design an
intelligent market basket-case study at sameh mall. In: Proceedings of the European Conference on the Impact
of Artificial Intelligence and Robotics, ECIAIR 2020, pp. 3444–3455 (2020)
88. Antonia-Moreno, C., Rafael-Romon, S., Garcıa-Carrion, R., Garcia-Zapirain, B.: Social impact assessment of
healthyair tool for real-time detection of pollution risk. Sustainability (Switzerland) (2020).
doi:10.3390/su12239856

Riswantini et al. Page 27 of 28
89. Yongao, H., Tianqiang, D., Shuhong, W., Wei, Y., Tian, C., Li, C.: Big data analysis on the state of
automotive cabin air filters in china. In: IOP Conference Series: Earth and Environmental Science, vol. 571, p.
012083 (2020). doi:10.1088/1755-1315/571/1/012083
90. Fedushko, S., Ustyianovych, T., Syerov, Y., Peracek, T.: User-engagement score and slis/slos/slas
measurements correlation of e-business projects through big data analysis. Applied Sciences 10(24) (2020).
doi:10.3390/app10249112
91. Mackey, T., Li, J., Purushothaman, V.L., Nali, M., Shah, N., Bardier, C., Cai, M., Liang, B.: Big data, natural
language processing, and deep learning to detect and characterize illicit covid-19 product sales: An infoveillance
study on twitter and instagram (preprint). JMIR Public Health and Surveillance 6 (2020). doi:10.2196/20794
92. Liammukda, A., Khamkong, M., Saenchan, L., Hongsakulvasu, N.: Panic of covid-19 on the volatility of u.s.
portfolios: Applied big data from google trend. In: 2020 1st International Conference on Big Data Analytics
and Practices (IBDAP), pp. 1–5 (2020). doi:10.1109/IBDAP50342.2020.9245613
93. Lee, H.: Exploring the initial impact of covid-19 sentiment on us stock market using big data. Sustainability
12, 6648 (2020). doi:10.3390/su12166648
94. Zhang, B., Wang, X., Rao, M.: Investor attention and stock market under the outbreak of the covid-19-based
on the data of mask concept stocks. E3S Web of Conferences 214, 02024 (2020).
doi:10.1051/e3sconf/202021402024
95. Wang, Y., Zeng, D.: Development of sports industry under the influence of covid-19 epidemic situation based
on big data. Journal of Intelligent and Fuzzy Systems (2020). doi:10.3233/JIFS-189284
96. Sung, Y.-A., Kim, K.-W., Kwon, H.-J.: Big data analysis of korean travelers’ behavior in the post-covid-19
era. Sustainability 13, 310 (2020). doi:10.3390/su13010310
97. Nimpattanavong, C., Khamlae, P., Choensawat, W., Sookhanaphibarn, K.: Flight traffic visual analytics during
covid-19. In: 2020 IEEE 9th Global Conference on Consumer Electronics (GCCE), pp. 215–217 (2020).
doi:10.1109/GCCE50665.2020.9291896
98. Lin, C., Lau, A., Fung, J., Guo, C., Chan, J., Yeung, D., Zhang, Y., Bo, Y., Hossain, M., Zeng, Y., Lao, X.: A
mechanism-based parameterisation scheme to investigate the association between transmission rate of
covid-19 and meteorological factors on plains in china. Science of The Total Environment 737, 140348 (2020).
doi:10.1016/j.scitotenv.2020.140348
99. Ibrahim, S.: The influences of global geographical climate towards covid-19 spread and death. International
Journal of Advanced Trends in Computer Science and Engineering 9, 612–617 (2020).
doi:10.30534/ijatcse/2020/8591.42020
100. Li, C., Huang, F.: Analysis of the spatial and temporal evolution of pm2.5 pollution in china during covid -19
epidemic. In: 2020 International Conference on Big Data, Artificial Intelligence and Internet of Things
Engineering (ICBAIE), pp. 17–24. IEEE Computer Society, Los Alamitos, CA, USA (2020).
doi:10.1109/ICBAIE49996.2020.00011
101. He, H., Shen, Y., Jiang, C., Li, T., Guo, M., Yao, L.: Spatiotemporal big data for pm2.5 exposure and health
risk assessment during covid-19. International Journal of Environmental Research and Public Health 17(20)
(2020). doi:10.3390/ijerph17207664
102. Yan, H.: Microbial control of river pollution during covid-19 pandemic based on big data analysis. Journal of
Intelligent & Fuzzy Systems 39(6), 8937–8942 (2020). doi:10.3233/JIFS-189291
103. Wang, W., Yu, H., Gao, Q., Hu, M.: Energy conversion path and optimization model in covid-19 under low
carbon constraints based on statistical learning theory. Journal of Intelligent and Fuzzy Systems (2020).
doi:10.3233/JIFS-189304
104. Hussain, A.A., Bouachir, O., Al-Turjman, F., Aloqaily, M.: Ai techniques for covid-19. IEEE Access PP, 1–1
(2020). doi:10.1109/ACCESS.2020.3007939
105. Jing, J.: Big data analysis and empirical research on the financing and investment decision of companies after
covid-19 epidemic situation based on deep learning. Journal of Intelligent and Fuzzy Systems 39(6),
8877–8886 (2020). doi:10.3233/JIFS-189285
106. Batarseh, F.A., Ghassib, I., Chong, D.S., P.H., S.: Preventive healthcare policies in the us: solutions for
disease management using big data analytics. Big Data 7(1) (2020). doi:10.1186/s40537-020-00315-8.
107. Sinha, I.K., Singh, K.P., Verma, S.: Dp-ann: A new differential private artificial neural network with
application on health data (workshop paper). In: 2020 IEEE Sixth International Conference on Multimedia Big
Data (BigMM), pp. 351–355 (2020). doi:10.1109/BigMM50055.2020.00061
108. Martınez-Alvarez, F., Asencio-Cortes, G., Torres, J., Gutierrez-Aviles, D., Melgar-Garcıa, L., Perez-Chacon, R.,
Rubio-Escudero, C., Riquelme, J., Troncoso, A.: Coronavirus optimization algorithm: A bioinspired
metaheuristic based on the covid-19 propagation model. Big Data 8(4), 308–322 (2020).
doi:10.1089/big.2020.0051
109. Shorten, C., Khoshgoftaar, M.T., Furht, B.: Deep learning applications for covid-19. Journal of Big Data
8(18) (2021). doi:10.1186/s40537-020-00392-9
110. Bionda, E., Maldarella, A., Soldan, F., Paludetto, G., Belloni, F.: Covid-19 and electricity demand: Focus on
milan and brescia distribution grids. In: 12th AEIT International Annual Conference, AEIT 2020 (2020).
doi:10.23919/AEIT50178.2020.9241083
111. Jia, Q., Guo, Y., Wang, G., Barnes, S.J.: Big data analytics in the fight against major public health incidents
(including covid-19): A conceptual framework. International Journal of Environmental Research and Public
Health 17(17) (2020). doi:10.3390/ijerph17176161
112. Bragazzi, N.L., Dai, H., Damiani, G., Behzadifar, M., Martini, M., Wu, J.: How big data and artificial
intelligence can help better manage the covid-19 pandemic. International Journal of Environmental Research
and Public Health 17(9) (2020). doi:10.3390/ijerph17093176
113. Zheng, B., Zhang, X., Yun, D.: Virtual technology of cache and real-time big data distribution in cloud
computing big data center. Journal of Intelligent & Fuzzy Systems 39(6), 8917–8925 (2020).
doi:10.3233/JIFS-189289
114. Peipeng, Y., Xia, Z., Fei, J., Jha, S.: An application review of artificial intelligence in prevention and cure of

Riswantini et al. Page 28 of 28
covid-19 pandemic. Computers, Materials & Continua 65, 743–760 (2020). doi:10.32604/cmc.2020.011391
115. Jimenez, A.J., Estevez-Reboredo, R.M., Santed, M.A., V., R.: Covid-19 symptom-related google searches and
local covid-19 incidence in spain: Correlational study. Journal of Medical Internet Research 22(12) (2020).
doi:10.2196/23518
116. Chen, L.-C., Chang, K.-H., Chung, H.-Y.: A novel statistic-based corpus machine processing approach to
refine a big textual data: An esp case of covid-19 news reports. Applied Sciences 10, 5505 (2020).
doi:10.3390/app10165505

Figures
Figure 1
Selection process of the literature review.
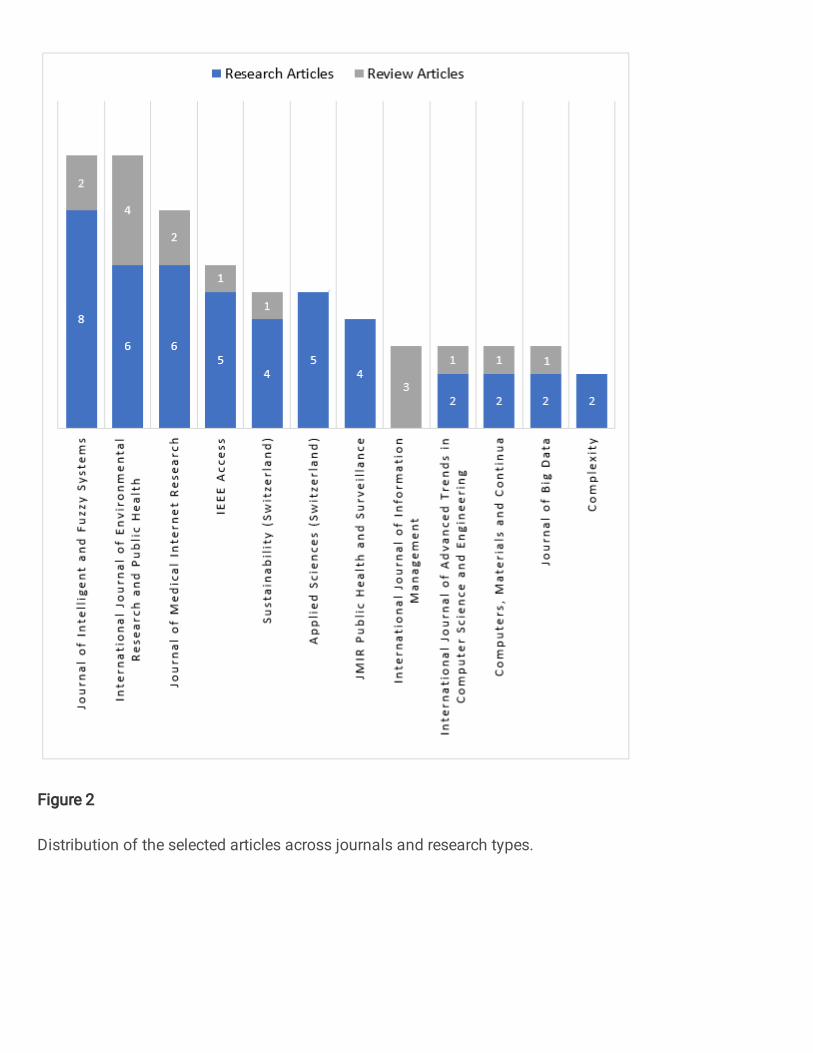
Figure 2
Distribution of the selected articles across journals and research types.

Figure 3
Word cloud of the abstracts of the selected articles.

Figure 4
Keywords relationship of the selected articles.

Figure 5
Knowledge mapping of the methods and application of the COVID-19 research
Figure 6
SIR and SEIR model

Figure 7
Modi�cation of the SEIR model[39]
Figure 8
Modi�cation of the SEIR model [78]
Supplementary Files
This is a list of supplementary �les associated with this preprint. Click to download.
surveybigdatacovid.tex