a synopsis of sound - image transforms based on the ... · a synopsis of sound - image transforms...
TRANSCRIPT
A Synopsis of Sound - Image Transforms based on the Chromaticism
of Music
DIONYSIOS POLITIS, DIMITRIOS MARGOUNAKIS
Department of Informatics
Aristotle University of Thessaloniki
University Campus, Thessaloniki, GR-541 24
GREECE
{dpolitis,margoun}@csd.auth.gr http://www.csd.auth.gr
Abstract: - Numerous algorithms have been proposed for image to sound and sound to image transforms.
Based on heuristic assignments of sound frequencies to RGB values, they perform effective mappings between
musical entities (notes) and values for optical wavelengths. In this paper, the chromaticism of the sound
domain is taken into account and the coloring of the performed music is depicted for interrelated sound
segments that have acoustic polymorphism and form entities of pitch organization. This algorithm helps
visualize musical files according to their melodic structure and not only according to their temporal
characteristics (i.e. rhythm).
Key-Words: - Sound to Image Transforms, Visualizations, Chromatic Index of Music.
1 Introduction Sounds are perceived as one dimensional signals
whereas images are though as entities with more
dimensions. Indeed, all the sounds that the human
auditory channel may perceive are assorted within
the 50 Hz – 20 kHz frequency range. Therefore,
sound signals, and especially the musical ones, are
characterized by a vector v = (f, ∆t) depicting their
frequency and their duration. In terms of music
perception this seems to be a coarse approach,
waiving the artistic dimension of music as a
performing art; however, it has served as the basis
for developing algorithms for sound to image and
image to sound transforms.
On the other end, images are signals
characterized by a frequency within the optical
range, or, as it has been the tradition in Physics, with
a wavelength λ. According to the International
Commission on Illumination (CIE) any real colour
can be expressed as a mixture of three CIE primaries
X, Y, Z [22]. Therefore, a given colour C of
wavelength λ can be expressed by (1):
Cλ = XX + YY + ZZ (1)
where the coefficients XYZ, called tristimulus
values, can be calculated using the CIE colour
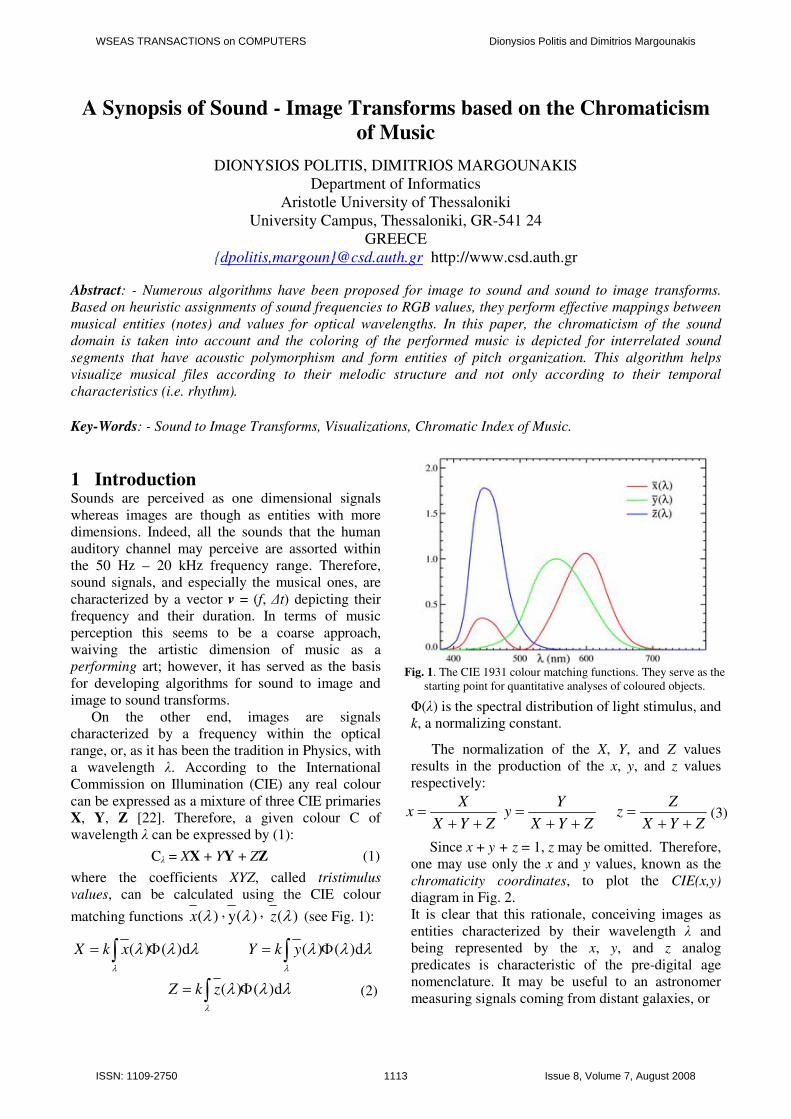
matching functions )(λx , )(y λ , )(λz (see Fig. 1):
λλλλ
d)()( Φ= ∫ xkX
λλλλ
d)()( Φ= ∫ ykY
λλλλ
d)()( Φ= ∫ zkZ
(2)
Φ(λ) is the spectral distribution of light stimulus, and
k, a normalizing constant.
The normalization of the X, Y, and Z values
results in the production of the x, y, and z values
respectively:
ZYX
Xx
++=
ZYX
Yy
++=
ZYX
Zz
++= (3)
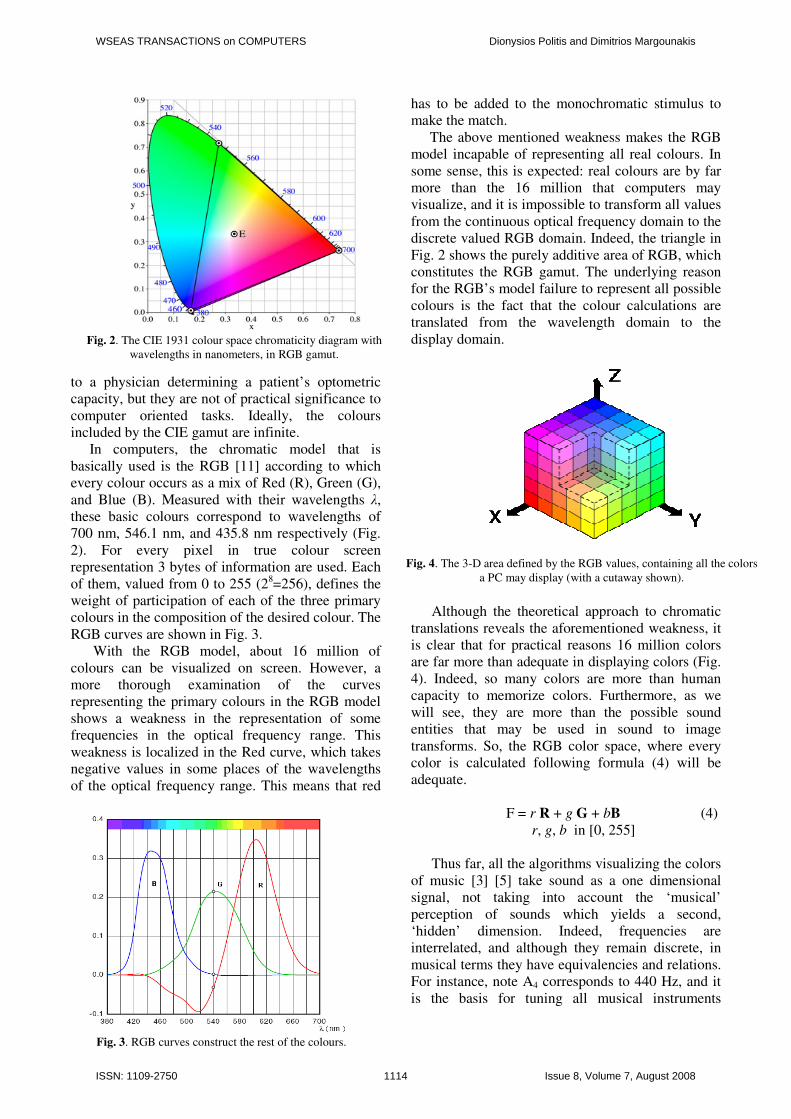
Since x + y + z = 1, z may be omitted. Therefore,
one may use only the x and y values, known as the
chromaticity coordinates, to plot the CIE(x,y)
diagram in Fig. 2.
It is clear that this rationale, conceiving images as
entities characterized by their wavelength λ and
being represented by the x, y, and z analog
predicates is characteristic of the pre-digital age
nomenclature. It may be useful to an astronomer
measuring signals coming from distant galaxies, or
Fig. 1. The CIE 1931 colour matching functions. They serve as the
starting point for quantitative analyses of coloured objects.
WSEAS TRANSACTIONS on COMPUTERS
Dionysios Politis and Dimitrios Margounakis
ISSN: 1109-2750 1113 Issue 8, Volume 7, August 2008
to a physician determining a patient’s optometric
capacity, but they are not of practical significance to
computer oriented tasks. Ideally, the colours
included by the CIE gamut are infinite.
In computers, the chromatic model that is
basically used is the RGB [11] according to which
every colour occurs as a mix of Red (R), Green (G),
and Blue (B). Measured with their wavelengths λ,
these basic colours correspond to wavelengths of
700 nm, 546.1 nm, and 435.8 nm respectively (Fig.
2). For every pixel in true colour screen
representation 3 bytes of information are used. Each
of them, valued from 0 to 255 (28=256), defines the
weight of participation of each of the three primary
colours in the composition of the desired colour. The
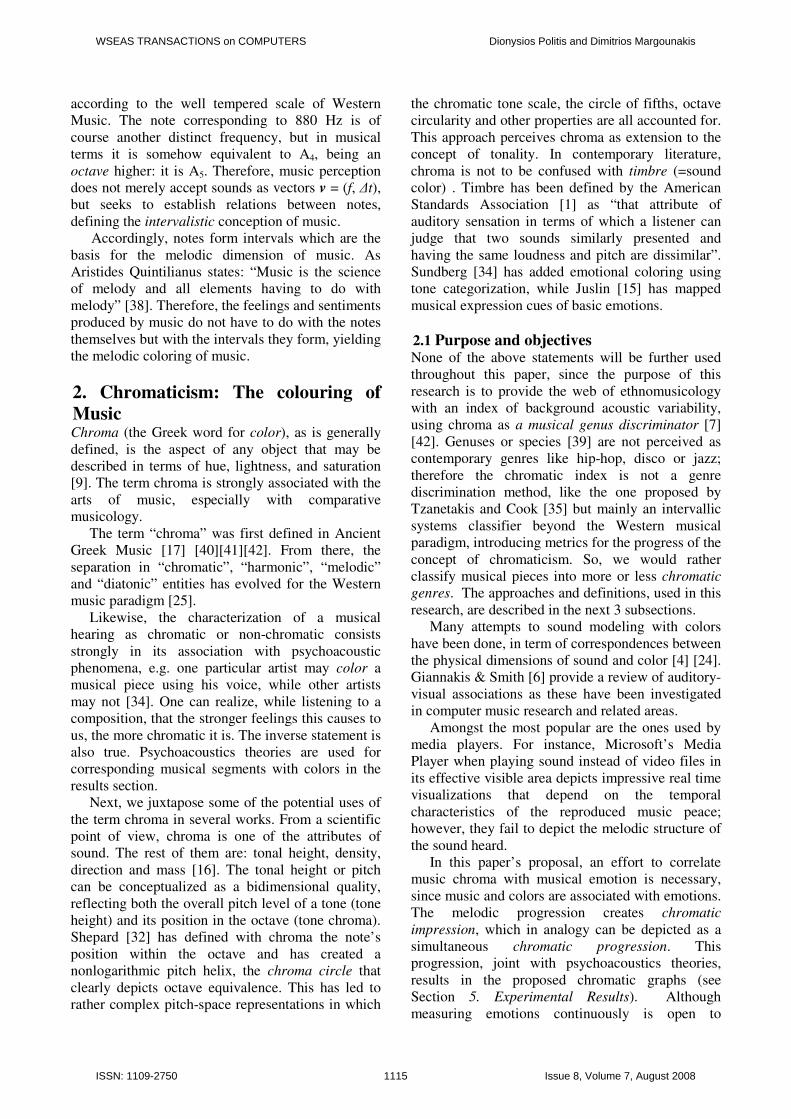
RGB curves are shown in Fig. 3.
With the RGB model, about 16 million of
colours can be visualized on screen. However, a
more thorough examination of the curves
representing the primary colours in the RGB model
shows a weakness in the representation of some
frequencies in the optical frequency range. This
weakness is localized in the Red curve, which takes
negative values in some places of the wavelengths
of the optical frequency range. This means that red
has to be added to the monochromatic stimulus to
make the match.
The above mentioned weakness makes the RGB
model incapable of representing all real colours. In
some sense, this is expected: real colours are by far
more than the 16 million that computers may
visualize, and it is impossible to transform all values
from the continuous optical frequency domain to the
discrete valued RGB domain. Indeed, the triangle in
Fig. 2 shows the purely additive area of RGB, which
constitutes the RGB gamut. The underlying reason
for the RGB’s model failure to represent all possible
colours is the fact that the colour calculations are
translated from the wavelength domain to the
display domain.
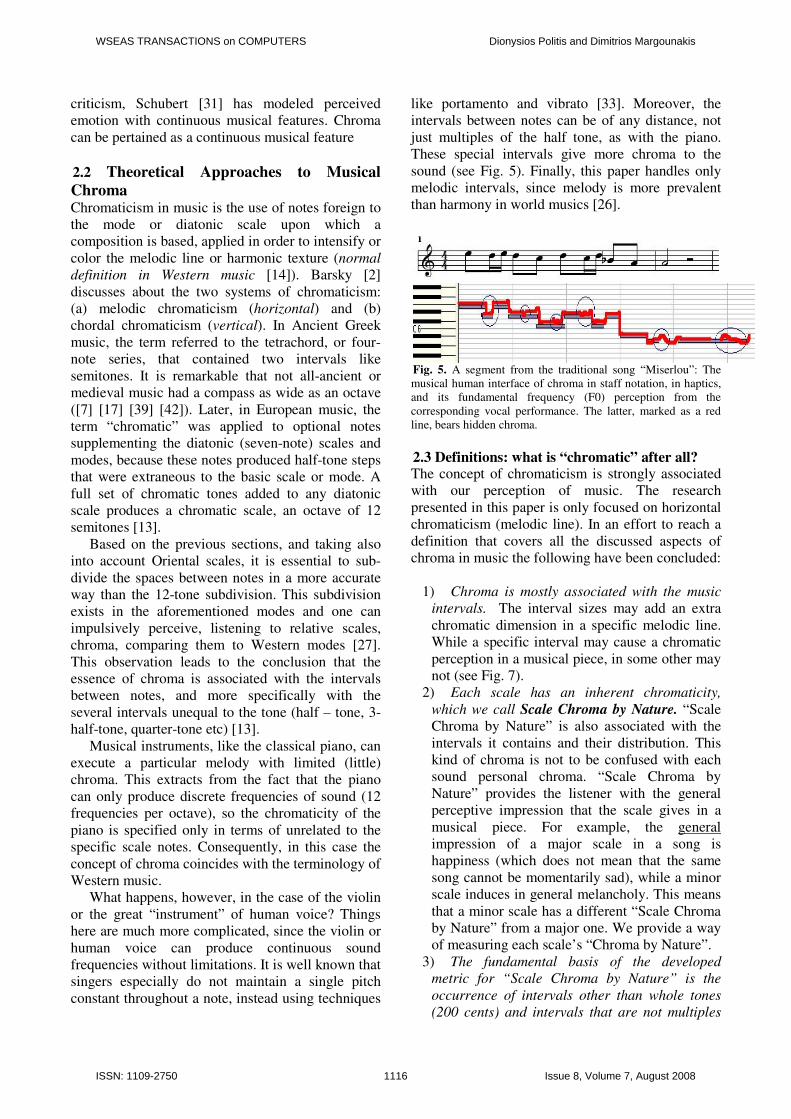
Although the theoretical approach to chromatic
translations reveals the aforementioned weakness, it
is clear that for practical reasons 16 million colors
are far more than adequate in displaying colors (Fig.
4). Indeed, so many colors are more than human
capacity to memorize colors. Furthermore, as we
will see, they are more than the possible sound
entities that may be used in sound to image
transforms. So, the RGB color space, where every
color is calculated following formula (4) will be
adequate.
F = r R + g G + bB (4)
r, g, b in [0, 255]
Thus far, all the algorithms visualizing the colors
of music [3] [5] take sound as a one dimensional
signal, not taking into account the ‘musical’
perception of sounds which yields a second,
‘hidden’ dimension. Indeed, frequencies are
interrelated, and although they remain discrete, in
musical terms they have equivalencies and relations.
For instance, note A4 corresponds to 440 Hz, and it
is the basis for tuning all musical instruments
Fig. 4. The 3-D area defined by the RGB values, containing all the colors
a PC may display (with a cutaway shown).
Fig. 2. The CIE 1931 colour space chromaticity diagram with
wavelengths in nanometers, in RGB gamut.
Fig. 3. RGB curves construct the rest of the colours.
WSEAS TRANSACTIONS on COMPUTERS Dionysios Politis and Dimitrios Margounakis
ISSN: 1109-2750 1114 Issue 8, Volume 7, August 2008
according to the well tempered scale of Western
Music. The note corresponding to 880 Hz is of
course another distinct frequency, but in musical
terms it is somehow equivalent to A4, being an
octave higher: it is A5. Therefore, music perception
does not merely accept sounds as vectors v = (f, ∆t),
but seeks to establish relations between notes,
defining the intervalistic conception of music.
Accordingly, notes form intervals which are the
basis for the melodic dimension of music. As
Aristides Quintilianus states: “Music is the science
of melody and all elements having to do with
melody” [38]. Therefore, the feelings and sentiments
produced by music do not have to do with the notes
themselves but with the intervals they form, yielding
the melodic coloring of music.
2. Chromaticism: The colouring of
Music Chroma (the Greek word for color), as is generally
defined, is the aspect of any object that may be
described in terms of hue, lightness, and saturation
[9]. The term chroma is strongly associated with the
arts of music, especially with comparative
musicology.
The term “chroma” was first defined in Ancient
Greek Music [17] [40][41][42]. From there, the
separation in “chromatic”, “harmonic”, “melodic”
and “diatonic” entities has evolved for the Western
music paradigm [25].
Likewise, the characterization of a musical
hearing as chromatic or non-chromatic consists
strongly in its association with psychoacoustic
phenomena, e.g. one particular artist may color a
musical piece using his voice, while other artists
may not [34]. One can realize, while listening to a
composition, that the stronger feelings this causes to
us, the more chromatic it is. The inverse statement is
also true. Psychoacoustics theories are used for
corresponding musical segments with colors in the
results section.
Next, we juxtapose some of the potential uses of
the term chroma in several works. From a scientific
point of view, chroma is one of the attributes of
sound. The rest of them are: tonal height, density,
direction and mass [16]. The tonal height or pitch
can be conceptualized as a bidimensional quality,
reflecting both the overall pitch level of a tone (tone
height) and its position in the octave (tone chroma).
Shepard [32] has defined with chroma the note’s
position within the octave and has created a
nonlogarithmic pitch helix, the chroma circle that
clearly depicts octave equivalence. This has led to
rather complex pitch-space representations in which
the chromatic tone scale, the circle of fifths, octave
circularity and other properties are all accounted for.
This approach perceives chroma as extension to the
concept of tonality. In contemporary literature,
chroma is not to be confused with timbre (=sound
color) . Timbre has been defined by the American
Standards Association [1] as “that attribute of
auditory sensation in terms of which a listener can
judge that two sounds similarly presented and
having the same loudness and pitch are dissimilar”.
Sundberg [34] has added emotional coloring using
tone categorization, while Juslin [15] has mapped
musical expression cues of basic emotions.
2.1 Purpose and objectives None of the above statements will be further used
throughout this paper, since the purpose of this
research is to provide the web of ethnomusicology
with an index of background acoustic variability,
using chroma as a musical genus discriminator [7]
[42]. Genuses or species [39] are not perceived as
contemporary genres like hip-hop, disco or jazz;
therefore the chromatic index is not a genre
discrimination method, like the one proposed by
Tzanetakis and Cook [35] but mainly an intervallic
systems classifier beyond the Western musical
paradigm, introducing metrics for the progress of the
concept of chromaticism. So, we would rather
classify musical pieces into more or less chromatic
genres. The approaches and definitions, used in this
research, are described in the next 3 subsections.
Many attempts to sound modeling with colors
have been done, in term of correspondences between
the physical dimensions of sound and color [4] [24].
Giannakis & Smith [6] provide a review of auditory-
visual associations as these have been investigated
in computer music research and related areas.
Amongst the most popular are the ones used by
media players. For instance, Microsoft’s Media
Player when playing sound instead of video files in
its effective visible area depicts impressive real time
visualizations that depend on the temporal
characteristics of the reproduced music peace;
however, they fail to depict the melodic structure of
the sound heard.
In this paper’s proposal, an effort to correlate
music chroma with musical emotion is necessary,
since music and colors are associated with emotions.
The melodic progression creates chromatic
impression, which in analogy can be depicted as a
simultaneous chromatic progression. This
progression, joint with psychoacoustics theories,
results in the proposed chromatic graphs (see
Section 5. Experimental Results). Although
measuring emotions continuously is open to
WSEAS TRANSACTIONS on COMPUTERS Dionysios Politis and Dimitrios Margounakis
ISSN: 1109-2750 1115 Issue 8, Volume 7, August 2008
criticism, Schubert [31] has modeled perceived
emotion with continuous musical features. Chroma
can be pertained as a continuous musical feature
2.2 Theoretical Approaches to Musical
Chroma Chromaticism in music is the use of notes foreign to
the mode or diatonic scale upon which a
composition is based, applied in order to intensify or
color the melodic line or harmonic texture (normal
definition in Western music [14]). Barsky [2]
discusses about the two systems of chromaticism:
(a) melodic chromaticism (horizontal) and (b)
chordal chromaticism (vertical). In Ancient Greek
music, the term referred to the tetrachord, or four-
note series, that contained two intervals like
semitones. It is remarkable that not all-ancient or
medieval music had a compass as wide as an octave
([7] [17] [39] [42]). Later, in European music, the
term “chromatic” was applied to optional notes
supplementing the diatonic (seven-note) scales and
modes, because these notes produced half-tone steps
that were extraneous to the basic scale or mode. A
full set of chromatic tones added to any diatonic
scale produces a chromatic scale, an octave of 12
semitones [13].
Based on the previous sections, and taking also
into account Oriental scales, it is essential to sub-
divide the spaces between notes in a more accurate
way than the 12-tone subdivision. This subdivision
exists in the aforementioned modes and one can
impulsively perceive, listening to relative scales,
chroma, comparing them to Western modes [27].
This observation leads to the conclusion that the
essence of chroma is associated with the intervals
between notes, and more specifically with the
several intervals unequal to the tone (half – tone, 3-
half-tone, quarter-tone etc) [13].
Musical instruments, like the classical piano, can
execute a particular melody with limited (little)
chroma. This extracts from the fact that the piano
can only produce discrete frequencies of sound (12
frequencies per octave), so the chromaticity of the
piano is specified only in terms of unrelated to the
specific scale notes. Consequently, in this case the
concept of chroma coincides with the terminology of
Western music.
What happens, however, in the case of the violin
or the great “instrument” of human voice? Things
here are much more complicated, since the violin or
human voice can produce continuous sound
frequencies without limitations. It is well known that
singers especially do not maintain a single pitch
constant throughout a note, instead using techniques
like portamento and vibrato [33]. Moreover, the
intervals between notes can be of any distance, not
just multiples of the half tone, as with the piano.
These special intervals give more chroma to the
sound (see Fig. 5). Finally, this paper handles only
melodic intervals, since melody is more prevalent
than harmony in world musics [26].
Fig. 5. A segment from the traditional song “Miserlou”: The
musical human interface of chroma in staff notation, in haptics,
and its fundamental frequency (F0) perception from the
corresponding vocal performance. The latter, marked as a red
line, bears hidden chroma.
2.3 Definitions: what is “chromatic” after all? The concept of chromaticism is strongly associated
with our perception of music. The research
presented in this paper is only focused on horizontal
chromaticism (melodic line). In an effort to reach a
definition that covers all the discussed aspects of
chroma in music the following have been concluded:
1) Chroma is mostly associated with the music
intervals. The interval sizes may add an extra
chromatic dimension in a specific melodic line.
While a specific interval may cause a chromatic
perception in a musical piece, in some other may
not (see Fig. 7).
2) Each scale has an inherent chromaticity,
which we call Scale Chroma by Nature. “Scale
Chroma by Nature” is also associated with the
intervals it contains and their distribution. This
kind of chroma is not to be confused with each
sound personal chroma. “Scale Chroma by
Nature” provides the listener with the general
perceptive impression that the scale gives in a
musical piece. For example, the general
impression of a major scale in a song is
happiness (which does not mean that the same
song cannot be momentarily sad), while a minor
scale induces in general melancholy. This means
that a minor scale has a different “Scale Chroma
by Nature” from a major one. We provide a way
of measuring each scale’s “Chroma by Nature”.
3) The fundamental basis of the developed
metric for “Scale Chroma by Nature” is the
occurrence of intervals other than whole tones
(200 cents) and intervals that are not multiples
WSEAS TRANSACTIONS on COMPUTERS Dionysios Politis and Dimitrios Margounakis
ISSN: 1109-2750 1116 Issue 8, Volume 7, August 2008
of whole tones within a scale. It returns to the
original meaning of the scales some music uses
being “chromatic” (rather than “diatonic” or
“enharmonic”), extending this to allow scales to
be more or less chromatic.
4) A sound in a musical piece is defined as
“chromatic”, as far it is produced out of
intervals, different than the ones, which the scale
that the musical piece is written to contains. This
definition also encompasses the occurrence of
any sound with frequency irrelevant to the
discrete frequencies of the scale in the musical
piece. This is the normal definition of the term
(stated in section 2.2) and should not be
confused with the definition of Scale Chroma by
Nature. A scale can contain itself chromatic
notes and this may result in a greatest “Scale
Chroma by Nature”, but since they are taken into
account in the Scale Chroma Measuring
algorithm, they are considered notes of the
established scale within the piece. So, if a note of
this kind is encountered through the melody of
the piece, it is no more chromatic in context,
which means it does not add any extra chroma to
the one of the scale and furthermore, of the
musical piece in general (see Fig. 6).
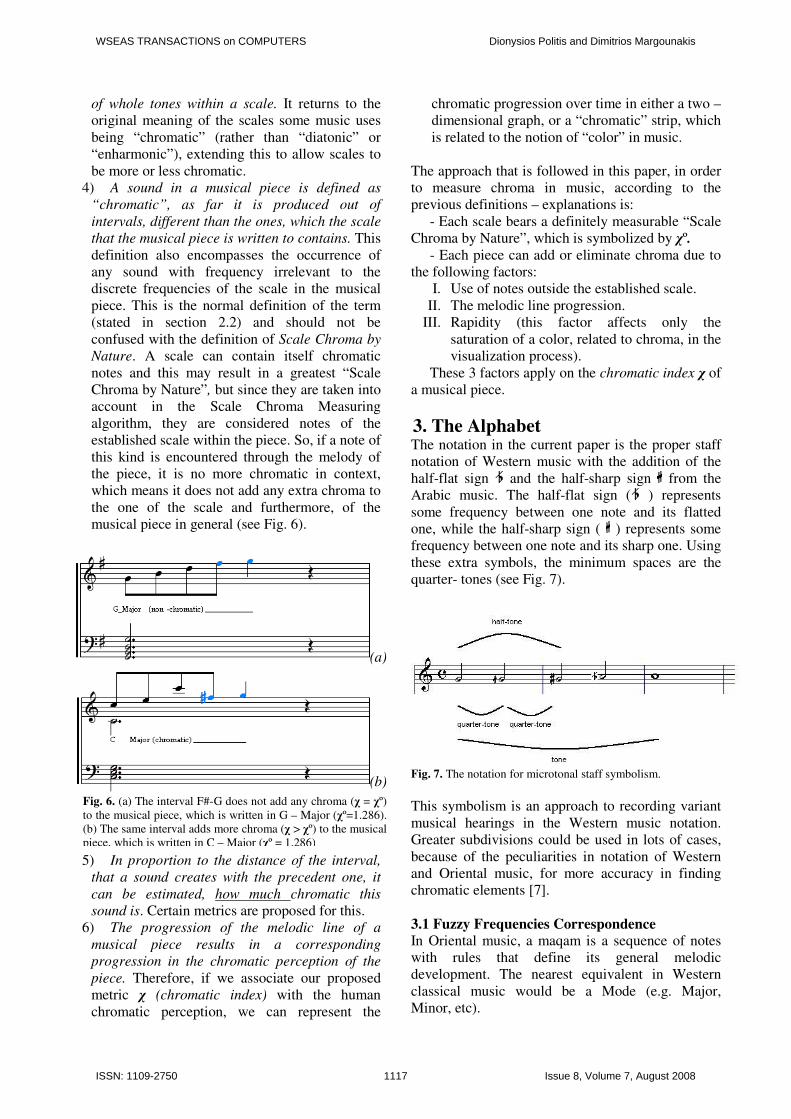
5) In proportion to the distance of the interval,
that a sound creates with the precedent one, it
can be estimated, how much chromatic this
sound is. Certain metrics are proposed for this.
6) The progression of the melodic line of a
musical piece results in a corresponding
progression in the chromatic perception of the
piece. Therefore, if we associate our proposed
metric χ (chromatic index) with the human
chromatic perception, we can represent the
chromatic progression over time in either a two –
dimensional graph, or a “chromatic” strip, which
is related to the notion of “color” in music.
The approach that is followed in this paper, in order
to measure chroma in music, according to the
previous definitions – explanations is:
- Each scale bears a definitely measurable “Scale
Chroma by Nature”, which is symbolized by χº.
- Each piece can add or eliminate chroma due to
the following factors:
I. Use of notes outside the established scale.
II. The melodic line progression.
III. Rapidity (this factor affects only the
saturation of a color, related to chroma, in the
visualization process).
These 3 factors apply on the chromatic index χ of
a musical piece.
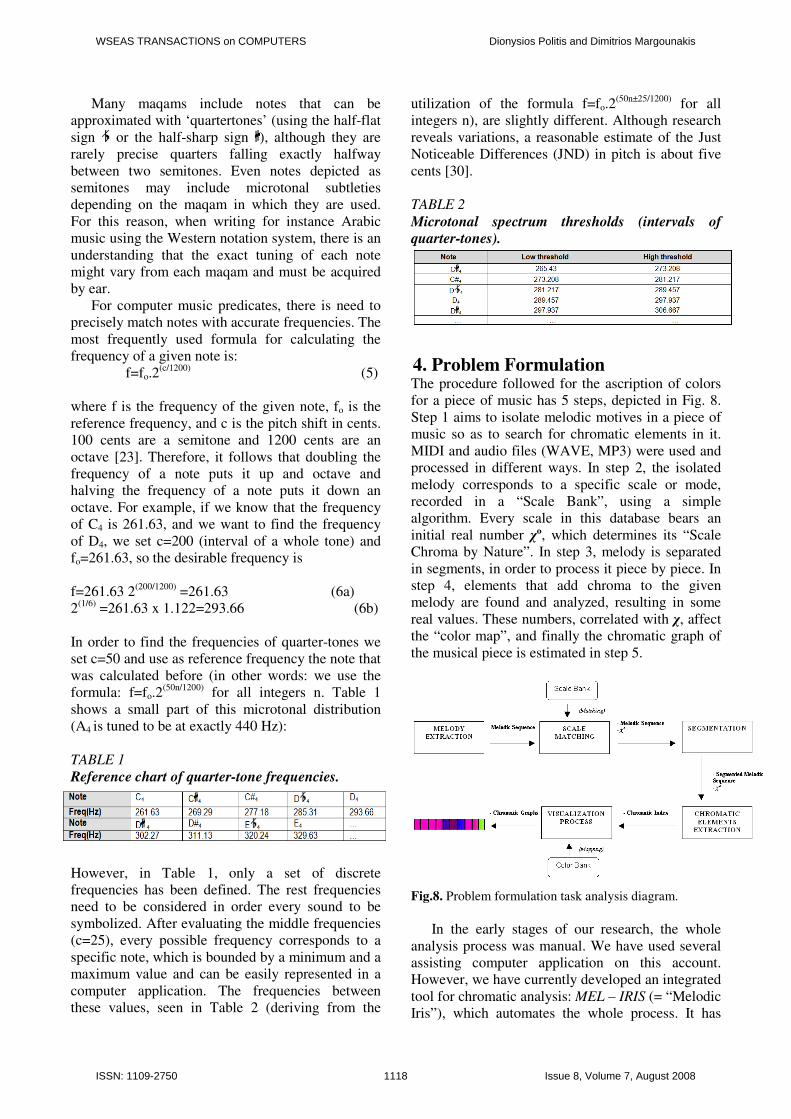
3. The Alphabet The notation in the current paper is the proper staff
notation of Western music with the addition of the
half-flat sign and the half-sharp sign from the
Arabic music. The half-flat sign ( ) represents
some frequency between one note and its flatted
one, while the half-sharp sign ( ) represents some
frequency between one note and its sharp one. Using
these extra symbols, the minimum spaces are the
quarter- tones (see Fig. 7).
Fig. 7. The notation for microtonal staff symbolism.
This symbolism is an approach to recording variant
musical hearings in the Western music notation.
Greater subdivisions could be used in lots of cases,
because of the peculiarities in notation of Western
and Oriental music, for more accuracy in finding
chromatic elements [7].
3.1 Fuzzy Frequencies Correspondence In Oriental music, a maqam is a sequence of notes
with rules that define its general melodic
development. The nearest equivalent in Western
classical music would be a Mode (e.g. Major,
Minor, etc).
(a)
(b)
Fig. 6. (a) The interval F#-G does not add any chroma (χ = χº)
to the musical piece, which is written in G – Major (χº=1.286).
(b) The same interval adds more chroma (χ > χº) to the musical
piece, which is written in C – Major (χº = 1.286)
WSEAS TRANSACTIONS on COMPUTERS Dionysios Politis and Dimitrios Margounakis
ISSN: 1109-2750 1117 Issue 8, Volume 7, August 2008
Many maqams include notes that can be
approximated with ‘quartertones’ (using the half-flat
sign or the half-sharp sign ), although they are
rarely precise quarters falling exactly halfway
between two semitones. Even notes depicted as
semitones may include microtonal subtleties
depending on the maqam in which they are used.
For this reason, when writing for instance Arabic
music using the Western notation system, there is an
understanding that the exact tuning of each note
might vary from each maqam and must be acquired
by ear.
For computer music predicates, there is need to
precisely match notes with accurate frequencies. The
most frequently used formula for calculating the
frequency of a given note is:
f=fo.2(c/1200)
(5)
where f is the frequency of the given note, fo is the
reference frequency, and c is the pitch shift in cents.
100 cents are a semitone and 1200 cents are an
octave [23]. Therefore, it follows that doubling the
frequency of a note puts it up and octave and
halving the frequency of a note puts it down an
octave. For example, if we know that the frequency
of C4 is 261.63, and we want to find the frequency
of D4, we set c=200 (interval of a whole tone) and
fo=261.63, so the desirable frequency is
f=261.63 2(200/1200)
=261.63 (6a)
2(1/6)
=261.63 x 1.122=293.66 (6b)
In order to find the frequencies of quarter-tones we
set c=50 and use as reference frequency the note that
was calculated before (in other words: we use the
formula: f=fo.2(50n/1200)
for all integers n. Table 1
shows a small part of this microtonal distribution
(A4 is tuned to be at exactly 440 Hz):
TABLE 1
Reference chart of quarter-tone frequencies.
However, in Table 1, only a set of discrete
frequencies has been defined. The rest frequencies
need to be considered in order every sound to be
symbolized. After evaluating the middle frequencies
(c=25), every possible frequency corresponds to a
specific note, which is bounded by a minimum and a
maximum value and can be easily represented in a
computer application. The frequencies between
these values, seen in Table 2 (deriving from the
utilization of the formula f=fo.2(50n±25/1200)
for all
integers n), are slightly different. Although research
reveals variations, a reasonable estimate of the Just
Noticeable Differences (JND) in pitch is about five
cents [30].
TABLE 2
Microtonal spectrum thresholds (intervals of
quarter-tones).
4. Problem Formulation The procedure followed for the ascription of colors
for a piece of music has 5 steps, depicted in Fig. 8.
Step 1 aims to isolate melodic motives in a piece of
music so as to search for chromatic elements in it.
MIDI and audio files (WAVE, MP3) were used and
processed in different ways. In step 2, the isolated
melody corresponds to a specific scale or mode,
recorded in a “Scale Bank”, using a simple
algorithm. Every scale in this database bears an
initial real number χº, which determines its “Scale
Chroma by Nature”. In step 3, melody is separated
in segments, in order to process it piece by piece. In
step 4, elements that add chroma to the given
melody are found and analyzed, resulting in some
real values. These numbers, correlated with χ, affect
the “color map”, and finally the chromatic graph of
the musical piece is estimated in step 5.
Fig.8. Problem formulation task analysis diagram.
In the early stages of our research, the whole
analysis process was manual. We have used several
assisting computer application on this account.
However, we have currently developed an integrated
tool for chromatic analysis: MEL – IRIS (= “Melodic
Iris”), which automates the whole process. It has
WSEAS TRANSACTIONS on COMPUTERS Dionysios Politis and Dimitrios Margounakis
ISSN: 1109-2750 1118 Issue 8, Volume 7, August 2008

been programmed using C++ user interface routines
over Matlab analysis functions. The aim of this
paper is to present the theoretical background of our
work and not technological details on MEL-IRIS,
although some discussion about it qualifies as
necessary.
An important observation for the framework of
MEL-IRIS is that the whole analysis process is
almost absolutely serial. This means that one step's
output is the input to the next step. The instant
consequence is that each step's function is
autonomous and self – independent. Therefore, each
function can be treated in a different way and
modified without affecting the total system's
performance. This is really important, since MEL-
IRIS executes functions that come under critical
research areas of growing interest, where an
accepted integrated solution of the problem has not
yet been found. Such fields are, for example, the
melody extraction out of Audio files, the scale
finding from an Audio musical piece or the
segmentation of melody. Because the essence of the
research in music chromaticism lies not on these
pieces, but on the extraction and vizualization of
chromatic parameters, their implementation has
been carried out using elementary algorithms, based
on some important aspects of the corresponding
research area. However, there is the capability of
easily replacing them with more complete,
documented and audited research outgrowths (as it
was mentioned before).
4.1 Input Management It is obvious that the procedure for melody isolation
is non-identical for MIDI and audio files. The
separation of melody from accompaniment is an
area of current research in Music Information
Retrieval. Recently several predominant pitch
detection models and algorithms have been
proposed for polyphonic audio [10] [18] [20].
4.1.1 MIDI files In MIDI files it is simple for the melody to be
isolated, since in a well-orchestrated MIDI
composition, melody can be usually found in some
track, which often bears the label “melody”. We
have used Cakewalk Music Creator 2003 and easily
extracted melodies from several MIDI files. In some
cases, greater effort was needed in order to
recognize and isolate the melody, e.g. in some 1-
track piano pieces. Nevertheless, no special
difficulties were encountered at this part of the
project.
4.1.2 Audio files Things were not that clear as when analyzing audio
files, since scores could not be directly extracted
from the musical piece. Although in our early
experiments we have used Sonic Foundry’s
SoundForge 7 and MatLab 7 for sonogram analysis,
the development of MEL-IRIS led to an automatic
FFT transform on audio signals and peak selection
out of them. In recordings where melody (or singer’s
voice) surpassed accompaniment, we have managed
to get (in a very good approach) the frequency
sequence of melody. Spectral analysis of music has
yet been discussed in several works [19] [21]. The
analysis proved to be easier in recordings with little
(or without) accompaniment, while in ‘tough’
orchestrations difficulties were encountered in
configuring loudness and display range settings on
the FFT sonogram. A detailed description of those
settings configuration disqualifies as necessary at
this paper. Directly related to this is the query of
how many simultaneous melodies may be
transcribed by a skilled human transcriber. This is
the “Principle of Limited Density” for which Huron
[12] states that “…If a composer intends to write
music in which independent parts are easily
distinguished, then the number of concurrent voices
or parts ought to be kept to three or fewer.”
The results of step 1 analysis for one MIDI and
one audio file are shown in Table 3 containing the
frequencies sequence for the first 9 events of each
melody. These frequencies (which are considered as
melody notes) are chosen for extraction according to
some clues that music perception research provides
us. Typically, the highest-pitch notes would be
classed as the melody notes unless they are
monotonous. On the other hand, the lowest-pitch
notes usually correspond to drum percussion, so
they are ignored. For other notes to be identified as
the melody, various compositional tricks need to be
applied such as making it much louder than the
accompanying notes and making use of a single
timbre throughout the melodic phrase [36]. On that
case, the sequence of frequencies is produced with
sampling of frequencies that bear the highest volume
(the darkest peaks on the 3-D graph) at a specific
time. We use very short pre-defined time intervals
for the sampling (250 ms by default).
4.2 The Database After the ending of the analysis process on a musical
piece, MEL-IRIS stores the results in the
“MELIRIS” database, which is structured on
Microsoft SQL server.
WSEAS TRANSACTIONS on COMPUTERS Dionysios Politis and Dimitrios Margounakis
ISSN: 1109-2750 1119 Issue 8, Volume 7, August 2008
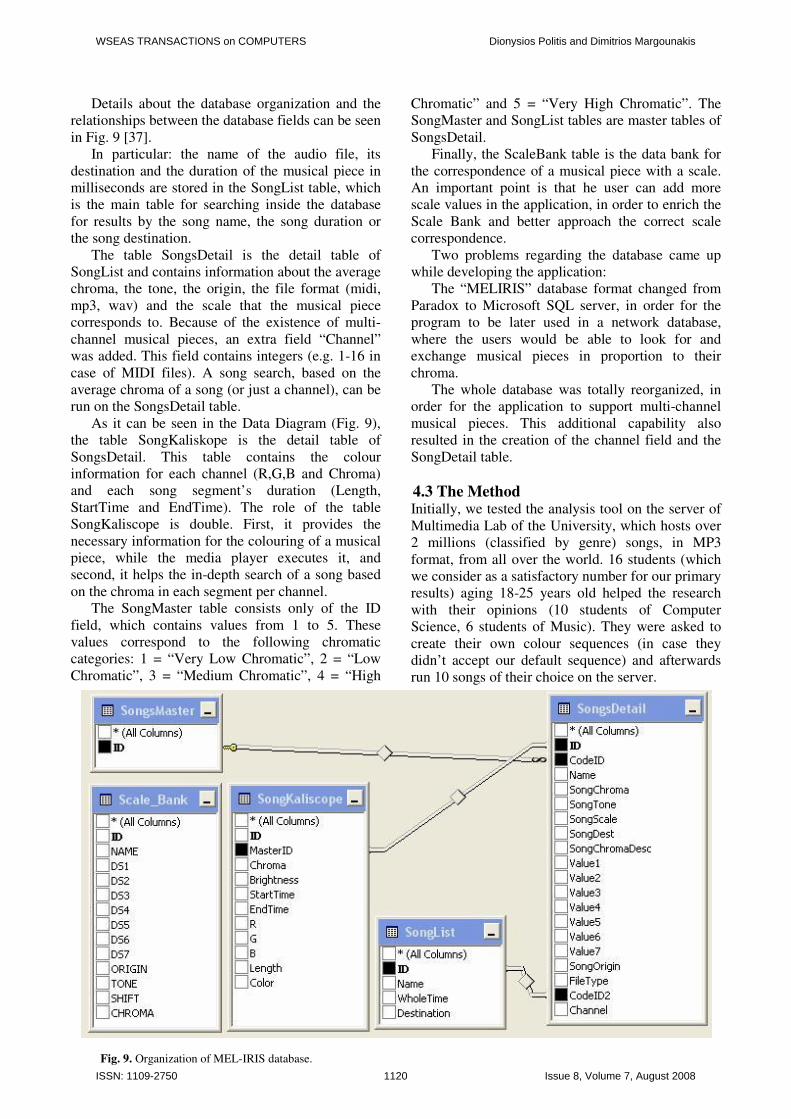
Details about the database organization and the
relationships between the database fields can be seen
in Fig. 9 [37].
In particular: the name of the audio file, its
destination and the duration of the musical piece in
milliseconds are stored in the SongList table, which
is the main table for searching inside the database
for results by the song name, the song duration or
the song destination.
The table SongsDetail is the detail table of
SongList and contains information about the average
chroma, the tone, the origin, the file format (midi,
mp3, wav) and the scale that the musical piece
corresponds to. Because of the existence of multi-
channel musical pieces, an extra field “Channel”
was added. This field contains integers (e.g. 1-16 in
case of MIDI files). A song search, based on the
average chroma of a song (or just a channel), can be
run on the SongsDetail table.
As it can be seen in the Data Diagram (Fig. 9),
the table SongKaliskope is the detail table of
SongsDetail. This table contains the colour
information for each channel (R,G,B and Chroma)
and each song segment’s duration (Length,
StartTime and EndTime). The role of the table
SongKaliscope is double. First, it provides the
necessary information for the colouring of a musical
piece, while the media player executes it, and
second, it helps the in-depth search of a song based
on the chroma in each segment per channel.
The SongMaster table consists only of the ID
field, which contains values from 1 to 5. These
values correspond to the following chromatic
categories: 1 = “Very Low Chromatic”, 2 = “Low
Chromatic”, 3 = “Medium Chromatic”, 4 = “High
Chromatic” and 5 = “Very High Chromatic”. The
SongMaster and SongList tables are master tables of
SongsDetail.
Finally, the ScaleBank table is the data bank for
the correspondence of a musical piece with a scale.
An important point is that he user can add more
scale values in the application, in order to enrich the
Scale Bank and better approach the correct scale
correspondence.
Two problems regarding the database came up
while developing the application:
The “MELIRIS” database format changed from
Paradox to Microsoft SQL server, in order for the
program to be later used in a network database,
where the users would be able to look for and
exchange musical pieces in proportion to their
chroma.
The whole database was totally reorganized, in
order for the application to support multi-channel
musical pieces. This additional capability also
resulted in the creation of the channel field and the
SongDetail table.
4.3 The Method
Initially, we tested the analysis tool on the server of
Multimedia Lab of the University, which hosts over
2 millions (classified by genre) songs, in MP3
format, from all over the world. 16 students (which
we consider as a satisfactory number for our primary
results) aging 18-25 years old helped the research
with their opinions (10 students of Computer
Science, 6 students of Music). They were asked to
create their own colour sequences (in case they
didn’t accept our default sequence) and afterwards
run 10 songs of their choice on the server.
Fig. 9. Organization of MEL-IRIS database.
WSEAS TRANSACTIONS on COMPUTERS Dionysios Politis and Dimitrios Margounakis
ISSN: 1109-2750 1120 Issue 8, Volume 7, August 2008

In this paper, we present the results form the
chromatic analysis of a sample of 407 MP3 songs
that were randomly chosen and initially scattered in
12 genres.
Due to space constraints we cannot display or
discuss the full statistics for the sample. We will
thus pick up a few examples, in order to demonstrate
some fundamental functions of MIR using colours.
We will (i) examine the common attributes of the
songs in each of the categories mentioned before,
(ii) apply filtering queries on the sample, and (iii) try
to detect similarities (from a psycho-acoustic and a
musicological perspective) in songs that resulted in
congener chromatic graphs.
The full experimental results are available for
further exploration at:
http://www.csd.auth.gr/~dpolitis/MEL-IRIS
4.4 Experimental Results Table 3 shows summarized statistics for each of the
12 genres of the sample. Although some genres
contain only a few songs and are therefore not
recommended for general conclusions, we can make
some observations on the numbers.
Table 3. Summarized statistics of the sample.
GENRE # Songs Ch. Avg
Classic 75 2,413
Dance 7 1,888
Hip Hop 44 1,890
Metal 13 1,856
Pop 51 2,127
Rock 15 1,869
Greek Old Classics 15 2,517
Greek Traditional 4 2,232
Rebetico 53 2,085
Instrumental 50 2,083
Ecclesiastical 47 2,196
Ethnic 33 2,061
TOTAL 407 2,2
Taking into account the genres that contain over
30 songs, we can observe that the most chromatic
genre is classical music. In Fig. 10(a), we can see
that there is a great variety of chromaticism in the
classical songs of the sample. In contrast, the hip
hop genre (the less chromatic from the considered
genres) shows no such variation with the most of the
tested songs belonging to an orange tint of about
χ=1,6 which corresponds between “Very Low
Chromatic” (χ=1) and “Low Chromatic” (χ=2), as
seen in Fig. 10(c). This is normal, because hip-hop
music is more rhythmic and less (or not at all)
melodic and creates static little chromatic
impression to the audient. Fig. 10(b) shows the
songs distribution of ecclesiastical chants, which is a
very chromatic genre. We can note here that it was
the only genre, where chromatic averages greater
than 3,5 appeared (with an exception of a 3,6
occurrence in classical music).
CLASSICAL
0
2
4
6
8
10
12
1,3
1,5
1,7
1,9
2,1
2,3
2,5
2,7
2,9
3,1
3,3
3,5
3,7
3,9
(a)
ECCLESIASTECAL CHANTS
0
5
10
15
1,3
1,5
1,7
1,9
2,1
2,3
2,5
2,7
2,9
3,1
3,3
3,5
3,7
3,9
(b)
HIP HOP
0
5
10
15
20
1,3
1,5
1,7
1,9
2,1
2,3
2,5
2,7
2,9
3,1
3,3
3,5
3,7
3,9
(c) Fig 10. Songs distribution from the chromatic analysis.
4.4.1 Queries The database has been created for song clustering
based on their chromaticism, which is obtained from
the MEL-IRIS tool. Therefore, the database is useful
for chromatic and statistic search on the server’s
songs.
In particular, the user can search for any genre
and find chromatic similarities in terms of
percentage coverage either in a musical piece’s
segments, or in all processed songs. Moreover,
chromatic analysis diagrams of the pieces in terms
of time can be extracted. MEL-IRIS presents the
percentage of each colour’s occurrence within a
piece and also classifies each song according to its
average chroma. Finally, the user is given the option
to directly reproduce similar patterns of songs for
further observing.
Some of the queries available on MEL-IRIS are:
WSEAS TRANSACTIONS on COMPUTERS Dionysios Politis and Dimitrios Margounakis
ISSN: 1109-2750 1121 Issue 8, Volume 7, August 2008

- Find the top- k songs whose total average chroma
<χ>tot. is χ.
- Find all the songs whose average chroma is
between χ1 and χ2.
- Find all the songs, which have a tint of colour in a
percentage greater than/less than/equal to the n %
of the song.
- Find the n most similar (in terms of colours) songs
to the song.
Fig 11. MEL-IRIS visual display results of the songs: “How
you gonna see me now” – Alice Cooper (top), and “The
trooper” – Iron Maiden (bottom). Both songs belong to the
‘Metal’ genre and have similar chromatic graphs (in terms of
colouring).
The user can produce queries applying values on
the variables of the queries, where:
k: integer
χ, χ1, χ2: float
colour: string (e.g. pink, blue etc.)
n: integer (range: 0-100).
Song: song name
For example, the result of the query “Find the
top-3 songs whose total average is 1,3” in our
database was:
• Smell of Paradise (Sa Trincha)
• Adios Andalusia (Eric Fernandez)
• How fare this spot (Sarah Brightman)
A second demonstration query on our sample was
“Find the 3 most similar songs to the song ‘How you
gonna see me now’ (Alice Cooper)”. The number
one returned song (the best match) was ‘The
trooper’ (Iron Maiden), which also belongs to Metal
songs. Fig. 11 presents the chromatic graphs of the
two songs, while Fig. 12 shows their colours
distribution. The similarity is obvious.
The graphs in Fig. 13 show the chromatic
progression of χ in all the three metal songs returned
from the query. The value range is almost identical
(the third song is ‘Laguna Sunrise’ – Black
Sabbath).
In the tested sample the statistical averages state
that 78% of the songs in the same genre (e.g. pop,
rock) showed the same average chroma on their
graph in a percentage of about 59%. For example,
70 songs in our sample belong in the rock-ballad
genre. 74% out of them had pink as their average
colour in a percentage of 60%.
Fig. 12. Similarity in the percentages of colours for the two
analyzed songs of Fig. 6.
Fig. 13. Sample graphs of the χ progression over time for three
songs of the same genre.
WSEAS TRANSACTIONS on COMPUTERS Dionysios Politis and Dimitrios Margounakis
ISSN: 1109-2750 1122 Issue 8, Volume 7, August 2008

4.4.2 Similarity Patterns Among the several observations on the chromatic
graphs is that several similarities between a song’s
patterns occurred. The similarities were obvious
from the colour and the size of the segments. This is
absolutely natural and predictable, since a song
usually has both identical repetitions (musical
phrase repetition – “physical refrain”) and slightly
varied repetition (musical phrase variation – “fake
refrain”).
In Fig. 14, we can see part of the chromatic graph
of the song “Say something” (James). The checked 3
lines comprise part of the refrain. Watching
carefully on the first and third line, we can observe
two exactly similar patterns.
Fig. 14. Similar patterns extracted from the song “Say
something” – James.
4.4.3 Interviews According to students’ opinions (in a short interview
during and after the experimental task), the
produced colourful stripes were satisfactory for
them in a percentage of 96%. In particular, one
student stated, “the feelings arousing from the visual
representation are too close to the pieces’
aesthetics”. As a whole, the users were amazed by
the musical piece segmentation, as it proved to
‘conceive’ (in an algorithmic way) the musical
alternations, which they acoustically perceived.
It is remarkable that the users observed as a
whole that in many pieces of the same genre
occurred a certain degree of similarity in their
chromatic ascription.
Another experiment was materialized with the
students: We showed them 10 different chromatic
graphs from several genres and one predefined
colour sequence (not the default). Afterwards, we
asked them to recognize which graph corresponds to
each of the 10 songs that we had them to listen in a
random order. The results were very successful. This
proves that the chromatic stripes can really act as a
significant digital signature of a song. Our stripes
database (which successfully indexes the digital
music library) could further be used by anybody
worldwide for searching music that match a specific
colour sequence or a music sample.
5 Image to Sound Conversion Before describing the methods for auditory display
of colourful images, some definitions should be
apposed.
The concepts of “chroma” (which is the
fundamental concept that governs this research) and
chromaticism have been thoroughly discussed in
foregoing papers [28] [29] and by several authors
[2] [7]. The basic principle is that the chromatic
perception of music is affected very much by the
intervallic distances between notes and not the
pitches themselves. Indeed, we can estimate how
much chromatic a musical scale or a melody is by
using the chromatic index χ [28]. This certain
variable is the basic component for creating music
from images in the present paper.
We invented the term ‘chromatic bricks’ in order
to describe the units with which a complete music
piece can be created from colours. The composer
places colourful bricks (just as a bricklayer), which
constitute as a whole the chromatic wall (Fig. 15). A
chromatic brick is to all intents an oblong (filled
with a specific colour) that represents a particular
musical phrase (a sequence of notes of the melody).
Each brick contains the following information: its
colour corresponds to a χi value (1≤ χi ≤ 2.2), which
is translated to certain emotions; and its length,
which defines the time of the particular musical
phrase. In the present paper, durations are
considered as length ratios between bricks and not
as absolute timings. All the bricks as a whole (that is
the chromatic wall) represent the entire melody.
Fig. 15. A Chromatic Wall consists of chromatic bricks with
length L and a chromatic value χi, which corresponds to a
certain colour hue.
5.1 Algorithmic Production of Melody using
Self-Created Bricks According to this method, the composer has to build
the chromatic wall by creating and putting bricks in
place by him. The attributes that a brick needs to be
comprised of are: chroma χ and duration of (these
values are used as input of the algorithm for melody
extraction). Previous to the beginning of bricks
creation, the composer has to define: which scale
shall his piece be written to (in order to define Scale
Chroma by Nature χ0, which corresponds to the
fundamental chroma of the melody) by choosing a
scale from the Scale Bank [29], the tempo of the
WSEAS TRANSACTIONS on COMPUTERS Dionysios Politis and Dimitrios Margounakis
ISSN: 1109-2750 1123 Issue 8, Volume 7, August 2008

piece (in order the melody to be correctly
transcribed to staff notation), and the first note of the
composition (which is the basis for the calculation
of the first brick’s chroma). The first user-defined
note should constrainedly belong to the chosen
scale.
After defining χ0, tempo and the first note, the
first brick (χ1,d1) should be created (χ1 is its
chroma value, and d1 is its duration). Because of the
calculations’ complexity, the presented algorithm is
oriented exclusively towards the χ variable, taking
little into consideration the duration factor. Duration
is counted in terms of notes values for simplicity.
That is: etc. For instance, the brick (1.4 ,
0.5) is a segment containing notes with values equal
to an eighth ( ) and orange as its colour. Data
modulation, so as real-time durations (in ms) is
accepted, is under consideration for future research.
Chromatic synthesis with musical bricks uses the
reverse method of chromatic analysis [28]. However
there is an important issue here: although a musical
piece is analyzed into one and only chromatic graph,
a chromatic representation could result to different
melodic sequences, which can be equally perceived
in terms of feelings. For this preliminary proposal,
10 basic rules are used from the big list of rules for
chromatic analysis with MEL-IRIS [29]. These rules
are related to the use of notes that do not belong to
the chosen scale, and therefore cause the notion of
chromaticism (Table 4).
On the basis of these rules, we observe that the
first four rules concern the χ increment; the next five
rules concern the χ decrease, while the last rule is
about the same χ value (the brick bears the same
colour to the previous brick)1. Consequently, it is
proper to use the first four rules in case of bricks
with greater χ than the previous brick’s χ. Likewise,
rules 5 – 9 are applied to bricks with less χ than the
previous brick’s χ. Finally, the last rule is triggered
whenever a similar (in terms of colour) brick to the
previous one is created.
Let a brick contain n musical units2
(m1,m2,…,mn). Each musical unit is assigned to a
chroma value χmi (for i=1,2,…,n) based on the
interval which is created with the previous musical
unit (according to the rules of Table 1). The
1 The table values are evident of psycho-acoustic experiments
and have been finally selected because they match well with our
colours – music correspondence. Farther analysis of the
particular theory disqualifies as necessary in this paper. 2 The term ‘musical units’ is used instead of ‘notes’, because of
rule 4, which concerns more than a note. One musical unit is
equal to a note for all other rules.
chromatic index of brick j (χj) is equal to the average
of χmi (i=1,2,…,n) of the musical units it contains:
n
n
i
m
j
i∑== 1
χχ (7)
Table 4: Rules for the chromatic variable’s χ transition in
the colour space of an image.
Rule Intervals χ transition Constraints
1 Chromatic semitones *1.01 -
2 Chromatic 3/2-tone *1.03 -
3 Chromatic quarter-
tones
*1.04 -
4 Part of chromatic
scale (N notes, N≥3)
*(1+0.01*N) -
5 Chromatic integer
multiples of tone
%1.005 -
6 Chromatic tones %1.01 -
7 Retraction of chroma %1.01 χ ≥ χ0
8 Retraction of chroma
(3/2-tone)
%1.015 χ ≥ χ0
9 Same note repetition % 1.02
10 Accepted Scale
Intervals
- -
However for each χmi (i=1,2,…,n) stands
( )1−
=ii mm f χχ (8)
and more specifically:
imm kii
⋅=− 1
χχ (9)
where
ii Nk ⋅+= 01.01 (10a)
{ }( )2−Ζ∈ +iN
if it is about the rules 1-4, or
i
iN
k⋅+
=005.01
1 (10b)
{ }( )4,3,2,1∈iN
if it is about the rules 5-9.
The sum of χmi is equal to:
ni mmm
n
i
m χχχχ +++=∑=
...21
1
(11)
If the newly created brick bears a greater χ value
than the previous brick (χj >χj-1) and the chroma
value of the last note of the previous brick is λ, then
(7) becomes:
( )
n
Nn
i
i
k
k
j
∑ ∏= =
⋅+⋅
= 1 1
01.01λχ . (12a)
WSEAS TRANSACTIONS on COMPUTERS Dionysios Politis and Dimitrios Margounakis
ISSN: 1109-2750 1124 Issue 8, Volume 7, August 2008
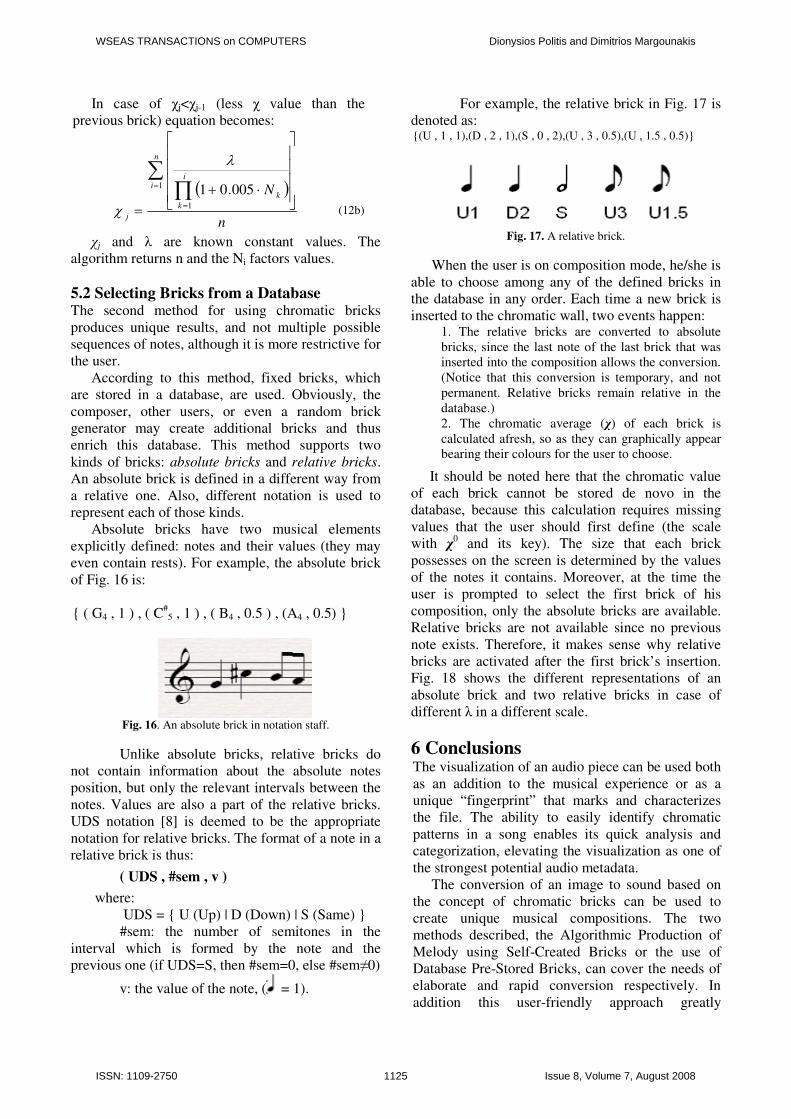
In case of χj<χj-1 (less χ value than the
previous brick) equation becomes:
( )
n
N
n
ii
k
k
j
∑∏=
=
⋅+
=
1
1
005.01
λ
χ (12b)
χj and λ are known constant values. The
algorithm returns n and the Ni factors values.
5.2 Selecting Bricks from a Database The second method for using chromatic bricks
produces unique results, and not multiple possible
sequences of notes, although it is more restrictive for
the user.
According to this method, fixed bricks, which
are stored in a database, are used. Obviously, the
composer, other users, or even a random brick
generator may create additional bricks and thus
enrich this database. This method supports two
kinds of bricks: absolute bricks and relative bricks.
An absolute brick is defined in a different way from
a relative one. Also, different notation is used to
represent each of those kinds.
Absolute bricks have two musical elements
explicitly defined: notes and their values (they may
even contain rests). For example, the absolute brick
of Fig. 16 is:
{ ( G4 , 1 ) , ( C#
5 , 1 ) , ( B4 , 0.5 ) , (A4 , 0.5) }
Fig. 16. An absolute brick in notation staff.
Unlike absolute bricks, relative bricks do
not contain information about the absolute notes
position, but only the relevant intervals between the
notes. Values are also a part of the relative bricks.
UDS notation [8] is deemed to be the appropriate
notation for relative bricks. The format of a note in a
relative brick is thus:
( UDS , #sem , v )
where:
UDS = { U (Up) | D (Down) | S (Same) }
#sem: the number of semitones in the
interval which is formed by the note and the
previous one (if UDS=S, then #sem=0, else #sem≠0)
v: the value of the note, ( = 1).
For example, the relative brick in Fig. 17 is
denoted as: {(U , 1 , 1),(D , 2 , 1),(S , 0 , 2),(U , 3 , 0.5),(U , 1.5 , 0.5)}
Fig. 17. A relative brick.
When the user is on composition mode, he/she is
able to choose among any of the defined bricks in
the database in any order. Each time a new brick is
inserted to the chromatic wall, two events happen: 1. The relative bricks are converted to absolute
bricks, since the last note of the last brick that was
inserted into the composition allows the conversion.
(Notice that this conversion is temporary, and not
permanent. Relative bricks remain relative in the
database.)
2. The chromatic average (χ) of each brick is
calculated afresh, so as they can graphically appear
bearing their colours for the user to choose.
It should be noted here that the chromatic value
of each brick cannot be stored de novo in the
database, because this calculation requires missing
values that the user should first define (the scale
with χ0 and its key). The size that each brick
possesses on the screen is determined by the values
of the notes it contains. Moreover, at the time the
user is prompted to select the first brick of his
composition, only the absolute bricks are available.
Relative bricks are not available since no previous
note exists. Therefore, it makes sense why relative
bricks are activated after the first brick’s insertion.
Fig. 18 shows the different representations of an
absolute brick and two relative bricks in case of
different λ in a different scale.
6 Conclusions The visualization of an audio piece can be used both
as an addition to the musical experience or as a
unique “fingerprint” that marks and characterizes
the file. The ability to easily identify chromatic
patterns in a song enables its quick analysis and
categorization, elevating the visualization as one of
the strongest potential audio metadata.
The conversion of an image to sound based on
the concept of chromatic bricks can be used to
create unique musical compositions. The two
methods described, the Algorithmic Production of
Melody using Self-Created Bricks or the use of
Database Pre-Stored Bricks, can cover the needs of
elaborate and rapid conversion respectively. In
addition this user-friendly approach greatly
WSEAS TRANSACTIONS on COMPUTERS Dionysios Politis and Dimitrios Margounakis
ISSN: 1109-2750 1125 Issue 8, Volume 7, August 2008

improves its usability through time, as additional
bricks can be created, stored and used in future
creations.
The use of a networked database in the
proportionate tools like MEL-IRIS is considered
necessary as it (i) easies the spread of custom
conversion units (chromatic bricks) and (ii)
accelerates the production of accurate statistics,
multiplying the advantages of the audio-visual
correspondence.
References:
[1] American Standards Association. Acoustical
Terminology SI, 1-1960.
[2] V. Barsky, Chromaticism, Harwood Academic
Publishers, Netherlands, 1996.
[3] D. Bruton, Color Science Web Page. 2007.
URL: http://www.physics.sfasu.edu/astro/color.html
[4] J. L. Caivano, Colour and sound: physical and
psychophysical relations, Colour Research and
Applications, Vol. 19, No. 2, 1994, pp. 126-132.
[5] S. Fels, K. Nishimoto & K. Mase,
MusiKalscope: A graphical musical instrument,
IEEE Multimedia Magazine, Vol. 5, No. 3, 1998,
pp. 26-35.
[6] K. Giannakis & M. Smith, Auditory-visual
associations for music compositional processes:
A Survey. Proceedings of International
Computer Music Conference ICMC2000, Berlin,
Germany, 2000.
[7] D. Giannelos, La Musique Byzantine,
L’Harmattan, Paris, 1996.
[8] A. Ghias, J. Logan, D. Chamberlin and B. C.
Smith, “Query by Humming – Musical
Information Retrieval in an Audio Database”,
ACM Multimedia 95, 1995.
[9] R. Gonzales & R. Woods, Digital Image
Processing, 2nd Edition, Prentice Hall, 2002.
[10] M. Goto, “A predominant - F0 estimation
method for polyphonic musical audio signals”,
proceedings of the 18th International Congress
on Acoustics (ICA 2004), pp. 1085 – 1088, 2004.
[11] R. Hall, Illumination and Color in Computer –
Generated Imagery. Berlin: Springer, 1989.
[12] D. Huron, Tone and voice: A derivation of the
rules of voice leading from perceptual principles,
Music Perception, 19, 2001, pp. 1-64.
[13] S. Isacoff, Temperament: how Music became a
Battleground for the Great Minds of Western
Civilization, Vintage Books, 2003.
[14] A. Jacobs, The new Penguin Dictionary of
Music. USA: Penguin, 1980.
[15] P. Juslin, Communicating emotion in music
performance: A review and theoretical
framework. In Juslin, P., & Sloboda, J. (Eds.),
Music and Emotion: Theory and Research.
UK:Oxford University Press, 2001.
[16] M. Leman, (Ed). Foundations of pitch and
timbre perceptions. Special Issue, Journal of
New Music Research, Vol. 26, No. 2, 1997.
[17] L. Lalou, Aristoxène de Tarente. La musique de
l’ antiquité. Doctoral Thesis. Paris, 1904.
Minkoff reprint. Geneva, 1973.
[18] Y. Li, & D. Wang, “Detecting pitch of singing
voice in polyphonic audio”, Proceedings of
ICASSP2005, Vol. 3, Philadelphia, PA, USA,
March 18-23, 2005, pp. 17-21.
Fi Fig. 18. Different representations of bricks in different musical compositions. The chromatic index (λ) and the pitch of the previous
note, as well as the scale, define the final graphical brick representation. Calculation of R-G-B values is done according to [4].
WSEAS TRANSACTIONS on COMPUTERS Dionysios Politis and Dimitrios Margounakis
ISSN: 1109-2750 1126 Issue 8, Volume 7, August 2008

[19] R. J. McNab, L. A. Smith & I. H. Witten,
“Signal processing for melody transcription”.
Proceedings of the 19th Australasian Computer
Science Conference, Melbourne, Australia,
January 31 – February 2, 1996.
[20] R. Meddis & M. Hewitt, A unitary model of
pitch perception, Journal of the Acoustical
Society of America, 102, 1997, pp. 1811 – 1820.
[21] N. Nettheim, On the spectral analysis of
melody, Interface: Journal of New Music
Research, 21, 1992, pp. 135-148.
[22] Y. Ohno, “CIE fundamentals for Color
Measurements”, in Proc. of the IS&T NIP16
Conference on Digital Printing Technologies,
Vancouver, Canada, October 16-20, 2000, pp.
540-545.
[23] H. Olson, Music, Physics and Engineering, N.
York: Dover Publications, 1967.
[24] C. Padgham, The scaling of the timbre of the
piping organ, Acustica, 60, 1986, pp. 189-204.
[25] R. Parncutt, Harmony: A Psychoacoustical
Approach. Berlin:Springer-Verlag, 1990.
[26] R. Parncutt, “Critical comparison of acoustical
and perceptual theories of the origin of musical
scales”, Proceedings of the International
Symposium On Musical Acoustics (ISMA2001),
10-14 September, 2001, Perugia, Italy.
[27] D. Politis, A. Dolia, & P. Linardis, “Identifying
transient patterns in idiomatic Greek and
Slavonic music”, proceedings of the 5th All-
Ukrainian International Conference on
Signal/Image Processing and Pattern
Recognition, UkrOBRAZ’2000, Kiev, 27
November-1 December 2000, pp. 103-106. [28]
D. Politis & D. Margounakis, “In Search for
Chroma in Music”, Proceedings of the 7th
WSEAS International Conference on Systems,
Corfu, 7-10 July 2003.
[29] D. Politis, D. Margounakis & K. Mokos,
“Visualizing the Chromatic Index of Music”,
Proceedings 4th International Conference on
Web Delivering of Music WEDELMUSIC ’04,
Barcelona, 13-14 September 2004, pp. 102-109.
[30] T. D. Rossing, The Science of Sound, 2nd Ed.
San Fransisco:Addison-Wesley, 1990.
[31] E. Schubert, Modeling perceived emotion with
continuous musical features, Music Perception,
21, 2004, pp. 561–585.
[32] R. Shepard, Pitch perception and measurement.
In Cook, P. (Ed.), Music, Cognition and
Computerized Sound. MA: MIT Press, 1999.
[33] J. Sundberg, The Science of the Singing Voice.
USA: Northern Illinois University Press, 1987.
[34] J. Sundberg, The perception of singing. In
Deutch, D. (Ed.), The Psychology of Music, 2nd
ed. London: Academic Press, 1999.
[35] G. Tzanetakis & P. Cook, Musical genre
classification of audio signals. IEEE
Transactions on Speech and Audio Processing,
Vol. 10, No. 5, 2002, pp. 293-302.
[36] A. Uitdenbogerd & J. Zobel, An Architecture
for effective music information retrieval.
Journal of the American Society of Information
Science and Technology (JASIST), Vol. 54, No.
12, 2004, pp. 1053 – 1057.
[37] Y. Sheng-Yuan, How Does Ontology help Web
Information Management Processing, WSEAS
Transactions on Computers, Vol. 5, Issue 9,
September 2006, pp. 1843-1850.
[38] R. P. Winnington-Ingram, Aristoxenos and the
intervals of Greek music, The Classical
Quarterly, Vol. 26, No. 3-4, 1932, pp. 195-208.
[39] A. Wood & I. M. Bowsher, The Physics of
Music. N. York: John Wiley & Sons, 1975.
[40] D. Politis, I.A. Tsoukalas, K. Vandikas, N.
Gekas, K. Daglis, & D. Margounakis, ARION –
An Ancient Greek Music Composer. WSEAS
Transactions on systems, Vol. 3, Issue 10,
December 2004, pp. 2948-2951.
[41] D. Politis, M. Gkatzogias, A. Karamalis, K.
Pyrinis, & A. Kalathas, GIS Driven Internet
Multimedia Databases for Multiple
Archaeological Excavations in Greece and the
Region of South-Eastern Europe: The
SEEArchWeb project. WSEAS Transactions on
Advances in Engineering Education, Vol. 2,
Issue 2, April 2005, pp. 54-61.
[42] M. L. West, Ancient Greek Music, UK: Oxford
University Press, 1994
WSEAS TRANSACTIONS on COMPUTERS Dionysios Politis and Dimitrios Margounakis
ISSN: 1109-2750 1127 Issue 8, Volume 7, August 2008