a synoptic classification of inflow-generating precipitation ... · a synoptic classification of...
TRANSCRIPT
A Synoptic Classification of Inflow-Generating Precipitation in theSnowy Mountains, Australia
ALISON THEOBALD AND HAMISH MCGOWAN
Climate Research Group, School of Geography, Planning and Environmental Management, University of
Queensland, St Lucia, Queensland, Australia
JOHANNA SPEIRS
Snowy Hydro, Ltd., Sydney, New South Wales, Australia
NIK CALLOW
Environmental Dynamics and Ecohydrology, School of Earth and Environment, University of
Western Australia, Crawley, Western Australia, Australia
(Manuscript received 24 October 2014, in final form 23 April 2015)
ABSTRACT
Precipitation falling in the SnowyMountains region of southeastern Australia provides fuel for hydroelectric
power generation and environmental flows along major river systems, as well as critical water resources for
agricultural irrigation. A synoptic climatology of daily precipitation that triggers a quantifiable increase in
streamflow in the headwater catchments of the SnowyMountains region is presented for the period 1958–2012.
Here, previous synoptic-meteorological studies of the region are extended by using a longer-term, year-round
precipitation and reanalysis dataset combined with a novel, automated synoptic-classification technique. A
three-dimensional representation of synoptic circulation is developed by effectively combining meteorological
variables through the depth of the troposphere. Eleven distinct synoptic types are identified, describing key
circulation features and moisture pathways that deliver precipitation to the Snowy Mountains. Synoptic types
with the highest precipitation totals are commonly associated with moisture pathways originating from the
northeast and northwest of Australia. These systems generate the greatest precipitation totals across the
westerly and high-elevation areas of the SnowyMountains, but precipitation is reduced in the eastern-elevation
areas in the lee of the mountain ranges. In eastern regions, synoptic types with onshore transport of humid air
from the Tasman Sea are the major source of precipitation. Strong seasonality in synoptic types is evident, with
frontal and cutoff-low types dominating in winter and inland heat troughs prevailing in summer. Interaction
between tropical and extratropical systems is evident in all seasons.
1. Introduction
Inflows generated from precipitation falling in the
Snowy Mountains region provide vital water sources for
irrigation and environmental flows in the agriculturally
important and ecologically diverse Murray–Darling ba-
sin, as well as fuel for hydroelectric power generation.
Located in southeastern Australia (SEA), the Snowy
Mountains are one of only a few alpine regions in Aus-
tralia. They form the highest part of the Great Dividing
Range and include Australia’s highest peak—Mount
Kosciusko—at 2228m (Fig. 1). In contrast to younger
mountain ranges such as the European Alps, the topog-
raphy is not as steep, rugged, or high in elevation; instead,
areas of undulating tablelands dominate the region.
In response to a series of severe droughts in the region,
construction began on the Snowy Mountains Hydro-
Electric Scheme (‘‘Scheme’’ hereinafter) in 1949. The
Scheme consists of a complex network of dams, hydro-
electric power stations, tunnels, aqueducts, and pipelines
that are able to divert eastward-flowing rivers under the
mountain range inland to the Murray and Murrumbidgee
Corresponding author address: Alison Theobald, School of
Geography, Planning and Environmental Management, Level 4,
Chamberlain Bldg., University of Queensland, St Lucia, Queens-
land, 4072, Australia.
E-mail: [email protected]
AUGUST 2015 THEOBALD ET AL . 1713
DOI: 10.1175/JAMC-D-14-0278.1
� 2015 American Meteorological Society
Rivers. The Scheme provides on average 2360Gl of water
per year for irrigation, underwriting AUD $3 billion of
agricultural production in the Murray–Darling basin.
Furthermore, the water provides environmental flows
along major rivers and offers a degree of flow regulation
(Snowy Hydro Limited 2003; Ghassemi and White
2007; see also http://www.mdba.gov.au/about-basin/
how-river-runs/murrumbidgee-catchment). The Scheme’s
hydroelectric power generation meets the peak power
demand for much of eastern Australia and currently
provides 32% of all renewable annual energy produc-
tion in Australia (http://www.snowyhydro.com.au/energy/
hydro/snowy-mountains-scheme).
The SnowyMountains are typically one of Australia’s
wettest regions, but the precipitation is highly variable.
Annual precipitation from days with $10mm of
precipitation in high-elevation regions of the Snowy
Mountains varied between 2800 and 760mm between
1958 and 2012 (Fig. 2). High precipitation variability
also exists on intra-annual time scales. Precipitation in
winter and spring is heavily influenced by the prevailing
midlatitude westerly winds in conjunction with oro-
graphic enhancement, and these are commonly consid-
ered to be the wettest seasons (Snowy Hydro Limited
2003; Pook et al. 2006; Cai and Cowan 2008;
Ummenhofer et al. 2009; Chubb et al. 2011). High-
intensity and warm spring rains falling onto the snow-
pack are a major source of inflows (McGowan et al.
2009), generating as much as 50% of the total annual
inflows to the hydroelectric catchments (Snowy Hydro
Limited 2003). Although the warmer months are gen-
erally drier, heavy rainfall can result from trajectories of
warm, moist air from lower latitudes and small-scale
convective events that generate thunderstorms (Barry
1992; Basist et al. 1994; Snowy Hydro Limited 2003).
Orographic enhancement of precipitation also occurs in
summer as north and northwesterly winds flow perpen-
dicular to the Snowy Mountains (Chubb et al. 2011).
The SnowyMountains region lies toward the northern
limits of the influence of the midlatitude westerly wind
belt, where interaction between tropical and extra-
tropical weather systems is an important factor in the
generation of precipitation (Wright 1989). Accordingly,
this region is sensitive to changes in the annual cycle of
the subtropical ridge (STR) and shifts in the westerly
storm tracks (Drosdowsky 2005; Murphy and Timbal
2008; Verdon-Kidd et al. 2013; Timbal and Drosdowsky
2013), as well as hydrological-cycle changes in a warm-
ing climate that can dramatically affect seasonal pre-
cipitation and runoff (Beniston 2003; Viviroli et al.
2011). In addition, the ascent mechanisms that are re-
sponsible for providing deep convective moisture and
thus the potential for higher precipitation totals in the
Snowy Mountains vary seasonally.
Historic snow-course data have shown significant de-
clines in snow depth (Nicholls 2005; Hennessy et al.
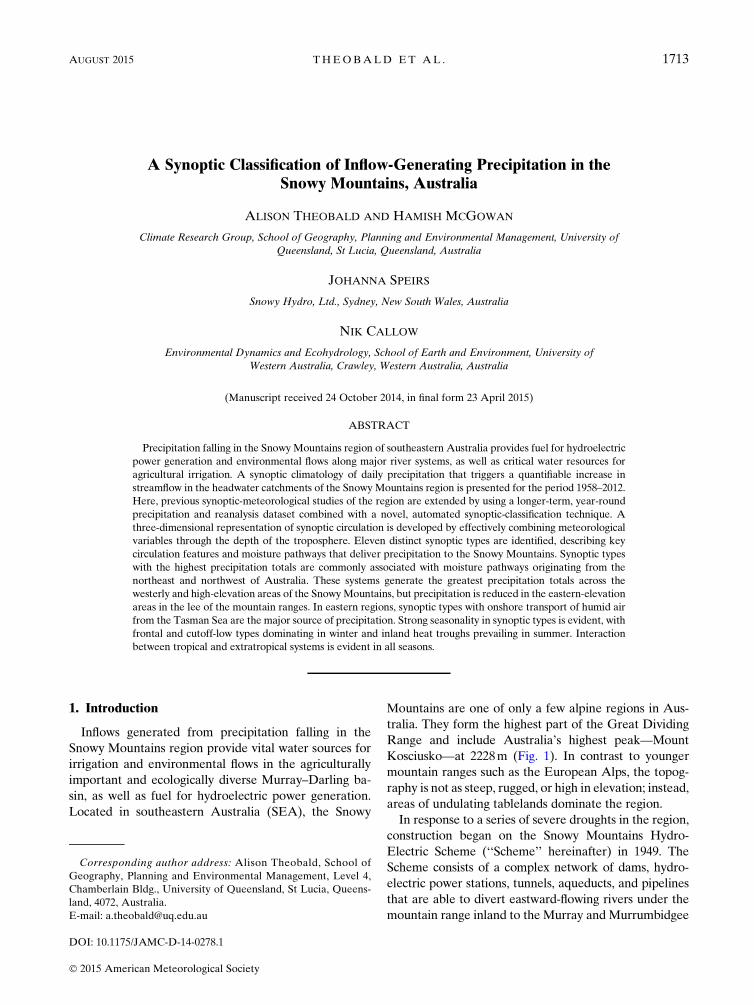
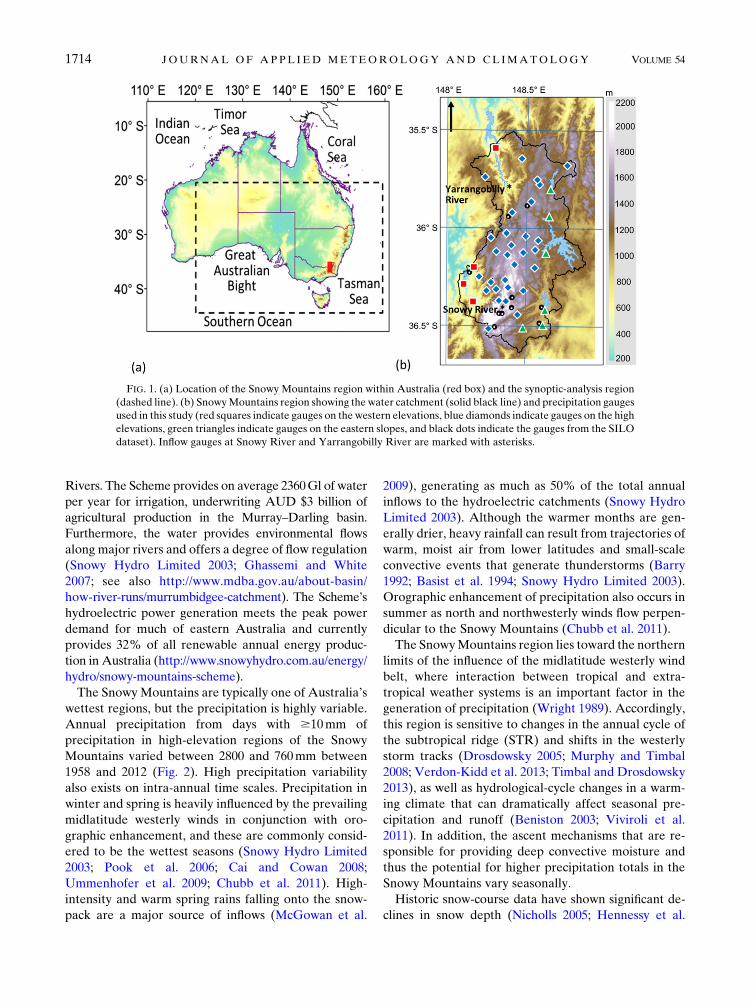
FIG. 1. (a) Location of the Snowy Mountains region within Australia (red box) and the synoptic-analysis region
(dashed line). (b) SnowyMountains region showing the water catchment (solid black line) and precipitation gauges
used in this study (red squares indicate gauges on the western elevations, blue diamonds indicate gauges on the high
elevations, green triangles indicate gauges on the eastern slopes, and black dots indicate the gauges from the SILO
dataset). Inflow gauges at Snowy River and Yarrangobilly River are marked with asterisks.
1714 JOURNAL OF APPL IED METEOROLOGY AND CL IMATOLOGY VOLUME 54

2008) in association with rising alpine temperatures.
Climate-change modeling of snow depth by Hennessy
et al. (2003, 2008) and Hendrikx et al. (2013) shows a
continuation of these declines. Regional-scale hydro-
climaticmodeling predicts rainfall and runoff to decrease
on average and to increase in extremity over coming
decades (Chiew et al. 2011). Meanwhile, demand for
both water and energy are forecast to increase into the
future (Christensen et al. 2007) resulting in increased
vulnerability of water resources that are already under
stress (Viviroli et al. 2011). Despite the importance of
inflow-generating precipitation in the SnowyMountains,
there remains a knowledge gap regarding the long-term,
historic climatological behavior of the synoptic weather
systems that deliver precipitation to the region.
The cool-season synoptic circulation over various re-
gions of SEA has been well studied (e.g., Wright 1989;
Pook et al. 2006; Landvogt et al. 2008; Risbey et al. 2009;
Gallant et al. 2012), although few studies relate specifi-
cally to the Snowy Mountains area (Colquhoun 1978;
Chubb et al. 2011; Fiddes et al. 2015). These studies
commonly report cool-season precipitation declines.
From these cool-season-focused studies, it is widely re-
ported that cold fronts and closed lows, including cutoff
lows, are responsible for the majority of wintertime
precipitation. These types of weather systems can occur
year-round (Landvogt et al. 2008; Wright 1989), how-
ever, and are also important for inflow generation out-
side the winter season, particularly when they interact
with tropical systems. For instance, the highest 7-day
accumulated rainfall total in the Snowy Mountains re-
gion fell between 27 February and 4March 2012, causing
widespread flooding (Bureau of Meteorology 2012).
Strengthening of the East Australia Current and asso-
ciated Tasman Sea warming due to climate change
suggest increasing summer precipitation in SEA (Cai
et al. 2005; Shi et al. 2008; Gallant et al. 2012).
Previous studies of synoptic circulation over SEA
have predominantly used manual-classification schemes,
which are, by their nature, subjective and limited in the
number of meteorological variables on which they are
based. The majority consider only the cool-season period.
Manual approaches are considered to be time-consuming,
and, with the exception of Pook et al. (2014), the majority
of SEA studies have covered relatively short time periods
of a few decades at most. Several SEA studies have fo-
cused particularly on the period of extended drought that
persisted for much of the 1990s and 2000s in an attempt to
understand the significant precipitation decline that oc-
curred during this period (e.g., Risbey et al. 2013). Studies
confined to shorter periodsmay not be fully representative
of synoptic circulation over a multidecadal period.
McGowan et al. (2009) identified the role that multi-
decadal ocean–atmosphere teleconnections may play in
the hydroclimate of the Snowy Mountains region. Ac-
cordingly, there is a need to extend current understanding
of synoptic circulation beyond the last few decades and to
encompass year-round synoptic systems.
Previous manual classifications of precipitation sys-
tems worldwide and inAustralia focusmainly on surface
pressure fields with limited analyses of mid- and upper-
level atmospheric properties. Between three and five
synoptic types were identified for SEA (Wright 1989;
Pook et al. 2006; Landvogt et al. 2008; Chubb et al. 2011;
Risbey et al. 2013). Studies that have applied automated
techniques have been based on a single atmospheric
FIG. 2. (top) Annual precipitation across the western (plus signs), high (squares), and eastern
(asterisks) elevations and (bottom) annual number of precipitation days $ 10mm for the pe-
riod 1958–2012.
AUGUST 2015 THEOBALD ET AL . 1715
variable, usually mean sea level pressure (MSLP;
Whetton 1988; Kidson 2000; Jiang 2011; Renwick 2011),
because of difficulties encountered in combining multi-
level data (Kidson 2000). Multivariable classifications
either classify each variable separately (e.g., Bettolli
et al. 2010) or use data-reduction techniques (e.g., Stahl
et al. 2006; Moron et al. 2008). Self-organizing maps that
are based on MSLP (Cassano and Cassano 2010) or
500-hPa geopotential height (Newton et al. 2014a,b)
were employed in Canadian studies to assess catchment-
scale hydroclimatic variability. These approaches, as
noted by Stahl et al. (2006), conceal the complex three-
dimensional nature and internal variability of synoptic
types. Consequently, causes of variability in seasonal
rainfall that depend not only on the annual cycle of
surface pressure, but also on seasonal changes to the
atmospheric circulation in the mid- and upper tropo-
sphere (Pook et al. 2006), may not be identified.
Here we present a seasonal, 55-yr (1958–2012) synoptic
climatology of inflow-generating precipitation days for
the Snowy Mountains region. A novel, objective method
is developed that describes synoptic types on the basis of a
suite of 21 meteorological variables throughout the depth
of the troposphere. Use of reanalysis data and an auto-
mated approach allows a multidecadal time period to be
investigated and removes much of the subjectivity of
manual classifications (Yarnal 1993). Important is that
this approach allows robust conclusions to be drawn with
regard to patterns of synoptic circulation that are re-
sponsible for inflow-generating precipitation, enabling
ongoing research to investigate trends in synoptic circu-
lation variability and their significance for local to re-
gional hydroclimate. Such knowledge is essential to better
understand the drivers of variability in historical records
of precipitation so as to make better-informed water-
management decisions (Viviroli et al. 2011).
A description of the data andmethods used is outlined
in section 2. Results of the synoptic climatology and the
variability of the synoptic weather types are presented in
section 3. A discussion and conclusions are presented in
section 4.
2. Data and methods
a. Data
A network of private, tipping- and weighing-bucket
precipitation gauges operated by Snowy Hydro Limited
(SHL) and the Queensland government’s Scientific In-
formation for Land Owners (SILO) ‘‘Patched Point
Dataset’’ (https://www.longpaddock.qld.gov.au/silo/ppd/
index.php?reset5reset, accessed January 2014; Jeffrey
et al. 2001) from the Australian Bureau of Meteorology
(BoM) recording stations provide the daily precipitation
observations used in this study (Fig. 1b). Some records in
the SHL dataset begin in the 1950s, but many of the early
data records (before 1975) are discontinuous. Installation
of an automatic weather station within the study area in
1996 and a substantial increase in precipitation gauge
network size after 2004 vastly improved data quality.
Newer, heated and weighing gauges at higher elevations,
some with wind shields, more accurately record snowfall.
Records from 56 SHL active gauges within the Snowy
Mountains have been used in this study, which covers the
period of 1958–2012. Data are recorded instantaneously
and were aggregated to daily totals to 0900 local time (in
line with the BoM convention for daily precipitation ob-
servations). SHL data from two inflow-recording stations,
Yarrangobilly River at Ravine station and the Snowy
River above Guthega station (Fig. 1b), were also aggre-
gated to daily totals.
Data from 10 gauges within the Snowy Mountains
were selected from the SILO dataset (Fig. 1b) and used
to ensure a continuous daily precipitation record. The
SILOdataset consists of observations fromBoMgauges,
filled in with interpolated values where observations are
unavailable. Rainfall is interpolated using the geo-
statistical method of ordinary kriging (Jeffrey et al.
2001). An interpolated surface (0.058 3 0.058 grid reso-
lution) is produced for each day, from which missing
data values for point locations are extracted from the
nearest grid cell. The provision of daily data for in-
dividual stations rather than a gridded product allows
direct insertion of data (Pook et al. 2010) into disconti-
nuities in the SHL record. For any point location, the
nearest 30 stations and all within 100 km are used for the
interpolation, whichever is greater. It has been shown
that normalized precipitation removes the component
of precipitation variability that is due to topographic
influences and can be reliably interpolated at time scales
from hourly to monthly (Jeffrey et al. 2001). Topo-
graphic effects are subsequently accounted for by de-
normalizing the interpolated surface to derive the final
rainfall surface. The SILO dataset is available for the
period from 1889 to present. Precipitation data from
all seasons were considered. The standard climatologi-
cal seasons have been used throughout this study:
December–February (DJF), March–May (MAM),
June–August (JJA), and September–November (SON).
For the purpose of producing a synoptic climatology,
the European Centre for Medium-Range Weather
Forecasts (ECMWF) ERA-Interim and ERA-40 re-
analysis products (Dee et al. 2011) were used as input to a
clustering algorithm and to construct composite maps of
the synoptic atmospheric circulation associated with
precipitation days. ERA-Interim spans the period from
1979 to near–real time and is available at a default 0.758
1716 JOURNAL OF APPL IED METEOROLOGY AND CL IMATOLOGY VOLUME 54
latitude3 0.758 longitude grid resolution. ERA-40 spans
the period 1958–2002 and has a default resolution of
2.58 3 2.58, but a 0.758 3 0.758 resolution can also be
obtained and is used here. Reanalysis products at
coarser scales have been shown in previous studies to be
unsuitable for regional climate assessments (Eichler and
Gottschalck 2013) and to have difficulty accurately de-
tecting features such as surface pressure fronts and
troughs. As a result, past synoptic studies have needed to
supplement coarse-resolution reanalysis data with sat-
ellite imagery and manual-analysis charts (e.g., Pook
et al. 2006). Furthermore, ECMWF reanalyses have
improved representation of Southern Hemisphere high-
latitude atmospheric circulation when compared with
other reanalysis products (Marshall 2003).
ERA-Interim represents the latest reanalysis product
(at the time of writing) fromECMWFand has addressed
several data-assimilation issues that were encountered
in ERA-40 (Dee et al. 2011). Comparison of clustering
results from the two products for an overlapping 22-yr
period (1979–2001) demonstrated no significant differ-
ence in the output (not shown). This result is in agree-
ment with Hoskins and Hodges (2005) who evaluated
the impact of changes to observing systems in their
analysis of Southern Hemisphere storm tracks. They
concluded that their climatological description re-
mained robust between different reanalyses and the pre-
and postsatellite eras.
Daily mean values of the following variables were
used in this study: MSLP; 500-hPa geopotential height;
wind vectors at the surface, 850, 700, 500, and 250 hPa;
relative humidity and temperature at 850, 700, 500, and
250hPa; and (the computed) 1000–500-hPa atmospheric
thickness. The subtropical jet stream (STJ), the strength
and position of which over Australia is known to in-
fluence steering and development of synoptic systems,
was calculated as the magnitude of the wind vector at
250hPa (Risbey et al. 2009). For our purposes, tem-
perature and humidity profiles are standard airmass in-
dicators of atmospheric stability and available moisture,
respectively (Davis and Kalkstein 1990). Wind vectors
provide critical information on direction of moisture
transport and steering of synoptic systems (Pook et al.
2006). Mean sea level pressure provides an indicator of
the large-scale current atmospheric state (Eder et al.
1994) while thickness provides information on advection
and frontal position (e.g., Pook et al. 2006). Variables
were obtained for the synoptic analysis area bounded by
latitudes 208–468S and longitudes 1208–1608E (Fig. 1a).
This region is considered to be extensive enough to
capture all synoptic weather systems affecting the
Snowy Mountains, including those originating in, and
interacting with, tropical latitudes.
b. Methods
1) QUALITY CONTROL
For the purposes of this study, all data were subject to
quality control and any data flagged as unsuitable for
climatological purposes were automatically removed.
Data were checked on a gauge-by-gauge basis for
anomalous values by calculating the maximum, mini-
mum, and range. Furthermore, any data with a quality
flag indicating potentially bad data were subject to ad-
ditional quality control and in a few cases were removed
because of anomalously high half-hourly values. In ad-
dition, SHL data coded as ‘‘good’’ but with a zero
amount where the corresponding SILO dataset showed a
value greater than zero were disregarded when calculat-
ing the daily mean values.
2) PRECIPITATION THRESHOLD
This study investigates days on which precipitation
generates inflow to reservoirs within the Snowy Moun-
tains water catchment (Fig. 1b). To define a threshold
amount for a precipitation day, a Lyne and Hollick filter
(Lyne and Hollick 1979) was applied to separate
‘‘quickflow’’ (surface runoff) from base flow in the in-
flow dataset (Nathan and McMahon 1990) at the Snowy
River and Yarrangobilly River stations. As alpine and
subalpine sites, respectively, these two stations provide
indicative conditions across the region. Precipitation
from the most relevant gauges to the inflow stations was
then correlated with quickflow at a lag time of 11 day
(based on prior knowledge of the behavior of pre-
cipitation and runoff in these catchments). The appli-
cation of the Lyne and Hollick filter to inflow data
resulted in a threshold precipitation amount of 10mm,
above which quickflow and therefore inflow was en-
hanced (not shown).
Only precipitation during the period from December
to April was considered for the determination of this
threshold. During the cool season, precipitation can be
stored as snowpack or can enhance inflow during spring
snowmelt, and, particularly during this period, a static
precipitation–runoff threshold does not apply. It is ac-
knowledged that such a precipitation–runoff threshold
is typically dynamic and depends upon numerous
catchment conditions but is necessary for the purpose of
synoptic classification of precipitation days in this study.
3) GROUPING DATA
Different precipitation regimes are experienced
across the Snowy Mountains region, in part because of
topographic interaction with the prevailing flow (Chubb
et al. 2011; Fiddes et al. 2015). Following Chubb et al.
AUGUST 2015 THEOBALD ET AL . 1717
(2011), the 56 SHL gauges were divided into western-,
high-, and eastern-elevation groups (Fig. 1b) on the basis
of the similarity of the statistics shown in Table 1. Al-
though the high-elevation group contains a greater
number of gauges, most of these began operating after
2004. Prior to 2004, the number of gauges was more
similar across all groups (Table 1). Such regionalization
of data has been used successfully in previous studies
in a variety of locations worldwide, helping to reduce
noise and spatial autocorrelation in the data (Whetton
1988; Widmann and Schär 1997; Kidson 2000; Chubb
et al. 2011; Plavcova et al. 2014).
A continuous daily precipitation record back to 1958
was not possible using only the SHL data; therefore,
comparisons between the SHL and SILO datasets were
carried out to determine the suitability, and associated
uncertainty, in combining the two datasets. Correla-
tions, contingency tables, and their associated skill-score
statistics [bias, probability of detection (POD), and
mean absolute error (MAE)] were calculated (Wilks
2006; Beesley et al. 2009; Tozer et al. 2012). Data from
all 10 SILO gauges within the watershed boundary
provided the best comparison with the most recent SHL
data (which include high-resolution, heated, and fenced
gauges), suggesting that using all gauges in the SILO
dataset back to 1958 provides the most robust estimate
of precipitation.
Contingency-table statistics were better overall for
gauges within the high-elevation group, with POD
scores indicating that at least 78%–84% of precipitation
days over 10mm are accurately detected by SILO. The
MAE between the SILO and SHL datasets varies be-
tween 0.03mm (high elevations) and 3.66mm (eastern
elevations), in good agreement with Jeffrey et al. (2001)
for the study region. SILO estimates of precipitation do
not demonstrate a forecast bias for the high elevations,
but there is a tendency to underforecast (overforecast)
precipitation days after (before) 2006 in the western and
eastern elevations. Lower skill scores in the western and
eastern elevations are likely due to fewer gauges in these
areas. Particularly in the east, the only two gauges within
the SILO dataset are located in the southern part of the
catchment. Lack of representation in the northern
catchment may explain the lower skill there. Despite the
lower skill scores for the eastern and western elevations,
only 4.5%–4.9% of days are detected solely in
these groups.
A daily precipitation amount for each group was cal-
culated as the mean daily precipitation from each gauge
within the group (Chubb et al. 2011; Dai et al. 2014;
Fiddes et al. 2015). Following WMO guidelines and
Chubb et al. (2011), a minimum of four data values were
used to calculate a mean (WMO 2011). When this was
unachievable using only SHL data, the SILO data were
included in the calculation. The change in the number
of SHL gauges, particularly within the high-elevation
group, was shown to have minimal effect on the calcula-
tion of the mean, with an average difference of 0.11mm
between mean values. Prior to the commencement of
data recording in the western (eastern) elevations by the
Snowy Hydro Scheme in 1961 (1960), daily totals were
calculated solely from the SILO dataset.
Each day with a precipitation total greater than the
threshold amount of 10mmwas extracted from the daily
record. The corresponding ECMWF reanalysis vari-
ables for each of those days were collated into a data
matrix and standardized on a monthly basis (over the
full study period), using z scores, to account for the in-
consistent units (Yarnal 1993; Hart et al. 2006; Wilson
et al. 2013; Gao et al. 2014). Standardizing climate data
has been demonstrated to have the additional benefit of
removing seasonal variations in intensity of synoptic
systems, allowing comparison between data with dif-
ferent variabilities and means (Gao et al. 2014; Jiang
2011;Wilks 2006; Kidson 2000; Yarnal 1993). The strong
influence of the seasonal cycle of the STR on weather
patterns in SEA means clustering applied to standard-
ized data better reflects the daily changes in atmospheric
circulation (Yarnal 1993). For example, Pook et al.
(2006, their Fig. 3) show the variability in monthly mean
MSLP across the cool season. In our study, the monthly
standardized MSLP data reveal that precipitation days
are always associated with negative anomalies, which
become stronger during the cooler months and are at a
maximum in May (not shown). Similar month-to-month
variations are apparent in the other variables used in this
study (not shown for brevity). The standardized data
matrix was used as input into the cluster analysis.
TABLE 1. Statistics of grouped precipitation gauges.
Group
Avg
elev (m)
Avg annual
precipitation (mm)
Correlation
between gauges
No. gauges
prior to 2004
No. gauges
after 2004
Western 391 1246 .0.78 2 5
High 1484 1602 .0.74 8 45
Eastern 1107 857 .0.70 3 6
1718 JOURNAL OF APPL IED METEOROLOGY AND CL IMATOLOGY VOLUME 54
4) CLUSTER ANALYSIS
To generate synoptic types for the period 1958–2012,
cluster analysis was applied to the standardized meteo-
rological variables for each daily precipitation total
greater than the threshold amount of 10mm. The cluster
analysis was performed across all seasons simulta-
neously, given the prior removal of the seasonal cycle by
data standardization. Equal weighting was given to each
variable, given the importance of each in influencing the
synoptic circulation and precipitation received, as out-
lined in section 2a. Hierarchical average-linkage clus-
tering gave an initial indication of the number of groups
contained in the data (Wilks 2006; Hart et al. 2006;
Trauth 2007). The k-means clustering method of Wilson
et al. (2013), with a city-block distance measure, was
then applied to the standardized variables to assign each
precipitation day to a synoptic type (Hart et al. 2006;
Wilson et al. 2013). The iterative nature of the k-means
technique refines the clusters by reclassifying days until
the smallest within-cluster solution is found and days
with similar meteorological characteristics are classified
in the same cluster (Hart et al. 2006). The algorithm was
tested for a range of clusters between 2 and 20. Exami-
nation of a plot of the distance measure against number
of clusters for the point at which the line flattens out, and
after which distance increases again, commonly gives an
indication of the optimum number of clusters (Wilks
2006; Tan et al. 2006; Wilson et al. 2013). This was used
in conjunction with physical interpretation of composite
maps (generated from the mean value of all days as-
signed to each cluster; Kalkstein et al. 1987). Thek-means
technique was initialized several times using random
subsets of the data as cluster seed values. The iteration for
which the sum of distances was smallest was then used as
the cluster seeds for the full dataset.
Comparison of clustering results between the ERA-
Interim andERA-40 reanalyses for an overlapping 22-yr
period produced no significant differences in the
resulting synoptic types, with a hit rate of .80% in the
assignment of individual days to the same synoptic type.
This is in agreement with Hoskins and Hodges (2005)
whose comprehensive comparison of synoptic clima-
tologies remained robust between different reanalyses
products and pre- and postsatellite eras.
The automated clustering procedure was validated by
comparison with amanual classification for a 5-yr period
(2008–12) and nonparametric hypothesis testing of the
precipitation assigned to each cluster. Surface and 500-hPa
height charts, readily available from BoM (http://
www.bom.gov.au/australia/charts/archive/), and NOAA
satellite imagery (http://www.ncdc.noaa.gov/gibbs/year)
were used to classify each day on the basis of identification
of key surface and upper-air features (Davis andKalkstein
1990; Yarnal 1993), and the presence of cloud bands.
Classification on the basis of these variables revealed
several days that could have been placed into more than
one cluster. Further inspection of additional reanalysis-
generated variables (temperature, humidity, and wind
vectors) showed that most days could belong to only one
particular cluster. Overall, only 8% of days were moved
into a different cluster on the basis of the manual anal-
ysis, from that generated by the k-means algorithm.
3. Results and analysis
a. Synoptic classification of precipitation-bearingsystems
The application of the threshold precipitation
amount to daily precipitation for the period of 1958–
2012 resulted in 3443 days being identified with inflow-
generating precipitation and requiring synoptic clas-
sification. A day was classified if at least 10mm of
precipitation was recorded in the western, high, or
eastern group. These specific days account for almost
40% of all precipitation days, that is, those for which
precipitation $ 1mm is recorded. It is acknowledged
that this definition of a precipitation day does not ac-
count for multiday precipitation events, in which a
series of synoptic types may traverse the region as a
precipitation-bearing weather system evolves through
time. Instead, each individual day is assigned to a
specific synoptic type, following Pook et al. (2006) and
Risbey et al. (2009). Figure 2 shows the annual pre-
cipitation across the different elevations (Fig. 2a) and
the annual number of precipitation days of at least
10mm (Fig. 2b) between 1958 and 2012, demonstrat-
ing the high degree of interannual variability in the
precipitation of the Snowy Mountains region. A sta-
tistically significant trend in precipitation of 138mm
(10 yr)21 in the eastern elevations is apparent, but
western and high elevations and annual precipitation
days exhibit nonsignificant decreases.
A two-sided Wilcoxon–Mann–Whitney test demon-
strated that the median rainfall amount in correspond-
ing clusters of the manual and automated classification
was equal at a 95% confidence level (p , 0.05). Fur-
thermore, the manual classification confirmed that the
automated scheme was capable of detecting expected
synoptic patterns. The types were not as clearly defined
as in previous manual-classification studies (e.g., Pook
et al. 2006; Chubb et al. 2011), however, likely because
of the greater number of variables being considered and
thus the greater possible combinations of variables as
well as the multitype nature of some synoptic systems.
AUGUST 2015 THEOBALD ET AL . 1719

The k-means clustering method, applied to the daily,
standardized reanalysis data for a range of cluster
numbers k, suggested the optimum number of clusters to
be 10 or 11 (Fig. 3). Comparison of composite maps for
each of these solutions further suggested that 11 syn-
optic types better represented known synoptic systems
and reinforced initial hierarchical clustering results. A
Wilcoxon–Mann–Whitney test determined that median
precipitation between types was significantly different,
rejecting the null hypothesis that all medians were equal
(p , 0.05), for 80% of all possible combinations (con-
sidering precipitation across all areas of the catchment).
Given that only those days experiencing precipitation$
10mm have been classified, rather than rain versus no-
rain days, and the natural variability in precipitation
amount from individual occurrences of the same type, it
is more likely that the null hypothesis will not be re-
jected in all cases. This result, along with physical in-
terpretation of composite maps for each reanalysis
parameter (Kalkstein et al. 1987; Wilson et al. 2013),
demonstrates that each of the 11 clusters represents
specific synoptic types.
Composite charts showing average meteorological
conditions for a number of key parameters for each of
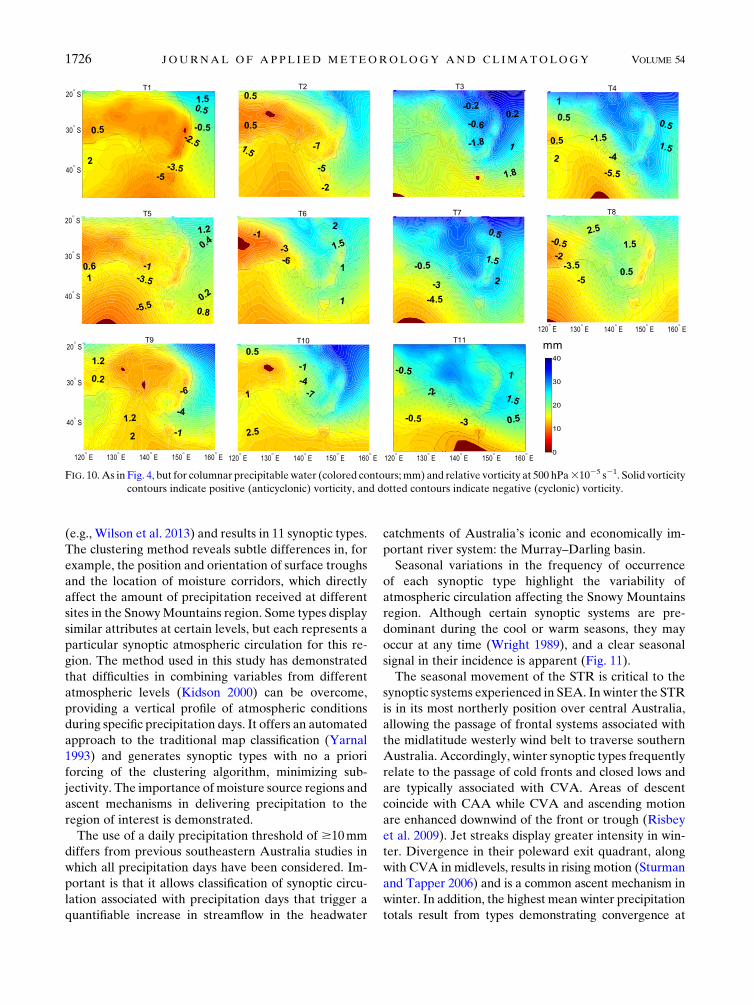
the 11 synoptic types are presented in Figs. 4–9. In ad-
dition to the clustering parameters, an analysis of co-
lumnar precipitable water (PW) and relative vorticity
FIG. 3. Within-cluster sum of distances. Similar to a scree plot,
the point at which the plot flattens out (shown by the circled area)
indicates that there are 11 clusters in the data.
FIG. 4. Compositemaps for each synoptic type showingMSLP (colored contours; hPa) and 500-hPa height (contour lines; m). Longitude
and latitude are displayed on the x and y axes, respectively. The area represented in these compositemaps is the synoptic-analysis region as
shown in Fig. 1a.
1720 JOURNAL OF APPL IED METEOROLOGY AND CL IMATOLOGY VOLUME 54

for each synoptic type was conducted, and it is shown in
Fig. 10. These additional parameters give further in-
formation on available moisture and system develop-
ment, respectively. Some between-type similarities exist
in individual variables for a given level (e.g., MSLP), but
when all variables are considered together each type
has distinct characteristics and distinguishing features.
Table 2 summarizes the three-dimensional characteris-
tics, ascent mechanisms, andmoisture pathways for each
synoptic type. The frequency of occurrence of each
synoptic type and the resulting precipitation contribu-
tions in each elevation group are presented in Table 3.
The synoptic classification reveals that 8 of the 11
types (all except T1, T5, and T9) represent atmospheric
circulation patterns with a connection to tropical lati-
tudes, in particular where a north or northwesterly air-
flow (specifically between 700 and 500 hPa; Figs. 7–9)
advects a conveyor of warm, moist air originating from
the warm oceans surrounding tropical Australia toward
the Snowy Mountains (Figs. 6–8). These tropical-
connected systems deliver over 70% of total precipita-
tion greater than 10mm across the whole catchment
(Table 3). Three of the tropical-connected synoptic
types—T8, T11, and T4—display synoptic circulation
conducive to northwest cloud bands (NWCBs). For T4,
however, NWCBs are detected on only ;10% of oc-
currences, when conditionsmatch those inWright (1989,
their Fig. 3). NWCBs form over the warm surface waters
to the northwest of Australia, where deep convection
feeds moisture from the tropical Indian Ocean along the
cloud band to southeastern Australia (Tapp and Barrell
1984; Sturman and Tapper 2006). This circulation, evi-
dent in Figs. 4 and 5 for T8 (and to a lesser extent T4 and
T11), features moisture aligned with the core of the STJ
and its region of maximum intensity [as shown in Tapp
and Barrell (1984)]. Together these three synoptic types
account for 26% of all days over 10mm. In a similar
way, and as confirmed by the manual classification,
T10-classified synoptic types have circulation that is
conducive to cloud bands extending northward along
the east coast, commonly seen as an easterly dip and
cloud-band pattern (Gallant et al. 2012; Fiddes et al.
2015). Downstream anticyclones and ridging—apparent
in T3, T4, T6, T7, T8, T10, and T11—contribute to
tropical moisture transport and enhancement of warm
air advection (WAA; Fig. 6), which, combined with an
anticlockwise rotation of winds with height (‘‘backing’’),
signifies forced ascent (Figs. 7–9). With the exception of
FIG. 5. As in Fig. 4, but showing the subtropical jet stream strength at the 250-hPa level (colored contours; m s21) and direction
(black arrows).
AUGUST 2015 THEOBALD ET AL . 1721
T11, all tropical-connected systems demonstrate upper-
level divergence in the exit quadrant of the STJ (Fig. 5).
All synoptic types exhibit airflow directions that are
conducive to orographic enhancement of precipitation.
Synoptic types T1, T2, T5, T6, and T8 can be grouped
as cold-cored frontal-type days [including contributions
from closed and cutoff lows (T2 and T6) and prefrontal
troughs (T5 and T8)], and together account for 53% of
all classified precipitation days (Table 3). Cutoff lows
here follow the definition in the SEA studies of Pook
et al. (2006), Risbey et al. (2009), and Chubb et al.
(2011), among others, in which closed circulation can be
apparent at the surface or midlevels with a trough above
or below, respectively. Themanual analysis showed that
T2 fulfils the traditional criteria of cutoff lows on ap-
proximately 60% (50%) of occurrences and T6 fulfils
them on 72% (44%) of occurrences when considering
MSLP (500-hPa geopotential height). In addition,
closed-low types have associated fronts on 75% (T2)
and 45% (T6) of occurrences. Cold-frontal types have
in common differential cyclonic vorticity advection
(CVA) at 500 hPa as an ascent mechanism (Fig. 10), but
closed-low types demonstrate stronger cyclonic vortic-
ity maxima than do embedded cold fronts and pre-
frontal types. The types T4 and T7 show the signature of
heat lows and troughs interacting with cold-cored
extratropical fronts to the south of Australia (Sturman
and Tapper 2006; Gallant et al. 2012). Localized accel-
eration of the STJ core along the enhanced thickness
gradient, jet-stream divergence in the poleward exit
quadrant, and strong WAA (associated with strong
downstream anticyclones) are consistent with enhanced
system development and higher precipitation totals
(Risbey et al. 2009). Cold fronts (T1) occur at a fre-
quency that is similar to those of other frontal types,
although they deliver smaller amounts of precipitation
across all elevations, consistent with lower humidity and
precipitable water. Strong cold-air advection (CAA),
clockwise rotation of winds with height, and jet-streak
divergence downstream of the front indicate ascent is
provided primarily by frontal lift. Development of
closed and cutoff lows is associated with a localization
and concentration of the STJ, often forming on the
poleward side of the jet. This relationship is represented
in Fig. 5, which shows a strong jet core located to the
north of the closed low for types 2 and 6. Similarly, for
classifications that include the passage of a cold front
(T1 and, to some extent, T5), meridional excursions of
the polar jet that cause it to merge with the subtropical
jet near the location of the front are a known feature
(Sturman and Tapper 2006; Risbey et al. 2009). Fur-
thermore, Risbey et al. (2009) associate cyclonic
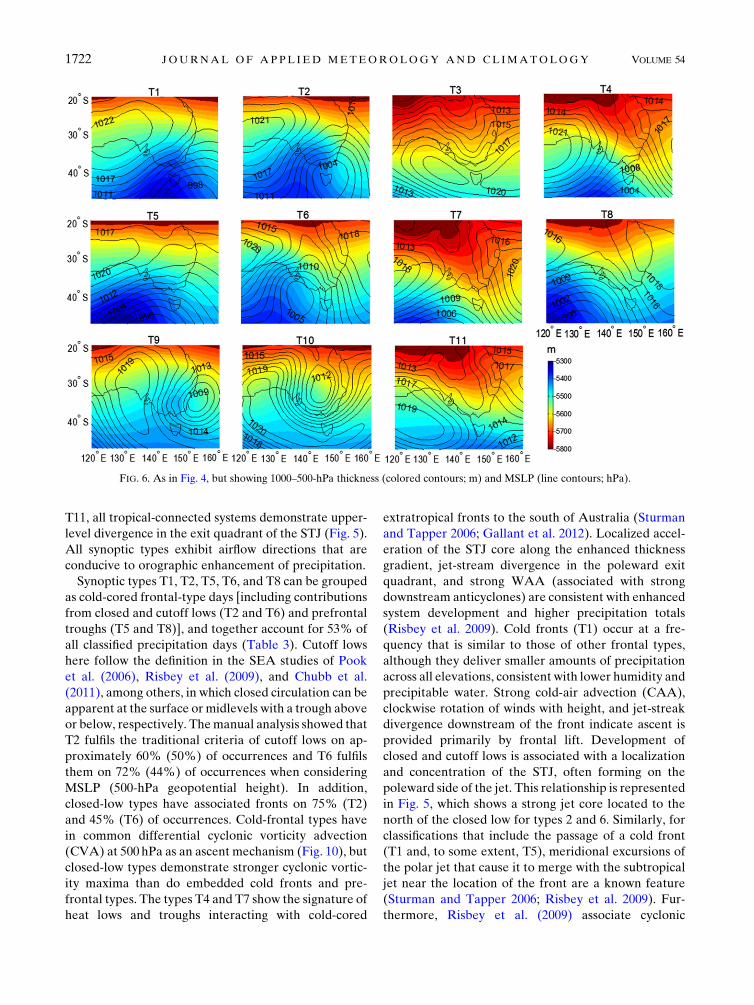
FIG. 6. As in Fig. 4, but showing 1000–500-hPa thickness (colored contours; m) and MSLP (line contours; hPa).
1722 JOURNAL OF APPL IED METEOROLOGY AND CL IMATOLOGY VOLUME 54
curvature of the jet-stream core, the exit region of
which is divergent, with the largest amounts of pre-
cipitation (.5mm and, in particular, for synoptic systems
that produce $ 15mm of precipitation) from frontal
systems—evident here in Fig. 6 for frontal-type days
over 10mm.
Synoptic type T3 is representative of inland heat
troughs extending from a low pressure center in north-
ern Australia—known locally as the Cloncurry low
(Sturman and Tapper 2006; Gallant et al. 2012). Strong
WAA, into the divergent region of the jet stream, is
apparent in the vicinity of the trough (Fig. 6).
Topographic interaction of the prevailing airflow in
each synoptic type creates differences in precipitation
contributions between elevation areas. Synoptic types
generating the greatest precipitation totals across
westerly elevations are the result of approaching cold
fronts or troughs, closed lows and troughs that extend
toward northwest Western Australia (T2, T4, T6, T7,
and T8; Table 3). This is similar for the high elevations,
where NWCBs associated with days that are classified
as type 8 and with closed lows (T6) bring the highest
percentage of precipitation totals per day. A common
feature in each of these types (T2, T4, T6, T7, and T8)
is a downstream anticyclone, with WAA and relatively
high PW to the northeast and northwest of the study
region (Figs. 6 and 10), along with divergence in the
poleward exit quadrant of the jet stream (Fig. 5) and
orographic enhancement. As a result, thermal wind
is enhanced and directed southeastward along the
thickness gradient, causing acceleration of the STJ
(Fig. 5)—apparent here for those synoptic systems
classified as T2, T6, and T8. Classifications that include
closed lows alone account for approximately 20% of
days and contribute 26%, 23%, and 16% of total pre-
cipitation to the western, high, and eastern groups,
respectively.
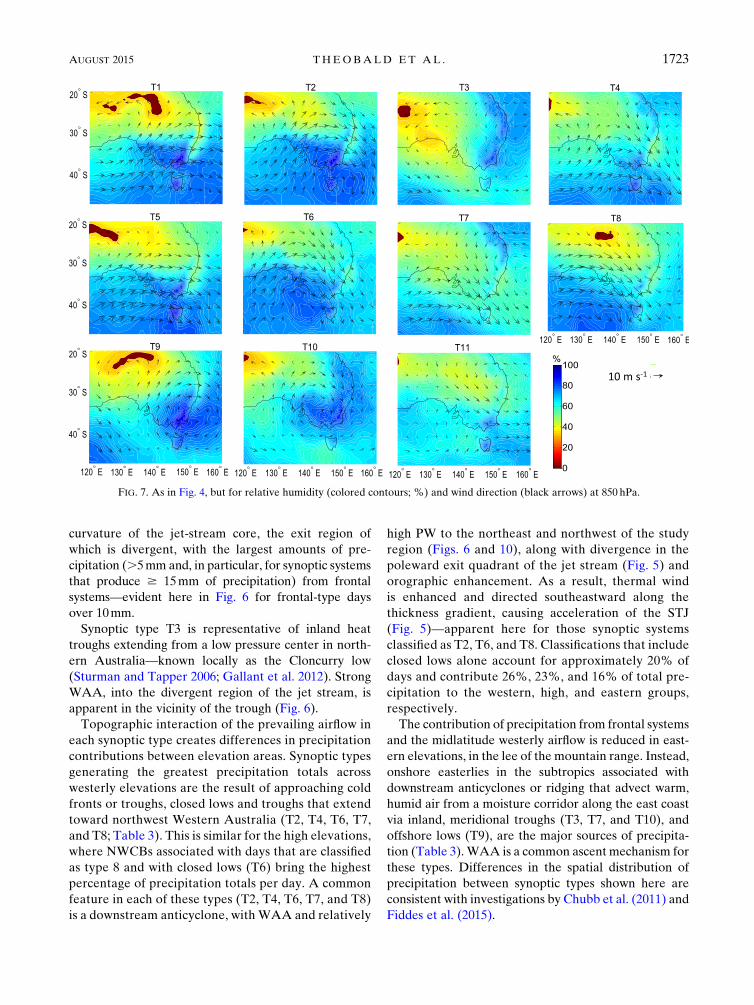
The contribution of precipitation from frontal systems
and the midlatitude westerly airflow is reduced in east-
ern elevations, in the lee of the mountain range. Instead,
onshore easterlies in the subtropics associated with
downstream anticyclones or ridging that advect warm,
humid air from a moisture corridor along the east coast
via inland, meridional troughs (T3, T7, and T10), and
offshore lows (T9), are the major sources of precipita-
tion (Table 3). WAA is a common ascent mechanism for
these types. Differences in the spatial distribution of
precipitation between synoptic types shown here are
consistent with investigations by Chubb et al. (2011) and
Fiddes et al. (2015).
FIG. 7. As in Fig. 4, but for relative humidity (colored contours; %) and wind direction (black arrows) at 850 hPa.
AUGUST 2015 THEOBALD ET AL . 1723

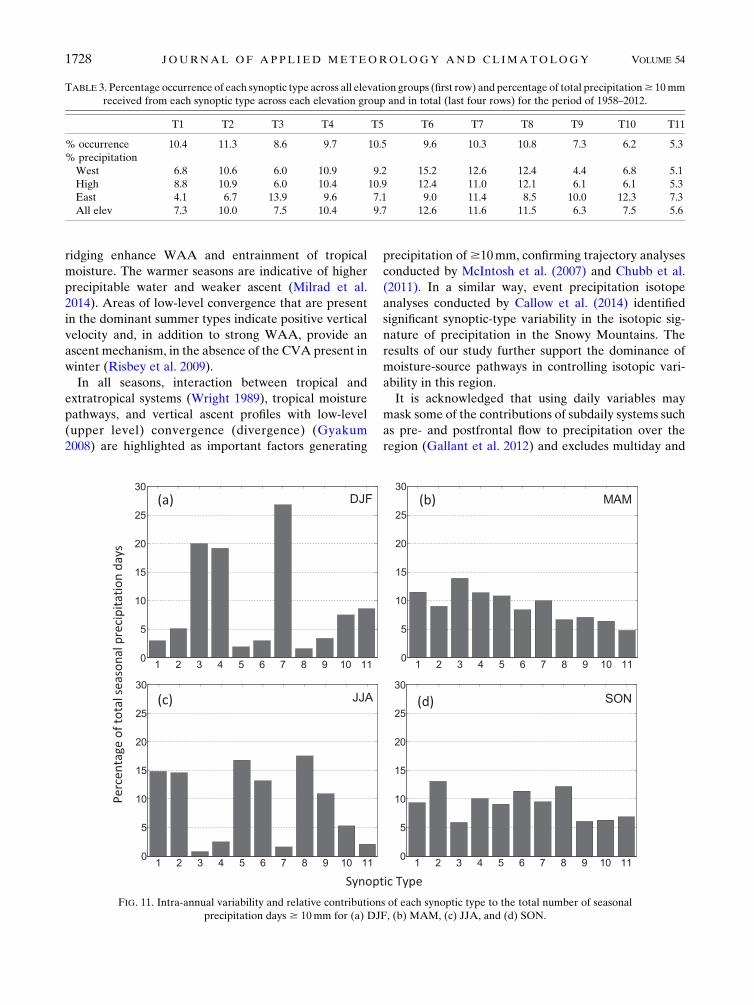
b. Seasonality of synoptic types
Clear seasonality in the frequency of synoptic types is
evident in Fig. 11, which reflects seasonal movement of
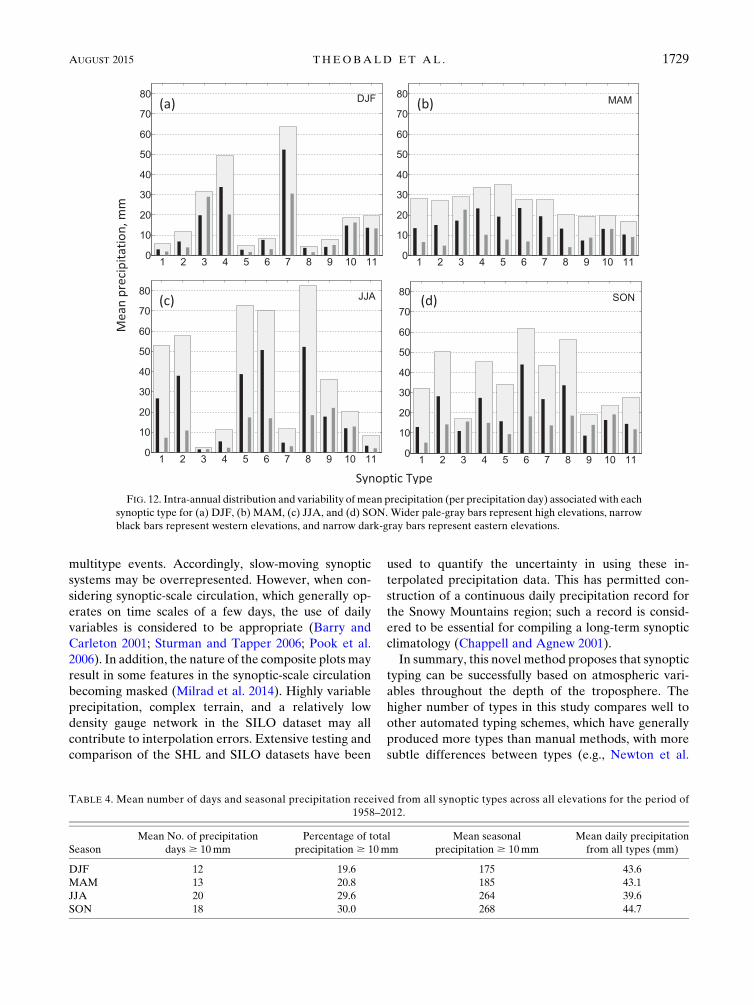
the STR. The mean contribution of each type to sea-
sonal precipitation accumulations (Fig. 12) demon-
strates the high degree of intra-annual variability. The
greatest between-type variability, in terms of both fre-
quency and precipitation, occurs in winter and summer.
Orographic enhancement of precipitation for all types is
evident, with highest elevations consistently receiving
the largest precipitation totals in all seasons (Fig. 12).
The majority of types can produce seasonal precipita-
tion accumulations beyond the 95th percentile (.2 stan-
dard deviations) and could be considered as extreme
(Pook et al. 2012). Notable large falls of precipitation,
exceeding 300mm in thewestern and high elevations, have
resulted from the dominant types T4 and T7 in summer
(not shown). As noted in section 3a, these types display
properties that are consistent with enhanced system de-
velopment, strong WAA, and higher precipitation totals.
Table 4 summarizes the mean precipitation from all
days per season and reinforces previous studies that this
region is dominated by cool-season precipitation (nearly
60%), often associated with frontal and closed-low
systems in the lower-to-midtroposphere (surface–500hPa;
Figs. 11 and 12). However, this study highlights that a sig-
nificant proportion of inflow-generating precipitation days
of $10mm (approximately 20%) are recorded during
summer months, often related to the occurrence of inland
heat troughs (i.e., T4 and T7) and increased convection. A
further 20% of days occurred in the transitional autumn
season. Mean daily precipitation from all synoptic types is
similar in all seasons, but the fewer number of precipitation
days occurring in summer and autumn and the higher PW
indicate a higher intensity for warm-season precipitation
days (Table 4).
In austral summer (DJF), precipitation is dominated
by warm-cored heat-trough types T3, T4, and T7. Sum-
mer types are associated with weaker midlevel troughs
and weaker cyclonic vorticity, often displaced upstream
of the SnowyMountains. Instead, stronger ridges, higher
moisture, enhanced WAA, and low-level (upper level)
convergence (divergence) dominate and act as ascent
mechanisms. Moist air, with high PW, is entrained from
tropical latitudes toward the Snowy Mountains region
(Figs. 6–8, 10). These systems deliver relatively consis-
tent falls across all elevations (Fig. 12).
The occurrence of each synoptic type and their asso-
ciated precipitation are more consistent in autumn
FIG. 8. As in Fig. 7, but for 700 hPa.
1724 JOURNAL OF APPL IED METEOROLOGY AND CL IMATOLOGY VOLUME 54
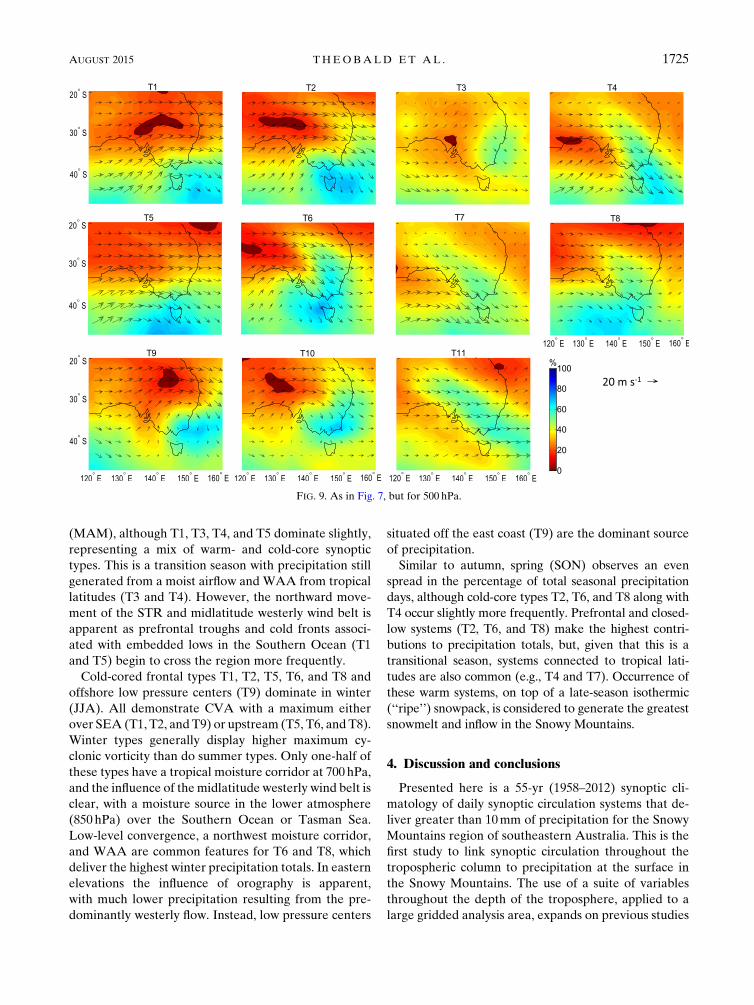
(MAM), although T1, T3, T4, and T5 dominate slightly,
representing a mix of warm- and cold-core synoptic
types. This is a transition season with precipitation still
generated from a moist airflow and WAA from tropical
latitudes (T3 and T4). However, the northward move-
ment of the STR and midlatitude westerly wind belt is
apparent as prefrontal troughs and cold fronts associ-
ated with embedded lows in the Southern Ocean (T1
and T5) begin to cross the region more frequently.
Cold-cored frontal types T1, T2, T5, T6, and T8 and
offshore low pressure centers (T9) dominate in winter
(JJA). All demonstrate CVA with a maximum either
over SEA (T1, T2, and T9) or upstream (T5, T6, and T8).
Winter types generally display higher maximum cy-
clonic vorticity than do summer types. Only one-half of
these types have a tropical moisture corridor at 700 hPa,
and the influence of themidlatitude westerly wind belt is
clear, with a moisture source in the lower atmosphere
(850 hPa) over the Southern Ocean or Tasman Sea.
Low-level convergence, a northwest moisture corridor,
and WAA are common features for T6 and T8, which
deliver the highest winter precipitation totals. In eastern
elevations the influence of orography is apparent,
with much lower precipitation resulting from the pre-
dominantly westerly flow. Instead, low pressure centers
situated off the east coast (T9) are the dominant source
of precipitation.
Similar to autumn, spring (SON) observes an even
spread in the percentage of total seasonal precipitation
days, although cold-core types T2, T6, and T8 along with
T4 occur slightly more frequently. Prefrontal and closed-
low systems (T2, T6, and T8) make the highest contri-
butions to precipitation totals, but, given that this is a
transitional season, systems connected to tropical lati-
tudes are also common (e.g., T4 and T7). Occurrence of
these warm systems, on top of a late-season isothermic
(‘‘ripe’’) snowpack, is considered to generate the greatest
snowmelt and inflow in the Snowy Mountains.
4. Discussion and conclusions
Presented here is a 55-yr (1958–2012) synoptic cli-
matology of daily synoptic circulation systems that de-
liver greater than 10mm of precipitation for the Snowy
Mountains region of southeastern Australia. This is the
first study to link synoptic circulation throughout the
tropospheric column to precipitation at the surface in
the Snowy Mountains. The use of a suite of variables
throughout the depth of the troposphere, applied to a
large gridded analysis area, expands on previous studies
FIG. 9. As in Fig. 7, but for 500 hPa.
AUGUST 2015 THEOBALD ET AL . 1725
(e.g., Wilson et al. 2013) and results in 11 synoptic types.
The clustering method reveals subtle differences in, for
example, the position and orientation of surface troughs
and the location of moisture corridors, which directly
affect the amount of precipitation received at different
sites in the SnowyMountains region. Some types display
similar attributes at certain levels, but each represents a
particular synoptic atmospheric circulation for this re-
gion. The method used in this study has demonstrated
that difficulties in combining variables from different
atmospheric levels (Kidson 2000) can be overcome,
providing a vertical profile of atmospheric conditions
during specific precipitation days. It offers an automated
approach to the traditional map classification (Yarnal
1993) and generates synoptic types with no a priori
forcing of the clustering algorithm, minimizing sub-
jectivity. The importance of moisture source regions and
ascent mechanisms in delivering precipitation to the
region of interest is demonstrated.
The use of a daily precipitation threshold of $10mm
differs from previous southeastern Australia studies in
which all precipitation days have been considered. Im-
portant is that it allows classification of synoptic circu-
lation associated with precipitation days that trigger a
quantifiable increase in streamflow in the headwater
catchments of Australia’s iconic and economically im-
portant river system: the Murray–Darling basin.
Seasonal variations in the frequency of occurrence
of each synoptic type highlight the variability of
atmospheric circulation affecting the Snowy Mountains
region. Although certain synoptic systems are pre-
dominant during the cool or warm seasons, they may
occur at any time (Wright 1989), and a clear seasonal
signal in their incidence is apparent (Fig. 11).
The seasonal movement of the STR is critical to the
synoptic systems experienced in SEA. In winter the STR
is in its most northerly position over central Australia,
allowing the passage of frontal systems associated with
the midlatitude westerly wind belt to traverse southern
Australia. Accordingly, winter synoptic types frequently
relate to the passage of cold fronts and closed lows and
are typically associated with CVA. Areas of descent
coincide with CAA while CVA and ascending motion
are enhanced downwind of the front or trough (Risbey
et al. 2009). Jet streaks display greater intensity in win-
ter. Divergence in their poleward exit quadrant, along
with CVA in midlevels, results in rising motion (Sturman
and Tapper 2006) and is a common ascent mechanism in
winter. In addition, the highest mean winter precipitation
totals result from types demonstrating convergence at
FIG. 10. As in Fig. 4, but for columnar precipitablewater (colored contours;mm) and relative vorticity at 500 hPa31025 s21. Solid vorticity
contours indicate positive (anticyclonic) vorticity, and dotted contours indicate negative (cyclonic) vorticity.
1726 JOURNAL OF APPL IED METEOROLOGY AND CL IMATOLOGY VOLUME 54

850hPa and trajectories of warm, moist air from tropical
latitudes (T6 and T8).
In summer, the southward movement of the STR sees
southern Australia under the influence of a band of high
pressure, associated with the descending branch of the
Hadley cell. Accordingly, frontal systems associated
with themidlatitude westerly wind belt are pushed south
of Australia. Instead, downstream anticyclones and
TABLE 2. Description of key characteristics for each synoptic type. Directional information is referred to withstandard compass-point
notation: north (N), west (W), south (S), east (E) and corresponding points between.
Synoptic type Synoptic summary Ascent mechanism Moisture pathway
T1: embedded cold
fronts
Cold fronts over or rapidly approaching
region; cold core; midlevel trough; no
connection to tropics
Frontal lift; CVA; convergence of polar
jet and STJ over Tasmania; weak
downstream divergence in poleward
exit quadrant of jet streak
Southern Ocean; no
tropical moisture
connection at any
tropospheric level
T2: closed lows Closed lows, including cutoff lows
centered over Tasmania; cold core;
weak downstream ridge; strong
trough at 500 hPa, with cutoff
circulation on ;50% of occasions
WAA over Coral Sea enhanced by
downstream ridge; CVA; divergence
in poleward exit quadrant of STJ jet
streak over Snowy Mountains region
Southern Ocean 850 hPa;
NW tropical 700 hPa
T3: inland heat
troughs
Heat troughs extend equatorward from
low pressure center in northwest
Queensland; warm core; downstream
anticyclone; midlevel trough
Convergent airflow at 850 hPa; winds
back strongly; strong WAA, enhanced
by downstream ridging; weak
divergence in poleward exit quadrant
of STJ
NE tropical 850–500 hPa;
high PW content
(;40mm) along NE
pathway
T4: narrow,
interacting,
inland heat
troughs
Narrow inland heat troughs aligned
NW–SE, interacting with cold-core
low; strong downstream anticyclone;
upstream midlevel trough; NWCBs
on ;10% of occasions
Convergent airflow at 850 hPa; WAA
into divergent poleward exit
quadrant of STJ
Southern Ocean and NE
tropical 850 hPa; NW
tropical 700–500 hPa;
high (;40mm) PW
along NE and NW
pathways
T5: prefrontal
troughs;
approaching
cold fronts
Prefrontal troughs and approaching cold
fronts (west of Snowy Mountains);
cold core; upstream midlevel trough
CVA; divergence in poleward exit
quadrant of jet streak, south of
Snowy Mountains region
Southern Ocean; no
tropical moisture
connection
T6: upstream
closed lows
Approaching closed lows, including
cutoff lows over bight; cold core;
downstream anticyclone; upstream,
strong midlevel trough, with cutoff
circulation on ;45% of occasions
Downstream anticyclone enhances
WAA into area of divergent
poleward exit quadrant of jet streak;
CVA; winds back strongly
Southern Ocean 850 hPa;
NW 700–500 hPa;
moderate PW
(;25mm) along
NW pathway
T7: broad,
interacting
inland heat
troughs
Broad inland heat troughs west of study
region, aligned N–S; interaction with
low pressure system SW of region;
strong downstream anticyclone
Convergent airflow at 850 hPa; WAA
enhanced by downstream anticyclone;
divergence in poleward exit quadrant
of STJ SW of Snowy Mountains
NE tropical 850 hPa;
NW tropical
700–500 hPa; extensive
area of high PW
(;40mm) along NE
and NW pathways
T8: approaching
prefrontal
troughs and
cold fronts
NWCBs
Approaching cold fronts and prefrontal
troughs aligned NW–SE; warm core;
strong downstream anticyclone;
NWCBs on ;40% of occasions
WAA, enhanced by downstream
anticyclone; divergence in poleward
exit quadrant of jet streak upstream
of Snowy Mountains; CVA; winds
back strongly
Southern Ocean 850 hPa;
NW tropical
700–500 hPa; moderate
(;20mm) PW along
NW pathway
T9: offshore low
pressure
systems
Offshore low pressure centers and
troughs; includes east coast lows; cold
core; midlevel closed circulation; no
interaction with tropics
WAA on poleward side of cyclonic
circulation; CVA
Tasman Sea; no tropical
moisture connection
at any level; moderate
PW (;25mm) over
Tasman Sea
T10: easterly
dips
Closed low pressure centers and troughs
aligned N–S, N, or NW of Snowy
Mountains and extending to tropics;
cold core; midlevel closed circulation
Convergent airflow at 850 hPa;
downstream ridging and associated
WAA; divergence in poleward exit
quadrant of STJ
NE tropical 850–500 hPa;
high (.30mm) PW
along NE pathway
T11: noninteracting
inland heat
troughs
Inland troughs; warm-core lows over
central Australia; lack of upstream
trough; NWCBs on ;35% of
occasions
Convergent airflow at 850 hPa;
downstream anticyclone enhances
WAA; winds back strongly
NW tropical
850–500 hPa; high PW
(;30mm) along
NW pathway
AUGUST 2015 THEOBALD ET AL . 1727
ridging enhance WAA and entrainment of tropical
moisture. The warmer seasons are indicative of higher
precipitable water and weaker ascent (Milrad et al.
2014). Areas of low-level convergence that are present
in the dominant summer types indicate positive vertical
velocity and, in addition to strong WAA, provide an
ascent mechanism, in the absence of the CVA present in
winter (Risbey et al. 2009).
In all seasons, interaction between tropical and
extratropical systems (Wright 1989), tropical moisture
pathways, and vertical ascent profiles with low-level
(upper level) convergence (divergence) (Gyakum
2008) are highlighted as important factors generating
precipitation of$10mm, confirming trajectory analyses
conducted by McIntosh et al. (2007) and Chubb et al.
(2011). In a similar way, event precipitation isotope
analyses conducted by Callow et al. (2014) identified
significant synoptic-type variability in the isotopic sig-
nature of precipitation in the Snowy Mountains. The
results of our study further support the dominance of
moisture-source pathways in controlling isotopic vari-
ability in this region.
It is acknowledged that using daily variables may
mask some of the contributions of subdaily systems such
as pre- and postfrontal flow to precipitation over the
region (Gallant et al. 2012) and excludes multiday and
TABLE 3. Percentage occurrence of each synoptic type across all elevation groups (first row) and percentage of total precipitation$ 10mm
received from each synoptic type across each elevation group and in total (last four rows) for the period of 1958–2012.
T1 T2 T3 T4 T5 T6 T7 T8 T9 T10 T11
% occurrence 10.4 11.3 8.6 9.7 10.5 9.6 10.3 10.8 7.3 6.2 5.3
% precipitation
West 6.8 10.6 6.0 10.9 9.2 15.2 12.6 12.4 4.4 6.8 5.1
High 8.8 10.9 6.0 10.4 10.9 12.4 11.0 12.1 6.1 6.1 5.3
East 4.1 6.7 13.9 9.6 7.1 9.0 11.4 8.5 10.0 12.3 7.3
All elev 7.3 10.0 7.5 10.4 9.7 12.6 11.6 11.5 6.3 7.5 5.6
FIG. 11. Intra-annual variability and relative contributions of each synoptic type to the total number of seasonal
precipitation days $ 10mm for (a) DJF, (b) MAM, (c) JJA, and (d) SON.
1728 JOURNAL OF APPL IED METEOROLOGY AND CL IMATOLOGY VOLUME 54
multitype events. Accordingly, slow-moving synoptic
systems may be overrepresented. However, when con-
sidering synoptic-scale circulation, which generally op-
erates on time scales of a few days, the use of daily
variables is considered to be appropriate (Barry and
Carleton 2001; Sturman and Tapper 2006; Pook et al.
2006). In addition, the nature of the composite plots may
result in some features in the synoptic-scale circulation
becoming masked (Milrad et al. 2014). Highly variable
precipitation, complex terrain, and a relatively low
density gauge network in the SILO dataset may all
contribute to interpolation errors. Extensive testing and
comparison of the SHL and SILO datasets have been
used to quantify the uncertainty in using these in-
terpolated precipitation data. This has permitted con-
struction of a continuous daily precipitation record for
the Snowy Mountains region; such a record is consid-
ered to be essential for compiling a long-term synoptic
climatology (Chappell and Agnew 2001).
In summary, this novel method proposes that synoptic
typing can be successfully based on atmospheric vari-
ables throughout the depth of the troposphere. The
higher number of types in this study compares well to
other automated typing schemes, which have generally
produced more types than manual methods, with more
subtle differences between types (e.g., Newton et al.
FIG. 12. Intra-annual distribution and variability of mean precipitation (per precipitation day) associated with each
synoptic type for (a) DJF, (b) MAM, (c) JJA, and (d) SON. Wider pale-gray bars represent high elevations, narrow
black bars represent western elevations, and narrow dark-gray bars represent eastern elevations.
TABLE 4. Mean number of days and seasonal precipitation received from all synoptic types across all elevations for the period of
1958–2012.
Season
Mean No. of precipitation
days $ 10mm
Percentage of total
precipitation $ 10mm
Mean seasonal
precipitation $ 10mm
Mean daily precipitation
from all types (mm)
DJF 12 19.6 175 43.6
MAM 13 20.8 185 43.1
JJA 20 29.6 264 39.6
SON 18 30.0 268 44.7
AUGUST 2015 THEOBALD ET AL . 1729
2014a,b; Plavcova et al. 2014; Kidson 2000). Although
the k-means technique has been widely used in synoptic
classifications, this is the first time, to our knowledge,
that it has been applied to multilevel and multiparam-
eter gridded meteorological data. It has revealed the
complex three-dimensional nature of synoptic-scale
circulation, including the importance of the influence
of moisture pathways from tropical latitudes in the
generation of high precipitation totals. It provides a
method for linking regional-scale precipitation data to
synoptic-scale atmospheric circulation. The spatial dis-
tribution of precipitation associated with synoptic types
has implications for water resources management (Frei
and Schär 1998; Newton et al. 2014a,b) in this region.
The synoptic-typing method that was applied here
allows long-term and climatologically significant periods
to be examined, enabling a robust investigation of the
impacts of synoptic circulation on the hydroclimate of
the Snowy Mountains region. Future research will in-
vestigate temporal variability of the synoptic types in
relation to interannual drivers of climate variability.
Increased understanding gained from this synoptic cli-
matology has implications for water resource manage-
ment in regional areas, and this method could be readily
applied to other hydroclimate studies and to other re-
gions worldwide.
Acknowledgments. We thank Snowy Hydro Limited
scientific staff for helpful and constructive discussions,
and we thank three anonymous reviewers whose com-
ments have greatly improved this manuscript. We also
thank Joshua Soderholm for initial assistance with pro-
gramming. Alison Theobald was supported by an
Australian Postgraduate Award and by Snowy Hydro
Limited. We thank Snowy Hydro Limited and the
Queensland Government Department of Science, In-
formation Technology, Innovation and the Arts for pro-
viding precipitation data. ERA-Interim and ERA-40 data
were provided by ECMWF (Reading, United Kingdom;
http://apps.ecmwf.int/datasets/). Satellite imagery was pro-
vided by NOAA (http://www.ncdc.noaa.gov/gibbs/year).
REFERENCES
Barry, R. G., 1992: Mountain Weather and Climate. 2nd ed.
Routledge, 402 pp.
——, and A. M. Carleton, 2001: Synoptic and Dynamic Climatol-
ogy. Routledge, 620 pp.
Basist, A., G. D. Bell, and V. Meentemeyer, 1994: Statistical re-
lationships between topography and precipitation patterns.
J. Climate, 7, 1305–1315, doi:10.1175/1520-0442(1994)007,1305:
SRBTAP.2.0.CO;2.
Beesley, C. A., A. J. Frost, and J. Zajaczkowski, 2009: A compar-
ison of the BAWAP and SILO spatially interpolated daily
rainfall datasets. Proc. 18th World IMACS/MODSIM Con-
gress, Cairns, Australia, Modelling and Simulation Society of
Australia and New Zealand and International Association for
Mathematics and Computers in Simulation, 3886–3892.
[Available online at http://www.mssanz.org.au/modsim09/I13/
beesley.pdf.]
Beniston, M., 2003: Climatic change in mountain regions: A review
of possible impacts. Climatic Change, 59, 5–31, doi:10.1023/
A:1024458411589.
Bettolli, M. L., O. C. Penalba, and W. M. Vargas, 2010: Synoptic
weather types in the south of South America and their re-
lationship to daily rainfall in the core crop-producing region in
Argentina. Aust. Meteor. Oceanogr. J., 60, 37–48.
Bureau of Meteorology, 2012: Exceptional heavy rainfall across
southeast Australia. Bureau of Meteorology Special Climate
Statement 39, 19 pp. [Available online at http://www.bom.gov.
au/climate/current/statements/scs39.pdf.]
Cai, W., and T. Cowan, 2008: Evidence of impacts from rising
temperature on inflows to the Murray-Darling Basin. Geo-
phys. Res. Lett., 35, L07701, doi:10.1029/2008GL033390.
——, G. Shi, T. Cowan, D. Bi, and J. Ribbe, 2005: The response of
the southern annular mode, the East Australian Current, and
the southernmid-latitude ocean circulation to global warming.
Geophys. Res. Lett., 32, L23706, doi:10.1029/2005GL024701.
Callow,N., H.McGowan, L.Warren, and J. Speirs, 2014:Drivers of
precipitation stable isotope variability in an alpine setting,
Snowy Mountains, Australia. J. Geophys. Res. Atmos., 119,
3016–3031, doi:10.1002/2013JD020710.
Cassano, E. N., and J. J. Cassano, 2010: Synoptic forcing of pre-
cipitation in the Mackenzie and Yukon River basins. Int.
J. Climatol., 30, 658–674, doi:10.1002/joc.1926.
Chappell, A., and C. T. Agnew, 2001: Geostatistical analysis and
numerical simulation of West African Sahel rainfall. Land
Degradation, A. J. Conacher, Ed., GeoJournal Library, Vol.
58, Springer, 19–35.
Chiew, F. H. S., W. J. Young, andW. Cai, 2011: Current drought and
future hydroclimate projections in southeast Australia and im-
plications for water resources management. Stochastic Environ.
Res. Risk Assess., 25, 601–612, doi:10.1007/s00477-010-0424-x.
Christensen, J. H., and Coauthors, 2007: Regional climate pro-
jections. Climate Change 2007: The Physical Science Basis,
S. Solomon et al., Eds., Cambridge University Press, 847–940.
Chubb, T. H., S. T. Siems, and M. J. Manton, 2011: On the decline
of wintertime precipitation in the Snowy Mountains of
southeastern Australia. J. Hydrometeor., 12, 1483–1497,
doi:10.1175/JHM-D-10-05021.1.
Colquhoun, J. R., 1978: Snowfall on the New South Wales Snowy
Mountains. Department of Science and the Environment
Bureau of Meteorology Tech. Rep. 25, 33 pp. [Available online
at http://www.australianweathernews.com/snow/Colquhoun_
Snowfall_NSW_Snowy_Mountains.pdf.]
Dai, J., M. Manton, S. Siems, and E. Ebert, 2014: Estimation of
daily winter precipitation in the Snowy Mountains of south-
eastern Australia. J. Hydrometeor., 15, 909–920, doi:10.1175/
JHM-D-13-081.1.
Davis, R. E., and L. S. Kalkstein, 1990: Development of an auto-
mated spatial synoptic climatological classification. Int.
J. Climatol., 10, 769–794, doi:10.1002/joc.3370100802.
Dee, D. P., and Coauthors, 2011: The ERA-Interim reanalysis:
Configuration and performance of the data assimilation sys-
tem. Quart. J. Roy. Meteor. Soc., 137, 553–597, doi:10.1002/
qj.828.
Drosdowsky, W., 2005: The latitude of the subtropical ridge over
eastern Australia: The L index revisited. Int. J. Climatol., 25,
1291–1299, doi:10.1002/joc.1196.
1730 JOURNAL OF APPL IED METEOROLOGY AND CL IMATOLOGY VOLUME 54

Eder, B. K., J. M. Davis, and P. Bloomfield, 1994: An automated
classification scheme designed to better elucidate the dependence
of ozone on meteorology. J. Appl. Meteor., 33, 1182–1199,
doi:10.1175/1520-0450(1994)033,1182:AACSDT.2.0.CO;2.
Eichler, T. P., and J. Gottschalck, 2013: A comparison of Southern
Hemisphere cyclone track climatology and interannual vari-
ability in coarse-gridded reanalysis datasets. Adv. Meteor.,
891260, doi:10.1155/2013/891260.
Fiddes, S., A. B. Pezza, and V. Barras, 2015: Synoptic climatology
of extreme precipitation in alpine Australia. Int. J. Climatol.,
35, 172–188, doi:10.1002/joc.3970.
Frei, C., and C. Schär, 1998: A precipitation climatology of the
Alps from high-resolution rain-gauge observations. Int. J. Clima-
tol., 18, 873–900, doi:10.1002/(SICI)1097-0088(19980630)18:
8,873::AID-JOC255.3.0.CO;2-9.
Gallant, A. J. E., A. S. Kiem, D. C. Verdon-Kidd, R. C. Stone, and
D. J. Karoly, 2012: Understanding hydroclimate processes
in the Murray-Darling Basin for natural resources manage-
ment. Hydrol. Earth Syst. Sci., 16, 2049–2068, doi:10.5194/
hess-16-2049-2012.
Gao, X., P. Schlosser, E. Monier, and D. Entekhabi, 2014: An
analogue approach to identify heavy precipitation events:
Evaluation and application to CMIP5 climate models in the
United States. J. Climate, 27, 5941–5963, doi:10.1175/
JCLI-D-13-00598.1.
Ghassemi, F., and I. White, 2007: Inter-Basin Water Transfer: Case
Studies from Australia, United States, Canada, China and In-
dia. 1st ed. International Hydrology Series, Cambridge Uni-
versity Press, 462 pp.
Gyakum, J. R., 2008: The application of Fred Sanders’ teaching to
current research on extreme cold-season precipitation events
in the Saint Lawrence River valley region. Synoptic–Dynamic
Meteorology and Weather Analysis and Forecasting, Meteor.
Monogr., No. 55, Amer. Meteor. Soc., 241–250.
Hart,M., R. deDear, and R.Hyde, 2006: A synoptic climatology of
tropospheric ozone episodes in Sydney, Australia. Int.
J. Climatol., 26, 1635–1649, doi:10.1002/joc.1332.
Hendrikx, J., C. Zammit, E. Ö. Hreinsson, and S. Becken, 2013:
A comparative assessment of the potential impact of cli-
mate change on the ski industry in New Zealand and
Australia. Climatic Change, 119, 965–978, doi:10.1007/
s10584-013-0741-4.
Hennessy, K., P. Whetton, I. Smith, J. Bathols, M. Hutchinson, and
J. Sharples, 2003: The impact of climate change on snow
conditions in mainland Australia. CSIRO Atmospheric
Research Rep., 47 pp. [Available online at http://www.
climatechange.vic.gov.au/__data/assets/pdf_file/0015/73212/
TheImpactofClimateChangeonSnowConditions2003.pdf.]
——, ——, K. Walsh, I. N. Smith, J. M. Bathols, M. Hutchinson,
and J. Sharples, 2008: Climate change effects on snow condi-
tions in mainland Australia and adaptation at ski resorts
through snowmaking. Climate Res., 35, 255–270, doi:10.3354/
cr00706.
Hoskins, B. J., and K. I. Hodges, 2005: A new perspective on
Southern Hemisphere storm tracks. J. Climate, 18, 4108–4129,
doi:10.1175/JCLI3570.1.
Jeffrey, S. J., J. O. Carter, K. B. Moodie, and A. R. Beswick, 2001:
Using spatial interpolation to construct a comprehensive ar-
chive of Australian climate data. Environ. Modell. Software,
16, 309–330, doi:10.1016/S1364-8152(01)00008-1.
Jiang, N., 2011: A new objective procedure for classifying New
Zealand synoptic weather types during 1958–2008. Int.
J. Climatol., 31, 863–879, doi:10.1002/joc.2126.
Kalkstein, L. S., G. Tan, and J. A. Skindlov, 1987: An evaluation of
three clustering procedures for use in synoptic climatological
classification. J. Climate Appl. Meteor., 26, 717–730,
doi:10.1175/1520-0450(1987)026,0717:AEOTCP.2.0.CO;2.
Kidson, J. W., 2000: An analysis of New Zealand synoptic types
and their use in defining weather regimes. Int. J. Climatol.,
20, 299–316, doi:10.1002/(SICI)1097-0088(20000315)20:
3,299::AID-JOC474.3.0.CO;2-B.
Landvogt, P. K., J. A. T. Bye, and T. P. Lane, 2008: An in-
vestigation of recent orographic precipitation events in
northeast Victoria. Aust. Meteor. Mag., 57, 235–247.
Lyne, V., and M. Hollick, 1979: Stochastic time-variable rainfall–
runoff modelling. Proc. Hydrology and Water Resources
Symposium, Perth, Australia, Institution of Engineers, 89–92.
Marshall, G. J., 2003: Trends in the southern annular mode from
observations and reanalyses. J. Climate, 16, 4134–4143,
doi:10.1175/1520-0442(2003)016,4134:TITSAM.2.0.CO;2.
McGowan, H. A., S. K. Marx, J. Denholm, J. Soderholm, and B. S.
Kamber, 2009: Reconstructing annual inflows to the headwa-
ter catchments of the Murray River, Australia, using the Pa-
cific decadal oscillation. Geophys. Res. Lett., 36, L06707,
doi:10.1029/2008GL037049.
McIntosh, P. C., M. J. Pook, J. S. Risbey, S. N. Lisson, and
M. Rebbeck, 2007: Seasonal climate forecasts for agriculture:
Towards better understanding and value. Field Crops Res.,
104, 130–138, doi:10.1016/j.fcr.2007.03.019.
Milrad, S. M., E. H. Atallah, J. G. Gyakum, and G. Dookhie, 2014:
Synoptic typing and precursors of heavy warm-season pre-
cipitation events at Montreal, Quebec. Wea. Forecasting, 29,
419–444, doi:10.1175/WAF-D-13-00030.1.
Moron, V., A. W. Robertson, M. N. Ward, and O. Ndiaye, 2008:
Weather types and rainfall over Senegal. Part I: Observa-
tional analysis. J. Climate, 21, 266–287, doi:10.1175/
2007JCLI1601.1.
Murphy, B. F., and B. Timbal, 2008: A review of recent climate
variability and climate change in southeastern Australia. Int.
J. Climatol., 28, 859–879, doi:10.1002/joc.1627.
Nathan, R. J., and T. A. McMahon, 1990: Evaluation of automated
techniques for base flow and recession analyses.Water Resour.
Res., 26, 1465–1473, doi:10.1029/WR026i007p01465.
Newton, B. W., T. D. Prowse, and B. R. Bonsal, 2014a: Evaluating
the distribution of water resources in western Canada using
synoptic climatology and selected teleconnections. Part 1:
Winter season.Hydrol. Processes, 28, 4219–4234, doi:10.1002/
hyp.10233.
——, ——, and ——, 2014b: Evaluating the distribution of water
resources in western Canada using synoptic climatology and
selected teleconnections. Part 2: Summer season. Hydrol.
Processes, 28, 4235–4249, doi:10.1002/hyp.10235.
Nicholls, N., 2005: Climate variability, climate change and the
Australian snow season. Aust. Meteor. Mag., 54, 177–185.
Plavcova, E., J. Kysely, and P. Stepanek, 2014: Links between
circulation types and precipitation in central Europe in the
observed data and regional climate model simulations. Int.
J. Climatol., 34, 2885–2898, doi:10.1002/joc.3882.Pook, M. J., P. C. McIntosh, and G. A. Meyers, 2006: The synoptic
decomposition of cool-season rainfall in the southeastern
Australian cropping region. J. Appl. Meteor. Climatol., 45,
1156–1170, doi:10.1175/JAM2394.1.
——, J. S. Risbey, and P. McIntosh, 2010: East coast lows, atmo-
spheric blocking and rainfall: A Tasmanian perspective. IOP
Conf. Ser.: Earth Environ. Sci., 11, 012011, doi:10.1088/
1755-1315/11/1/012011.
AUGUST 2015 THEOBALD ET AL . 1731

——,——, and——, 2012: The synoptic climatology of cool-season
rainfall in the Central Wheatbelt of Western Australia. Mon.
Wea. Rev., 140, 28–43, doi:10.1175/MWR-D-11-00048.1.
——, ——, and ——, 2014: A comparative synoptic climatology of
cool-season rainfall in major grain-growing regions of south-
ern Australia. Theor. Appl. Climatol., 117, 521–533,
doi:10.1007/s00704-013-1021-y.
Renwick, J. A., 2011: Kidson’s synoptic weather types and surface
climate variability over New Zealand.Wea. Climate, 31, 3–23.
Risbey, J. S., M. J. Pook, P. C. Mcintosh, C. C. Ummenhofer, and
G. Meyers, 2009: Characteristics and variability of synoptic
features associated with cool season rainfall in southeastern
Australia. Int. J. Climatol., 29, 1595–1613, doi:10.1002/
joc.1775.
——, ——, and ——, 2013: Spatial trends in synoptic rainfall in
southern Australia. Geophys. Res. Lett., 40, 3781–3785,
doi:10.1002/grl.50739.
Shi, G., J. Ribbe, W. Cai, and T. Cowan, 2008: An interpretation of
Australian rainfall projections. Geophys. Res. Lett., 35,L02702, doi:10.1029/2007GL032436.
Snowy Hydro Limited, 2003: Engineering Features of the Snowy
Mountains Scheme. 4th ed. Snowy Hydro Ltd., 20 pp.
Stahl, K., R. D. Moore, and I. G. McKendry, 2006: The role of
synoptic-scale circulation in the linkage between large-scale
ocean–atmosphere indices and winter surface climate in
British Columbia, Canada. Int. J. Climatol., 26, 541–560,
doi:10.1002/joc.1268.
Sturman, A. P., andN. J. Tapper, 2006:TheWeather and Climate of
Australia and New Zealand. 2nd ed. Oxford University Press,
541 pp.
Tan, P., M. Steinbach, and V. Kumar, 2006: Cluster analysis: Basic
concepts and algorithms. Introduction to Data Mining, Pear-
son Addison-Wesley, 487–568.
Tapp, R. G., and S. L. Barrell, 1984: The northwest Australian
cloud band: Climatology, characteristics and factors associ-
ated with development. J. Climatol., 4, 411–424, doi:10.1002/
joc.3370040406.
Timbal, B., and W. Drosdowsky, 2013: The relationship between
the decline of southeastern Australian rainfall and the
strengthening of the subtropical ridge. Int. J. Climatol., 33,
1021–1034, doi:10.1002/joc.3492.
Tozer, C. R., A. S. Kiem, and D. C. Verdon-Kidd, 2012: On the
uncertainties associated with using gridded rainfall data as a
proxy for observed. Hydrol. Earth Syst. Sci., 16, 1481–1499,
doi:10.5194/hess-16-1481-2012.
Trauth, M., 2007: MATLAB Recipes for Earth Sciences. 3rd ed.
Springer-Verlag, 336 pp.
Ummenhofer, C. C., A. S. Gupta, A. S. Taschetto, and M. H.
England, 2009: Modulation of Australian precipitation by
meridional gradients in east Indian Ocean sea surface temper-
ature. J. Climate, 22, 5597–5610, doi:10.1175/2009JCLI3021.1.
Verdon-Kidd, D. C., A. S. Kiem, and R. Moran, 2013: Links be-
tween the Big Dry in Australia and hemispheric multi-decadal
climate variability—Implications for water resource manage-
ment. Hydrol. Earth Syst. Sci., 10, 13 539–13 593, doi:10.5194/
hessd-10-13539-2013.
Viviroli, D., and Coauthors, 2011: Climate change and mountain
water resources: Overview and recommendations for re-
search, management and policy. Hydrol. Earth Syst. Sci., 15,
471–504, doi:10.5194/hess-15-471-2011.
Whetton, P. H., 1988: A synoptic climatological analysis of rainfall
variability in south-eastern Australia. J. Climatol., 8, 155–177,
doi:10.1002/joc.3370080204.
Widmann, M., and C. Schär, 1997: A principal component
and long-term trend analysis of daily precipitation in
Switzerland. Int. J. Climatol., 17, 1333–1356, doi:10.1002/
(SICI)1097-0088(199710)17:12,1333::AID-JOC108.3.0.CO;2-Q.
Wilks, D. S., 2006: Statistical Methods in the Atmospheric Sciences.
2nd ed. Academic Press, 627 pp.
Wilson, L., M. J. Manton, and S. T. Siems, 2013: Relationship be-
tween rainfall and weather regimes in south-eastern Queens-
land, Australia. Int. J. Climatol., 33, 979–991, doi:10.1002/
joc.3484.
WMO, 2011: Guide to climatological practices—2011 edition.
WMO Publ. WMO-No. 100, 117 pp. [Available online at
http://www.wmo.int/pages/prog/wcp/ccl/guide/documents/
WMO_100_en.pdf.]
Wright, W. J., 1989: A synoptic climatological classification of
winter precipitation in Victoria. Aust. Meteor. Mag., 37, 217–
229.
Yarnal, B., 1993: Synoptic Climatology in Environmental Analysis:
A Primer. John Wiley and Sons, 256 pp.
1732 JOURNAL OF APPL IED METEOROLOGY AND CL IMATOLOGY VOLUME 54