a synthesis of the impacts of contemporary forest
TRANSCRIPT
A Synthesis of the Impacts of Contemporary Forest Practices on Aquatic Ecosystems at a Watershed Scale: A Case Study from Hinkle
Creek
A Skaugset, M Adams, D Bateman, K Cromack, L Ganio, B Gerth, B Gresswell, J Li, S Meininger, A Simmons, C Surfleet, and N Zegre

ResearchersGraduate Students• Aaron Berger• Becca Miller• Fey Egan• Hazel Owens• Kelly Kibler• Lance George• Mark Novick• Matt Meadows• Niels Leuthhold• Nick Som• Nicolas Zegre• Scott Meininger• Tim Otis
P.I.s• Arne Skaugset• Bob Gresswell• Judy Li• Kermit Cromack• Lisa Ganio• Mike Adams
Faculty Research Assistants• Alex Irving• Amy Simmons• Bill Gerth• Chris Surfleet• Dave Leer• Doug Bateman• Emily Sinkhorn• Janel Sobota• Nicolas Zegre• Rich Van Driesche• Steve Clark• Tim Royer
And our many field crews, lab technicians, and associates.
Thank you!

Physical Setting
• Foothills of the southern Oregon Cascades• Igneous geology (basalt and rhyolite flows)• Deep, well-drained gravelly to clay loam soils• Mean annual precipitation (MAP) ~ 1,480 mm (58 in)• 60-year old, harvest regenerated, Douglas-fir forest• Owned and managed by Roseburg Forest Products.

Hinkle Creek Paired Watershed Study
• Nested, paired watershed study
• Total watershed area; 1,941 ha (4,794 acres)
• Control watershed NFH; 857 ha (2,117 acres)
• Treatment watershed SFH; 1,084 ha (2,677 acres)
• Nested control watersheds; Meyers & DeMerrsmann
• Nested treatment watersheds; Fenton, Clay, Russell, & BB
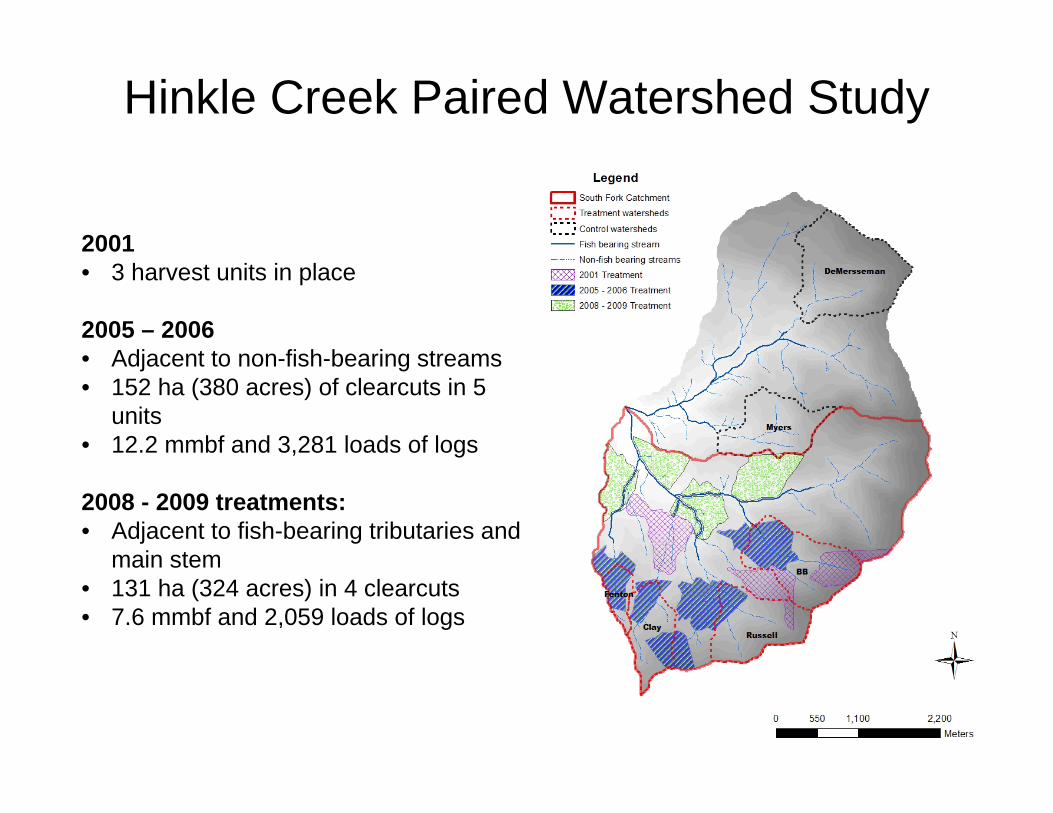
Hinkle Creek Paired Watershed Study
2001 • 3 harvest units in place
2005 – 2006• Adjacent to non-fish-bearing streams• 152 ha (380 acres) of clearcuts in 5
units• 12.2 mmbf and 3,281 loads of logs
2008 - 2009 treatments:• Adjacent to fish-bearing tributaries and
main stem• 131 ha (324 acres) in 4 clearcuts• 7.6 mmbf and 2,059 loads of logs

Watershed Hydrology
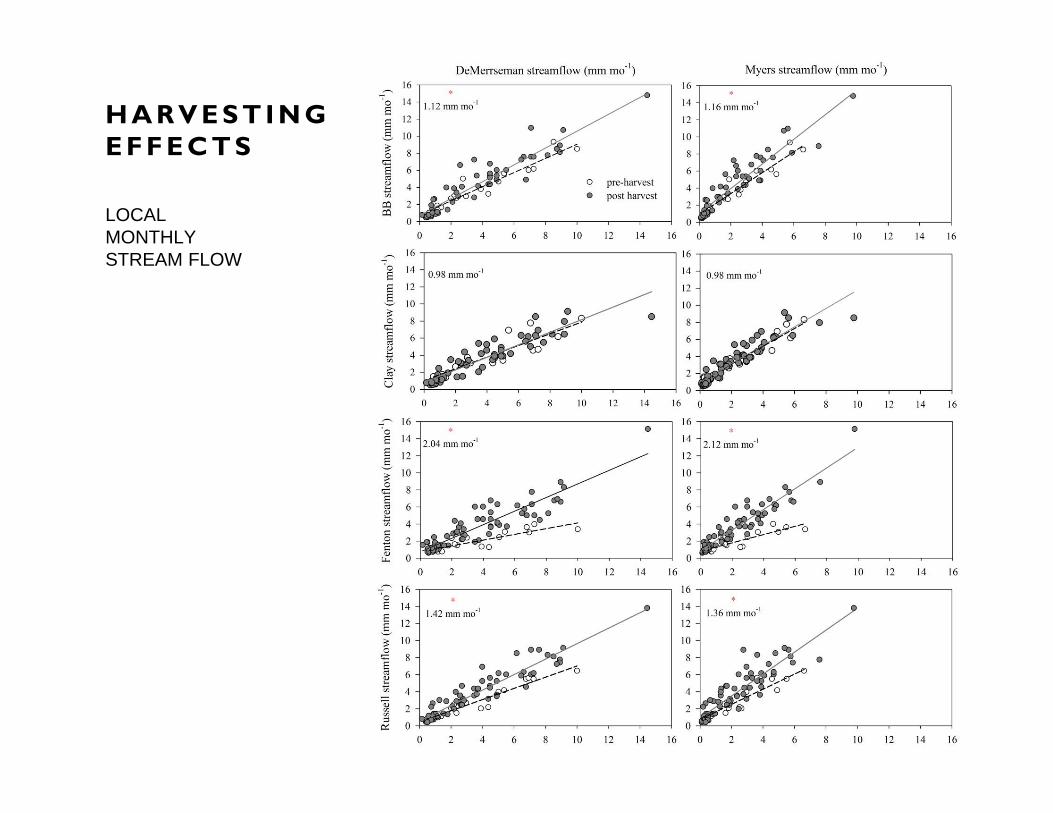
H A R V E S T I N G E F F E C T S
LOCALMONTHLYSTREAM FLOW

H A R V E S T I N G E F F E C T S
LOCALPEAK FLOW

HARVESTING EFFECTS
DOWNSTREAMPEAK FLOW
QUICK FLOW
MONTHLY STREAMFLOW

August Low Flow SFH
Source: Surfleet & Skaugset. (In press). WJAF
Sediment Yield


Sediment Yield Increases
• Sediment yield results are not consistent with the seminal results in the literature.
• Increases in sediment yield are consistent with and are correlated with increases in water yield.
• This requires further work to separate increases in sediment yield due to increases in stream power from increases due to an increase in the erosion rate of the watershed.

Stream Temperature


The net impact of the timber harvest on the non‐fish‐bearing streams was a 0.5°C decrease in average daily temperature.
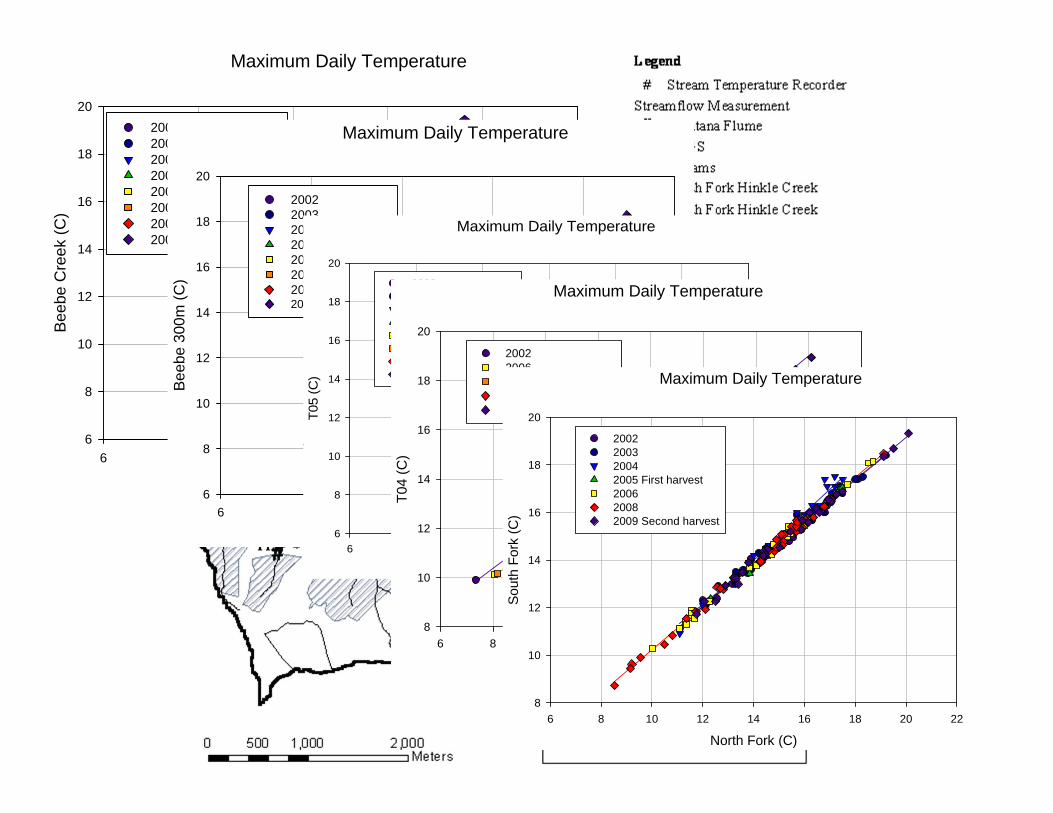
Maximum Daily Temperature
DeMersseman Creek (C)6 8 10 12 14 16
Beeb
e C
reek
(C)
6
8
10
12
14
16
18
202002200320042005 First harvest2006200720082009 Dam-break flood
Maximum Daily Temperature
DeMersseman (C)6 8 10 12 14 16
Beeb
e 30
0m (C
)
6
8
10
12
14
16
18
20
2002200320042005 First harvest2006 200720082009
Maximum Daily Temperature
C05 (C)6 8 10 12 14 16 18
T05
(C)
6
8
10
12
14
16
18
20
2002200320042005 First harvest2006 200720082009 Second harvest
Maximum Daily Temperature
C01 (C)6 8 10 12 14 16 18 20 22
T04
(C)
8
10
12
14
16
18
20
20022006 200720082009 Second harvest
Maximum Daily Temperature
North Fork (C)6 8 10 12 14 16 18 20 22
Sout
h Fo
rk (C
)
8
10
12
14
16
18
20
2002200320042005 First harvest2006 20082009 Second harvest
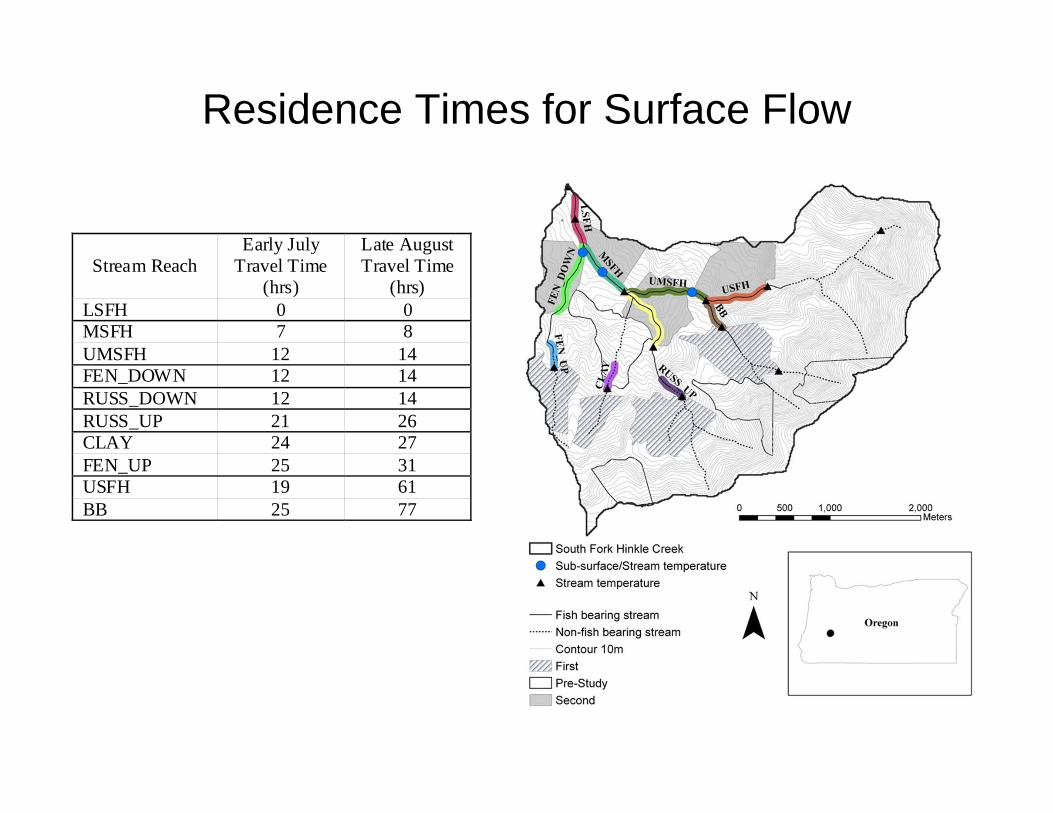
Residence Times for Surface Flow
Stream Reach Early July
Travel Time (hrs)
Late AugustTravel Time
(hrs) LSFH 0 0MSFH 7 8UMSFH 12 14FEN_DOWN 12 14RUSS_DOWN 12 14RUSS_UP 21 26CLAY 24 27FEN_UP 25 31USFH 19 61BB 25 77
Stream Chemistry
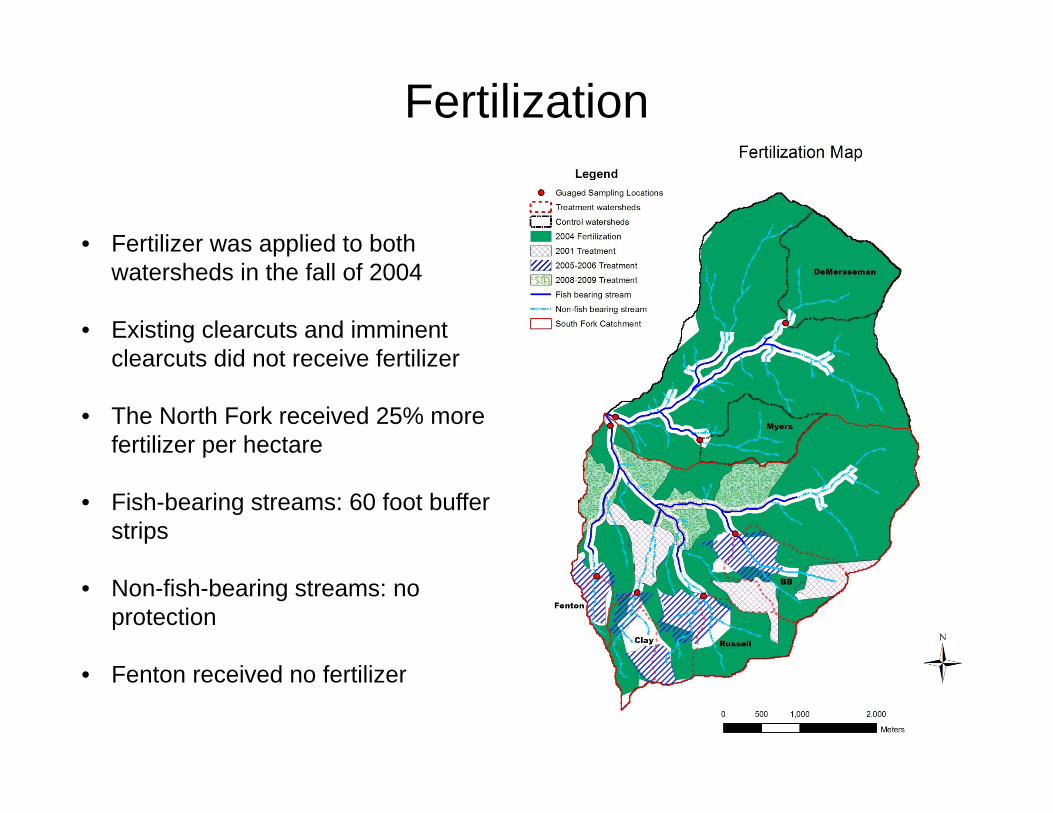
Fertilization
• Fertilizer was applied to both watersheds in the fall of 2004
• Existing clearcuts and imminent clearcuts did not receive fertilizer
• The North Fork received 25% more fertilizer per hectare
• Fish-bearing streams: 60 foot buffer strips
• Non-fish-bearing streams: no protection
• Fenton received no fertilizer

Nitrate response
• Strong seasonal fluctuation during the calibration period• Muted seasonal response during the first post-treatment period• More pronounced seasonal response during the second post-treatment
period

Nitrate response
Calibration Period 1 Period 2North Fork 0.015 0.017 0.023South Fork 0.098 0.075 0.117Treatment headwaters 0.129 0.207 0.135
Mean NO3 + NO2 (mg/L)

Amphibians

DataCollection• Sampled only
before and after the first entry.
• Sampled 100 sites/yr.
• Average of 39 were unoccupied.

Amphibian Results
Effect of Being Within a Harvest Unit
0.00
1.00
2.00
3.00
4.00
5.00
2004 2005 2006 2007Odd
s Ratio (and
Con
fiden
ce Lim
its)
Aquatic Invertebrates

2004
2006 - 2009headwaterlogging
25
30
35
40
45
50
55
2004 2005 2006 2007 2008 2009
controltreatment
Benthic taxa richne
ss2004 2005 2006 2007 2008 2009
controltreatment
1
10
100
Benthic pe
rcen
tchiro
nomids
Invertebrate Response in Headwaters:Percent Chironomids, Increased,
Taxa Richness Decreased

Tributaries with Fish:No downstream effects on invertebrates
after harvest in headwatersafter harvest in headwaters
300
3000
30000
2004 2005 2006 2007 2008 2009
control
treatment
Benthic inverteb
rates p
er squ
are meter
Benthic densities (in this graph), percent chironomids and taxa richness did not differ significantly from controls
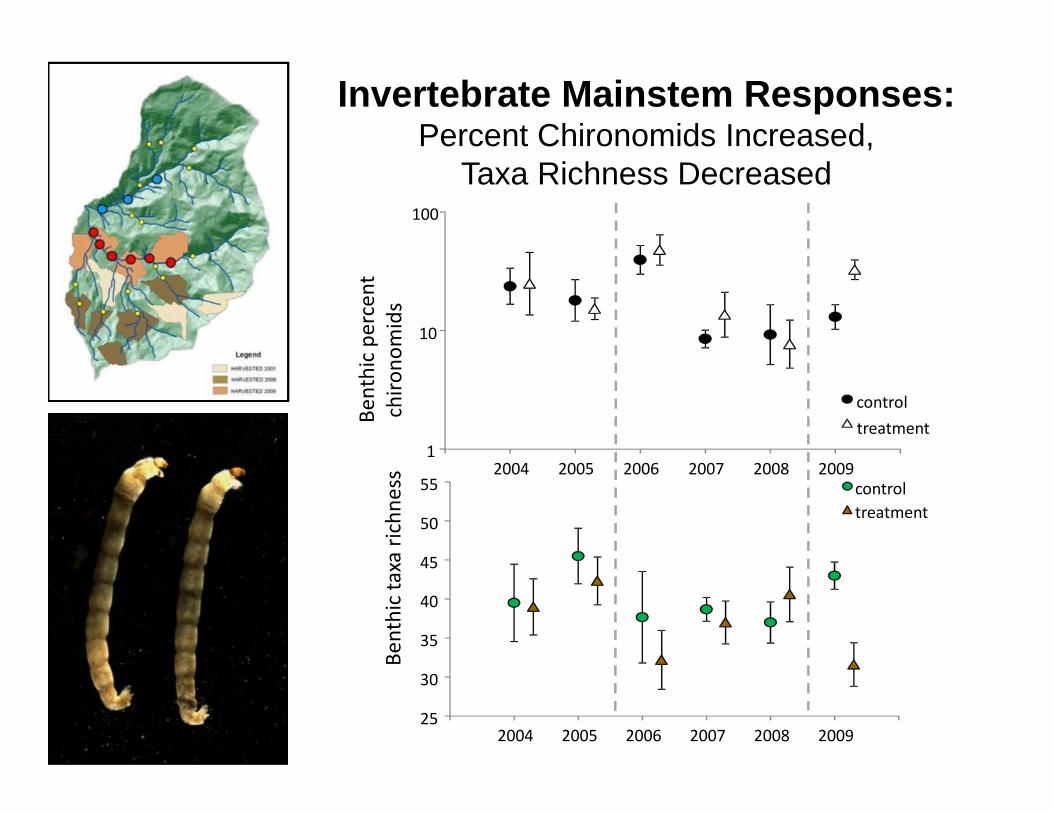
Invertebrate Mainstem Responses:Percent Chironomids Increased,
Taxa Richness Decreased
25
30
35
40
45
50
55
2004 2005 2006 2007 2008 2009
controltreatment
Benthic taxa richne
ssBe
nthic pe
rcen
tchiro
nomids
2004 2005 2006 2007 2008 20091
10
100
controltreatment

Mainstem Responses:Lack of invertebrate density response possibly related
to fish biomass response

Fisheries

Mean Fork Length of Age 1+ Cutthroat Trout by Year andTreatment Period with 95% CI for North and South Fork Hinkle Creek
Years
2001
2002
2003
2004
2005
2006
2007
2008
2009
2010
2011
Fork
leng
th (m
m)
100
105
110
115
120
125
130
135
140NF HinkleSF Hinkle
Pre-treatment Post 1 Post 2

Year2001 2002 2003 2004 2005 2006 2007 2008 2009 2010 2011
Age
0 tro
ut (g
ram
s/m
2)
0.0
0.2
0.4
0.6
0.8
1.0NF HinkleSF Hinkle
Mean Biomass Age 0 Cutthroat Trout from Pools inNorth and South Fork Hinkle Tributaries
Pre-treatment Post 1 Post 2
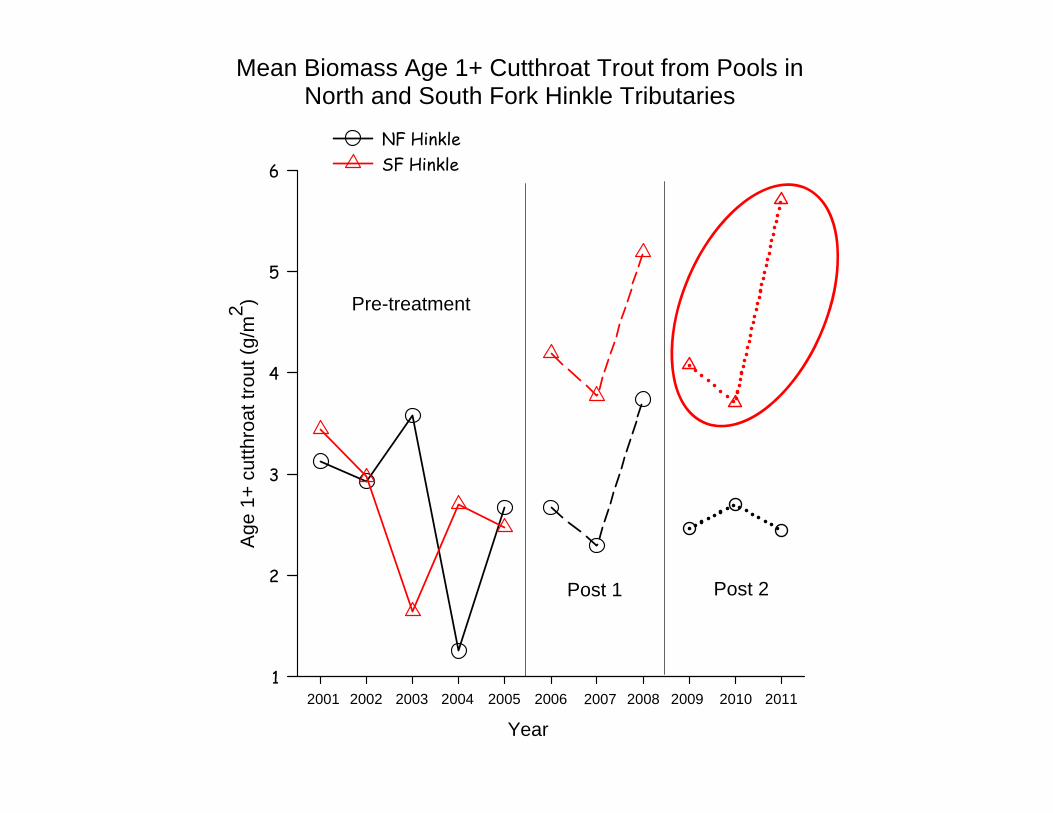
Mean Biomass Age 1+ Cutthroat Trout from Pools inNorth and South Fork Hinkle Tributaries
Age
1+
cutth
roat
trou
t (g/
m2 )
1
2
3
4
5
6
NF HinkleSF Hinkle
Year
Pre-treatment
Post 1 Post 2
2001 2002 2003 2004 2005 2006 2007 2008 2009 2010 2011

Basin-level Analysis Significant Preliminary Results:
Coming soon: Stream-level analysisOwens, H.L. 2013
Same relationships for Age-1+ CT with 1-yr lag in both watersheds
Dissimilar relationships for Age-0 CT (no lag) between
watersheds

At this point in time, what do we think we have learned at Hinkle Creek?
• For almost every discipline, contemporary forest practices resulted in detectable changes in a parameter of interest.
• These changes were often difficult to detect, not acute, often subtle, and the magnitude of the changes existed well within the spatial variability exhibited within the watershed.

Douglas County Thank You!
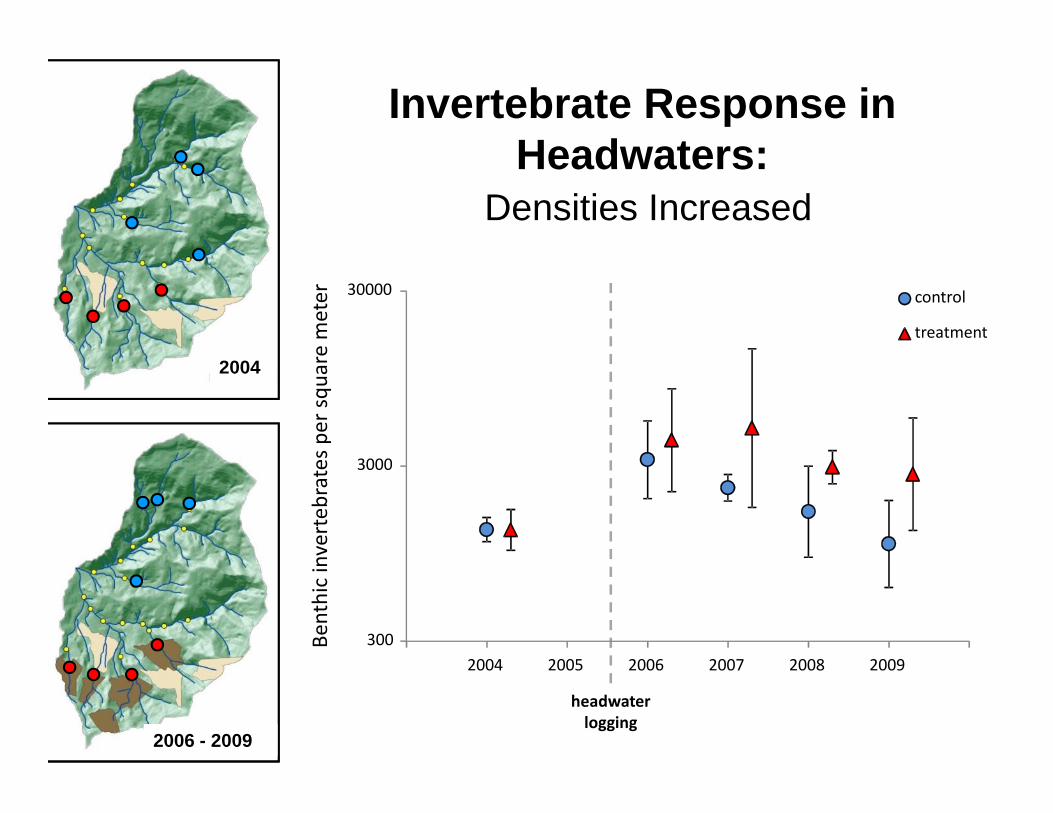
Invertebrate Response in Headwaters:
Densities Increased
headwaterlogging
300
3000
30000
2004 2005 2006 2007 2008 2009
control
treatmentBe
nthic inverteb
rates p
er squ
are meter
2004
2006 - 2009
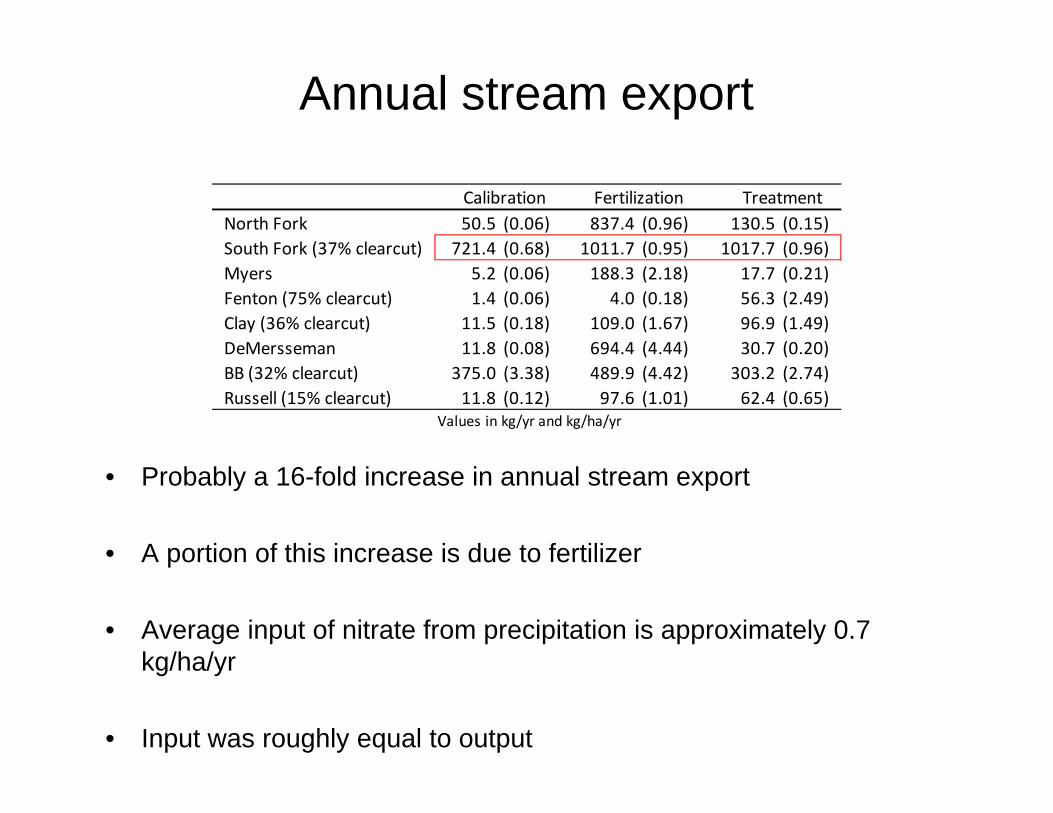
Annual stream export
• Probably a 16-fold increase in annual stream export
• A portion of this increase is due to fertilizer
• Average input of nitrate from precipitation is approximately 0.7 kg/ha/yr
• Input was roughly equal to output
North Fork 50.5 (0.06) 837.4 (0.96) 130.5 (0.15) South Fork (37% clearcut) 721.4 (0.68) 1011.7 (0.95) 1017.7 (0.96) Myers 5.2 (0.06) 188.3 (2.18) 17.7 (0.21) Fenton (75% clearcut) 1.4 (0.06) 4.0 (0.18) 56.3 (2.49) Clay (36% clearcut) 11.5 (0.18) 109.0 (1.67) 96.9 (1.49) DeMersseman 11.8 (0.08) 694.4 (4.44) 30.7 (0.20) BB (32% clearcut) 375.0 (3.38) 489.9 (4.42) 303.2 (2.74) Russell (15% clearcut) 11.8 (0.12) 97.6 (1.01) 62.4 (0.65)
Values in kg/yr and kg/ha/yr
Calibration Fertilization Treatment

Amphibian Results
Effect of Being Within 500m Downstream of Harvest Unit
0.00
0.50
1.00
1.50
2.00
2.50
3.00
3.50
2004 2005 2006 2007Odd
s Ratio (and
Con
fiden
ce Lim
its)

Amphibian Results
Effect of Being in the South Fork
0.00
0.50
1.00
1.50
2.00
2.50
3.00
2004 2005 2006 2007Odd
s Ratio (and
Con
fiden
ce Lim
its)

Significant differences were
related to increases in
production (growth and mass).

• Overall, very few detectable changes in habitat or biologic parameters were observed with either treatment.
• At Hinkle Creek, Oregon Forest Practices Rules provided adequate short-term protection from acute negative effects to the resident fish community.
Fisheries Summary