a system description of an improved 10.6-^m … · a system description of an improved 10.6-um...
TRANSCRIPT

ASL-CR-79-0001-1 AD
EEADCOM ASL CR-~)t OOOl-l c.l
Reports Control Symbol OS D-1366
A SYSTEM DESCRIPTION OF AN IMPROVED 10.6-^m LIDAR SYSTEM
FOR MONOSTATIC OPTICAL MEASUREMENTS OF BATTLEFIELD
DUST AND SMOKE
April 1979 LOAN COPY: RETURN TO AFWL TEC < CAL LIBRARY
KIRTLA; O AF3, N. M.
Prepared by
J.E. van der LAAN
SRI International 333 Ravenswood Avenue
Menlo Park, California 94025
Under Contract No. DAAG29-77-C-0001 Contract Monitor: JAGIR S. RANDHAWA
20081120291 Approved for public release; distribution unlimited -
US Army Electronics Research and Development Command ATOMSPHERIC SCIENCES LABORATORY White Sands Missile Range, NM 88002

NOTICES
Disc laimers
The findings in this report are not to be construed as an of- ficial Department of the Army position, unless so designated bv other authorized documents.
The citation of trade names and names of manufacturers in this report is not to be construed as official Government in- dorsement or approval of commercial products or services referenced herein.
Disposition
Destorv this report when it is no longer needed. Do not return it to the originator.

SECURITY CLASSIFICATION OF THIS PAGE (When Data Entered)
REPORT DOCUMENTATION PAGE READ INSTRUCTIONS BEFORE COMPLETING FORM
1 REPORT NUMBER
ASL-CR-79-0001-1
2. GOVT ACCESSION NO. 3. RECIPIENT'S CATALOG NUMBER
4. TITLE (and Subtitle)
A SYSTEM DESCRIPTION OF AN IMPROVED 10.6-um LIDAR SYSTEM FOR MONOSTATIC OPTICAL MEASUREMENTS OF BATTLEFIELD DUST AND SMOKE
5. TYPE OF REPORT & PERIOD COVERED
Technical Report 2 Covering the Period February 1978 to March 1979
7. AU'-.ORI?)
Jan E. van der Laan
6. PERFORMING ORG. REPORT NUMBER
SRI Project 5862 8. CONTRACT OR GRANT NUMBER(s)
Contr. DAAG29-77-C-0001
9. PERFORMING ORGANIZATION NAME AND ADDRESS SRI International 333 Ravenswood Avenue Menlo Park, California 94025
10. PROGRAM ELEMENT, PROJECT, TASK AREA & WORK UNIT NUMBERS
11. CONTROLLING OFFICE NAME AND ADDRESS
U.S. Army Research Office Geosciences Division Research Triangle Park, North Carolina 27709
12 REPORT DATE
April 1979
13. NO. OF PAGES
46 15. SECURITY CLASS, (of this report)
UNCLASSIFIED 14. MONITORING AGENCY NAME 81 ADDRESS (if diff. from Controlling Office)
Atmospheric Sciences Laboratory White Sands Missile Range New Mexico, 88002
15a. DECLASSIFICATION/DOWNGRADING SCHEDULE
16. DISTRIBUTION STATEMENT (of thij report)
Approved for public release; distribution unlimited
17. DISTRIBUTION STATEMENT (of the abstract entered in Block 20, if different from report)
18. SUPPLEMENTARY NOTES
Contract Monitor: Jagir S. Randhawa
19. KEY WORDS (Continue on reverse side if necessary and identify by block number)
LIDAR Military smoke Optical properties Optical backscatter Optical transmission
20. ABSTRACT (Continue on reverse side if necessary and identify by block number)
A 10.6-pm wavelength CO2 lidar system, designed specifically for measurements of battlefield dust and smoke, was installed in the U.S. Army Atmospheric Sciences Laboratory 's laser Doppler velocimeter van. The system design addresses recommenda- tions made following a smoke test field program using a prototype system at Dugway Proving Ground in September 1977. Improvements in range resolution, range jitter, side lobe clutter, and amplitude dynamic range were incorporated in the system. This report serves as a system technical manual.
00,^1473 EDITION OF 1 NOV 65 IS OBSOLETE SECURITY CLASSIFICATION OF THIS PAGE (When Data Entered)

Qjlb ^ clc e^-iAaJ^.
ERRATA SHEET
ASL-CR-79-0001-1
A SYSTEM DESCRIPTION OF AN IMPROVED "10.6pm LIDAR SYSTEM FOR MONOSTATIC OPTICAL MEASUREMENTS OF BATTLEFIELD DUST AND SMOKE
Page 5 Table 1, second column, sixth line down in lower half of table:
Change to D*= 1.3 x 1010cm HzV"1
Page 6 Figure 1:
Put the number 5 in open circle in first block on left.
Underneath second black on right (with number 10 in the circle), change to read "LINEAR."
Page 9 Footnote:
Change reference to Appendix B to Appendix F.

CONTENTS
ILLUSTRATIONS iv
TABLES iv
ACKNOWLEDGMENTS v
I INTRODUCTION 1
II BACKGROUND 3
III ASL LIDAR DEVELOPMENT 4
A. System Description 8
B. ASL Lidar Laser Transmitter 11
C. ASL Lidar Receiver System 16
IV SYSTEM IMPROVEMENTS 22
REFERENCES 24
APPENDICES
A PERFORMANCE PREDICTION CALCULATIONS 25
B SCHEMATIC FOR CONTROL UNIT 27
C SCHEMATIC FOR TRIGGER AND SYNCHRONIZED PULSE ISOLATION INTERFACE 28
D SCHEMATIC FOR FIBER OPTIC DETECTOR UNIT 29
E LASER OPERATING CONDITIONS 30
F RECEIVER ALIGNMENT PROCEDURE 31
G SPECIFICATIONS FOR RECEIVER LINEAR AMPLIFIER 36
H SPECIFICATIONS FOR RECEIVER LOGARITHMIC AMPLIFIER 40
I RECEIVER ELECTRONICS PACKAGE WIRING DIAGRAM 43

ILLUSTRATIONS
1 ASL Lidar Functional Diagram 6
2 System Timing Diagram 7
3 Transmitter Alignment Package Functional Diagram 13
4 Transmitter Alignment Package Conceptual Drawing 14
5 LIDAR Receiver Package 17
6 ASL/LIDAR Receiver 18
TABLES
1. ASL Lidar Specifications 5
ii
ACKNOWLEDGMENTS
The author is indebted to Dr. Edward R. Murray for assistance in
the design of the improved CO- lidar system and to Dr. Richard Baumgartner
for helpful discussions concerning system calculations. Dr. Ray Loveland
of the Atmospheric Sciences Laboratory, White Sands Missile Range, pro-
vided many suggestions on system interface requirements with the laser
Doppler velocimeter system. In addition, the author wishes to acknow-
ledge Dr. J. S. Randhawa for his work in coordinating the field evalua-
tion program and Mr. K. Ballard and R. March for technical assistance
during the field test.
iii

I INTRODUCTION
SRI International is conducting a three-year investigation funded
by the Army Research Office (ARO), Division of Geophysics, to develop
real-time digital techniques for evaluation of aerosol, cloud, and pre-
cipitation optical physical densities. Consistent with these objectives,
a field test program was conducted at Dugway Proving Grounds where lidar
observations were made of smoke and dust clouds using SRI's Mark IX
lidar (0.7 \im) and a prototype C0„ lidar system (10.6 ym) . Additional
funds to support part of this field program were provided by the U.S.
Army Atmospheric Laboratory (ASL). The primary objective of the Dugway
test was an evaluation of the performance of the 10.6 um lidar system for
observations of smoke rather than a detailed analysis of smoke distribu-
tions and densities. It was not possible to characterize and evaluate
fully the 10.6 ym lidar from a systems approach due to limited opera-
tional time during the Dugway tests; however, several recommendations for
improvement were identified, providing the design objectives for an im-
proved 10.6-ym system. The ASL provided the funds to develop this im-
proved 10.6-ym lidar system which was installed in the ASL's Laser
Doppler Velocimeter (LDV) equipment van. This report provides a detailed
system description and outlines operational procedures for the improved
10.6-ym lidar system, henceforth to be referred to in this report as the
ASL lidar. In addition to, and as part of, this ASL lidar development,
References are listed at the end of this report,

a second evaluation field program was scheduled with objectives similar
to those in the Dugway test. This program, Dusty Infrared Test - 1
(DIRT-1), was conducted in October 1978 at the White Sands Missile Range,
New Mexico; the results will be presented in a separate report on this
ARO contract.

II BACKGROUND
Lasers provide a source of light energy with characteristics neces-
sary for strong interaction with atmospherically-suspended particulate
matter at remote distances. Using a pulsed lager source, radar techniques
(lidar-laser radar) can be applied to provide range-resolved information
of these interactions by observing the backscatter signature. With cer-
tain auxiliary information and appropriate data processing techniques,
backscatter and extinction coefficients can be measured for naturally-
occurring aerosols, providing a reference background for characterization
of artificially-generated aerosols. Recent military interest in methods
to measure real-time, three-dimensional distributions of density and op-
tical parameters of dense smoke clouds led to a two-wavelength lidar
(0.7 and 10.6 um) experiment to collect basic data on generated smoke
clouds. The results of this initial experiment, conducted at Dugway
Proving Grounds in late 1977 with ARO and ASL support, generally were
consistent with theoretical data relating to aerosol particle size dis-
tributions, and clearly illustrated the usefulness of long-wavelength
lidar for measurements of large particle aerosols. These results pro-
vided the stimulus for the development of an improved 10.6-ym lidar for
optical measurements of battlefield smoke and dust.

Ill ASL LIDAR DEVELOPMENT
Evaluations of the 10.6 ym-wavelength lidar operation during the
1977 Dugway field test identified several system parameters requiring
improvement in the next generation system. Optimization of range reso-
lution and elimination of side-lobe clutter and timing jitter were the
major design objectives addressed in the development of the ASL lidar.
The system originally proposed for installation in the ASL-LDV equipment
2 van included the lidar laser transmitter system, receiver system, and
a data digitizing system to be interfaced to the data processing equip-
ment van of the LDV system. The receiver system would use the 12-inch
f/2 telescope and beam steering optics of the LDV system. The ASL re-
quested SRI to design the system so that minimum effort would be required
to convert operation from the lidar mode back to the LDV mode of operation.
SRI designed and installed a lidar system in the ASL-LDV equipment
van having the general specifications given in Table 1; system perform-
ance calculations are discussed in Appendix A. The system design does
not alter the normal LDV operational mode in any way except that the LDV
cannot be operated simultaneously with the lidar system; in fact, if the
LDV system were operational and aligned, the lidar mode of operation could
be installed, operated, and removed without disturbing any of the LDV
system alignments.

Table 1
ASL LIDAR SPECIFICATIONS
System Component Specification Comments
Transmitter
Manufacturer Lumonics Research Ltd., Model TEA-101-2
Type CO 1076 ym Wavelength
Beam diameter 3.1 cm Beam divergence 1.2 mrad Operation pulsed Energy 250 mJ No nitrogen gas
mix Pulsewidth 75 ns (FWHM) PRF (maximum) 1 PPS
Receiver
Telescope 12-inch (30 cm), Newtonian
LDV primary
Field of view 1.23 mrad Detector Honeywell Associates-, LN„-cooled
HgCdTe photodiode; * 10 !* ,-l
D = 1.3 x 10 cm Hz*W 100 MHz BW
Post amplifier linear: 26 dB gain, 100 MHz BW
Appendix G
log: tangential Appendix H sensitivity -111 dBr; ±0.5 dB linearity over 80-dB range; 15-ns rise time
In lddition to the abovementioned objectives and design criteria,
SRI designed the system so that a minimum effort would be required to
prepare the system for transportation to new field locations. All system
components are shock-mounted, and special shipping brackets were made

TRANSMIT/RECEIVER STEERING MIRROR
TRANSMIT OPTICAL
ALIGNMENT PACKAGE
LASE ̂ 7> BEAM
PULSED C02
LASER
©
ENERGY MONITOR
FIBER OPTIC
TRIGGER PROBE
LASER FIRE
LASER CONTROL UNIT/GAS
REGULATOR
@
EXTERNAL CONTROL TRIGGER
ISOLATION UNIT
II J&.
SYSTEM CONTROL TRIGGER
PHOTO DETECTOR
(12)
TRIGGER (laser has fired)
DELAY PULSE
GENERATOR
©
LIDAR CONTROL UNIT
©
PRE-TRIGGER (arm)
RECEIVER BEAM
COAXIAL TRANSMIT
RECEIVER BEAM
LAST TRANSMIT-ONLY
OPTIC 0
RECEIVER OPTICS
DETECTOR
LINEAR PRE-AMP
® ®
LINEAR
LOG
VIDEO AMP
6o) I LWi^X OR
LOG VIDEO
ENERGY PRVM
SIGNAL PRVM
(14)
GATE
TRANSIENT DIGITIZER
©
ARM TRIGGER
(laser has
fired)
ANALOG (DAC)
OUTPUT
dc LEVELS PROPORTIONAL TO
ENERGY AND GATED SIGNAL
DIGITAL OUTPUT
RANGE-RESOLVED BACKSCATTER DATA
DATA OUTPUTS
FIGURE 1 ASL LIDAR FUNCTIONAL DIAGRAM

10-MS PULSE Q] PRE-TRIGGER PULSE
(control unit)
H 500-MS I
DELAY |
_K
K.
10-MS PULSE
50-V PULSE
[T] SYSTEM CONTROL TRIGGER (control unit)
S] EXTERNAL LASER TRIGGER (isolation unit)
, B LASER FIRE PULSE (laser control unit)
L5j SPARK GAP LIGHT PULSE (laser main current discharge detected by photo diode)
DELAY ^ 1 MS FROM [5]
LJL 75 ns (FWHM) ID LASER OUTPUT PULSE
I (high-speed pyroelectric detector)
•u 2k SAMPLES (i.e., 20 MS
at 0.01-MS sample rate)
Lll ADC CLOCK PULSES (biomation 2k word; sample rate selectable)
J V AMPLITUDE [a| DACOUTpuT
(biomation record memory read-out; i.e., lidar return)
^
ATMOSPHERIC RETURN
TARGET RETURN
V
EXAMPLE LIDAR RETURN
FIGURE 2 SYSTEM TIMING DIAGRAM

for quick installation. The van also was modified for air-ride suspen-
sion to anticipate system shipment without removal of any of the opti-
cal components requiring critical alignment.
In the discussion below, a general system description (Section
III A) is presented, followed by detailed descriptions of the trans-
mitter (Section III B) and receiver (Section III C).
A. System Description
The ASL lidar system basically is composed of two major system com-
ponents: (1) a pulsed C0„ laser that generates a very short, high peak
power IR pulse for transmission, and (2) a narrow field-of-view optical
receiver system that collects the backscattered energy and directs the
signal to an IR detector. After detection and amplification, the signal
is digitized by a high-speed transient recorder which provides range-
resolved backscatter amplitude data output in both digital and digitally-
reconstructed analog (DAC) formats. The digital output primarily is in-
tended for recording and processing while the DAC output is useful in ob-
serving the real-time backscatter returns.
A functional diagram of the ASL lidar system is shown in Figure 1
and a timing diagram of events is shown in Figure 2. Refer to Figures
1 and 2 for elucidation of the system functions description which follows.
(constructed by SRI and detailed in
Appendix B) generates two line-synchronized control functions, pre-trig
(1 | and system control trigger [2j , at selectable pulse repetition rates
* Circled numbers refer to items identified in Figure 1 while numbers enclosed in squares refer to timing functions in Figure 2.
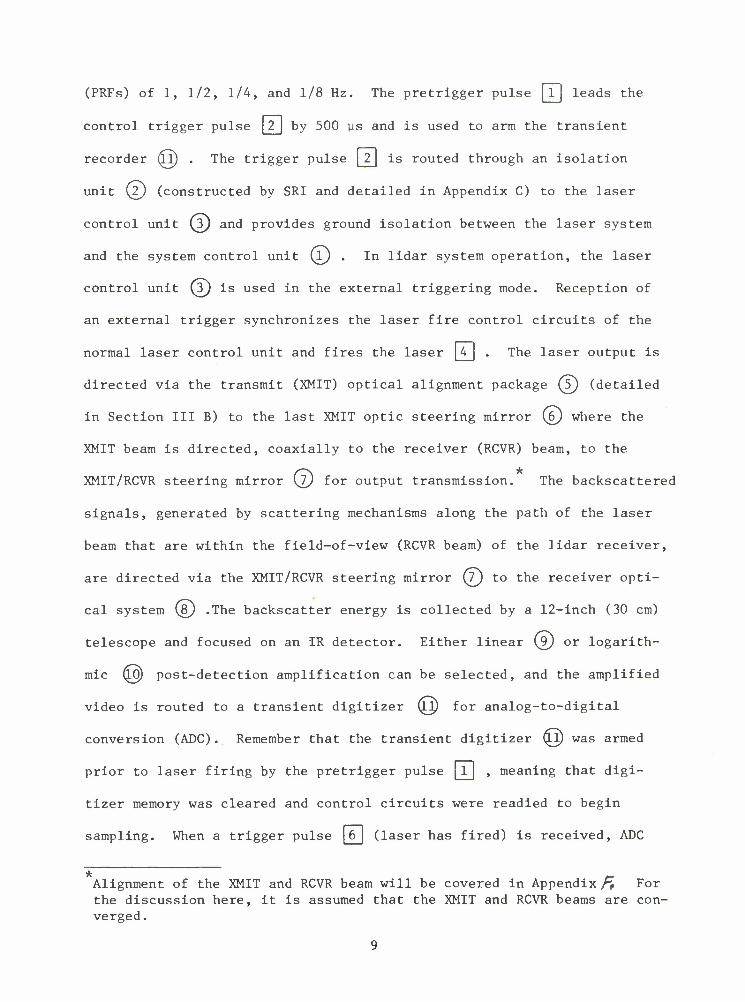
(PRFs) of 1, 1/2, 1/4, and 1/8 Hz. The pretrigger pulse [T] leads the
control trigger pulse |_2_| by 500 ps and is used to arm the transient
recorder ny . The trigger pulse 2 is routed through an isolation
unit [2j (constructed by SRI and detailed in Appendix C) to the laser
control unit (3J and provides ground isolation between the laser system
and the system control unit (V) . In lidar system operation, the laser
control unit QT) is used in the external triggering mode. Reception of
an external trigger synchronizes the laser fire control circuits of the
normal laser control unit and fires the laser [4J . The laser output is
directed via the transmit (XMIT) optical alignment package (5) (detailed
in Section III B) to the last XMIT optic steering mirror \6J where the
XMIT beam is directed, coaxially to the receiver (RCVR) beam, to the
XMIT/RCVR steering mirror \7J for output transmission. The backscattered
signals, generated by scattering mechanisms along the path of the laser
beam that are within the field-of-view (RCVR beam) of the lidar receiver,
are directed via the XMIT/RCVR steering mirror (T) to the receiver opti-
cal system {8J .The backscatter energy is collected by a 12-inch (30 cm)
telescope and focused on an IR detector. Either linear (9) or logarith-
mic ^0) post-detection amplification can be selected, and the amplified
video is routed to a transient digitizer Qj) for analog-to-digital
conversion (ADC). Remember that the transient digitizer (ll) was armed
prior to laser firing by the pretrigger pulse [jj , meaning that digi-
tizer memory was cleared and control circuits were readied to begin
sampling. When a trigger pulse 6 (laser has fired) is received, ADC
* t- Alignment of the XMIT and RCVR beam will be covered in Appendix f-f For the discussion here, it is assumed that the XMIT and RCVR beams are con- verged.

will occur on the next 2048 clock samples |_7j . This 2K data word auto-
matically is placed into the memory of the transient recorder where it
can be read out digitally for permanent storage or processing. The
transient digitizer also provides a repetitive DAC sampling output 8
of the data in memory for convenient A-scope monitoring of the data.
The data will remain in memory and cannot be updated again until the
next arm pulse-trigger/pulse combination is received. In order to time-
lock the start-ADC time for the transient recorder with the actual laser
pulse start time (no range jitter), the trigger pulse must be referenced
to the actual laser pulse. A convenient way to derive this trigger pulse
would be to use a pyroelectric detector to detect a sample of the actual
laser pulse output; however, we have found that radio frequency interfer-
ence (RFI) from the laser firing easily can enter the pyroelectric detec-
tor and interfere with the detection of real-time zero. This problem was
the major cause of range jitter on the Dugway 10.6-pm lidar system. A
preferred triggering system for zero-time reference is a fiber optic
pick-up placed adjacent to the laser spark gap. A strong light pulse,
coincident with the laser current discharge, can be transmitted over
long distances via the fiber optic cable to a fast PIN photodiode Q2)
(constructed by SRI and described in Appendix D) for detection providing
a trigger reference 61 . This fiber optic technique is free of RFI and
also eliminates one potential source of ground loops. The detected light
pulse is synchronized within 10 to 20 ns of the actual laser pulse and
leads the laser pulse in time by approximately 500 ns.
10

In addition to the basic system elements just described, two peak-
reading voltmeters (PRVM) (13) (14) and a delay generator (l5) are in-
corporated in the ASL lidar both to provide a convenient method of observ-
ing laser energy output and as a system alignment aid. The PRVMs are
gated in time by the delay generator output QJ>) to sample only specific
regions of data for peak signals. The peak reading detected during the
gate period is converted to a DC level that is available for recording
and is displayed on a front panel meter. One PRVM is used during normal
operation to observe the laser energy output while the other monitors
select ranges of received video for desired targets. This is quite use-
ful in steering the lidar to specific targets and in system convergence
alignment.
B. ASL Lidar Laser Transmitter
The laser transmitter system consists of a Lumonics C0„ TEA-101-2
laser, an alignment package to enable rapid, straightforward alignment of
the transmitter, an on-line monitor of laser energy on a pulse-to-pulse
basis, and a system triggering interface. The system is mounted on the
bottom level of a sturdy two-level optical table to maintain clignment
of the various components.
A detailed description of the Lumonics laser will not be presented
in this report as its operation and theory is covered adequately in its
equipment manual. However, details pertinent to operation of the ASL
lidar in particular will be discussed here and in Appendix E of this
report.
U
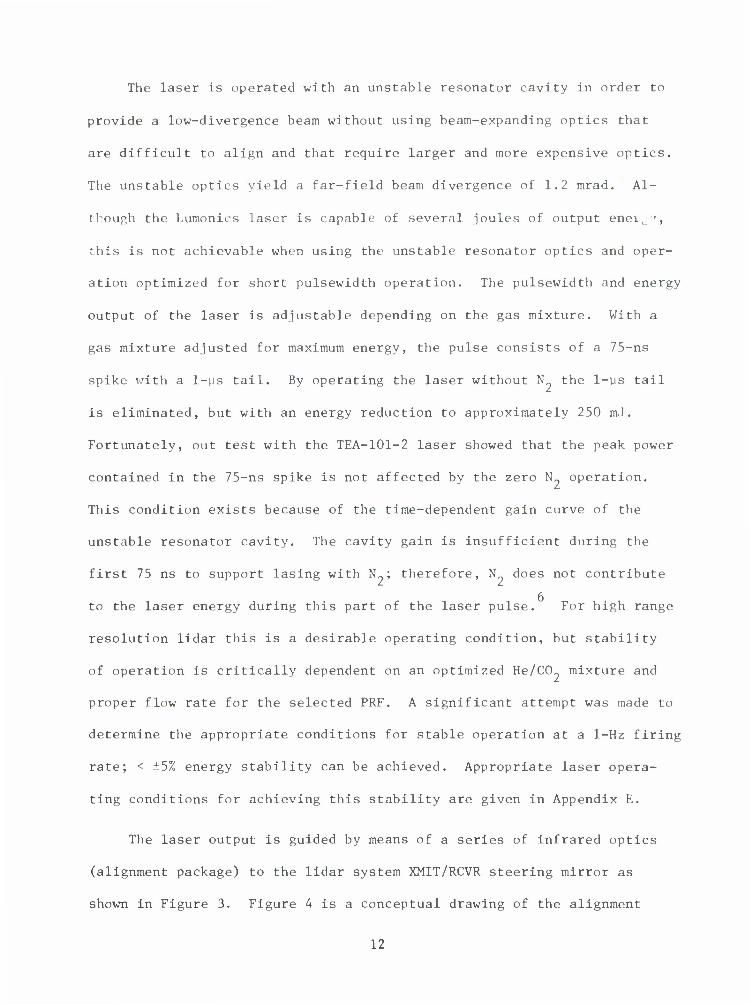
The laser is operated with an unstable resonator cavity in order to
provide a low-divergence beam without using beam-expanding optics that
are difficult to align and that require larger and more expensive optics.
The unstable optics yield a far-field beam divergence of 1.2 mrad. Al-
though the Lumonics laser is capable of several -joules of output enei^ ',
this is not achievable when using the unstable resonator optics and oper-
ation optimized for short pulsewidth operation. The pulsewidth and energy
output of the laser is adjustable depending on the gas mixture. With a
gas mixture adjusted for maximum energy, the pulse consists of a 75-ns
spike with a 1-ps tail. By operating the laser without N the 1-us tail
is eliminated, but with an energy reduction to approximately 250 mJ.
Fortunately, out test with the TEA-101-2 laser showed that the peak power
contained in the 75-ns spike is not affected by the zero N operation.
This condition exists because of the time-dependent gain curve of the
unstable resonator cavity. The cavity gain is insufficient during the
first 75 ns to support lasing with N ; therefore, N does not contribute
to the laser energy during this part of the laser pulse. For high range
resolution lidar this is a desirable operating condition, but stability
of operation is critically dependent on an optimized He/CO mixture and
proper flow rate for the selected PRF. A significant attempt was made to
determine the appropriate conditions for stable operation at a 1-Hz firing
rate; < ±5% energy stability can be achieved. Appropriate laser opera-
ting conditions for achieving this stability are given in Appendix E.
The laser output is guided by means of a series of infrared optics
(alignment package) to the lidar system XMIT/RCVR steering mirror as
shown in Figure 3. Figure 4 is a conceptual drawing of the alignment
12

10-Mm TRANSMIT AND HeNe BEAM
RECEIVER BEAM
10 Mm BEAM
HeNe BEAM
1% 10.6 nm BEAM
Q Ge FLAT
(5) 1st STEERING OPTIC
(3) ZnSe BEAM SPLITTER
@ 2nd BEAM-STEERING OPTIC
© 3rd BEAM-STEERING OPTIC
(6) T/R STEERING OPTIC
(7) 50-cm FOCAL LENGTH MIRROR
(8) PYROELECTRIC DETECTOR
FIGURE 3 TRANSMIT ALIGNMENT PACKAGE
13

CC O DC U U CC DC
0. Q_ 5 O
h O o i (J y LU o a O h-
2 LU
LU
H 0. o
2 cc
2
LT
h CL O
LU
o _i LU LU _J o 0- LU LU u o 10 h |- 2 _l cc
2 1 oo 00 < 1- cc 5 1
5 5 o u < 5 UJ o LU
LU LU
LU < < LU LL _l CD LU LU K LU
QJ CO CO 00 E O
00 c XI
c V cr U 1 o
CC
»- N (M co P ir> Q-
©©©©©©©©
cc LU CC
> o
o E
5 E <5 LU
< i- OC W h-
C
3
•-* a s c o o
UJ
a <
< CL
z LU
z a _J
< H
CO
z < DC I-
UJ DC 3 C3
14

package that may provide a better perspective of the optical arrangement.
The laser beam passes through a germanium (Ge) flat (lj to the first
steering mirror (2J where it is directed through a zinc selenide (ZnSe)
(3) beam-splitter to a second beam-steering mirror (4^) . This mirror
directs the beam up through a hole in the second level of the optical
table to a third beam-steering optic {5J where the beam is directed to
the lidar XMIT/RCVR (T/R) steering mirror © for transmission. To aid
in alignment, a HeNe alignment laser beam is placed on axis with the IR
beam by reflecting it off the output side of the Ge flat (l) . Using
this arrangement, the HeNe beam may be left on during normal laser opera-
tion to provide a visible indication of the IR beam path. Exact parallel
axis alignment between the IR and HeNe beam is accomplished by adjusting
the Ge flat (Y) positioning such that the far-field beams are in the same
location. This alignment is performed easily by observing the position
of an IR burn spot on a suitable material (i.e., uncoated Polaroid film)
at the focal point of a 50-cm focal length mirror and adjusting the HeNe
beam onto this burn spot. This alignment, of course, should not be done
with full laser energy as the full-focused energy density can be quite
dangerous. The method used in our alignment package is to beam split
(Y) off 1% of the laser energy and direct it at the 50-cm focusing
mirror (V) as shown in Figure 3. A burn spot at the focal point (lj of
the 50-cm mirror can be detected easily and represents the far-field IR
beam location. The HeNe beam far-field spot can be adjusted onto the IR
beam burn spot using the Ge flat (Y) Gimbal mount adjustments. The burn
* Circled numbers in Section III B refer to components identified in Figures 3 and 4.
15
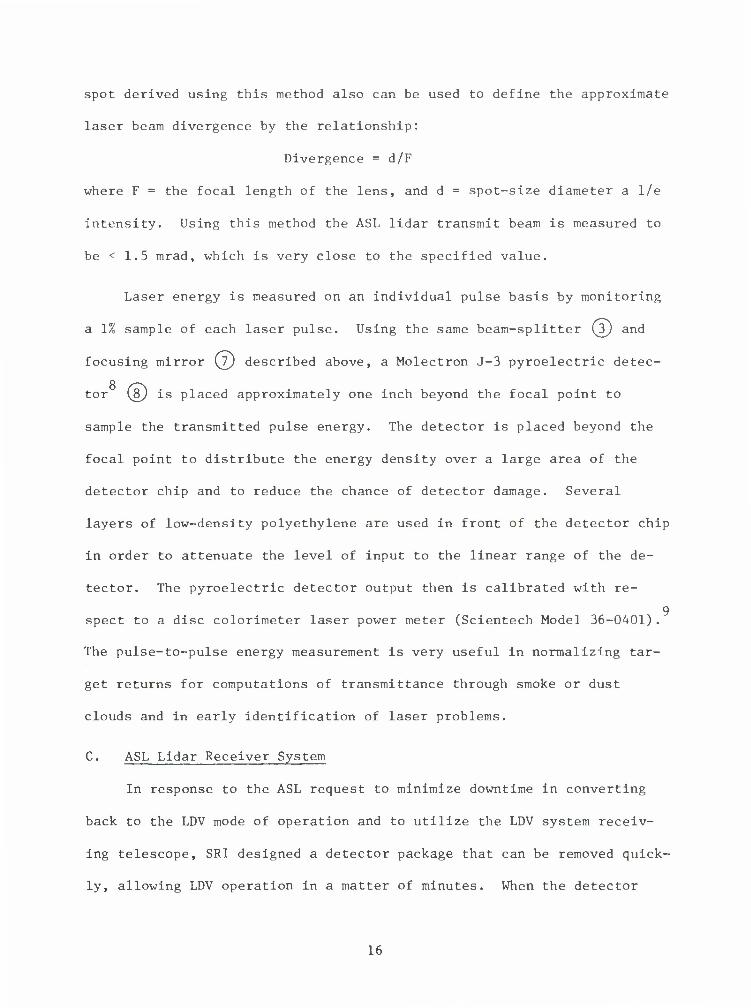
spot derived using this method also can be used to define the approximate
laser beam divergence by the relationship:
Divergence = d/F
where F = the focal length of the lens, and d = spot-size diameter a 1/e
intensity. Using this method the ASL lidar transmit beam is measured to
be < 1.5 mrad, which is very close to the specified value.
Laser energy is measured on an individual pulse basis by monitoring
a 1% sample of each laser pulse. Using the same beam-splitter \3J and
focusing mirror \7J described above, a Molectron J-3 pyroelectric detec-
8 s~\ tor [8J is placed approximately one inch beyond the focal point to
sample the transmitted pulse energy. The detector is placed beyond the
focal point to distribute the energy density over a large area of the
detector chip and to reduce the chance of detector damage. Several
layers of low-density polyethylene are used in front of the detector chip
in order to attenuate the level of input to the linear range of the de-
tector. The pyroelectric detector output then is calibrated with re-
9 spect to a disc colorimeter laser power meter (Scientech Model 36-0401) .
The pulse-to-pulse energy measurement is very useful in normalizing tar-
get returns for computations of transmittance through smoke or dust
clouds and in early identification of laser problems.
C. ASL Lidar Receiver System
In response to the ASL request to minimize downtime in converting
back to the LDV mode of operation and to utilize the LDV system receiv-
ing telescope, SRI designed a detector package that can be removed quick-
ly, allowing LDV operation in a matter of minutes. When the detector
16

z O
LU t- tr < 3 CO
o -1
J co Z <
IT O
h- Z 3
u z LU
tr i- • N
S 5 O a.
5 > | E n 2 < X Q 5 O LU LU
5 (0 H or a. < < CO u
uj < < Q &£ OQ ,, CO Z o
o Z < < z P < a. < 0. DC tr DC 2 ° h C LU
O > co f— u > 1-
UJ LU
X <
LU 1- LU
LU Z o 3 UJ O
Z DC m Q tr 5
00@©@ <
< Q-
UJ tr cr < a
CO <
tr
o
17
LU > O LU cr a: < Q
<
LL
18

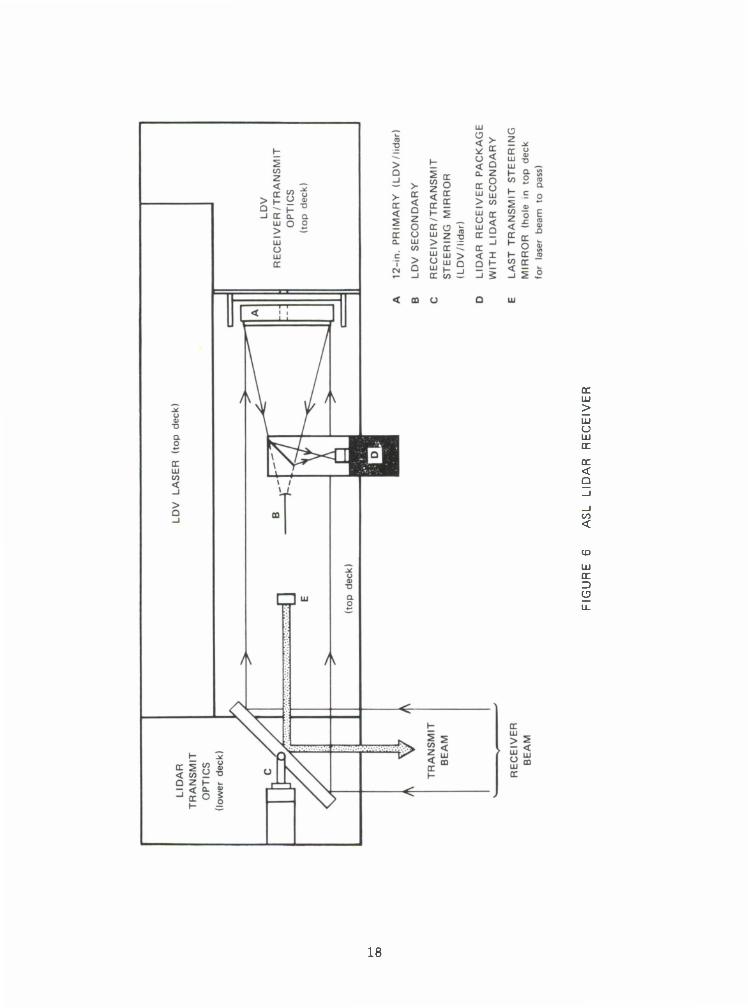
package, shown in Figure 5, is placed in position, it converts the re-
ceiving telescope from a Cassegrainian configuration (LDV mode) to a
Newtonian system (LIDAR mode). Figure 6 shows the major receiving com-
ponents for both systems which all are located on the top deck of a two-
level optical table. The lidar detector package contains a Newtonian
beam-director, relay optics, a liquid N„-cooled HgCdTe diode detector,
and post-detection amplification electronics'. The detector and elec-
tronics are located in an RFI-shielded enclosure that is conductively-
isolated from the assembly by phenolic mounts. This isolation is re-
quired to ensure receiver isolation integrity from the laser ground.
In the lidar operation mode, the receiver package is positioned in
a keyed location shown in Figure 6 (see callout D) such that the Newton-
ian secondary lens /is (Figure 5) directs the telescope primary lens
focus toward the relay optics assembly £l\, . The actual primary focus
(infinity focus) is 2 inches (5 cm) in front of the first lens (lens 111)
of the relay optics assembly so that the received rays diverge to fill
lens #1. Lens #1 collimates the diverging beam which then is focused by
lens #2 onto the detector chip. The relay optics expand the field-of-
view of the receiver to match the transmit beam divergence, and enables
the use of a smaller detector with lower noise. The detector chip is
0.114 mm square and with the f/2 and f/1 relay lenses yields a receiver
field-of-view of 1.23 mrad. To reduce sidelobe clutter such as that en-
countered in the Dugway 10.6 um lidar system, the desirable field-of-view
is equal to or slightly greater than the beam divergence of the laser.
* Numbers enclosed by triangles refer to components identified in Figure 5.
19

The relay optic assembly /2\ is mounted in a 5-axis precision optical
mount /3\ that allows precise alignment of this assembly. Alignment of
the assembly is discussed in Appendix F. Once aligned, no further ad-
justments of this assembly should be required. In order to focus the
receiving telescope at various ranges and provide a fine convergence
adjustment for the transmit/receive system, the relay optic assembly/
mount/2\ / £& and detector/amplifier enclosure A\ are mounted on an
X-Y-Z translation stage £& .
The receiver electronics located in the RFI-tight enclosure provide
detector bias and linear or logarithmic amplification of the received
signal. If linear operation is selected, a maximum dynamic range of
40 dB (optical power) is available at the receiver package output. This
linear dynamic range, however, cannot be appreciated when converting it
to digital information because of digitizer limitations. Generally, only
approximately 23 dB of this dynamic range can be utilized accurately in
an 8-bit digitizer. Using the logarithmic amplifier over four decades,
more than 40 dB of optical power can be digitized on an 8-bit digitizer
system.
The specifications for the linear amplifier and log amplifier are
given in Appendix G and H, respectively, and a schematic diagram of the
receiver package electronics is given in Appendix I. Although logarith-
mic operation generally is desired, there are many applications where the
greater accuracy required can only be achieved by linear amplification.
20

The video output (log or linear) from the receiver package is digi-
tized by a Biomation 8100 that can be operated at a digitizing rate up
to 100 MHz (10 ns sample rate). Specifications of the 8100 digitizer
are found in the system equipment manual. The digital output from the
Biomation unit can be interfaced with the post-processing and/or record-
ing equipment. Originally it was planned to interface this output with
the data processing equipment of the LDV system located in a separate
computer van but, during the course of the ASL lidar development, the
LDV computer van became dedicated to other ASL programs. Thus, other
approaches to recording and processing of the data must be examined.
21
IV SYSTEM IMPROVEMENTS
The overall objective in the ASL lidar developments was to improve
system performance with respect to the prototype system used during the
Dugway field test; specific attention was directed at improving range
resolution, timing jitter, dynamic range, and reduction in sidelobe
clutter. A comparison between the ASL lidar performance and the proto-
type system in the specific areas noted above follows:
(1) Range resolution—An improvement in range resolution from
approximately 75 to 25 m was achieved by reducing the laser pulsewidth
from 250 ns to 75 ns (FWHM). This improvement primarily was the result
of careful characterization of the laser operation with a zero-N„ gas
mixture (Appendix E). The receiver system bandwidth also was increased
from 10 MHz (receiver limitation) to 25 MHz (digitizer analog bandwidth)
so that the shorter pulse width of the transmitted signal can be appre-
ciated.
(2) Timing jitter—Unstable zero-time (laser has fired) triggering
was the cause of the range jitter observed in the Dugway test data. This
jitter primarily was caused by RFI coupled to the trigger line when the
CO laser discharge occurred. The use of a fiber optic pick-up of the
laser spark gap discharge greatly reduces the problem in the ASL lidar
system.
22

(3) Dynamic range—The prototype system used the SRI Mark IX lidar
log amplifier on a time-share basis during the Dugway test. A log video
amplifier improved in both risetime/falltime and dynamic range was de-
veloped for the ASL lidar system (Appendix H).
(4) Sidelobe clutter—Sidelobe clutter noted in the Dugway data
was due to the fact that some transmitted energy (approximately 10%) is
radiated outside the 1.2-mrad beam divergence specification. Some low-
level energy may exist several mrad beyond the stated beam divergence.
If scatter mechanisms are present along the path, some backscatter will
occur even though they are outside the transmitter normal beam path.
The amount of backscatter, of course, will depend on the type of scatter-
ing surface. At Dugway guy wires near the center of the optical path
caused notable backscatter. This off-axis backscatter is a problem only
if it is within the field-of-view of the receiver system which, at Dugway,
was 3 mrad. To eliminate this problem in the ASL lidar system, the re-
ceiver system was designed so that the field-of-view (1.23 mrad) is just
slightly larger than the transmitter beam divergence of 1.2 mrad. The
only problem in matching the transmit and receive beams in this manner
is the critical alignment it requires. Fortunately, when a target is
used, as in smoke and dust measurements, a convenient daily performance
evaluation and convergence backscatter signal is available for checking
the system alignments (see Appendix F).
23

REFERENCES
1. Uthe, E. E. , "Lidar Observations of Smoke and Dust Clouds at 0.7-ym and 10.6-ym Wavelengths," Technical Report No. 1, ARO Contract DAAG29-77-C-0001, SRI Project 5862 (1978).
2. "Remote Monostatic Wind Measuring System," Final Report Contract DAAH01-75-C-1057 for U.S. Army Missile Command, Lockheed Missiles & Space Company, Inc. (1976).
3. Technical Manual for Model 5201C Memory Voltmeter, Rev. 1, Micro Instrument Company, Escondido, CA (1969).
4. Operation and Maintenance Manual for Pulse Generators, Models 801 and 802, Dytech Corporation, Santa Clara, CA.
5. Instruction Manual for Series 100-2 TEA CO Laser System, Serial No. 1434, Lumonics Research Limited, Kanata (Ottawa) Ontario, Canada (1978).
6. Lumonics Research Limited, private communication (1979).
7. Instruction Manual for Helium-Neon Lasers, Models 142-147,
9.
Spectra-Physics, Mount; ain View, CA . (1976).
Instruction Manual for Pyroelectri c Joulemeter , Model J3, Molectron Corporation, Sunnyvale, CA (1978).
Operating Instructions for • Models 36-0401 and 36-4001 Laser Power Meters, Scientech, Inc., Boulder, CO (1977)
10. Test Report No. 30270-1 for LK146 C9 S/N R-2 Infrared Detector for SRI International, Contr. No. A38923, Honeywell, Inc., Lexington, MA (1978).
11. Operating and Service Manual for Waveform Recorder, Model 8100, S/N 11930, Biomation, Santa Clara, CA (1978).
24

Appendix A
PERFORMANCE PREDICTION CALCULATIONS
Calculations of signal-to-noise ratio (SNR) as a function of range
have been made for the ASL lidar to establish expected system performance.
The backscatter coefficient measured at Dugway Proving Grounds in 1977
was used for the calculation since atmospheric conditions are expected
to be similar to those at White Sands, New Mexico where the first ASL
lidar system evaluation was conducted.
To determine the SNR at a given range the lidar equation first is
solved for backscatter signal:
Pr(R) = Ut ;§ k B180 Ta Ts (1) R
where
P = return signal, photon/s
U = transmitted energy, J/pulse
2 A = area of receiver, m r
R = range, m
A = wavelength, m
-34 h = Planck's constant, 6.63 x 10 J-S
(B,„n = backscatter coefficient, m str
-kr -1 T = atmospheric transmission = e , k ^ 0.09 km a
T = system efficiency.
25

For this calculation, the following parameters were used:
U = 0.25 J/pulse
A = 0.07297 m (12-in diameter)
A =10.6 urn
-9 -1 -1 S,„„ = 7.4 x 10 m str
T = 0.91 a
T = 0.78. s
The resultant received power levels were:
P (500 m) = 5.576 x 10~8 W r
P (1 km) = 1.326 x 10~8 W r
P (1.5 km) = 5.61 x 10~9 W r
P (2 km) = 3.0 x 10~9 W. r
The backscatter signal as a function of range then is compared with the
receiver system noise equivalent power (NEP) which is derived from the
detector and receiver characteristics as follows:
Detector NEP = -^ = 2.6 x 10~12 W//Hz D
— 32 * 10 ^ —1 where A = detector area 1.14 x 10 cm and D = 1.3 x 10 cmHz2W
—8 With a receiver bandwidth of 25 MHz the system NEP = 1.3 x 10 W.
Comparing the system NEP with the anticipated received power, we
can see that an SNR = 1 is expected at a range of 1 km.
26
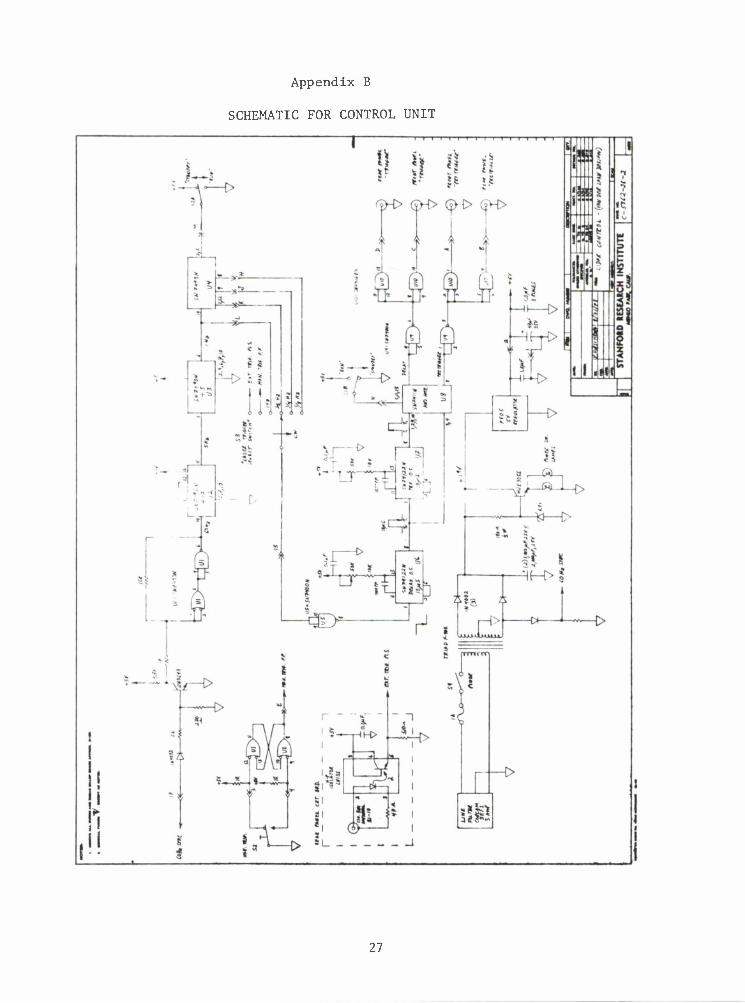
Appendix B
SCHEMATIC FOR CONTROL UNIT
27

SCHEMATIC FOR TRIGGER AND SYNCHRONIZED PULSE ISOLATION INTERFACE
5111H
54
• s
!
I!
.__ f\' iWTTrO
*h
45 r
I
life 5 •< Htrt.
Cs
M
HiS Si!
1
i
1
! I
3
z
II I/* o UJ S -i
<
i I gisi
—o
-0 II •>
ii -• a ~ ~^— 5*a
28
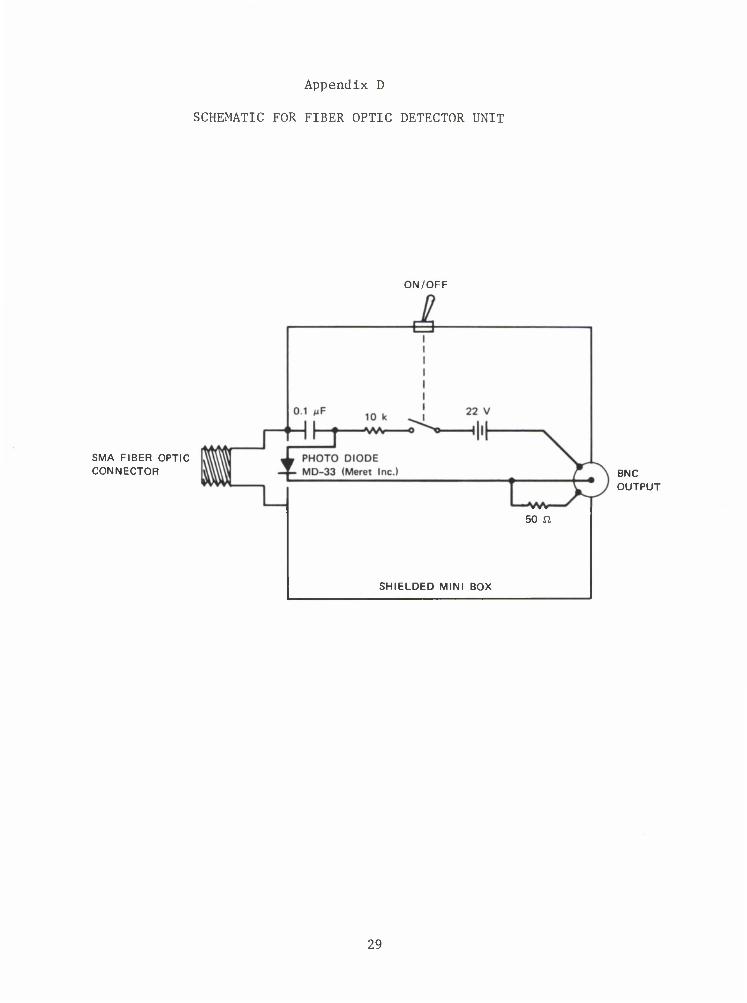
Appendix D
SCHEMATIC FOR FIBER OPTIC DETECTOR UNIT
ON/OFF
SMA FIBER OPTIC CONNECTOR BNC
OUTPUT
50 n
SHIELDED MINI BOX
29

Appendix E
LASER OPERATING CONDITIONS
Operation of the Lumonics C0„ laser system for minimum pulsewidth
output requires operation with fundamental transverse mode optics
(unstable resonator cavity) and zero-nitrogen (N„) lasing gas mix.
For stable operation under these conditions there is a definite optimum
gas mixture, gas flow rate, and high voltage setting for each selected
PRF rate. The ASL lidar laser was optimized for operation at a 1-Hz
PRF rate, and the following conditions produced a 250-mJ, 75-ns (FWHM)
pulse output with a pulse-to-pulse amplitude stability better than ± 5%:
He regulator pressure 10 lb
C0„ regulator pressure 10 lb
He flow rate 7 (flowmeter reading)
C0„ flow rate • 3 (flowmeter reading)
High voltage 38 kV
The Lumonics Operation Manual should be consulted for general operating
hints and instructions.
30

Appendix F
RECEIVER ALIGNMENT PROCEDURE
The alignment procedure described here is a complete receiver
system alignment and generally will be required only during initial
setup of the lidar system. During normal operation a routine standard
lidar convergence adjustment is all that is required. If a lidar target
is to be used during normal operation, the target return will provide an
excellent system performance reference as well as a convenient conver-
gence signal. A convergence procedure also is discussed in this re-
ceiver system alignment outline.
The ASL lidar receiver system is aligned when the receiver detec-
tor or its image is on the principal axis and at the focal point of the
receiver telescope primary. The principal axis of the telescope also
must be centered on the transmit/receive (T/R) steering mirror. To
achieve this alignment, the first step is to confirm that the telescope
primary and the T/R steering mirror are in proper alignment (this condi-
tion should exist if the LDV system is aligned).
Step A.
1. Place a retroreflector cube on a stand at a range of 100 m
from the van on or near the anticipated optical path of interest.
2. Illuminate the retroreflector with the HeNe transmit align-
ment laser by steering the beam with the T/R steering mirror on to the
retroreflector (it is assumed that the transmit system is aligned, and
31

that the HeNe alignment laser defines the IR optical path). If the tele-
scope primary is aligned properly an image of the illuminated retroreflec-
tor will be seen on a white card held 9 inches above and 9 inches from the
edge of the optical table and approximately two ft in front of the primary.
3. If the retroreflector image is not seen at the desired
location the primary mirror should be adjusted so that it is. To aid
in this adjustment, position the LDV secondary lens at the exact desired
primary focus location. Loosen the primary mirror lock-down screws and
adjust the appropriate controls to position the retroreflector image at
the center of the LDV secondary. Tighten the lock-down screws and con-
firm that the image has not moved; repeat procedure if necessary.
This completes the telescope primary adjustment.
Step B.
1. Place the lidar receiver package in its keyed location on
the table and bolt it down. In this location the lidar Newtonian
secondary mirror, located on the receiver package, should direct the
principal axis of the receiver 90 from the normal and towards the relay-
optic housing on the receiver package. The retroreflector image should
be located using a white card held approximately 2 inches in front of the
relay optic housing.
* The LDV secondary is mounted on a special X-Y-Z translation mount and normally should be on the proper receiver axis; in order to focus the system at 100 m, only a Z-translation should be required.
** Prior to installing the receiver package, the optics of the relay optics assembly should be aligned and focused on the desired detector chip using the visible optic assembly provided. This assembly will be changed to a matching IR optics assembly in Step C.
32

2. If the retroreflector image (Step B-l) is not near the
location expected, check its location with respect to the table and
primary mirror. The image should be 19 inches in front of the primary
mirror, 9 inches above and 4 inches from the edge of the table; if it is
not, adjust the position of the Newtonian secondary.
3. The position of the entire detector/relay optic package
now can be adjusted using the package X-Y-Z position controls so that
the relay optics are on-axis and 2 inches beyond the focused retroreflec-
tor imate. The package is placed 2 inches beyond the image focus because
the relay optics provide a four-fold detector field-of-view expansion and
the expanded detector image is located 2 inches in front of the relay
optic assembly.
The basic visible receiver adjustments are now completed. The
following adjustments are required to correct for any differences between
the visible relay optic assembly and the IR optics assembly used in system
operation.
Step C.
1. Replace the visible relay optic assembly with the IR optic
assembly on the relay optic mount, being careful not to disturb any of
the 5-axis adjustments.
2. Replace the retroreflector cube used in Steps A and B with
a chopped IR source (a hair dryer element with a chopper blade and motor
in front of the element makes an excellent IR source for this alignment).
3. Fill the LN„ Dewar flask in the receiver package with LN.
and turn the receiver on.
33

4. Connect an ac-microvolt meter (i.e., H-P 400E) to the re-
ceiver output. Do not use the log amplifier for this test. If the re-
ceiver is aligned properly, a detectable signal-to-noise change in re-
ceiver output level will be observed when the receiver beam is blocked
and unblocked. The receiver "no signal" noise level output should be
between 60 and 80 uV. If no change is observed, translate the receiver
package in the X-Y-Z axis until a signal is detected. Once a detectable
level is observed and peaked, readjust the relay optic adjustments to
optimize the signal. Only minor adjustments should be required.
The receiving system adjustments for system focus at 100 m are now
completed. To focus the system at other ranges, calculate the required
image position change from the 100 m location, and reposition the re-
ceiver package using the Z-axis adjustment. This should be a very minor
adjustment since the 100 m-to-infinity change is only 3.8 mm. A more
accurate focus adjustment, also serving as a complete receiver/transmitter
alignment, is described in Step D.
Step D.
1. Align the receiver onto a target of interest using the
T/R steering mirror. A focused image of the target should be seen near
the telescope primary focus if a white card is placed at that location.
Adjust the T/R steering mirror so that the target image is centered on
the principal axis of the receiver. The receiver system now is aligned
in X-Y coordinates on the target of interest.
54

2. Turn the CO laser system on and illuminate the target.
The C0„ laser output should be aligned on the target at this time since
the transmit alignment HeNe laser (which defines the C0„ laser path) was
used to define the principal receiver axis in Step A of this procedure.
3. Connect the output of the receiver to a peak reading volt-
mi ter ;PRVM) and dual trace oscilloscope, and observe the return signal
on the scope.
4. Put the PRVM gate signal on the second channel of the
oscilloscope and adjust the gate range to the target location. A reading
on the PRVM now should be seen and represents the peak amplitude return.
5. Be sure that the transmitter and receiver beams are in
convergence by adjusting the last transmit steering mirror in X and Y.
Each adjustment should be scanned while observing the PRVM for the maxi-
mum signal. Note the 50% amplitude location on each side of the peak
signal for both the X and Y micrometer settings and set both micrometers
for the mid-range position. Note that this lidar convergence adjustment
generally is the only daily adjustment required.
6. Adjust the receiver package Z-position control for a maxi-
mum signal on the PRVM. The receiver system now is focused at the target
range.
The receiver system alignment procedure is now completed.
35

Appendix G
SPECIFICATIONS FOR RECEIVER LINEAR AMPLIFIER
SL
•~7"-m:m:,!2BB±^\ ... .•>.'-: -Jim
PERRY AMPLIFIER
-WIDEBAND RF TRANSISTOR AMPLIFIER
.___ULfRA.IOW NOISE FOR
LASER-PULSED DETECTOR SYSTEMS
-MODELS 460 THRU 490
SPECIFICATIONS
GAIN (RG=50 OHM) 36DB
BANDWIDTH (RG=50 OHM) MODEL 460 *00HZ - 10MHZ MODEL 470 J00HZ - 30MHZ MODEL 480 >00HZ - 50MHZ MODEL 490 100HZ - 100MHZ
PULSE RESPONSE S NANOSECONDS
INPUT IMPEDANCE 50 OHM
OUTPUT IMPEDANCE * OHM
OUTPUT LEVEL MAXIMUM J VOLTS P-P
POWER REQUIREMENTS *I2V (?20MA
OPERATING TEMPERATURE -55°C TO 85°C
MECHANICAL SIZE *" X 2" X 1"
THE SERIES 460 THRU 490 VIDEO PREAMPLIFIERS AS£ SPECIALLY DESIGNED FOR USE WITH HIGH-SPEED PHOTODETECTOXS IN PULSE AND CW LASER SYSTEMS. THESE UNITS WILL ACCEPT VAR20US INPUT IMPEDANCES AS PRESENTED BY TYPICAL DETECTORS AND MAINTAIN OVERALL STABILITY AND PERFORMANCE WITH INPUTS FROM 10 OHM TO IK OHM.
Pff.<T^1iplla^«mwMllm«i.M ••• •—r—mam.
PERRY AMPLIFIER BROO KLINE] MASS.' 617- RE 4~0844
i
I
Appendix G 1 of 4
36

OPERATING INSTRUCTIONS
PLEASE READ CAREFULLY BEFORE OPERATING
*W AMPLIFIER SPECIALISTS
-T. PERRY AMPLIFIER '38 FULLER ST BRCOKLINE. MASS. RE 4-084*
MODEL ^90 WIDEBAND VIDEO AMPLIFIER
INPUT- THE INPUT OF THE AMPLIFIER IS CAPACITIVELY COUPLED
INTERNALLY WITH A 1UF CAPACITOR RATED AT 25 VOLTS NON-POLAR.
TO EXCEED THIS VOLTAGE RATING ADD AN EXTERNAL CERAMIC TYPE
CAPACITOR.
THE INPUT IMPEDANCE IS 50 OHMS. THE AMPLIFIER IS STABILIZED
TO ACCEPT INPUT DRIVING IMPEDANCES OF 10 OHM TO IK OHM.
OPTIMUM AMPLIFIER PERFORMANCE IS ATTAINED WITH RESISTIVE
DRIVE SOURCES. MOST DETECTORS ARE HOWEVER REACTIVE IN NATURE
DUE TO INTRINSIC DETECTOR CAPACITANCE. IT IS RECOMMENDED THAT
THE INPUT DRIVING CAPACITANCE BE KEPT AT A MINIMUM TO MINIMIZE
REFLECTIVE DISTORTION AND INSTABILITY. SHORT CABLES ARE A MUST.
HIGHLY REACTIVE DETECTORS REQUIRE SPECIAL COMPENSATION FOR
OPTIMUM PERFORMANCE, THEREFORE IT IS OFTEN ADVISABLE TO DETERMINE
THE EXACT ELECTRICAL CHARACTERISTICS OF THE DETECTOR AND HAVE
THEM MATCHED SPECIFICALLY TO THE AMPLIFIER.
OUTPUT THE OUTPUT OF THE AMPLIFIER IS CAPACITIVELY COUPLED
INTERNALLY WITH A 3UF CAPACITOR. SHORT CIRCUITS WILL NOT DAMAGE
THE AMPLIFIER WHEN OPERATING AT LOW SIGNAL LEVELS. THE OUTPUT
IMPEDANCE @100MHZ IS 50 OHMS. THE BASIC MODEL ^90 WILL DRIVE
50 OHM CABLES OF SHORT LENGTH TO A MAXIMUM OF 1 VOLT PEAK INTO
50 OHMS. TO DRIVE LONGER CABLES IT IS RECOMMENDED THAT A PERRY
VIDEO LINE DRIVE BE INSTALLED. INSTALLATION OF THE LINE DRIVE
EXPANDS THE OUTPUT CAPABILITY TO «• VOLTS PEAK, EXTENDS LOW
Appendix G 2 of 4
37

AMPltFIER SPECIALISTS
PERRY AMPLIFIER l38 FULLER ST BROOKLINE. MASS RE 4 - 0844
FREQUENCY RESPONSE AND RETRIEVES 6DB GAIN LOST IN THE
LOADING EFFECT OF THE 50 OHM TERMINATION. A VIDEO LINE
DRIVER CIRCUIT CAN BE INSTALLED IN SOME VERSIONS OF THE MODEL 490.
SUCH UNITS ARE SPECIAL DESIGNS FOR SPECIFIC AMPLIC ATIONS AND
DESIGNATED AS MODELS 490LD.
GAIN THE VOLTAGE GAIN OF THE AMPLIFIER IS A FUNCTION OF THE
INPUT DRIVING SOURCE IMPEDANCE. THE GAIN IS 26DB @ 50 OHM DRIVING
SOURCE IMPEDANCE, AND WILL DECREASE SOMEWHAT WITH HIGHER SOURCE
IMPEDANCES.
TANDEM OPERATION IN MANY CASES ADDITIONAL GAIN MAY BE REQUIRED
TO MEET SYSTEM DEMANDS. IT IS POSSIBLE TO DIRECTLY STACK TWO
MODEL *+90 BY DIRECT CONNECTION TO GIVE OVERALL GAIN OF 50DB.
TANDEM OPERATION WILL CAUSE SOME CONTRACTION OF BANDWIDTH AS
IS TO BE EXPECTED.
POWER REQUIREMENTS THE POWER SUPPLY SHOULD BE OF GOOD DESIGN TO
ELIMINATE POWER SUPPLY FEEDBACK. TWIST ALL POWER LEADS TO THE
AMPLIFIER AND BY-PASS THE POWER AT THE AMPLIFIER WHENEVER POSSIBLE.
CURRENT DEMAND WILL VARY FROM UNIT TO UNIT WITH A 16MA AVERAGE.
MODEL UNITS <+90LD WILL REQUIRE "+0MA CURRENT @±12 VOLTS. BIAS
CIRCUITS SHOULD BE INDEPENDENT OF AMPLIFIER POWER CIRCUITS.
USE SEPARATE BATTERIES FOR IDEAL ISOLATION AND NOISE MINIMIZATION.
CAUTION : DO NOT CONNECT POWER TO THE AMPLIFIER IN REVERSE.
REVERSE POWER WILL DAMAGE THE AMPLIFIER.
Appendix G 3 of 4
38

ENGINEERING NOTE: MODEL 490 SERIAL NO. 6861 RF AMPLIFIER.
THIS UNIT HAS BEEN OPTIMIZED FOR USE WITH A HONEYWELL DETECTOR
IMPEDANCE RANGE 50 TO 200 OHMS/ 10PF CAPACITANCE. THE MODULE
CONTINS A FIXED DECOUPLED BIAS RESISTOR TO SUPPLY BACK BIAS
TO THE DETECTOR DIODE. THE BIAS RESISTOR VALUE IS 2<tK OHM AND
WILL SUPPLY 500UAMP TO THE DETECTOR WHEN OPERATED FROM A
12 VOLT BATTERY SOURCE. THE BIAS CIRCUIT IS ACCESSABLE VIA
TERMINAL MARKED "V". APPLY BIAS ONLY WHEN DETECTOR IS SECURELY
CONNECTED TO AVOID INPUT VOLTAGE OVERLOAD.
PERRY
Appendix G 4 of 4
39

Appendix H
SPECIFICATIONS FOR RECEIVER LOGARITHMIC AMPLIFIER
cpmMic,
PLANAR MICROWAVE INTERNATIONAL CORPORATION A DIVISION OF THE KURAS ALTERMAN CORPORATION
138 K1FER COURT SUNNYVALE. CALIFORNIA 940K6 (408) 739-3400
Log Video Amplifier
P/N £t^ \oioE? S/N f 0 f
Specification Measured
1. Input Impedance 50ft S"0^- 2. Output Slope
21 mv/db (nom) **.$" rvi«//c/4 3. Risetime 15 n sec.
4. Settling time 30 n sec.
(-81 dbr)
(-51 dbr)
(-31 dbr)
(-11 dbr)
(-81 dbr)
Jf ** (-51 dbr)
afrhS (-31 dbr)
^70hS (-11 dbr)
Cog. Engineer v'fy? Cfb*^^y 10
Date f/Vf-rY Q.A. Q^~=#>-y>vi. -,
Tested By GCt^T ^t^9*-4UT Ot
tfate r/^/7 *>
Product Line Manager
Date
CABLE ADDRESS: PLAM1C • TWX: 910-339-9220
Appendix H 1 of 3
40

cpmMic,
PLANAR MICROWAVE INTERNATIONAL CORPORATION A DIVISION OF THE KURAS-ALTERMAN CORPORATION
138 K1FER COURT SUNNYVALE. CALIFORNIA 94086 (408) 730 3400
S/N %Q\
Tpecification
5. Output s/n ratio at 200 mv input, less than 16 db.
6. Lo£ conformity + 0.5 db
7. Recovery Time:
Measured
see attached transfer response
Direct and indirect measurements have been made which verify that the unit will recognize a low level pulse following a high level pulse within 50 nanoseconds. Recovery time however, is difficult to measure because the test and measurement equipment cannot generate or measure the extremely high on-to-off ratios required to properly evaluate the device being tested. This problem was discussed with Jon Vanderlawn.
Tested By: ^Lgn, *~&*l0tarrt\
mtfr Date:
Q.A.
*
&—r+*
CABLE ADDRESS: PLAM1C • TWX: 910-339-9220
Appendix H 2 of 3
41

CPUAMIC
PLANAR MICROWAVE INTERNATIONAL CORPORATION A DIVISION OF THE KURAS-ALTERMAN CORPORATION
138 K1FER COURT SUNNYVALE CALIFORNIA 940R6 <<08) 7.193400
S/N tOL Transfer Response
10 volt input signal defined as 0 dbr
Input Output (dbr) (mv)
-1 \l11 -6.15 l^fOSL -11.15 nsz -16.3 it.it -21 i<r<W -26.15 rtll -31 /2*r -36.15 t*fo -41 nil -46.15 ton -51 w -56.15 f7V -61 77* -65.15 6*3 -71 St>l -76.15 Mbo -81.1 760- -86.25 2S-JL -91.15 tT3
Error (db)
+ . t
- .ox
+ .rt + .16
i «t
- .07
-.»
Tested By: f^Qy\ ^O^^Cf >Q Date: */Y/7# y^ - ' '' CABLE ADDRESS. PLAM1C • TWX: 910-339-9220
Appendix H 3 of 3
42
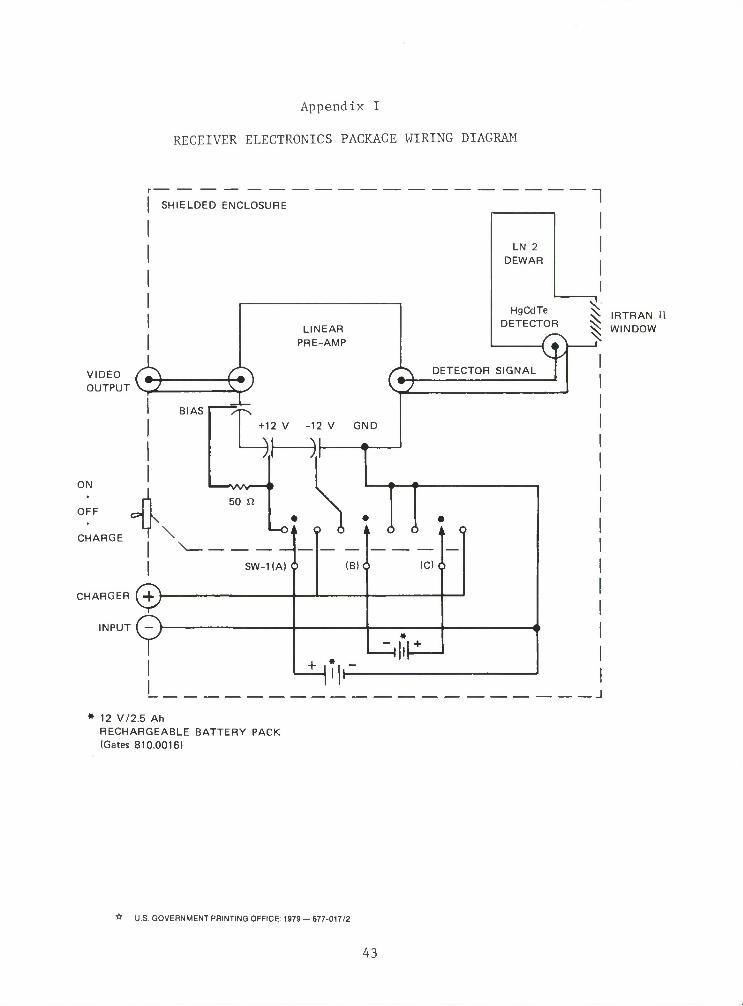
Appendix I
RECEIVER ELECTRONICS PACKAGE WIRING DIAGRAM
SHIELDED ENCLOSURE 1
VIDEO OUTPUT (?) &
LINEAR
PRE-AMP
LN 2
DEWAR
5L HgCdTe * |RJRAN „ fTOR
^ WINDOW
BIAS
ON
OFF
CHARGE
0: DETECTOR SIGNAL
+12 V -12 V GND
)l ).h
50 n \
1
SW-KA) 6
CHARGER
INPUT ( -
<*>
9
(B)<5 <C)d>
•—oA 90 A 6 6 A o
+ lIlP-
* 12 V/2.5 Ah RECHARGEABLE BATTERY PACK (Gates 810.0016)
* U.S. GOVERNMENT PRINTING OFFICE: 1979 — 677-017/2
43