a systematic approach to modeling and verifying context-aware services ...€¦ · a systematic...
TRANSCRIPT

Seediscussions,stats,andauthorprofilesforthispublicationat:https://www.researchgate.net/publication/239442887
ASystematicApproachtoModelingandVerifyingContext-AwareServicesinSOAs
ConferencePaper·January2008
CITATION
1
READS
73
2authors:
Someoftheauthorsofthispublicationarealsoworkingontheserelatedprojects:
SecurityinSensornetworkViewproject
DigitalHealthRevolutionViewproject
DhamindaB.Abeywickrama
VTTTechnicalResearchCentre,Oulu,Finland
21PUBLICATIONS108CITATIONS
SEEPROFILE
SitaRamakrishnan
MonashUniversity(Australia)
48PUBLICATIONS140CITATIONS
SEEPROFILE
AllcontentfollowingthispagewasuploadedbyDhamindaB.Abeywickramaon11March2015.
Theuserhasrequestedenhancementofthedownloadedfile.

Preface Welcome to the Pervasive 2008 Workshop Proceedings. This year’s conference offered a diverse workshop program. In total, eight workshops were held on May 19, 2008 and May 22, 2008. Each workshop had its own acceptance criteria. Some had an acceptance rate below 25%, while other accepted as many position papers as possible to ensure that a wide range of views would be represented. In total, over 50 papers were presented, covering a wide variety of topics. These ideas represent some of the future of the Pervasive conference, and we include them here for your enjoyment and to inspire the next set of innovations to come.
May 2008 Arkady Zaslavsky, Khai Truong Workshops Chairs

Contents Workshop on Security and Privacy Issues in Mobile Phone Use Don’t trust POS terminals! Verify in‐shop payments with your phone Iulia Ion & Boris Dragovic
8
The Privacy Badge Revisited ‐ Enhancement of a Privacy‐Awareness User Interface for Small Devices Sven Gehring & Martin Gisch
18
Consistent Deniable Lying: Privacy in Mobile Social Networks Sebastian Kay Belle & Marcel Waldvogel
26
Mobile Gambling James Phillips & Alex Blaszczynski
34
Usage Profiles for the Mobile Phone Amy K. Karlson
36
Challenges for Privacy with Ubiquitous Sensor Logging James Scott
39
Workshop on Pervasive Persuasive Technology and Environmental Sustainability Notes on the Political Image: Pervasive Computing, Modeling Assemblage, and Ecological Governance Benjamin H. Bratton & Natalie Jeremijenko
45
The Potential Of Ubicomp Technologies To Determine The Carbon Footprints Of Products Ali Dada, Thorsten Staake & Elgar Fleisch
50
Towards Participatory Design of Ambient Persuasive Technology Janet Davis
54
Motivating Environmentally Sustainable Behavior Changes with a Virtual Polar Bear Tawanna Dillahunt, Geof Becker, Jennifer Mankoff & Robert Kraut
58
Points of Persuasion: Strategic Essentialism and Environmental Sustainability Paul Dourish
63
Understanding Motivation And Enabling Action Towards Change Penny Hagen & Duncan Underwood
67
The New Well‐Tempered Environment: Tuning Buildings And Cities Dan Hill & Duncan Wilson
71

Promoting Environmentally Sustainable Behaviors Using Social Marketing In Emerging Persuasive Technologies Omar Khan & John Canny
75
Context‐Aware Pervasive Persuasive Systems for Managing Water and Energy Usage, and CO2 Emissions: Multi‐Levelled Policies, Goals, and an Expert Systems Shell Approach Seng W. Loke, Jugdutt Singh & Hai Le
79
Using Persuasive Technology To Encourage Sustainable Behavior Cees Midden, Teddy McCalley, Jaap Ham & Ruud Zaalberg
83
Participate: Producing A Mass Scale Environmental Campaign for Pervasive Technology Mark Paxton
87
The Design Of Imprint: “Walk The Walk” And Other Lessons Zachary Pousman, Hafez Rouzati, Katie Collins & John Stasko
91
Understanding And Influencing Spatio‐Temporal Visitor Movement In National Parks Based On Static And Dynamic Sensor Data Katja Schechtner & Helmut Schrom‐Feiertag
95
TerraPed: A Design Concept for Sustainability Jennifer Stein
100
Challenging Comfort & Cleanliness Norms Through Interactive In‐Home Feedback Systems Yolande Strengers
104
Taking the Guesswork out of Environmentally Sustainable Lifestyles Ronak Sutaria & Aalok Deshmukh
109
EcoIsland: A System For Persuading Users To Reduce CO2 Emissions Chihiro Takayama & Vili Lehdonvirta
113
Workshop on Pervasive Computing @ Home Pervasive Computing @ ICS‐FORTH Constantine Stephanidis, Antonis Argyros, Dimitris Grammenos & Xenophon Zabulis
119
The eHome – a Practical Smart Home Implementation Lasse Kaila, Jussi Mikkonen, Antti‐Matti Vainio & Jukka Vanhala
125
Home Deployments For Independent Living Aaron Quigley, Michael McGrath, Paddy Nixon & Terry Dishongh
132
Bringing IMS Services to the DLNA Connected Home Johan Hjelm, Toshikane Oda, Andreas Fasbender, Shingo Murakami & Ayodele Damola
139

Pervasive Help @ Home: Connecting People Who Connect Devices Mark W. Newman & Mark S. Ackerman
144
End‐User Programming for the Home: a Challenge Joëlle Coutaz
153
Adding Convenience to “Cohabitation of Convenience” Umar Rashid and Aaron Quigley
157
Workshop on Pervasive Mobile Interaction Devices (PERMID 2008) APriori: A Ubiquitous Product Rating System Felix von Reischach & Florian Michahelles
163
Augmenting BDI With Relevance: Supporting Agent‐Based, Pervasive Applications Andrew Koster, Fernando Koch, Frank Dignum & Liz Sonenberg
167
Elaborating a Framework for Open Human Computer Interaction with Ambient Services Andreas Lorenz, Markus Eisenhauer & Andreas Zimmermann
171
Using Haptics for Mobile Information Display Karon E. MacLean
175
Charting User Expectations on Mobile Shopping ‐ Roleplaying Study on Mobile Interaction with RFID Technology Susanna Paasovaara, Mohsen Darianian & Jonna Häkkilä
180
What's our favourite colour? Using Bluetooth‐enabled mobile devices for group decision making Alison Ruth & Jenine Beekhuyzen
184
Homebird—Task‐based User Experience for Home Networks and Smart Spaces Olli Rantapuska & Mia Lähteenmäki
188
Touch and Share: Intuitive Peer Selection Sojin Kim, Eun Young Choi, Joon Sung Hong & Jinho Choi
192
Workshop on Improved Mobile User Experience (IMUx 2008) The Challenges of Evaluating the Mobile and Ubiquitous User Experience Kasper Løvborg Jensen & Lars Bo Larsen
198
Selecting Optimal Modalities For Multimodal Interaction In Mobile And Pervasive Environments Saija Lemmelä
208

Performance of Ajax on Mobile Devices: A Snapshot of Current Progress Mikko Pervilä & Jussi Kangasharju
218
Workshop on Context‐Awareness for Self‐Managing Systems (CASEMANS 2008) A Fair and Energy‐Efficient Topology Control Protocol for Wireless Sensor Networks Rami Mochaourab & Waltenegus Dargie
‐‐‐
Context‐Aware Routing in Wireless Mesh Networks Peizhao Hu, Ricky Robinson, Marius Portmann & Jadwiga Indulska
‐‐‐
Localized Power‐Aware Routing in Linear Wireless Sensor Networks Marco Zimmerling, Waltenegus Dargie & Johnathan Reason
‐‐‐
A ZigBee‐based Sensor Node for Tracking People's Locations Tsutomu Terada & Satoshi Takahashi
‐‐‐
Workshop on Context‐Aware Pervasive Communities: Infrastructures, Services and Applications (CAPC 2008) A Systematic Approach to Modeling and Verifying Context‐Aware Services in SOAs Dhaminda Abeywickrama & Sita Ramakrishnan
233
An Adaptive Architecture for Context‐Aware Interaction in Pervasive Applications Alan Colman, Minh Tran & Jun Han
237
Information Art Based on Community Activity in a Large Workplace James Constable, Raymes Khoury, David Carmichael, Judy Kay & Bob Kummerfeld
245
Exposing Contextual Information for Balancing Software Autonomy and User Control in Context‐Aware Systems Bob Hardian, Jadwiga Indulska & Karen Henricksen
253
Monitoring System in Ubiquitous Smart Space Hyo‐Nam Lee, Sung‐Hwa Lim, Byoung‐Hoon Lee, Dong‐Wook Lee, Jai‐Hoon Kim & We‐Duke Cho
261
Community‐based Autonomous Service Activation and Failure Recovery in a Message‐Oriented Pervasive Middleware Chun‐Feng Liao, Ya‐Wen Jong & Li‐Chen Fu
265
Middleware framework for flexible integration of new sensor types Glen Pink, David Carmichael, Judy Kay & Bob Kummerfeld
273

Workshop on Pervasive Expression: Pervasive Visual, Auditory and Alternative Modality Information Display Urban Empathy: Work in Progress Teresa Almeida
279
Taxtile Nerve Extensions Stephen Barrass
283
Soundscapes at Workspace Zero – Design Explorations into the Use of Sound in a Shared Environment Berry Eggen, Koert van Mensvoort, David Menting, Emar Vegt, Wouter Widdershoven & Rob Zimmermann
287
Integrating Textiles with Electronic Systems Cecilia Heffer
295
Development of Sonification Strategies: Facilitating Auditory Display Hong Jun Song & Kirsty Beilharz
298
A Framework for Architecture as a Medium for Expression Martin Tomitsch, Andrew Vande Moere & Thomas Grechenig
304
Extruding the Body with Light to Make Visible the Spatial Relationships inherent in Gesture and Posture Danielle Wilde
309

Workshop on
Security and Privacy Issues in Mobile Phone Use
ORGANIZERS: Rene Mayrhofer (Vienna University, Austria)
Marc Langheinrich (ETH Zurich, Switzerland)
Alexander De Luca (LMU Munich, Germany)

Don’t trust POS terminals!Verify in-shop payments with your phone
Iulia Ion* and Boris Dragovic
CREATE-NET, Trento, Italy, *ETH Zurich, [email protected], [email protected]
Abstract. Despite the advanced capabilities of the chip-enabled, debitand credit cards, fraud in payment transactions has not diminished - ithas shifted. The reason lies in the lack of a trusted communication pathbetween the smartcard and the cardholder. More explicitly, because usershave no means of verifying the authenticity of the Point-of-Sales (POS)terminal, they do not know how much they are about to pay nor towhom. We propose to use the camera-enabled mobile phone and a pre-viously shared secret to create a two-way, secure communication chan-nel. Messages from the card are displayed by the POS terminal as visualcodes, then captured and decoded by the phone. Messages from the card-holder are computed by the phone and manually typed in as one-timePINs. We extend the EMV payment protocol to provide explicit veri-fication and confirmation of the transaction amount. In the process wealso improve cardholder authentication, protect against stolen PIN andcards, and eliminate the POS terminal from the trust chain altogether.The implementation requires minimal software updates and no hardwaremodifications.
1 Introduction
Security-wise, credit and debit card technology has evolved from rather inse-cure, magnetic strip based cards to, admittedly more secure, Integrated ChipCard (ICC). Most notable attacks on the former rely on the ease of cloning themagnetic stripe, visual signature verification as well as the supported completelack of authentication in the extreme cases. Unfortunately, the ICC technologydoes not come without its woes either. Despite the introduction of EMV [11],(named after Europay, Mastercard and Visa, also known as Chip and PIN) whichshould have made systems more secure, the payment fraud did not diminish - itshifted focus.
In this paper we address a threat stemming from the inclusion of the Point-of-Sale (POS) terminal in the ICC payment trust-chain. In other words, we addressthe issue of frauds arising from tampered POS terminals overcharging customers.In the typical scenario, the customer authorizes the payment (by typing in thePIN) based on the amount displayed on the POS terminal built-in display. Onthe other hand, the card signs the payment transaction corresponding to the

amount reported to it by the terminal. Unfortunately, these two amounts canbe different - should the POS terminal have been tampered with.
In a simple scenario, Alice thinks she is paying 50 euros for a book andshe approves the transaction by entering the PIN, but the card is requested toproduce a Transaction Certificate (TC) for 100 euros. A number of days can passbefore Alice spots the fraud on her bank statement. This, unfortunately, mayhappen even in the presence of SMS notification due to a number of reasons,e.g. offline terminal, delayed transaction processing, lack of network coverage.
The shortcoming of the current POS terminal based payment schemes isthe lack of a direct trusted communication path between the chip on the cardand the cardholder. Thus, the cardholder has absolutely no means of verifyingthe transaction amount real-time should the terminal be compromised. Despitetheir enhanced processing power and capabilities, smart-cards cannot protectusers against such frauds due to the fragmentation of the trust-chain.
Although manufacturers claim that POS terminals are designed to be tamperresistant and prevent unauthorized parties from altering the software or hard-ware, experiments proved differently. By replacing internal parts, Drimer andMurdoch were able to gain complete control over the terminal [9]. Furthermore,common users are unexperienced, not trained to recognize POS models nor tolook for tampering signs. Even for experienced users, it is difficult to know allthe approved POS terminal models on the market and to detect tampering.
In fact, in 2006, following the discovery of a systematic fraud that resulted inthe theft of one million Pounds from customer accounts, Shell stopped acceptingChip and PIN payments at 600 out of 1,000 UK petrol stations [16]. Policesuspected that fraudsters have altered the PIN pads or that employees wereinvolved in the scam.
The contribution of this article is an extension to the payment protocol whicheffectively shortens the trust chain by excluding the POS terminal from it. Thusit closes the outlined class of frauds focusing on tampering with POS terminals.
2 Defending against credit card fraud
Several solutions have been developed to address the problem of compromisedPOS terminals. This section gives a brief overview and analyzes the most no-table ones: transaction confirmation via SMS, trusted mediating hardware calledelectronic attorney and credit card technology that integrates display. We high-light the latency, cost and usability shortcomings of the solutions, motivatingthe contribution of this paper.
2.1 Alternative solutions
SMS confirmation. Many banks offer various flavors of SMS card transfernotification services where cardholders are made aware of the involvement oftheir card in a transaction. These are not confirmation services as the cardholdersare given no opportunity to block the reported transaction.

A number of issues may impede prompt SMS delivery, e.g. network latency,lack of network coverage, delay in transaction processing as is the case in off-linePOS terminals, etc. Therefore, not integrating SMS as a confirmation channelin the actual payment process also has external motivation. In this paper, wepropose to actively involve the mobile phone in the payment transaction as atrusted, authorized instrument.
Electronic attorney. Anderson and Bond [2] propose the use of a trustedpiece of hardware to mediate the physical interaction between the chip readerslot of the POS terminal and the credit card. The electronic attorney is “a smalldevice about the size of a credit card, with chipcard contacts at one end and achipcard reader at the other, as well as an LCD display and several buttons” [2].The cardholder inserts his secret PIN on the trusted keyboard, thus preventingPIN sniffing, and verifies the charged amount on the display of the electronicattorney, thus preventing merchant fraud.
There are a number of obstacles for market success of such a product rang-ing from increased cost for the end-user, inconvenience of carrying yet anothertoken, the need for substantial software updates to POS terminal, including fun-damental modifications to the payment protocol itself. The mobile phone, onthe other hand, represents a token that can be found in almost any pocket andrepresents the most used computing platform.
Display equipped cards. Although IC cards with integrated display couldprovide a viable solution to the problem, technology implementing it [4] is stillvery immature and expensive. In the future, slim credit cards with incorporatedscreens could display the approved transaction amount. That would, of course,require replacement of credit cards on a large scale - incurring costs that wouldprobably be pushed to the end-user as is the case in biometric identificationcards and passports. While users are not security aware and do not recognizethe vulnerabilities in the payment protocol, banks do not have enough incentivesto invest in customer’s security [2] due to risk vs. investment asymmetry.
Unlike display equipped cards and the electronic attorney, our solution ismuch easier to implement, is cost-effective both for banks and customers, requiresminimum implementation effort, and incurs no extra hardware costs.
2.2 Proposed solution: the mobile phone as a trusted component
To create a trusted communication path between the card and the cardholder, wemake use of the customer’s personal mobile phone and visual code technology1.Mobile phones are now the most widely deployed computing platform in theworld. Analysts predict that one billion mobile phones will be sold in 2009 [15].As highly personal devices, with enhanced computing capabilities, great con-nectivity and equipped with radio, mp3 player, video cameras, they represent agreat platform for a big range of privacy and security applications, from enter-tainment, personal content management to identification tokens and payment
1 2d code: http://2d-code.co.uk/

systems. Subjective perception of mobile personal devices, such as phones, sug-gests that users regard them as intrinsically trusted.
Visual codes or 2D bar-codes, representing the evolution of ubiquitous bar-codes, are already widely used to encode information. These 2D codes are par-ticularly suitable for being scanned and decoded using camera-enabled mobilephones. Applications range from hiding private data, annotating physical ob-jects, to easily retrieving related information and functionality - applicationthat has proven to be very popular in Asia, etc. Visual codes generation andrecognition software is now widely available [8, 19]. In fact, in Japan most ofthe phones already come with preinstalled recognition software. With the use of
Pay:50€56749
1. Approve A=50 €
2. Send message6. Type in PIN
4. Read visual code
3. Encode and display message
5. Decode, verify A, generate PIN
7. Verify PIN andconfirm A
POS terminal Credit cardMobile phone
Fig. 1. EMV payment protocol
visual codes and a camera phone, the payment scenario proceeds as follows. Thecredit card and the personal mobile device share a secret key. Through the useof cryptographic primitives, the mobile phone acts as a trusted party and assiststhe cardholder in the payment process. Just like in the current payment scenario,(1)the cardholder inserts his credit card into the POS terminal. Before the userenters the PIN, the terminal communicates to the card the transaction amount.(2)The card produces a message based on the payment amount and a one-timechallenge generated on the spot by the card. (3)The terminal encodes and dis-plays the message in the form of a visual code on its display (where previouslythe amount to be verified was shown). (4)The cardholder then uses his mobilephone to scan and decode the visual tag automatically. The user can verify onthe trusted display of his mobile phone the transaction amount. (5)Based onthe one-time challenge computed by the card and on the pre-shared secret key(between the card and the phone), the mobile phone computes a one-time PIN.(6)If the amount coincides with the user’s expectations, he enters the PIN intothe payment terminal. (7)Being in possession of the secret key and the one-timechallenge from step 2, the card itself verifies the PIN which confirms that the useragreed to the specific amount and it finally authorizes the payment transaction.

3 EMV payment protocol
In this section, we briefly detail the standardized transaction processing steps,as defined by the EMV specifications [12, 13], and executed between the cardand the terminal. We start by introducing the involved components. The creditcard and the POS terminal communicate by exchanging Application ProtocolData Units (APDU) = command-response message pairs, via the T=1 protocol.
The EMV payment steps differ, depending on the different types of cardauthentication employed: Static Data Authentication (SDA) (based on symmet-ric key algorithms), Dynamic Data Authentication (DDA) (cards with publickey capabilities), and Combined Data Authentication (CCA) (symmetric keycryptography, the use of certificates and signatures). As the Chip and SPIN in-vestigations states [3], there is no public, official data, neither from APACS2 norany UK bank, confirming whether DDA or SDA capable cards are being used inpractice. However, after having analyzed a number of UK Chip and PIN cards,the authors have found no evidence to suggest dynamic capabilities.
Smart-cards are capable of securely storing several keys and certificates andof performing cryptographic computations such as hashing (SHA-1 algorithm),symmetric encryption (AES, DES, 3DES), public key cryptography (RSA) anddigital signatures (DSA). The specific capabilities and algorithms depend oneach type of card and manufacturer. Furthermore, several payment applicationscan be installed and run on one smart-card. Cryptographic keys are stored andcomputed securely on the card and never leave it.
Point of Sales terminals vary in brand name (Hypercom, VeriFone, IBM),dimensions, design, capabilities and price (from $100 to $800). They usually con-tain a card reader slot, Internet connection, small keyboard and small display,from usually 128x64 pixels simple ASCII capable display to the more sophisti-cated, programmable devices, e.g. to include the company logo and graphics aswell as customized payment services.
Figure 2 depicts the transaction steps. The main steps are the following:1. Read application data: When the card is powered up, it responds with
an Answer to Reset (ATR) message, which contains information about the card.Over a series of SELECT and READ RECORD commands, the terminal re-quests relevant information to process the transaction, such as account details,supported payment applications and cardholder verification methods (CVM) toagree on a common payment scheme [12]. To easily select the payment applica-tion, the ICC maintains a directory structure for the list of installed applications,each of which is associated with an Application Identifier (AID).
2. Card authentication: This step is also called Internal Authentication.Basically, the card proves it is genuine to the external world. The terminal con-firms the legitimacy of the card. Depending on the authentication protocol, SDA,DDA or CCA be used.
2 APACS - the UK Payments Association: http://www.apacs.org.uk/

POS Terminal Credit Card
request card details
VERIFY PINsuccess/wrong PIN
request ARQCsend ARQC
request TC
ARQCARPC
send TC or AAC
SELECT/READ RECORD1.Readapplicationdata
2.Authenticate card(SDA or DDA)
Acount details, CMV list
3.Cardholderverification
4.Transactionauthorization
Signature of card data
Bank ARPC
Fig. 2. EMV payment protocol
3. Cardholder verification: The user enters the PIN in the POS keyboard.The POS terminal sends the PIN to the card, which verifies it and confirms thatthe customer is the legitimate card owner (Offline PIN Processing [13], p.105)
4. Transaction authorization: Step 4 in Figure 2 depicts the transactionauthorization process. The dash lines represent optional message exchanges (alsocalled External Authentication); they only take place in the case of on-line trans-actions (i.e. if there is connectivity between the terminal and the issuing bankand the card requests authorization from the bank). The terminal requests a Ap-plication ReQuest Cryptogram (ARQC) - which contains the card, terminal, andtransaction data encrypted by a DES key. The ARQC is then forwarded to thebank. As a result, the bank responds with a Application ResPonse Cryptogram(ARPQ) by which it authenticates itself and confirms that sufficient funds areavailable. The card then issues the Transaction Certificate (TC) which is laterused by the merchant to collect the charged amount or denies the paymentthrough an Application Authentication Cryptogram (AAC).
To improve efficiency of credit card payments, transactions are often not sentone-by-one to the bank as soon as they are collected by the terminal as a set ofTCs. Such batching can be leveraged for lowering resource consumption (timefor processing and communication, network costs, etc.) or may occur naturallyin the case of off-line POS terminals (e.g. buying tickets in trains, food in thestreet or duty free goods in airplanes).
4 Extended payment protocol
To support the proposed extension to the EMV protocol presented above, sev-eral alterations are needed. As Figure 3 shows, these modifications are actuallyminimal; they influence the cardholder verification process and make the param-

eters for transaction authorization dependent on the results of the previous step.Steps 1 and 2 in the EMV protocol remain completely unchanged.
To be on the safe and robust side, we assume the simplest, most common caseand design our protocol for off-line POS terminal and SDA card. By limiting therequirements on the system and card capabilities, we make the proposed EMVextension applicable to all types of transactions, even on cards with greatercapabilities (e.g. DDA with on-line authentication).
4.1 Protocol steps
In the following specification of our extension to the EMV protocol, by N wedenote a nonce (20 bits long, about one million possible values), A is the transac-tion amount (16 bits long, payments up to 65000 units, enough for Euro, Dollar,British Pounds transactions), K is the shared secret key (112 bits), hashK(m)is the secure hash of the message m (hash size of 56 bits) computed with thekey K and A||N is the concatenation of A and N.
1. The card generates a fresh N and computes hashK(A||N), then sends theterminal the message m1=A||N ||hashK(A||N).
2. The terminal displays a visual code encoding the message m1.3. The phone decodes the visual image and verifies the message authenticity
by computing the hash with the shared secret key K.4. The phone computes the response m2=hashK(N ||hashK(A||N)) and trims
it to 20 bits (i.e. 6-digit number), which is displayed to the user.5. The user types the code into the payment terminal and the card verifies
the inserted PIN by making the same computation. Afterwards, the cardapproves the payment transaction for the amount A.
POS Terminal Credit Card
Type hash_K(N||hash_K(A||N)), VERIFY as PIN
success/wrong PIN
request TC send TC or AAC
3.Cardholderverification
4.Transactionauthorization
Mobile phone
send AA||N||hash_K(A||N)
display asvisual code
Fig. 3. Extended EMV payment protocol, steps 3 and 4
We trim message m2 to just 20 bits because the user would not quite enjoytyping in the entire hash. Even if done naively, the truncation of the hash to

obtain the PIN would remain secure for the following two reasons: i) the secretkey used for hash computation is unknown to the terminal while the one-timechallenge changes on each transaction; ii) the number of PIN entry attempts islimited while there is 1 in a million probability of guessing the PIN correctly.A similar approach is chosen by Wong and Stajano to design a multichannelsecurity protocol in [21]. Making m2 dependent on A provides resistance toreplay attacks in the very unlikely case of collision in the values of the nonce N.
4.2 Implementation and installation
Smart-cards and POS terminals currently in use offer all the computation capa-bilities required for implementation of the suggested EMV protocol extension.Therefore, no hardware upgrade is needed on either side. Furthermore, updatesto POS terminal firmware and card software can be done remotely, by authorizedparties through standard interfaces. In fact, brand manufacturers periodicallypush new software updates into the POS terminals, and banks update card ap-plications and risk management data via payment terminals. Furthermore, thecard and the terminal can exchange data messages of arbitrary sizes. Followingthe fixed header formats, the byte denoted L specifies the length of the messagethat follows, which is interpreted by the selected payment application. For back-ward compatibility, we envisage support for both alternatives. The user mightprefer the old EMV protocol if, for example, he or she forgot the phone at homeor if his mobile device is temporarily out of battery power.
The shared key K shall be securely stored in a key file on the smart-cardand in the protected storage of the mobile phone’s SIM card, available only uponsuccessful entering of a secret PIN, thus preventing unauthorized use in the caseof device abduction.
The visual code should be large enough to encode 90 bits of data andcompact to fit on the POS display. For visual codes, we can choose betweentwo main formats. While QR Codes [1] have higher error correction capacity,Data Matrices are more compact [20]. Considering the limited displays of POSterminals and the physical proximity of the mobile phone, we recommend theuse of Data Matrix. According to Ballagas et. all [6], a 10x10 visual code witherror detection, can encode up to 76 bits of data. We propose increasing the sizeof the visual code to reach the desired encoding capacity.
The hashing algorithm employed should be implemented by EMV com-pliant cards. For secure messaging SHA-1 is used [12], whereas for ApplicationCryptograms (AC) 3DES MACs are generated3. Specific implementation detailsdepends on manufacturer and are not included in the EMV technical speci-fications. For example, the estimated duration for performing 3DES encryp-tion/decryption is 30ms for MPCOS-EMV, Gemplus cards [14]. Even though wewere not able to find specific information on hashing performance, we do not ex-pect the extra processing time to significantly influence the payment transaction3 Steven J. Murdoch, EMV flaws and fixes: vulnerabilities in smart cardpayment systems. COSIC Seminar, K.U. Leuven, Belgium, 11 June 2007.http://www.cl.cam.ac.uk/ sjm217/talks/leuven07emv.pdf

duration. In line with the current implementation, we propose the use of 3DESbased hashing algorithms in the protocol extension.
5 Evaluation and discussion
It has been argued that mobile phones are, similarly to personal computers,susceptible to viruses and should, therefore, not be considered trusted environ-ments. Furthermore, some argue that, due to software vulnerabilities, mobiledevices are not secure enough to act as payment devices, as in the case of pay-ments conducted with Near Field Communication (NFC) phones. However, bykeeping the two-factor payment entities (credit card and mobile phone), we onlyincrease the security of the EMV payment protocol, which currently exclusivelyrelies on the computation capabilities of the smart-card. In our design, we wereinspired by the new computing paradigm proposed by Balfanz et al [5]: improvesecurity by migrating part of a PC application to a small, trusted device. Themobile device acts as a convenient, secure smart card.
Our contribution brings two-fold improvements to the protocol. Firstly, itenhances cardholder authentication through the use of one-time PIN, a uniquelygenerated PIN for every transaction. Two-factor authentication in on-line bank-ing is offered by many banks as a value added service (such as Protiva fromGemalto[18]). Secondly, and most importantly, it protects against merchantfraud by supporting explicit confirmation of the amount to be charged for thepayment transaction, for which simple One Time Password (OTP) schemes arenot sufficient. While similar solutions as the one we have presented in this pa-per have been implemented for on-line banking [7], no prototype nor specificproposal has been done for in-shop payments.
The same system shortage that we address is pointed out by Drimer andMurdoch and exploited in a relay attack [10]. However, while performing a relayattack requires a counterfeit terminal, a counterfeit card and synchronization oftwo distant payments, we address a much easier to fulfill scenario, which canbe carried out with just one crocked terminal. Furthermore, our solution alsoprovides a stronger alternative to the distance bounding based solution proposedby the authors.
6 Conclusion and future work
In this article, we proposed the use of the camera-equipped mobile phone duringin-shop credit card payments to create secure communication channels with thecard. Through the use of visual codes and one-time PINs, we create explicitamount verification and confirmation and thus protect against merchant fraud.The proposed enhancement benefits not only the cardholder through protectionagainst theft of PIN or credit card, but also the bank and the retailer throughimproved cardholder authentication.

In the future, we plan to implement a prototype of the application and con-duct user studies. Because real POS terminals and credit cards are not repro-grammable by unauthorized parties, we plan to implement a prototype usingJava Card Development Kitand/or smart-card readers (as credit cards) and thefreely available OpenCard Framework[17] (as POS terminals). Support for cryp-tographic operations on mobile phones is already widely available: Java CardApplet, SATSA optional libraries, lite Bouncy Castle implementation.
References
1. Information Technology. Automatic Identification and Data Capture Techniques.QR Code 2005 Bar Code Symbology, ISO/IEC 18004. Technical report, Interna-tional Organization for Standardization, 2006.
2. Ross Anderson and Mike Bond. The man-in-the-middle defence. In Security Pro-tocols Workshop, March 2006.
3. Ross Anderson, Mike Bond, and Steven J. Murdoch. Chip and SPIN.http://www.chipandspin.co.uk/spin.pdf.
4. AVESO. Display enabled smart cards. http://www.avesodisplays.com.5. Dirk Balfanz and Ed Felten. Hand-held computers can be better smart card. In
Proceedings of USENIX Security ’99. Washington, DC., August 1999.6. Rafael Ballagas, Michael Rohs, Jennifer G. Sheridan, and Jan Borchers. Sweep
and point & shoot: Phonecam-based interactions for large public displays. In CHI’05: Extended abstracts of the 2005 conference on Human factors and computingsystems, Portland, Oregon, USA, April 2005. ACM Press.
7. Cronto mobile client. http://www.cronto.com.8. Diego Lopez de Ipina, Paulo R. S. Mendonca, and Andy Hopper. TRIP: A Low-
Cost Vision-Based Location System for Ubiquitous Computing. Personal and Ubiq-uitous Computing, 6(3):206–219, 2002.
9. Saar Drimer. Chip & PIN terminal playing Tetris.http://www.lightbluetouchpaper.org/2006/12/24/chip-pin-terminal-playing-tetris/, December 24th, 2006.
10. Saar Drimer and Steven J. Murdoch. Keep your enemies close: Distance boundingagainst smartcard relay attacks. In USENIX Security Symposium, August 2007.
11. EMVCo. http://www.emvco.com/.12. EMVCo. Book 1 - Application independent ICC to Terminal Interface require-
ments, 4.1 edition, May 2004.13. EMVCo. Book 3 - Application Specifications, 4.1 edition, May 2004.14. GEMPLUS. MPCOS-EMV R4, Reference Manual, November 2000.15. BBC News. Mobiles head for sales milestone.
http://news.bbc.co.uk/2/hi/technology/4697405.stm, 19 July 2005.16. BBC News. Petrol firm suspends chip-and-pin.
http://news.bbc.co.uk/1/hi/england/4980190.stm, 6 May 2006.17. OpenCard Framework. http://www.opencard.org/.18. Protiva. http://www.protiva.gemalto.com.19. Michael Rohs. Real-world interaction with camera-phones. In 2nd International
Symposium on Ubiquitous Computing Systems (UCS 2004), Tokyo, Japan, 2004.20. Semacode. Choosing the best 2d barcode format for mobile apps. Technical report,
2006.21. Ford Long Wong and Frank Stajano. Multichannel security protocols. IEEE Per-
vasive Computing, 6(4):31–39, 2007.

The Privacy Badge Revisited - Enhancement ofa Privacy-Awareness User Interface for Small
Devices
Sven Gehring1 and Martin Gisch2
1 [email protected], Eyeled GmbH, Science Park 1, D-66123 Saarbrucken,Germany, http://www.eyeled.de
2 [email protected], Eyeled GmbH, Science Park 1, D-66123 Saarbrucken, Germany,http://www.eyeled.de
Abstract. In this paper, we present enhancements of the Privacy Badge,which is a privacy-awareness user interface for small devices with limitedcapabilities. The Privacy Badge was created to visualize privacy loss inubiquitous and pervasive computing environments and to enable usersto do privacy settings in an easy and understandable way. We intro-duce the service anticipation as a new feature and present enhancementsof existing features. We evaluated the enhanced Privacy Badge with auser evaluation whose results approve the overall system as well as themodifications.
1 INTRODUCTION
When dealing with privacy visualization, there is a lack of appropriate conceptslike there is for user interfaces for desktop computers. It becomes even worsewhen considering small screen mobile devices. One reason is that presentinginformation on mobile devices is a difficult task, due to their limited capabilitieslike small screens and small buttons. Nevertheless, privacy visualization for smalldevices is important, even more due to pervasive and ubiquitous computing.
In [GLB1], the Privacy Badge has been introduced, which is a privacy-awareness user interface for small devices. It visualizes the privacy loss thataccumulates over time and allows the users of a pervasive computing environ-ment to do privacy settings. We assume, that the more personal data personsloose, the smaller becomes their privacy. This is expressed in the term privacyloss and this is what the Privacy Badge tries to visualize in an easy and intuitiveway. The version of the Privacy Badge presented in [GLB1] was only a prototypeand therefore we could only evaluate the basic concept in a non natural proto-type environment. Now we introduce a revised version of the Privacy Badge,which is an enhancement of the prototype version and offers new features likethe service anticipation. Additionally, we evaluated the revised version with auser evaluation in order to approve the interface.

2 RELATED WORK
Privacy is an important topic and subject to a huge amount of research work.Nevertheless, only few literature exists that is specifically dedicated to user in-terface design for privacy.
In [NM1], Ngyuen et al. describe privacy mirrors, a framework that offers acatalogue of characteristics that have to be considered when handling privacyin socio-technical systems. Another approach is called Privacy for the RAVEenvironment by Belotti et al. [BS1]. It is one of the oldest approaches in the fieldof privacy awareness interfaces and it uses physical hints to visualize what isgoing on in a system. For P3P[W3C], a privacy description language for websites,there are various implementations available.
None of these works actually include methods for small screen devices. A firstattempt on that can be found in the PaWS System[ML1] by Langheinrich, whichoffers a small PDA interface for viewing service descriptions and a list of activeservices in a ubiquitous environment. This attempt relies on providing largeamounts of text, which is not appropriate for small screens and uses technicalterms not feasible for non-technical persons.
3 DISCREET
The Privacy Badge concept has been specifically developed as the visualizationapplication for the framework developed within the Discreet project. Therefore,it provides means for visualizing privacy related events within the frameworkand to set privacy preferences for it. The Discreet project is an FP6 europeanproject for discreet service provision in smart environments[DIS] that involves10 partners from 5 countries.
The goal of Discreet is to design, specify and implement a distributed frame-work, called Discreet-Core (D-Core). The D-Core is a fully distributed middle-ware, which acts as a distributed entity of mediation and provides primitives toproperly manage privacy related data. The D-Core is aimed to manage the ex-change of personal data among users, communication networks, environmentalmonitoring/sensing devices, and service providers. Its design goal is to minimizeand control the amount of personalized information made available to the in-volved organizations, in order for the users to benefit of services without worryingabout dissemination and improper use of their personal data.
Discreet includes law specialists to ensure that the technical solutions pro-posed in [KC1] properly address and reflect the legal requirements. The analysisof the legal situation defines a design space for privacy solutions which is delim-ited on one hand by rules prescribing the limitations under which data can becollected, stored, processed or communicated to third parties and is delimitedon the other hand by rules enforcing the accessibility of some information forpublic security organizations.
Finally, a further goal of Discreet is the development of solutions to protectdata when they are gathered and delivered to the unit of trust. The project

specifically focuses on technologies and solutions deployed in intelligent environ-ments, with special attention towards Wireless LAN (WLAN), Radio FrequencyIdentification (RFID) and sensor networks.
4 THE PRIVACY BADGE
The Privacy Badge is a privacy-awareness user interface, created to visualizeprivacy loss in ubiquitous and pervasive computing environments and enableusers to do privacy settings in an easy and understandable way. The main goalof the prototype was to design an easy-to-use and intuitive user interface tovisualize and manage privacy aspects in the interaction with services for theprivacy-aware system architecture described in [KC1], which works on small,mobile devices, dealing with their restrictions. Since privacy loss is a ratherabstract term that cannot be converted to a concrete number, percentages andabsolute scales are no appropriate visualization approaches for it.
Hence, the metaphor of radiation badges3 was chosen for visualizing theprivacy loss that accumulates over time.
With the Privacy Badge, the user is able to see at a glance four characteristicsof the privacy loss, namely what has been disclosed, when has it been disclosed,to whom and to what end and does the user care about the information.
4.1 User Interfaces
The Privacy Badge is separated in two user interfaces, an awareness user inter-face (miniature badge) for visualizing the privacy loss that already occurred anda detailed user interface (detailed view) for doing privacy settings.
The miniature badge is a small icon in a circle shape that is present on thescreen at any time. It gives at-a-glance information without any details. Thenearer to the center a point is located, the more important is the according datato the users. Fig. 1 shows three possible states of the miniature badge. The morecrowded the badge, the higher the privacy loss.
When tapping the miniature badge, it expands to the full-screen detailed userinterface that depicts the privacy loss which occurred. Each instance of a dataloss occurrence is shown as a small symbol, representing the certain data type.If the view gets too crowded, filters can be applied that show only certain datatypes or a specific service.
4.2 Changing Preferences
Setting and changing preferences is another mode of interaction with the PrivacyBadge. This includes setting whether a specific service can access specific data3 Radiation Badges are devices handed out to workers who get in contact with radio-active materials. They collect radiation dosage over time and get darker with thetotal exposure increasing.

Fig. 1. Privacy Badge states. From left to right: no loss, some loss, high loss
or not. The user can switch to a preference view where he can simply adjust thepreferences by moving the preferences icons with a drag and drop mechanism.The nearer to the center a data type is moved, the more important is the re-spective data type to the user. The metaphor here is a leash, because the userscan keep their data ”on a short leash” to have more control over it. The angle ofa data type is not evaluated but serves the purpose to help the user categorizehis settings by grouping data together spatially. For a more elaborated groupingmechanism, one can switch to a novice mode where the data types are groupedtogether according to the ontology. In addition, the user can also switch to ser-vice view where services are shown as symbols around the user instead of datatypes.
To show, what data a service is allowed to get, the interface can be switchedto a service-centered view as depicted in Fig. 2 on which the service is symbolizedinstead of the user in the middle of the badge. The data types it requests arearranged around it according to the preferences for the data types as well as thepreferences set for the service. By overlaying the two user-centered views, thedistance between the data type and the service can be interpreted as level ofobfuscation or blurring of data. In short, this means that the service can onlygain full access to data that is on the same level or further away from the userthan the service.
5 THE PRIVACY BADGE ENHANCED
5.1 Setting Preferences
When setting preferences, the users could so far only specify if they want todisclose a certain data type or not. While working with the Privacy Badge, wedecided to extend the preference setting functionality by adding two attributesto the preferences that can be set by the users. Like shown in Fig. 2, the userscan now decide, if they want to be asked for disclosure every time data of aparticular type is requested. They can also specify if they want to be notifiedwhen personal data of a certain type is disclosed. This gives the users a bettercontrol over the disclosure of personal data.
5.2 Service Anticipation
If a service requests personal data of the users, it might be possible that thisparticular service requests several different personal information. To enable the

users to see all data types requested by one service at a glance, we added thefeature of service anticipation. The Privacy Badge is now capable of displayingall information a service requests in a service anticipation view, which is shownin Fig. 2. Before any data is disclosed the users have the possibility to see whatwould be disclosed and what preferences apply to the case at hand. In additionto the privacy preferences, the service description is shown so the users has everydata they need to calculate his ”return on disclosure”, meaning what he gets andwhat - in terms of privacy loss - they have to ”pay” for it.
Using the same interface used for setting the preferences, the users are nowenabled to decide whether the surplus value of a new service’s use outweighs theprivacy loss associated with it before using the service.
Fig. 2. From left to right: setting preferences for a single service in the service antici-pation, setting attributes of a preference, user is asked for consent.
6 USER EVALUATION
Since we enhanced a privacy-awareness user interface, it is essential to verify theused concepts in order to provide a user interface which is easily understandableand useful for real users. Hence, we conducted a user survey with 10 participants.The average age of the participants was 28.8 years. Every participant owns a cellphone and uses mobile devices like PDAs or cell phones regularly. By this, we canassume that the participants are conversant in interacting with small devices.
6.1 Preparation
As the very first step of preparing the survey, the Privacy Badge must be intro-duced to the participants.Therefore, every participant received the same intro-duction on the Privacy Badge.
We started with introducing the separation of the Privacy Badge into theawareness user interface and the detailed user interface and how the two user

interfaces are related. The introduction was continued by the introduction ofthe three different states of the awareness user interface, which are empty, littlecrowded and highly crowded. The last part of the introduction covered the de-tailed user interface and its views as well as the functionalities that are offeredby the views. The introductory part was finished by explaining how to performseveral tasks like setting a preference value in the detailed user interface or ac-tivating a filter.
6.2 Conduction
After passing the introductory part, every participant was asked to perform thesame tasks with the Privacy Badge. The tasks to perform were looking at thethree different states (empty, little crowded, highly crowded) of the miniatureview, switching to the detailed user interface, switching to the service view andfinding out more about the disclosed data, setting a preference value and finallysetting preference values in the service anticipation view.
After performing the tasks, we handed out a questionnaire with 25 questionsthat could be answered on a scale from 1 to 10 where 1 is the worst, 5 standardand 10 the best.
6.3 Result
By evaluating the survey, we can say that the results approve the concepts usedin the Privacy Badge, as well as the enhancements made to the earlier version ofthe Privacy Badge. The average result on the questions we asked can be found inFig. 3. The participants liked the general design (7.6) and evaluated the usabilityof the Privacy Badge as user friendly (8.7). They also liked the partition of thePrivacy Badge into a miniature badge and a full-screen view (9.1).
Asked about the miniature badge, the participants liked the design (6.7) andevaluated the three different states as easy to understand (8.3). The position ofthe miniature badge on the screen of the PDA was rated to be reasonable (8.2)as well as the permanent visibility of the awareness user interface (6.6).
In the last block of questions concerning the detailed user interface, the par-ticipants expressed they like the design (7.7) and interaction (7.3) of the userinterface as well as the separation of the different views inside the detailed userinterface (8.0). The concept of using the distance to the center of the differ-ent views as a measure of importance was evaluated as reasonable (7.4). Askedabout the service view, the participants liked the possibility of receiving addi-tional information on the disclosed data by clicking the point on the screen (7.9)and rated the view as easy to understand (7.5). The preference view was alsorated as easy to understand (7.3) and easy to use (7.4). The availability of theservice anticipation feature was rated reasonable (7.4). According to the par-ticipants, the service anticipation is easy to understand (7.3) and easy to use(7.0). Furthermore, the participants liked the feature of filtering for certain datatypes (7.6). One general remark that was raised by some participants was theabsence of a Privacy Badge internal help function. This might be a feature to

add in future versions of the Privacy Badge. One might argue that the result ofthe evaluation is not representative, since the participants were only cell phoneand PDA experienced users and therefore represent only a small part of thepopulation.
This can be countered by the fact that the Privacy Badge is designed forexperienced users which frequently use mobile services. Hence, the result of thesurvey is representative since the participants represent the target audience ofthe Privacy Badge.
Fig. 3. User Evaluation, questions and average answer.
Summing up the evaluation, we can say that the enhanced Privacy Badgetogether with the used concepts was approved by the users.

7 DISCUSSION AND FUTURE WORK
In this work, we introduced an enhanced version of the Privacy Badge, a privacy-awareness user interface which is appropriate for small devices with limited ca-pabilities. We evaluated the Privacy Badge with a user evaluation with 10 par-ticipants. The participants rated the Privacy Badge as easy to understand andeasy to use. They had neither problems with understanding the used conceptsnor with performing given tasks. Hence, the Privacy Badge together with theused concepts was approved by the evaluation.
A starting-point for future work would be the enhancement and standardiza-tion of the Discreet framework and the Privacy Badge. It is desirable that thePrivacy Badge can be integrated and used on mobile devices or also on commondesktop computers when surfing the internet or using applications that need tohandle private data.
8 ACKNOWLEDGEMENTS
This work is partially supported by the European Union, in the framework ofthe FP6 - IST Project DISCREET.
References
[BS1] V. Bellotti, A. Sellen: Designing for Privacy in Ubiquitous ComputingEnvironments. In: The third European Conference on Computer-SupportedCooperative Work. Milan, Italy. September 1993.
[PB1] CMU Usable Privacy and Security Laboratory. Privacy Bird. 15.03.2006.http://www.privacybird.com/
[DIS] Discreet Project - Discreet Service Provision in Smart Environ-ments. Official Homepage, http://www.ist-discreet.org, 2007.
[SG1] S. Gehring: The Privacy Badge - Development and Implementationof a Privacy-Awareness User Interface for Small Devices, Master’sThesis, Computer Science Library, Saarland University, Saarbrucken, Ger-many, January 2008.
[GLB1] M. Gisch, A. De Luca, M. Blanchebarbe: The Privacy Badge - A Privacy-Awareness User Interface for Small Devices. In Proceedings of theMobility Conference 2007. Singapore, 10-12 September,2007.
[KC1] C. Kiraly et al.: System Architecture Specification, IST DI-CREET Deliverable D2201, October 2006, available at http://www.ist-discreet.org/Deliverables/D2201.pdf
[ML1] M. Langheinrich: Personal Privacy in Ubiquitous Computing Toolsand System Support. Dissertation, University of Bielefeld, Bielefeld, Ger-many, 2005.
[NM1] D. Ngyuen, E. Mynatt: Privacy Mirrors: Making Ubicomp Visible. InCHI 2001. Seattle, WA.
[W3C] W3C:The Platform for Privacy Preferences 1.0. (P3P1.0) Specification.16.04. 2002. http://www.w3.org/TR/P3P/
[YOU] YOUpowered Inc: Orby Toolbar. 2001.http://www.pixelcode.com/youpowered/products orbyintro.html

Consistent Deniable Lying:Privacy in Mobile Social Networks
Sebastian Kay Belle1 and Marcel Waldvogel1
Distributed Systems Laboratory1
University of Konstanz
Konstanz, Germany
<first>.<last>@uni-konstanz.de
Abstract. Social networking is moving to mobile phones. This not only means
continuous access, but also allows to link virtual and physical neighbourhood in
novel ways. To make such systems useful, personal data such as lists of friends
and interests need to be shared with more and frequently unknown people, posing
a risk to your privacy. In this paper, we present our approach to social networking,
Consistent Deniable Lying (CDL). Using easy-to-understand mechanisms and
tuned to this environment, it enables you to meet new friends with joint interests
while limiting exposure of your private data. Not only can it be generalised to
include “friends of friends” (transitivity) into interest search, it allows you to
plausibly refute any allegations of your claimed interests. Unlike prior work, we
focus on the application to similarity finding and include the novel aspects of
transitivity and deniability, which are key to success in social networks.
1 Introduction
Mobile phones combine the benefits of networked computers and personal assistants:
They can gather information from the Internet while also surveying your surroundings,
not require any activity of yours until something to raise your attention has been iden-
tified. When used for building social networks, both this metaphor and the real mobile
phone require access to large amounts of information. Many people willingly publish
massive amounts of data into social networking platforms, unawares of the risks of iden-
tity theft, the possibility of this data becoming embarrassing to you in a few years, or
other abuses of your data. However, private data can also be used in a useful manner in
many cases. For instance, publishing personal data could facilitate locating like-minded
people.
Thinking about mobile devices, this idea can be extended in such a way that data
could be published on a mobile device such that other devices can connect to and search
for some desired information, or even that a mobile device could broadcast the con-
tained information to other devices in the vicinity through wireless P2P connections.
Especially nowadays, where virtual social networks grow and gain severe impact on
how people interact with each other, the extension of social networks to mobile devices
discloses interesting new aspects of interaction. Thus, the demand to exchange data
while preserving privacy is an interesting goal to accomplish. We envision not only an

increase in privacy-awareness, but also in the use of location-dependent mobile contact
services, such as Nokia Sensor1.
Before we put up the requirements, let us discuss two sample uses:
1. The Terminator, as a techno-savvy man from the future, is, of course, a long-term
passionate user of our system. One of his goals is to find other rough boys to help
him fulfil his cruel appointments. Unbeknownst even to the scriptwriter, the Ter-
minator is one of the most sensitive men in the university. Deep down in his heart,
he would like to watch romantic movies holding hands with an empathic young
woman. Looking out for a fellow moviegoer without becoming the laughing-stock
of his tough friends requires that he can plausibly deny his inner self.
2. Dr. Leonard “Bones” McCoy is visiting a medical congress of rare diseases. Many
of his fellow doctors bring their patients’ records, hoping to be able to run their
illness theories on a larger dataset. Dr. McCoy and his colleagues are aware of the
recent results of Narayanan and Shmatikov [1], knowingly that simple “anonymisa-
tion” can easily be undone, causing the doctors to lose their license due to violation
of the privacy act. Here, it would be helpful if the real information was slightly
perturbed to avoid reverse engineering, while still keeping many of the properties
for analysis. Fortunately, the data does not need to be entirely accurate: Once a the-
ory crystallises, it can be manually verified by the individual dataset-contributing
doctors on the original data.
Examining the requirements closer, we find that we have a privacy-preserving, sym-
metric, transitive, approximate set-intersection problem with deniability. This is ex-
plained as follows and addressed by our approach, Consistent Deniable Lying (CDL).
Privacy-preserving: Neither party should learn too much about the other or be able to
perform data mining too easily.
Symmetric: Both parties should gain similar knowledge about each other.
Approximate: There is no need for exact results, as long as persons with shared in-
terests can be identified with high probability. Even the occasional error can be a
success, as a discussion starting with “oh, you really believe that I like this?” can
be a good start.
Transitive: When looking for a person with particular properties, you frequently ask
your friends whether they know someone matching your description. Transitivity
enables such queries to be answered by the system, even if the friend(s) you are
asking do not share the desired properties.
Deniable: If you feel that its none of their business, you can always plausibly declare
that some of the properties in your public profile are wrong.
To achieve these properties, our system under design extends your profile with addi-
tional, fake, interests. Human interests are generally clustered, so fake interests cannot
be purely randomly chosen but need to model the clustering relationships from realistic
interests. Today, we are in a unique position that such data and their relationship is pub-
licly available, which finally enables this novel approach. For example, cddb.com or
1 http://www.nokia.ch/A4335350

Fig. 1: Comparison of Algorithms
imdb.com are large repositories of music and movie relationships (genre, artists, top-
ics, . . . ); whereas wikipedia.org contains relationship information for encyclopaedic
knowledge.
Unlike prior work, we focus on the application to similarity finding and include the
novel aspects of transitivity and deniability, which are key to success in social networks.
2 Background and Related Work
Preserving privacy in information retrieval is an ongoing field of study with several dis-
tinct and promising techniques, all intended to reduce the ability of others to excessively
mine data (cf. Fig. 1).
Traditionally, privacy in databases is ascertained by access control, completely pre-
venting access to selected types of information. When some of the information should
be made available, inference control (cf. [2]) can be used to ensure only aggregated
information is delivered, whereas operations on multiple subsets will not reveal in-
dividual entries. The inverse is private information retrieval (cf. [3], [4]), where the
database is unable to successfully profile the querier. Bloom filters [5] already provide
some form of uncertainty: Not only are there false positives, but it is hard to identify the
data originally put into the filter, unless the candidate set of members can be enumer-
ated in practice. As shown in e.g. [6], the latter is frequently the case today, so hashing
techniques ranging from Bloom filters to cryptographically strong hashes provide no
privacy in many of today’s applications due to finite set sizes.
Bellovin and Cheswick [6] use encrypted bloom filters to query a data base. In
a nutshell, Bellovin and Cheswick mask the intentional database query by augmenting
the proper questions with fake inquiries. As the authors show, making the fake questions
look plausible is very hard, when your questions are under the scrutiny of a trained eye.
Their approach differs from CDL in that they modify the query, not the database and
requires a semi-trusted third party.
Freedman et al. [7] provide efficient private set intersection, which solves the above
problems, but lacks transitivity and, more importantly, deniability: An attacker can cre-
ate a set of his “interests” which cover what it wants to learn from the victim, thereby
being able to profile him with arbitrary scrutiny.
Woodruff and Staddon [8] introduce the concept of private inference control, PIC,
to control the amount of information that can be obtained by a querier or the database
owner.

(a) (b) (c)
Fig. 2: Global information space mapped onto G (a) and the user-specific subset of the
information space mapped onto G′, respectively (b). Thus, G′ is a subgraph of G (c).
3 Consistent Deniable Lying
As Bellovin and Cheswick [6] stated – and what is a matter of common knowledge
– telling a consistent set of lies is hard. We propose a simple method to address the
requirements listed in section 1, given that a global non-user-specific dataset is on-
hand, which is a superset for user-specific datasets. E.g. the cddb.org or freedb.orgis a global superset of a user’s iTunes library.
Formally, let DG be the global, non-user-specific database and let DU ⊂ DG be a
user’s specific database (e.g., a user’s iTunes library). Access to DU should be restricted
as processing a query presumably violates the user’s privacy. Assumed that DG exists,
we map DG onto a graph G(V,E). Each vertex v ∈ V represents a single data element
of DG, each edge (v,u) ∈ E; v �= u relates to an arbitrary but predefined relationship
between v and u (e.g., written by the same artist). Simplified, we map the information
space contained in DG onto a graph (cf. Fig 2(a)). Likewise, we create a graph G′(V ′,E ′)for the user-specific database UD, utilising the same relationship between two vertices
v′,u′ ∈V ′ as was used to relate the vertices of G (cf. Fig. 2(b)). Thus, G′ is a subgraph
of G (cf. Fig. 2(c). Note that G and G′ are not necessarily fully connected.
Beside mapping the information space onto a graph, we utilise bloom filters to en-
code such a graph. Let B denote a bit array of length m and let Hj(v); j = 1 . . .n, n < mbe n different hash functions that map a vertex v ∈ V to an index i ∈ {0, . . . ,m−1} of
B. Thus, to query a user’s database and check if it contains information u ∈V we sim-
ply check the bits in B for Hj(u). As a user-specific database is mapped to G′(V ′,E ′)with V ′ ⊂V it is easy to create a query utilising elements from V and compare it to the
bit vector that encodes V ′ (cf. Fig. 3(a)). This approach is especially suited for mobile
devices due to the low computational costs needed to compare two bit arrays.
For instance, Dr. Leonard “Bones” McCoy utilises his smartphone to create a query
for some strange symptoms he encountered lately during the yearly check-up of the
Terminator. The query is encoded into a bit array and broadcasted to his colleagues
mobile devices at the conference.
However, as this simple scheme would allow set interactions to retrieve sensitive
information from V ′ we propose to introduce fake bits in B that are generated by muta-
tion of G′. Simplified, we add fake information by adding additional vertices to V ′ from
V\V ′ (cf. section 3.2). Thus, encoding the modified set of vertices V ′ in B we generate
a bit vector containing untruths (cf. Fig. 3(b)).

(a)
(b)
Fig. 3: Relationship between the bloom filter for G and subgraph G′ (a) and relationship
between the bloom filter for G and G′ with introduced fake vertices (beige) (b).
Bloom filters are listed here as one likely use, thanks to their compactness and their
slight gain in privacy. Nevertheless, CDL even provides necessary advantages when the
set is encoded in plain-text or when private set intersection methods are used.
3.1 How to be Consistent
As we propose to introduce untruths into a user-specific database DU we need to verify
that the false information included is consistent with the true dataset of the user. To
achieve consistency we make use of the precondition that DG ⊃ DU . By mapping DGand DU to G and G′, respectively, we can formalise this precondition as follows::
⋃G′ ⊆ G thus ∀G′;G′ ⊂ G (1)
So, as we extract fake information not related to the user out of G\G′ the introduced
untruths are consistent with the user’s true dataset.
3.2 How to Lie
Following, we explain three simple schemes to add fake data to G′. Introducing fake
elements creates an extended graph G′lie that contains additional, false information. For-
mally, we create G′lie(V
′lie,E
′lie) by extending G′ so that G′ ⊂G′
lie ⊂G. All three schemes
can easily be combined to create G′lie in which the magnitude of dummy elements in-
serted control the reliability of G′lie whenever a query is processed. Initially, let G′
lie = G′and let Glie(Vlie,Elie) be the graph of all possible untruths where Vlie = {V\V ′
lie} and
Elie = {E\E ′lie}. We create G′
lie successively through an arbitrary combination of the
three fake vertex insertion methods. While G′lie grows, Glie thins out, thus, we can de-
fine the following invariant::
(G′ ∪G′lie)∩Glie = /0 (2)

Random Insertion:: The simplest method to introduce untruths is to add random ver-
tices as illustrated in Fig. 4 (a). We calculate the number of randomly selected vertices
as::
nrandde f= �δrand · |Vlie|�; δrand = [0,1] (3)
where δrand is a user chosen threshold. Then we select and remove nrand vertices v∈Vlieand add them to V ′
lie. Further, if we select a vertex v ∈Vlie that is adjacent to one or more
vertex u ∈ V ′lie ∪V ′, we also add the edge that defines the relation between u and v to
E ′lie and remove the edge from Elie. Note, while it is simple to select random vertices,
the set of selected vertices still forms a consistent set of lies as discussed in section 3.1.
Growth Insertion:: Second, we introduce lies by growing G′lie through adding neigh-
bouring vertices. We add false vertices adjacent to vertices v ∈V ′lie as depicted in Fig. 4
(b). Let C(VC,EC) be a subgraph of G′lie, thus, VC ⊂V ′
lie and EC ⊂ E ′lie and let T be the
spanning tree for C. T can easily be extended by adding vertices beneath the leaves of
T . Let δdepth,δext = [0,1] be two user-defined thresholds, Lp = /0 the set of processedleaves of T , and Lu = {l|l is leaf of T} the set of unprocessed leaves of T . We add fake
vertices as follows::
1. Calculate random variable χext = [0,1]2. If χext ≤ δext and Lu �= /0 proceed, else break3. Randomly select and remove leaf l ∈ Lu and add it to Lp.
4. Set::
δext ← δext −χext/(|Lu|+1)
5. Calculate random variable χdepth = [0,1]6. If χdepth ≤ δdepth proceed, else go back to step 2.)
7. Randomly select and remove vertex v ∈Vlie where dist(v, l) = 1 in G,2 add it to V ′lie
and Lu, and add (v, l) ∈ E to E ′lie
8. Set::
δdepth ← δdepth −χdepth
and go back to step 5.)
Cluster Insertion:: Third we propose to generate fake clusters as illustrated in Fig. 4
(c). Again, let C(VC,EC) be a subgraph of G′lie. Further, let δdvsd = [0,1] be a user-
defined threshold, ncnt = |VC|, and L = /0 an initially empty set of vertices. Then we run
the following steps to create a fake cluster C′(V ′C,E ′
C)::
1. Select random vertex v ∈Vlie with ∃u ∈Vlie; dist(v,u) = 1, and add it to V ′C.
2. If ∃u ∈ Vlie\V ′C with dist(u,v) = 1; (u,v) ∈ Elie, add u to L, add u to V ′
C, and add
(u,v) ∈ Elie to E ′C. Else, go to step 6.)
3. Calculate random variable χdvsd = [0,1]. According to χdvsd set::
v ← v if χdvsd ≥ δdvsd
v ← u if χdvsd < δdvsd , and remove u from L
2 Note that (v, l) /∈ Elie as E ′lie ∩Elie = /0.

(a) Random insertion (b) Growth insertion (c) Cluster insertion
Fig. 4: The three fake vertex insertion techniques. Fake vertices are shown in beige.
4. Select a second discrete random variable χcnt ∈ 0, . . . ,ncnt and set ncnt ← ncnt −χcnt5. If ncnt > 0 go back to step 2.), else discard L and go to step 7.)
6. Randomly select and remove u ∈ L. Set v ← u and go back to step 2.)
7. ∀u,v; u ∈V ′lie,∈ v ∈V ′
C and dist(u,v) = 1 add (u,v) ∈ E to E ′lie
Thus, we are able to create clusters C′ ⊂ Glie to enhance G′lie.
3.3 How to be Deniable
The deniability of our system implicitly emanates from the consistent set of untruths as
well as the methods we utilise to choose them. By inserting fake information selected
from a global dataset (cf. section 3.1, eq. (1)) all information related to a user is equally
probable, thus, there are no obvious “outliers” that can easily be identified as meaning-
less information in the given context. Second, by introducing three different techniques
that add fake information in a non-deterministic but plausible manner (cf. section 3.2),
false information cannot be refined. In any case, a user can argue that information in his
dataset could be introduced through random addition of false elements, thus, the user
himself is the deciding factor to let someone know if the received information is true or
false.
3.4 How Close are You?
As contacts grow more reliable the amount of false information inserted into G′lie can
be reduced on a per-user basis by defining access rules that reduce the thresholds that
control the amount of false information in a user’s dataset. Furthermore, by introducing
access rules for indirect contacts, that are (trusted) direct contacts of a user’s 1st degree
contacts, we facilitate transitivity to socialise or share sensitive information.
To come back to our initial examples, suppose that our tech-savvy Terminator, the
covert romanticist, got in (real-world) contact with Trixie through the CDL system. As

the Terminator gained more confidence in Trixie over time, he decides to define an
access rule for Trixies’ 1st degree contacts that enables them to gather more precise
information about the Terminator such that he potentially extends his private social
network further. Note that other users that query the Terminator’s profile still access the
original bit vector.
Likewise, Dr. Leonard “Bones” McCoy could facilitate the use of indirect access
rules regarding his problem with the strange symptoms he encountered during the Ter-minators’ check-up. One of “Bones” long lasting friends who can not attend the con-
ference “Bones” is visiting defined several access rules for some of his direct contacts
that also attend the conference. Thus, as “Bones” is now enabled to gather more precise
information from some indirect contacts he luckily finds a colleague that posted some
similar symptoms of another patient. Getting into direct (real-world) contact with this
colleague at the conference, this colleague, a psychiatrist, comes up with a plausible
diagnosis: suppressed emotions!
4 Conclusion and Future Work
We proposed a technique that enables us to achieve synchronous, privacy preserving
information exchange provided that a global dataset is available. By introducing con-
sistent untruths in a user’s specific dataset the user gets the deciding factor to authorise
the information other users may see. Further, we defined a method to refine the untruths
introduced in a dataset on a per-user basis, thus, giving the user control over the amount
of fake information and also taking into account transitive relationships.
In the future we will investigate integration of other private set interaction algo-
rithms as well as fuzzy geographic location using mobile devices. Further other meth-
ods to introduce lies, like deleting vertices could be an interesting field to research.
References1. Narayanan, A., Shmatikov, V.: How to break anonymity of the netflix prize dataset (2007)2. Farkas, C., Jajodia, S.: The inference problem: a survey. SIGKDD Explor. Newsl. 4(2) (2002)
6–113. Chor, B., Kushilevitz, E., Goldreich, O., Sudan, M.: Private information retrieval. J. ACM
45(6) (1998) 965–9814. Kushilevitz, E., Ostrovsky, R.: Replication is not needed: single database, computationally-
private information retrieval. In: FOCS ’97: Proceedings of the 38th Annual Symposium
on Foundations of Computer Science (FOCS ’97), Washington, DC, USA, IEEE Computer
Society (1997) 3645. Bloom, B.H.: Space/time trade-offs in hash coding with allowable errors. Commun. ACM
13(7) (1970) 422–4266. Bellovin, S.M., Cheswick, W.R.: Privacy-enhanced searches using encrypted bloom filters.
Draft (2004)7. Freedman, M., Nissim, K., Pinkas, B.: Efficient private matching and set intersection. In:
Advances in Cryptology — EUROCRYPT 2004. (2004)8. Woodruff, D.P., Staddon, J.: Private inference control. In: Proceedings of the 11th ACM
Conference on Computer and Communications Security, Washington DC, USA (2004) 188–
197

Mobile Gambling
James Phillips1 and Alex Blaszczynski2
1 Monash University, Clayton VIC 3800, Australia 2 University of Sydney, Sydney NSW 2006, Australia
Abstract. Although technical capability outstrips consumer acceptance, gambling has already been implemented on mobile phones in some jurisdictions. This paper presents rates of self reported problems and distraction in the community, to advise impact statements or harm-minimization plans.
Keywords: Mobile phones, gambling, advertising.
1 Mobile Gambling
Although, commercial transactions and location aware advertising are technically possible, technical capability sometimes outstrips consumer acceptance [1]. The present paper considers some reported rates of consumer responses to specific problems with their mobile phone, relevant to the implementation of gambling or advertising on mobile phones.
Even though consumer acceptance and market penetration for mobile phones is remarkable, the capability for technologies like advertising [2] has yet to properly address consumer acceptance [1]. For instance, Mahatanankoon, Wen and Lim [1] considered acceptance of potential uses of mobile phones on a 1-5 scale (1 being not important and 5 being very important). The 251 respondents rated messaging most highly at (3.92) with applications such as games (2.84) and electronic payment (2.75) as more important than personalized advertisements (2.03) and personalized shopping offers (1.85). Such data has implications for innovations such as location aware advertising [3]. Presumably factors such as trust and perceived risk are influencing the willingness to accept such technologies [4].
Organizations planning new innovations such as gambling [5] on mobile phones need to know that a proportion of the community already reports problems with their mobile phones [6]. For instance, when considering possible develops such as gambling on mobile phones, previous studies have found that games account for about 20% of self reported mobile phone use [6]. However, 2.6% of individuals agree that the time they spend on their mobile phones gets them into trouble, another 5.6% agree that they are on their mobile phone when they should be doing other things, and 7.7% of individuals already report problems paying their bills [6]. But these numbers represent a minority within the community, and it is difficult to argue that an innovation such as mobile gambling be blocked just on this basis [6].

Nevertheless, current strategies to curb problem gambling seek to control access by limiting the availability to gaming machines [7]. Hence, legalizing gambling on mobile phones, as has been done in South Africa, potentially creates millions of new gaming terminals. It is not yet clear whether the same people who already have a gambling problem would be liable to misuse mobile gaming technology if implemented, or whether the new technology would afford access to new segments of the community, and create a new cohort of people with problems? However, there is the potential for mobile gambling technology to place personalized gambling within the reach of the 20 million Australians irrespective of the age of the subscriber. In particular, problem gambling is associated with symptoms such as lying about one's gambling, and the need for financial bail out. Hence, mobile gaming is liable to require attention from bodies regulating privacy and financial transaction.
Advertising constitutes one of the forms of inducements to gamble, but its use in Australia is now tightly controlled. When considering innovations associated with advertising on mobile phones, data is required on the capability of the mobile phone to distract. We find that 9.2% of participants report that their mobile phone goes off at meetings, lectures or at the theatre. Distraction could also be equated with unwanted phone calls. On average 13.5% of phone calls were reported to be unwanted. And more dangerously, 56.3% report regularly using their mobile phone while driving [6]. Such figures are likely to increase with the implementation of advertising on mobile phones. For instance, 96% of emails are estimated to be SPAM, and Australia has already fined companies for sending SPAM to mobile phones
Psychological testing may not be mature enough to be able to equitably detect and exclude members of the community who would abuse the technology. Nevertheless, the capacity for the mobile phone to incur financial loss or cause distraction should be taken into account in impact statements or harm minimization plans when considering innovations such as gambling or location aware advertising
References
1. Mahatanankoon, P., Wen, H.J., Lim, B:. Consumer-based m-commerce: exploring consumer perception of mobile applications. Comp. Stand. Interfaces 27, 347-357. (2005).
2. Scharl, A., Dickinger, A., Murphy, J.: Diffusion and success factors of mobile marketing. Elect. Comm. Res. Applic. 4, 159-173. (2005)
3. Häkkilä, J., Isomursu, M.:. User experiences on location-aware mobile services. Proceedings of OZCHI2005, ACM ISBN: 1-59593-222-4 (2005).
4. Horst, M., Kuttschreuter, M., Gutteling, J.M.: Perceived usefulness, personal experiences, risk perception and trust as determinants of adoption of e-government services in The Netherlands. Computers in Human Behaviour (2007).
5. Griffiths, M.D.: Internet gambling: Issues, concerns and recommendations. CyberPsych. Behav. 6(6), 557-568 (2003).
6. Phillips, J.G., Saling, L., & Blaszczynski, A. (in press). The Psychology of Mobile Phone Use and Misuse. In: Columbus, F. (ed.), Mobile Telephones: Networks, Applications, and Performance. Nova Science Publishers.
7. Abbott, M., Volberg, M.: Gambling and pathological gambling: Growth industry and growth pathology of the 1990s. Comm. Ment. Health N.Z. 9(2), 22-31. (1994).

Usage Profiles for the Mobile Phone
Amy K. Karlson
Microsoft Research, Visualization and Interaction Group One Microsoft Way, Redmond, WA 98052
Abstract. “Usage profiles” may offer an effective means to compartmentalize access to data and services to address privacy and security concerns that arise when users intentionally and unintentionally share their phones with others. I discuss the research questions I am exploring to inform the user-center design of usage profiles, such as how many profiles are appropriate, what data and services are accessible from each profile, and how users switch among profiles.
Keywords: Mobile phone, sharing, security, privacy.
1 Introduction
Mobile phones today exemplify personal computing. First, their rapid proliferation and adoption mean that in many markets, nearly every person has one. Second, phones’ small forms and high portability mean users can keep them within arm’s reach at all times. Third, by supporting a variety of text and voice communications, phones can satisfy a wide and important range of peoples’ social and data connectivity needs. At the same time, phones’ increasing processing capabilities elevate their utility as service, computing and entertainment platforms. Finally, phones’ expanding storage capacities allow users to keep larger volumes of personal data on the phone, such as communication histories (SMS, email, phone calls), calendar data, contacts, and even traditional media like documents, photos and music.
Given that phones are such personal devices, it is unsurprising that they typically support only a single-user model of security: either the phone is password-locked and none of its features are accessible, or the phone is unlocked and all of its features are accessible. Since typing a password every time you pick up your phone is tedious, this model of security often fails due to non-use. Although advances in low-overhead authentication solutions (e.g., fingerprint readers) may do much to encourage people to secure their devices between uses, the all-or-nothing approach to device security ignores the fact that it can be useful and natural to let others use our personal phones.
Indeed, while phones typically have a single owner, field studies have reported that phone sharing is commonplace [2,3]. Although the populations that have been studied (teenagers and communities in the developing world) have had economic incentives to share their phones, observations and interviews confirm that there are also a host of social and pragmatic motivations for phone sharing that are relevant across diverse user populations. Consider an example from my own life: I am driving myself and my

friend Jacquie to the movies, where we plan to meet up with our friend Lisa. During the drive, my phone rings and I see that it is Lisa who is calling. Assuming that Lisa’s call is related to our plans, I pass my phone to Jacquie to field the call while I drive.
When I pass my phone to Jacquie, I am handing over all the personal data I have stored on it. Since Jacquie is a close friend, this does not particularly alarm me. Furthermore, since Jacquie is sitting next to me, it would be socially inappropriate for her to interact with my phone beyond the length of the phone call. But now imagine that I ask her to look up directions to the theater using my phone’s web browser. In doing so, she may inadvertently see upcoming work appointments displayed on my home screen, the email messages displayed from my last interaction with the browser, and my previous web searches. Other than the fact that my employer might not appreciate a non-employee viewing a work-related appointment, the convenience of having Jacquie look up directions for me far outweighs the mild discomfort I have in her stumbling upon information she would not otherwise have access to.
If we instead put a coworker in my passenger seat, I now want to limit the exposure of my personal data and so am unlikely to encourage follow-up interactions. Unfortunately, with today’s devices, the tradeoff is that I miss out on a favor because my options are limited to handing my device to someone (exposing all my data) or not (protecting my data). If I could instead put my device in “guest” mode, or better yet, my device automatically switches to guest mode when it detects that the person holding the device is not me, then I am freed from the burden of performing threat assessments at every sharing opportunity, and I get the favor I want – a double win!
2 Understanding User Profile Requirements
The idea of protecting private data from the eyes of others by enabling different usage modes for mobile devices is not new. Stajano [1] proposed that PDAs could benefit from having both public and private modes, or “hats”, that would “draw a security perimeter” around private data when users were otherwise compelled to hand their device to another person. In his discussion, Stajano theorizes about the data and services that might be assigned to the public and private “hats”, flow-of-control requirements in switching between “hats”, and the tradeoffs of alternative authentication methods and implementation models. Although usable security is his goal, Stajano’s research focuses largely on the pragmatic implementation challenges.
As a complement to Stajano’s system-level approach, I am interested in the human-centered requirements for multiple modes of operation. I call these modes “usage profiles” rather than “hats” since a “hat” is person-centric, and I believe it is an open question whether usage profiles are more appropriately centered on types of people, or types of activity. Ultimately, however, I am interested in understanding what constitutes a tractable, useful, and usable set of usage profiles for the phone.
Two fundamental and inseparable aspects of my exploration will be in investigating 1) how many profiles are appropriate; and 2) what data and services are available from within each profile. Stajano suggested a minimum of two profiles: public and private. But is this too simplistic? Perhaps I want my spouse to have access to everything on my phone except for my work calendar and email (the “spouse”

profile). But when my coworker’s phone dies and she asks to use my phone to send an email, I would like to ensure she doesn’t see my communications histories, calendar data, contacts, or even application access history (the “colleague” profile). And when my 5-year old nephew asks to play Pong on my phone, I am not so much worried about him seeing my personal data as I am concerned about protecting my data from accidental additions or deletions (the “child” profile).
The challenge of establishing an appropriate number of usage profiles is that offering too many profiles might confuse users, while offering too few might not provide users adequate flexibility. I propose that user confusion might be mitigated if profile definitions match the user’s mental model of the sharing activity. For example, if a user’s trust varies widely among the people in her life, it might be helpful for her to define profiles in terms her personal relationships (e.g., spouse, colleague, stranger). Alternatively, we might offer profiles around the activities that an owner allows others perform (e.g., calling, gaming, web browsing). Note that these approaches do not just differ in name, but imply different groupings of data and services; relationship-based profiles might have a hierarchical structure (a coworker is at least as trusted as a stranger), while activity-based profiles might be more disjoint.
I am currently designing a user study to understand how the characteristics of number, function, and structure of usage profiles impact their usability and desirability. I will also explore interface designs and user expectations for the mechanism(s) by which users switch among profiles. Since the success of a security scheme relies on an owner’s willingness to use it, research must target both the system-level implementation as well as user-guided approaches that are flexible enough to match varying user preferences and mobile scenarios. I look forward to sharing my ideas, learning about the work of others, and engaging in the cross-disciplinary dialog that will help bring effective security to the mobile space.
3 Bio
Amy Karlson recently joined Microsoft Research’s Visualization and Interaction (VIBE) Group as an HCI researcher. She is currently interested in the role that mobile devices play in spanning users’ various information and communications networks, and addressing the usability and privacy challenges that arise from the boon of accessing limitless public and personal data from the palms of our hands.
References
1. Stajano, F. One user, many hats; and, sometimes, no hat–towards a secure yet usable DA. Security Protocols Workshop, Springer Verlag (2004), 51-64.
2. Steenson, M. and Donner, J. Beyond the personal and private: Modes of mobile phone sharing in urban India. In S. W. Campbell & R. Ling (Eds.), Mobile Communication Research Annual (Vol. 1), Transaction Books (in press).
3. Weilenmann, A. and Larsson, C. Local use and sharing of mobile phones. In B. Brown, N. Green and R. Harper (Eds.), Wireless World: Social and Interactional Aspects of the Mobile Age, Springer Verlag (2001), 99-115.

Challenges for Privacy with Ubiquitous Sensor Logging
James Scott
Microsoft Research Cambridge
Abstract. In this position paper I discuss some implications for privacy of a future where sensing and logging of sensor data is ubiquitous.
1 Ubiquitous Sensing: A Genie Awakened
Sensors are ubiquitous. To take the medium of sound as an example, the number of microphones present in a home, office, or even in public spaces like streets is huge and is expected to keep growing. These sensors are not just present in situated hardware such as telephones, computer terminals, etc, but are also present in mobile devices such as phones, media players (e.g. iPods), consumer electronics such as navigation devices, and so on. The deployed sensors are also not under a single entity’s control, with individuals, corporations and governments all having control over many sensors.
While audio is perhaps the most pervasive sensor type (due to telephones), other types of sensors deployed and being deployed include cameras (phones, CCTV, webcams), location sensors (GPS, radio-based), environmental sensors, physiological sensors, neighbourhood object/person sensors (RFID, radio-based), etc.
2 Ubiquitous Logging: A Giant Stirring?
Automatic logging (as opposed to deliberate, manually triggered data capture) is not yet ubiquitous. While personal logging devices such as SenseCam [1] and Personal Audio Loop [2] have been developed, such automatic logging is not found in commonly deployed devices. However, this is not because the sensing or logging technology has proven immature. Instead, the reasons for a lack of deployment are because of the difficulty of managing the data, and the lack of applications which can make use of such data. In terms of data management, while software such as MyLifeBits [3] has been developed, such software is not widely available and there still remains significant difficulty for users in managing their personal media. As such, deployed end user applications using logged rather than realtime data are still predominantly focused on simple finding and replaying media for personal entertainment. Applications which can usefully manage and navigate large sets of data items are being explored in research environments, such as in health monitoring (e.g. show my doctor a picture of every meal I’ve eaten in the last month).

3 Privacy Issues in a Brave New World
Let us jump into the not-too-distant future when sensors are even more pervasive, storage capacity is essentially infinite, computation to data mine and search sensor data is plentiful, and networking is fast and cheap. Furthermore let us assume that applications have arisen which have convinced users, corporations and governments to log sensor data (images, sounds, physiological data, etc). In this world, any sensor might be logged by default rather than only logged in specific circumstances.
What are the challenges to privacy in such environments? The security of data on one’s own devices is not necessarily the main source of threats to privacy. Much more of an issue are data logged by others. With pervasive logging, everything one does or says may be recorded and made public or shared with interested third parties.
There is no single panacea for this issue; solutions may come from many domains, including but not limited to:
Legal – existing laws in some countries concerning “data protection” can be used, rewritten, or better enforced. This may prove easier to accomplish against corporations than individuals or governments.
Social – social etiquette and taboo may make the publication of data that others would consider private very distasteful, and the threat of retaliation in kind for such offenders might keep the effects minimal.
Technological – Proactive jamming or obfuscating equipment may be used on a large scale, e.g. camera-lens detectors or GPS signal jammers, may become more widespread. However, it may be illegal or very difficult to jam many sensors effectively. Alternatively, automated tools may help users keep track of their information “footprint” so they can more easily send removal requests reactively.
Virtual – personal spaces such as homes may become more important for privacy as a haven away from pervasive sensing. One possibility is that the nature of interacting via a virtual medium may become more compelling since it is easier to control the “signal” that one presents to the world. Indeed, security research has identified ways of creating channels which mimic many (unlogged) real world conversations, e.g. the ability to anonymously participate in situations even as complex as financial transactions [4]. To conclude, ubiquitous sensing’s impact on privacy poses social, technical and other types of challenge, making this an interesting area for future research.
References
[1] S. Hodges et al., “SenseCam: a Retrospective Memory Aid”. In Proc. UbiComp 2006, Springer. [2] G. Hayes et al., “The Personal Audio Loop: Designing a Ubiquitous Audio-Based Memory Aid”. In Proc. MobileHCI 2004, ACM. [3] J. Gemmell et al., "Passive Capture and Ensuing Issues for a Personal Lifetime Store". In Proc. CARPE 2004, ACM. [4] F. Stajano and R. Anderson, “The Cocaine Auction Protocol: On the Power of Anonymous Broadcast”. In Proc. Workshop on Information Hiding, 1999, Springer.

Workshop on
Pervasive Persuasive Technology and Environmental Sustainability
ORGANIZERS: Marcus Foth (Queensland University of Technology, Australia)
Christine Satchell (Queensland University of Technology, Australia)
Eric Paulos (Intel Research Berkeley, USA)
Tom Igoe (NYU, USA)
Carlo Ratti (MIT, USA)

PERVASIVE PERSUASIVE TECHNOLOGY AND ENVIRONMENTAL SUSTAINABILITY
Marcus Foth, Christine Satchell, Eric Paulos,
Tom Igoe, Carlo Ratti
[email protected], [email protected], [email protected], [email protected], [email protected]
www.urbaninformatics.net/green
Abstract Environmental sustainability and climate change are issues which must no longer be ignored by anyone, any industry or any academic community. The pervasive technology, ubiquitous computing and HCI community is slowly waking up to these global concerns. The key theme of this workshop around environmental sustainability will be addressed threefold: (1) How to go beyond just informing and into motivating and encouraging action and change. (2) Pervasiveness can easily turn invasive. We want to start re-considering the impact of pervasive technology from an ecological perspective. (3) Digital divide between humans and the environment: Can the process of ‘blogging sensor data’ assist us in becoming more aware of the needs of nature? How can we avoid the downsides? 1. Theme of the workshop and topics of interest Environmental sustainability and climate change are issues which must no longer be ignored by anyone, any industry or any academic community. The pervasive technology, ubiquitous computing and HCI community is slowly waking up to these global concerns. The Nobel Peace Price 2007 was awarded to Al Gore and the Intergovernmental Panel on Climate Change (IPCC) “for their efforts to build up and disseminate greater knowledge about man-made climate change, and to lay the foundations for the measures that are needed to counteract such change”. The citation highlights the urgency of the fact that information and awareness around causes and implications are necessary but not sufficient to combat climate change. Action is required. The key theme of this workshop around environmental sustainability will be addressed threefold: 1. Providing people with environmental data and educational information – via mass
communications such as film, TV and print and new media, or micro communications such as pervasive sensor networks (cf. Participatory Urbanism and Ergo at urban-atmospheres.net; real-time Rome at senseable.mit.edu; biomapping.net; placeengine.com) – may not trigger sufficient motivation to get people to change their habits towards a more environmentally sustainable lifestyle. This workshop seeks to develop a better understanding how to go beyond just informing and into motivating and encouraging action and change.
2. Pervasiveness can easily turn invasive. It has already caused negative consequences in biological settings (e.g., algae in lakes and oceans, kudzu vine in the southeastern US, rabbits

and cane toads in Australia). Pervasive can be a dangerous term when the ecological impacts are disregarded. Pervasive technology is no different. In order to avoid further serious damage to the environment, this workshop aims to lay the foundations to start re-considering the impact of pervasive technology from an ecological perspective.
3. Addressing the 21st century Digital Divide: The mass uptake of pervasive technology brings about digitally networked and augmented societies; however, access is still not universal. Castells and others use the notion of the ‘digital divide’ to account for those whose voices are not heard by this technology. Initially, the divide was seen only between the first and third worlds and then between urban and rural, but with today’s near ubiquitous coverage, the digital divide between humans and the environment needs to be addressed. Virtual environments could give the natural world an opportunity to ‘speak’. How can we address imbalances? For example, sensors embedded in the environment could allow creeks and rivers to blog their own pollution levels, local parks can upload images of native bird life. Can the process of ‘blogging sensor data’ (sensorbase.org) assist us in becoming more aware of the needs of nature? How can we avoid the downsides?
2. Topics of interest Topics of interest include but are not limited to: • Transfer persuasive and motivational approaches and experiences from design cases which
successfully employ pervasive technology in areas such as games and entertainment, health, and marketing and advertising, e.g., competition, collaboration, rewards, team play, make it fun.
• Innovative ways or re-appropriated ways to reduce the impact of computing production (e.g., increase the life cycles of computing devices; re-purpose older computing devices for sensor networks, data logging and other low-performance but increasingly useful tasks; re-think the design of computing devices to allow for more efficient and thorough recycling of components).
• Considerations of what ‘pervasive technology’ means from an ecological perspective.
• New applications of pervasive computing technology to support environmental education and decision making in formal (school, work) and informal (leisure, play, everyday) settings.
• Evaluations and evaluation methods for assessing the impact of pervasive computing devices, applications on the environment.
• New interfaces of pervasive computing devices, systems and applications and modes of interactions between people and nature.
3. Format After the introduction of the organisers and the key themes of the workshop, we will do a little icebreaker activity in the form of mini interviews followed by brief informal peer introductions of all participants. We then want to generate a common knowledge base for the workshop on environmental sustainability by collecting information on what we know about the issues at hand, e.g., sources of data on climate change, accessibility and legibility of that data, current impact it has or lack thereof. After morning tea, the workshop breaks into three rotating groups (starting with 1/2/3) according to the three themes: 1. Motivation, 2. Ecological impact, and 3. Digital divide between humans and the environment. After lunch, these groups rotate themes so each group works

on each theme: 2/3/1, followed by 3/1/2. Following afternoon tea, we hold a plenary to share results and discuss further steps, plan the Design Challenge 2009, discuss collaboration arrangements beyond the workshop and allocate tasks to volunteers. Design Challenge 2009: Impact! In addition to the conventional academic outcomes, we want to define a number of feasible goals and design a process to bring these goals to fruition within 12 months time and present them at Pervasive 2009. Additionally, we want the workshop to be an opportunity to exchange research insights, expertise and ideas. We also want to leave enough breakout and social time to allow for professional networking opportunities. 4. The organisers Marcus Foth: ARC Australian Postdoctoral Fellow, Institute for Creative Industries and Innovation, Queensland University of Technology, Brisbane, Australia and 2007 Visiting Fellow, Oxford Internet Institute, UK. Interests: urban informatics, master-planned communities, social computing, social networks, triple bottom line sustainability, wombats. urbaninformatics.net
Christine Satchell: ARC Australian Postdoctoral Fellow (Industry), Institute for Creative Industries and Innovation, Queensland University of Technology, Brisbane, Australia. Interests: HCI, scenario and persona design, young people, digital nomads, mobile technology, puppies.
Eric Paulos: Director, Urban Atmospheres, Intel Research Berkeley, USA. Interests: urban computing, social telepresence, robotics, physical computing, interaction design, persuasive technologies, intimate media, sasquach. paulos.net
Tom Igoe: Associate Arts Professor, Interactive Telecommunications Program, Tisch School of the Arts, New York, USA. Interests: physical computing and networking, sensor networks, ecologically sustainable practices in technology development, monkeys. tigoe.net
Carlo Ratti: Director, SENSEable City Laboratory, MIT, Boston, USA. Interests: Architecture, sensor networks, real-time data, urban technology, urban planning, crocodiles. senseable.mit.edu
5. A selection of relevant readings CLIMATE RISK. (2007). Towards a High-Bandwidth, Low-Carbon Future: Telecommunications-
based Opportunities to Reduce Greenhouse Gas Emissions. Fairlight: Climate Risk Australia. DARBY, S. (2006). The Effectiveness of Feedback on Energy Consumption (DEFRA report).
Oxford, UK: Environmental Change Institute, University of Oxford. DE YOUNG, R. (2000). Expanding and Evaluating Motives for Environmentally Responsible
Behavior. Journal of Social Issues, 56(3), 509-526. FOGG, B. J. (2003). Persuasive Technology: Using Computers to Change What We Think and Do.
Amsterdam: Morgan Kaufmann Publishers. FOGG, B. J., & ECKLES, D. (2007). Mobile Persuasion: 20 Perspectives on the Future of
Behavior Change. Stanford, CA: Stanford Captology Media. HERRING, H. (1998). Does Energy Efficiency Save Energy: The Implications of accepting the
Khazzoom-Brookes Postulate. Retrieved Apr 2, 2008, from http://technology.open.ac.uk/eeru/staff/horace/kbpotl.htm
MONBIOT, G. (2006). Heat: How to Stop the Planet From Burning. Cambridge, MA: South End Press.
PAULOS, E., HONICKY, R. J., & HOOKER, B. (2008, in press). Citizen Science: Enabling Participatory Urbanism. In M. FOTH (Ed.), Urban Informatics. Hershey, PA: IGI Global.

Notes on the Political Image: Pervasive Computing, Modeling Assemblage, and Ecological Governance Abstract: What are the larger opportunities for pervasive computing technologies to monitor and model the intricate assemblages of the natural and artificial environments? Perhaps more importantly, how might such media contribute to or even constitute in a new kind of reflexive governance in the image of the information they produce? We consider what is at stake for such a constitution by locating it in theoretical insights from other contexts. In outlining current and future research directions, we underscore the necessity of environmentally produced information to concretize itself not merely as data for some later, deferred political action, but as a direct political image: an instrumental diagram in its own right. Agencies: Borders, Sensors, Interfaces Far from borderless, our world is filled with an apparent infinity of political borders , biological borders, logistical borders, informational borders. “Things” (flora, fauna, and machines, data) assemble, expunge and express themselves within this segmented landscape. We see such borders also as interfaces, membranes which govern the conditions of exchange between any paired complex bodies (from ambient air and soil to a bank customer and her money.) An environmental sensor, be it a flower petal or inscribed silicon wafers microcasting in near-field communication, is, in Bruno Latour’s parlance, a kind of actant. (Latour, 2005) It speaks on behalf of some condition in this little network and communicates to other parts of the system. The interface, in this case that sensor, thus takes the position of a limited agent in the whole system, and in it, the smallest transactional unit of data, becomes itself the emergent actor in this landscape of borders. The Pervasive Scenario: To Govern What? The driving scenario understood by us, is one in which there would be a local administration of each interface’s expression --what toxins flowers absorb, what plastics are allowed through customs, what concrete infrastructure cracks under slow pressure—based on what is heard and is relayed through a pervasive network of networks of computational monitoring media.

But once data is gathered what does this image look like in detail, and what is done with it once we have it? Individual events in this listening landscape are absorbed as signifiers, are correlated according to as yet unimagined protocols, and are registered not only as information about which a governance might act, but for us as the actual medium of some non-governmental political apparatuses would register themselves back onto the world. That is, first the information is a map or diagram and then, more interestingly, that same information becomes an interface. In this, governance is not delivered by the management of “human rights,” but instead acts according to new constitutional forms, yet to be formally ratified. Its work is not simply policing an environmental homeostasis, but of direct management by participation of ecosystemic interfaces as the constitution of a new polis and politics. (Mouffe, 2005) It is that imminent political diagram, not yet present, that redefines interfaces less as pure information than as positions in an expanded parliamentary territory; neither a ‘standing reserve’ of objective datapoints nor a undifferentiated naturalized unity. (Heidegger, 1993) Policy and Relationality At NYU’s Environmental Health Clinic, these operations are designed as a matter of institutional policy (or policy is made as a matter of design.) They are a model for how ecological interfaces, both human and non-human, both organic and inorganic, can be understood as site of health. And health is then less the individual body and the medicines that might be inserted into it to contain undesirable states, than it is the external, plural, at-hand living and non-living worlds of the urban landscape. Here a fertile middle-ground is taken as the location of prescription and operation. The individual lung and the gathering storm system are engaged at once by design, as both public health records in their ways. Both provide an open form of evidence of what the administrative unit and ecological microcosm that is NYU is doing and has done through its multi-scalar participations in the urban ecology of the city. As with any Clinic, at EHC prescriptions are given. But here prescriptions are offered both to individuals and to architectural systems on how to better monitor and adjust or redesign the causal interrelationships in which they work. Some Recent Projects Toward This: A Portfolio of Prescriptions Some projects at NYU’s EHC work to monitor and measure that evidence, and others to redesign through it. For example, One Tree Project, in which genetically identical trees were planted across the Bay Area acts as a formidable monitoring interface for the effects

of ambient environmental variation on the complex mechanisms of organic growth. In another,, 1400 face masks were distributed to the mingling hordes of protesters and pedestrians during the Republican convention in New York, which together worked as a networked surface on which individual consumption of air pollutants was traced and tracked. In these, distributed interfaces express and even compute, socially legible evidence of ecological interactions. But instead of such symptoms rendered through a mediating layer of silicon computation, these simple, extremely analog devices draw their evidence more directly. This allows a more direct experiential response to the information they express, but like any such image they require another step before becoming instruments of change and governance. Other NYU EHC projects directly redesign the assemblages at work (DeLanda, 2006). No Park, for example, uses a legal gap in traffic storage interfaces (i.e. no parking zones in front of hydrants) to install intricately designed gardens which absorb automobile related pollutants right where they are generated. Here the socio-ecological network of the city is neither smothered nor rarified, but amplified and engaged by configuring it at the level (and height) of collective assembly. Future projects seek to engage at the scale of the NYU micro-city and its architectures. One locates solar panels not on rooftops but as window shades, circumventing the difficult regulations of solar collection technologies in Manhattan as well as locating the production side of shared energy infrastructure at the direct personal level of individual dorm and office dwellers. He and she can see and relate to their energy consumption footprint at the literal scale of his or her own footprint. Another improves on the vogue for rooftop gardens as decorative micro-parks for people and turns them into gray water treatment machines that support the interlocking purposes of ground-level and migratory species across the city. Data Smog and the Missing Expert In these projects a problem of translation and activation is introduced, one that is not solved by the amassing of more computational power and the scattering of sensors into the world. That is, natural systems work very well already as monitoring devices, but we have yet to formulate

complete constitutional images of their participation. We have yet to find the best ways of making an image-instrument of their political profiles, diagrams of their evidence that constitute an effective agency. Scaled somewhere between the medical care of the individual body and the continental sweep weather modeling , the an ecological polis is largely unmanaged and unarticulated. To introduce an layer of engineered listening and speaking media into and onto the ambient environment (in parking lots, wetlands, cloud clusters, lung cells, etc.) will open a flood of information about how worldly systems perform and relate. By flipping the on-switch, as it were, and being at once able to monitor and model the interrelationships of all assemblages at once, would be akin to the invention of the microscope, opening up the complexity and agency of worlds we could not imagine. But would it also be a din of voices that we simply do not have the means to properly listen to, to govern through: a churning cacophony of signals? The design impulse will be to model these signals into dataclouds, undulating traffic clusters that allow datasets to be sliced and figured by different patterns and variables. We believe that such data clouds have purpose and potential but cannot by themselves realize either. Dataclouds have a tendency to inappropriately reassure their audiences. They imply, in the grace and intricacy of their renderings, a presumed expert system (and expert) on whose behalf they are fictitiously designed who must be using these information as an instrument of government, somewhere. If not now, soon. Dataclouds signify control but too often only defer agency to that missing expert. This is part of the work that they do as blog culture memes. They assure; they present the affect of a political agency that is still to find its bearings. The data cloud looks like expert instrumentation, but does the closed frame of its bounded diagnostic, in fact make it easier for those viewing the data cloud to retract their own involvement back into logic of simulation and to remain spectators? What is the political space of air quality? What would it mean for such images to work more effectively as interfaces? How can the images of evidence, produced by pervasive sensing media, work not just to display information about socio-ecosystmes but to turn their audiences into users who can, in the direct course of their habitation of the world, compute by their interactions a preferred assemblage of what the image represents? How can the data that becomes diagrams, become again instruments of a new political space? The answer to these, we believe, lies in the specification of both an ecologically appropriate political scale and a constitutional image of that polis, which

in turn may rely on the encounters between pervasive computing and ecological governance. Notes: Manuel De Landa, A New Philosophy of Society: Assemblage Theory and Social Complexity. Continuum. London. 2006. Martin Heidegger, “The Question Concerning Technology” Basic Writings. Ed. David Krell. HarperCollins. New York. 1993 (1954) Bruno Latour, Reassembling the Social: An Introduction to Actor-Network Theory. Oxford University Press. 2005 Chantal Mouffe, On the Political. Routledge, New York. 2005. Author BiographiesBenjamin H. Bratton (SCI_Arc, UCLA, Yahoo!) invents systems concepts and translates and transposes them into actual systems. This labor requires him to where many hats for different occasions, including sociologist, design strategist, professor, software executive, and historian of exceptional violence. He teaches architects about double-bind ironies at SCI_Arc, media artists about topologies of logistics at UCLA, and enterprise product strategists about the social specification of emergent data channels at Yahoo!. Natalie Jeremijenko (NYU Environmental Health Clinic) is a polymath design technologist and political affectician, working within the wormholes connecting experimental art and global science policy. She has taught at the world’s august institutions, been shown in the toniest arts festivals, received the most competitive awards, and annoyed the most miscast authoritarians.

THE POTENTIAL OF UBICOMP TECHNOLOGIES TODETERMINE THE CARBON FOOTPRINTS OF
PRODUCTS
Ali Dada1,3, Thorsten Staake2, Elgar Fleisch1,2
1 Institute of Technology Management (ITEM-HSG), University of St. Gallen, Dufourstrasse 40a,9000 St. Gallen, Switzerland
2 Information Management, ETH Zurich, Sonneggstrasse 63, 8092 Zurich, Switzerland3 SAP Research CEC St. Gallen, Blumenbergplatz 9, 9000 St. Gallen, Switzerland
[email protected], [email protected], [email protected]
AbstractSeveral problems exist in accurately quantifying the greenhouse gases (GHG) which result from theproduction, transportation, usage, and recycling of products. We review in this paper the currentattempts at measuring GHG emissions and investigate the potential of UbiComp technologies inimproving the state of the art in carbon footprint calculation and in communicating the result toconsumers. This has potential benefits on consumer awareness and behaviour and can also fostercompetition among companies towards higher energy and resource efficiency.
1. Introduction
Companies measure energy usage and greenhouse gas (GHG) emissions to comply with regulations,to assess their performance in an energy-constrained economy, and to participate in a growingcarbon market [8] Moreover, some organizations also identified the value of communicating thecarbon footprint1 of their products to end consumers who increasingly consider environmentalaspects in their purchasing decisions [4]. However, a number of challenges need to be addressedwhen determining GHG emissions for individual products or services. In particular, it is difficult tocapture all relevant emissions along the product’s lifecycle and to account for the variations infootprints of individual instances of products, such as spatial, temporal, and supplier variations. Inthis contribution, we propose a solution that leverages UbiComp technologies in order todynamically track a product’s carbon footprint along its life-cycle and make it easily accessible to theconsumer. The benefit of such a solution is that it enables comparisons on many levels, for examplebetween variations of the same product, between products from different manufacturers, andbetween different companies upstream in the value chain. Consumers can then exert pressure byselecting the least carbon-intensive products. We provide a review of methods used to measureGHG emissions in section 2 and outline in section 3 where UbiComp technologies can help. Weconclude in section 4.
1 “The carbon footprint is a measure of the total amount of CO2 emissions that is directly and indirectly accumulatedover the life stages of a product.”[11]

2. State of the art in measuring energy usage and GHG emissions
We review in this section the approaches used to determine the emissions of companies (supply side)and tools that calculate emissions due to the consumption by individuals (demand side).
2.1. Supply-side approaches
There are several standards and guidelines used by companies in order to quantify and report theirGHG emissions. The most prominent standard is the GHG corporate protocol [8], used by themajority of the FT500 companies and serving as the basis for most GHG guidelines and programs.This protocol is accompanied by tools that help companies to calculate their emissions. Variousother tools exist in the context of GHG reporting programs such as CARROT for participants in theCalifornia Climate Action Registry [3] and SEIT which is provided with the DoE 1605b voluntaryreporting program [6]. Furthermore, software vendors offer enterprise solutions for carbon andenergy management, e.g. Environmental Compliance by SAP [9].
There has recently been some effort to calculate the carbon footprint of some particular productsusing a supply-chain-wide approach. Prominent examples are the pilots conducted by Carbon Trusttogether with brands such as Walkers and Trinity Mirror [4]. Furthermore, CarbonCounted providesan online application for brand owners, also for the purpose of calculating a product’s footprint [5].These two examples differ in many aspects which makes it impossible to accurately calculate andcompare a product’s footprint, such as whether they include all GHG emissions or only CO2 andwhether they consider offsets. They do not take the energy usage at the retailer into consideration,or do so in a very coarse-grained way. Neither takes home usage into account. These issues make itimpossible to accurately calculate and compare a product’s footprint. Finally, when differentsuppliers have different footprints, or when there are temporal or spatial variances between differentinstances of a product, average numbers are used, which results in inaccurate results. Examplesinclude fruits bought off-season which require six months of chilled storage or products beingshipped half way across the globe.
2.2. Demand-side Approaches
Many carbon calculators are available to determine the carbon footprint of an individual or ahousehold. According to Bottrill [1], the calculators give an annual result based on one data entryper activity, thus not taking seasonal or lifestyle fluctuations into consideration. The author adds thatthe tools are falling short of accurately monitoring people’s energy use and providing the feedbackrequired. In the field of monitoring energy usage, there are several projects that provide accuratenumbers by conducting measurements on household devices. For example, Kuckuck is a projectwhich uses sensor data to display domestic energy consumption [10]. The Device-Level PowerMonitoring system [7] comprises monitoring units that plug into power outlets enabling per-deviceelectricity monitoring. Despite such projects that measure the energy usage of different devices athome, this usage is not meant to be attributed to the products that require them, for example theenergy used by a washing machine or a refrigerator is not distributed, respectively, among theclothes and foods inside. In effect, the energy usage at home cannot be accumulated to the totalcarbon footprint of a product which until now is focusing only on the supply-side calculations. In thenext section we will describe how products can have one dynamic carbon footprint which is easilyaccessible to users.

3. The potential of UbiComp
To calculate a dynamic carbon footprint, we need a mechanism that links information aboutemissions with the products that required them, namely by assigning to each item its share of theemissions of each emitting process. This can be achieved via the unique identification of items, e.g.via the Electronic Product Code (EPC) [2]. Items with an EPC number can be tracked frommanufacturing along the supply chain and until the retailers, with the possibility to add dynamicinformation – such as the carbon emitted at each partner – to the EPC Information Services (EPCIS). With unique identification in place, the share of yet-disregarded life-cycle stages of theproduct’s footprint can be quantified and attributed to the items that required them. For example, thesame EPC number can be used to identify items beyond the point of sale, where intelligent devicescan attribute their consumed energy to the items using it. Unique identification can also make theproduct footprint easily accessible, e.g. to a consumer on his mobile phone. After including all theproduct life-cycle stages, we would be able to consolidate the emissions and assign them toindividual items or other entities. This approach therefore comprises two stages. The first stage is aninformation gathering stage that can be realized by a publish/subscribe system in which processowners publish the process information and users (including items) can be subscribed to theprocesses they are part of. The second stage is an on-demand calculation of an item’s footprint basedon the available process/item information. Our initial research indicates that only minor changes arenecessary to use EPC Information Systems for the purpose of carbon footprint management.
4. Conclusion
We reviewed in this paper the available approaches in measuring GHG emissions and noted theirshortcomings in contributing to the accurate quantification of carbon footprints of products. We thenhighlighted the potential of UbiComp technologies in contributing to this effort. Such technologiescan also make the carbon footprint of products conveniently accessible to consumers. This enablesconsumers to exert pressure on the brand owner to decrease the footprint and it helps influence theirown behavior at home in order to keep the footprint as low as possible. Also, if companies cancompare the carbon-intensity of products from different suppliers, they can exert pressure byselecting partners with the least carbon-intensive products.
References
[1] BOTTRILL, C. Internet-based Tools for Behaviour Change. In European Council for Energy Efficient Economics(ECEEE) Summer Study 2007: Dynamics of Consumption. 2007.
[2] BROCK, D. The Electronic Product Code (EPC): A Naming Scheme for Objects. Tech. Rep. MIT-AUTOID-WH-002, MIT Auto ID Center, 2001.
[3] CALIFORNIA CLIMATE ACTION REGISTRY. Carrot. Online http://www.climateregistry.org/, 2008.
[4] CARBON TRUST. Carbon Footprints in the Supply Chain: The Next Step for Businesses, 2006.
[5] CARBONCOUNTED. Online http://www.carboncounted.com/, 2008.
[6] ENERGY INFORMATION ADMINISTRATION. Energy-related Emissions Data & Environmental Analyses. Onlinehttp://www.eia.doe.gov/environment.html, 2007.
[7] LEBLANC, J. Device-Level Power Consumption Monitoring. In Workshop on Ubiquitous Sustainability, UbiComp(2007).

[8] RANGANATHAN, J., CORBIER, L., BHATIA, P., SCHMITZ, S., GAGE, P., AND OREN, K. The Greenhouse Gas Protocol -A Corporate Accounting and Reporting Standard. WBCSD and WRI, 2004.
[9] SAP. SAP Environmental Compliance. Online http://www.sap.com/solutions/grc/ehscompliance/index.epx, 2008.
[10] STRINGER, FITZPATRICK, CHALMERS, HARRIS, KRISHNA, AND HAARLANDER. Kuckuck – Exploring Ways ofSensing and Displaying Energy Consumption Information in the Home. In Workshop on UbiquitousSustainability, UbiComp (2007).
[11] WIEDMANN, T., AND MINX, J. A Definition of 'Carbon Footprint'. ISA Research Report 07-01, 2007.
Motivation
This paper comprised a brief review of measures to calculate carbon emissions and possible ways tomake carbon footprints more accurate by including the various product lifecycle stages. Since ourfocus is on providing the consumers with the appropriate information to empower them in thedecision-making process, the key question is which information consumers need, how to retrieve it,and how consumers will be influenced by it. Also important is the optimal medium and form ofpresenting the information and how to measure their feedback including possible third-order effects.We are eager to discuss such questions in the workshop and learn from others’ experiences. Moreinformation about us and other related research can be found at www.bits-to-energy.ch.
Authors’ Biographies
Ali Dada
Ph.D. candidate at the Institute of Technology Management in the University of St. Gallen andresearch associate at SAP Research. Ali’s Ph.D. topic is carbon footprints of products: theirfeasibility and implications on consumer behavior and brand owner’s sustainability decisions.
Dr. Thorsten Staake
Thorsten Staake works as Project Manager of the Bits to Energy Lab and Senior Researcher at theChair of Information Management, Swiss Federal Institute of Technology (ETH) Zurich. Beforejoining the ETH, Thorsten spent one year at MIT’s Auto-ID Lab and worked for two years at theInstitute of Technology Management, University of St. Gallen, where he was in charge for theInstitute’s supply chain security initiative. His current research interests are related to enhancingsupply chain visibility to determine, communicate, and minimize greenhouse gas emissions.
Prof. Dr. Elgar Fleisch
Professor of Information and Technology Management; Department of Management, Technology,and Economics, Swiss Federal Institute of Technology (ETH Zurich) and Institute of TechnologyManagement, University of St. Gallen (HSG); Co-Chair of Auto-ID Labs, Insurance-Lab (I-Lab),and Bits to Energy Lab. Elgar Fleisch’s current research focuses on the economic and informationsystem perspective of ubiquitous computing, work that addresses the architecture of the Internet ofThings. He also conducts research in the areas of service engineering and internationalization.

Towards Participatory Design of Ambient PersuasiveTechnology
Janet Davis
Dept. of Computer Science
Grinnell College
Grinnell, IA 50112
1. Design Problem and Method
At my institution, the EcoCampus committee is charged with developing approaches to promote sus-
tainable behavior on campus, specifically behaviors that will reduce the campus’s net carbon emis-
sions. Approaches that provide new opportunities, such as coordinating a campus rummage sale to
reduce end-of-year trash disposal and start-of-year purchases, have met with great success. More di-
rect approaches to persuade individuals to change their behavior—for example, posting pleas against
food waste and reminders to turn off lights—have had less clear results, and even engendered some
resentment.
I aim to engage this committee and others in participatory design of new persuasive technology aimed
at changing these types of behaviors in ways that are more demonstrably effective, and engaging
rather than annoying. Participatory Design (or PD) is a family of theories and methods related to end
users as full participants in the design process. Many, but not all, PD researchers and practicioners
are motivated in part by a belief in the value of democracy in the design setting [12]. Participatory
design is well-suited to this design context because my institution has a culture of active stakeholder
involvement in decision-making, and because there is a group of people already committed to envi-
ronmental sustainability. I believe it is only right to include them in the design process. By making
them full participants, I gain access to their special knowledge, perspectives, and creativity, as well as
an enthusiastic group of supporters of the new approaches.
The design process will begin with a Future Workshop [9, 10] to guide EcoCampus committee mem-
bers and other interested members of the community in generating visions for behavioral and cultural
change on campus. A Future Workshop consists of three phases: a Critique phase to elicit problems
with current practice, a Fantasy phase to envision an ideal world in which those problems were solved,
and an Implementation phase in which the aim is to begin making plans for realistic changes. Whereas
most Future Workshops in the PD literature have focused on work practices, the workshop concept
originated in the context of community organizing around societal issues [9]; the topic of this work-
shop will be “Green Culture at Grinnell.” At the end of this workshop, I hope we will have identified
a number of behaviors to target for change, as well as possible approaches—technological and non-
technological—for changing them. I plan to continue working with a smaller group of stakeholders
on one or more behaviors that seem appropriate to the development of persuasive technology.

2. Ambient Persuasion
Designing technology to change behavior with respect to environmental sustainability, or to promote
sustainable culture, clearly falls into B.J. Fogg’s definition of persuasive technology: “interactive
computing systems designed to change people’s attitudes and behaviors” [4, p. 1]. Indeed, Fogg
uses the example of paper recycling by an organization to illustrate his different perspectives on the
roles of persuasive technology [3]. Several efforts have begun to explore persuasive technology in
relation to environmental sustainability. For example, RideNow is a web- and email-based system
that facilitates ad-hoc ride sharing [15]. The SmartTrip tool for mobile devices simplifies the task of
combining multiple errands into a single trip, with the goal of reducing driving among those resistant
to ride sharing or public transit [8]. GreenScanner is a mobile application that shoppers can use at
the store to read reviews of the environmental impacts of various products [14]. In these systems, the
computer’s functional role is that of a persuasive tool [3, 4]: The system makes suggestions, provides
information, or makes the desired behavior easier to do. But, users must go to some effort to adopt
these tools. As Fogg argues, persuasive technology for mobile devices are most effective when they
help people to achieve the goals they have already decided upon [4, pp. 192–3].
An alternative is to embed persuasive tools in the built environment, particularly in public or semi-
public places. The idea is to make suggestions at exactly the right time and place, without annoying
those to be persuaded [4, 11, 7]. Recent work by Mathew and his students exploits this approach,
which he calls environmental persuasion [11], in the context of promoting physical activity. In one
design, an attractive glass staircase with embedded information displays entices commuters in a sub-
way station to use the stairs rather than the escalator [11]. In another, information kiosks at bus stops
suggest that walking will result in earlier arrival time at the destination than waiting for the bus, and
will burn more calories [13]. Embedding persuasive technology in public spaces allows for incremen-tal peruasion: “Persuasion is initiated by the persuasive elements, but the actual behavior change is a
result of gradual but increasing awareness of the importance of that change” [11]. Such an approach
can influence the behavior of those who are not initially committed to behavior change. This gradual
approach also leaves room for discovery, playfulness, ambiguity, and subtlety, qualities that could
make a persuasive device intriguing rather than annoying.
Some design efforts have already begun to explore environmental persuasion with respect to envi-
ronmental sustainability. For example, WaterBot aims to reduce water consumption by tracking and
displaying information about water use at the sink itself [1]. Although the design is aimed at the
home or workplace, some ideas could be adapted to sinks in more public spaces. Intriguingly, Hol-
stius et al. use live and robotic plants in an ambient display that shows the balance between trash
and recycling in a dining area [5]. The goals of ambient displays—to provide awareness through the
physical environment, without demanding attention [16]—seem particularly compatible with the idea
of non-annoying, incremental persuasion. These initial efforts show this area, which one might call
ambient persuasive technology, is ripe for further investigation.
3. Research Questions
I believe that applying participatory design to persuasive technology is a novel approach. Futher-
more, as Hornecker et al. argue, the application of participatory design methods to the design space
of pervasive computing is still largely unexplored [6]. A key question, then, is how (or whether) to in-
corporate known principles and guidelines for the design of persuasive technology and for persuasion

in general, such as Cialdini’s six fundamental human tendencies [2], with the process of participatory
design. A second question is how to incorporate concern for the ethics of persuasion into the process.
Design participants are not the only ones who will interact with the persuasive technology, and they
are not necessarily typical stakeholders as they almost certainly value environmental sustainability
more highly than most community members. Fogg outlines a method to account for ethical concerns
in the design of persuasive technology [4], with which participants might be engaged. Furthermore,
although participatory design is not inherently problematic from the standpoint of environmental sus-
tainability, can particular design themselves be made more sensitive to that goal?
WaterBot [1] and the “infotropism” display [5] not only make indirect suggestions, but also monitor
and report on behavior in the surrounding environment. Because of the community context, such
displays tread a fine line between self-monitoring, which seems generally positive and acceptable,
and surveillance, which Fogg warns may cause public compliance without private acceptance [4, p.
49]. What design features are needed to avoid that undesirable outcome? What guidance can I draw
from these examples? For example, where WaterBot aims to support social validation in a household
context by tracking the water consumption of individuals, the infotropism display, designed for a
more public context, does not connect the data it gathers with particular individuals.
Fogg argues that behavioral change is a more compelling metric than attitudinal change for measuring
the success of persuasive technology: it is thought to be more difficult to achieve, it can be measured
without relying on self-reports, and finally, it is a direct measure of real-world outcomes [3]. However,
following the work of Holstius, et al. [5] and other work on ambient displays, and consistent with the
goal of not annoying people, it will be important to assess users’ attitudes towards and understanding
of the persuasive technology itself. In the context of environmental sustainability, one should also ask
about the net environmental impact of the persuasive technology. Unlike applications for mobile de-
vices already in use, such as cell phones, ambient persuasive technology involves introducing new de-
vices into the environment and thus involves some measurable consumption of resources—electricity
to power the device and other resources for its manufacture. Can we demonstrate that the devices we
build have an environmental impact that is lesser than that of the undesirable behavior they are in-
tended to change? What techniques can we use to reduce the power consumption of ambient displays,
both in the prototype phase and in deployment? At one extreme, we might eschew the “technology”
aspect of persuasive technology altogether, and use Intille’s approach of temporarily deploying sensor
systems to measure the behavioral impacts of low-technology persuasive techniques [7].
4. Motivation for Attending the Workshop
I have been interested in environmental sustainability and ambient displays for several years; the
theme of “Persuasive Pervasive Technology and Environmental Sustainability” lets me bring those
interests together. At the workshop, I hope to meet other researchers interested in related areas and
perhaps raise some different perspectives on design methodology. I hope also for feedback and new
insights to guide my work, which is in its earliest phases.
5. Biography
Janet Davis is Assistant Professor of Computer Science at Grinnell College, a socially-conscious
liberal arts college in central Iowa. She earned her B.S. in Computer Science at Harvey Mudd College,
and her Ph.D. in Computer Science and Engineering at the University of Washington. Her dissertation

work involved the design of new user interfaces for a large-scale urban simulation system, with a
particular attention to the values of democracy and freedom from bias. She is a member of the
Sustainable CHI group. Her interests include Value Sensitive Design, Participatory Design, ambient
displays, environmental sustainability, design for local impact, and alpacas.
References
[1] E. Arroyo, L. Bonanni, and T. Selker. Waterbot: Exploring feedback and persuasive techniques at the
sink. In Proceedings of the SIGCHI Conference on Human Factors in Computing Systems (CHI 2005),pages 631–639, 2005.
[2] R. B. Cialdini. The science of persuasion. Scientific American, pages 76–81, February 2001.
[3] B. Fogg. Persuasive computers: Perspectives and research directions. In Proceedings of the SIGCHIConference on Human Factors in Computing Systems (CHI 1998), pages 225–232, 1998.
[4] B. Fogg. Persuasive Technology: Using Computers to Change What We Think and Do. Morgan Kauf-
mann, San Francisco, 2003.
[5] D. Holstius, J. Kembel, A. Hurst, P.-H. Wan, and J. Forlizzi. Infotropism: Living and robotic plants as
interactive displays. In Proceedings of the 5th Conference on Designing Interactive Systems (DIS 2004),pages 215–221, 2004.
[6] E. Hornecker, J. Halloran, G. Fitzpatrick, M. Weal, D. Millard, D. Michaelides, D. Cruickshank, and
D. D. Roure. UbiComp in opportunity spaces: Challenges for participatory design. In Proceedings of theParticipatory Design Conference (PDC ’06), 2006.
[7] S. S. Intille. Ubiquitous computing technology for just-in-time motivation of behavior change. In Ubi-Health Workshop, 2003.
[8] E. M. Johnson, H. Koh, J. McAtee, and S. Shoulders. SmartTrip: Persuasive technology to promote
conscious driving habits. In CHI ’07 Extended Abstracts on Human Factors in Computing Systems, 2007.
[9] R. Jungk and N. Muller. Future Workshops: How to Create Desirable Futures. Institute for Social
Inventions, London, 1987.
[10] F. Kensing and K. H. Madsen. Generating visions: Future workshops and metaphorical design. In
J. Greenbaum and M. Kyng, editors, Design at Work: Cooperative Design of Computer Systems, chapter 8,
pages 155–168. Lawrence Erlbaum Associates, Hillsdale, NJ, 1991.
[11] A. P. Mathew. Using the environment as an interactive interface to motivate positive bheavior change
in a subway station. In CHI ’05 Extended Abstracts on Human Factors in Computing Systems, pages
1637–1640, 2005.
[12] M. J. Muller. Participatory design: The third space in HCI. In J. A. Jacko and A. Sears, editors, TheHuman-Computer Interaction Handbook, chapter 54, pages 1051–1068. Lawrence Erlbaum Associates,
Mahwah, NJ, 2003.
[13] V. Singh and A. P. Mathew. WalkMSU: An intervention to motivate physical activity in university stu-
dents. In CHI ’07 Extended Abstracts on Human Factors in Computing Systems, pages 2657–2662, 2007.
[14] B. Tomlinson. Prototyping a community-generated, mobile device-enabled database of environmental
impact reviews of consumer products. In Proceedings of the 41st Hawaii International Conference onSystem Sciences, 2008.
[15] R. Wash, L. Hemphill, and P. Resnick. Design decisions in the RideNow project. In Proceedings of the2005 International ACM SIGGROUP Conference on Supporting Group Work, pages 132–135, 2005.
[16] C. Wisneski, H. Ishii, A. Dahley, M. Gorbet, S. Brave, B. Ullmer, and P. Yarin. Ambient displays: Turning
architectural space into an interface between people and digital information. In Proceedings of the FirstInternational Workshop on Cooperative Buildings (CoBuild ’98), 1998.

Motivating Environmentally Sustainable Behavior Changes with a Virtual Polar Bear
Tawanna Dillahunt, Geof Becker, Jennifer Mankoff and Robert Kraut HCII, Carnegie Mellon University, Pittsburgh, PA
{tdillahu, gbecker, jmankoff, robert.kraut}@andrew.cmu.edu Abstract
Personal choices and activities directly account for much of the energy consumption in the U.S. with secondary impacts of those activities influencing an even larger proportion of energy consumption. Although there is a long history of investigation into motivators for energy-conservation, it is still unclear how to encourage persistent behavior change, and technology has only recently been applied to the problem. In this study we sought to learn if virtual pets could have a positive impact on real-world, environmentally responsible behavior. The polar bear is a powerful iconic symbol for many individuals, and its fate can be simply and directly connected to environmentally responsible behavior. Just as Tamagotchis evoked a powerful response from their owners, we hoped to use attachment to a virtual polar bear as a motivator for energy conservation. We ran a study exploring the impact of attachment on real-world actions. The results of our study suggest that an interactive virtual polar bear may increase environmentally responsible behaviors, especially when emotional attachment takes place.
1. Introduction Global warming continues to be one of the world’s major issues. In the U.S. alone, Americans consumed 100 quadrillion BTUs of energy in 2005 [11], with personal, individual activities accounting for much of this consumption. For example, 40% of the energy consumed is used for residential or commercial lighting, heating and cooling. All of this is driven directly by individual choices or indirectly because of consumer needs. Thus, personal choices can lead to a significant reduction in energy consumption, with a corresponding reduction in the release of CO2, one of the primary gases responsible for climate change. However, this requires persuading individuals to change their behavior, and maintain those changes over time, both difficult propositions. Our approach is to leverage the power of the polar bear as a symbol of climate change by creating a virtual pet, a technology that has promise for supporting behavior change (e.g. [7]). We describe a pilot study showing that increased attachment to a virtual polar bear had a significant positive impact on the number of actions that individuals had taken as reported a week after they used our software. This work is currently being incorporated into a mobile tool intended to influence transportation choices and into a social networking website.
There is extensive literature in the areas of environmental sociology, public policy, and more recently, conservation psychology that discusses the promotion of environmentally responsible behavior. In past work, we have explored the impact of motivators such as public commitment,

Figure 1: (top) a polar bear with lots of ice (bottom) a polar bear with little ice
frequent feedback, and personalization on environmentally responsible behavior [10]. Research in conservation psychology implies that animals help humans connect with nature [9]. Vining’s literature review demonstrates the extensive evidence for strong emotional bonds between humans and animals but she states that the answer to whether caring about animals or the environment leads to environmentally responsible behavior remains open [12]. Technology may provide a mechanism for leveraging these bonds to encourage behavior change. For example, Tamagotchis are virtual pets requiring nurturing interaction in order to be sustained. This in turn led to an emotional attachment to these virtual pets, for example owners mourned when their pets “died” [2]. Lin and Strub’s “Fish’n’Steps” study is an example of how an interactive computer game using a virtual pet, in this case fish, encourage physical activity [7].
Our approach integrates conservation psychology, a study which looks into relationships between nature and humans, with persuasive technology, the study of how computers can leverage psychological cues to motivate and influence behavior [3]. For example, motivators of environmentally responsible behavior are more effective when they have a direct impact on people's needs or concerns [1]. Also, caring for real animals can inspire conservation behavior [12]. In this paper we show that an emotional connection to a virtual pet that responds to environmental behavior can help motivate an individual by making that behavior seem to directly impact an individual’s concerns.
2. ExperimentWe conducted a one week, between subjects study to explore the effect of higher attachment to a virtual pet (the attachment group) to lower attachment to the same pet (the control group) on environmentally responsible behavior. To create attachment, we used a story describing environmental change, specifically the impact of climate change on the habitat of polar bears, pre-tested to elicit sadness. We asked participants in the attachment group to read it, reflect on their emotions and write about environmental responsibility, and name the polar bear on their display.
Participants were shown a Flash-based virtual polar bear on an ice floe that would grow as they committed to environmentally responsible actions and decrease as they chose not to commit to actions. As shown in Figure 1, the size of the ice floe would change depending on the number of actions a subject committed to taking. Our study tested the following hypotheses:
• H1: Commitments - Users who form emotional attachment to the virtual polar bear will commit to more environmentally responsible actions than users who do not form bonds
• H2: Fulfilled Commitments - Users who form emotional attachment to the virtual polar bear will fulfill (act on) their commitments

0
2
4
6
8
10
12
14
H1: Num Commitments H2: Num SustainedCommitments
H3: Donations ($)
Mea
n N
umbe
r of U
nits
ControlAttachment
Figure 2: (above) The attachment graph was higher for all hypotheses, and H2 (Fulfilled Commitments) is significant (F[1,11]=6.527, p=.0309).
• H3: Donations - Users who form emotional attachment to the virtual polar bear will donate more to a zoo than those from the control group
We recruited 20 subjects (10 in each condition) associated with local universities. Participants were given $15 and a shower timer for their time. All participants completed an initial survey at the start of the experiment to test whether either group was more likely to have higher motives for environmentally responsible behavior and whether this changed during the experiment. We used a subset of questions from De Young’s scales measuring competence and participation [1]. Participants also completed two additional scales both before and after the main intervention (interacting with the polar bear): the first measured levels of care on agreeableness and empathy [5] and the second measured overall environmental concerns [6]. All scales had a reliability of .65 or higher, measured using Cronbach’s α (values were α=.8615 for competence, α=.8920 for participation, α=.7579 for care and α=.655 for environmental concern).
The actions are included in Table 1. Fourteen were taken from sixty actions previously designed and tested as part of a field study of the StepGreen website [10]. We created an additional action, “Take an environmental sustainability flyer and give it to a friend,” and made flyers available to participants.
3. Results and DiscussionOut of the 20 participants, 60% were male and 40% female; 95% of the participants were students. Out of the 20 participants, 19 completed the first task; we reached 11 to ask about donations (5 control, 6 attachment), and we were only able to reach 11 participants to ask which actions they fulfilled (5 control, 6 attachment). The initial survey showed balance across the groups in terms of motivation for environmentally responsible behavior (p=.08833 and .08199).
1 Turn off the water while brushing your teeth
2 Turn off lights if you are leaving a room for more than 10 minutes
3 Wash only full loads of clothes
4 Wash only full loads of dishes
5 Dry only full loads of clothes
6 Carpool 1 day a week when you would otherwise drive
7 Pledge to ride the bus 1 day a week when you would otherwise drive
8 Combine trips in vehicle (i.e., visit multiple destinations on one trip)
9 Take the stairs instead of the elevator a minimum of 5 times per week
10 Take a shower instead of a bath
11 Restrict length of shower to 5 minutes
12 Use a low wattage night light
13 Lower heating thermostat to 68 degrees and wear warmer clothes
14 Unplug any electronic devices when not in use
15 Take an environmental sustainability flyer and give it to a friend
Table 1 - List of Actions

As shown in Figure 2, participants in the attachment group had a higher mean number of committed actions (H1), fulfilled commitments (H2) and a higher mean donation (H3). Of these, the difference in fulfilled commitments was statistically significant: F[1,11]=6.527, p=.0309*. The attachment group also demonstrated significantly greater environmental concern and greater care after reading about and interacting with the polar bear (F[1,19]=5.1273, p=0.0369* and F[1,19]=3.8124, p=.0675, respectively).
Our findings demonstrate that participants in the attachment group were more concerned about the environment, and this translated directly into significantly higher reported actions. Of particular interest is the fact that while there was not a significant difference in the number of commitments between the groups, reported follow through in terms of fulfilling those commitments was significantly higher. However, it is possible that participants in the attachment group lied about their follow through out of guilt or some other emotion. Also, we do not know how long these differences will be sustained.
4. Future WorkOur next step is to deploy the polar bear over a longer period of time, in a setting where we can objectively measure its impact on action. This addresses the two biggest concerns mentioned above. We plan to deploy the polar bear on a mobile platform that can track use of different transportation options. Additionally, we are currently creating a virtual polar bear plugin for MySpace and Facebook. The large numbers of users on sites such as MySpace (used by over 61.2 million unique visitors) and Facebook (over 19.5 million unique users)[8] presents exciting opportunities to encourage personally- and socially-desirable change in behaviors. Users will be able to publicly make commitments and have the status of their polar bear on display. Based on consistency theory, users would be more likely to behave consistently with their commitment [4]. This may also lead to further research on the impact peer pressure may have on environmentally sustainable actions.
5. Reason for Attending The work we described is an initial contribution to the issue of persuading individuals to take more sustainable actions. As such, it addresses one of the three main topics of the workshop, how to motivate sustainable action. Additionally, though there was no room to discuss it here, our research is expanding to address the appropriate deployment platforms and messaging for varied socio-economic and ethnic groups. We are excited by the opportunity to attend this workshop and engage researchers on these critical fronts.
6. Author Bios Tawanna Dillahunt is a first year Ph.D. student at Carnegie Mellon University. Her research interests include environmental sustainability and pervasive computing.

Geof Becker works at the Tepper School of Business at Carnegie Mellon in Marketing and Public Relations and is interested in encouraging development of online communities that commit to positive social action. Jennifer Mankoff is an assistant professor at CMU in the HCII. Her research interests include environmental sustainability, pervasive computing, and Assistive Technologies. Robert Kraut is a Herbert A. Simon Professor of HCI at CMU. He conducts research in four major areas: online communities, everyday use of the Internet, Technology and conversation, collaboration in small work groups, and computers in organizations.
7. References 1. De Young, R. (2003). Expanding and Evaluating Motives for Environmentally Responsible
Behavior. Journal of Social Issues, Vol. 56, No.3, pp. 509-526. 2. Donath, J. (2004). Artificial Pets: Simple Behaviors Elicit Complex Attachments. In M.
Bekoff (ed.), The Encyclopedia of Animal Behavior, Greenwood Press. 3. Fogg, B.J. (2002). Persuasive Computers Using Technology to Change What We Think and
Do. Morgan Kaufman Publishers, San Francisco, CA. 4. Harmon-Jones, E. (2002). Cognitive Dissonance Theory. Perspective on Persuasion. The
Persuasion Handbook: Developments in Theory and Practice. Sage Publications. p. 99-116. 5. International Personality Item Pool (as of February 2008): A Scientific Collaboratory for the
Development of Advanced Measures of Personality and Other Individual Differences, Big-Five Factors Markers: http://ipip.ori.org/newBigFive5broadKey.htm.
6. Kaufman, T. (1999). A Study of the Motivations Behind Heritage Site Selection in the United States, PhD Dissertation, Virginia Tech.
7. Lin, J., Lindtner, M.S., Strub, H. (2006). Fish'n'Steps: Encouraging Physical Activity with an Interactive Computer Game. in Proceedings of the 8th International Conference on Ubiquitous Computing, pp. 261-278.
8. McCarthy, C (September 13, 2007). Nielsen/NetRatings’ August social media numbers: Not much change, CNet News.com. http://www.news.com/8301-13577_3-9777942-36.html.
9. Myers, O.E. Jr., Saunders C.D. (2002). Animals as links toward developing caring relationships with the natural world. In Kahn and Kelert (eds). Children and Nature, 153-178. Cambridge, MA: MIT Press.
10. Mankoff, J, Matthews, D., Fussell, S.R., Johnson, M. (2007). Leveraging social networks to motivate individuals to reduce their ecological footprints. In Proceedings of HICSS.
11. U.S. Department of Energy (2006). Annual Energy Review 2005. Energy Information Administration, Washington, DC DOE/EIA-0384.
12. Vining, Joanne (2003). The Connection to Other Animals and Caring for Nature. Human Ecology Review, Vol. 10, No. 2

Points of Persuasion:
Strategic Essentialism and Environmental Sustainability
Paul Dourish Donald Bren School of Information and Computer Sciences
University of California, Irvine Irvine, CA 92697-3440, USA
[email protected]://www.ics.uci.edu/~jpd
Abstract
The environmental movement, as a political body, is an alliance of many different groups with different agendas and goals, not always compatible. Nonetheless, as a matter of political pragmatism, the identification of “the environment” as a common focus binds these actors together – an act of strategic essentialism. Drawing on this observation and on an account of identity production in social software, I suggest that an alternative approach to pervasive persuasion might be to help crystallize this sort of political connection.
1. Strategic Essentialism and Sustainability
Postcolonial scholar Gayatri Spivak (1987) coined the term “strategic essentialism” to refer to the ways in which subordinate or marginalized social groups may temporarily put aside local differences in order to forge a sense of collective identity through which they band together in political movements. Post-war resistance movements to colonial rule often relied on just such mechanisms by which particular forms of ethnicity or nation-hood were used to align disparate groups towards common goals. Spivak’s observation is that, while such terms as “indigenous” peoples or similar labels result in problematic and unstable groupings that erase significant differences and distinctions (rethinking colonial categories), nonetheless these acts of identity formation support important political ends. So while terms such as “Indian,” “African”, or “Native American” may be manufactured and suppress highly significant differences, they nonetheless do important work.
Studies of the social history of environmentalism show much the same sort of process at work in the development of the environmental movement. Cronon (1995) documents the history of our conception of Wilderness. In the period of the Western Expansion, wilderness is a threat to human existence. It betokens the kinds of arid, unforgiving and hostile environment that settlers might experience in their movement west, something that must be conquered (and so also a source of opportunity.) It is not for nothing, he argues, that it is the wilderness where Christ

struggles with the Devil, or into which Adam and Eve are cast. By the late nineteenth century, though, a new notion of wilderness has emerged – not a threat but a comfort, not something to be overcome but something to be cherished, a place not of danger but of rejuvenation. The national park movement reflects a change in the understanding of what wilderness might be, what it might be worth, and why. Cronon documents a range of considerations that are part of this ideological reframing of wilderness (including the gender issues associated with the image of the rugged masculinity involved in taming “virgin” nature, the problems of habitation by indigenous peoples, and the issues of the supernatural associated with the encounter with wilderness), but his central concern is the way that the ideological construction of wilderness obscures the central role of human action:
By imagining that our true home is in the wilderness, we forgive ourselves the homes we actually inhabit. In its flight from history, in its siren song of escape, in its reproduction of the dangerous dualism that sets human beings outside of nature—in all of these ways, wilderness poses a serious threat to responsible environmentalism at the end of the twentieth century. (Cronon, 1995:81).
More broadly, as Proctor (1998) also demonstrates, strategic essentialism lies at the heart of the creation of the environmental movement at all. What we think of as environmentalism is a political force resulting from the forging of an alliance between groups with concerns as diverse as open access, biodiversity, air and water pollution, surfing, animal husbandry, agricultural efficiency, bioengineering, and rock climbing. “The environment” emerges as a concept shaped by the union of common interests, even though these interests might be mobilized in quite different ways and for quite different reasons. As Spivak would note, the inherent heterogeneity of the group is made subservient to strategic goals. Arguably, one of the reasons that the clash of perspectives over environmentalism – between, for instance, Western environmentalists and native Amazonians over sustainability and economic survival in the rainforest (Tsing, 2004) – are so troubling is because they threaten the unstable alliances out of which these political movements are formed.
2. Pervasive Persuasion
When we talk of persuasion as a consideration for information technologies, we are frequently concerned with how behavior modification can be induced by intervening in moments of local decision-making and by providing people with new rewards and new motivations for desirable behaviors (Fogg, 2003). These kinds of strategies have been common, for instance, in health and fitness applications (e.g. Lin et al., 2006). One might imagine a range of pervasive persuasive technologies along these lines. If we argue that the essential importance of pervasiveness is that the technology accompanies people in the course of their everyday lives, then technologies that help people to assess their everyday actions in terms of broader questions of sustainability present themselves – applications that help people understand their carbon footprint, for example, or ones that provide access to environmental information as a part of shopping (e.g. Bernheim-Brush et al., 2004).
However, if we think about environmental sustainability from a political perspective, and particularly bearing in mind the important role of strategic essentialism, then a different

application area presents itself. From this perspective, what we might want to persuade people of is the ways in which their interests are aligned with those of others. As is demonstrated by sociological research into the formation of social movements, this process of alignment and mobilization, by which one can start to find one’s own interests as being congruent with those of others, is a critical first step in political mobilization (Snow et al., 1986).
Arguably, we can find the foundations for such technologies in the current crop of so-called “social software” applications, of which Facebook is perhaps currently the most prominent. Social networking sites claim simply to articulate social networks that are already there, but of course, social networks in the formal sense are an analytic device rather than an aspect of our own everyday experience. (This can most easily be demonstrated by asking the question, “Tell me about someone two hops away from you in your social network.” Nobody can, since, by definition, such a person is not known to the subject.) Instead, then, we can approach social networking sites as technologies of affiliation, alignment, and identification, sites at which forms of collective identity are forged and enacted.
If social software works by, first, tying individuals and actions to groups and networks and, second, by providing a platform through which one acts as a member of a group (be that an institutional affiliation, an informal group, or simply a identifiable social type), then a similar approach can perhaps be harnessed in the domain of sustainability. This would suggest that, rather than using technology to provoke reflection on environmental impact of individual actions, we might use it instead to show how particular actions or concerns link one into a broader coalition of concerned citizens, social groups, and organizations. So, for instance, if we were to combine the sorts of monitoring technologies developed by Paulos (2008) or the kinds of scanning technologies explored by Bernheim-Brush et al. (2004) with social networking accounts of the different interests associated with sustainability debates and movements, then we might have a system that could tell people, “the action you are about to take aligns you with X but against Y,” or, “the products that you are looking at have these different impacts on these different groups.” What is being done here is a process of frame bridging (Snow et al., 1986) that not only allows for forms of reflection and behaviour modification but also links the individual into a broader coalition of interests. What becomes visible is not so much the world, but its political alignments.
3. Conclusions
Various attempts have been made to use pervasive technologies to connect people to the environment in which they live (e.g. Paulos, 2008), or to provide them with tools for reflection on the impacts of their practices (e.g. Bernheim-Brush et al, 2004). Observing that we need to think about sustainability also as a process of political mobilization, I have suggested that we can draw too on a different set of technologies – the social networking technologies familiar from Web 2.0 applications – as a means to connect people not only to environments and to actions but to other people; and, moreover, to do this in a way that helps them to see their way through the central questions around which political action might be initiated. The new goal of pervasive technology here, then, is to promote a form of strategic essentialism that is part of this process.

4. Acknowledgements
This work was supported in part by the National Science Foundation under awards 0205724, 0527729, 0524033, and 0712890.
5. References
Bernheim-Brush, A.J., Combs-Turner, T., Smith, M., and Gupta, N. 2004. Scanning Objects in the Wild: Assessing an Object-Triggered Information System. Proc. Intl Conf. Ubiquitous Computing Ubicomp 2004 (Nottingham, England).
Cronon, W. 1995. Uncommon Ground: Rethinking the Human Place in Nature. Norton.
Fogg, B.J. 2003. Persuasive Technology: Using Computers to Change What We Think and Do. Morgan Kaufman.
Lin, J., Mamykina, L., Lindtner, S., Delajoux, G., and Strub, H. 2006. Fish’n’Steps: Encouraging Physical Activity with an Interactive Computer Game. Proc. Intl. Conf. Ubiquitous Computing Ubicomp 2006 (Orange County, CA), 261-278.
Paulos, E. 2008. Citizen Science: Enabling Participatory Urbanism. In Foth, M. (ed), Urban Informatics: Community Integration and Implementation.
Proctor, J. 1998. The Social Construction of Nature: Relativist Accusations, Pragmatist and Critical Realist Responses. Annals of the Association of American Geographers, 88(3), 352-376.
Snow, D., Ruchford, B., Worden, S., and Benford, R. 1986. Frame Alignment Processes, Micromobilization, and Movement Participation. American Sociological Review, 51, 464-481.
Spivak, G. 1987. In Other Worlds: Essays in Cultural Politics. Taylor and Francis.
Stoler, A. 1989. Rethinking Colonial Categories: European Communities and the Boundaries of Rule. Comparative Studies in Society and History, 31, 134-161.
Tsing, A. 2004. Friction: An Ethnography of Global Connection. Princeton, NJ: Princeton University Press.
Bio Statement: Paul Dourish is a Professor of Informatics in the Donald Bren School of Information and Computer Sciences at UC Irvine, with courtesy appointments in Computer Science and Anthropology. He teaches in the Informatics program and in the interdisciplinary graduate program in Arts Computation and Engineering (ACE). In 2008, he was elected to the CHI Academy.
Motivation for attending: I’d like to understand the ways in which environmental questions act as a nexus for technological, social, and cultural considerations, and are likely to develop over the next few years.

Understanding motivation and enabling action towards change
Penny Hagen, Duncan Underwood1
AbstractSocial Technologies can be platforms for change as they facilitate actions and act as spaces for conversation and the dissemination of information. In this workshop paper we explore the concept of motivation in relation to our practice as technology designers. We are specifically interested in what motivates people to take action, and how we can support that as technology designers.
We frame our conversation about motivation, technology, and action towards sustainability by exploring two aspects of our design practice. The first aspect focuses on design research and using participatory methods such as Mobile Diaries to understand what motivates people to be involved, to take action, to contribute. The second aspect is the design of technologies, channels or tools that enable people to act upon their motivations effectively. We provide examples of this through case studies of our work.
1. Digital Eskimo and our stakeholders
Digital Eskimo is a design agency with a commitment to working on projects we consider to be progressing humanity towards a nurturing (more than sustainable) way of being. To achieve this we practice ‘Considered Design’. This definition covers a number of aspects of how we approach our design and underlying company philosophy.
It means we are ethics and values driven. The act of doing design is meaningful to us, over and above the notion of monetary profit. Our practice is grounded in, and informed by the principles of sustainability. We think that change is produced collectively, created through action, experience and sharing knowledge. And we think design can make a difference.
Our clients are equally invested in social change and are often activists themselves, existing to promote or facilitate environmental or social causes. Many of our clients are non-government organisations and workers unions. Similarly the stakeholders, users or community members that we are designing for are also (often) interested in change - seeking action or ways to complete action. Our work talks to their motivations and interests. Some of our work focuses on creating and growing existing communities over time, some of our work focuses on
1 Digital Eskimo, Level 4, 16 Foster Street, Surry Hills NSW Australia
www.digitaleskimo.net

capturing focused action one time, on a large scale. Our work is underwritten by an approach to design that focuses on understanding what motivates people to take action or be part of a community towards change.
While our core work is manifest in online technologies, it increasingly takes the form of more integrated services across multiple delivery systems, overlapping with ubiquitous and pervasive systems. Through the workshop we hope to explore how our approach to design can be applicable to pervasive systems, and contribute to expanding discourse on how we as designers we can build pervasive technologies that support or motivate sustainable living practices.
2. An approach to design
Our work is guided by the traditions of Participatory Design [2][7], in that we recognize the expertise of the users and stakeholders, what Sanders calls a Participatory Mindset [6]. For these reasons we select research methods based on their ability to immerse the design team in the world of our stakeholders, methods that facilitate a collaborative relationship with clients and aim to enable all stakeholders to be appropriately represented in the design. We use participatory methods such as workshops and collaborative brainstorming and we build collective personas and scenarios with our stakeholders [3]. While we continue to employ a range of researcher driven methods such as interviews, focus groups, surveys and questionnaires we embrace methods that are more designerly (e.g. [1]) participatory (e.g. [8]) and interventionist (e.g. [5]) such as Mobile Diaries [4].
In this paper we briefly present three diverse “social technology” case studies where actions or discourse are facilitated through technology. The first is a Design Research case study using technology to understand underlying attitudes to sustainability as well as ways to support corresponding actions. The second and third, an Integrated Campaign and an Online Campaign site respectively both aim to motivate and facilitate change by using technology to amplify individual actions on a collective platform, albeit in quite different ways.
3. Case studies
3.1 WWF Human Habitat Diaries (Design Research Project)
Digital Eskimo conducted a research project with five participants over a two week period. Each was selected from one of the different demographic groups likely to interact with WWF's FutureMakers project. The intention was to provide a window into the lives of participants, a way for them to share their world with us, and their perspective on it. This research was to inform the design of online tools that enabled and encouraged such sharing between people on an ongoing basis.
Participants were prompted to reflect their environment and daily lives from a sustainability perspective and were invited to implement one of eight measures that would reduce their negative impacts on the environment. Participants used Mobile Diaries which include camera phones, low resolution video cameras, maps and notebooks to record their daily experiences at work and at home. SMS’s and images with audio annotations were sent from the phone to personal Habitat Diaries (password protected blogsites) assigned to each participant that could be accessed by the participants and the designers/researchers. The notebooks, video cameras

and maps were mailed back to us at the conclusion of the study. Combined, they enabled us to develop a rich picture of the participants’ lives, habits, and attitudes to sustainability. The data gathered enabled us to understand the participants motivations around issues of sustainability, the obstacles motivated people faced in making change, as well as identify when and why they might be motivated to participate in an online community focused on supporting change.
3.2 David Hicks – Amnesty International Australia (Design Case Study)
In this case study Digital Eskimo was asked to develop an online facility to promote a project of Amnesty International Australia (AIA), raising awareness of the issue of David Hicks’ imprisonment without trial in Guantanamo Bay.
AIA had built a full sized replica of the cell David Hicks lived in and the public were invited to spend a small amount of time in the cell alone to consider David’s experience in Guantanamo Bay and the broader issue of his ongoing imprisonment. We saw an opportunity to use the online space to show and share people’s reaction to their time in the cell as well as their attitude on the issue by placing a webcam in the cell that enabled visitors to record a 30 second message to camera that was then syndicated to one or more websites. The corresponding website enabled people who could not access the cell to understand a little of the experience, at the same time by broadcasting these messages we affected a far broader audience than would have originally have been reached.
Digital Eskimo’s response to this opportunity promoted the tour of the cell and communicated AIA’s campaign objectives. But furthermore it allowed people to act upon their motivation to do something about these issues: voice their opinion on the issues of David Hicks’ detention and the imprisonment of terror suspects without trial; to hear the opinions and responses of others to their experience in the cell; and to share their own views among their networks.
3.3 ACTU Your Rights at Work campaign site
The website is the hub of the ACTU’s 150000 member campaign against the unpopular WorkChoices legislation. Our team designed the site with an emphasis on informing workers and inspiring specific targeted action.
The site delivers the ACTU’s information in a simple and effective style, as well as telling the stories of workers who have been affected by the WorkChoices legislation. Primarily however the site is a campaigning tool that was designed to deliver single strong calls to action that can be updated by the ACTU at a moments notice.
This tool allowed the ACTU to easily and quickly communicate to their member base. It enabled motivated people to undertake a collective action and to easily promote such action to their friends and networks, amplifying the call to act and directing such activity in order to maximize its effect.
4.0 Conclusion Digital Eskimo is a design agency that utilizes social technologies to promote and progress a nurturing (more than sustainable) way of life. Key to our own motivation within our projects is that we share the goals of our clients. Key to achieving successful design outcomes is developing a richer understanding of the motivations of each project’s stakeholders and our

ability to design technologies that encourage and enable people to act upon these motivations; connecting, sharing knowledge and working together to create change towards a nurturing / sustainable life.
5.0 Biography 5.1 Penny Hagen
Penny Hagen is the Executive Producer at Digital Eskimo. Prior to joining Digital Eskimo Penny spent 10 years freelancing as a producer, designer and trainer specializing in interactive media and community projects in Sydney and New Zealand. Penny has also worked as a researcher for UTS’s Interaction Design Lab investigating mobile technology use and conducting research into social software and participatory design methods. Underlying her approach to technology design is a commitment to creating communication tools that acknowledge the emergent nature of social networks and encouraging appropriation by the people that use them.
5.2 Duncan Underwood
Duncan Underwood is the Sustainable Development Manager at Digital Eskimo. Duncan graduated with a Bachelor of Design (Industrial) from UTS in 1997 and is currently enrolled in Master of Social Science (International Urban and Environmental Management) at RMIT. Before Digital Eskimo, Duncan worked in business development at Clean Up Australia.
6.0 Bibliography [1] GAVER, B., DUNNE, T. & PACENTI, E. (1999) Design: Cultural Probes.
Interactions, 21-29
[2] GREENBAUM, J. & KYNG, M. (Eds.) (1991) Design at Work: Cooperative Design of Computer Systems, New Jersey, Lawrence Erlbaum Associated.
[3] HAGEN, P. & GRAVINA, D., Sharing through Artefacts: client-user centred design. Ozchi. Sydney, ACM, 2006
[4] HAGEN, P., ROBERTSON, T. & GRAVINA, D. (2007) Engaging with stakeholders: Mobile Diaries for social design. DUX. Chicago, USA, ACM.
[5] PAULOS, E. and JENKINS, T. Urban probes: encountering our emerging urban atmospheres. ACM Press, Portland, Oregon, USA, 2005
[6] SANDERS, E. B.-N. (2006). Design Research in 2006. Design Research Quarterly, 1.
[7] SCHULER, D. & NAMIOKA, A. (Eds.) Participatory Design: Principles and Practices. NJ, Lawrence Erlbaum Associates.
[8] VISSER, F. S., STAPPERS, P. J., LUGT, R. V. D. & SANDERS, E. B.-N. (2005) Contextmapping: experiences from practice. CoDesign, 1, 119-140.

THE NEW WELL-TEMPERED ENVIRONMENT: TUNING BUILDINGS AND CITIES
Dan Hill & Duncan Wilson
Abstract: Our work has two main components - one part practical, the other theoretical - though both are related, and have developed in discussion. They both concern the measurement and feedback of energy usage in buildings, and then cities, in order to enable users to change their behaviour - to in effect, ‘tune’ their environment. The work is intended to raise important questions about the efficacy of such schemes, outline the potential of systems when stretched over urban and social networks, to speculate about the future of information as part of the fabric of buildings, and to make some practical considerations clear along the way.
1: Tuning 13 Fitzroy Street
The first part of the work concerns research and development work led by Arup’s Dr. Duncan Wilson, deploying wireless sensor networks in the new Arup building at 13 Fitzroy Street, London.
This is predicated on the emerging understanding that occupation of a commercial building typically costs more than 200 times the initial capital cost of construction and that ~40% of final energy consumption in the European Community is in the buildings sector. In addition governments are pushing regulatory frameworks to reduce the energy impact of such running costs [1]. Within the UK, energy used in buildings accounts for some 50 per cent of the country’s carbon dioxide emissions.
Thus the ability to moderate the use of energy in buildings can have a significant impact on the overall efficiency of the built stock. Changes to the design and construction of new buildings is leading to significant improvements in building efficiency but the majority of the built stock is comprised of older buildings with limited potential for passive energy saving. The Living Buildings initiative [2] at Arup is one example of our sustainability activities working towards the

consequences of the context above. At a macro level we are also working at a city scale on projects such as Dongtan eco-city in China [3]. But what are the opportunities for pervasive computing?
We have been exploring the use of ubiquitous or pervasive computing technology based around wireless sensor network (WSN) platforms to gain improved understanding of real-time operation of buildings and to allow greater environmental control of existing buildings that do not have the installed infrastructure to actively control energy consumption.
The first small steps have been to deploy WSN's in the office environment to investigate both energy consumption of the building and the comfort of the space [4]. Various quantitative and qualitative measures are being taken and fed back in real-time to occupants of the space (not just building / facility managers). At the newly built Fitzroy Street building, the two main sensor network development platforms used were Crossbow and Arduino. Motes have been deployed throughout the building (and in a related study at Central Saint Martins college in London), connecting over Bluetooth IEEE 802.15 and sensing occupancy levels (via Passive InfraRed sensors) combined with performance data from the building management system. The Bricks Framework is used to fuse data together, and provide the base for dynamic visualisations, sound installations and interactive devices.
We’ll discuss various methods for conveying information back to users, and the many issues therein. As it stands, the system is producing data across all axes and various visualisation methods are being designed for a number of locations within the building.
Ultimately, this work at the level of buildings may provide an opportunity to start doing city wide monitoring of the pre- and post-occupancy performance of sustainable buildings. This pervasive data collection from very large sensor populations could be integrated to support control and optimisation at this scale. City information modelling systems are beginning to emerge, extrapolating from Arup’s work with building informational modelling (BIM), and this provides a unique opportunity for post construction analysis and validation.
2: The Personal Well-Tempered Environment
Developed by Dan Hill, this section continues the themes covered thus far, extrapolating the potential for such schemes when stretched across urban and social networks. It’s an imagined system at this point [5], a real-time dashboard for buildings, neighbourhoods, and the city, focused on conveying the energy flow in and out of spaces, centred around the behaviour of individuals and groups within buildings.
In this, it becomes a form of 'BIM 2.0' that gives users of buildings both the real-time and

longitudinal information they need to help change their behaviour and thus use buildings, and energy, more effectively. It would be an ongoing post-occupancy evaluation for the building, the neighbourhood and the city. Importantly, it proposes measuring contribution as well as consumption, through sensors embedded into localised wind and solar power, grey-water collection, and so on. Further, it explores the idea of measuring behaviour across wider circuits, such as an individual’s movement through the city (scoring ‘points’ for public transport versus private transport, monitoring environmental usage in office environments, and so on.)
Suggested as a software service layer for connecting things together within and across buildings, it would take a ‘plug-in’ approach to connecting energy sources and resources, drawing from architectural theory of Archigram and Cedric Price amongst others. Multi-sensory feedback is a particular theme in the suggested interface, exploring different ways of conveying this information. The work is based on a survey of existing energy monitoring schemes and products in this area, collated and discussed online. Over and above this, it folds in some ideas from social software, particularly the reflexive mode produced by systems such as Last FM, Flickr, Dopplr, Nike+ and so on, and wraps these up with the aforementioned architectural theory as well as making connections to newer concepts like Bruce Sterling’s spimes and everyday product design.
Drawing from this recent history of social software, the proposal describes various ways in which an ‘open’ approach to data, allied with social networks, may enable a socialising of the data, or even a ‘gaming’ element - in which individuals, suburbs, neighbourhoods and cities can compare their environmental performance. This latter aspect is an attempt to make the civic relationship between an individual and their environment clear, thus addressing a key issue in the emerging informational city. Taking the conceptual starting point of an API on a house, the idea suggests extending this to the API on the neighbourhood, even the city itself. Making the effects of informational behaviour visible on the street in turn asks further questions about how to perceive and communicate the emerging informational aspects of the contemporary city, a theme increasingly fundamental to urban planning.
Though initial investigations elsewhere suggest that feedback on energy use can help change behaviour [6], questions will be asked of the efficacy of such ‘persuasive visualisation’, as part of a critical assessment of whether such systems can truly have a beneficial effect in terms of ‘tuning the environment’, or whether the real problems lie elsewhere.
The connection to the aforementioned Arup projects will be made clear, seeing the Personal Well-Tempered Environment as an example of Arup’s approach of ‘total design’ - a multidisciplinary framework for building - and discussing how information itself can increasingly be thought of a material within building. With a holistic approach, it makes sense to consider information as part of the built fabric, just as with glass, steel, ETFE etc. The Well-Tempered ideas will begin to inform Arup’s work on the ground, and vice versa, thus creating a constructive relationship between imagined informational architectures and pragmatic, deployed engineering.

Motivation for participating in the workshop
This workshop provides an opportunity to extend the thinking around our projects so far, testing the ideas against related work and discussing with others working in this field, subsequently wrapping the findings back into practical work through our projects and research at Arup.
Biographies
As part of the Foresight Innovation and Incubation team at Arup, Dr. Duncan Wilson ([email protected]) is responsible for researching medium and long term futures with a focus on social and technology factors. He develops foresight and innovation capability within Arup, co-created the Drivers of Change concept, and programme manages a series of workshops on the future of the built environment. He was Principal Investigator on a Euro 1.4 million two year research project (DTI technology programme) applying wireless sensor networks in the built environment, is a partner in the European Union SENSEI project looking at networks of wireless sensor networks and is leading an internal research project on the implications of ubiquitous computing for Arup. His research merges interests in sensing and monitoring and creating interactive, ambient displays that solicit and feedback information with the intent of influencing behaviour. Duncan is a Chartered Engineer (IET), has a PhD from University College London in Artificial Intelligence and Machine Vision and blogs at http://www.driversofchange.com/emtech/NB: The work at Arup is supported by two UK national programmes (DTI/TSB Technology Programme)
Dan Hill ([email protected]) has been working at the forefront of innovative information technology since the early '90s, and is responsible for many innovative, popular and critically acclaimed products and services He was Head of Interactive Technology & Design at the BBC in London for 5 years, before launching the critically-acclaimed international magazine Monocle during 2007, responsible for its digital services. He recently joined Arup as a Senior Consultant in their planning group, working with urban informatics. During 2007, Hill co-organised the Postopolis!architecture and urbanism exhibition/conference in New York City, and has a background in academic research and teaching in urban regeneration and urban informatics. His weblog City of Sound (http://www.cityofsound.com/) is generally considered to be amongst the foremost architecture and urbanism sites, recently voted by Planetizen as one of the ten best planning, design, and development sites for 2008 (http://www.planetizen.com/websites/2008).
References:[1] For example, the EU Energy Performance of Buildings Directive, http://www.buildingsplatform.org/cms/[2] http://www.arup.com/advancedtechnologyandresearch/feature.cfm?pageid=9887 [3] http://www.arup.com/eastasia/project.cfm?pageid=7047 [4] FANGER, P.O. Thermal Comfort. Analysis and applications in environmental engineering. McGraw Hill. http://www.flickr.com/photos/pseudonomad/collections/72157603889824626/ [5] http://www.cityofsound.com/blog/2008/01/the-personal-we.html, with video at http://nextbutton.pureprofile.com/TVC/?id=4326 [6] Pacific Northwest National Laboratory of the Energy Department, 2008 (http://www.nytimes.com/2008/01/10/technology/10energy.html?scp=3&sq=department+of+energy)

PROMOTING ENVIRONMENTALLY SUSTAINABLE BEHAVIORS USING SOCIAL MARKETING IN EMERGING PERSUASIVE TECHNOLOGIES
Omar Khan and John CannyBerkeley Institute of Design, Computer Science Division,
University of California, Berkeley, USA{omar, jfc}@cs.berkeley.edu
Abstract We argue that social marketing, a strategy that uses techniques from corporate marketing to influence the behavior of target audiences, is a useful framework for thinking about motivating people to enact environmentally sustainable behaviors. We critically examine some pervasive green applications through the lens of social marketing and discuss how we might study various persuasive factors encouraged by social marketers in these domains and in our own research.
1. Introduction
Social marketing uses tools from corporate marketing to influence the behavior of target audiences [1, 6]. Kotler and Zaltman, reflecting on successful marketing campaigns for products like soap, observed that some principles might translate to selling social causes. In the ensuing 35 years, social marketing has become particularly widely accepted in the public health domain, where it has been successfully used to influence behaviors concerning drunk driving and childhood obesity, for example. In this paper, we suggest using principles from social marketing to enhance persuasive technologies and help focus them on changing behaviors, and not just raising awareness.
2. Social Marketing: Setting the Stage
In his recent text [1], Andreasan describes a set of concepts, many from corporate marketing, that make the social marketing process effective. While social marketers emphasize the importance of considering the factors listed below, the degree of effectiveness of some of these factors has not been carefully studied. To that extent, one important research contribution will be the study of the effectiveness of these factors in the area of encouraging environmentally sustainable behaviors.
Benefits and Costs
Like obtaining a product, when an individual chooses to enact a certain behavior, they must pay some cost, and hopefully acquire some benefits. The social marketer's challenge is to sell the benefits while minimizing the costs. Related to this is how the benefits are presented. Research shows that the order in which requests of individuals are made can have a significant effect on engagement behavior [7]. In addition, the method of presentation can be very important [10].

Other People
Robert Cialdini has shown that 1) when deciding on a behavior to enact, people are strongly influenced by knowing what others are doing and 2) in certain situations, people report that they do not think they will be strongly influenced by others, but in fact these same people appear to be most strongly influenced by what others are doing [2]. This perhaps surprising result means that social influence can be particularly powerful because people do not guard themselves against such influence.
Self-Assurance (or Self-Efficacy)
Even if benefits, costs and other people are aligned in favor of an individual enacting a certain behavior, that individual may still not act. One reason is that they may believe they cannot enact the behavior. This is where we must provide support mechanisms like support groups (e.g. Alcoholics Anonymous) and skills training [13].
Segmentation and Identity
Because of large variability in target audiences, it is unlikely that treating the audience as one large, coherent market will be successful, and thus we should perform market segmentation. Identity-based marketing is related to this idea. Controlled studies have shown that if individuals with a relevant identity (say they are "green" individuals) that is primed (the individual is given content that surfaces "green" thoughts) are then much more likely to purchase a product related to that identity when compared to green individuals who were not primed [11].
3. Pervasive Green Applications through the Social Marketing Lens
3.1. Highly Sensed Virtual Environments
Green social networking site applications have been discussed in the literature [8] and appear online. One popular green application on Facebook is called "I Am Green" [4]. Users provide the application with a list of their green behaviors. Each green behaviors gets you a leaf, and you are compared to your other friends who have also installed the application. As a leaf collecting competition, it may be effective, but it is unclear if it is actually effective at advocating and motivating users to enact environmentally sustainable behaviors.
Consider the profile view of the "I Am Green" application in Figure 1. What is most prominent is the number of leaves the friends have, not the behaviors they enact. To leverage social influence, the application could instead say "4 of your friends recycle, even when it is not convenient." If four of my friends do it, based on Cialdini's work, we can hypothesize that we are already more likely to enact that behavior. Furthermore, I could click on the behavior and learn more about it, like its benefits and costs. Similarly, popular behaviors could be advertised.
Finally, recall the social marketer's emphasis on audience segmentation. Social networking sites provide such detailed information about individuals and their social network that creating audience segments of size one is possible. Indeed, we hypothesize that presenting users with recommended behaviors based on collaborative filtering instead of the most popular behaviors will lead to increased adoption of the recommended behaviors.

Figure 1: Screenshot from the I Am Green Facebook application
3.2. Dormitory Energy Competition at Oberlin College
On the Oberlin campus in 2005, an energy saving competition was run between dormitories [9]. The dormitories that saved the most energy, over a certain period, would win a prize. Building on the well documented effect of providing energy consumption feedback to reduce future consumption [3], the researchers provided one group of dormitories with real-time consumption information they could view on the Internet (see Figure 2 below for a particular residence, Kade Hall), or on an interactive display in the lobby of the building. Dorms engaged in the competition using these advanced monitoring systems saw significant energy reduction, over and above those dorms that did not have such detailed monitoring technology. However, examination of energy consumption patterns after the end of the competition suggests that the numbers have returned to near their original, pre-competition baseline [5]. From a social marketing perspective, this is not surprising. One of the primary benefits offered to students in the dorms was the potential to win the competition. When the competition is discontinued, both the benefit of having a prize, and the benefit of friendly competition, disappear, and what's left is the somewhat intangible benefit of reducing the campus' electricity consumption and maybe indirectly helping the planet. This is one hypothesis for the return to the baseline. We could examine the benefits hypothesis in future competition by redesigning the benefits to be seen as continually useful. Another possibility is to ensure the benefits remain for a long enough period so that individuals internalize their behaviors. Such work has been done in residential settings.
4. Our Work
We intend to study the effectiveness at reducing consumption of the social marketing concepts outlined above, and game-like mechanisms (e.g. competition, scoring points) as demonstrated in the Dorm Energy Competition. First, we can perform basic experiments in a laboratory setting to study the impact of different social marketing factors incorporated in technologies on behavioral change (as in [2, 7, 10]). In the field, we hope to study these factors in two domains:
4.1 Highly Sensed Virtual Environments
In an online social networking environment, we will build an application that promotes environmentally sustainable behaviors. The application may be similar to the "I Am Green" application, in that users must select behaviors that they enact. Concretely, we would then manipulate the persuasive factors mentioned above for different groups, and monitor the uptake of behaviors. Here are some of the persuasive factors we may study:

Social Influence: since the application sits on top of a social network, we can leverage information about friends. We can present performance information about friends, make comparisons between individuals and their friends
Game Mechanisms (scoring, competition): behavior choices might be translated to a score (like leaves in "I Am Green") and can be billed as a competition amongst participating individuals
4.2 Reducing Individual Energy Consumption in Office Spaces
Office buildings consume a huge proportion of energy in most countries. Lighting and electronics usage by individuals is a significant component of office building energy consumption. We are building a dashboard display for an office space. Based on survey work by the Center for the Built Environment at Berkeley, often office occupants feel they have very little control over energy consumption in their space. Thus, one experiment we may run is between visual displays that only display consumption information, and those that display consumption information and promote appropriate behaviors for changing consumption in the space.
Game mechanisms may also be effective in this domain. A study [12] showed that competition between office spaces yielded increased reductions when compared to spaces that did not compete.
5. About the Authors
Omar Khan is a 3rd year PhD student studying human computer interaction. He is trying to persuade individuals to enact environmentally sustainable behaviors. John Canny is the Paul and StacyJacobs Distinguished Professor in the UC Berkeley Department of Computer Science. His research interests include activity-oriented design and educational and persuasive information systems.
6. References
[1] ANDREASEN, A.R., Social Marketing in the 21st Century, Sage Publications Inc, 2006. [2] CIALDINI, R.B., “Basic Social Influence Is Underestimated,” Psychological Inquiry, vol. 16, 2005, pp. 158-161. [3] DARBY, S., The effectiveness of feedback on energy consumption. A review for DEFRA of the literature on metering, billing, and direct displays, University of Oxford, Environmental Change Institute. April, 2006. [4] "I Am Green," January 2008, http://apps.facebook.com/iamgreen/. [5] Lucid Design Group (private communication), 2007. [6] P. KOTLER and G. ZALTMAN, “Social Marketing: An Approach to Planned Social Change,” Journal of Marketing, vol. 35, 1971, pp. 3-12. [7] W. LIU AND J. AAKER, "The Happiness of Giving: The Time-Ask Effect," To appear in the Journal of Consumer Research, February 2008. [8] J. MANKOFF et al., “Leveraging Social Networks To Motivate Individuals to Reduce their Ecological Footprints,” Proceedings of the 40th Annual Hawaii International Conference on System Sciences, 2007, p. 87. [9] J.E. PETERSEN et al., “Dormitory residents reduce electricity consumption when exposed to real-time visual feedback and incentives,” International Journal of Sustainability in Higher Education, vol. 8, 2007, pp. 16-33. [10] D. RAMACHANDRAN and J. CANNY, "The persuasive power of human-machine dialogue," To appear in Proceedings of Persuasive 2008. [11] REED, A. “Activating the self-importance of consumer selves: Exploring identity salience effects on judgments,” Journal of consumer research, vol. 31, 2004, pp. 286-295. [12] F. SIERO et al., “Changing Organizational Energy Consumption Behaviour Through Comparative Feedback ,” Journal of Environmental Psychology, vol. 16, 1996, pp. 235-246. [13] V.J. STRECHER and M.E. DEVELLIS, “The Role of Self-Efficacy in Achieving Health Behavior Change,” Health Education & Behavior, vol. 13, 1986, p. 73.

����������� �������� ��������������������������������������������������������������������������������� ���������������
������� ������������������ �����
Seng W. Loke, 1 Jugdutt Singh, 2 and Hai Le3
Abstract We propose a technological solution to the general problem of empowering individuals to take actions related to environment sustainability, going beyond mere reminder systems or simply passive written guidelines. Resource-usage policies at the home, community, state or national level will be encoded in a formal rule-based language and so, translatable to policies or goals at lower levels of granularity. 1. Introduction This position paper outlines a technological solution to the general problem of empowering users to take actions related to environment sustainability, going beyond mere reminder systems or simply passive guidelines. Our position is that such a system can make a difference. Several systems have been proposed in the water and energy domain [1,2,5], in order to encourage prudent use of resources based on the idea of persuasive technology [3]. More generally, the idea is to develop systems which can autonomously
(i) quantify effects of actions and measure consequences (whenever measurable) – e.g., actions related to usage of resources such as water and energy, and CO2 emissions; such quantification can be in terms of low-level activities: for example, what is the cost of this handwash? How much of CO2 emissions will leaving this device running till I return from dinner cost me? etc
(ii) help users be aware of such effects and consequences, and then (iii) facilitate users adjusting their behaviour or attitude with respect to goals related to these
effects and consequences. The goals related to resource usage or CO2 emissions may be specified as policies at different levels, by users themselves, by the local council, the state government or even a national body. User goals might be shaped by policies from above. A system which can automatically map a high level national goal to goals tailored for individuals would help individuals make a difference.
1 Department of Computer Science and Computer Engineering, La Trobe University, Melbourne, Australia ([email protected]) 2 Center for Technology Infusion, La Trobe University, Melbourne, Australia ([email protected]) 3 Center for Technology Infusion, La Trobe University, Melbourne, Australia ([email protected])

2. Architecture Buildings blocks of technology is available for a system automating this process of taking high level goals and helping users “digest” and be influenced by these goals in daily life. We outline the key aspects and associated technologies of such a system, as follows:
• Fine-grained metering and monitoring: ideally, devices should be available to capture usage of resources at different outlets (e.g., for water, be able to monitor usage at different sinks or faucets) as well as usage of the entire home or floor or building, and perhaps, with some instrumentation, resource usage of particular individuals in the home.
The problem of labeling an instance of resource consumption (which we define as any distinguishable action or activity employing a countable measure of resources, often, but not necessarily, having an identifiable start and end time, e.g., opening a kitchen water faucet for a certain period, or switching on a lamp for certain time) with its particular time, place, actor (the user of the resource), and purpose is generally difficult though not impossible with adequate instrumentation for the user. Traditional metering is, hence, merely confined to units of resources used but more information about how and why resources are used will help computer automation of resource-control, as we discuss further below.
• Data processing and situation understanding: once resource usage can be tracked, one would need to process the data from such metering, either to translate processed data into appropriate visualization forms and various status displays to simply inform users, or more elaborately, to trigger particular persuasion strategies to influence users’ (or consumers’) behaviours and attitudes towards goals (which may encompass status displays, but more than that, also other persuasive messages or actions to take (e.g., reducing water flow in a long shower) according to persuasive techniques being employed), as we consider further below.
The system could also perform longer term analysis of metered data to determine usage trends over days, weeks, months or even years. Understanding situations of use of particular units of resources can help inform the system about what actions to take or messages to use at that instant. There has been tremendous amount of work in sensor-based inference of users’ context and situations [4], as well as inferring user’s current activities.4 Useful context here (with regards to water, say) include the identity of individuals, the location where water is being used, the time in which water is being used, the activity for which the water is being used and the urgency of the use, current water costs, user-specified cost/water usage goals, current water levels and current policies on water restrictions, all of which aggregates into situations of use, which can then be mapped to appropriate persuasive strategies and messages. For a given type of resource, models of what constitutes normal resource usage, wasteful usage, and conservative usage will be needed. Further finer demarcations than these three might be useful, or fuzzy categories.
• Action strategizing: Given an instance of resource consumption, a system will have rules
which could map the collection of (i) metered data, (ii) usage trend knowledge, (iii) 4 http://www.activity-based-computing.org/

computed effects of the resource consumed, (iv) policies (at home, community, state or national level) and associated goals, and (v) the inferred situations of use, to actions to regulate usage in that instance (possibly even identifying wastage or non-usage).
Actions can range from simply notifying users, i.e. displaying to users cost or water levels in a visual form, advice on water-saving for specific tasks, various forms of reinforcement messages, just-in-time prompts, social validation (e.g., where possible show the best water users in the home), adaptations (according to usage history or current needs), negotiation (e.g., to keep to a previously specified budget, the user can use more water this time but have less to use next time), recommendations of water saving devices, to taking action on behalf of the user (e.g., stopping water flow at certain times – if the user so authorises such pre-settings).
• Feedback and strategy revision: there is a cycle of monitoring resource usage and situations of use, adopting a course of action and a corresponding persuasion strategy, following the strategy, and then adjusting or revising strategies midway depending on detected changes in resource usage (e.g., due to users’ behavioural change). Such a cycle of processing is akin to the paradigm of knowledge-based intelligent agents [6], which runs in the “background”, as depicted in Figure 1.
Figure 1: Overall system behaviour – a cycle of sensing/monitoring resource usage, reasoning about the way the resource is used and acting
3. Conclusion The above system is under development and we plan to build a shell in the expert systems style which can be instantiated with different models of resource usage behaviour, persuasion strategies, action modules, and knowledge about what actions to take in different situations, to help manage the usage of a particular type of resource. Such a system can be interfaced to various resource monitoring devices and displays for persuasive messages. Resource-usage policies at the home, community, state or national level will be encoded in a formal rule-based language and so, translatable to policies or goals at lower levels. For example, a goal for water usage at the home level can be created based on a community policy. The system will then, while monitoring resource usage or computing its effects (e.g., greenhouse gas emissions), adopt various persuasion strategies and interact with the user to help meet this goal.

Thereafter, experiments with the system and usability evaluation in real settings will be done with users. There are issues related to producing and employing the necessary monitoring equipment for the systems we propose here, since that itself could lead to further energy consumption (which remains to be measured), and raise concerns about privacy. It is possible to only use monitored information for the purposes of providing advice to the user or prudent messages, but this implies careful safeguarding of gathered context information (indeed mechanisms to allow users themselves to regulate context information or protect privacy has been considered elsewhere, e.g., [7,8]) – not insurmountable but possible with existing policy-based solutions. In addition, while CO2 emissions might not be decisively quantified at this time, relative measures might be applicable and usable in our approach. Lastly, our solution relies on prudent persuasion rather than coercion, and so, it is possible for individuals to ignore the messages of our system – the role of our system is, hence, to empower, encourage, and facilitate those already desiring to make some difference. While this paper has proposed a technological solution, further social and cultural implications of our proposal remains to be explored. Acknowledgements. We thank anonymous referees for their valuable comments on this paper. 4. References [1] MCCALLEY, T., KAISER, F., MIDDEN, C.J.H., KESER, M., AND TEUNISSEN, M. Persuasive appliances: Goal priming and behavioural response to product-integrated energy feedback, PERSUASIVE 2006. LNCS 3962, New York, Springer Verlag, pp. 45-49, 2006. [2] BONANNI, L., ARROYO, E., LEE, C.-H., AND SELKER, T. Smart Sinks: Real-World Opportunities for Context-Aware Interaction, in CHI 2005, pp. 1232-1235. [3] FOGG, B.J. Persuasive Technology: Using Computers to Change What We Think and Do, Morgan Kaufman Publishers, 2003. [4] LOKE, S.W. Context-Aware Pervasive Systems: Architectures for a New Breed of Applications,"Auerbach Publications (CRC Press), 2007. [5] AL MAHMUD, A., DADLANI, P., MUBIN, O., SHAHID, S., MIDDEN, C.J.H., AND MORAN, O. iParrot: Towards Designing a Persuasive Agent for Energy Conservation, in de Kort et al. (eds), PERSUASIVE 2007, LNCS 4744, New York, Springer Verlay, pp. 64-67, 2007. [6] RUSSELL, S.J. AND NORVIG, P. Artificial Intelligence: a Modern Approach: Prentice-Hall, 1995. [7] HULL, R., KUMAR, B., LIEUWEN, D., PATEL-SCHNEIDER, P., SAHUGUET, A., VARADARAJAN, S., AND AVINASH VYAS, A. Enabling Context-Aware and Privacy-Conscious User Data Sharing. Proceedings of the IEEE Intl. Conf. on Mobile Data Management (MDM 2004), 2004. http://db.bell-labs.com/project/e-services-customization/privacy-conscious-data-mdm2004.pdf [8] HONG, J.I. An Architecture for Privacy-Sensitive Ubiquitous Computing. PhD Thesis, University of California at Berkeley, Computer Science Division, Berkeley, 2005. http://www.cs.cmu.edu/~jasonh/publications/jihdiss.pdf Biography Dr. Seng Loke is a Senior Lecturer at the Department of Computer Science and Computer Engineering, La Trobe University, Melbourne, Australia. He has authored and co-authored more than 170 research publications, and leads the Pervasive Computing Group at La Trobe. Prof. J. Singh is Director of the Center for Technology Infusion, at La Trobe University, Melbourne, Australia, and Research Professor. Dr. Hai Le is Research Fellow at the Center for Technology Infusion, at La Trobe University. The team, recently formed, works on cost-effective computing and engineering solutions to the important issues of environmental sustainability. The workshop will be highly useful as a forum for interacting with experts in other fields, and in creating a multidisciplinary understanding of the issues (and perhaps solutions) at hand.

Using persuasive technology to encourage sustainable behavior
Cees Midden, Teddy McCalley, Jaap Ham & Ruud Zaalberg Eindhoven University of Technology
The Netherlands [email protected]
AbstractIn this paper sustainable consumption is conceptualized as the result of various types of interactions between users and systems. We review attempts to promote sustainable behavior and discuss contributions by using persuasive technology. In particular, we focus on the appraisal of climate risks and interactive approaches to influence energy consumption in households.
1. Introduction The impact of human activity on the natural environment has severely affected the ecosystems on earth and in the long run might lead to serious threats to human life and civilization. The environmental impact of humans can be roughly assessed as a function of their numbers, their affluence, and the technology they currently use (cf. Ehrlich & Ehrlich, 1991). However, despite the fact that humans have used technology as long as they have consumed natural resources, technology as related to environmental resource use, is often set apart from the study of human behavior and resource conservation. This separation has hampered interventions to protect natural resources and constrain negative environmental impacts.
Various studies have shown that a purely technological approach to reduce energy consumption often leads to disappointing results due to changes in user behaviour, which have been described as rebound effects (Midden, Kaiser, McCalley, 2007). Also, resistance to new systems and negative experiences, for example due to faulty automation or lacking user friendliness, has frustrated the high hopes of innovative technologies. On the other hand, the effects of purely behavioral approaches have been very successful neither or mixed at best (e.g. Weenig & Midden, 1997). One of the main reasons for the lack of success is that most communication programs targeted the intentions of users, but largely ignored the technical context in which consumption choices actually occur. Basically, we view energy efficiency and conservation as the outcomes of multiple interactions between technological systems and human users. It follows that interventions that aim to influence consumption behaviour should be concentrating on guiding interactions between users and systems.
The linkage between technology and sustainable user behavior can be described by distinguishing four roles of technology: (1) as an intermediary, where the technology used for attaining a goal defines the ecological impact, although often surrounded by uncertainty; (2) as an amplifier, where technology amplifies the human potential to attain goals, but at the same time it amplifies the use of resources (3) as a determinant, wherebehavior is shaped and activated on the basis of the affordances, constraints and cues provided by the technological environment and (4) as a promoter, where technology is designed to influence behavioral choices (Midden, Kaiser & McCalley, 2007).

Although it would be worthwhile to consider each of these roles as a perspective to design persuasive interventions that enhance sustainable consumption, we will focus in this contribution on the fourth role of technology, that is the role of promoter.
2. Technology as promoter of sustainable behavior How can people be motivated to use scarce natural resources in a sustainable way? In the search for effective interventions we ask how persuasive technology can help to overcome some traditional limitations and make motivational strategies more powerful. We discuss this role of technology regarding two foremost challenges that policy-makers and psychologists face in combating the major environmental risks of CO2-emissions and climate change. First the use of media technologies is explored, to see how they can help enhance problem awareness. Second, we focus on interventions to change behavior and the ways technology can be used to make interventions more effective.
2.1. Using novel media to raise risk awareness
Since the 1970s, worldwide numerous mass-media campaigns have been used to raise concern for the threats to natural eco-systems and the urgency of action. Results have often been disappointing. Among the many issues that have been identified, attention and processing issues form an important part. Looking at attention rates, many mass-media appear not to be used by the general public. Traditional visual media such as television ads and video-clips have also been used to stimulate environmental awareness and conservation behavior. However, visual media are not more motivating per se for enhancing sustainable behavior, in spite of their easy access and less demanding processing (Weenig & Midden, 1997).
More advanced multimedia technologies may add persuasive impact to the traditional communication of transferring symbolic information (like text or speech) by inducing direct sensory experiences like sounds, images, scent and touch that create ’presence’, the feeling of ’being there' in a mediated environment (see for an overview IJsselsteijn, 2004). It may allow people to better conceptualize cause-effect relationships, such as how an urban area would look and feel like without car traffic or how the world would be after serious climate change. More recently, significant research efforts have been directed toward investigating the relation between ’presence’ and emotional impact (measured through, e.g., galvanic skin response or heart rate variability), where findings are supportive of the existence of such a relation, in particular in relation to fear-inducing media environments (Meehan, Razzaque, Whitton, & Brooks, 2003). Research in the domain of environmental risks has convincingly demonstrated the role of affect and emotion in risk perception (e.g., Slovic, Finucane, Peters, & McGregor, 2004,). Some experimental evidence is available which shows that video images with emotionally charged content stimulate attention for climate risks and coping options. The use of intrusive images and dramatic sounds to alert people were found to enhance relevant information processing for coping with these risks (Meijnders, Midden & Wilke, 2001). These studies suggest a new area of inquiry in which virtual environments can be used to offer new opportunities for technology assessment by giving people pre-experiences of future technology effects or newly planned environments and facilities, which will go beyond verbal descriptions or abstract representations. Ongoing work in the Netherlands focuses on the cognitive and motivational effects on coping behavior as a result of user experiences in a virtual polder environment, which is threatened by dike collapse (Zaalberg & Midden, in preparation). In sum, traditional media have had limited success in promoting environmental problem awareness, but new multimedia technologies show more promise in this endeavor by offering new opportunities for creating and enriching sensory experiences as a route to raising awareness of future and/or distant issues, to explore cause-effect relationships and to experience environments that are not directly observable. However, despite the

possibilities offered by multi-media technology, raising awareness will not be enough to fight climate risks and diminish the use of natural resources. In the next section we turn to the role of technology in accomplishing behavioral change.
2.2. Using Persuasive Technology to Promote Energy Conservation Behavior
Prior to the 1990’s, experiments using electronic devices indicated that they might contribute to the efficiency and effectiveness of behavioral interventions, but technology just wasn’t yet smart enough in most cases to make these devices very successful. Psychologists have as yet merely touched upon the opportunities offered by intelligent systems to promote (energy) conservation behavior. Most early work was done on the effects of feedback on energy consumption in the home. Studies often used simple procedures like written messages based on daily or weekly meter readings, while some researchers used electronic displays. Electronic modes of feedback have been proposed to solve a number of issues related to written modes. First, electronic means could provide feedback more quickly and frequently than written feedback, even continuously, thus making the consequences of specific behaviors better available for the consumer. Second, electronic feedback could be given at more central locations like the living room or the kitchen. Third, electronic feedback allows for the use of multiple standards (e.g., personal and social), reference points (e.g., financial costs per hour, the previous day or the upcoming month) and units (e.g., $ or emitted CO2). Fourth, written feedback provided with a high frequency has been quite effortful and costly. Automation could make the feedback process more efficient. Fifth, instead of the usual aggregated feedback at the household level, electronic feedback could be source-specific (e.g., the airco or the cooker), evidently creating a closer link between feedback and action (e.g. Wood & Newborough, 2003). In sum, electronic means have made it easy to provide highly frequent feedback, which is more effective. Electronic devices have also facilitated feedback on specific appliances, which appeared to be more effective than general feedback. Goal-setting, added to electronic feedback, enhanced energy savings. Almost all interventions were designed to communicate with subjects in a one-way direction. Modern intelligent systems enable two-way interaction between user and system, which allows for more precise targeting of tasks and for personalization. To illustrate, interactive systems allow for the implementation of more refined goal-setting procedures and the provision of more specific information, not only to specific appliances but to specific tasks as well. Interactive devices are still rare in the domain of (energy) conservation behavior. Some studies, however, illustrate the potential. The present authors observed in two earlier studies (e.g. McCalley, 2006) energy conservation results up to 20% using washing machines with a user interface that allowed for interactive goal-setting and outcome feedback. During a series of twenty washing tasks, users received immediate feedback each time they made a choice for a washing program to carry out a particular task. Subjects with either self-set or assigned goals saved more energy than subjects without an explicit goal.Applying intelligent agent technology that learns from the users and interactively communicates on a personal basis could enhance the power of supportive systems. We use the term agent to refer to a piece of software that can be considered as an autonomous creature able to perform tasks with more or less intelligence and autonomy. It can be made visible in many ways through virtual or physical forms of embodiment (e.g. Diesbach & Midgley, 2007). An agent system could be able to frame outcomes based on the current context or user, or to encourage the user to make certain goals more explicit, and even make suggestions on how to act or guide a user to a decision. In this role, intelligent agents may become persuasive social actors, rather than simple tools (e.g. Fogg, 2003). In a very recent study (Midden & Ham, 2008) demonstrated that social feedback from a physically embodied agent, an iCat (Philips company), resulted in significantly more energy conservation behavior on the same washing tasks than the factual feedback like provided in McCalley and Midden study.

3. Conclusion In this paper we discussed behavioral interventions on enhancing sustainability with a focus on human-technology interactions. Four roles of technology have been suggested and the role of promoter of sustainable behavior has been explored in greater detail. Our review reveals that persuasive technology has much to contribute to the design of effective motivational interventions. It helps to raise awareness of future or distant issues, such as the vast melting of polar ice, or to lower thresholds for change, for example by making it possible to experience a building not yet constructed or to explore cause-and-effect relationships such as the effects of ventilation on air circulation in the home. Technological assistance may go beyond the level of specific appliances or systems and direct energy use. For example, the application of computer and robot technologies to domestic appliances) will be able to monitor multiple sources of energy use and support home energy management. Such systems will offer advice on saving options taking account of personal lifestyles and will even be able to support strategic decisions like investments in equipment and home renovation. Sustainability requires joint efforts in various social groupings (e.g. household, neighborhood). Persuasive systems may also be able to touch this social dimension of sustainable behavior for example by coordinating contributions.Interventions that aspire to integrate psychological with technological means form a challenging perspective. We believe, however, this effort to be most worthwhile on the route to a society that makes sustainable use of its natural resources.
4. References Diesbach, P.L. & Midgley, D.F. (2007) Embodied Agents on a website: Modelling an Attitudinal Route of Influence. In: deKort, Y.Ijsselsteijn, W., Midden, C.J.H., Eggen, B, & Fogg, B.J. Persuasive Technology, Ehrlich, P. R., & Ehrlich, A. H. (1991). Healing the planet. New York: Addison-Wesley. Fogg, B. J. (2003). Persuasive technology. Amsterdam: Morgan Kaufmann Publishers. Meehan, M., Razzaque, S., Whitton, M.C., & Brooks, F.P. (2003). Effect of latency on presence in stressful virtual environments.Proceedings of IEEE Virtual Reality 2003, Los Angeles, California, 141-148. McCalley, L. T. (2006). From motivation and cognition theories to everyday applications and back again: The case of product-integrated information and feedback, Energy Policy, 34, 129-137. Meijnders, A. L., Midden, C. J. H., & Wilke, H. A. M. (2001a). Communications about environmental risks and risk reducing behavior: The impact of fear on information processing. JASP, 31, 754-777. Midden, C.J.H., Kaiser, F.G., and L McCalley, L.T. (2007) Technology’s Four Roles in Understanding Individuals’ Conservation ofNatural Resources. Journal of Social Issues, Vol. 63, No. 1, 2007, pp. 155—174. Midden, C.J.H. & Ham, J.R.C.(2008) The persuasive effects of positive and negative social feedback from an embodied agent on energy conservation behavior. Unpublished manuscript. Eindhoven |University of Technology. Slovic, P., Finucane, M.L., Peters, E., & MacGregor, D.G. (2004). Risk as analysis and risk as feelings: some thoughts about affect,reason, risk and rationality. Risk Analysis, 24, 311-322. Weenig, M. H., & Midden, C. J. H. (1997). Mass media information campaign and knowledge gap effects. Journal of Applied Social Psychology, 27, 11, 945 – 958. Wood, G., & Newborough, M. (2003). Dynamic energy-consumption indicators for domestic appliances: Environment, behaviour and design. Energy and Buildings, 35, 821-841. IJsselsteijn, W. (2004). Presence. Doctoral dissertation, Eindhoven University of Technology, Department of Human-Technology Interaction, the Netherlands. Zaalberg, R. & Midden, C.J.H. Adaptation and prevention. Real and Virtual Experiences with river flooding in the Netherlands. In preparation. About the authors: Cees Midden is professor of Human Technology Interaction and chair of the Human-Technology Interaction group at Eindhoven University of Technology, Netherland. His research focus is on the social-cognitive factors of human-technology interactions. He published various books and articles on environmental consumer behaviour, on persuasive communication and the perception and communicationof technological risks. In 2006 he chaired the first International Conference on Persuasive Technology. Teddy McCalley is an assistant professor of psychology at TU/e. Jaap Ham is an assistant professor of social psychology at TU/e. Ruud Zaalberg is a social psychologist. He is currently working as a postdoct at TU/e University of Technology. Motivation to participate:Using persuasive technology to promote sustainable behavior is at the center of my research interest. I hope this workshop will learn me about relevant related work and I hope to meet colleagues who are also involved in this fascinating area.

Participate: Producing A Mass Scale Environmental Campaignfor Pervasive Technology
Mark Paxton1
Mixed Reality Lab, University of NottinghamJubilee Campus, Wollaton Road, Nottingham, NG8 1BB, England
{mcp}@cs.nott.ac.ukhttp://www.mrl.nottingham.ac.uk
The Participate2 project is exploring how pervasive computing can supportfuture mass scale environmental campaigns in which the public upload andaccess information about their local environments and engage in reflection,discussion and debate. We introduce the idea of ‘three layer participation’ inwhich members of the public collaborate with broadcasters, networks of schoolsand other organisations as part of a multi-faceted campaign. In the first phaseof the project, we have conducted three exploratory trials focusing on schools,visitors to Kew Gardens in London, and members of the public playing apervasive game on mobile phones. Based on our experiences in these trials weoutline the research challenges to be addressed in the second part of the projectand that define an agenda for supporting future participatory campaigns.
1. Introduction
At the turn of the 21st century we have become engaged in a global debate concerning the nature andimpact of climate change and our role as individuals, societies and indeed a global community inmanaging our environment. In order to pursue this debate we must address three key challenges. Weneed to gather information about the environment on a greater scale than ever before, we need toinform the debate by conveying environmental knowledge in new ways, and ultimately, we will alsoneed to persuade people to change their behaviours.
We believe that pervasive computing can ultimately engage millions of people in mass participationenvironmental campaigns, raising awareness of environmental issues, supporting education, activismand democracy, and delivering environmental data on a scale never before possible.
1 and Amanda Oldroyd (BT), Andy Gower (BT), Adrian Woolard (BBC), Nick Tandavanitj (Blast Theory), Steve Benford(University of Nottingham), Danae Stanton Fraser (University of Bath), David Crellin (Sciencescope), Richard Harper(Microsoft Research Cambridge)2 See www.participate-online.org for information about the project including recent papers

2. The Participate Project
Participate is a UK project to explore the potential of pervasive computing to support massparticipation environmental campaigns. The project brings together a consortium of industry andacademic partners to collectively explore how the convergence of mobile, online and broadcast mediacan enable a broad cross-section of the public to contribute to, as well as access, environmentalinformation – on the move, in public places, at school and at home. The partners and their respectiveinterests are: BT (telecommunications), The BBC (broadcasting), Microsoft Research (computing),ScienceScope (sensors and dataloggers), Blast Theory (artists), The Mixed Reality Laboratory at theUniversity of Nottingham (pervasive computing) and the School of Psychology at the University ofBath (learning technologies).
Inspired by a history of television led ‘big science’ projects in the UK, such as the BBC’s annualSpringwatch campaign [1], Participate is exploring a generalised ‘three layer’ approach to participationas shown in figure 1.
� The public – individuals and families – establish a general background picture of ‘quality oflife’ factors across the country.
� Schools and local-groups carry out focused investigations of particular localities, drillingdown into the background data in more detail using more specialised sensors and dataloggers.
� Experts working with broadcasters drive and shape the overall campaign, assimilatinginformation and feeding it back.
Participate began in January 2006, and at the time of writing (January 2008) has just reached thebeginning of its final year. The initial eighteen months of the project involved designing, deployingand studying three focused trial experiences to test initial ideas and technologies; the schools trial, thecommunity trial and the public trial. The schools trial brought together different schools in a series ofmulti-study technology-supported science activities. The community trial involved visitors to KewGardens engaging with interactive posters and large displays and making and sharing their own videodocumentaries. The public trial involved creating a context-aware game for mobile phones called Prof.
public – families &individuals
schools &local groups
experts
public – families &individuals
schools &local groups
experts
public – families &individuals
schools &local groups
experts
National TVbroadcast &
online
Regional/localbroadcast &
online
Onlineservices,events,visitor
centres etc.
Onlineservices
Mobile, locationbased upload,
online & games
Mobile, locationbased upload,
online &games
Figure 1: Three layers of Participation

Tanda’s Guess A Ware that attempted to build a picture of the player’s environmental behaviour over aperiod of several weeks, inviting them to reflect on or even change their daily routines. The trialsexplored different contexts and approaches to participation across our different layers, and their resultsare now being fed into the design and development of a final integrated large-scale public campaignthat will take place across the UK in the Summer of 2008.
3. A Research Agenda for Mass Participation Campaigns
Our initial experiences in the schools, community and public trials have informed an emerging researchagenda for the second half of Participate and we hope for future research into mass participationcampaigns in general. This agenda includes the following research issues.
Reflection, feedback and personalisation: The next major challenge is to encourage participants toreflect on the data gathered and on their own environmental behaviour. How can environmentalinformation best be summarised and presented back to participants in different contexts? How canparticipants understand their own information within an aggregated whole? How can we portrayhistorical information? And what are the roles of broadcast and online channels in this?
The role of pervasive play in persuasion: Do such games such as ‘Prof Tanda’ have a special role toplay in actively shaping behaviour? Can they engage new audiences who may not respond totraditional challenges? How and when can we best interrupt people? What level of contextualknowledge is required if such games are to be effective?
Digital rights and digital footprints: Our experience in the schools trial shows that the reuse andpublication of gathered information can be a complex and tricky issue, especially with regards to therecorded movements of children. How do rights issues affect people’s motivation to participate? Isthere an appropriate framework for negotiating the reuse of information, both in original andaggregated forms, that can be understood by individuals and yet is flexible enough to serve the needs ofmultiple regulatory needs, including those of schools and broadcasters? What are appropriate technicalpoints of control within a system, specifically are peer-to-peer or centralised approaches moreappropriate?
Human-sensor dialogue: The nature of interaction between humans and sensing systems is anongoing topic of research within HCI (for example [2]). Participate raises new questions here,especially concerning the integration of mobile and fixed sensors. Building on the schools trial, howcan we extend mobile sensors to compare individuals’ experiences of and interactions with anenvironment? Conversely, how can sensors that are fixed in the environment engage passers by,providing them with location specific information or encourage them to annotate sensors readings withqualitative information such as images of the local context?
Technologies, channels, preferences and modes of participation: Given that there are varioustechnological means of participating in an environmental campaign, what is the relationship betweentechnology type and participant type?

4. Conclusion
In conclusion, we believe that pervasive computing has a key role to play in helping informenvironmental debate and supporting people in reflecting on and even changing their behaviours.Participate has brought together a unique consortium of industrial and academic partners to explore thistopic, developing new approaches and technologies and also defining the research agenda for futuremass scale environmental campaigns. This paper has articulated some key research challenges thathave emerged from our initial forays into this territory. The second phase of the project will involveexploring these within the context of a final integrated large-scale trial.
5. Acknowledgements
We gratefully acknowledge the support of the UK’s Engineering and Physical Sciences ResearchCouncil (EPSRC) and Technology Strategy Board for funding this work. We would also like to thankthe many researchers who have contributed to Participate and also our external partners Kew Gardensand all the schools, teachers and pupils who have taken part in this research.
6. About the Authors
Mark Paxton is a researcher and PhD student at the Mixed Reality Lab at the University ofNottingham. His background is in Electronic and Computer Engineering, and research interestsexplore human-sensor dialogue. His involvement with the Participate project relates primarily aroundthe use of environmental sensors and datalogging equipment in educational contexts, and his previouswork has investigated educational use of mobile phones in schools and e-science techniques for thestudy of the environment in schools.
7. Workshop Aims
We would like to share our experiences from the three trials in the initial stage of Participate withfellow researchers in environmentally engaged areas of pervasive and persuasive computing,participatory sensing and HCI. We would welcome the opportunity discuss the Participate project andour ongoing work with other workshop participants. We would also like to pursue opportunities toexpose the platforms and methods we have developed to a wider audience with a view to possiblefuture collaborations.
8. References
[1] BBC Springwatch, http://www.bbc.co.uk/nature/animals/springwatch/index.shtml[2] BELLOTTI, V., BACK, M., EDWARDS, W. K., GRINTER, R. E., HENDERSON, A. AND
LOPES, C, Making Sense of Sensing Systems: Five Questions for Designers and Researchers,Proc. CHI 2002, CHI Letters, 1 (1), 415-422, Minneapolis, USA, 20-25 April, 2002, ACM.

THE DESIGN OF IMPRINT: “WALK THE WALK” AND OTHER LESSONS
Zachary Pousman, Hafez Rouzati, Katie Collins, John Stasko
BiographyZachary Pousman is a PhD student in Human-Centered Computing at Georgia Tech. He works in the Information Interfaces lab, headed by John Stasko. Zach's research centers around casual information visualization, infovis systems for everyday people dealing with the volumes of information that they generate and encounter. Zach has a Masters of Science in HCI from Georgia Tech and a B.A. in Philosophy from the University of Chicago.
AbstractWe introduce Imprint, a casual information visualization system that showcases data extracted from a printer queue. The system filters and aggregates data including layout information, text, and images, and displays interactive visualizations on a large touch-screen display mounted above the physical printers that serve a small community. Imprint’s visualizations depict environmental issues, such as energy consumption and paper consumption of the printers, as well as social information, such as popular concepts from the printed matter. Imprint is intended to spark reflection and conversation, and to bring data into discussions about paper usage,“waste,” and extrapolation. The goal is not to explicitly reduce paper, energy, or toner usage, but instead to open some of the very questions that might, for example, cleanly delineate what counts as waste when it comes to the printers as they are being used by the community. We note an emerging list of design strategies that have helped us to explore these issues. The first we term “eating the dog food,” or walking the walk—when a visualization brings up environmental impact data it must also disclose how much environmental impact the system itself produces as it operates. Others may follow, including the use of defamiliarization, and the use of social particulars in visualizations.
1. IntroductionThe modern world is full of traces, ways in which human activity, either individual or aggregate, leaves behind some residue or trace. These traces are often invisible, untracked and unexamined. But like Bowker [2], Star [9], and others who research how infrastructure is understood and made visible, we seek to make these often invisible traces visible for the community. In doing so, we hope to draw a community’s attention to the ways that infrastructure shapes its understanding of the world and of itself, and to draw the community into reflection, contemplation, and conversation. Imprint is a system that monitors a printer or group of printers and creates simple interactive visualizations of the datastream that passes to the printer(s). Imprint shows casual information visualizations [7] on a large touch screen above the printers that it monitors. Imprint visualizations depict either social information, information about which members of the community are printing, and what concepts are popular, in addition to environmental information, information about how much paper, toner, and energy are being used as individuals print their documents.

Our design goals with the system are twofold. First, we seek to create a conversation piece and to foster novel reflections on the datastream of printer traffic. We are not attempting to modify the behavior of members of the community; we do not want to build a system that bullies, badgers, cajoles or shames community members into changing their behaviors (i.e., into printing fewer pages). This kind of intervention, even if it were achievable, might not cause long-lasting behavior change, but instead might cause users to “route around” the Imprint monitoring system by, for example, printing more at home. This is exactly why we designed imprint to be intentionally vague in its presentations (see figures below). Our second design goal is make Imprint provocative enough to elicit suggestions and comments from community members for new visual depictions and visualizations. Our hope is to design the system to be a framework through which community members can ask new and better questions about this data set.
2.Related WorkWe take inspiration from Gaver et al.’s Home Health Horoscope [4] and the general approach to designing for ludic engagement. Ludic engagement is a design strategy for engaging the playful parts of human life, as opposed to targeting the task-centric and analytically solvable parts of human life (which is the implicit focus of much technological intervention) [3]. From here we take inspiration not to “solve” wasted printer pages, and instead to engage a workgroup or community in playful reflection.We note prior examples of systems that display environmental impacts and traces to occupants of work spaces. Holmes’ 7000 oaks and counting is an ambient display and casual infovis system that reads building automation data to determine a real time carbon footprint of a building [5]. Jeremijenko’s Stump creates visual tree rings as coversheets instead of the usual coversheet metadata [6]. The coversheets could be stacked to form a stump made from wasted paper.
3. System Architecture and Interaction3.1 System DetailsImprint is built of three main components: a modified print server, a data store, and the visualization front end. Imprint’s backend is built on a Mac OS X server, which runs the Common Unix Printing System (CUPS), which has a modified backend to retain print job files. Imprint processes print job files and passes them to an Apple Core Data store. The Core Data store serves raw visualization data to a second computer which builds and displays the visualizations. Touch screen input is provided by a Smart Technologies overlay. We log interaction data from Imprint in a SQLite database.3.2 User InteractionsWe are still constructing the interactive capabilities of Imprint. Imprint displays simple visualizations in a slideshow presentation, each slide appearing for a period of 30 seconds, before moving to the next slide. In this way, we can show multiple perspectives on the printer data, with individual visualizations focusing on individual aspects of the data. Users may select large next and back buttons to move to different slides.Users may also filter and query the dataset in each slide by activating a dynamic query slider. Dynamic query sliders allow users to create complicated queries of a dataset with ease, since they are an extension of the normal scroller/slider control found in many applications and systems [8]. The dynamic query slider allows users to modify the date range of the visualization.

Figure 1a: The Timing is Everything display. Stripmap on the left shows 3 weeks of data of printer activity (idle, one-sided documents, two-sided documents). The bar graph in the center shows aggregate data, with prices. Figure 1b. The Work versus Play display. An aggregate count of documents that included the word “work” are compared with those that include the word “play.” This ratio is represented by the gray vs bar. Random sub-images from images in work and play documents appear in their respective areas.
4. Design Strategies4.1 Walking the WalkImprint brings up environmental concerns by creating visualizations of energy consumption, paper usage, and toner usage. As such, Imprint must be sensitive to these concerns and issues. And it should do so in a public manner, where users (and even passers by) can see how seriously the designers have internalized these concerns. Imprint includes a slide view that states how much energy the system itself has required to run. It totals the sum of the energy to power the display, the display computer, and the server. We also calculate the dollar value of this electricity and display that as well. In this way, we are not just talking the talk of environmental impact (and the traces left by our actions), but also walking the walk.Walking the walk confers three main benefits: it lends credibility to the system and to the designers, it preempts potential questions, and it may be a spark for further reflection. Walking the walk lends credibility to the system because it looks at the same issue (energy consumption) from another perspective inside the same system. Putting our energy consumption out for all to see conveys that we are not embarrassed by it (it is just data), and that, in some sense we are not judging others (or at the very least not judging others more than we judge ourselves). Walking the walk can preempt user questions about the work, since it serves a function of being part of the “full disclosure” of the system. Lastly, the visualization of our own energy consumption can serve as a spark for reflection by users, especially since it can be compared to the core datastream. Users can use the amount of energy used by the system to compare against the total amount of energy used to power the printers themselves.4.2 DefamiliarizationWe are exploring with our visualizations some of the notions of defamiliarization [1]. Defamiliarization is a design strategy that appears in much of art, where the normal way of seeing or understanding some topic can be challenged by showing the object or topic from a novel perspective. Removing the printers from their normal everyday role and making the words printed each day the focus of visualizations helps to remove them from the everyday experience

(printing, reading) and to find new ways in which they make sense (as art objects, as part of a community of concepts).4.3 Sensitivity to social particularsImprint is designed, in its current iteration, for a particular kind of community, and in fact a particular community. It is heavily customized for our own HCI community at Georgia Tech. Visualizations of academic communities have particular attributes that we seek to highlight with our visualizations. One salient one is that members often print the names of other members in the community (in references sections and elsewhere). Another particular we emphasize with our visualizations are implicit or explicit tensions that may be at play in the community. Some researchers at Georgia Tech are more interested in work tasks while others concern themselves with play (there is even a lab group called “Work2Play”). These identities and opposition words also become visible in the visualizations.
5. Concluding ThoughtsWe are really just beginning to explore deeply both the topic of environmentalism and the attendant ways that system design must change to accommodate this domain. Our first stake in the ground has been to “walk the walk” by creating a simple visualization that publicly announces the amount of energy used by our system. Our current work is a deployment on our own floor, a floor of an academic research building at Georgia Institute of Technology. Our plan is to measure the effects of the intervention, both in qualitative and quantitative ways, using a mixed methods approach. Our aim is to determine the degree to which members of our workgroup interact with the system, use it as fodder for conversation, and, perhaps, modify their behaviors. By the time of the conference, we may be able to report on preliminary results.
6. References1. Bell, G., Blythe, M., and Sengers, P. Making by making strange: Defamiliarization and the
design of domestic technologies. ACM Trans. Computer Human Interaction. 2005 (ToCHI 2005). 149-173.
2. Bowker, G. 1994. Information Mythology: The World As/Of Information. In Bud-Frierman (ed), Information Acumen: The Understanding and Use of Knowledge in Modern Business, 231-247.
3. Gaver, W., Bowers, J., Boucher, A., Gellerson, H., Pennington, S., Schmidt, A., Steed, A., Villars, N., and Walker, B. The drift table: designing for ludic engagement. Proceedings of CHI, extended abstracts, 2004.
4. Gaver, W. and Sengers, P. Enhancing Ubiquitous Computing with User Interpretation: FieldTesting the Home Health Horoscope. Proceedings of CHI 2007.
5. Holmes, T. G. Eco-visualization: combining art and technology to reduce energy consumption. 2007. 153-162.
6. Jeremijenko, N. Stump. 1999. Shown at: http://onetrees.org/stump/index.html7. Pousman, Z., Stasko, J., and Mateas, M. Casual Information Visualization: Depictions of
Data in Everyday Life. Proceedings of IEEE Conference on Information Visualization (Infovis 2007).
8. Schneiderman, B. Dynamic Queries for Visual Information Seeking. IEEE Software. 1994. 70-77.
9. Star, S. L. The Ethnography of Infrastructure. American Behavioral Scientist. 1999. 377-391.
Understanding and influencing spatio-temporal visitor movement in national parks based on static and dynamic
sensor data
Katja Schechtner, Helmut Schrom-Feiertag arsenal research
Giefinggasse 2, 1210 Vienna [email protected] [email protected]
www.arsenal.ac.at
Within large urban agglomerations national parks play an important role in the daily life of the citizens: apart from influencing the local climate they are major areas for recreation. National park operators strive to balance the needs of individual visitors with the needs of wildlife and plants and find a way to motivate people to respect restricted areas. A current project in Vienna aims at influencing the movement patterns of visitors by offering user centered information that takes into account the spatiotemporal behavior of the other visitors and the national parks infrastructure information. The spatiotemporal behavior is collected via a variety of sensors including GPS enabled PDAs, which also function as guiding devices.
1. Management of National parks: balancing recreation vs. protection needs
Within large urban agglomerations parks play an important role in the daily life of the citizens: apart from influencing the local climate they are major areas for recreation. There are a quite a large number of cities where national parks or biosphere parks are part of a city or close to its borders, e.g. Vienna, Austria, Sydney Australia or the 2014 Olympic host city Sochi, Russia. The wider Viennese urban area has about 2.5 million inhabitants and two national parks in the vicinity. Sydney has about 4.1 million inhabitants, who can reach more than five national parks for a day trip. The Sochi National park is located in the mountains that surround a city of 390.000 inhabitants. In conjunction with the upcoming Olympic Games and the impact of the expected increase in tourism it is currently discussed how the national park can be protected.
One of the major questions the national parks face is: how to protect the nature, while at the same time offering access for as many people as possible? For the operators of national parks it is of utmost importance to balance the needs of individual visitors with the needs of wildlife and plants and find a way to motivate people to respect restricted areas. Therefore national parks and their visitors need information about each other in order to offer, plan and enjoy visits, while at the same time protecting the nature.

Based on these needs a research project in Vienna currently examines the movement patterns of national park visitors with a variety of sensors and methods. The idea behind the project is to get an overall picture of the visitor movement (based on historic and real time data), associate the movement data with infrastructure information of the park has (e.g. sensible spots, spots to see special flowers and plants, etc) and influence visitor movement with regard to nature protection issues. To influence the visitors they will receive two different sets of information when entering the park: either a more general information on where to go and what to visit – based on historic data – or real time information tailored to their interest via a GPS enabled PDA. The ultimate goal is to significantly influence the distribution of visitors within the national park, thus distributing the stress for the nature more evenly, while at the same time protecting special areas.
2. Collecting, predicting and influencing spatio-temporal movement
Three different research institutes cooperate with two national parks to make sure that the developed technology fits the user needs of the park operators and the park visitors alike. The research teams focus on the further development of a GPS/GALILEO based mobile guide, useful visualisation methods, the development of a robust pedestrian analysis and prediction model and a concept for sustainable recreation planning, while two National Parks do not only offer different test sites, but also bring their expert view on typical visitors requests, as well as national park operator requirements specification for the analysis and prediction tool to the project.
In order to gain knowledge over the spatial and temporal distribution of national park visitors and their individual behaviour observations are made by the use of surveys, travel reports and pervasive sensors such as light barriers, video systems, pressure, heat or infrared sensors that are installed at specific points along the route network. However these methods gain only low resolution and low entropy information about a persons` spatio-temporal behaviour.
The only way to collect the individual movements in a sufficient quality is by the use of GPS enabled devices. First attempts to use GPS as monitoring technology for park visitors for spatiotemporal analysis and modelling showed the possible high practical impact for park management. 1 2
Therefore the national park visitors are equipped with a GPS receiver and the GPS tracks are collected on a central server for further analysis. In order to convince national park visitors to use such a GPS device we follow a two tier strategy: on the one hand an easy to use GPS enabled mobile guide is developed,
1 Arrowsmith, C. and Chhetri, P., 2003, Port Campbell National Park: Patterns of Use A report for the development of visitor typology
as input to a generic model of visitor movements and patterns of use. Department of Geospatial Science, RMIT University,
Melbourne, Victoria 2 Morris, S., Gimblett, R., and Barnard,K., 2005, Probabilistic Travel Modeling using GPS Data. International Congress on
Simulation and Modeling, Melbourne, Australia, Dec 2005.

which offers location and time based information to the visitors while at the same time tracking their routes. (see Fig. 1) On the other hand visitors act as mobile “measurement units” through the usage of the mobile guide and provide GPS position data with high resolution. This tracking information is anonymously transferred to the analysis and prediction tool, which delivers easy to use information for the national park management about the spatiotemporal visitor behaviour on an aggregated manner (e.g. preferred routes, travel length, duration, stops, etc.). (see Fig. 2)
At the same time the prediction tool feeds back information to the visitor and offers routes according to the visitor’s preferences, e.g. sending her to an area less crowded, which still offers the spots (flowers, animals) he wants to see most. Moreover the visitor can assess his own collected information via an online diary that shows his route and spatial information along this route together with pictures or audio files he has collected during his visit.
Fig. 1. Benefit for the visitor by using the GPS enabled guide.
Fig. 2. Benefit for the national park operators based on the collected GPS data

2.1. Data collection, analysis and visualisation
As it cannot be assumed that all visitors will use a mobile guide, additional people counting techniques at entrances and fixed locations complement the satellite based measurements. To analyse the GPS data it is pre processed with outlier detection and map matching methods. Afterwards several analysis algorithms are applied to discover the required information such as preferred routes, travel length and duration, stops and duration and visitor frequencies at certain route segments. Different information is combined to understand the spatiotemporal behaviour of the visitors: e.g. by comparing the stop analyses results with the geo referenced places of interest the popularity of certain areas in the park is measured and by analysing the adjoining route segment the popularity of specific tours can be derived. The information is fed into a spatiotemporal analysis tool that enables the park management to examine the acceptance rate of thematic routes and places of interest and revise the routing strategy if necessary. The national park operators can make spatial and temporal restrictions and will get the spatial visitor distribution in the centre map containing the path network showing the visitor frequencies of the individual path segments and at the entrances. Also the frequencies at places of interest and analysed stopping areas can be displayed. So it is possible to determine popular places and the attractiveness of them over time and with regard to the current visitor groups. Typical analyses are trip length and duration, stop duration, speed distribution and number of visited places.
2.2. Movement prediction, information feedback and validation
The GPS position and counting data sets are combined with the actual meteorological data (actually the even more complex parameter of the “felt temperature” is included into the model) and provide the basis for prediction models, where future visitor counts and routes are estimated. On the basis of large long term data sets a reliable prediction tool will deliver planning information to the park management taking into account actual weather conditions and seasonal dependencies. The model is currently developed and will be implemented until autumn 2008.
The models will be used by the national park management to create new routes and offer real time information and dynamic route changes to visitors who rent a GPS enabled PDA.
3. Conclusion
The general idea behind the described project was to turn the data that is collected via sensor network into valuable information that can be used to influence people’s behaviour. A crucial point was to find a method to motivate people to share their movement patterns with the national park management and understand how they will benefit from the information that is fed back to them. This has worked surprisingly well: 245 people used the GPS enabled PDAs during a test time of two days – even though no real time information about the park could be provided.

The first part of the project has focused on evaluating and implementing data acquisition methods and developing analysis algorithms. Currently the prediction model is improved, benefiting from the constant stream of counting data. However more and constant GPS data is needed to evaluate the prediction accuracy of the model. In the second test phase the individual spatio-temporal motion behavior will be closely monitored in order to analyse the willingness of the visitors to follow the suggested routes.
4. Motivation for Participation in the Workshop
While more sensors deliver an abundance of data about the environment which can be used for a multitude of different control and guiding measures it is not clear yet how to balance the needs of the individual with the needs of a community or a society. The typical problem in transport lies in car navigation where it has to be decided whether to integrate all possible streets into the maps or whether to keep some of them hidden in order to protect residential areas from through traffic or to make sure emergency services find less frequented routes.
In the described project in Vienna the aim is to give national park operators the possibility to get insight into their visitor’s spatio-temporal motion behavior with the ultimate aim to influence their route choice. At the same time visitors make their personal data (GPS tracks, interest profile) available to the national park operators because they benefit from individual route information tailored to their interest profile. At the same time the users do know that in order to protect the nature they will not be guided to completely off – beaten tracks. It is part of the project to analyse the willingness of the visitors to balance their individual benefit against the benefit of the society.
This aspect of balancing needs and information and the willingness to alter behavior I would like to discuss in a workshop that aims at employing pervasive computing to protect the urban atmosphere.
5. Biography
Katja Schechtner is the head of Human Centered Mobility Technologies at arsenal research. Her team focuses on capturing, analyzing and simulating human mobility behavior. She has studied architecture and urban planning at the Technical University of Vienna, Austria (2001) and Columbia University, NYC, USA. She also holds an MSc in economics and communication from the DUK, Austria (2004). Currently she is finishing her PhD in Urban Planning at the TU Vienna, Austria and the ETH Zürich, Switzerland with her thesis about “Ambient Urban Intelligence”. She has worked as an urban planner in The Netherlands, Ireland and as a senior consultant in urban planning and transport telematics in Japan.

TerraPed: A Design Concept for Sustainability
Jennifer Stein Media Arts and Practice, School of Cinematic Arts
University of Southern California 850 W. 34th Street, LUC 310 Los Angeles, CA 90089-2211
Abstract TerraPed is a design concept for an emergent, data-driven online world that is dependent on the ecological impact of humans in the physical world. This project has been conceptualized as a resource and tool to encourage a shared understanding of human impact on the earth by offering a visualization of that impact. Though standard ecological and carbon footprint assessments are helpful in communicating one’s personal impact, these surveys do not encourage continuous monitoring or change to one’s habits. TerraPed offers an engaging and informative platform for informing and motivating users to take action and change behaviors that threaten the sustainability earth’s resources. 1. TerraPed Overview TerraPed is an interactive, online community that emerges from real-world data and encourages its inhabitants to consider their ecological impact on the environment. This project measures the ecological and carbon footprint of each user and visualizes this impact in the form of a dynamic footprint graphic. Each inhabitant’s footprint is in constant flux and is impacted by a live stream of data from an RSS news feed, location-specific air quality sensor data and the changes in lifestyle made by each inhabitant. Inhabitants are encouraged to: a) make lifestyle changes to limit the amount of resources they use; b) submit photos of themselves taking steps towards a more sustainable lifestyle, such as recycling, taking public transportation, or using alternative energy such as solar or wind power; c) engage daily and interact with current news and policy worldwide; d) motivate social interaction and participation to employ a collective intelligence towards positive environmental change. Because those who are already concerned with environmental issues would most likely adopt a project of this nature, the main goal would be to engage people who wouldn’t ordinarily interact with such issues. Therefore, an example of an ideal audience for this project is school children between the ages of 5-12 as part of their daily curriculum. The children would be encouraged to participate with their parents at home, introducing both children and adults to important environmental concerns and encourage changes throughout the entire family.

Additional functions and applications would be built into TerraPed after the initial implementation of the online component. These additional components would encourage use by a broader audience and include a mobile phone application for real-time monitoring of one’s footprint, as well as a Facebook Footprint widget. The Facebook widget would encourage a larger audience to participate in the TerraPed community, as well as add an element of social and environmental consciousness to Facebook. 1.1. The TerraPed Experience
The TerraPed experience begins with a simple registration, in which users are asked to create a username and password, and to provide their zip code. The username and password is used to access personal footprint information and the zip code is used to provide location-specific information and suggestions about local resources. After a user registers, they are asked to complete an Ecological and Carbon Footprint Survey. This survey integrates the basic questions of both types of standard surveys and provides the users with calculations represented numerically, as well as in the form of a footprint. They will also receive an image of an ideal footprint and a representation of the national average for others in their country of residence. This footprint is placed onto the emergent planet in the center of the main page. As more users register, all will populate the planet with a variety of footprints viewable. Personal footprint information is accessible only to individual users, unless each user specifies open access to their social network. Once a user’s footprint is established, inhabitants are encouraged to make lifestyle changes towards a more sustainable existence, as well as find a balance between personal impact within their control and external impact beyond their control. The ultimate goal is to reduce the size of their footprint to the ideal sustainable size determined for their country of residence. For example, the ideal human footprint for the US is 4.5 acres of land for each person, but the a average footprint is 24 acres of land and 7.5 tone of carbon dioxide. If one’s footprint were determined to equal 14 acres of the earth’s resources and 5 tons of carbon emissions, their goal would be to take steps towards reducing their footprint and CO2 emissions to 4.5 acres and zero tons of carbon in the US. All changes to individual footprints are visualized by a change in size and color, as shown in Figure 1.2.3. These changes occur based on personal impacts, air quality sensor data and a RSS news feed related to climate change and environmental issues. Personal impact is measured by the lifestyle habits outlined in the footprint survey as well as through a shared photo stream of inhabitants take steps towards sustainability. This shared photo stream encourages users to take photos of them recycling or taking public transportation, and invites other users to vote for and comment on the impact of others actions, adding a social element to promote participation and shared ideas. The idea of creating a social and informational network for environmental sustainability is consistent throughout TerraPed, and acts to motivate its users to take action.

1.2. Graphic
Figure 1.2.1 Main page
Figure 1.2.2 Social Network page Figure 1.2.3 Data-driven changes to footprint

Figure 1.2.4 Results page Figure 1.2.5 Footprint Update page
2. Summary TerraPed’s main goal is to educate people about their impact on the environment and motivate them to take action. This includes making lifestyle changes such as decreasing the amount of carbon they create or the amount of energy they use, while making people aware of the consequences of where their food is grown, how much waste they create, and what they can do to change these habits. By offering a dynamic visualization of one’s personal ecological and carbon footprint, along with a social platform to share ideas and information, TerraPed presents a new way to engage people with issues of climate change and environmental sustainability. Biography Jennifer Stein is a doctoral candidate in the newly created PhD program in Media Arts and Practice in the School of Cinematic Arts at the University of Southern California. As the focus of this program is on both theory and practice, Jennifer’s research will examine the impact of urban computing on the spaces of everyday life and interaction design informed by this research. Prior to entering this program, Jennifer was the Program Manager of the Interactive Media Division in the School of Cinematic Arts, where she developed curricula for a graduate program, advised students, and managed several research grants. Before coming to USC in this capacity, Jennifer completed my Master’s Degree in Media and Communications from Goldsmiths College, University of London. She has also worked in new media and television production in New York and Los Angeles at Nickelodeon and Warner Brothers. Motivation My motivation for attending this workshop is to share ideas with a like-minded community about how to motivate towards change and what tools would be most beneficial to reach this goal. Because I hope to integrate themes of sustainability into my doctoral research and design projects, I believe this workshop would be an invaluable experience.

CHALLENGING COMFORT & CLEANLINESS NORMS THROUGH INTERACTIVE IN-HOME
FEEDBACK SYSTEMS
Yolande Strengers Abstract This paper discusses the limitations of targeting individual behaviours through information feedback systems without considering the broader socio-technical context in which decisions are made about how people use energy and water. The paper draws on recent research conducted by the author investigating the impact of interactive in-home feedback systems on practices dependent on comfort and cleanliness norms. The research found that although current feedback systems were doing little to challenge bathing, laundering, heating and cooling practices dependent upon these norms, feedback systems could be redesigned to target normative behaviours. This conclusion is made within the context of previous research on social norms which has found that people will be more likely to change their behaviours if they are benchmarked against a wider social group and given approval or disapproval for their current behaviours. Previous research shows that personalised feedback can achieve energy and water consumption savings of between 5-15 per cent [6]. However, larger gains have arguably not been achieved because information feedback does little to challenge practices that are deeply ingrained in social and cultural norms. This paper briefly summarises recent research conducted by the author on the impact of interactive feedback systems on comfort and cleanliness norms, which largely govern practices such as heating, cooling, bathing and laundering. The paper offers preliminary conclusions to suggest how feedback systems can challenge normative practices. This analysis is made within the context of the researcher’s PhD, which is exploring how interactive energy and water technologies, such as ‘smart meters’ and ‘in-home displays’, influence expectations of comfort and cleanliness in Australian households. The research discussed involved a range of ethnographic methods, such as interviews, household tours, observation and photography, with ten households from South East Water’s ‘EcoPioneer’ trial based in the south-eastern
Figure 1: Ampy Email’s EcoMeter

suburbs of Melbourne. The full trial involved 50 households, which each had an Ampy Email ‘EcoMeter’ in-home display system (see Figure 1). The EcoMeter plugs into any power point in the home and displays the household’s energy, water and gas consumption in real-time. The research aimed to understand how feedback systems affect expectations of comfort and cleanliness, and how they could be re-designed to challenge these norms more strongly. Normative behaviours are those which sit beyond the realm of questionable practice [13] and are so deeply ingrained in the routines of daily life that education alone will not result in their reconfiguration [9]. This is despite the fact the histories of everyday practices such as laundering, bathing, heating and cooling show dramatic variations in what is considered ‘normal’ [1, 4, 5, 11, 18]. For example, while a weekly bath was recently the norm, this has been replaced by daily or more frequent showering. Similarly, comfort practices such as opening windows, cooling the body with water, using blankets and appropriate clothing, or building thermally efficient housing, are being replaced by heating and air-conditioning [13]. Although many other norms influence individual behaviours, water and space heating and cooling (comfort norms) constitute almost 60 per cent of Australians’ energy demand in the home [7]. Similarly, the bathroom, toilet, laundry and kitchen (cleanliness norms) constitute 70 per cent of an average household’s water consumption in Melbourne [12]. However, governments, utilities and conservationists have been reluctant to challenge these norms. Shove [13, p. 17] argues that this is because ‘comfort and cleanliness constitute fine examples of non-negotiability, their meaning and importance being quite simply taken for granted.’ The EcoPioneer research supported Shove’s conclusion and attributed the lack of change in these norms resulting from the provision of feedback to two factors. Firstly, the research found that householders either didn’t understand or misunderstood the connections between the consumption data provided through the EcoMeter, and their own practices. They were left to answer questions such as: what practices does this figure on my screen relate to? And, is this figure appropriate or inappropriate for the tasks I have just undertaken? This problem is related to the way the consumption data was provided to participants, which was in the units of kilowatts, kilolitres and greenhouse gas emissions. Providing raw consumption data to householders assumes that they can understand and translate this information into energy and water services, such as air-conditioning, heating, lighting, showering, cooking and computer or TV usage [13, 14, 18, 20]. Secondly, the practices made possible by energy and water are set within wider social and cultural norms governed by notions around what it means to have a clean body, clothes or house, or to be comfortable in any given society or culture [13]. Feedback systems generally target the individual, rather than this larger context in which a household is situated. Therefore, where householders had made the connection between their consumption data and practices, they did not necessarily consider these tasks to be negotiable or changeable. Instead, they often tried to improve the practice by changing the technologies used for the task. For example some participants changed to water-efficient showerheads or energy-

efficient light globes (provided to all participants taking part in the EcoPioneer trial). Similarly, most participants made small efficiency changes to their practices such as taking shorter showers, doing full loads of laundry, or turning off lights and standby appliances. However, feedback rarely resulted in fundamental changes to householder norms around what it means to be clean or comfortable. Residents rarely showered or washed their clothes less, or suddenly tolerated a larger band of temperatures, although some did use the heater and air-conditioner less. The non-negotiability of these practices can be attributed to two main factors. Firstly, many people shower once or twice a day and wear fresh clothes everyday because they believe society expects them to, and because this expectation becomes habitualised into daily life. The thought of embarrassing or disrespecting oneself by wearing dirty clothes or giving off body odour is generally reprehensible, and indeed many people find their own body odour repelling, although this has not always been the case [13]. Secondly, comfort and cleanliness expectations are being ratcheted upwards by a whole range of actors. For example, heating and air-conditioner manufacturers, electricity providers, governments, fashion designers and builders are all involved in both directly and indirectly promoting artificially-produced comfort [13]. People conform to these escalating expectations and come to regard them as normal, rejecting former and alternative ways of achieving them. Providing isolated information to households about their energy and water consumption therefore falsely assumes that people can meaningfully translate this information into practices and make autonomous decisions to substantially change them independently of their social context [18]. These findings confirm the views of several other authors [2, 15, 17, 19], who argue that individuals are not always free to act on information that is provided to them. Instead, individuals are constrained and influenced by technologies and infrastructures around them, the way resources are provided, and the social and cultural norms of the society they live in. While the EcoMeter encouraged participants to make small changes to the technologies and infrastructures in their homes, it rarely challenged their expectations of comfort and cleanliness. Feedback systems could be redesigned to challenge these norms in a number of ways. Firstly, feedback systems should encourage greater social interaction, both within and beyond the household, by improving the prominence and visibility of the in-home display system. Social interaction around the EcoMeter was already occurring in some of the homes visited, and this encouraged debate about everyday practices such as laundry and showering. Within the household, it gave the members with lower comfort and cleanliness expectations (mainly males and children) the opportunity to challenge householders with higher expectations (mainly females), who tended to dictate the overall standard of the household. Having the in-home display in a prominent position can also encourage discussion about practices that depend upon social norms with people visiting the household, such as what each person would or would not be willing to change to achieve a reduction in energy and water

use. Several interviewees reported this occurring as a result of the EcoMeter and noticed that householders with high expectations of comfort and cleanliness tried to conform to the norms of their peers and family members. While this approach can backfire and reinforce or increase existing expectations of comfort and cleanliness if the social group in question has higher expectations than the target household, the conservation focus of the in-home display biases discussion towards practices that save energy and water. To reinforce this approach, normative information could be provided through the feedback system. This might involve benchmarking people against a wider social group, such as their neighbours, in addition to indicating some form of approval and/or disapproval for their consumption levels through the display system. Several psychology researchers have tested this approach with great success [3, 8, 10]. They found that people aspire to the norm of any given group they belong to, as well as respond to an approval rating provided by the managers of the feedback system (which reinforces an aspired social norm). Although this paper has argued that subtle changes could be made to feedback systems to encourage a greater reduction in energy and water consumption, norms are unlikely to change overnight. Feedback systems are still heavily focused on individuals, and largely ignore the wider technological and institutional context in which individuals are contextually situated. For example, feedback systems designed to challenge comfort and cleanliness norms have to compete with the dominance of the shower, the proliferation of air-conditioning, and universal clothing standards in the workplace. Therefore, it would be foolish to promote feedback systems as a ‘solution’ to environmental problems without considering it a small part of a wider socio-technical system of energy and water consumption [13, 16]. Author biography Yolande Strengers is currently undertaking a PhD research project within the School of Global Studies, Social Science and Planning at RMIT University in Melbourne. Her PhD is funded by the Australasian CRC for Interaction Design (ACID) and the Australian Housing and Urban Research Institute (AHURI). Yolande is supervised by Dr Anitra Nelson and Professor Mike Berry from AHURI Research Centre at RMIT University. She holds a Bachelor of Arts (Deans Scholars Program) from Monash University and is due to finalise a Masters of International Urban and Environmental Management at RMIT University in the near future. Motivation for attending workshop Yolande is interested in attending Green Pervasive because the first workshop theme is closely aligned with the aims of her PhD research. In particular, Yolande is interested in understanding how pervasive technologies can assist in challenging normative behaviours.

References [1] Ackermann, M 2002, Cool comfort: America's romance with air-conditioning, Smithsonian Institution Press,
Washington [USA]. [2] Chappells, H & Shove, E 2003, 'The environment and the home', paper presented to the Environment and
Human Behaviour Seminar, Policy Studies Institute, London, 23 June. [3] Cialdini, R 2003, 'Crafting normative messages to protect the environment', Current Directions in
Psychological Science, vol. 12, no. 4, pp. 105-9. [4] Cooper, I 1982, 'Comfort theory and practice: barriers to the conservation of energy by building occupants',
Applied Energy, vol. 11, pp. 243-88. [5] Crowley, JE 1999, 'The sensibility of comfort', The American Historical Review, vol. 104, no. 3, pp. 749-83. [6] Darby, S 2006, The effectiveness of feedback on energy consumption: A review for DEFRA of the literature
on metering, billing and direct displays, Environmental Change Institute, University of Oxford, Oxford [England].
[7] EA 2007, 10 tips for saving this winter, Energy Australia, Sydney [Australia]. [8] Goldstein, N & Cialdini, R 2007, 'Using social norms as a lever of social influence', in AR Pratkanis (ed.),
The science of social influence: advances and future progress, Psychology Press, New York [US], pp. 167-91.
[9] Jelsma, J 2006, 'Designing 'moralized' products: theory and practice', in P-P Verbeek & A Slob (eds), User behavior and technology development: shaping sustainable relations between consumers and technologies, Springer, The Netherlands, pp. 221-31.
[10] Schultz, W, Nolan, J, Cialdini, R, Goldstein, N & Griskevicius, V 2007, 'The constructive, destructive, and reconstructive power of social norms', Psychological Science, vol. 18, no. 5, pp. 429-34.
[11] Schwartz Cowan, R 1989, More work for mother: the ironies of household technology from the open hearth to the microwave, Free Association Books, London [England].
[12] SEW 2002, 20 ways to save water, South East Water, Moorabbin, VIC. [13] Shove, E 2003, Comfort, cleanliness and convenience: the social organisation of normality, Berg
Publishers, Oxford [UK]. [14] ---- 2004, 'Efficiency and consumption: technology and practice', Energy & Environment, vol. 15, no. 6, pp.
1053-65. [15] Sofoulis, Z 2005, 'Big water, everyday water: a sociotechnical perspective', Continuum: Journal of Media &
Cultural Studies, vol. 19, no. 4, pp. 445-63. [16] Sofoulis, Z, Allon, F, Campbell, M, Attwater, R & Velayutham, S 2005, Everyday water: values, practices,
interactions: a UWS research partnerships project: final report, University of Western Sydney presented to Delfin Lend Lease, Sydney [Australia].
[17] Southerton, D, Chappells, H & Van Vliet, B (eds) 2004, Sustainable consumption: the implications of changing infrastructures of provision, Edward Elgar, Cheltenham [UK].
[18] Southerton, D, Warde, A & Hand, M 2004, 'The limited autonomy of the consumer: implications for sustainable consumption', in D Southerton, B Van Vliet & H Chappells (eds), Sustainable consumption: the implications of changing infrastructures of provision, Edward Elgar, Cheltenham [UK], pp. 32-48.
[19] Van Vliet, B, Chappells, H & Shove, E 2005, Infrastructures of consumption: environmental innovation in the utilities industries, Earthscan, London [UK].
[20] Wilhite, H & Lutzenhiser, L 1999, 'Social loading and sustainable consumption', Advances in consumer research, vol. 26, pp. 281-7.

Taking the Guesswork out of Environmentally Sustainable
Lifestyles
Ronak Sutaria Urban Sensors
230, Lake Merced Hills, #4A San Francisco, CA 94132 [email protected]
Aalok Deshmukh Rocky Mountain Institute
1820 Folsom St. Boulder, CO 80302
AbstractA large number of global environmental conferences, protocols, pacts and inter-governmental panels have been doing some excellent work in providing long-term guidelines, regulations and credible data for making decisions as well as for actions needed. However, a majority of these are geared towards large organizations such as governments or corporations. There is a considerable potential for impact by targeting individuals and providing them with relevant information to induce small incremental steps that can collectively result in large impacts. The focus of this paper is to identify ways and means wherein pervasive sensor-based technologies can assist individuals, who are unaware of global environmental protocols, in making daily decisions which can result in an environmentally sustainable lifestyle. Specific scenarios are discussed which explore the use of existing technologies where feedback can be provided to an individual for his/her actions. This feedback could use real-time collaborative data as well as historical trends and averages.
1. Introduction
1.1. Daily Lifestyle Trends In Energy Consumption
The use of energy in daily life is unavoidable. It is important to understand energy use distribution by end use in order to understand where the largest savings impacts are possible by user intervention. In the United States, the Energy Information Administration (EIA) provides data, forecasts, and analyses to promote sound policy making and public understanding regarding energy and its interaction with the economy and the environment. Looking at electricity consumption by end use in US households closely reveals that household appliances, including refrigerators account for over 50% of US household energy use1. Equipping the end users and/or appliances with energy meters as well as communications capabilities can be a first step in providing feedback to users.
This is where pervasive networks with distributed sensors can provide significant benefits by way of providing feedback to individual within households as well as by making these data available to a larger database to progressively improve the rigor in policy making and implementation. Coupled with real-time feedback to users about the environmental impact of their usage patterns (amount of
1 U.S. Energy Information Administration, from http://www.eia.doe.gov/emeu/recs/recs2001/enduse2001/enduse2001.html, accessed 2008-01-05

resultant carbon emissions, etc.) and concrete suggestions to reduce their impact, there is a significant potential to achieve widespread and radical levels of impact reduction.
2. Using Pervasive Ad-Hoc Networks for Making Environmentally Sustainable Lifestyle Choices
2.1 Current Applications of Sensor Based Networks Buildings have long used sensor-based Building Management Systems (BMS) or Energy Management Systems (EMS). A BMS/EMS is typically defined as a fully functional control system, which includes sensors, controllers, various communications devices and the full complement of operational software necessary to have a fully functioning system2. In addition, there are also industry-accepted data communications protocols such as BACnet3 (Building Automation and Control Networks), that have been designed to meet the communication needs of various building systems and the information is made available to building operators and facility managers.
However, with the increased interest in green buildings and the resulting need for providing feedback and education to users; there are some products/systems that are more geared towards providing building users/occupants with real-time feedback on the reduced environmental impacts of buildings that have been designed as green or energy-efficient4. These products typically tie in with building automation and control systems to provide feedback to users/occupants. Furthermore, wireless applications too are coming to the fore5. At a larger scale, Automatic Meter Reading (AMR) is gradually and increasingly being adopted by utilities and offers exciting possibilities in the context of this discussion. From UtiliMetrics6, AMR is the remote collection of water, gas and electric consumption data from customers' utility meters using remote sensing technologies.
2.2 Use of Pervasive Technologies to Encourage Action and Change.
The first step in making sustainable lifestyle choices would be to provide the end users with a simple, easy to understand view of their energy consumption as described in 1.1. Simple energy meters are available7 that can measure “Watts” used by various appliances (dryers, water heaters, air-conditioning, etc) and can make a cumulative reading. These can be easily extended to provide a SMS alert or an email at every periodic time interval (every 24 hrs) to the end user. This would enable the user to get an accurate idea of their energy consumption. Similar energy meter readings collected from a community in the same neighbourhood and hence having similar space heating and cooling requirements can provide energy usage patterns and comparisons to the members of
2 See DDC Online, http://www.ddc-online.org/intro/intro_chapt01.aspx for a description, in generic terms of “Direct Digital Control” systems; accessed 2008-01-05. 3 See BACnet - A Data Communication Protocol for Building Automation and Control Networks,http://www.bacnet.org/, accessed 2008-01-05. 4 See iBPortalTM and GreenTouchscreenTM from Quality Attributes on http://www.qualityattributes.com/; and Building DashboardTM and IRISTM from Lucid Design Group on http://www.luciddesigngroup.com/; accessed 2008-01-05. 5 See ArchRock – Applications for Environmental Monitoring on http://www.archrock.com/applications/, accessed 2008-01-066 See Utilitmetrics – About AMR on http://www.utilimetrics.org/about/amr.htm, accessed 2008-01-10 7 See Kill-A-Watt devices made by P3 International, http://www.p3international.com/products/special/P4400/P4400-CE.html; accessed 2008-01-06.

that community in a collaborative manner. These comparisons can also provide classification based on the type of appliances used and their specific brands, to help determine the most effective and energy-efficient appliances. An intuitive user interface and easy to understand information is imperative in enabling the end-user to take relevant action. Devices like MorePower Multi8 are possibly the next generation of “smart-energy meters” which provide actionable and easy to understand information. To make this more actionable, such a system maybe enhanced so as to provide examples of simple everyday actions and how they can reduce energy use, costs and emissions, on a daily, monthly and annual basis; without compromising quality of life, such as running your refrigerator on the “Medium-Low” setting (typically 3-4°C), instead of the “High Cool” setting (typically 1°C); running your hot water at 50°C at opposed to 55°C; changing all your light bulbs to compact fluorescent lamps, etc.
A logical next step to collecting data and information is to analyze the same and to determine how it compares to that of the people around. A fair amount of information is available on personal carbon trading, such as the RSA CarbonLimited project9.
Figure 1: Image MoreAssociates
According to the U.S. Environmental Protection Agency (EPA), typical annual CO2 emissions due to electricity are 16,290 pounds (7.39 metric tons) per household, assuming approximately 900 kWh per month, while typical annual CO2 emissions of 11,000 pounds (4.99 metric tons) per household based on national average monthly consumption of 7,680 cubic feet of gas; amounting to a total of 27,290 pounds (12.38 metric tons) of CO2 emissions for household energy use10. In comparison, annual emissions from a typical passenger vehicle are estimated at 5.5 metric tons of CO2 emissions11. Given the nationwide average of nearly two vehicles per household12, vehicles can be seen to contribute as much to household emissions as electricity and natural gas.
An extension to the household energy meters is to fit vehicles with “mileage meters”. These meters show the mileage given by the car over a short period. The mileage data of the car as well as of the cars driving around it can be made available to the driver using vehicular networks. The advantage
8 See MoreAssociates energy literacy, http://www.moreassociates.com/research/energy_literacy, accessed 2008-01-06. 9 Carbon Limited, exploring personal carbon trading, from http://www.rsacarbonlimited.org/viewarticle.aspa?pageid=577&nodeid=1; accessed 2008-01-06. 10 http://www.epa.gov/climatechange/emissions/ind_assumptions.html; accessed 2008-01-10 11 http://www.epa.gov/otaq/climate/420f05004.htm; accessed 2008-01-10 12 http://www.bts.gov/press_releases/2003/bts019_03/html/bts019_03.html; accessed 2008-01-10

of providing real-time collaborative data would be to provide the end-user with information which is relevant and specific to the vehicles which are being driven in the same environmental and road-conditions but providing better mileage. This can lead to a competitive outlook to getting the best mileage possible. This is similar to a multi-player video game where the statistics for each user are displayed on the screen and the players try to better their games based on the opponent’s scores and skills.
About the authors:
Ronak Sutaria is an Entrepreneur at Urban Sensors and a Senior Engineer with Arcot Systems. He has travelled nationally and internationally as a technical solutions architect and has extensive experience with enterprise-level e-commerce applications. He has a Master’s degree in Computer Science from the New Jersey Institute of Technology where he did his thesis in the field of Anomaly based Malicious Code Detection and took courses in Advanced Networking, Mobile Computing and Sensor Networks. He has peer-reviewed papers for the ICPS 2006 and worked, in an academic capacity, with technologies such as TinyOS, nesC, Maté and Trickle. He has a keen interest in applications of sensor based technologies to urban cities in developing countries.
Aalok Deshmukh is a Senior Consultant with Rocky Mountain Institute’s Built Environment Team, and has over 5 years of experience spanning contributions to more than 125 projects. He has a Master’s degree in building science from Arizona State University; and has published several peer-reviewed technical and research papers. He is a LEED™ Accredited Professional and part of the U.S. Green Building Council’s LEED certification review team; and has served as an elected member on the LEED NC Core Committee. He has a keen interest in the development and application of appropriate technologies, standards, and sustainability indicators as they pertain to the environmental impact of buildings—across various corporate and international contexts in general—and especially in India and other developing economies.
Motivation for attending the Pervasive Persuasive Technology and Environmental Sustainability workshop:
The conference is addressing a lot of the real-world sustainability issues. The idea of motivating people in real time to take action based on concrete data is very appealing. The use of pervasive technologies in such a scenario, if made intuitive enough, seems very plausible. The authors also have a keen interest in making these technologies viable and accessible across the economic divide.
The hands-on and interactive nature of the workshop seems like an excellent platform to understand the current knowledge base of the participants on these topics as well as brainstorm new realistic ideas. The idea of keeping the participants engaged beyond the workshop is especially exciting. The design challenge 2009 would be an interesting exercise to know how practical some of the ideas are and to be able to collaboratively design some of these prototypes.

ECOISLAND: A SYSTEM FOR PERSUADINGUSERS TO REDUCE CO2 EMISSIONS
Chihiro Takayama1
Vili Lehdonvirta2
AbstractA significant portion of the carbon dioxide emissions that have been shown to cause global warm-ing are due to household energy consumption and traffic. EcoIsland is a computer system aimed atpersuading and assisting individual families in changing their lifestyle patterns in a way that reducesCO2 emissions. The system builds on our earlier work on persuasive ubiquitous computing appli-cations, and applies ideas from behaviorism, social psychology and emissions trading to attempt tomotivate changes in users’ behaviour. In this paper, we briefly describe the concept and the theoriesbehind it, and provide preliminary results from a user study measuring its effectiveness.
1. Introduction
According to Intergovernmental Panel on Climate Change [1], global warming caused by greenhouse
gases released into the atmosphere through the actions of man is a major threat to the earth’s ecology.
Efforts to reduce greenhouse gas emissions come in two forms: technological solutions and changes
in human behaviour. Technological solutions broadly include improving energy efficiency and de-
veloping cleaner energy sources. Dramatic changes in human behaviour may also be necessary if
catastrophic climate change is to be avoided.
Public and private efforts to change individual behaviour towards more environmentally friendly prac-
tices usually rely on education, but there are psychological limits to the ability of education alone to
effect behavioral change. Even when a person well knows that a particular behavior is so detrimental
to their long-term well-being as to offset any possible short-term benefits, their may still irrationally
choose the short-term indulgence. Future consequences, while widely known, are easily ignored in
the present.
In our earlier work on ambient lifestyle feedback systems, we used ubiquitous computing technology
to construct a virtual “Skinner box” to motivate children to adopt correct tooth brushing patterns
[2]. The system monitors the user and rewards desirable behaviour using techniques familiar from
computer games, while punishing undesirable behaviour. This approach may be described as falling
in the general field of captology, computers as persuasive technologies [3].
In EcoIsland, we apply a similar approach to attempt to motivate behaviour changes that reduce CO2
emissions. Compared to the earlier work, EcoIsland’s design is informed by a richer psychological
theory and includes a complete “virtual economy” for emission rights trading. The purpose of the
work is to study the applicability and effectiveness of these techniques for persuasive purposes.
1Waseda University, Tokyo, Japan. c [email protected] Institute for Information Technology, Finland. [email protected]

2. The EcoIsland concept
EcoIsland is a game-like application intended to be used as a background activity by an ecologically
minded family in the course of their normal daily activities. A display installed in the kitchen or
another prominent place in the household presents a virtual island. Each family member is represented
on the island by an avatar (Figure 1). The family sets a target CO2 emission level (e.g. national
average minus 20%) and the system tracks their approximate current emissions using sensors and
self-reported data. If the emissions exceed the target level, the water around the island begins to rise,
eventually sweeping away the avatars’ possessions and resulting in a game over.
Figure 1. EcoIsland main visual
On their mobile phones, the participants have a list of actions that they may take to reduce the emis-
sions: turning down the air conditioning by one degree, taking the train instead of the car, et cetera.
Upon completing an action, a participant reports using the phone, and the water level reacts accord-
ingly. Reported activities are also shown in speech bubbles above the corresponding avatars. A lack
of activity causes the avatars to suggest actions.
Participants can also see neighbouring islands and their activities in the display, and can list buy
and sell offers for emission rights on a marketplace. Trading is conducted using a virtual currency
obtained from a regular allowance. The credits are also used to buy improvements and decorations to
the island, so successful sellers can afford to decorate their island more, while heavy emitters have to
spend their allowance on emission rights.
3. Persuasive techniques
The general approach from ambient lifestyle feedback systems is to provide a feedback loop for user
behaviour. The virtual island shown in the display acts as a metaphor and makes the participants
conscious of the ecological consequences of their choices and activities.
We also tap into social psychology, attempting to exploit social facilitation and conforming behaviorto encourage the desired behaviour. Social facilitation is the phenomenon where a person performs
better at a task when someone else, e.g. a colleague or a supervisor, is watching [4]. Conforming
behaviour is the desire not to act against group consensus [5].

EcoIsland’s design facilitates these by involving the whole family, and by presenting the participants’
activity reports in the speech bubbles and providing contribution charts and activity histories. On
the other hand, the fact that the game is played by a family unit instead of an individual means that
participants can also agree to assign tasks to certain members.
Lastly, there is the trading system, which is based on the same principle as industry level emis-
sions trading systems: reductions should be carried out in places where it is easiest to do so. A
family that finds it easy to make significant reductions can sell emission rights to households that
find it difficult due to e.g. location or job. This should make it possible to attain the same amount
of total reductions with a lower total cost (measured in disutility), promoting use of the system.
��������������� ��
����������
����������
���
���������� ����������� ���
�����
�!��
"#$������#��
��$���#%��
&''�
�����
�������(�
��) *��
�����+�
,+��$-.
�����(���#��/�(#)���01
Figure 2. EcoIsland system architecture
4. Implementation
We have developed a prototype system that implements the
functionality described above, except that sensors are not yet
used. Figure 2 presents the overall architecture and technolo-
gies used. The kitchen display uses Adobe Flash to render a
visualisation based on data obtained from a server running the
EcoIsland application, which is written in Java. The mobile
phone clients use a normal web browser to interact with the
server. The application is of the thin-client type: data is man-
aged in a database on the server side, so that the client machine
stores no data.
5. Evaluation
For our first user study, we recruited six families (twenty persons) who are interested in environmental
issues and live in a family. The experiment lasted for four weeks. In the first week, we equipped the
participants’ air conditioners with a simple Ecowatt[6] electricity usage meter to compare the readings
between experiment weeks.
In the second week, the system was installed and only one family member from each household was
asked to use it. In the third week, all family members used the system. Comparing the results of
the second and third week provides insights regarding the social psychological effects. In the fourth
week, we introduced the emissions trading system, and observed how it affected user behaviour.
After the experiment, we conducted a survey in the form of a questionnaire asking about changes in
the participants’ attitudes and feedback.
6. Results and Discussion
In the survey, 17 out of 20 participants said that they were more conscious of environmental issues
after the experiment than before. Several families said that the sinking virtual island contributed to a
change in their consciousness, suggesting that the metaphor works well. But when asked about their
motivations for the emission reducing actions they conducted during the experiment, they responded
with reasons stemming from the system, such as wanting to save the sinking virtual island, purchase
items and amass points, rather than using environmental reasoning.

A log of the emission reduction activities reported by the participants shows that five out of six persons
reported more actions in the third week than the second week, lending support to the hypothesis that
social facilitation and conforming behaviour can be used effectively. During the fourth week, only
two out of six families used the emissions trading system. Ten participants reported that the target
reduction levels were so easy to achieve that there was no need to resort to emissions trading. This
highlights a common challenge in game design: how to set the parameters (in this case, target levels,
effect of actions and currency allowances) in such a way as to provide an optimal challenge.
As for the air conditioner electricity usage recorded by Ecowatt, there was no observable correlation
with the reported emission reducing activities. While this is an alarming result, it does reflect the fact
that the experiment period was short considering ordinary day-to-day variance in electricity use. The
time of the experiment (in December and January) was also such that the appliance may have been
used less than normally. In the future, EcoIsland could be linked to a HEMS (Home Energy Manage-
ment System), which would allow for a large variety of usage data to be automatically reported to the
system, also enabling a much more comprehensive evaluation. However, some participants noted that
the act of manual reporting itself probably contributed to the motivation, so we must be careful when
replacing self-reporting with sensor data.
Work on EcoIsland continues, probably in the form of a larger and longer user study that among other
things tries to provide an evaluation of the trading system. At the same time, we plan to apply this
particular flavour of persuasive technology to other application areas.
References
[1] IPCC. IPCC Fourth Assessment Report: Climate Change 2007, http://www.ipcc.ch/
[2] Nakajima T., Lehdonvirta V., Tokunaga E., Kimura H. “Reflecting Human Behavior to Motivate
Desirable Lifestyle”, Proceedings of DIS 2008, February 25-27, 2008, Cape Town, South Africa.
[3] B. J. Fogg. Persuasive technology: using computers to change what we think and do, New York:
ACM, 2002
[4] Zajonc, R. B. Social facilitation. Science, pp. 149, 269-274. 1965
[5] Asch, S. E. Opinions and social pressure. Scientific American, pp. 31-35. 1955
[6] ENEGATE co.,ltd, ecowatt, http://www.enegate.co.jp/
Chihiro Takayama is a Master’s course student at the Distributed and Ubiquitous Computing Lab-
oratory, Department of Computer Science, Waseda University, Tokyo, Japan. His interests include
persuasive technology, user interfaces and usability. Email: c [email protected]
Vili Lehdonvirta graduated from Helsinki University of Technology in 2005 with a M.Sc (Tech.) in
electronic business, and is currently pursuing a Ph.D degree in economic sociology at Turku School
of Economics, Finland. He works as a researcher at Helsinki Institute for Information Technology
HIIT, where his research interests include virtual economies and ecologically sustainable virtual con-
sumption. Email: [email protected]
The authors wish to thank Yasuyuki Washio and Miyuki Shiraishi for their contributions to this work.

Workshop on
Pervasive Computing @ Home
ORGANIZERS: A.J. Brush (Microsoft Research, USA)
Shwetak Patel (Georgia Tech, USA)
Brian Meyers (Microsoft Research, USA)
Albrecht Schmidt (University of Duisburg-Essen, Germany)

Pervasive Computing @ Home
A.J. Brush#, Shwetak Patel*, Brian Meyers#, Albrecht Schmidt�
#Microsoft Research, Redmond, USA *Georgia Tech, Atlanta, USA
�University of Duisburg-Essen, Germany [email protected], [email protected],
[email protected], [email protected]
1. Motivation and Theme
The Pervasive Computing @ Home workshop focuses on Pervasive Technology as applied specifically to a home environment. Two approaches have emerged in the research community for studying technologies as well as behavior in a home setting. The first is building a “living laboratory” (i.e. MIT, Georgia Tech, Intel, and Microsoft), where a very rich set of sensors, actuators and infrastructure are available for studying specific behavioral questions and technical challenges. The other is to create deployable versions of sensing technology, actuator systems and methodologies so that researchers can study behavior in a more natural and authentic setting (i.e. Georgia Tech’s Digital Family Portrait, Intel’s CareNet, Microsoft’s Whereabouts clock). Both options provide valuable insight with regard to behavior and technology, but each approach has drawbacks. For example, the expense of building a functioning laboratory or the difficulty of ensuring the technology is robust enough for the home.
As many researchers and companies around the world study Pervasive Technology in the home, we wanted to bring together researchers to share insights on designing and deploying pervasive technologies for the home. The question we will discuss include why do we want to put technologies in people’s home and what does it really take for that to be successful? What are the challenges? How do you run a field study about something that is supposed to work 24x7? What lessons can we learn from the state of technology adoption in the home today? Are there lessons to be learned from successful home and mobile technologies, such as Tivos, iPods and mobile phones? What cultural differences and similarities can we observe for pervasive technologies in the home? In the workshop program we have a set of papers reflecting on these questions and showing novel and interesting solutions. The papers report work of people who have placed technology in the home (or living laboratory) or who are planning on doing so in the future.
We expect the workshop to result in a community of researchers focused on pervasive computing in the home, a set of lessons learned about deploying technologies in homes and living laboratories, and a list of hot areas for research.

Pervasive Computing @ ICS-FORTH
Constantine Stephanidis1,2, Antonis Argyros1,2, Dimitris Grammenos1,and Xenophon Zabulis1
1 Institute of Computer Science (ICS), Foundation for Research and Technology – Hellas (FORTH),
N. Plastira 100, Vassilika Vouton GR - 70013 Heraklion, Crete, Greece
{cs, argyros, gramenos, zabulis}@ics.forth.gr
2 Department of Computer Science, University of Crete
Abstract. This paper introduces the Ambient Intelligence (AmI) Programme of the Institute of Computer Science of the Foundation for Research and Technology – Hellas (ICS-FORTH). In this context, a laboratory space of about 100m2 comprising six rooms, called the “AmI Sandbox”, has been created. In this space several AmI technologies have already been installed and related R&D activities are being conducted. In addition to that, a large-scale Ambient Intelligence Facility is currently being built. The facility will occupy a three-floor 3,000 m2 building, comprising simulated AmI-augmented environments and their support spaces, laboratory spaces for developing and testing related technologies, staff offices and public spaces.
Keywords: Ambient Intelligence, living laboratory, interdisciplinary research.
1 Introduction
The Institute of Computer Science of the Foundation for Research and Technology – Hellas (ICS-FORTH), since its establishment in 1983, has had a long history and recognized tradition in conducting basic and applied research, and playing a leading role, in Greece and internationally, in the field of Information and Communication Technologies. ICS-FORTH comprises the following Research Laboratories and Centers: � Biomedical Informatics Laboratory (BMI) � Computer Architecture and VLSI Systems Laboratory (CARV) � Computational Vision and Robotics Laboratory (CVRL) � Distributed Computing Systems Laboratory (DCS) � Human- Computer Interaction Laboratory (HCI) � Centre for Universal Access and Assistive Technologies (CUA- AT)
� Information Systems Laboratory (ISL) � Centre for Cultural Informatics (CCI)

� Telecommunications and Networks Laboratory (TNL)
Additionally, ICS-FORTH is running a horizontal interdisciplinary Research and Development Programme in the domain of Ambient Intelligence (AmI). The vision of this Programme is to establish itself as a connecting thread for the activities of the individual laboratories and to provide opportunities for defining interesting new problems. In this context, a laboratory space of about 100m2 comprising six rooms, called the “AmI Sandbox”, has been created in 2007. In this space, various AmI technologies and applications are being installed, integrated and demonstrated, and alternative ideas and solutions are being cooperatively developed, studied and tested. A cross-laboratory taskforce has been formed comprising researchers, technical staff and graduate students. Thus, the AmI Sandbox provides researchers the opportunity to bring along and share their know-how and resources in order to obtain hands-on experience and experiment in a highly flexible setting. Currently, the following activities are being conducted:
(a) Design, implementation and evaluation of an integrated, scalable approach towards the creation of AmI environments.
(b) Design of the simulation spaces and selection of the required hardware and software technologies.
(c) Installation, integration and testing of candidate AmI technologies in the AmI Sandbox.
(d) Definition of alternative representative scenarios of use for all the simulation spaces of an AmI Facility (see Figure 1), including the home environment.
The following technologies have already been installed in the AmI Sandbox: � Computer vision system, comprising 8 cameras � Surround speaker system with 8 speakers � Various computer-operated lights (neon, spot lights, floor and desk lamps) using
both the DMX and X10 protocols � Computer-operated air-condition � Various screens and high definition TVs, including touch screens � One large front projection screen created by 2 ceiling-mounted short-throw
projectors � One back projection screen � Several sensors (distance, temperature, etc.) and actuators � Desktop and mobile RFID readers � An interactive table � Access control systems � Positioning system through wireless access points � Various robotic systems

� Based on these technologies, the various laboratories of ICS-FORTH, taking advantage of their related expertise and know-how, are currently working towards the development of several interoperating AmI components, such as:
� AmI software and hardware architectures � Middleware � Computer vision subsystem for multiple user localization and gesture recognition � Speech recognition and speaker localization � Environment sensing technologies and sensor fusion � Dynamic surround sound playing system � Environmental control � Context management and reasoning � Access control, information and communications security � Seamless and intuitive user-environment interaction
The above components are to comprise a generic set of “building blocks” that will be employed to synthesize a wide range of AmI applications. Furthermore, the interaction of such different AmI components will be studied in depth. The first results of this effort are expected to be delivered by the end of summer 2008, in the form of an integrated AmI Sandbox demonstrator. These results, depending on their utility and impact, will be “propagated” to the ICS-FORTH Ambient Intelligence Facility (see Fig. 1), that is currently being built and that will occupy a three-floor 3,000 square meters building, comprising simulated AmI-augmented environments and their support spaces (e.g., computer and observation rooms), laboratory spaces for developing and testing related technologies, staff offices and public spaces.
Fig. 1. Digital maquette of ICS-FORTH’ AmI Facility (currently under construction).
One of the key application domains that will be addressed in this new facility is housing. More specifically, the northern part of the building will enclose a simulated home environment that will expand on two floors which will be linked through both a staircase and an elevator and will include an open-space living room, a kitchen, a house office, two bedrooms (one for adults and one for children) and a bathroom. The home will integrate numerous application scenarios including local, remote and automated home control, safety and security, health monitoring, independent living,

(tele)working and entertainment. The AmI home will be fully accessible by the elderly and people with disabilities.
A first, small and focused, example of current work related to home control is an interactive application that supports accessible lighting control through multiple modalities, such as: (a) touch-screen-based, for sighted users with no motor impairments; (b) remote controlled operation in combination with speech for visually impaired users or tele-operation by sighted users; (c) switch-based scanning for motor-impaired users; and (d) speech-based interaction for all users. The visual interface and the hardware set-up of the system are depicted in Fig.2. The usability and accessibility of the system have been tested with several end-users with diverse abilities, including young children, blind people, people with hand-motor impairments and elderly. The findings of these evaluations: (i) confirmed the validity of the initial design decisions; (ii) supplied interesting ideas for future improvements; and (iii) provided strong evidence that the design approach followed can be effectively used for creating general-purpose environmental control interfaces that are accessible and highly usable by diverse user groups, including people with disabilities.
Fig. 2. The visual interface, also depicting a user’s hand using the touch screen (left); and the prototype hardware set-up (right) of the lights control system.
2 Relevance to the goals and topic of the workshop
The activities described above have only recently started, and therefore the results are rather preliminary. However, as the home environment is the target of a substantial part of current and future research work at ICS-FORTH, participation in this workshop is considered as very interesting and important, since it will provide an invaluable opportunity, on the one hand, to learn the problems faced and solutions devised by others, and, on the other had, to liaise with key actors and establish mutually beneficial cooperations in this challenging domain.

3 Authors’ Short CVs
Constantine Stephanidis
Constantine Stephanidis, Professor at the Department of Computer Science of the University of Crete, is the Director of the Institute of Computer Science (ICS), Foundation for Research and Technology – Hellas (FORTH), Head of the Human - Computer Interaction Laboratory and of the Centre for Universal Access and Assistive Technologies and Head of the Ambient Intelligence Programme of ICS-FORTH. Currently, he is also the President of the Board of Directors of the Science and Technology Park of Crete. Prof. Stephanidis is the Scientific Coordinator of the European Commission Coordination Action INTERLINK (2006-2009) that aims to identify and address world-scale, basic research problems in 'software intensive systems and new computing paradigms', 'ambient computing and communication environments' and 'intelligent and Cognitive Systems', under a human-centred perspective, and to define joint basic research agendas for world-wide cooperation in these domains. Prof. Stephanidis is the Editor-in-Chief of the Springer international journal "Universal Access in the Information Society" and General Chair of the HCI International 2009 Conference. He has published more than 300 technical papers in scientific archival journals, proceedings of international conferences and workshops related to his fields of expertise.
Web page: http://www.ics.forth.gr/stephanidis/index.shtml
Antonis Argyros
Antonis Argyros is an Associate Professor at the Computer Science Department, University of Crete and a researcher at ICS-FORTH where he has been involved in many RTD projects in image analysis, computer vision and robotics. Prof. Argyros is the deputy coordinator of the Ambient Intelligence Programme of ICS-FORTH and assistant scientific coordinator of the European Commission Coordination Action INTERLINK. Antonis Argyros is also a member of the Executive Committee of the European Consortium for Informatics and Mathematics (ERCIM). The research interests of Antonis Argyros fall in the areas of computer vision and robotics, visual perception of motion and scene structure, development of robot behaviors based on visual input, cognitive vision systems, vision-based tracking of multiple targets, and omni-directional vision. In these areas he has published more than 60 papers in scientific journals and conference proceedings.
Web page: http://www.ics.forth.gr/~argyros/
Dimitris Grammenos
Dimitris Grammenos is the lead interaction designer of the Human-Computer Interaction Laboratory of ICS-FORTH, and he is in charge of the Lab’s Universally Accessible Games Activity. He is also a member of ICS-FORTH’ Ambient Intelligence (AmI) Programme Coordination Team. He holds a B.Sc in Computer Science, and an M.Sc and Ph.D in Electronic Engineering. He has been involved in

several European R&D projects related to Design for All and Universal Access and has given related lectures, seminars and tutorials. He is a member of the Editorial Board of the “Universal Access in the Information Society” International Journal and a member of the Program Board of the International Conference on Universal Access in Human-Computer Interaction.
Web page: http://www.ics.forth.gr/hci/people/dgrammenos
Xenophon Zabulis
Xenophon Zabulis is currently a Researcher at the Institute of Computer Science – Foundation of Research and Technology, Hellas. He received the B.A., M.S. and Ph.D. degrees in computer science from the University of Crete, Greece, in 1996, 1998 and 2001, respectively. He has worked as a Postdoctoral Fellow at the Computer and Information Science Department, at the interdisciplinary General Robotics, Automation, Sensing and Perception laboratory and at the Institute for Research in Cognitive Science, both at the University of Pennsylvania, USA. In addition he has worked as a Research Fellow at the Institute of Informatics and Telematics, Centre of Research and Technology Hellas, Greece.

The eHome – a Practical Smart Home Implementation
Lasse Kaila, Jussi Mikkonen, Antti-Matti Vainio, Jukka Vanhala
Tampere University of Technology, Department of Electronics Korkeakoulunkatu 3
33720 Tampere, Finland Tel. +358 3 3115 11, fax. +358 3 3115 3394
{lasse.kaila, jussi.mikkonen, antti-matti.vainio, jukka.vanhala}@tut.fi
Abstract. The eHome project was started in order to find out how a smart home would perform under normal everyday conditions. A network of ubiquitous devices and user interfaces were installed in a regular 52 m2 apartment, where two young people lived and used the equipment in their everyday lives. The goal was to study what a smart space should contain and how users can interact with all the equipment. Emphasis was placed on practicality and user studies. This paper describes the motivation, implementation and results of this three-year research project.
1. Introduction
Smart homes and environments have been discussed and hyped for many years now [1], and despite technological advances, future visions and dreams the concept of a smart home remains distant and unfamiliar. To the average citizen it is not clear what a smart home actually is, and even among professionals the definition of a smart home varies depending on whom you ask. Thus it is not surprising that smart homes are still waiting for their breakthrough on the common market. Still, with electronic devices and appliances becoming more and more numerous and common in everyday life it would be beneficial to have an easy way to control and interact with all these. This is possibly one of the biggest assets a smart home could have. Instead of running theoretical tests, simulations and laboratory experiments we saw a need to investigate to how a smart home would function in everyday life. The eHome project was a three-year study on how devices, networks and user interfaces (UIs) work together in everyday life in a normal home environment.
2. Motivation
Smart homes, ubiquitous computing and home networks have been popular research topics over the years [2,3], but practical applications are still rare or nonexistent. There really is not much knowledge of how smart homes would work in practice, when dealing with everyday life. Many smart spaces that exist today are corporate

showrooms, design showcases or laboratories that have been made to resemble normal homes, decorated with modern furniture and filled with modern gadgets [4]. A common problem with many applications is that control is very restricted and devices do not have much knowledge about what is going on elsewhere in the network. There is no “intelligence” in the system, not to mention that the price for such a system is very high [4]. The technology has been advanced enough for decades, but there seems to be something essential missing, either from an application or a technical point of view, that would make people want to have smart homes [5]. In order to bring the technology and applications available for everyone the price has to go down and usability and value to normal living has to increase considerably. Modern homes are already being equipped with more and more electronic devices and appliances, each with their own UI and operational logic. Learning to use all the user interfaces of all possible appliances at home can be a tedious task [6], but with a centralised and intuitive UI these problems might be alleviated. In addition, it is possible to tailor the UI to better suit the needs of the current group of users, or even individuals. This reason alone is why we feel that smart homes could really offer people additional value and increased usability.
The Personal Electronics research group has been involved in smart home research since 1999, and a few smart spaces had already been constructed before the eHome. The Living Room was a former laboratory converted into a living space with a living room, kitchen and a small hall. It was used for testing the first infrastructure and user interface prototypes. A few years later a complete apartment, Smart Home, was built at the university. It was designed to be a flexible, versatile testing space with removable floor and ceiling tiles, customised electrics and lots of space for equipment. The Smart Home was fitted with devices similar to the ones in the Living Room, plus an upgraded communications network, more UIs and new adaptive and learning control software.
With these thoughts in mind we decided to run a new research project parallel to the Smart Home. In contrast to laboratory and theoretical tests, empirical testing in a real home and a real-life everyday scenario would provide extremely valuable feedback and results. In the eHome-project we wanted to investigate what kinds of ways there were to interface with home devices, electronics and functions and how these would work in practice. Also other advantages that a smart home can offer, like increased security and safety by monitoring both appliances and people, lower energy consumption by turning off lights and unused equipment, were interesting [7].
3. The eHome
The eHome is a 52 m2 flat, with a bedroom, living room, kitchen, sauna and bathroom. The apartment and network infrastructure can be seen in Figure 1.

Fig. 1 Network infrastructure of the eHome, showing networked devices, networks, user interfaces and the server. The apartment itself is shown on the right-hand side.
The apartment was fitted with an appropriate infrastructure in order to create a network for all installed devices and home appliances. Both wired and wireless technology was used, making mobile applications also possible. Control networks exist for both mains (230 VAC) and lower voltages, and they cover the entire apartment. In order to be able to connect devices, UIs and sensors together most of them had to be custom built at the university. Functionality was also added to commercial devices where possible and a simple communication protocol was created in order to standardise functions and messages in the home network. A standard PC was chosen to function as a network master, since a modern PC already contains several kinds of network connections. The PC was connected to the home networks controlling the devices, and it also had an Internet connection and functioned as a web server. It ran a Java software package called the Home Controller, which was responsible for all functionality in the eHome, devices and user interfaces. Using software modules it was basically possible to use any network types, as long as they could be connected to the PC.
The eHome featured motorised window blinds, lighting controls (on/off, dimming), universal infrared remote controls for A/V equipment, controllable mains sockets etc. Home appliances such as stoves and microwave ovens were not included directly in the home network because they lacked a common control interface. Monitoring and measuring them externally however was possible. Sensors measuring temperatures, humidity levels and current consumption were also used to detect various changes in the apartment, such as windows or doors that were accidentally left open. In order to be able to control and monitor all these devices and home electronics the eHome

featured both mobile and static UIs. This way users had flexible control of the home and we were able to find out the usefulness and usability of each UI. User interfaces in the eHome included a mobile phone (for both local and remote connections), a web-based UI (which could be used from a touch screen-equipped laptop PC) and a TV UI (mimicking a digital set-up box). Each UI had its own purpose and different adjustable functions, designed to complement each other. The web UI was designed to be the most versatile UI, and it allowed users to control all devices and also make timer settings and different preset modes.
Two tenants, a male/female couple (a cultural historian and a biologist), in their mid-twenties, were selected to live in the apartment for a period of three years. During this time they reported their experiences with the smart home systems, user interfaces and daily routines. A usability researcher was present each time a new UI was introduced or when regular feedback was collected.
4. Findings and lessons learned
During their three-year period the tenants gave the usability lab a lot of material to study and digest. When the project was concluded user feedback was collected and analysed [8]. It was interesting to see how living in the eHome had changed the tenants’ daily routines, how visitors to the eHome experienced it and how the system performed as a whole. In the beginning of the testing period the tenants naturally had their suspicions about the system and its reliability. It took a few weeks for them to get used to using everything and learning how to operate the different user interfaces. New UIs and functionality was introduced to them gradually, and every time a new device or function was added the same learning process was repeated. In spite of what the tenants thought in the beginning, the mobile phone had become by far the most popular UI. The tenants had no more worries about having forgotten to turn off the lights or the coffeemaker, and usually pressing a few buttons on the phone is a lot quicker than turning on the laptop PC or TV just to make one quick adjustment. The mobile phone is also easy to carry with you, it is always on and the user interface is familiar to everyone [8]. The tenants also appreciated the different timer and mode settings that the web-UI offered. Instead of waking up in the morning to a ringing alarm clock they set the window blinds to open and bedroom light to turn on in the morning, creating a more natural way of waking up. Programmable wall switches were also convenient for grouping lighting controls and turning all lights off from a single button. The TV UI was not as popular, as using it might interrupt the TV programme and annoy other viewers. In a nutshell, every UI had its strengths and weaknesses, and using multiple UIs instead of one single UI also provided flexibility and new possibilities. However in the future mobile phones may soon overtake an important role as primary smart home UIs.
The eHome system was running continuously for three years, and the infrastructure itself worked appropriately throughout the experiment. There were no hardware faults apart from a few blown fuses and a broken light dimmer. The biggest downtimes were caused by software updates, bugs in the Home Controller software and network failures. If there was a technical problem and a UI was not functioning for a while it

was not such a big deal, the tenants simply stopped making more complex adjustments for a while and used traditional manual controls instead. However sometimes it took many days for them to start trusting eHome UIs again after a problem had occurred. Also if there was a network problem and a device could not be adjusted remotely the users thought it to be very annoying. It was also very difficult for the users to locate the fault, which in turn increased the feeling of frustration.
The eHome taught us a lot about practical issues around smart homes. The increasing amount of technology and complexity in our lives can lead to worries about losing control [3]. In the eHome, for example, the users were worried about forgetting to turn off home appliances when they left the home. The female tenant even had a habit of unplugging everything that was not used when going away for a few days; she was worried about possible fire risks. Once before in her previous apartment she had accidentally unplugged the freezer, which of course resulted in lots of spoiled food. A temperature sensor inside the freeze would have warned about this. The eHome tenants were thus happy about having the possibility to monitor and turn off equipment remotely, it increased their feeling of security. Remote control of lights and appliances can also help in reducing energy usage, especially if heating could be controlled. The tenants also commented that a future smart home control system should contain some kind of adaptivity and proactivity. The eHome implementation did not learn new rules and behaviour on its own, it had to be pre-programmed or set by the users. Furthermore, the tenants also pointed out that it is not desirable to have an automated home with things happening without any influence from the users. Instead it is important to let users have control, or at least a sensation of being in control of the networked devices. On the other hand, constantly having to adjust or control something is not desirable either, which leads to quite a controversy [5]. A proper solution might be a home controller with a certain degree of automation, which could be overrun and set by the users. Additionally the tenants saw the implemented system slightly limited as far as its capabilities were concerned. More adjustable devices, features and sensors would have increased the usefulness of the eHome system.
5. Smart Home Challenges
The biggest challenge smart home researchers face is the lack of standardised or completely missing communication interfaces in home electronics. This problem can be alleviated by using adapters and converters, however there are limits on what each interface can do and usually some functions remain unavailable. Another practical obstacle becomes obvious when installing networks and devices in older buildings. Even wireless networks require power cabling, and equipment need their own installation space. In cases like these it is advantageous to use existing cabling (phone and power lines, cable ducts etc.) as much as possible. For energy savings control of heating, ventilation and air conditioning (HVAC) would be a must, unfortunately in most apartment buildings it is not possible to sufficiently affect the temperature inside a single apartment or even in a room. Problems regarding how adding new devices should be worked out depend largely on the infrastructure used. In a proprietary

customised network it might require large modifications to the infrastructure and UIs in order to fully utilise the new device. Even if the protocol and network would support on-the-fly addition of devices the biggest challenge lies in creating dynamic UIs that automatically change when changes have been made in the infrastructure. Service discovery protocols, plug-and-play networks and dynamic UIs are a viable but extremely complicated solution to this problem.
When considering a scenario like the eHome, where prototype devices have to work 24/7 we also have to think about reliability and software stability issues. If a device malfunctions, a fuse is blown or the control software crashes how can the problem be fixed? In what way does it affect the functionality of other devices, and how quickly can it be repaired? The inhabitants have also got to be taken into account, as their lives should be as unaffected by these possible faults as possible. Some problems can be solved by a simple flip of a circuit breaker or a reset button, but in worse situations someone has to go over and perform repairs. With a remote connection to the eHome it was possible to remotely switch off relays and thus reset devices, as long as the Internet connection was up and running. The tenants were also able to reset the server in case of a hardware/software crash, but more involvement in the debugging process was not desired or allowed. A question of reliability also surfaces, because even today’s technology that is rushed onto the market is largely untested, barely working and usually needs software updates right from the start. How can users cope with these kinds of problems if they continue to spread to home appliances and control systems? This might require third party services, possibly a caretaker or support company that assists users providing smart home services and support.
From a human point of view the concept of smart homes is rather unfamiliar to the average user [7] and this, together with new technology, often leads to suspicions and prejudices. The home is also considered a very private and personal environment, and ubiquitous electronics and sensors that monitor and make adjustments can be seen as intrusive [9]. The issue around privacy is a difficult one to tackle, even physically hiding or embedding sensors will not help if the users know that they are being monitored in some way.
6. Conclusion
The eHome project was a unique study, which concentrated on finding out how a smart home would function in everyday life and what kinds of functionality it should provide to its users. This practical study revealed results that would not have been discovered in theoretical laboratory tests. It would seem that the most desirable functions of a smart home are indeed various user interfaces that allow more flexible control of the home. The home should also contain learning and adaptive functions, which would gradually allow users to leave some functions to the Home Controller. However as long as there are no compatible devices on the market it seems that there is a long way to go before smart homes really become commonplace. After the eHome the development of smart homes still continues at the university Smart Home lab in the form of a proactive, adaptive space.

About the author
Lasse Kaila started working with smart spaces and devices at the Institute of Electronics in 1999. He received his Master's degree from Tampere University of Technology in 2001 and he is currently writing his PhD thesis on smart home implementations. He has a background in electronics design, embedded devices and personal electronics.
7. References
[1] R. Harper : Inside the Smart Home, Springer verlag, 2003, 264 p. [2] C. D. Kidd et. al. : The Aware Home: A Living Laboratory for Ubiquitous Computing
Research. Proceedings of the Second International Workshop on Cooperative Buildings, CoBuild’99, 1999.
[3] Mozer, M. C., Lessons from an adaptive house. In : Smart environments: Technologies, protocols, and applications, pp. 273-294, 2005.
[4] Philips Research, What is Ambient Intelligence?, (March 2, 2004), Available at http://www.research.philips.com/technologies/syst_softw/ami/index.html [Accessed: August 20, 2007].
[5] F. K. Aldrich : Smart Homes, Past, Present and Future. Inside the Smart Home, 2003, Springer, London.
[6] W. Green, D. Gyi, R. Kalawsky, D. Atkins : Capturing user requirements for an integrated home environment. Proceedings of the Nordic conference on Human-Computer Interaction, NordiCHI ’04, Tampere, Finland, October 23-27, 2004.
[7] S. Leppänen et.al. : Smart Home, from pilot to mass product (in Finnish), TEKES project report, 2004.
[8] T. Koskela, K. Väänänen-Vainio-Mattila : Evolution towards smart home environments: empirical evaluation of three user interfaces. Personal and Ubiquitous Computing, 2004, Volume 8, Issue 3-4, pp. 234 – 240.
[9] F. Mäyrä, A. Soronen, J. Vanhala, J. Mikkonen, M. Zakrzewski, I. Koskinen, K. Kuusela : Probing a Proactive Home : Challenges in Researching and Designing Everyday Smart Environments. Human Technology, 2006, volume 2, pp. 158-186.

Home deployments for independent living
Aaron Quigley, Michael McGrath, Paddy Nixon, and Terry Dishongh
University College Dublin, Ireland and Intel’s Digital Health GroupTechnology Research for Independent Living (TRIL) Centre
{aaron.quigley,paddy.nixon}@ucd.ie,
{michael.j.mcgrath,terry.dishongh}@intel.com
http://www.trilcenter.org/
Abstract. This paper reports on the research and data/infrastructurechallenges faced in moving pervasive computing technology to large num-bers of home deployments from both a controlled clinical and laboratorysetting. The purpose of these home deployments is twofold; to providea number of services to a cohort of elders and to collect a rich array ofphysiological, environmental and computational context data for clinicalstudy. By adopting a scenario based design framework we can incorporatethe results from ethnographic study, ongoing application development tohelp realise a suite of hardware, software, services and sensors from ourtechnology platform suitable for in-situ study.
Key words: Home Deployments, BioMOBIUSTM, context management,data management, TRIL
1 Introduction
The TRIL Centre is a coordinated collection of research projects addressing thephysical, cognitive and social consequences of ageing, all informed by ethno-graphic research and supported by our BioMOBIUSTM, Research Platform: anopen, shareable software and hardware system. A component of the researchplatform is a hardware element called SHIMMER (Sensing Health with Intel-ligence, Modularity, Mobility, and Experimental Reusability). This is a smallwireless sensor platform designed to support wearable sensing applications suchas wirelessly monitoring patients with neurological disorders [3].For our research, the motivating question from the call for this workshop is,“why do we want to put technologies in people‘s homes and what does it reallytake for that to be successful?” In our home deployments we aim to collect richcontext data to help elders prevent falls, improve their cognitive function andto improve their social connection. To be successful in the short-term, our inhome deployments must collect high quality context data suitable for clinicalresearch and for useful feedback to the elder. In the long-term, to be successfulour technologies must ultimately help elders “age in place”, ideally in their ownhomes.For our research, we adopt a form of scenario-based design and development.

Figure 1 shows a single pass through our process from concept through to in-home evaluation. In practice, different phases of this process are occurring inparallel at differing levels of maturity akin to a spiral model. For initial analysis,lab/clinic analysis and in-home study, stakeholders and details of current prac-tice are collected through both clinical and ethnographic research. The ongoingethnographic research consists of both direct investigation and observation in-cluding, in-clinic and in-home interviews, field studies, and questionnaires. Thisprovides a real-world understanding of what old people need, what they find ac-ceptable and how their quality of life can be improved. This is a ongoing process,which is reflected on at every phase as new technologies or more refined clinicalquestions are proposed.
Fig. 1. Our technology transfer from concept, through clinical/lab trial to home de-ployment
The initial analysis phase also includes clinical modelling that seeks to iden-tify which behavioural markers which can be reliably correlated with specificconditions. For example, a limited time spent outside the home could be associ-ated with an increasing risk of social isolation. Specific activity scenarios allowa clinical researchers to establish the exact context data to be collected to iden-tify these behavioural markers. The initial design of a particular solution is aniterative process including storyboards, interaction design, sketches and groupdiscussion.We have developed the BioMOBIUSTM, research platform given the nature ofthe problems to be studied. This acts as a common technology platform of hard-ware, software, services and sensors. This platform supports the development ofboth health care monitoring applications using wearable technologies but alsomore traditional pervasive computing applications which rely on a rich sourceof context data. The platform supports rapid application prototyping includingbody worn and environmental sensors, local and remote systems, data process-ing, biosignal processing and customised interfaces. The creation of these initialprototypes as shown in Figure 1 (A), typically act as a “sketch” for engineers,designers and clinicians to discuss and work with in the next phase.In practice the prototypes developed allow the clinicians to understand the fullrange of data which can be collected. Such prototypes are refined through arange of inputs including results from preliminary data analysis, new or refined

technologies, ethnographic results, and experimental design conditions. After aninitial evaluation, a refined application can be used in a controlled lab experiment(trial) by researchers or in an actual clinical experiment (trial) by clinicians, Fig-ure 1 (B). Both summative and formative evaluation processes are undertakenin the ongoing use of the application.At this point, these applications are designed to collect rich experimental datasets from controlled clinical and laboratory experiments. These experimentsrange from highly instrumented elders (Electroencephalography skull caps) andenvironments (sudoku games) with dozens of participants through to large scaleclinical data collection (video/accelerometor data) with hundreds of participantsover the course of a year. In either case (lab or clinic) the environment can beclosely monitored to ensure the data collected is useful for behavioural markerstudy as noted in Figure 1 (B).
Fig. 2. Remote Interaction Storyboard Fig. 3. Home Instrumentation Story-board
The end to end scenario-based design and development process described sofar is straight forward. The analysis, design, protoype and evaluation steps arein a well controlled environment as described in Figure 1 stages A and B. Sto-ryboards such as those shown in Figures 3 and 2 are used in the design phaseas noted in C of Figure 1. These storyboards provide a view of the extent of thein-home computing environment in terms of the deployed services and sensors.In addition, these storyboards help convey the required and appropriate levelof detail in the data collection and sharing between home and researcher, orbetween end users. Section 2.2 describes these data issues in more detail.Translating the applications or prototypes developed from a lab or clinic settinginto a home requires us to develop refined scenario descriptions before a homesystem can be built and its impacts felt. Figure 1 suggests the design of homeand remote pervasive computing applications occurs once the previous phase iscomplete. However, our spiral model of scenario-based design and developmentallows us to leverage the ongoing ethnographic, prototype, application develop-ment and lab/clicnic trials, in parallel. A further strength of this approach isthat we can identify cross-overs between projects and stakeholders who can par-ticipate in multiple studies for the individual projects in the physical, cognitiveand social consequences of ageing.

2 Home Deployment
The BioMOBIUSTMResearch Platform is a system for rapid application pro-totyping and the development of both clinical and in-home systems for healthcare monitoring and social connectedness. These three phases can loosely be de-scribed by the three boxes as shown in Figure 1. In the home, once deployed,the infrastructure forms the basis for further pervasive computing at home op-portunities. As a common sensor, computing and communications platform forin-home research it can be used to support the application needs of a range ofstakeholders, from end users through to system administrators.One example application consists of a series of in-home sensors (pressure sensor,galvanic skin response and video cameras) along with hand-held devices andprocessing elements. This application collects the behavioural markers and pro-vides feedback to the older person, to carers and clinicians. The collected datais securely stored both locally and hence remotely to a central infrastructure.
2.1 In-Home Application Users
In the first home deployments we must collect high quality context data suit-able for both clinical research and for context-aware feedback (audible, hapticor visual) to the elder. In our typical home based deployments there a num-ber of stakeholders to consider, who can be defined by the following conceptualgroups, Subjects (elders), Family, who may sharing data for social applicationsand certain alerts, Extended Social Network, Primary Clinical support such asa nursing specialist or physiotherapist, Secondary Clinical Support such as clin-icians and researchers, and System Administrators. In a clinical or lab settingwe have other stakeholders such as interaction designers, biomedical engineers,hardware engineers, software engineers who are involved with analysis, design,prototyping, development and evaluation. Once deployed to a home setting forlong term study, many of these stakeholders cannot be involved to ensure theuser to user or user to Primary/Secondary Clinical support remains undisturbedand can be hence evaluated.
2.2 Data Collection
Our system consists of two components. The Home Deployment Platform whichcollects, processes, shares and persists data in the home, and a central compo-nent known as CITADEL (Central Infrastructure for TRIL Acquired Data fromExperimental Locations) which processes the data collected from the remotesites at a central location. The CITADEL is used for to support both clinicaldata and a myriad of end-user to end-user services.
At the lowest level as shown in Figure 4, all of the context data collectedthrough an end-users interaction with an application can be captured, processed,analysed and retained at its highest level of quality. The platform supports thislevel of data collection from wireless and fixed sensors, cameras, audio recorders

Fig. 4. View of data collection in terms of volume of data versus levels of abstraction
and other computational elements. The software aspects consist of a range ofsoftware blocks for arithmetic and mathematical operations, digital signal pro-cessing, video processing, display, data acquisition (from various interfaces suchas serial, Bluetooth) and file/database access. However data collection at thislevel results in a vast amount of data which may include both raw audio and videofeeds. Clearly, to collect, process and retain such voluminous datasets from manylocations would require massive amounts of storage in the CITADEL. Instead,we aim to support context aware applications which process these voluminousdatasets locally through inference. Some of this inference comes from clinicalmodels established in the lab/clinic trials. Other aspects of this inference comesfrom standard pattern detection which extracts signatures from the raw datasources (eg. stick figures, aggregate noise levels per hour, average duration ofsitting in a particular seat). Other classes of application at this level are directsuch as medication reminder or social interaction applications such as digitalscrapbooks [7].At the next level in Figure 4 will be a class of end user application which willlog data from a range of sensors tied to specific end user applications (fallsdectors, cognitive state measurement games, audio bridge applications). Someexperiments will require specific end user consent to release the data back tothe researchers. Facilities also need to be introduced to allow users to blackoutor obfuscate experimental results to help preserve their privacy. Generally, thevolume of data collected at this level will be less than the raw data streams andit will often be acquired in an asynchronous manner.

At the next level in Figure 4, many forms of context-awareness in terms of localprocessing, aggregation and filtering will be built into the end user applications.As a result minimal amounts of data may need to be persisted locally and henceremotely to the CITADEL. In addition, some of the user context may be con-verted into inter-application state data for multi-party applications. Examplesof such include “user is online” state transfer to other users in family awarenessapplications or aggregate location data for “family whereabout clock” applica-tions. Clinical examples may include remote monitoring of Sudoku game playby therapists and clinicans in the Cognitive strand projects.The highest levels of abstraction may provide data in a highly anonymised formor data for each user in a highly obfuscated manner. Examples which can berealised at this level include location based applications [5] which push user lo-cation at a country level to a social networking site or applications which sharepublic photos locally with others [1]. Moving further up the levels of abstractionwe see less and less raw data collected and increasingly more abstract viewsof a users interaction or data stored or shared. Data collection at these levelswhile more abstract is also much smaller (in terms of both storage and networkbandwidth use).
3 Discussion
The nature and scale of our home deployments to hundreds of elders, informed bylab and clinical trials, makes these applications and the supporting infrastructureideal for the study of “pervasive computing at home” research questions. Ourevaluation methodology to date has been as expected for lab and clinic basedtrial. The lessons learnt from these trials along with the ongoing ethnographicstudies has focussed our design process on the need to blend our technologies intothe devices and objects currently in use. This is particularly important for thosewith cognitive issues or a propensity to fall. The layout of their homes providesa “framework” for supporting their mobility as well as helping maintain theirregular patterns of life. For our home deployments a particular challenge stemsfrom the need to both collect high quality context data suitable for en-masseclinical analysis at the same time as providing relevant and useful pervasiveapplications and services to our elder cohort. This is in contrast to a standardview of pervasive applications where only user generated content and sufficientinformation for developed inference models needs to be retained.
4 Acknowledgements
This research is supported by a grant from Intel and by the Irish DevelopmentAuthority. Thanks also to all the TRIL Technology Platform team and in par-ticular Ben Dromey our a TRIL designer in UCD for the story boards in Figures2 and 3.

References
1. Trent Apted, Judy Kay, and Aaron Quigley. Tabletop sharing of digital photographsfor the elderly. In CHI ’06: Proceedings of the SIGCHI conference on Human Factorsin computing systems, pages 781–790, New York, NY, USA, April 2006. ACM Press.
2. Kenneth P. Fishkin, Bernt Schiele, Paddy Nixon, and Aaron J. Quigley, editors. Per-vasive Computing, 4th International Conference, PERVASIVE 2006, volume 3968of Lecture Notes in Computer Science. Springer, May 2006.
3. Konrad Lorincz, Benjamin Kuris, Steven M. Ayer, Shyamal Patel, Paolo Bonato,and Matt Welsh. Wearable wireless sensor network to assess clinical status in pa-tients with neurological disorders. In IPSN ’07: Proceedings of the 6th internationalconference on Information processing in sensor networks, pages 563–564, New York,NY, USA, 2007. ACM.
4. Aaron Quigley and David West. Sharing memories, the ubicomp scrapbook. InAdjunct Proceedings The Sixth International Conference on Ubiquitous Computing(UbiComp 2004), September 2004.
5. Aaron J. Quigley and David West. Proximation: Location-awareness though sensedproximity and gsm estimation. In Thomas Strang and Claudia Linnhoff-Popien, ed-itors, Location- and Context-Awareness, First International Workshop, LoCA 2005,pages 363–376. Lecture Notes in Computer Science, Springer, May 2005. LectureNotes in Computer Science.
6. Peter Risborg and Aaron Quigley. Nightingale: Reminiscence and technology - froma user perspective. In OZeWAI 2003: Australian Web Accessibility Initiative. LaTrobe University, Victoria, Australia, December 2003.
7. David West, Aaron Quigley, and Judy Kay. Memento: A digital physical scrapbookfor memory sharing. Journal of Personal and Ubiquitous Computing, 11(4):313–328,April 2007. Special Issue on Memory and sharing of experiences.
5 Biography
Aaron Quigley is an academic staff member of the School of Computer Science& Informatics UCD. He currently directs a team of 22 (postdocs, postgrads andresearch engineers) with support from colleagues. His research interests are inPervasive Computing and Visualisation. He is one of the Principal Investigatorsfor the TRIL Centre on the Technology Platform. He is the program co-chair forLoCA 2009, the Late Breaking Results co-chair for Pervasive 2008, the co-chairfor PPD’08 and was the conference chair for Pervasive 2006 [2]. He has pub-lished over 60 peer reviewed publications including book chapters and researchpapers in leading journals, conferences and workshops along with several editedproceedings with 30 on Pervasive Computing. His publications in this area haveincluded projects incorporating technology probes [6], in-lab experiments [5],demonstrations [4], elder user trials [1] and comparative age group trials [7].

Bringing IMS Services to the DLNA Connected Home
Johan Hjelm1, Toshikane Oda1, Andreas Fasbender2, Shingo Murakami1, Ayodele Damola3
{firstname.lastname}@ericsson.comEricsson Research Japan, Koraku Mori Bldg. 1-4-14 Koraku, Bunkyo-ku, Tokyo 112-004
JapanEricsson GmbH, Kackertstrasse 7-9, D-52072 Aachen, Germany Ericsson AB, Torshamnsgatan 21-13, 164 80 Stockholm, Sweden
Abstract. DLNA is a leading standard for consumer electronics devices. But it does not enable remote devices to connect to services in the home, using the IMS-based networks now being rolled out by telecom companies. We present a solution for interworking DLNA and IMS, and discuss the implications. We also describe how to enable IMS services on DLNA devices.
INTRODUCTION
DLNA [5] is emerging as the driving standard for the control and coordination of media services in home networks. The number of DLNA compliant devices already ranges in the hundreds, with a steady stream of new devices emerging on the market. But while DLNA is a successful technology inside the home network, it is not designed for global connectivity.
At the same time, in the telecommunications sector, the IP Multimedia Subsystem (IMS) [2], [3] has emerged as a strong contender for managing multimedia services in telecoms networks. IMS provides authentication, authorization, and other security functions, as well as quality of service. These services are typically implemented in fault-tolerant, high-reliability servers.
IMS has found multiple uses outside the VoIP services it was originally targeted to provide, for instance in messaging, presence information, and IPTV.
DLNA, while a technology to enable simple and easy sharing and viewing of media in the home, is constrained when it comes to enabling access to services outside the home, since it does not have functions to discover services in the wide-area network. Nor does it have the security functions required to authenticate and authorize devices towards the network. DLNA, as based on UPnP, also does not have a notion of a user, since the technology only tracks the device.
The strong necessity of interoperable home devices has enabled DLNA to gain wide acceptance, but at the same time this is what is holding it back from use with services which require wide-area technology.

Requirements of an interconnection Function
The interconnection between the IMS network and the DLNA network is managed by the Home IMS Gateway – the HIGA. The HIGA provides devices like DLNA devices with a way to connect to the IMS network without having an IMS client [12]. By this principle, the HIGA enables all IMS services to be leveraged by DLNA devices.
The HIGA contains added functionality compared to current home networks and residential gateways (RGW) [1]. It is equipped with an ISIM issued by the IMS operator, which is tied to the identity management.
It also has an identity model, which enables the mapping of multiple users and services onto one single IMS private identity [12]. IMS enables the adaptation of media to devices, by providing functions for device characteristics description; and it supports means to setup communication sessions with guaranteed Quality of Service over the network.
In IMS, it is the user, not the device, who is authenticated to receive access to services. In DLNA, and the UPnP protocol which it leverages, it is the other way around. Hence, the HIGA Identity Management function supports mapping of device identities in the home LAN to user identities (IMPU’s) in the IMS network.
When used with DLNA devices, one of the primary uses of the HIGA is to open the appropriate ports in the NAT. The home network is assumed to be behind a NAT, which is controlled by the HIGA, using for example UPnP IGD. This enables NAT traversal for both signaling and media traffic, though HIGA is typically not involved in the media plane.
There can be several types of signaling in a home network, involving different protocols which have different features, for instance the notion of sessions. Sessions represent a duration of connection [6], and are enabled by SIP. DLNA, on the other hand, is oriented towards transactions, and HTTP as the underlying protocol is by definition stateless and no persistence is assumed.
In case of SIP clients, the HIGA converts IMS messages to SIP messages and vice versa, which means adding or removing the IMS-specific parts of the SIP signaling when it is addressed outside the home network. However, this will not enable DLNA devices to connect to use IMS services. To do that, an additional function has been added to the system: The IMS-DLNA Gateway.
This gateway translates the messaging and protocols from the IMS signaling, to the DLNA signaling, and additional semantics on top of HTTP such as SOAP. The semantics of the messages also have to be translated. In addition, this module of the HIGA has to act on the media plane. The emerging IPTV architectures under definition in e.g. TISPAN, DVB, Open IPTV Forum, and ITU-T are based on RTP as the transport protocol for media streams, whereas DLNA devices use HTTP by default [16].

IMS Services in DLNA environments
IMS Services Gateway
IMS enables a number of specific services, such as Push to Talk over Cellular [8] (PoC), Immediate Messaging (IM) [9], or IP Multimedia Telephony [10], and IPTV [16]. These are not available on non-SIP devices today. But they can be made available as native services using an API. This takes the integration of IMS and DLNA devices one step further than the IMS-DLNA Gateway.
One way of exposing IMS functionality to UPnP devices is to define new UPnP functionality (according to [4]), the UPnP - IMS Services Gateway (ISG). The ISG exposes the IMS services to UPnP devices, for instance by providing a SOAP API addressable over UPnP. The use of the ISG will enable UPnP devices to invoke IMS sessions and to exchange event notifications with the IMS core using relevant functions of the HIGA.
Given the increasing tendency to use the Web Services paradigm in CE devices, we have been developing a conceptual Web Services ISG interface. The interface defines an abstraction layer enabling multimedia devices supporting arbitrary home networking technologies to access IMS services. The interface consists of modules or wrappers responsible for different technologies such as CEA-2014 [14], UPnP Remote User interface (RUI) etc. Each module exposes functions which map to methods in the underlying SIP stack or a high-level API e.g. JSR 281 [15]. The services accessible via the interface would depend on the device’s capabilities such as the presentation layer, communication protocols, media rendering and serving capabilities.
IMS-based IPTV
As discussed in [13] and [16], television is one of the future services where IMS can be leveraged. The IMS systems enables the setup of a control infrastructure, which lets the user control the media in a way which gives the same service experience as today’s terrestrial TV – while at the same time enhancing it to include new functions for personalization and interactivity.
Adding these features are crucial to the success of IPTV, enabling service providers to add value, instead of just moving the traditional TV experience into a different kind of cable.
Making this available to users of DLNA devices, however, requires conversion both of protocols and signaling. This is one of the functions of the IMS-DLNA Gateway.

Presence
A presence and instant messaging system [9], [11] allows users to subscribe toinformation about each other and be notified of changes in state, and for users to sendeach other short instant messages. This typically includes information like happy/sad, available/not available, etc.
In the IMS presence system the authentication and authorization features of IMS are leveraged to determine who is allowed to subscribe to information, and also who is able to get which information. The same system can be used to manage the user’s personal profile, which can be used as a basis for personalization of services.
Making this available to users on DLNA devices requires the translation of the signaling and data from the SIP-based infrastructure for presence to the HTTP-based infrastructure of DLNA.
Conclusions
We have presented an open standards based solution for interconnecting DLNA devices with IMS-based services.
All above-mentioned services can not be realized on a DLNA device, since they require signaling of a type which the DLNA device is not set up to manage. However, by including the HIGA, the home network can become a part of the IMS network of the operator. We also introduced an IMS-DLNA gateway, and added an IMS Services Gateway which enables the user of the DLNA device to leverage services on the IMS network.
Combining DLNA and IMS to provide the strengths of both the flexible home network and the managed global telecommunication networks has been the key goal. It also supports secure remote access to home services and to personal media from any IMS device.
References
[1] Home Gateway Initiative – http://www.homegateway.org[2] 3GPP IMS – 3rd Generation Partnership Project; Technical Specification Group Services and System
Aspects; IP Multimedia Subsystem (IMS); Stage 2 (Release 8), 3GPP TS 23.228, available from http://www.3gpp.org
[3] ETSI TISPAN NGN – http://portal.etsi.org/tispan[4] UPnP – http://www.upnp.org[5] DLNA – http://www.dlna.org. [6] SIP RFC 3261, J. Rosenberg et al., SIP: Session Initiation Protocol, June 2002. [7] UUID RFC 4122, A Universally Unique Identifier (UUID) URN Namespace, July 2005. [8] PoC specifications,
http://member.openmobilealliance.org/ftp/Public_documents/POC/Permanent_documents/OMA-AD-PoC-V1_0_1-20061128-A.zip
[9] IM specifications, http://member.openmobilealliance.org/ftp/Public_documents/MWG/IM/Permanent_documents/OMA-AD_IM_SIMPLE-V1_0_0-20040907-D.zip

[10] MMTel specifications, IP Multimedia Core Network Subsystem (IMS) Multimedia Telephony Service and supplementary services; Stage 1, 3GPP TS 22.173, available from http://www.3gpp.org
[11] Presence specifications, http://member.openmobilealliance.org/ftp/public_documents/PAG/Permanent_documents/OMA-AD-Presence_SIMPLE-V2_0-20070425-D.zip
[12] An IMS Gateway for Service Convergence in Connected Homes, Torbjörn Cagenius, Andreas Fasbender, Luis Barriga, FITCE 2006, Athens, Greece.
[13] Evolving the TV experience – Anytime, anywhere, any device. Torbjörn Cagenius, Andreas Fasbender, Johan Hjelm, Uwe Horn, Ignacio Más Ivars and Niclas Selberg. Ericsson Review n:o 03, 2006.
[14] CEA-2014, http://www.ce.org/standards/StandardDetails.aspx?Id=2865&number=CEA-2014[15] JSR 281, http://www.jcp.org/en/jsr/detail?id=281 [16] Open IPTV Forum, http://www.openiptvforum.org/
The authors wish to acknowledge the support of their employer, Ericsson, and their colleagues; as well as their colleagues in Sony, who have been instrumental in the cooperation from which this work is resulting. .

Pervasive Help @ Home: Connecting People Who Connect Devices
Mark W. Newman and Mark S. Ackerman
School of Information and Electrical Engineering and Computer Sciences Department
University of Michigan Ann Arbor, MI 48109 USA
{mwnewman,ackerm}@umich.edu
Abstract. We propose a system to allow users of domestic pervasive computing technology to receive indirect help regarding the composition and control of their systems of devices from other users with similar configurations. Our work extends previous work on end-user composition and collaborative assistance and is based around the notion of a shared repository of compositions (called the Composition Community) from which end-users can receive information about typical and best-practice service compositions that are contributed by other community members. A Composition Monitor automatically determines the composition of each user’s network, allowing contributions to the repository to be made without explicit effort. A Composition Visualizer allows users to view and compare different compositions in order to choose the most appropriate one for their needs. The goal of our work is to bring together the knowledge and collective problem solving skills of diverse users who are currently isolated from each other in their separate homes.
Keywords: pervasive computing, home computing, end-user composition, collaborative help
1 Introduction
Each home is a technological island. New devices and services enter each home and populate niches that is particular to the specific not only to their specific functions but to the other technologies already present, with which they must coexist, interoperate, or compete. The home is also an island in the sense that each home’s inhabitants are isolated from other home’s inhabitants, even as they each struggle to comprehend, configure, and control the various technologies with which they each live.
The goal of our project is to allow users to receive help relevant to the control and configuration of pervasive computing technology in the home. A centerpiece of our approach is to allow users to benefit from the work of other users with similar environment compositions. If we can find a way to harness the experiences of the vast range of users of ubiquitous environments, the ability to find a solution to any problem that arises becomes increasingly tractable. Using this approach, a user

wishing to change the functionality of their environment—whether to add new capabilities or to recover from a breakdown by restoring it to a previously attained level of functioning—can take advantage of information about the configurations of large numbers of others users’ environments that have been more or less successful at providing the desired functionality. This amounts to a new form of collective help that can be of great value, perhaps even essential, to the ability of users with a wide range of skill, motivation, and patience to manage and control their individual ubiquitous computing environments.
The purpose of this position paper is to argue the need for collaborative help facilities in pervasive environments, briefly survey the related work, and outline requirements for a system that would provide help to users who will increasingly need to configure, manage, and control pervasive computing systems in their homes.
2 Related Work
The primary goal of this research is to support user control over pervasive computing environments by providing help with composition and maintenance. There are two key areas of related work that must be considered: attempts to support user control and composition in ubiquitous computing environments, and techniques to provide help to users of interactive systems.
2.1 End-User Composition in Ubiquitous Computing Environments
A central focus of our work is supporting end-user composition. By “composition” we mean the work that must be done in order to configure the constituent components of a ubiquitous computing environment to ensure that commands will function properly, information will be delivered properly, and automated behaviors will execute properly.
Supporting the ability of users to govern the automated behavior of ubiquitous computing environments has received some attention in prior literature. The Jigsaw Editor [13], CAMP [16], and iCAP [5] all allow end-users to create rules that associate the behaviors of different components within a ubicomp environment. In each of these systems, a major focus was on exploring the value of novel interaction techniques (respectively: assembling jigsaw puzzle pieces, composing magnetic poetry, and informally sketching if-then action rules) and to learn more about what users would like to be able to do with an environment supporting context-aware and/or sensor-driven interaction. The projects did not address the maintenance of the system or its behavior over time, facilities to allow users to receive help with the composition task, or the ability of users to understand current and possible future states of an environment when the environment configuration(s) depicted were not recently created by themselves.
Newman’s previous work on end-user composition was concerned with allowing users to access command and composition capabilities from a single point of control. Additionally, this work explored the creation, modification, and invocation of re-

usable templates to allow end-users to create (and potentially share) custom configurations of devices and services for particular interactions [9-11]. While this work provides a foundation for the current project, it did not address the need of users to receive help when creating or modifying compositions, nor did it provide facilities for visualizing and understanding complex pervasive environments.
2.2 Help and User Assistance
Help has been an HCI research problem for over 20 years. During the 1980s, help was largely seen as answering immediate questions about applications and occasionally operating systems. Help was largely documentation-centric, and initial research focused on how to design and deliver help documentation so that it could be used more effectively (e.g., [7, 12]). In the 1990s, with the advent of networks and CSCW, emphasis began to shift away from formal documentation, prepared in advance, to ad-hoc queries to other people and research began to explore the possibilities of using computer-mediated communication (CMC) systems such as email and bulletin boards for help (e.g., [6, 14]). Ackerman's Answer Garden series ([1, 3]) was one such attempt to combine hypermedia, information, and people into a help network.
Recently, help as a research area has become somewhat moribund. The standard solution for users seems to be to google for answers to problems or to ask on a myriad assortment of webboards. For many problems, particularly time-sensitive and complex problems, these solutions are not optimal.
While some research continues (e.g., investigations of Web-based online Q&A communities [19] and wikis [15], tools to support authoring and distillation of informal communication [8], and studies of collaborative help system [2, 17], there have been as yet no attempts to consider help as a context-aware collaborative problem in pervasive environments.
A goal of our project is to “restart” user assistance within HCI and within the pervasive computing research community. Little, if anything, has been done recently to consider how help might be brought into the next generation of computational environments. Without this functionality, users will be left to their own, facing problems that will become increasingly difficult and complex. It is, in our opinion, unlikely that users will be able to adopt open ubiquitous computing environments without some assistance.
3 Collaborative Help in the Pervasive Home
Our proposed system (shown in Figure 1) consists of three interrelated elements:
1. Facilities (e.g., user interfaces) to allow users to understand compositions, especially the differences between otherwise similar compositions and the areas where deviations from previous states have occurred.

Figure 1: An overview of a proposed system for delivering collaborative help to users of pervasive computing environments. We plan to develop facilities for visualizing (CV), provisioning both community- and expert-generated help (CC and BCS), and automatically detecting and sharing compositions (CM).
2. Shared repositories that allow users to benefit from the collective work of other users who have successfully configured their environments, along with techniques for identifying compositions in the repository that are similar to the composition for which help is being requested. shows the technical components that will implement (1) and (2).
3. Mechanisms for automatically collecting information about users’ compositions and depositing the information in a shared repository.
3.1 Visualizing Compositions
For users to identify opportunities for improvement or repair and make informed decisions about how to operationalize changes to their environments, they must be able to rapidly view the configuration and status of their environments. In addition, they must be provided with information about how their configurations differ from other possible configurations that may be “better” in some way (e.g., featuring additional functionality, operating more smoothly). Thus, the first component of our system is the Composition Visualizer (CV), which allows end-users to reason about their configurations and compare it against others’.
In order to illustrate the usefulness of CV, we present a pair of scenarios that show how such a tool could be used for diagnosing an emergent problem and for modifying an environment to support new functionality.
Scenario 1: A Broken Thermostat On Thanksgiving morning, Joe realizes his living room’s context-dependent thermostat no longer seems to work. He would really like to get the system going again before his Thanksgiving guests arrive to a 40 degree1 living room. Joe doesn't really know how to debug his house—he just wants it to work. Using CV, Joe immediately sees that his “People tracker” service (a service that detects which rooms are occupied by people) has failed to communicate with the thermostat in the past 48 hours—a deviation from the previous several months when 100s of messages per day
1 The reader may assume Celsius or Fahrenheit—the story works equally well either way.

passed between them. By exploring with CV, Joe is able to determine that there is a discrepancy between the thermostat’s recently upgraded firmware and the version of the People Tracker service he is running. Using this information, Joe is able to get both services in sync and repair the problem (see Figure 2).
(a)
(b)
Figure 2: In this illustration of a possible sequence of interactions with a composition visualizer (CV), a user (“Joe”) views a composition involving his thermostat, and notices that a communication failure has been detected between his “People tracker” service and the thermostat (a). He then elects to see relevant composition information from “Everyone’s networks” and explores the discrepancy between the state of his thermostat and the most commonly found state for similar thermostats (b). By exploring further, he is able to see that the problem lies in the fact the he is still running an older version of the person tracker service. Based on this information, he decides to upgrade the person tracker service to the latest version.

Scenario 2: Augmenting a Context-Aware Alarm Clock In a conversation at the grocery store, Margaret learned from her neighbor Tom that he had figured out how to automatically reset his children’s alarm clocks on snow days. She’d like to know how to add that functionality to her own home. Using CV, she is able to explore a variety of compositions that involve her son Max’s alarm clock. She is intrigued by several suggestions for associating traffic conditions and airline flight status information with wake-up time, but passes them by and eventually finds a composition (perhaps Tom’s) that uses information from the local Snow Day Alert web service to disable the alarm clock when the schools are closed. She happily adds the new composition to her own environment.
Goals for a Composition Visualizer As can be seen from these scenarios, an effective visualization tool that allows users to understand task-relevant relationships and details can enable users to create and modify compositions that would otherwise be quite difficult to work with. Moreover, obtaining help from document-centric sources or web-based discussion boards would be unlikely to provide an actionable solution for either of these scenarios.
The key issues in designing and evaluating CV will be determining what information about compositions (their own and others’) is most important to present to users, developing effective ways of representing the most relevant information, and providing users with the necessary controls to efficiently interact with and refine the visualization to obtain the information they need. As indicated by the scenarios described above, we believe that anomalies (e.g., divergence from previous known “good” states or divergence from commonly-used patterns) are a particularly significant type of information to display. For example, it is valuable for a user to know when the current state of a composition has diverged from a previously known “good” state. Another key challenge will be to find effective ways to encapsulate or “black box” portions of the network in particular situations so that the visualizations do not become overwhelmingly complex while still providing users with the information they need in order to troubleshoot and/or augment their environments.
3.2 Providing for User Assistance in Composition
Given that the goal of CV is to allow users to be made aware of anomalous configurations found within their environments and to explore new functional capabilities that from which they could benefit, we turn now to the question of where such information could come from. The Composition Community (CC) provides storage and retrieval mechanisms for meta-data about services, and more importantly, about compositions. It also allows power users or others to annotate services and compositions.
A service in each home (the “Composition Monitor” described below) will upload the current configuration of that home’s environment in a privacy-preserving manner to the CC. Once information about a number of compositions is available, these data can be used to determine whether a user's configuration or desired configuration is

feasible—i.e., whether it is used by others and if others have reported breakdowns or problems.
Even with such a facility, a typical user may be unable or uninterested in finding new services and compositions if doing so requires going through long lists of potential options. They will be interested, however, in finding new functionality that will best serve them. While we plan to exploit social filtering and recommendation mechanisms to allow popular compositions and services to bubble to the top, we also see great value in allowing “power users” with greater skill, patience, and motivation to hand-craft compositions that others can use. Thus we propose the Best Composition Service (BCS) to allow potential power users to create "best practices" or "cool functionality" compositions by stringing together services and then publishing these for others to incorporate into their own systems. Any user can then go to a BCS, obtain a set of compositions that provide a desired functionality, and then using CC, check the composition against her current environment. Again, when everyone's configurations are available, some users can add additional functionality with relatively little cost.
3.3 Monitoring and Sharing Compositions
In order to automatically monitor and construct composition models of users’ environments, we depend on emerging frameworks for device and service interoperation that are based on networked communication (e.g., UPnP [18] or DPWS [4]). Because of the nature of communication among networked services, we are able to construct a model of the interrelationships among services without requiring modification of the services themselves. Messages on the network are used to perform communication among services such as invoking operations, subscribing to event notifications, and sending event notifications. Thus, we plan to implement a composition monitor that captures all network traffic and analyzes it to build a graph of service communication. By analyzing the temporal relationships among communications, we can subdivide the graph into sets of services whose communication patterns are functionally related.
Once sets of functional compositions have been determined, they are uploaded to a shared composition repository. The repository will be located as part of the Composition Community server, and all Composition Visualizers will be able to access such data.
4 Conclusion
As pervasive technology makes its way into the home, each home’s inhabitants will be forced to contend with configuration and maintenance challenges of ever-increasing complexity. Helping users overcome these challenges is crucial to the ultimate success of pervasive computing in the home.
In this position paper, we have laid out our proposal for a system to deliver help to otherwise isolated users as they attempt to configure and control their technological

environments. Our system builds upon prior research in end-user composition and collaborative help by providing mechanisms for visualizing compositions (including one’s own and those of others), as well as accessing and contributing to shared repositories of composition information. We believe such a system is novel and will represent a large step forward in helping users solve difficult composition problems in pervasive computing environments.
References
1. Ackerman, M.S. Augmenting Organizational Memory: A Field Study of Answer Garden. ACM Transactions on Information Systems, 16(3). pp. 203-224, (1998).
2. Ackerman, M.S. and Haverson, C. Organizational Memory: Processes, Boundary Objects, and Trajectories. Computer Supported Cooperative Work; The Journal of Collaborative Computing, 13(2). pp. 155-189, (2004).
3. Ackerman, M.S. and McDonald, D.W. Answer Garden 2: Merging Orgnaziational Memory with Collective Help. In Proc. ACM Conference on Computer-Supported Cooperative Work (CSCW '96). pp. 97-105. Boston, MA, USA (1996).
4. Chan, S., et al. Devices Profile for Web Services Specification. http://specs.xmlsoap.org/ws/2006/02/devprof/devicesprofile.pdf.
5. Dey, A.K., Sohn, T., Streng, S. and Kodama, J. iCAP: Interactive Prototyping of Context-Aware Applications. In Proc. the 4th International Conference on Pervasive Computing (Pervasive '06). Dublin, Ireland (2006).
6. Finholt, T.A. Accessing Organizational Expertise through Computer-Mediated Communication (Ph.D. Dissertation). Carnegie-Mellon University (1990).
7. Marchioni, G. and Schneiderman, B. Finding Facts vs. Browsing Knowledge in Hypertext Systems. International Journal of Man-Machine Studies, 21(1). pp. 70-79, (1988).
8. Nam, K.K. and Ackerman, M.S. Arkose: Reusing Informal Information in Online Communities. In Proc. ACM Group Conference (Group 2007). pp. 137-146. Sanibel Island, FL, USA (2007).
9. Newman, M.W. Now We're Cooking: Recipes for End-User Service Composition in the Digital Home. IT @ Home Workshop at CHI '06, Montreal, Quebec, Canada (2006).
10.Newman, M.W., Elliott, A. and Smith, T.F. Providing an Integrated User Experience of Networked Media, Devices, and Services Through End-User Composition. In Proc. the International Conference on Pervasive Computing (Pervasive 2008). To Appear. Sydney, Australia (2008).
11.Newman, M.W., et al. Designing for Serendipity: Supporting End-user Configuration of Ubiquitous Computing Environments. In Proc. the International Conference on Designing interactive Systems (DIS 2002). pp. 147-156. London, UK (2002).
12.Remde, J.R., Gomez, L.M. and Landauer, T.K. SuperBook: an automatic tool for information exploration--hypertext? : In Proc. the ACM conference on Hypertext (Hypertext '87). pp. 175-188. Chapel Hill, North Carolina, United States (1987).
13.Rodden, T., et al. Between the dazzle of a new building and its eventual corpse: assembling the ubiquitous home. In Proc. the International Conference on Designing Interactive Systems (DIS 2004). pp. 71-80. Cambridge, MA, USA (2004).
14.Sproull, L. and Kiesler, S. Connections: New Ways of Working in the Networked Organization. MIT Press, Cambridge, MA, USA (1991).
15.Stevens, G. and Weidenhofer, T. CHIC - A Pluggable Solution for Community Help in Context. In Proc. NordCHI '06 (2006).

16.Truong, K.N., Huang, E.M. and Abowd, G.D. CAMP: A Magnetic Poetry Interface for End-User Programming of Capture Applications for the Home. In Proc. the 6th International Conference on Ubiquitous Computing (Ubicomp 2004). pp. 143-160. Nottingham, UK (2004).
17.Twidale, M. Where am I and Who am I? Issues in Collaborative Technical Help. In Proc. ACM Conference on Computer-Supportive Cooperative Work (CSCW '04). pp. 378-387. Chicago, IL, USA (2004).
18.UPnP Forum. UPnP Device Architecture. UPnP Forum (2000). 19.Zhang, J. and Ackerman, M.S. Expertise Networks in Online Communities: Structure and
Algorithms. In Proc. the 16th International Conference on the World Wide Web (WWW '07). Banff, Calgary, Canada (2007).

End-User Programming for the Home: a Challenge
Joëlle Coutaz
Grenoble Informatics Laboratory (LIG) University Joseph Fourier
385 rue de la Bibliothèque, 38041 Grenoble Cedex 09, France [email protected]
Abstract. In this position paper, we propose a model for networked artifacts inspired from molecular chemistry. Using a real-case exemplar, we demonstrate the intrinsic complexity of the domain illustrated with unsolved problems such as mastering the semantics of networked artefacts. As a result, providing end-users with the capability to program their home is a very challenging issue.
Keywords: User interface, End-User Programming, coupling interaction resources, networked artefacts.
1 Introduction
Ubiquitous computing promises unprecedented empowerment from the flexible and robust combination of software services with the physical world. For the HCI research community, this means that end-users will be able to shape their own interactive spaces and build imaginative new forms of interaction and functionalities that were not anticipated by the system’s designers. This means providing end-users with the capacity to “program” their interactive spaces including their home. This vision sounds very attractive. But to hold the promise, we need to find a way to master the intrinsic complexity of networked artifacts. To demonstrate this complexity, I propose to use an analogy with chemistry where a smart artefact is modeled as a composition of physical and digital atoms whose configuration evolves under particular conditions. A more detailed description is available in [1].
2 Smart Artefacts as Chemical Molecules
A smart artefact (also called a mixed-reality object or an augmented object) is a chemistry-inspired assembly made from two sorts of elements – digital atoms (D) and physical atoms (P) whose bonds correspond to communication mechanisms or physical attachments. As in chemistry, reaction (or a chain of reactions) results from the confluence of particular events, and produces new smart artefacts. A smart artefact may break down into simpler artefacts and atoms, or it may be coupled with other artefacts and atoms into a more sophisticated artefact. Alternatively, only the

internal geometry of the artefact may evolve. The confluence of events that provokes a reaction denotes a change in context as introduced by the ubiquitous computing community. These events are generated either by humans, by the physical environment, or by the system itself (to guarantee service continuity, for example).
a)
Pnab
Dnab b)
DS
PPC
=
Dreg
Pnab
Dnab
+ Dweb
PPC
Dreg
Pnab
Dnab
Dweb
DS
DS
Fig. 1. a) The “virgin” Nabaztag as a [P – D] molecule. b) Registrating the Nabaztag. (Dashed lines denote couplings that result from a chain of reactions.)
Thus, the simplest smart artefact is composed of a single D atom coupled with a single P atom. Software services are composed of D atoms only, whereas conventional objects of the real world are strictly built from P atoms. An interactive space (e.g., a smart home), may be a unique macro-molecule of D and P elements, orit may be a set of molecules each one defining a smaller bubble, but prone to reconfiguration. As in chemistry, the nature of the events that trigger a reaction has an impact on the resulting product. The Nabaztag shown in Figure 1 a) is an interesting form of [P – D] molecule. We have two of them at home. We like them, but in the future, we may get into trouble if the home becomes a huge molecule of smart artefacts!
3 The Nabaztag Exemplar
The Nabaztag is an information appliance1 that results from the binding of a P atom with a D atom: the Pnab atom is a 9 inches tall plastic bunny shape including a loud-speaker, moving ears, colored lights that pulsate on its nose and belly, and a Wi-Fi card. Its Dnab atom implements some service-oriented protocol over IP. The [Pnab – Dnab] molecule shown in Figure 1-a, corresponds to the “virgin” Nabaztag as users get it from the store. To become a working information appliance, the Nabaztag must be registered using a Web server on a personal computer. The registration process is supported by the [PPC – Dweb – Dreg] molecule where PPC denotes the PC, Dweb the Web server, and Dreg the registration software service available from the Web server (see figure 1-b). By filling in forms on the PC, the user provokes a reaction between the original Nabaztag molecule and the registration molecule resulting in the creation of a bond between atoms Dnab and Dreg as well as bonds between Dweb and the Dsservices to which this particular instance of Nabaztag is able to subscribe. These services include weather forecast, time, inter-personal messaging, mood expression (the rabbit has a mood!), breaking news, etc.
1 Nabaztag means “rabbit” in Armenian.

Through form filling, the user can specify which services are of interest. Once the user has disconnected from the web server, the Nabaztag, as an information appliance, is a rather well-balanced star-like molecule with a stem coupled to a single P atom (see Figure 2). This simple real-life example illustrates one problem (at least): Users may be uncertain about the semantics of the final molecule. How can users be sure that the final boundary of the Nabaztag is the “nice” molecule shown in Figure 2? It is possible that the Ds atoms are coupled with other services whose behavior may have an undesirable impact on the native Dnab (for example, in terms of privacy). You can marry your Nabaztag to another one. If this function is transitive, your Nabaztag becomes polygamous. In other words, consequent bonds are created between your Nabaztag and other Nabaztags and this is unknown to you. As another example of chain of reactions, the arrival of the Nabaztag in the home, which may be a huge molecule or a set of coexisting molecules, may entail a chain of reactions that may not be predictable or even observable and controllable.
DS
Dreg
Pnab
Dnab
DS Fig. 2. The Nabaztag as a working autonomous information appliance.
Smart home
DS
Dreg
Pnab
Dnab
DS
Pmob
Dmob
Mobile phone
Dfri
Pfri
Augmented Fridge
Ppre
Dpre
Presence detector
Dans
Pans
Answering machine
DIP
IP device discovery
Dmes
Fig. 3. The Nabaztag joining a Smart Home.
Suppose for example, that the Nabaztag joins the smart home represented by the molecule shown in figure 3. This smart home is equipped with a presence detector, a surveillance system, and an IP-device discovery facility. It includes a number of smart objects such as an augmented IP fridge and an IP answering machine. When the owner is away, any intrusion or abnormal situation is notified to the owner via the

mobile phone. Suppose that the user has subscribed the Nabaztag to the buddies messaging service. The Nabaztag is then able to play messages sent by buddies using its speaker-phone. Unfortunately, it has no replay facility. Thus, when there is nobody home, messages are lost. In order for the Nabaztag to forward incoming messages to the recording facilities of the home, additional bonds must be created between the appropriate D services. These can be created autonomously by the smart artefacts, or they can result from the interpretation of an end-user program, or from a smooth combination of both. Whatever the process, an initial coupling is necessary to entail a chain of reactions until reaching a stable appropriate situation. Because the Nabaztag is an IP device, a bond can be automatically established between DIP, the IP-device discovery facility and Dnab. Dnab is now able to discover Dpre, the presence detector, as well as Drec to use the recording facility of the answering machine or even Dmes to forward messages to the mobile phone. These bonds can in turn provoke new chains of reactions. How far can we go? The complexity is combinatorial, even for very simple situations. This is the problem I would like to develop and discuss at the workshop. Even if we manage to define the appropriate notations for end-users to program their house, we still have to solve the semantic boundary problem.
References
1. Coutaz, J. End-User Programming and the Intrinsic Complexity of Networked Artefacts. 4th
Workshop on End-User Software Engineering, ICSE 2008.

Adding Convenience to “Cohabitation of Convenience”
Umar Rashid and Aaron Quigley
School of Computer Science & Informatics, University College Dublin Dublin, Republic of Ireland
{umer.rashid, aquigley}@ucd.ie
Abstract. The home environment offers a promising venue for deployment of pervasive technologies. To date, most research efforts in this domain have focused on improving the life experience of family members. However, nowadays many people who are unrelated to each other share accommodation, giving rise to the phenomenon of “cohabitation of convenience”. Examples include elder care facilities, hostels, shared houses and dorm rooms. We provide a scenario-based exploratory study into how pervasive technologies can be used to access and disseminate personal information while amongst unrelated residents. We further plan to develop and evaluate systems that accomplish the proposed scenarios.
Keywords: Smart home, ambient display, mobile computing, domestic computing.
1 Introduction
Back in 1972, Stanley Milgram identified the phenomenon of familiar strangers in urban public places [8]. Familiar strangers are the people whom one comes across frequently but interact with them rarely, such as commuters at bus stops or subway stations. Drawing on Milgram’s notion of familiar strangers [8], Paulos and Goodman [10] explored how mobile devices are likely to impact the relationships among urban strangers. Nowadays, strangers are no longer confined to public places but have penetrated domestic venues as well. Mobility and economic considerations of modern life have made it common for unrelated people to live in shared households [7]. In addition to short-term residences (hostels, hotels, elder care facilities etc.), there is also a trend to change long-term residences regularly to avail of new job or education opportunities elsewhere [12].
Even when people live for a substantial period at a place, they share it with other people who are not their friends or family members. Among the co-residents, there may be some students, and others professionals. Some residents work/study part-time, others full time. Some work in night shifts, while others during a morning shift. Socio-economic considerations of residents make them share their residence with people who have remarkably different professions, hobbies, daily schedules, personal preferences, life-styles, and cultural backgrounds. This is the arrangement we term as “cohabitation of convenience”.

A bulk of research activities in the smart home domain has focused on supporting life for family members. These include ethnographic studies [2] as well as “peace of mind” applications such as Digital Family Portraits [9], CareNet [4], and the Whereabout Clocks [1]. To our knowledge, no ethnographic study as yet has investigated the implications and prospects of pervasive technologies use in cohabitation of convenience. Without concerted efforts to understand and address these requirements, the research community runs the risk of rendering domestic pervasive technologies irrelevant to a significant section of the population.
In this paper, we present an exploratory study into how pervasive technologies can help add a degree of convenience to the lives of unrelated co-residents. We presented some scenarios to a group of unrelated house-mates about the exchange of personal information between their personal devices and an ambient display. Our future plan is to use a scenario-based approach [3] for the design and in-situ evaluation of the pervasive system that can realize these scenarios.
2 Pervasive Technology Usage Scenarios in Cohabitation of Convenience
To determine the requirements of pervasive systems that support cohabitation of convenience, we conducted a study into the daily lives of 12 people living in 4 different shared accommodations in Dublin, Ireland. The study involved a visit to the selected shared accommodations and a focus group discussion with residents that typically lasted for about 2 hours. We adopted a scenario-based approach to discuss our concept. Scenarios provide a comprehensive overview of the functionality, interaction and contextual settings of system, from both user and designer perspectives [3]. The participants were in the age group 19-35, eight of them males and four females. All of them were adept users of ICT (Information and Communication Technologies) including cell phones, personal digital assistants (PDA) and computers. Ten of them were computer professionals and had good insight into the implications of pervasive computing and smart home technologies. The participants received a pizza lunch as a gratuity.
We noticed that while our participants lived in single bedrooms, they shared not only the kitchen, bathroom and living rooms, but also the collective responsibility for maintenance and cleanliness of these shared spaces in their respective houses. The scenarios we envisaged include the presence of an ambient display in the shared space of the house that serves as medium to exchange information with personal digital devices of the residents. Personal digital devices include cell phones, personal digital assistants (PDAs), notepads or personal computers. We draw on the scenario of use of a SharedNotes system [6] that supports exchange of information between PDAs and a shared public display, though in a different setting (workplace). To assuage privacy concerns, contents of the ambient display must be visible only to the residents and the landlord. To achieve this, the contents need to be represented in the form of a graphic visualization that is aesthetically pleasing and understandable only to the particular resident [5, 11].

Below is the description of scenarios we presented to our study participants in order to get their feedback.
Scenario 1: Notification of BillsIn the last week of each month, the ambient display shows notification of due bills by the tenants. After the system gets confirmation of a particular tenant’s payment to the landlord’s bank account has been accomplished, it subsequently removes the tenant’s notification from the ambient display and sends a receipt notification to their personal digital device. Tenants can select which personal digital device (cell phone, PDA or personal computer) they want to receive the receipt of bill payment on.
Scenario 2: Cleaning/maintenance schedule of shared spaces The ambient display posts information about which tenants are scheduled to clean the shared spaces (kitchen, bathroom, living room etc.) of the house on each weekend. As a reminder, the relevant person is sent a notification on his/her personal device at an appropriate time. If due to some urgency, tenants cannot clean the shared spaces on their turn, they may use their personal devices to post a request on the ambient display for a change in schedule.
Scenario 3: Personal Plans Residents can use their personal devices to post information on the ambient display about their personal plans including exams, holidays, parties, visits of close ones, or health details (cold/flu etc.). This is to ensure that co-residents get to know in time about changes that my affect them for a short time and avoid any trouble arising because of their conflicting schedules.
Scenario 4: Leaving residence Tenants can post a notice of their departure on the ambient display at an appropriate time as regards the terms of contract, so that the landlord and other tenants brace themselves to have a new tenant. The landlord pays the deposit back to the departing tenant, a receipt is sent on the latter’s personal device and his/her personal profile is deleted from the system.
Feedback from participants Initial responses from residents have been quite supportive of our ideas. Most of them appreciated the idea of presenting relevant information on ambient display in an aesthetic form and use of personal devices for communication and coordination among fellow residents. However, some expressed the concern that co-residents, being there for a while, may be able to decipher the “hidden” messages on an ambient display. At present, we are in the requirement analysis phase of system design. Importantly the participants of our interviews are not representative of the general population living in shared houses. We plan to conduct an ethnographic study about the prospects and potentials of pervasive technology use in cohabitation of convenience and draw on the results for design and in situ evaluation of that system.

3 Conclusions & Future Works
In this paper, we investigated some ways pervasive computing technologies can be used to support an improved level of convenience for unrelated people living under the same roof (so-called “co-habitation of convenience”). We used a scenario-based approach to help a group of residents understand the potential use of pervasive technology in their domestic settings. The scenarios were focused on sharing information between an ambient display in a shared space of the house and personal digital devices of the home residents. We plan to conduct the scenario-based interviews with a larger sample of people to predict the acceptability of our proposed scenarios. Based on the results of these interviews, we will propose design guidelines for pervasive systems that support convenient living. The next step will be to develop that system and deploy it in homes for in-situ evaluation over a substantial period of time. We will also investigate how deployment of pervasive technologies strengthens the sense of belonging among residents and in turn influences the very nature of cohabitation of convenience.
While we have focussed on a very limited range of pervasive applications, namely ambient displays and personal digital devices, this is not the full range of opportunities from the study of co-habitation of convenience. We envisage scenarios where audio sensors, appliance use sensors, activity detection mechanisms could also be used to develop applications for improved awareness of the use of shared spaces.
Acknowledgments. This research is supported by Irish Research Council for Science, Engineering and Technology (IRCSET): funded by the National Development Plan, and co-funded by IBM. We thank all anonymous reviewers who provided valuable feedback on this work.
References
1. Brown, B., Taylor, A., Izadi, S., Sellen, A., and Kaye, J.: Locating family values: A field trial of the Whereabouts Clock. Ubicomp 2007, 354-371 (2007)
2. Brush, A. J. B., and Inkpen, K. M.: Yours, Mine, and Ours? Sharing and Use of Technology in Domestic Environments. UbiComp 2007, 109-126 (2007)
3. Carroll, J, Ed.: Scenario-based design: envisioning work and technology in system development, NY: Wiley (1995)
4. Consolvo, S., Roessler, P., and Shelton, B.E.: The CareNet Display: Lessons Learned from an In Home Evaluation of an Ambient Display. UbiComp 2004, 1-17 (2004)
5. Ferscha, A., Emsenhuber, B., Schmitzberger, H., Thon, P.: Aesthetic Awareness Displays. Pervasive 2006 Adjunct Proceedings (2006)
6. Greenberg, S., Boyle, M. and LaBerge, J.: PDAs and Shared Public Displays: Making Personal Information Public, and Public Information Personal. Springer-Verlag Personal Technologies, Vol.3, No.1, 54–64 (1999)
7. Kenyon, E. and Heath, S.: Choosing This Life: narratives of choice amongst home sharers. Housing Studies, 16(5), 619–636 (2001)
8. Milgram, S.: The Familiar Stranger: An Aspect of Urban Anonymity. The individual in a social world, Reading, MA: Addison-Wesley, 51-53 (1977)

9. Mynatt, E.D., Rowan, J., Jacobs, A., and Craighill, S.: Digital Family Portraits: Supporting Peace of Mind for Extended Family Members. CHI 2001, 333-340 (2001)
10. Paulos, E., and Goodman, E.: The Familiar Stranger: Anxiety, Comfort, and Play in Public Places. CHI 2004, 223-230 (2004)
11.Plaue, C., Miller, T., Stasko, J.: Is a picture worth a thousand words?: an evaluation of information awareness displays. Graphics Interface 2004, 117-126 (2004)
12.Yankow, J.: Migration, Job Change, and Wage Growth: A New Perspective on the Pecuniary Return to Geographic Mobility. Journal of Regional Science 43(3), 483-516 (2003)

Workshop on
Pervasive Mobile Interaction Devices (PERMID 2008)
ORGANIZERS: Jonna Hakkila (Nokia Research Center, Finland)
Gregor Broll (Ludwig-Maximillian University of Munich, Germany)
Enrico Rukzio (University of Lancaster, UK)
Derek Reilly (Dalhousie University, Canada)
Paul Holleis (University of Duisburg-Essen, Germany)

APriori: A Ubiquitous Product Rating System
Felix von Reischach and Florian MichahellesInformation Management, ETH Zurich, Switzerland
[email protected], [email protected]
ABSTRACTIn this paper, we propose a ubiquitous product rating system.First we provide an overview of state-of-the-art productrecommendation, concluding that current approaches do notsupport in-store consumers; i.e. consumers on the shop floor.Within shops however is where three out of four buyingdecisions are made. Hence we propose APriori, a new approachtowards mobile product recommendation. APriori makesproduct recommendation available for mobile users. Theseutilize their phones to identify tagged (barcode/RFID)consumer products. Based on the identification of products, themobile device communicates with a backend productrecommendation system. As a new rating concept we proposethe use of user-generated rating criteria. Accordingly, wedescribe the APriori prototype implementation and first userexperiences. We conclude with discussions about futureresearch directions.
Keywordspervasive user-generated content, product recommendationsystems, mobile applications, user experience, RFID, NearField Communication (NFC), mobile web 2.0
1. INTRODUCTIONWithin the last decades, the variety of products in retail storeshas increased significantly. Globalization, coming along withthe individualization of demands, leads to so called strategypluralism in the retail industry: retailers offer everything foreverybody. An example: Draegers grocery store in SiliconValley offers 250 types of mustard, 75 kinds of olive oil and300 varieties of jam. The vast amount of choices makes it moreand more difficult for consumers to take a well-founded buyingdecision. This is frequently referred to as consumer confusion[1]. Consumers react to this information overflow by retreat, bydelaying the buying decision or by randomly buying products[2].Although the plurality of choices also has positive effects, itremains a challenge to use the advantages of a broad productrange without overwhelming consumers at the same time. Theadvantage however can only be realized if the informationabout the offered products is structured in a way that can beperceived and filtered by the human brain in an appropriateway.An approach to structure product data in a way it can support[3] consumers in their buying decision is provided through
web-based product recommendation systems1. These allowusers to submit experiences they have made with particularproducts and share them with other users in a community-likefashion.Nonetheless, product recommendation systems in the Internetdo not meet the needs of customers of physical stores; they donot meet the needs of so called mobile users. Consumers turnon their computers and make use of the systems mainly if theyhave a high involvement with a product or when they plan topurchase the product in the Internet anyway (for example forbalancing the pros and cons before buying a camera). However,studies suggest that three out of four buying decisions areactually taken within shops [4]. Moreover, we assume thatusers are preferably motivated to express themselves in thecontext of actually using a product (mot of the time a mobilecontext). This is when they are emotionally driven.In parallel, mobile devices are more and more evolving intopermanent companions of consumers. In many developedcountries, mobile phone penetration is well above 90%,meaning that almost everybody is using a mobile phone. Inaddition, recent handsets provide extended functionalities suchas mobile Internet connection, mobile barcode recognition [7]and NFC (Near Field Communication) [6]. These tendenciesenable the interconnection of the physical world with thevirtual world, especially since almost all products have beentagged with barcodes and since a broad tagging of consumergoods with RFID tags is possible in the long run [5].Based on the tendencies outlined above we study: How canmobile users be enabled to actively recommend products and toreceive product recommendations?Our approach is a concept for mobile product rating with user-generated criteria. It allows consumers to submit and receiveratings anytime-anywhere, using their mobile phone as aproduct interaction device. In Section 2, we survey currentconcepts of product recommendation systems. We show whythey cannot support mobile users, i.e. consumers in shops, in anappropriate way. The result is the need for a ubiquitous productrating system. Section 3 is devoted to APriori, a novel approachtowards product rating which is tailored to the needs of mobileusers. In Section 4, we describe the demonstratorimplementation of the proposed concept. We conclude with acritical assessment of APriori and the discussion of future workin Section 5.
1 Examples: http://www.epinions.com, http://www.amazon.com

2. THE NEED FOR APRIORI
2.1 Product Review Systems TodayCurrent commercial product recommendation systems areaccessed on the web and allow users to exchange experiencesabout products. Prominent examples of web-pages hostingproduct recommendation functionality are Amazon.com andEpinions.com. While Epinions sees itself as a neutral providerof additional shopping information for online-shoppers,Amazon has integrated recommendation functionality into theirown web shop. Further neutral recommendation sites areratings.net, reviewcentre.com, kelkoo.com andedigitalresearch.com, to name just a few. Almost all web shopshave followed Amazon.com and provide productrecommendation functionality in one way or the other. Concretefunctionalities of current recommendation systems are:searching for product recommendations, creating productrecommendations, maintaining user profiles and connectinguser profiles to others, building a web-of-trust. In many casesusers can also rate recommendations made by others. Allconsidered recommendation systems offer both product ratingsand product reviews.
Product Ratings: Product ratings are usually visualized on aone-to-five stars scale. They allow the user an at-a-glanceassessment of products. Ratings can be made based on specificpredefined criteria such as price-performance ratio and qualityor can be submitted as an expression of the overall satisfaction.
Product Reviews: In contrast, product reviews allow users todescribe their experience with products as continuous text.Different levels of detail are usual for the reviews. At Epinions,for example, users can submit short reviews (up to 100 words)and longer reviews.In the research domain, product recommendations have mainlybeen discussed in the fields of marketing and computer science.While in marketing mainly the effects of productrecommendations on sales were investigated [8] [9], theresearch in computer science focused on ways of filteringrecommendations for the needs of consumers (e.g. [10] [11]). Inthe field of mobile computing, amongst others, the approachesof [12], [13] and [14] have made travel locationrecommendations mobile. However, none of them leverages thepossibilities mobile tag reader technologies offer. Thus they donot implement the vision of the mobile phone as a pervasivemobile interaction device.
2.2 Mobile CharacteristicsElaborating the requirements for mobile recommendationsystems, we based our approach on [16], who identifiedcharacteristics of the mobile user experience in mobile webbrowsing. We assume product recommendation is a specialcase of mobile web browsing. Thus we identify the particularcharacteristics which influence the user experience whenaccessing product recommendation systems from mobile phonesinstead from stationary PCs:
� The mental and physical resources of users are morelimited for mobile users, as they frequently have to do
parallel actions (e.g. standing, examining a product, usinga mobile application).
� The temporal context, thus the time a user is willing tospend for product recommendation is shorter. A studysuggests that mobile users get distracted in average after4 seconds, when waiting for a computational result in amobile context [17].
� The task context in which mobile productrecommendation takes place is different. While manypeople spend time in the Internet without a specific goal,mobile product recommendation is a part of a particulartask: shopping, i.e. deciding on a product.
� Another obvious difference is device usability.Compared to a stationary PC, a mobile phone has a smalldisplay, unfamiliar usage patterns (no mouse, small andless keys, launching of applications), limited connectivityand limited computational resources.
Our takeaways from this listing are that, generally speaking,the system must focus on easy usability while considering thedevice constraints of mobile phones.
3. APRIORI – SYSTEM DESIGNBased on the mobile characteristics elaborated above, wedevote this section to the design of APriori. In order to meet therequirements of mobile users, we take two steps. Firstly, wedesign a product rating system accessible from a mobile phone.Thus the system is usable in-situ (e.g. on the shop-floor). Tagreaders integrated in mobile phones are used to ease theinteraction between physical products and recommendationsystems. Secondly, we review the concept of current productrecommendations.
3.1 Technical ArchitectureA coarse overview of the building blocks of APriori is given inFigure 1. Users access APriori through an application on amobile phone. In order to receive product ratings or activelyrate products, users scan tags which are attached to productsalready today. This can be any tag which is capable of storingan identifier on product type level and which can be read bymobile phones. Natural candidates are barcodes and RFID tagsof all types.
Figure 1: Building blocks of APrioriHaving read the product identifier stored on the tag, the mobileapplication queries a server application for existing ratings thesubmitted identifier. The server application (request processor)receives the query and authenticates the user with his userprofile (user repository). The query is forwarded to the ratingrepository, a data base which contains all submitted

recommendations. The data is filtered in a way the userdemands it (filtered for a specific product type or to othercharacteristics the user has requested in his profile). Thisprocedure is similar as we know it from recommendationsystems in the Internet (see also [12]). Then the information isshown to the user on the mobile phone and he can take afounded buying decision.Concerning the tags used: barcodes are already attached tonearly all products. There exist a range of approaches to usecamera-phones to read them with mobile phones [7].Interaction-wise the use of NFC, thus touching physical objectsfor interaction provides advantages to users [15]. However, itcan be doubted if all consumer products will be tagged withNFC tags in the nearer future like we experience it withbarcode technology today.
3.2 Concept of Adaptive Rating CriteriaWe see isolated product ratings as not expressive enough forthe user. They usually only provide information about few,predefined criteria (e.g. overall satisfaction, price-performanceratio, quality). This is why in the Internet product ratings arealways combined with detailed textual product reviews. Thiscombination provides users with both: easy at-a-glanceassessment of a product and differentiated experiences of userswritten down textual. As the requirements for mobile productrecommendation demands little user interaction and the displayof product recommendations on small screens in a user-friendlyway, we think product reviews do not make sense for mobiledevices.This is why we extend the approach of product rating. Wemake product ratings more expressive by introducing adaptiverating criteria. The goal is to leverage the advantages thatproduct ratings provide (quick entry, easy to display) andreduce the shortcomings they have (limited expressiveness).
Figure 2: Product tree in recommender systemsIn APriori, just as in most existing product rating systems,products are arranged in a tree-like hierarchy (see Figure 2).The leaves of the tree represent product types, all inner nodesare product categories. Let us assume a consumer is looking forratings for the iPod Nano at Epinions. The productrecommendation system would find this product type in thefollowing product hierarchy: Home � Electronics � MP3 andDigital Media Players � Apple iPod Nano.For a given product type (here: iPod Nano), there is apredefined set of standard rating criteria available. In ourexample, these are overall rating, sound, ease of use,durability, portability, battery life. Predefined rating criteriahowever limit the power of consumers to express themselves.For example, there is no information in them which expresses
something about the scratch sensitivity of the MP3-player. Thisis why APriori features additional adaptive rating criteria: userscreate their own rating criteria. We distinguish:
� Standard Criteria: Standard criteria are well-knowncriteria which apply for many product categories. Forexample the price-performance ratio is important foralmost all product types and product categories. This ishow it is done in the product review systems of today.
� Adaptive Criteria: These are criteria which extend thestandard criteria by what the community thinks isimportant to rate. This is how we exceed the state-of-the-art. Adaptive criteria are created by users. Coming backto the iPod Nano, examples for dynamic criteria aresensitivity of casing and quality of headphones. Thus,features that were expressed through textual reviews intraditional product recommendations systems.
In order to not make product rating too complicated for users ina mobile context users maintain the possibility to submit anoverall rating on a one-to-five scale without rating all possiblecriteria. APriori uses the well-known one-to-five stars scaleusers are familiar with from conventional product ratings.What are potential drawbacks and challenges with adaptivecriteria? In order to prevent users from generating too manycriteria and unrelated criteria, there is need for a moderatorwho is able to delete criteria if they are becoming too many orif they do not fit. This is a similar approach to how it is done inWikipedia2, for example. Of course the moderator does notneed to access the system on a mobile device. A web-basedinterface is provided. In addition, users can submit warnings tothe moderator on their mobile, if they feel a criterion should notbe where it is. In order to prevent the multiple creation of thesame criteria and to prevent spelling errors, there is an auto-completion feature when entering the criteria.
4. PROTOTYPE IMPLEMENTATIONWe implemented a first simple prototype of APriori on an NFCphone (Nokia 6131 NFC). Yet we have not implemented user-generated rating criteria. Users so far can only make an overallrating for a product. As test products, we tagged four bottles ofolive oil with HF RFID tags. Why olive oil? Olive oil isrelatively expensive (average price of the selected bottles:14.82 USD) and is offered in a broad range of quality.Frequently, olive oil of low quality is offered at high prices. Butconsumers notice that only when they try the oil, which theyusually cannot do before buying it. All this makes olive oil agood example for product recommendation. For tag detection,NFC instead of Barcode recognition was chosen as it allowseasier interaction and enables the automatic start of the mobileapplication upon reading of a tag.
2 http://www.wikipedia.com

Figure 3: Screenshot of an overall rating for olive oil inAPriori
The user interface implementation was a challenge. Wedesigned a simple user interface (see Figure 3), making use ofthe well-known 5-stars visualization of ratings. In the future,users will be allowed to switch between an overall rating viewof a product and a detailed rating view with the adaptive ratingcriteria using the direction keys of their phone.Preliminary user experiences (both consumers and retailprofessionals) indicate a high potential in the application. Manypraised the few interaction steps necessary to receive andsubmit product ratings. However, also criticism has beenexpressed: some users doubted that they would trust theopinion of other random consumers. Others indicated they donot believe in people actively rating products without additionalincentives.
5. CONCLUSION AND OUTLOOKToday product recommendation is accepted and used on theweb, but does not yet support consumers in-situ, where theyneed recommendations most. APriori is a step towards anunderstanding of product recommendation for users in a mobilecontext. Still there are a range of functionalities which canextend APriori in the future. Some of them are: The integrationof user data maintained in social networking websites. As userstend to have extensive profiles on these sites, it is promising touse personal data and friendship relations between users as atool to define networks of trust. In other words: members ofsocial networks (e.g. Facebook) could decide to trust onlypeople they have as friends or that have certain characteristics(e.g. hobbies). Another possible extension is to provideconsumers, despite community-based ratings, with productreviews carried out by consumer associations3. We believe thatmobile product recommendation is a powerful tool to helpconsumers to take better buying decisions. Thus we willcontinue to evaluate its utility in a comprehensive user study.
6. REFERENCES[1] Rudolph, T., Schweizer, M., and Wagner, T. 2004.
Consumer Confusion in Retail Environments: An Adoptionof the MR Model. AMA Winter Educators Conference2004 - Scottsdale, Arizona.
[2] Gross, P. 2004. Consumer Confusion undMultioptionsgesellschaft. Thexis Fachzeitschrift fürMarketing, 4.2004.
3 See for example http://consumersunion.com
[3] Pham, A. and Healey, J. 2004. Telling you what you like.Los Angeles Times, 20 September 2004.
[4] How to annoy your customers. The Economist, 5 January2008.
[5] O’Connor M. C. 2006. Wal-Mart Seeks UHF for Item-Level. RFID Journal, 30 March 2006.
[6] NFC Forum. http://www.nfc-forum.com.[7] Adelmann, R., Langheinrich, M., Flörkemeyer, C. 2006.
Toolkit for Barcode Recognition and Resolving onCamera Phones – Jump Starting the Internet of Things.Workshop Mobile and Embedded Interactive Systems(MEIS'06) at Informatik 2006.
[8] Cooke, A., Sujan, H., Sujan, M. and Weitz, B 2002.Marketing the unfamiliar: the role of context and item-specific information in electronic agent recommendations.Journal of Marketing Research 39(4):488-497.
[9] Senecal, S. and Nantel, J. 2004. The influence of onlineproduct recommendations on consumers’ online choices.Journal of Retailing 80:159-169.
[10] Du Boucher-Ryan, P. and Bridge, D. 2006. Collaborativerecommending using formal concept analysis. Knowledge-Based Systems 19(5):309-315.
[11] Weibelzahl, S., Bergmann, R., Weber, G. 2000. Towardsan empirical evaluation of CBR approaches for productrecommendation in electronic shops. In Proceedings of the8th German Workshop on Case-Based Reasoning.
[12] Wietsma T.A. and Ricci, F. 2005. Product reviews inmobile decision aid systems. PERMID Workshop atPervasive Conference 2005.
[13] Van Stetten, M., Pokraev, S. and Koolwaaij, J. 2004.Context-aware recommendations in the mobile touristapplication COMPASS. Adaptive Hypermedia andAdaptive Web-Based Systems, LNCS 3137, Springer, 234-244.
[14] Tung, H.W. and Soo, V.W. 2004. A personalizedrestaurant recommender agent for mobile e-service. InProceedings of IEEE International Conference on E-Technology, E-Commerce and E-Service (EEE04), IEEECD Press, 259-262.
[15] Boll, G. et al. 2007. Comparing techniques for mobileinteraction with objects from the real World. PERMIDWorkshop at Pervasive Conference 2007.
[16] Roto, V. 2006. Web browsing on mobile phones –characteristics and user experience. Dissertation atHelsinki University of Technology.
[17] Roto, V. and Oulasvirta, A. 2005. Need for non-visualfeedback with long response times in mobile HCI. InProceedings of the 14th International World Wide WebConference 2005.

Augmenting BDI with relevance
Supporting agent-based, pervasive applications
Andrew Koster University ofUtrecht Intelligent Systems
Fernando Koch Universityof Utrecht Intelligent Systems
Frank Dignum University ofUtrecht Intelligent Systems
Liz Sonenberg University ofMelbourne Department of
Information [email protected]
ABSTRACTThe potential of pervasive mobile systems lies in the integra-tion of applications and services available on mobile devices.These services must be built on the premises of context-awareness, such that the application takes advantage of en-vironmental information to improve its performance. Thechallenge is to process more environmental information withthe limited computational resources available on mobile de-vices. Intelligent Agents have been proposed as a suitable ar-chitecture for these tasks. Such agents are designed around adeliberation cycle. We show that one of the problems agentsencounter in highly dynamic environments is that this cyclemisses opportunities to react to the changing environment.For this reason we propose an extra module that augmentsagent architecures with a “context-observer”. Based on thestructures used in the deliberation cycle, this module eval-uates the relevance of received data. It does this parallel tothe normal cycle. We illustrate how such an approach couldimprove the context sensitivity of the agent’s behaviour andthus the usefulness of the application.
1. INTRODUCTIONIn the past few years there has been a continuing trend
towards the use of mobile (wearable) computers in everydaylife [6]. One of the largest differences between mobile devicesand traditional systems is, of course, their mobility. The userdoes not need to sit down to use them, but can do so whileon the move. For pervasive applications to be effective me-diators between the available information and the physicaluser, they need to present information in a quick and easymanner. As more and more information becomes available,contemporary software has a hard time keeping up. Cur-rent mobile devices incorporate many different tools previ-ously found separately, such as a mobile phone, organizerfunctionalities, integrated sensors, multimedia applications,etc. The true potential of pervasive systems comes from in-tegration of such data [14]. However, current technologiesare unfit to handle the multitude and degree of dynamism ofmobile and pervasive environmental information. We intendto explore “what” structures in software application are re-quired to process more information (from the environment)with less resources. We are interested in a special kind ofsoftware applications: the ones built upon agent technolo-gies. We suggest that agents provide a set of features closely
aligned to the requirements of pervasive mobile applications.
1.1 Using agent technologyIn the field of Artificial Intelligence the Intelligent Agent
[15] has been proposed as a design method for dealing withissues in robotics, eMarkets and also mobile applications,such as tourist guides, conference assistants [10, 9] and var-ious other task-based applications [4]. Work is being doneto extend this to more generally applicable tasks on mobiledevices [11]. All these problems have in common that:
• the problem should be solved without requiring theintervention of the user.
• the agent interacts directly with the environment, orsuggests such interactions to its user, thus changing itsenvironment.
• the solution requires flexibility. The agent must exhibitproactive goal-oriented behaviour as well as reacting tounforeseen situations.
The unique problem encountered in smartphones, however,is the sheer amount of highly dynamic information in theenvironment, combined with the limited processing powerof a telephone. We wonder how this impacts the working ofagents.Many agent architectures are based on the so-called Be-
lief, Desire, Intention (BDI) - Model. This model is basedon a respectable philosophical model of human practical rea-soning, originally developed by Michael Bratman [2]. It pre-sumes rational entities have desires. To fulfill these desiresthey form intentions, based on their beliefs about the world.Computational architectures based on this model all workaround a deliberation cycle. While there are various differ-ent proposals for implementing such a cycle [12, 1], they arebased on a similar system:
• sense the environment and update the agent’s beliefs
• deliberate on the agent’s desires and plans to achievethem. Form intentions and, if things have changed inthe environment, possibly reprocess former intentions.
• act on whatever intentions the agent decided to exe-cute. Then loop back to sensing.

This cycle is repeated during the runtime of the agent, buthow often depends on the architectures. The main process-ing investment is in the “deliberate” part of this loop andthe longer this takes, the larger the chance of discrepanciesbetween the“sensed”environment and the environment thatis“acted” in. In a highly dynamic environment it is thereforedangerous to deliberate for too long. A balance has to befound between two extremes. On the one hand proactivelyplanning the optimal way to achieve a goal runs the risk thatthe situation has changed too much to execute it, while onthe other hand reacting to sensory data with the first planavailable may accomplish some action, but it runs the riskthat the action is suboptimal or even wrong.The middle way, and one of the main contributors to suc-
ces of the BDI-architectures, is splitting the goals up intosubgoals that are easier to plan for. The assumption isthen that achieving the subgoals moves the agent nearerto achieving the final goal.The agent executes its immediate actions counting on in-
complete information, but the plans may still lead to dead-ends and exceptions. As detailed below, once facing the un-expected, the agent must behave with coherence, by revisingwhat went wrong, and backtracking to the previous selec-tion point. Nonetheless, backtracking is not always possiblewith physical actions. That is, some actions that changedthe situation of the world cannot be undone. Therefore, al-though ideally we want to plan with the maximum amountof information possible, sometimes the agent has to assumeincomplete plans and be prepared to react to unexpectedevents. This mechanism promotes balance between proac-tiveness and reactiveness [3]. The planning process can thinkahead a number of interactions by analysing the tail part ofthe plan. At the same time, it can reconsider the currentbasic actions, the remaining sub-goals, or the plan execu-tion itself in reaction to changes in the environment. Thisrequires that the inference system contains the structuresto observe the environment and revise the plan executionprocess. Current BDI-model implementations provide thesestructures in different architectures.A BDI-architecture uses the cyclic structure to continu-
ously evaluate the world and update the agent’s actions. Animportant question is when to reconsider its plans and ac-tions? Architectures such as JACK [8] and 3APL [7] detectthe failure of a plan once it ends without the (sub-)goal be-ing achieved. They must then process where the plan failedto be able to backtrack. This is an expensive process. Weargue that the sooner it is detected that a plan can no longerexecute correctly, the easier it is to correct it. However, wealso do not wish to ‘baby sit’ the plans, monitoring theirprogression every step of the way. Instead we propose anextension to the model. In the next section we will showhow a simple plug-in module could help in deciding whento start and stop some of the critical processes in the de-liberation cycle. In section 2.1 we demonstrate its workingwith a simple example and finally present our conclusionsand discuss future work.
2. THE CONTEXT-OBSERVERWhen information is liable to change and affect plans at
any moment it is unfortunate that it will only be “sensed” inone step of the deliberation cycle. The world is consideredstable during the “deliberate” and “act” steps and any infor-mation that changes during these stages is only considered
in the next cycle. While speeding up the cycle would allowfor more accurate information, it allows for less proactivereasoning. Wouldn’t it be better if sensing the environmentis done continuously and separately from the deliberationcycle? The reason for it being in the cycle, however is forthe consistency during the “deliberate” step: it creates prob-lems in the deliberation if, while reasoning about a plan, thebeliefs it is based on change.We therefore propose a separate meta-model that prepro-
cesses incoming information. This context-observer observeschanges in the environment, rationalises the changes that arerelevant for current deliberations and sends events signal-ing the occurrences to the planning module. This structurehelps to improve deliberation performance by filtering rele-vant events and promoting real-time coordination betweenobservation and plan deliberation. The intra-module coor-dination is based on an event passing mechanism.The deliberation mechanism must then be extended with
the ability for events to affect its working by interruptingor starting certain processes. Contemporary agent program-ming languages such as JACK and 2APL [5] already supportthis.
The way it works.We propose the following augmentations to standard BDI-
theory [13] to support the evaluation of relevance as de-scribed above.
An agent is defined as the tupleA = 〈B,D, I,Γ,A,R, ξ〉.Where B is the beliefbase, D is the desirebase, Iis the intentionbase, Γ is the set of plans, R isthe set of relevance filters and ξ is the eventbase.In addition an agent has basic actions A.
• Beliefs represent the state of the environment, suchas items, people, obstacles as well as the robot’s ownstate, such as current location.
• Desires give the overall goals of the agent; that isgeneric goals the robot should pursue overtime whenthe proper conditions arrive. If the condition is truethe desire is adopted.
• Intentions represent the goals to which the agent iscommitted. These are always preceded by a condition.This describes the necessary preconditions to achievethe intention.
• Plans are practical reasoning rules defining how theagent infers what to do to achieve a goal. A plan maycontain a set of sub-plans (or sub-goals) that wouldlead to achieving the main goal. Plans are also alwayspreceded by a condition. This describes the necessarypreconditions to execute the plan.
These structures are similar to those already in use inagent models, but we have added ‘conditions’ for desiresand intentions, rather than only have them for plans. Suchconditions should be interpreted as a subset of possible pred-icates in the world. A condition is considered to be true ifthe beliefbase is consistent with it. In addition to thesevariations on standard structures, we introduce events andrelevancy filters as new structures for the context-observer.

Figure 1: Context-observer design
Events, relevancy filters and revised deliberation.Events are used for internal communication in the agent.
They keep the other structures and modules updated andthe deliberation cycle streamlined. Their structure consistsof a message, a triggering object and a receiver.Relevancy filters are the “planning rules” of the context-
observer: they are generated from the conditions of theclassic elements and “trigger” if any incoming informationchanges the truth value of the condition (or conditions).The context-observer’s ‘deliberation’ will run in parallel
to the agent’s deliberation, allowing it to use the resourcesavailable as efficiently as possible by preprocessing incomingdata based on the relevancy filters. If a relevancy filter trig-gers that a condition, previously true, has been falsified, ittriggers reconsideration of the corresponding element.When the desires, intentions or plans of the agent are
changed, then an event is sent to the context-observer. Inresponse to this the context-observer processes the event andupdates the relevancy filters. If the element was asserted, allthe predicates in the condition are added as a relevancy fil-ter. If the element was retracted, then any predicates not inuse for any other conditions are removed from the relevancyfilters.An overview of how all these elements come together can
be seen in figure 1. We will now demonstrate how this im-proves the functioning of the agent with an example.
2.1 A context-observer in TileworldLet us assume the problem scenario in figure 2. This sce-
nario is a mix between the concepts of mobile services and“Tileworld” games. The agent has the desire goBase(G) toreach base G, downloadF iles(G) to download the files forgoal G, and the plan rules to resolve these goals. New basesare added to the scenario at run-time, with different pri-orities. The number of files to download and the size ofthe window of opportunity (WoO) varies randomly per goal.Let us say that for each base G, the belief base contains thefollowing information: pos(G, X, Y ), represents the positionfor G; files(G, [files]), represents the list of files associatedto G; woo(G, N), represent the size, in number of squares,of the window of opportunity for processing G. The agent’s
Figure 2: Mobile services in Tileworld
position is represented as pos(X, Y ). The agent can simulta-neously move one square and download one file per goal perclock period. It can also download files simultaneously, how-ever there is a penalty associated to networking concurrency– set at 10% in this example.In one particular run, the scenario is as in the figure. The
agent activates the desire goBase(G1) and the deliberationleads it to commit to that goal. The agent starts to movetowards G1. Let us say that when the agent is at pos(4, 6), anew base G2 is asserted with a higher priority. The goals toreach two bases at the same time are conflicting, of course.Hence, the agent has to reconsider the current intentiongoBase(G1), by pausing it and starting the new intentiongoBase(G2). It starts to move towards G2. The goals todownload files are not conflicting, as the agent can down-load files for different goals concurrently. We aim to showhow the context-observer helps to improve the application’sperformance in relation to this goal.In (Case I), the application operates without a context-
observer. The application starts to download the files forG1 immediately. At pos(4, 6), when it learns about G2 (asdescribed above), it continues to download the files for G1and starts to download the files for G2 concurrently. Asthere are three files forG2, it completes this task at pos(7, 4),delivering the information at that point. It continues todownload the files for G1, which has nine files associated toit, completing at pos(8, 5), that is while the agent is at baseG2.One can say that this information is delivered at an incon-
venient time, which is intuitive if, for example, the mobileuser is attending to a meeting at G2 and receives the filesfor G1 at that point. I also note that there are no downloadoperations happening between G2 and G1, because the goalshave been completed already, thus it misses the opportunityto optimise the processing by postponing the downloads forG1 to this convenient time. In addition, the “overhead cost”of concurrent downloads between pos(4, 6) and pos(6, 6) re-sults in total costs equals 11.6.In comparison, in (Case II), the application operates with
a context-observer. The desire to download the files for G1is preceded by a condition that it has to be within the areamarked as “Window of Opportunity (WoO) G1” to deliverthe information for G1 at pos(4, 4). Then, it starts to down-load the files.

When the agent reaches position pos(6, 6), it is still in theWoO to download the files for G1 and steps inside the WoOto download the files for G2. The downloads are processedsimultaneously, as explained, however they compete for re-sources – namely, network bandwidth. Next, the agent stepsout of the WoO for G1, at pos(7, 6). An event is generatedthat the condition for the desire to download the G1 fileshas been falsified. At this point, the deliberation systemcan stop downloadF iles(G1), because it is no longer rele-vant. It can then concentrate resources on other concurrentdeliberations – namely, into downloadF iles(G2).Once the agent reaches G2 and the information is de-
livered, it has the opportunity to resume the deliberationof goBase(G1). Again, once heading towards base G1, atpos(7, 7) it is in the WoO to deliver the information for G1.Hence, it can resume the deliberation of downloadF iles(G1).The remaining files are downloaded and delivered beforereaching G1.In this case, the information is delivered at convenient
times for both G1 and G2. In addition, as the file downloadfor G1 is postponed to a more convenient time – that is,paused when out of the WoO for G1 and resumed betweenpos(7, 7) and pos(4, 7) – it reduces the amount of concurrentdownloads, thus saving “overhead cost”. The resulting totaldownload costs equals 11.2, which is an improvement over(Case I)’s deliberation.Therefore, the agent is saving resources when it is able to
pause and resume the file download deliberations in responseto events from the context-observer. The optimisation ofthe number of operations involved is the visible consequenceof taking advantage of environmental information to decide“when” to reconsider. The operations are facilitated by theability of the planning process to handle concurrent deliber-ations.
3. CONCLUSION AND FUTURE WORKFor a mobile device to function as a context-aware ap-
plication, it is necessary to integrate many of the differentservices available on it. The application must therefore dealwith a large amount of highly dynamic and heterogenous in-formation. We have shown that while agent architectures area natural choice for use in such environments, their adop-tion is not without problems. One of those is recognizing“when” is the optimal time to reconsider desires, plans andactions. The context-observer is designed to alleviate thisproblem by recognizing whether new information impactscurrent deliberations or executions. If this is the case theagent is “warned”, thus bypassing the deliberation cycle’s in-herent delayed action. The agent is more equipped to reactto dynamic information using fewer resources when doingso. We use information provided by the agent designer tosupport these runtime decisions.The context-observer performs a role of meta-reasoning
and we do not argue that it is the only way that one couldsolve this conundrum. However, we believe that placing thiskind of meta-reasoning as a preprocessing module on incom-ing information is an intuitive solution that makes it easyfor the designer, programmer and user to understand.The next step in researching the context-observer is to
demonstrate, with qualitative and quantitative simulations,that the context-observer can assist the application designerto configure a system to suit characteristics of the domain,and can help provide the user with a coherent, pervasive,
mobile application.
4. REFERENCES[1] R. H. Bordini and J. F. Hubner. Bdi agent
programming in agentspeak using jason (tutorialpaper). In CLIMA VI, pages 143–164, 2005.
[2] M. Bratman. Intention, Plans, and Practical Reason.Harvard University Press, Cambridge, MA, 1987.
[3] M. E. Bratman, D. J. Israel, and M. E. Pollack. Plansand resource-bounded practical reasoning.Computational Intelligence, 4(4):349–355, 1988.
[4] G. Chen and D. Kotz. A survey of context-awaremobile computing research. Technical ReportTR2000-381, Dept. of Computer Science, DartmouthCollege, November 2000.
[5] M. Dastani and J.-J. Meyer. A practical agentprogramming language. In Proceedings of the fifthInternational Workshop on Programming Multi-agentSystems (ProMAS’07), 2007.
[6] A. Greenfield. Everyware: the dawning age ofubiquitous computing. New Riders Publishing, 2006.
[7] K. V. Hindriks, F. S. d. Boer, W. v. d. Hoek, andJ.-J. C. Meyer. Agent programming in 3apl.Autonomous Agents and Multi-Agent Systems,2:357–401, 1999.
[8] N. Howden, R. Ronnquist, A. Hodgson, and A. Lucas.Jack intelligent agents - summary of an agentinfrastructure. In 5th International Conference onAutonomous Agents, 2001.
[9] F. Koch and I. Rahwan. The role of agents inintelligent mobile services. In Proceedings of the 7thPacific Rim International Workshop on Multi-Agents(PRIMA), volume 3371, Berlin, Germany, 2005.Springer-Verlag.
[10] M. Luck, P. McBurney, O. Shehory, and S. Willmott.Agent Technology: Computing as Interaction (ARoadmap for Agent Based Computing). AgentLink,2005.
[11] M. O’Grady and G. O’Hare. Mobile devices and
intelligent agents U towards a new generation ofapplications and services. Intelligent Embedded Agents,171:335–353, May 2005.
[12] A. S. Rao and M. Georgeff. Bdi agents: From theoryto practice. In Proceedings f the First InternationalConference on Multi-Agent Systems, ICMAS 95, 1995.
[13] A. S. Rao and M. P. Georgeff. Modeling rationalagents within a BDI-architecture. In Proceedings ofthe 2nd International Conference on Principles ofKnowledge Representation and Reasoning (KR’91),pages 473–484, San Mateo, CA, USA, 1991. MorganKaufmann publishers Inc.
[14] M. Weiser. The computer for the twenty-first century.Scientific American, pages 94–104, 1991.
[15] M. Wooldridge and N. R. Jennings. Intelligent agents:theory and practice. The Knowledge EngineeringReview, 10(2):115–152, 1995.

Elaborating a Framework for Open Human ComputerInteraction with Ambient Services
Andreas Lorenz, Markus Eisenhauer, Andreas ZimmermannFraunhofer Institute for Applied Information Technology
Schloss Birlinghoven53754 St. Augustin, Germany
{andreas.lorenz, markus.eisenhauer, andreas.zimmermann}@fit.fraunhofer.de
ABSTRACTIn a world of ambient services, the technology disappearsinto the surroundings until only the user interface remainsperceivable by users. Most preferably, the interface to in-teract with an ambient service is separated from the devicehosting the services, e.g. the user interface is running on amobile device and connected with the devices in the envi-ronment. In our work we will define a framework enablingdifferent ambient services to work together with different in-put devices and vice versa. The goal is to enable the userto employ the device that fits best to the current situation,personal capabilities and gusto. In particular the use of de-vices the user is already familiar with should be transferredto additional or new services.
1. INTRODUCTIONIn an ambient intelligence world, devices work together tosupport people in carrying out their daily activities in aneasy, natural way using information and intelligence that ishidden in the network connecting these devices. The tech-nology disappears into the surroundings until only the userinterface remains perceivable by users. Key terms describingambient services are
• Embedded hardware integrated in the environment(smart devices, sensors, interaction devices),
• Seamless mobile/fixed communication and computinginfrastructure (interoperability, wired and wireless net-works) and
• Personalized human-computer interfaces.
In opposition to the desktop paradigm, in which a singleuser consciously engages a single device for a specializedpurpose, someone interacting with ambient services engagesseveral computational devices and systems simultaneously.In this work we will describe technologies to enable any de-vice to be an interaction device for interacting with ambientservices. Because we address a wide range of computing de-vices (mobile devices like mobile phone, Pocket-PC, voicerecording devices, gesture-based interaction device like Wii-Controller, and other) we use the term input device for thedevice the user has at hand.In this paper we will elaborate a framework that abstracts
from concrete input devices. The paper covers the wholeprocess from identifying the needs and requirements, defini-tion of the terms and components to the specification of theframework.
1.1 ScenarioBurkhard, a business man always interested in the newesttechnology, went to his favorite media store to get the newesthome cinema equipment. He has to listen to a long intro-duction from the shop assistant, because there are so manyoptions; at the end, Burkhard has the choice between an-other remote control or just a Compact-Disc with softwarefor any Java-equipped mobile device. Because his wife is al-ready tired of the zoo of remote controls on the coffee tablein the living room, Burkhard takes the CD and installs asmall piece of software at his pen-enabled PDA, which en-ables the device to be the remote control of the home-cinemaequipment. For his wife, he installs the same software on hermobile phone - because her device does not support a pen,she uses another version that is using the joystick insteadof the touch-sensitive screen. With the software, everybodyis able to elect the best device and the favorite input style.The input is automatically translated to control commandsand sent to the environmental device, which reacts accord-ingly. From now, it will be an important feature of any newelectronic product to work together with Burkhard’s smart-phone as control device, too.The scenario illustrates the vision of replacing hardware
remote controls with software applications to be installed onany existing device. Other scenario would envision high in-tegration of different input modalities with one and the sameservice, for example to have a haptic remote user interfacefor one user and in parallel a speech control for anotheruser with visual acuity. Both envisions the selection of anymodality by the user without the need to change the service.
2. PROBLEM DESCRIPTIONOne limiting factor for market penetration of ambient ser-vices is the dependency between services and required inter-action devices and methods. In private environments, e.g.at home, it combines purchasing a new product with the ac-companied requirement to learn operating a new device anda new interaction method. In foreign environments, privatedevices are completely useless because they are not able tointeract with the environment. The provision of special pur-pose devices by the vendor has proven to be one of the mostlimiting factor for acceptance of public ambient services.What device is used is defined by the vendor of the ser-
vice - regardless on the capabilities of the user, her devicesalready available and the task currently performed. For re-mote interaction with a service this pre-selection of the in-put device(s) becomes obsolete. Example: A Movie-Playeris running on a PC with TV-output. For starting the play-

back, the player understands clicking on the “Play”-Buttonwith the mouse, entering “Ctrl-P”with a keyboard or saying“Play” into the microphone.The interaction could be improved if the user is in position
of decision-maker, mainly because of four reasons:
1. The service usually does not care about the physicaldevice the user employed. The source can be any de-vice that is able to deliver the input to the service.
Example: To invoke the “play”-method it is equal tothe Movie-Player if the user employed the mouse, thekeyboard or the microphone to express the input.
2. The service usually does not care about the input modal-ity the user has chosen. The user can select any stylethat can be transformed one-to-one into the right for-mat.
Example: To invoke the “play”-method it is equal tothe Movie-Player if the user has pressed“Ctrl-P”, clickedon the “Play”-button or spoke the command.
3. The input devices usually work independent of the per-forming services, in particular they do not care aboutthe behavior of the service.
Example: Whenever the user pressed “Ctrl-P”, clickedon the button, or spoke“Play”neither of the keyboard,the mouse or the microphone cares about whether themovie starts playing or not. Either knows nothingabout movies.
4. The user cares about the device, the modalityand the behavior of the service depending on
• Situation
Example: In front of the PC, the user might takethe mouse; sitting on the couch, the user mightemploy a spoken command.
• Task
Example: For starting the playback, the user mightemploy the speech recognition - for browsing thefile system searching a movie, the user might switchto the mouse.
• Preferences
Example: The user might find it strange to chatwith a computer system and prefer to use mouseor keyboard if possible.
• Capabilities
Example: A physical impaired user might not beable to operate a mouse but capable of speech.
With our work we address service developers who want toenable users employ any device as input device, and inter-action developers who want to enable input devices to worktogether with environmental services. We will empower dis-tributing input events from any source to any service cur-rently enabled without loosing it’s meaning to the service.The remote access is illustrated in Figure 1.
Figure 1: Transmission of user input from any re-mote device to service(s).
2.1 RequirementsThe first step is to enable services to receive and consumeinput from devices a user already knows. The way to createdesired input with the device, its meaning to the service, andthe expected reaction from the service must be clear to theuser. To be attractive to a wide range of users, the solutionshould work on different devices and in different environ-ments. The communication of the device with the servicemust be wireless in order to be usable from any location.The more developers are able to integrate their solutions,
the more solutions will be available for selection. Usually,services from different vendors do not speak the same lan-guage. For integration we need to have a common way toexpress meaning of input events and a unique process for theexchange. The interface of the service should be consistentwith available standards as much as possible. All specifica-tions need to be well defined, first-class documented, easy tounderstand (here: “easy” from the perspective of a software-developer) and as low resource consuming as possible in or-der to be acceptable by developers. The implementation onboth the input device and the service should be independentfrom operating systems and programming language as muchas possible.
2.2 GoalThe goal of this work is to enable input devices to deliveruser input to ambient services. The input device offers anykind of user interface meaningful to the selected ambientservice(s). The input device transfers this information tothe service which reacts in its specific way.
2.3 Research StatementOne-to-one semantic correspondence between remote inputdevice and processing service is key to open Human-ComputerInteraction with interactive ambient services with the user’schoice of input devices.
3. RELATED WORKSystem capabilities of ambient services are limited if the useris not equipped with a specific input device to have a channelfor explicit input or controlling the behavior. To overcomelimitations, the user could be equipped with a service-relateddevice. The hand-out of devices from a vendor of the serviceboosts costs, requires the user to be willing to pick it upand requires trust into the user to bring it back at the endof the stay. The use of any private device is not possibletoday because they do usually not speak the language ofthe environment, not even in private settings.The zoo of remote controls in home environments indi-
cates high relevance of expressing input to remote devices.Excluding (wireless) mouse and keyboard input, the type

Figure 2: The Technical Components
of remote input can be categorized with rapidly decreasingpercentage of use: Action events like On/Off, Up/Down,Play/Stop are present at almost all remote controls; Num-bers and short texts are sometimes used, for example to op-erate the phone, switch TV-channels, or name movie record-ings; hardly any use of longer text and pointer controls.Iftode et al [5] identified the need for a simple, universal
solution to control different applications in the environmentof the user, which end-users are likely to accept easily. Theinput device should be programmable and support dynamicsoftware extension for interaction with additional ambientservices. For controlling the service, many approaches al-low users to design their own remote control by creatingnew graphical interfaces that are downloaded to the inputdevice after compilation. Beside these haptic input capabil-ities it is also possible to use speech recorded by a mobiledevice to control a remote system. Using for instance thePersonal Universal Controller [8] a user can speak a com-mand through which this is executed by the system. Thefocus is on automatic creation of the user interface from adescription language.Research in projects like IBM’s “Universal Information
Appliance” (UIA, [3]) or XWeb [9] results in the definition ofa set of incompatible description languages like MoDAL (theXML-based language used by UIA) and UIML [1], where theprogrammer provides a specification (model) of the applica-tion, the display and the user. The concrete user interfaceis thus decoupled from the application, but only valid for aspecific one. Though they are often based on similar com-ponents, they cannot be applied to another ambient service.The iStuff Mobile architecture [2] is a platform combining
(physical) sensor enhanced mobile phones and interactivespaces. The platform uses an Event-Heap [6] for distributingevents of a specific type with specific fields. The mobilephone is then capable of sensing (local) user activity (e.g.key pressed) that are posted as (iStuff-)events on the heap.
3.1 SummaryTransferring events to any ambient service generally capableof performing the input but not able to correctly understandthat particular type and content is useless. For develop-ment of GUI-based desktop applications there exist alreadycommon techniques and events that have a clear meaningto any application. For example, independent events likemouse-clicks can be delivered to any service; the mouse orthe mouse-button itself does not know about the meaningto the application. The mouse could be replaced with anyother physical device; if it fires correct mouse-events, theapplication will understand.
4. TERMS AND DEFINITIONSFor our work we identified the following components. Figure2 illustrates their places in the overall process.
Input Device. The mobile device the user engages to con-trol the ambient service. The type and shape of the device isnot defined per se. On the remote device there is a client ap-plication running as the counterpart of the user-interaction.Examples: Mobile phone, laptop, microphone, traditionalcomputer systems.
Controlled Device. A computing device that is availablein the current environment of the user.Examples: Small items providing information (sensors), out-put devices (displays, speakers), traditional computer sys-tems.
Ambient Service. An interactive application (short ser-vice) running on any controlled device. The user consciouslyinteracts with the service in order to get information, adjustsettings or control the behavior.Examples: Small services providing information to the user(like the temperature), electronically actuate output devices(like playing an audio file at a speaker installation in aroom), GUI-based applications on embedded devices (likeshowing a movie on the TV).
Client. The role of the information provider in the client/-server approach. In our case, the client is the applicationrunning on the input device, receiving input from the userand delivering the input in a feasible manner to the event-consumer.Examples: Networked application with graphical compo-nents, audio/voice-recognition systems, camera-based input,gesture recognition applications.
Server. The role of an information receiver in the client/-server approach. In our case, the server is the applicationrunning on the controlled device providing any number ofservices.Examples: Networked application with or without local user-interface, TCP/IP-Socket listener, Web-Server.
Input Method. An abstract definition of a way to expressinput by the user, including the modality used with the inputdevice. The potential meaning, interpretation and reactiondepends on the service implementation.Examples: Common GUI-based methods (for example click-ing a certain button), voice commands (like spoken word“up”), gestures (like “Thumb up”) or any other method. Theexamples could be interpreted to increase the volume by anaudio player, but other services could implement their owninterpretation (for example to move the cursor upwards).
Input Event. The event delivered by the client to the server,containing the type of the event and other event-specificdata.Examples: Button-pressed events, key-typed events, or mouse-move events. The events include additional information likethe character assigned with a pressed key or the positionwhere a mouse click occurred.
Event Consumer. A set of any number (including zero) ofambient services processing an event in their defined man-ner. If the set is empty, no service is able to make use of theinformation; the event is ignored.

5. DESIGN OF A FRAMEWORKA software framework is an abstract design for a categoryof software systems. It defines a set of cooperating compo-nents, and the control flow in the system [7]. Some defini-tions implicitly require an object-oriented software design,defining a framework as an“architecture of class hierarchies”[10]. This might exclude efficient implementations based onother paradigms and get in the way of mixing up differ-ent software-designs for implementing specific componentsor operations. Because we are focusing on a design of solu-tion(s), we will use the following definition of a framework:
Framework. A Framework is a generic architecture of a so-lution for a set of similar problems.
In computer science, the used term architecture is definedas the ”fundamental organization of a system embodied inits components, their relationships to each other, and to theenvironment, and the principles guiding its design and evo-lution” [4].In traditional (Graphical) User Interfaces (GUI), the user
has access to application dependent graphic components.The user employs a mouse or keyboard in order to deliver in-put to the service. Most programming languages offer com-ponents to support the development of user interfaces, to-gether with back-end-mechanisms for performing user input(for example event-listener mechanism). In this case, theservice provides a performing method that is associated toinput events occurring on the control component.For the definition of our architecture, we abstract from the
GUI-based control flow by defining a Virtual Input Device.It has the same attributes and behavior like any other devicerunning a user interface except that it’s shape is not defined;in particular, it does not necessarily provide any graphicalrepresentation. The only visible knowledge is a precise spec-ification of input event(s) it delivers on the user’s request.Potentially in parallel to existing graphical items, the de-veloper registers listeners to the events for performing theinput stream coming from virtual input devices.The derived abstract system architecture is illustrated in
Figure 3. The information flow to transfer an input eventoccurring on an input device to an ambient service consistsof six steps to be performed: (1) Triggered by the user inter-action, the client on the input device receives an input eventfrom the local resources. (2) The input event is translatedinto a common representation. (3) The event is sent fromthe input device to the controlled device. (4) The inputevent is unpacked from its representation. (5) The inputevent is delivered to the target service(s). (6) The targetservice(s) consume the event. In this flow, the virtual inputdevice covers the steps (2)-(5). For implementation we willuse standard web-service technology defining input-adaptersas web-services that are remotely executed over the network.
6. BENEFITSThe virtual input device covers the complexity of deliveringinput events from the client to the server. On the clientside, the local event is handed over to a specific componentas if the component was a local event consumer (“fire-and-
Figure 3: The abstract system architecture
forget”). On the server side, there is no difference betweentraditional event handlers and listeners to virtual input de-vices, which supports the integration between the two andtransferring developer skills to the new setting. Because themeaning of an input event becomes independent from itsrepresentation, the creation of an input event is not boundto any static process: it is open to the developer, the capabil-ities of the device and the abilities of the user to employ anyphysical device and select the appropriate input method.
7. REFERENCES[1] M. Abrams, C. Phanouriou, A. Batongbacal,
S. Williams, and J. Shuster. UIML: Anappliance-independent XML user interface language.In International World Wide Web Conference,Toronto, Canada, 1999.
[2] R. Ballagas, F. Memon, R. Reiners, and J. Borchers.iStuff Mobile: Rapidly prototyping new mobile phoneinterfaces for ubiquitous computing. In SIGCHIConference on Human Factors in Computing Systems,pages 1107–1116, San Jose, CA, 2007. ACM Press.
[3] K. Eustice, T. Lehman, A. Morales, M. Munson,S. Edlund, and M. Guillen. A universal informationappliance. IBM Systems Journal, 38(4):575–601, 1999.
[4] IEEE. Systems and software engineering -recommended practice for architectural description ofsoftware-intensive systems. ISO/IEC 42010 IEEE Std1471-2000, pages c1–24, July 2007.
[5] L. Iftode, C. Borcea, N. Ravi, P. Kang, and P. Zhou.Smart phone: An embedded system for universalinteractions. In IEEE Intl. Workshop on FutureTrends of Distributed Computing Systems, 2004.
[6] B. Johanson and A. Fox. The event heap: Acoordination infrastructure for interactive workspaces.In IEEE Workshop on Mobile Computing Systems andApplications, page 83. IEEE, 2002.
[7] J. Ludewig and H. Lichter. Software Engineering.dpunkt.verlag, Heidelberg, 2007.
[8] J. Nichols, B. A. Myers, M. Higgins, J. Hughes, T. K.Harris, R. Rosenfeld, and M. Pignol. Generatingremote control interfaces for complex appliances. InACM symposium on User interface software andtechnology, Paris, France, 2002. ACM Press.
[9] D. Olsen, S. Jefferies, T. Nielsen, W. Moyes, andP. Fredrickson. Cross-modal interaction using xweb. InAnnual ACM Symposium on User Interface Softwareand Technology, pages 191–200. ACM Press, 2000.
[10] H. Zullighoven. Object-Oriented ConstructionHandbook. dpunkt.verlag, Heidelberg, 2005.

Using Haptics for Mobile Information Display Karon E. MacLean
Department of Computer Science University of British Columbia
Vancouver, B.C., Canada 001-604-822-8169
[email protected] feedback has a role to play in mobile display of information, with its potential for enriching technology interactions, offloading vision, and providing low-attention or eyes-free communication with networked information and other users. However, without careful and perceptually informed design, it will become just another annoying distraction; and our current knowledge of both haptic perception and the impact of its processing on multimodal attention is in its infancy.
This position paper outlines opportunities and pitfalls of designing mobile haptic interactions, with emphasis on abstract communication via haptic icons – brief, informative tangible signals. Past and ongoing projects relating to this effort are described, and illustrated using usage scenarios.
Categories and Subject DescriptorsH5.2. Information interfaces and presentation (e.g., HCI): User Interfaces, Haptic I/O.
KeywordsHaptic feedback, haptic icons, tactile, mobile interaction design.
1. INTRODUCTIONToday’s combination of "always-on” connection devices and feature bloat bombards users with visual and audio information. This situation is particular severe with mobile devices, where screen real estate is limited and there are typically multiple demands on a user’s attention.
Haptic feedback should be able to help alleviate this overload, by providing another communication channel that has several special properties. The haptic sense, comprising taction (perceived through the skin) and proprioception (body forces and motions), is underutilized in computer interfaces; yet we have a rich experience in the physical world of using it to collect information in intuitive, transparent ways [8, 9, 12]. With haptic feedback, we can also make small digital transactions physical, confirmed, and articulated [10]. In the real world, we know a door latch has engaged when it clicks. The computer doesn’t usually help us out in this way, and when it does, it’s generally with a sound [7] which, while effective, can be intrusive or (conversely) go un-sensed in a noisy environment. Finally, mobile devices are often held or carried in close bodily contact, providing opportunities for haptic display – delivered for example as tactor waveforms, by a vibrating screen and felt through a stylus, or by the motion of a force-feedback knob.
On the down side, we do not yet have heuristics or common expectations for how nontraditional information should be
transmitted haptically in digital interfaces, especially for multitasking situations where the user is cognitively loaded. One challenge is the limited expressiveness of haptic technology in most current mobile devices, which employ actuators capable only of simple vibratory feedback (on/off). Technology that can produce richer haptic feedback is needed to research and develop effective interaction techniques that make the most of this channel. Moreover, to augment interfaces haptically without making the overload even worse requires understanding the role of attention – and its saturation – in multimodal perception.
In this position paper, I begin by defining a basic unit of communication that my research group and others have been using in our early explorations for mobile haptic communications: the haptic icon. I then further describe key roles that haptics will play in this domain as well as the device form factors which are emerging. For the remainder, I outline the efforts my group has made on several key research challenges before us. These relate to (a) designing perceptually distinguishable sets of haptic icons, (b) increasing usable set size, and (c) managing intrusiveness in multimodal, multitasking environments.
At this juncture, I introduce Tamara, a young professional parent who will illustrate some of these ideas. Some are near fruition, while others may never occur as we envision them. Their specificity should help demonstrate the potential breadth and richness of the haptic modality.
A salesperson, Tamara is often on the road. She spends a large part of her day in the car, commuting from one client to another. We catch Tamara as she as she kisses her young son goodbye and embarks on a road trip to her clients in her sales area.
Figure 1. An example of multitasking using a mobile touchscreen device (Nokia 770 tablet). Haptic feedback could enable the user to pay more visual attention to the presenter.

1.1 Haptic Icons Haptic icons are brief, active, tangible stimuli (either tactile display or proprioceptive force feedback) that convey information such as event notification, identity, content or state [1, 4, 14, 16]. Because most humans do not have experience in obtaining abstracted, representational information through their touch sense – as we do for vision and audition – this vocabulary must be constructed with care, and with attention to human perceptual and cognitive abilities [15, 19].
In order to be effective, haptic icons must be both meaningful and easily distinguished. They also need to be short, easy for a user to process, and must transmit a message reliably and consistently. They must not be ignorable when conveying urgent and important information. Like graphical icons, haptic icons must either be universal (generally recognized by different people in different situations) or easily learned and compatible across applications.
Scenario: Tamara receives an urgent call During an informal chat with some clients she is visiting, Tamara receives a call on her mobile phone, which is on “vibrate” mode. Reaching into her pocket and grasping the phone with her thumb on the small tactile display on its side, she immediately receives a sharp, anxiety-provoking sensation. Two traveling ridges start repeatedly from the two opposite ends of the tactile pad and meet in its center; they accelerate like a heart beating faster and faster. There is definitively something wrong at home! After apologizing to her clients, Tamara answers the phone to find out from the babysitter that her 5-year-old boy, Bobby, has cut himself with a rusted nail. The babysitter is on the way to the hospital and wondering about tetanus shots.
It is easy to imagine Tamara’s cell phone displaying other haptic icons to indicate different conditions and callers. She is able to get details about the urgent message from the phone’s tactile display with a quick, discreet motion (slipping her hand into her vest). While the transmitted message must always be clear and concise, in most situations it should not demand Tamara’s full attention.
Metaphorical associations: Initial design efforts have built on our social and experiential norms for manipulating tangible objects and interpreting physical feedback. Well-established metaphors for touch drive new models for association and bring intuitive meaning and affordances that relate to haptic icons. However, there have not been many deployed examples of metaphorically designed icons; a set of 7 were successful used in [4].
Arbitrary associations: The metaphorical approach does not scale well because it is difficult to simultaneously optimize metaphorical matching and stimulus distinguishability as the set grows. This is partly a function of the limited expressiveness of today’s tactile display hardware, particularly constrained by requirements for small size and low power. Furthermore, abstract information items might not have an obvious tangible analog on which to base a metaphorical connection. Thus, one of our research foci has been to understand the extent to which people are able to learn and remember large collections of arbitrarilymatched stimulus-meaning pairs, and to explore best-practices for both effective design and effective learning [5, 6]. A more
extensive comparison between these two design approaches is available in [15].
Our group has worked for several years to refine the process of designing haptic icons for specific applications, beginning by satisfying the necessary (but not sufficient) requirement for perceptual distinctiveness using a perceptual optimization tool [16, 20]. We have demonstrated that users can learn a small set of icons quickly: in one typical result (using a commodity vibrotactile display embedded in a mouse) users learned 7 icons in less than 3 min, and retained and used them over a 3-hour period [3]. We have gone on to deploy haptic icons in a number of applications and device form factors [4, 6, 22]; and obtained insights into how to meet user needs with embedded tactile displays through managed intrusiveness and eyes-free operation.
Our results here and elsewhere indicate that this kind of abstract haptic feedback has sufficient expressive and information capacity to provide a real benefit in these contexts, and user feedback confirms a need for quiet, non-intrusive haptic signals in applications such as hand-held mobile devices.
2. The Hardware The vibrations emitted by today’s cell phones are usually produced by small, eccentrically weighted motors whose high-speed oscillation makes the device case buzz. These actuators are limited in expressive control – most fundamentally, bandwidth as well as independent control of the resultant vibratory amplitude and frequency. They can produce only a few discernible signals which are not particularly pleasant to feel.
New technologies such as piezoelectric ceramic actuators are emerging as suitable technologies for rendering more expressive haptic feedback (e.g. in the piezo-actuated touchscreens of [11, 21], which are also fast, strong, thin and light. Piezos allow independent control of their amplitude and frequency, leading to a greater variety of tactile waveforms. However, piezos have the disadvantage of relatively low signal strength: their feedback is rich and precise but subtle, best for engaged use. Other approaches currently in vogue include solenoids and voice coils; these, as well as eccentric motors, produce stronger percepts more appropriate for attention-grabbing roles.
We have also explored new ways of delivering this information. A force feedback knob embedded in a handheld form factor
Figure 2: Piezo-based skin-stretch display

supported early interaction concept explorations [18], which more recent, embeddable knob technology could render relevant. A novel handheld tactile display [14]1 brings a skin-stretch principle to the mobile form factor. Because the sensations this device renders are completely unfamiliar, its language is truly new. Its design had to be founded on a thorough psychophysical characterization.
3. Roles for Haptics in Mobile Computing There are many ways that haptic feedback will be able to contribute to user’s transparent access to networked information while on the go. The following provides a few examples.
3.1.1 System to user: signal, monitor and navigate In the natural world, we often use touch to detect events and monitor states – the pencil sharpening is finished; the road is rough, so we must slow down. Touch is also an obvious choice for spatial cueing: a tap on the shoulder can tell us which way to look. Further, we often obtain this information and act on it sub-consciously. We can use a similar approach with synthetic and abstracted haptic displays, and aim for the same kind of low-attention, background human processing of ongoing system processes and network events. However, this entails knowing about the limits of our tactile perception, our cognitive models for associating signals with meanings, and the role attention and workload play in what gets through.
Hence, lacking proven heuristics for this modality, usability means combining top-down with bottom-up design: identifying valuable use cases via contextual study, while closely examining candidate solutions with respect to basic human abilities. In this manner, we have related a number of system-user communication scenarios (including GPS-guided urban navigation and signaling applications) to the specific display capabilities of a given device [14]. In [5, 6], we have further focused on mechanisms that users find natural for learning haptic representations for system notifications and labels.
3.1.2 Lightweight communicationHaptic feedback can be used to mediate background communication among users, freeing voice and ears for other tasks. For example, we used the vibrotactile mouse-based icons described above in a fully simulated, remote collaboration task to mediate turntaking. We found improved collaborative quality by metrics such as equitability of time in control and control turnover rates, through a background awareness of others’ wish to participate [3, 4]. In upcoming work, we will deploy this concept on mobile devices in a classroom setting.
Scenario: haptically-mediated turn-takingTamara enters the room for a meeting with several people at her client’s company, with others connected by video, and notices Karl (known for endless monologues, important to not offend).
She takes hope from her next observation that the room has haptic chairs that help speakers be aware of how urgently others wish to take the floor. Soon, Karl raises
1 Built in collaboration with V. Hayward of McGill University.
a criticism that Tamara can address, but doesn’t give her an opening. Instead of trying to interrupt verbally, Tamara reaches for the button on her armrest. Both Tamara’s and Karl’s chairs emit a firm, brief vibratory burst, indicating that a new and urgent request has entered the queue, which recurs every 20 seconds or so. After a minute, Karl pauses in mid-harangue, looks down at his chair, mildly surprised, then looks around the room. This time Tamara is able to catch his eye, and quickly takes the floor. Karl pushes a release button on his own chair to stop his queue-signal.
In the middle of her answer, Tamara gradually notices a mild pulse on her own chair. Someone else wants to talk next, but not urgently. The faces around her tell her nothing. She wraps up her point a bit more briskly and presses her release button. In the ensuing pause, someone on the video link introduces a different topic.
The haptic signals that Karl and Tamara feel must be matched to both the task and the users. For Tamara, it provided extra contextual information, without distracting her from her speech. In contrast, the haptic cue that Karl received was so evocative that it demanded his attention. To make these interactions possible, application designers need a solid understanding of how people react to haptic stimulation under cognitive load.
3.1.3 Structuring the handheld workspace Haptics on a mobile platform can also be used in a more local way, to provide immediate guiding feedback and constraints in basic GUI operations. Vibrotactile feedback can display object edges, button click confirmation, scrollbar position and progress bar status [13]. In the future, we plan to extend this to facilitating handheld interactions with large projected workspaces
4. Interaction Design Challenges I close with brief comments on a selection of the core questions which currently pose the most serious obstacles to embedded haptic feedback; these center on haptic stimulus design given a piece of hardware, rather than improvement of the hardware itself. However, the first two are indeed rooted in the primitive state of current embeddable display technology, which is akin to a (very) low-resolution monochrome graphic screen. One can hope that demonstration of potential value will lead to hardware improvements. A more general discussion of haptic interaction design issues can be found in [17].
4.1 Potential Set Size How much abstract information can we communicate through touch? What perceptually-guided heuristics will facilitate the largest distinguishable stimulus sets? Metaphorically guided icon sets seem to work well up to a dozen items or so, but beyond this more systematic approaches are required. Amplitude, frequency and waveform are the most commonly modulated variables; rhythm shows promise for more range [1, 25]. In [23, 24], we carried out a more comprehensive analysis of rhythm, and used it with frequency and amplitude to create a distinguishable set of 84 stimuli. In ongoing work, we are using this set to study limits on the number of stimulus-meaning associations users can learn and utilize in realistic contexts.

4.2 AssociabilityGiven a set of distinguishable stimuli, the associability problem is to match these to a comparable number of meanings; or in a less constrained but still difficult problem, to choose from the possible stimuli the best matches to a smaller set of meanings. The solution will lie both in the structure of the matches themselves, and in the mechanisms by which users are asked to learn them.
Progress on this front has begun even with the smaller validated stimulus sets available in the past. For example, we hypothesized that when users can choose the stimuli which will represent specific concepts, their learning and recall will be eased and enhanced relative to having arbitrary associations imposed on them. We tested this idea by comparing the two cases for 10-icon sets. This produced two surprising results. Participants recalled 86% of the previously learned associations 2 weeks later without any intervening reinforcement (despite zero expectation of ability to recall); and there was no difference between arbitrary and user-chosen association conditions [5].
These results underscore the eminent practicality of using haptic icons in everyday interface design, suggesting high learnability and a surprising user ability to find their own mnemonics for carefully composed stimuli, regardless of how associations are assigned. However, this is a small set, and we anticipate that more structure will be required to support users attempting far more.
4.3 Design for Attention Designing with awareness of multitasking operating environment is all-important; otherwise, mobile haptics will be just another annoying distraction. To manage intrusiveness and allow the user to optimize where they direct their attention, signals must be designed with variable salience: important events or urgent events/changes should register as “louder” than less important ones [3]. Furthermore, beyond issues of sensory adaptation to the signals, the user’s interruptibility is not a constant. In the car, for example, pulled over vs. engaged in a turn differ substantially in what kind of additional distractions the driver can safely deal with; in the office, some tasks require protection from routine interference, and yet certain events might always be important enough to come through. Eventually (we hope) interfaces will become smart enough to know when to intrude.
For haptic icons to be capable of variable-intrusion signaling, it is necessary to test them as sets while controlling workload intensity in multimodal task simulations. We have developed techniques for prototyping realistic contexts of specific test applications, to explore more basic questions such as how cognitive workload is impacted by haptics communication, and whether conscious attention is required to make use of haptic signals. These have been in the context of urgency-based mediation of turntaking in remote collaboration [2, 3] and in more abstracted instances, iconic rendering of ordinal data [22] and GUI augmentations [13] for their efficiency and robustness under workload. The importance of workload testing is generally apparent in the diversity of response patterns that different types of icons elicit as load increased. For turn-taking, some icons were intended to be more intrusive than others, whereas for the ordinal renderings, our aim was for uniform salience; workload testing allowed iteration to achieve both of these goals.
4.4 SummaryIn this paper, I have suggested how haptic information display can potentially enrich and lower the cognitive and attentional load involved in utilizing mobile information appliances, particularly in multitasking environments. Haptic icons are one possible mechanism, whether implemented through today’s vibrotactile displays or the high efficiency, miniature force-feedback knobs and sliders we will soon see on the market. Successful and scalable design efforts in this area need to be undertaken in a user-centered fashion with attention to user capabilities, and will inform improved device design.
5. ACKNOWLEDGMENTSThe work described here is due to the devoted efforts of many students in the Sensory Perception and Interaction (SPIN) Lab.
6. REFERENCES[1] Brown, L. M., Brewster, S. A., et al., “A First Investigation
into the Effectiveness of Tactons,” in Proc. of 1st Worldhaptics Conference (WHC '05), Pisa, Italy, pp. 167-176, 2005.
[2] Chan, A., Designing Haptic Icons to Support an Urgency-Based Turn-Taking Protocol, M.Sc. Thesis, University of British Columbia, 2004.
[3] Chan, A., MacLean, K. E., et al., “Learning and Identifying Haptic Icons under Workload,” in Proc. of 1st Worldhaptics Conference (WHC '05), Pisa, Italy, pp. 432-439, 2005.
[4] Chan, A., MacLean, K. E., et al., “Designing Haptic Icons to Support Collaborative Turn-Taking,” to appear in the Int'l J of Human Computer Studies, 2008.
[5] Enriquez, M. and MacLean, K. E., “The Role of Choice in Longitudinal Recall of Meaningful Tactile Signals,” in Proc. of IEEE Haptic Symp (HAPTICS '08), Reno, pp. TBA, 2008.
[6] Enriquez, M., MacLean, K. E., et al., “Haptic Phonemes: Basic Building Blocks of Haptic Communication,” in Proc. of 8th Int'l Conf. on Multimodal Interfaces (ICMI '06), Banff, Canada, pp. 302-309, 2006.
[7] Gaver, W., “Synthesizing Auditory Icons,” in Proc. of CHI'93, Amsterdam, pp. 228-235, 1993.
[8] Heller, M. A. and Schiff, W., “The Psychology of Touch.” New Jersey, USA: T. L. Erlbaum, Hillsdale, 1991.
[9] Katz, D., The World of Touch. New Jersey: Erlbaum, 1925/89.
[10] Kontarinis, D. A. and Howe, R. D., “Tactile Display of Vibratory Information in Teleoperation and Virtual Environments,” Presence, vol. 4, pp. 387-402, 1995.
[11] Laitinen, P. and Maenpaa, J., “Enabling Mobile Haptic Design: Piezoelectric Actuator Technology Properties in Hand Held Devices,” in Proc. of HAVE '06, 2006.
[12] Lederman, S. J. and Klatzky, R. L., “Action for Perception: Manual Exploratory Movements for Haptically Processing Objects and Their Features,” in Hand and Brain: Neurphysiology and Psychology of Hand, A. Wing, et al., Eds. San Diego: Academic Press, 1996, pp. 431-446.
[13] Leung, R., MacLean, K. E., et al., “Evaluation of Haptically Augmented Touchscreen GUI Elements under Cognitive Load,” in Proc. of 9th Int'l Conf on Multimodal Interfaces (ICMI '07), pp. 374-381, 2007.

[14] Luk, J., Pasquero, J., et al., “A Role for Haptics in Mobile Interaction: Initial Design Using a Handheld Tactile Display Prototype,” in Proc. of ACM CHI '06, CHI Letters, vol. 8, no. 1, Montreal, Canada, pp. 171-180, 2006.
[15] MacLean, K. E., “Haptics in the Wild: Interaction Design for Everyday Interfaces,” to appear in Reviews of Human Factors and Ergonomics, M. Carswell, Ed. Santa Monica, CA: Human Factors and Ergonomics Society, 2008.
[16] MacLean, K. E. and Enriquez, M., “Perceptual Design of Haptic Icons,” in Proc. EuroHaptics, Dublin, Ireland, 2003.
[17] MacLean, K. E. and Hayward, V., “Do It Yourself Haptics, Part II: Interaction Design,” IEEE Robotics and Automation Society Magazine, vol. 15:1, 2008.
[18] MacLean, K. E., Shaver, M. J., et al., “Handheld Haptics: A USB Media Controller with Force Sensing,” in Proc. of IEEE Haptic Symposium (HAPTICS '02), Orlando, FL, pp. 311-318, 2002.
[19] Pasquero, J., “Survey on Communication through Touch,” Center for Intelligent Machines, McGill University, Montreal, Canada TR-CIM 06.04, 2006. http://www.cim.mcgill.ca/~haptic/pub/JP-CIM-TR-06.pdf.
[20] Pasquero, J., Luk, J., et al., “Perceptual Analysis of Haptic Icons: An Investigation into the Validity of Cluster Sorted MDS,” in Proc. of 14th IEEE Haptic Symposium (HAPTICS '08), Alexandria, Virginia, pp. 437-444, 2006.
[21] Poupyrev, I., Okabe, M., and Maruyama, S . “Haptic Feedback for Pen Computing: Directions and Strategies,” Extended Abstracts of CHI 2004, pp. 1309–1312, 2004.
[22] Tang, A., McLachlan, P., et al., “Perceiving Ordinal Data Haptically under Workload,” in Proc. of 7th Int'l Conf on Multimodal Interfaces (ICMI '05), Trento, Italy, pp. pages 244-251, 2005.
[23] Ternes, D., Building Large Sets of Haptic Icons: Rhythm as a Design Parameter, and between-Subjects MDS for Evaluation, M.Sc. Thesis, Univ. of British Columbia, 2007.
[24] Ternes, D. and MacLean, K. E., “Designing Large Sets of Haptic Icons with Rhythm,” in Proc. of submitted to Eurohaptics, 2008.
[25] van Erp, J. B. F. and Spapé, M. M. A., “Distilling the Underlying Dimensions of Tactile Melodies,” in Proc. of Eurohaptics, Dublin, Ireland, pp. 111-120, 2003.

Charting User Expectations on Mobile Shopping - Role-playing Study on Mobile Interaction with RFID Technology
Susanna Paasovaara Nokia Research Center
Visiokatu 1 33720 Tampere, Finland
Mohsen Darianian Nokia Research Center
Itämerenkatu 11-13 00180 Helsinki, Finland
Jonna Häkkilä Nokia Research Center
Yrttipellontie 1 90230 Oulu, Finland
ABSTRACT The use of mobile communication devices and RFID technology is a popular scenario for future shopping experience, and it offers numerous use cases related e.g. to information delivery, item search, and payment. In this paper we focus on charting the user preferences and potential usability risks with the technology by presenting a user study employing in-depth interviews and role-playing technique in an imaginary shopping situation, where the user was introduced different use cases with a mobile phone employing RFID reader. In this paper, we report the study findings and discuss the questions concerning the distrust and conflicts related to the approach from the user point of view.
Author Keywords Mobile devices, RFID, NFC, smart environments, user studies, usability, physical interaction.
ACM Classification Keywords H5.m. Information interfaces and presentation (e.g., HCI): Miscellaneous.
INTRODUCTION Postmodern consumer energy is changing the future of the retail industry business. In the information society, many consumers use the internet to search information or for product comparison, and with the advances in ICT, this is increasingly possible while mobile. One technology to be utilized in shopping scenarios is near field communication (NFC), typically employing RFID technology, which can be used e.g. to get the information about the items of interest or for payment transactions. Mobile communication devices integrating RFID technology already exist, e.g. Nokia 6131 NFC mobile phone, creating true possibilities to expand the use of the technology for wide audiences. Applying the technology successfully to end-user needs would bring value for the consumer, value gain meaning here e.g. getting simple information about the item of interest or much more complex decision making support like qualified comparisons of features or prices. Nevertheless the acceptance of such technologies is not obvious. The user needs to see the personal value gain, face friendly physical interaction and trust in the new technology in mobile devices.
Many of the research studies with new use cases for mobile technology concentrate on rather narrow use scenarios and have been done with technology orientated people. In our study, we wanted to chart end user expectations and concerns in a versatile shopping scenario, which covered different kinds of use cases. By this, we aimed to facilitate the interviews by showing the participants different kinds of possibilities with the technology and evoke their imagination. Similar approach where role-playing technique has been used for charting user experience with physical interaction phenomenon can be found in [10], where the participants interacted with a mobile phone and visual tags. In the following, we present related work in the area, describe our user study and the key findings, and discuss the trends that rose from them.
RELATED WORK Physical interaction phenomenon with mobile devices and real world has gained relatively high attention during recent years. Välkkynen et al. have proposed three categories for physical mobile interaction – touching, pointing and scanning [11], which have been further investigated by Rukzio et al. [7]. Here, touching and pointing refer to physically touching or remotely pointing the smart object, respectively, whereas scanning can be used to browse and search smart objects or services in a physical space. With RFID technology, the user typically touches or points an RFID tag from a near distance with his/her mobile device. This interaction style has been suggested both because of the efficiency of interaction in providing shortcuts to avoid long navigations paths in mobile device’s application menus, as for its intuitiveness - when you select the physical object by touching, you know what you are interacting with. This kind of touching metaphor has been utilized for instance in pairing Bluetooth devices [9].
Also in commerce, simple RFID based interactive applications have been around for years, probably the most common example being ticketing. These applications are often developed around a limited functionality, and concentrate e.g. on loading bus tickets into an RFID tag card by buying certain amount of transactions associated with the card identifier, and paying each trip by touching a reader when entering the vehicle. Commercial applications integrating NFC technology into mobile phones can also be

found, for instance NTT Docomo’s Osaifu-Keitai payment services in Japan [5].
Furthermore, more complex systems related to the use of RFID in shopping scenarios have been proposed, such as a concept level implementation that recommends the user similar products that s/he is interested in [8], or idea that bill money was tagged [1]. These kinds of scenarios inevitably raise questions related to usability, privacy and trust. Furthermore, despite of the positive experiences reported with physical interaction phenomenon, there are still large unexplored areas with the interaction technology and in successfully applying it to large scale use. Although RFID technology has been around for years, it does not necessarily appear as a familiar to ‘a man of the street’. Moreover, the lack of commonly agreed user interface metaphors and icons on what do the tags do or what they are referring to builds barriers to the use [4].
USER STUDY
Set-Up To find out users’ acceptance, interests and fears with RFID technology in shopping domain, a user study was arranged. The study included user tests consisting of two parts: a role play and a semi-structured interview. The objective with the role play was to find out intuitions with interacting with RFID tags and NFC phone, and to get the participants to understand the concept of RFID and the possibilities it offers in shopping domain. Only after that it was possible to further interview the test participants.
The test was set up in a usability laboratory, where imaginary scenario of a shopping mall was staged, figure 1. The set-up consisted of two posters with RFID tags presenting an advertisement poster out side a shop and a shop map in the lobby area of the shop, a table with RFID tagged items presenting the shop itself, and a non-functional RFID check-out desk. Nokia 6131 NFC phone was used as the RFID tag reader.
Figure 1. Examples of the shopping mall set-up.
Participants The test participants were eight non-technical persons (4 women and 4 men), of which only one had ever heard of RFID before. Test participants were from the city of Tampere, Finland, and their age ranged from early twenties to over 60 years. Their active usage habits with mobile phones were restricted to phone calls and SMS, but majority (5/8) had also some experience with more advanced features like camera, MMS and mobile internet.
Procedure The shopping mall scenario that was role played in the user study consisted of different tasks where user was asked to interact with a mobile phone and RFID as the storyline proceeded. The tasks utilized both interacting with Nokia 6131 NFC mobile phone and tags and paper prototyping. The storyline for the shopping scenario, where the user test participant acted as the customer, was as follows (each task is numbered).
First, the customer notices an advertisement including an RFID tag in the shop window, and 1) downloads more information about the ad to her/his phone by reading the tag. Then s/he enters the shop, and 2) downloads a map of the shop from a tag in a map poster next to the shop entrance. He then walks to the product shelf, where 3) s/he reads a tag in the product package, which includes more information about the product. On his way to the check-out s/he decides to buy a soft drink and 4) reads the tag in the bottle for more information. At check-out, 5) s/he pays the items with her/his phone by interacting with the tags. Before leaving the shop, s/he is asked 6) if s/he wants to create a profile based on her/his shopping. The profile could be used e.g. for informing him about special offers that might interest her/him.
During each task, the participant was encouraged to think aloud, and complementary questions to chart the impressions and expectations with the task were asked. The questions included, for instance, how the interaction was expected to happen, what kind of information was to be received, if it should be stored and accessible for later use, and alternative ways to do the task. After completing the scenario, the participant was interviewed e.g. about the usefulness and acceptability of different features.
FINDINGS
First Impressions As none of the participants had earlier experience about RFIDs, the first impressions and intuition about interacting with tags varied. The expectations on how the interaction with RFID tags and NFC phone would happen (task 1) were divided into three groups: touching (3/8), pointing (2/8) and menu based (3/8). Touching the tag in the poster with the phone was done in various ways. Pointing the tag with the phone from a distance was done mainly for two reasons: either touching a tag was considered embarrassing, or the user associated the phone to a remote controller. Menu

based interaction was expected based on previous experiences with mobile phones in general, but not really wished by any of the test participants.
Information retrieved from a tag in an advertisement poster (task 1) was expected to include different things. The main use case was getting more information about the advertised product (6/8). Other ideas included for example information about the availability, available variations and location of the product, period of validity for the offer, being able to save the information of the poster in the phone and being able to purchase the product directly from the poster.
Navigating and Finding Information Possibility to download a shop map from a map poster to mobile phone using RFID tag (task 2) was found very appealing idea by half (4/8) of the test participants. They stated that they often felt lost especially in hyper markets and shopping malls. A map application capable of assisting in navigating to a desired place or product was wished instead of a static map. 5/8 of the test participants wondered if they could locate a desired product by touching the RFID tag in a poster or typing the product name in. Also finding information and location of different variations of the same or similar product was hoped by 3/8. When considering the amount of information on the map, the main demand was to ensure clarity.
Whereas half of the participants appreciated a map, the other half consisted of people feeling confident in navigating in strange places by themselves and enjoying just wandering around and discovering interesting things.
Comparing Products, Advertising and Customer Profiling All of the test participants had gathered information about some products for comparison. Here, 2/8 said that they could easily keep the information in their minds, but others used paper or brochures to record the information. This was done for comparing the features or prices between different products in the same shop or same products in different shops later on. The most important piece of information was the price. These people were interested in the possibility to easily capture the product information by interacting with a RFID tag.
Initial reactions towards mobile advertisement and user profiling (task 6) were many times very negative. Privacy issues related personal data were raised by 6/8 of the users. Any kind of attempt to control one’s shopping habits was resisted. Advertisement at least in form of (mobile phone) messages was considered disturbing. Despite negative first reactions, 6/8 of the participants had moderate interest towards mobile advertisement if they could decide what kind of advertisement to receive and when not to receive anything. According to them, deciding upon advertisement content would be done by creating a self made profile. Attitudes towards automatic user profiling remained highly negative with 3/8 users. More or less neutral attitudes
towards profiling among the rest 5/8 were based on assumptions on anonymity and experiences with current loyalty card systems.
One of the ideas presented to the test participants during the interview was to create a profile of preferred and avoided attributes to assist in shopping suitable products. Here, the user’s personal profile would be matched against the product attributes resulting on recommendations and warnings. This idea interested 6/8 of the test participants and they were willing to use some time for getting the added value provided by the service. Though, 3/8 stated that they were very lazy at typing information into a mobile phone, so an easy method for adding information would be needed. PC, RFID tags containing only attribute information and choosing from product attributes were methods suggested by the test participants. Interesting product attributes included for example allergens (3/8), country of origin (2/8) and energy content (3/8).
Paying Using a mobile device as the means for payment interested half (4/8) of the test participants. Particularly paying for smaller, cheaper items on-the-go was found interesting. The other half resisted the idea. They had fears of reliability and privacy. 2/8 of the participants resisted and feared information systems to such degree that they only used cash for payments at the moment.
General Impressions after the User Test The suspicion in the beginning of the test session was replaced by interest towards the possibilities of RFID during it. Every test participant found some agreeable use for RFID in shopping environment. Getting more information about the products fast and without having to trouble anyone interested 7/8 of the participants. Possibility to summon appropriate sales person on the spot via a tag interested those preferring human service. Prospect shopping in a more cost and time efficient way was appealing, but there was high resistance towards any shop or even system getting hands on personal information like shopping habits thus allowing personalized advertisement.
DISCUSSION The study revealed several interesting trends, where there are conflicts of interests, suspicions, mistrust, and thus potential usability and acceptability risks with the technology. The study recorded fears related to privacy e.g. in giving out personal information in consumer profiling, and receiving spam messages. Similar findings in the context of mobile services have been reported before [2]. There is also an interesting contradiction in consumers’ wish. On the other hand, users desire personalized services, here e.g. information about allergens, but on the other hand they don’t want (and bother) to give out much information about themselves. This is yet another challenge for the service designers.

Moreover, there is a possible conflict between what the users want vs. what the shopkeeper wants. Comparing prices to find the cheapest one may not be in the interests of the retailer. However, among our participants, it was the preferred use case for current practices in taking notes of a product. Moreover, wandering behavior is an interesting phenomenon, which currently is not supported in many technology orientated use scenarios – many times people come to a shop to look around and wander, not necessarily to find a particular product. On the other hand, wandering behavior may be desirable also from the retailer’s point of view, as it may result impulse purchases. In order to feel useful, a successful technical application should try to adapt to the current shopping practices of the user.
Trust is one of the most important acceptance criteria of the RFID technologies in the shopping business. Today’smobile phones with integrated RFID readers give the customer direct control over capturing information about the items of interest. This can be supported by using a customer defined personal profile for information filtering, timing and flow optimization.
Methodologically, applying role-playing technique to the user study was found to be a good choice. The dilemma with charting user expectations and attitudes with a new technology is that ordinary users, who typically have little expertise in technology, should be involved. However, they may have difficulties to comprehend the possibilities with the technology, and thus surveys or interviews without any connection to users’ everyday experiences give less reliable results. With role-playing technique, we could engage non-technical participants and give them an idea of thetechnology in real life use, provoking them to brainstorm about the possibilities with the technology and reveal their attitudes and opinions about its possibilities. Positive experiences of using acting in participatory design and scenario development have also been reported earlier [3, 6].
CONCLUSIONS In this paper we have presented a user study shopping scenario employing mobile phones and RFID technology. The user study included 8 participants having no earlier experience with RFID technology, and applied role-playing technique and interviews.
Touch based interaction with RFID tags together with information systems brings positive prospects to shopping by allowing users to get different kinds of information faster and paying for goods. Information about the products would be used for making decisions about buying and doing shopping in a more cost and time efficient way. Touch based interaction may however be considered embarrassing, thus building a barrier to use in a public place like a shop. Adapting RFID technology to users’ current shopping practices is a challenge - it is easy to imagine solutions for a user seeking a product but less easy
to support wandering type shopping behavior. Fears of the privacy of the data that is considered personal and the reliability of the information systems create even more barriers. The contradiction in users’ wish to get personalized ads while maintaining high control over personal information and without having to spend much time on providing it is yet another interesting challenge for application designers.
ACKNOWLEDGMENTS The authors wish to thank their colleagues who contributed to the study.
REFERENCES 1. Angell, I., Kietzmann, J. RFID and the End of Cash?
Communications of the ACM, Dec. 2006 / Vol 49. No. 12. 91-96.
2. Häkkilä, J., Mäntyjärvi, J. Combining Location-Aware Mobile Phone Applications and Multimedia Messaging. Journal of Mobile Multimedia, 1, (1), 18-32 (2005).
3. Iacucci, G., Kuutti, K. Everyday Life as a Stage in Creating and Performing Scenarios for Wireless Devices. Personal and Ubiquitous Computing (2002) 6: 299-306. Springer-Verlag London Ltd, 2002.
4. Mäkelä, K., Belt, S., Greenblatt, D., Häkkilä, J. Mobile Interaction with Visual and RFID Tags – A Field Study on User Perceptions. Proc. CHI 2007, ACM Press (2007), 991-994.
5. Osaifu-Keitai. Available at http://www.nttdocomo.co.jp/english/service/osaifu/index.html . Last accessed 17 March 2008.
6. Oulasvirta, A., Kurvinen, E., Kankainen, T. Understanding Context by Being There: Case Studies in Bodystorming. Personal and Ubiquitous Computing (2003) 7: 125-134. Springer-Verlag London Ltd, 2003.
7. Rukzio, E., Leichtenstern, K., Callaghan, V., Holleis, P. Schmidt, A., Chin J. An Experimental Comparison of Physical Mobile Interaction Techniques: Touching, Pointing and Scanning. Proc Ubicomp 2006, 87-104.
8. Ruta, M., Di Noia, T., Di Sciascio, E., Piscitelli, G., Scioscia, F. RFID Meets Bluetooth in a Semantic Based U-commerce Environment. Proc. ICEC’07, 107-116
9. Salminen, T., Hosio, S., Riekki, J. Enhancing Bluetooth Connectivity with RFID. Proc. PerCom 2005, 36-41.
10.Toye, E., Sharp, R., Madhavepeddy, A., Scott, D., Upton, E., Blackwell, A. Interacting with Mobile Services: An Evaluation of Camera-Phones and Visual Tags. Personal and Ubiquitous Computing (2007) 11: 97-106. Springer-Verlag London Ltd, 2006.
11.Välkkynen, P., Tuomisto, T. Physical Browsing Research. In Pervasive 2005 Workshop on Pervasive Mobile Interaction Devices (PERMID 2005).

What's our favourite colour?Using Bluetooth-enabled mobile devices for group
decision making Alison Ruth
Griffith University Kessels Road
Nathan, Qld 4111 +617 37355549
Jenine Beekhuyzen Griffith University
Kessels Road Nathan, Qld, 4111 +617 33735021
ABSTRACTIn this paper, we present an audience response system (ARS) using ubiquitous devices, specifically Bluetooth-enabled phones. It is proposed that the system can act as a replacement for costly proprietary products such as TurningPoint clickers and Keepads. Such a system is attractive as it reduces the cost to both the audience and the presenter. Through experiments in real-world environments, we found that the system may have limitations, however the minimal configuration system presented here performed well in a small group setting.
Categories and Subject DescriptorsH5.2. [Information Systems]: User Interfaces – Interactionstyles.
General TermsPerformance, Design, Experimentation, Human Factors, Standardization
KeywordsAudience Response Systems, Electronic Response Systems, Ubiquitous Computing, Mobile Devices, Bluetooth.
1. INTRODUCTIONStudent engagement is almost a requirement of teaching and learning. Getting students engaged in a face-to-face learning environment, particularly in large lectures with potentially hundreds of students, has difficulties and often results reduced student attention, and worse, lack of attendance. Attempts have been made to enable more interaction via specialised devices (i.e. TurningPoint Clickers [1]) which require purchase of the devices by either students or institutions. A useful example set in an educational environment is Tsvetinov, Abercrombie & Do’s 1995 study of the use of KEEpads with first year students to get them talking together without the “bounded rationality” which typically occurs with group thinking [2]. The implementation of these types of systems is starting to occur, however the cost to some institutions may be prohibitive. There is the possibility that this cost will be transferred onto students. In this paper we argue that the purchase and use of these devices is becoming redundant, considering most students have either a Bluetooth enabled phone or computer. We also argue that proprietary systems have some known limitations, e.g.
TurningPoint can only communicate through infrared line of sight technologies. This limitations specifically makes them unsuitable for at least one of the scenarios presented here. Thus we present a design concept for an audience response system (ARS). We present the minimal technical requirements, three proofs of concept, implications for design as well as suggesting future work through illustrative scenarios. The design presented attempts to utilise ubiquitous devices and enable convergence of applications within a single device.This paper investigates the following design questions:
� How can ubiquitous devices be used to collect information in a real time educational setting?
� How can the gathered information be used to make decisions in real time?
In line with the aims of this proof of concept, Freeman et al [3] suggested that a Bluetooth-based audience response system would better integrate with student lifestyle decisions, and this is based on the work of Prensky [4] who suggested a system which would allow students to SMS responses to set questions. These systems and the one presented in this paper attempt to harness the integrative capacity of using every day ubiquitous objects (mobile phones) in novel ways. Pering’s [5] Musicology project explores using mobile (cell) phones as conduits for social music use. He presents three different interface modalities: public (others can see who they are), anonymous (unidentified interactions), and registered, where a personal digital profile is used. These three interface modalities may be linked to the concepts presented in section 2.1. Finally, in some ways similar to our research, Valkkynen and Tuomisto [6] present a proof of concept of a mobile-device based interaction method for pervasive computing. In defining these user interaction methods for physical browsing, they present scenarios for their use. They agree that scenarios are a useful way to present a proof of concept. Building on these examples and in looking at the wider applications for this technology, the system potentially moves beyond classroom/lecture hall scenarios to enable decision support systems for meetings, particularly Annual General Meetings (AGMs) where large groups of people are involved in voting.

2. INITIAL CONCEPTUALISATION 2.1 ConceptThe concept is for an ‘Audience Response System’ (ARS) to enable participants in a lecture to respond to questions via a Bluetooth enabled phone. The envisaged system would allow for responses to be tallied and the information available immediately for discussion. The system would require some configuration, however, there is potential for a minimal amount of pre-configuration. The obvious reason for this being setup time needed in a 50-minute lecture environment, and managing the configuration concurrently across a large group of students. There exists the potential for three levels of configuration. In the (mobile) sending device: 1. Minimal – Bluetooth capability in ‘discoverable’ (Macintosh
term) or ‘shown to all’ visibility (Nokia term). Devices with different configurations may also be used although further steps may be required.
2. Context aware – a Bluetooth-enabled device to send data, specifically pre-downloaded vCard with programmable responses (yes/no, multiple choice options, very short answer (one-two words) responses) using object push (OBEX).
3. Feedback system – a system where simple responses can be sent to a specific device provided the device name is known (for large group scenarios). May require vCard type interface where name of receiving device and response is input.
For the minimal configuration scenario, which is presented here, an Apple Macintosh MacBook portable computer with Bluetooth capabilities was used as the ‘receiving’ device. The built in “Browse Device” command was used to scan for operating Bluetooth devices. For the more developed systems, the receiving end could consist of:
� Computer with software which can scan for Bluetooth devices� Process for dumping responses to a text file � Script for parsing responses and importing text file into
spreadsheet or similar and using simple graphing processes (scriptable or based on simple functions – e.g. COUNTIF, then function REPT to give simple graphs see example in Figure 2).
2.2 Minimum Configuration The configuration of the developed system would require:
� Bluetooth scanning � Script to count number of connections (population) � Script to import data to spreadsheet In a minimal (nil) configuration, the receiving system would scan for active Bluetooth signals. Respondents would turn Bluetooth on and off to send a response. This configuration would require no installation on the remote (mobile) device and would utilise basic sending capabilities on their device. The receiving station would observe active Bluetooth signals and provide a count of signals during a set period of time. Respondents would activate their Bluetooth functionality in response to a set of answer choices provided by the presenter/lecturer/assistant. A more advanced system, perhaps using vCard systems, would provide for multiple responses. The vCard would contain the response, perhaps input by the respondent at the time of the interaction. This response would be read by the receiving station
and then processed. This would enable a list to be imported into the spreadsheet. A fully developed system may be able to take multiple choices then return raw numbers of responses or simple graphical representations of responses.
2.3 ScenariosA number of potential scenarios are presented to assist in the potential configurations of the system. These scenarios are based on basic uses of the system. As development progresses, more advanced uses may become obvious.
2.3.1 LecturesStudents can respond during lectures in order to provide real time feedback to instructors. This feedback may be used to inform the lecturer or their assistant on levels of understanding of content they are teaching. In a similar manner to TurningPoint, students could respond to multiple-choice questions, yes/no questions and potentially a single word response (this would be in the more advanced system and perhaps generate a cloud of responses, in a similar manner to tag clouds, common in web 2.0 technologies). This system potentially allows for discussion of key perceptions of participants (students) as they are being challenged with new information.One major benefit of this system is to encourage student’s learning by being active participants in class. Having a pseudo-anonymous input might allow those to respond who might otherwise not raise their hand in class to answer questions.
2.3.2 Meetings With questions and issues raised during meetings, members in attendance could be asked to respond. This could help to anonymously determine the level of consensus of controversial issues, as well as being used in voting situations. Participants would be able to provide yes/no responses, which could be analysed precisely and relatively quickly. During the meeting the results could be disseminated to all participants.
2.4 DesignBased on the scenarios presented, we suggest 3 levels of design:1. One-way response system. This system allows answering of
simple questions with no configuration by participants. In a classroom/lecture, the presenter could ask a question, request participants to respond if agreeing (or disagreeing), then tally the responses.
� Example: Please turn on your Bluetooth if you like the colour blue. A second request could be: Please turn on your Bluetooth if you do not like yellow. The system would tally responses and present them as either raw figures or with some scripting a graph or percent. This provides real data for participants to engage with in discussion.
2. Programmed response system. This system could use a vCard with a small number of responses able to be sent. Participants would be able to respond to multiple options by additional input to the vCard and maintain their active Bluetooth for the response. The system would tally totals for each response

3. Two-way response and feedback system (in real time) A more advanced system could feed tallied responses back to devices. In this case, the system as described in point 2 could be programmed to respond with a simple vCard back with totals for each response.
This proposal deals primarily with the basic level for participant interaction and graphical display of input.
3. Proof of Concept Trials were conducted based on availability of groups of different sizes. Thus the initial trial was conducted with a small group who meet regularly for research discussions. The second trial was conducted with a large group of first year students (approximately 100). The third trial was conducted with a smaller group of postgraduate students (approximately 20). Precise numbers of participants in these groups is not known due to a limited window for testing (at the end of a lecture) and the presence of some individuals without phones who were interested in witnessing the test.
3.1 Trial 1 The first trial was conducted using an academic audience of primarily information technology and information systems lecturers in a controlled meeting environment. Eight individuals with Bluetooth capable phones participated. These participants were able to test out various ideas and situations and provide insight into ways in which students or other participants may react in a given situation. In our initial trial with these participants, we were able to gather some responses to different questions. We used a MacBook with Bluetooth capability as the base station. Figure 1 shows the Bluetooth scanning in response to a question.
Figure 1. Scanning for participating Bluetooth phones. The list of devices is hidden to protect participants’ details.
The responses were read from the browse files screen (Figure 1) and entered by hand into a spreadsheet to provide a quick graph using the REPT function. Figure 2 shows the charted responses to the questions in table 1, which were used in our proof of concept.
3.2 Trial 2 The second test was conducted at the end of a lecture with a group of first year students. While there is 300 students enrolled in the course, not all stayed for the test nor were all those present in possession of a phone. Thus the precise number of participants is unknown.This test provided valuable information about the limitations of the proposed system using generally available equipment. One significant limitation is the scanning system used by the Macintosh MacBook as the base station. This system not only scans for devices, but also collects ID information. The length of
time the numbers are available to the operator of the system was insufficient to establish the number of devices transmitting.
Figure 2. Spreadsheet showing recorded and graphed responses using REPT function
Questionnumber
Question Row number of response in
Figure 2
1 Please turn your Bluetooth on. 2
2 Please turn your Bluetooth on if you are male.
4
3 Please turn your Bluetooth on if you are female.
5
4 Please turn your Bluetooth on if you like blue.
7
5 Please turn your Bluetooth on if you like red.
8
6 Please turn your Bluetooth on if you like yellow.
9
Table 1: Questions asked of participants A second limitation of this trial was the large venue. This venue is the largest lecture theatre on campus and is set out in a layered style from the front to the back of the room, much like an auditorium where participants are sitting level to higher than the presenter. As a lecture theatre designed to hold more than 400 people, the distance may be a limiting factor in the final design of the system. During the trial, the receiving station (MacBook) was moved to the centre of the room, where 35 devices were recorded. The system then went into collecting IDs so perhaps there is a limitation in the design of the Bluetooth scanning system. From this trial, we learnt that the final system may need to be limited to scanning rather than collecting ID signals. However as a trial, the system performed some of the functions.
3.3 Trial 3 The third trial was a smaller venue (maximum capacity 180). This trial was smaller (14 students with devices) and the students were

advanced masters students. At least one student already had a degree in IT and was interested and helpful in conducting the trial. For this trial, students gathered around the podium and answered the same questions as Trial 1. Students then walked away from the podium to test range. It was found that most signals dropped out before students reached the back of the room. From this trial we learnt that while the system has potential, a more powerful receiving station and more powerful broadcasting appliances may be needed for a workable system for large groups.
4. DISCUSSIONBased on the testing of our proof of concept, the system appears to be able to work manually with some caveats. While the trials asked only for positive responses, questions could potentially cover negative responses and neutral responses. This was an issue raised by one participant in the initial trial. Issues that were raised by participants during the first trial included both technological and social issues:
� Auto-discovery is not a function one all phones – on participant’s phone has to be selected as ‘find me’ (Motorola) in order to be found.
� Participants may be engaged in another activity on their phone, which automatically turns on Bluetooth (i.e. sending files from their phone to their computer via Bluetooth) – this occurred with one participant.
� Access to a mobile phone device and its required features – one participant’s phone battery went flat, although for this trial we had access to more phones.
� Framing of questions - How to tell between the no’s and those who don’t want to answer. How to get people to participate. If they don’t care and don’t respond then is it assumed that they are saying no?
These issues need further investigation. Another significant issue, which became evident during the trials, was the slow response times of the Bluetooth scan as it attempted to extract the names of the devices. This was particularly evident during the larger scale trial (Trial 2) which could be counted as a failure. In a fully designed system, the scanning ability of the Bluetooth may need to be restricted to providing a simple count of devices, rather than any sort of identifier. This is theoretically possible but not with the unmodified applications at our disposal. A simple count could then be sent to the current (active) cell in the spreadsheet thereby allowing instant feedback to be presented to participants/presenters. In the regular course of a teaching session, this then becomes the discussion point for the class.
5. IMPLICATIONS FOR DESIGN The design of a system such as proposed here depends on environmental factors such as room size, location (incl. interference from outside sources), number of participants, reliability and strength of the receiving station as well as the sending devices. The application developed to run such a system would require some design in order to facilitate even a minimalist approach. Once this is achieved, a more integrated interface could be designed.
6. CONCLUSIONEngaging students in large classroom environments can be a challenge. Generally the attempts to do this encourage students to be more active in contributing to discussions and in providing feedback in real time. In this paper, we present a conceptual design, which attempts to utilise ubiquitous devices and enable convergence of applications within a single device. The design could be implemented in either a small classroom or a large lecture theatre environment with appropriate equipment. We present another situation, that of an Annual General Meeting, in which the design could be applied. We also present a working proof of concept effective in getting responses from participants however the test highlighted that some issues need to be investigated further. Design of the system appears to be within the scope and capabilities of Bluetooth, although further tests to determine the maximum number of concurrent connections possible need to be performed. Discussions with software engineers and technologists have been fruitful in confirming some assumptions about how Bluetooth could work to achieve this.
7. ACKNOWLEDGMENTSThanks to the ‘Shoe Group’ and students at Griffith Business School for participating in the trial and Nokia for donating the phones.
8. REFERENCES[1] Turning Technologies, 2008, TurningPoint 2008, Web: http://www.turningtechnologies.com/highereducation.htm,Accessed: 18/1/08. [2] P. Tsvetinov, D. Abercrombie, H. Do, 2005, Individual versus group reasoning: A comparison study using a keypad support system. Web: http://www.ascilite.org.au/conferences/brisbane05/blogs/proceedings/P9_Tsvetinov.pdf, Accessed: 17/3/08.[3] M. Freeman, A. Bell, C. Comerton-Forde, J. Pickering, P. Blayney, 2007, Factors affecting educational innovation with in class electronic response systems, Australasian Journal of Educational Technology 23, 149, Web: http://www.ascilite.org.au/ajet/ajet23/freeman.html. , Accessed: 17/3/08.[4] M. Prensky, 2005, What can you learn from a mobile phone? Almost anything, Journal of Online Education 1, Web: http://www.innovateonline.info/index.php?view=article&id=83,Accessed: 21/1/08. [5] T. Pering, 2006, Evaluating the privacy of using mobile devices to interact in public places,Workshop Pervasive Mobile Interaction Devices (PERMID2006), Dublin, Ireland. Web: http://www.medien.ifi.lmu.de/permid2006/pdf/Pering_Permid2006.pdf, Accessed: 21/1/08.[6] P. Valkkynen, T. Tuomisto, 2005, Physical browsing research,Workshop Pervasive Mobile Interaction Devices (PERMID2005) Munich, Germany. Web: http://www.medien.ifi.lmu.de/permid2005/pdf/PasiVaelkkynen_Permid2005.pdf, Accessed: 22/1/08.

Homebird—Task-based User Experience for Home Networks and Smart Spaces Olli Rantapuska
Nokia Research Center P.O. Box 407
FI-00045 Nokia Group
Mia Lähteenmäki Nokia Research Center
P.O. Box 407 FI-00045 Nokia Group
ABSTRACTContemporary wireless networks in people’s homes are already enabling consumer electronics devices to communicate with each other. Standards like Universal Plug and Play are being developed for interoperability between devices from different manufacturers. For example, a digital media player device is able to display video clips from a home PC or play music from portable devices. Development of the user experience is also needed to have devices perform tasks in concert. Homebird is a demonstration of a task-based user experience on a mobile phone. It discovers features of other devices automatically and suggests to the user that certain tasks can be performed together with those devices. This approach cuts down the number of steps needed to perform common tasks, and also makes it easier for users to find out what can be done in a particular environment. The implementation architecture makes it easy to add new tasks, and they can also have the phone perform actions in the background without user interaction. The task-based approach was evaluated with a small user study, and participants found it easy to understand and useful, if they were offered tasks that suit their daily life.
Categories and Subject DescriptorsH.5.2 [Information Interfaces and Presentation]: User Interfaces – interaction styles, prototyping. C.5.3 [Computer System Implementation]: Microcomputers – portable devices.J.7 [Computers in Other Systems]: consumer products.
General TermsDesign, Experimentation, Human Factors
KeywordsTask, remote control, mobile phone, UPnP, WLAN.
1. INTRODUCTIONWireless local area networks are becoming prevalent in people’s homes. A home network makes it possible to share content between computing and consumer electronics devices. The network acts as a communications backbone, removing the need to connect devices together individually. Content, such as photos, movies or even cooking recipes, can be moved around and processed by devices that support the type of content and the necessary protocols for handling it. There are also generic protocols like Universal Plug and Play for handling abstract pieces of content.
Consumer electronics devices are rapidly becoming networked. Stereo systems can download music from the Internet and play it on speakers in the next room, printers can include a scanner and they all work on a wireless network. The selection of networked home devices is expected to further broaden in the coming years.
With a multitude of devices and an expectation of interoperability comes a difficult challenge. Somehow, people at home would need to get information about what they can do with their selection of devices, and how those tasks can be controlled. Not only would several remote controls be needed to communicate with the devices, but they would also need to refer to other devices to complete tasks. People have mobile phones nowadays, and they would like to use their phone as a remote control—out of 10 most popular mobile application wishes, three were universal remote controls [7]. The call is open for an intuitive remote control interface for home networks and smart spaces.
2. PROBLEM AREA OF REMOTE CONTROLIt’s straightforward to design a remote control for a single device and its features, but controlling a set of devices in concert is more challenging. There are already various universal remote control devices on the market. For example, the Logitech Harmony line [4] offers good flexibility in controlling many devices at the same time. However, universal remotes for the most part still need to be pre-configured with a certain set of actions that can be performed. In an interoperable networked home, new actions can become available dynamically. It should be up to the remote control to discover these actions, not the user. With bidirectional communication enabled through WLAN, remote control devices will be better equipped to make intelligent decisions on the user’s behalf. Of course, interoperability depends on individual device manufacturers implementing the necessary control interfaces, which are generally not a key selling point for devices.
The home network consists of physical devices, but that does not necessarily need to be the user experience paradigm. A remote control can combine the features of the devices together and provide distilled, more meaningful information to the end user. One approach is a task-based system, where a single task that the user engages in can span multiple devices. For example, a task to view a DVD movie would involve at least a TV and a DVD player device. These tasks would be personalized for each user, and would be generic enough to avoid being bound to individual devices. The user would not need to think about devices; he would only need to interact with higher-level tasks.

The task-based paradigm has been the subject of some existing work. In [2] the authors found that it is possible to predict the next probable task based on history of the users’ activity, and that in fact it is easier to predict the next task than the next device being used. In their work, a task is defined as a set of related commands to devices, and the aim is to group those commands in a meaningful way so that they can be easily used together as one task. Assuming individual devices provide broad enough bidirectional APIs, it is possible to use commonsense reasoning to suggest tasks, or goals, automatically as described in [3]. Their Roadie concept allows people to execute remote control actions starting from the goal that they want to accomplish. A small user evaluation indicated that working with Roadie required less clicks and took less time than controlling the devices without it.
People could also be allowed to customize tasks that the system can perform—a simple user interface would let the end user connect the dots to form new tasks. In [6], the Huddle system lets end users connect devices together in a user interface centered on content flows. For advanced users, a high level programming environment could be offered for developing tasks—in the TERESA tool [5], developers are able to concentrate on the conceptual task model and a user interface can be automatically generated for different platforms and devices. The same task can have a different presentation depending on the platform.
Eventually, tasks could be defined both by machine learning and by users themselves. As the authors found in [8], neither approach is optimal by itself. People forget to include every detail defining the tasks manually, and machine learning takes a long time to converge to an accurate model. By using these approaches to augment each other, however, better results could be achieved.
In previous work, there has been little focus on studying how end users actually perceive the task-based approach to remote control, and what kind of tasks would be appropriate for their home environment. This paper extends the work on task-based interaction with a study on end users and a demonstration implementation using a bidirectional control protocol such as Universal Plug and Play (UPnP) over WLAN.
3. HOMEBIRD: TASK-BASED REMOTE CONTROL ON A MOBILE PHONE We set out to experiment with the task-based paradigm, and proceeded to develop Homebird, a prototype implementation of a user experience based on tasks. Homebird runs on a customized Nokia N95 smart phone, and can be used in home WLAN networks. It is implemented using Symbian C++.
The task-based implementation takes a step back from a list of devices and instead presents currently available tasks to the user. We define tasks as high-level goals the user wants to accomplish, in most cases making use of several devices simultaneously. The presentation of tasks allows them to change in response to arbitrary events—for example, a newly discovered network device can trigger changes to the set of available tasks. The user can activate each task by selecting it, soliciting the phone to perform that particular task. An example task is Show latest photos. Each task has logic behind it that describes what the task does—the Show latest photos task displays photos on a nearby TV screen. It is designed to (1) search the network for photos, and (2) search the network for TV screens capable of showing the
photos. The phone performs these actions in the background without user interaction. If the items in both (1) and (2) are found, only then does Show latest photos appear in the presentation of tasks, offering the user the possibility to activate it. When the user selects that task, the phone retrieves the photos it previously found and sends them to the TV it found. A particular TV screen can be selected in case many were discovered. Additionally, the phone displays a new user interface for switching to the next and previous photo, essentially letting the user refine the task by providing more information.
In Homebird, the logic of tasks is encapsulated in modules called plug-ins. The plug-ins are dynamically loaded libraries that adhere to a defined plug-in API. The Homebird framework loads these plug-ins when the phone is switched on, and lets them perform actions in the background. Homebird notifies plug-ins if the phone is in coverage of a known WLAN. This way, it is possible to save memory and improve battery life by shutting down plug-ins when the context is not relevant for them—the plug-ins are meant to run inside the coverage of the home WLAN.
The Homebird architecture is shown in Figure 1. The framework starts and manages plug-ins that can be written separately. Each plug-in can have background processes that it uses to perform inquiries without user interaction. Each plug-in can produce one or more tasks that appear on the Homebird user interface. When a task is selected in the UI, control is handed back to the respective plug-in that can then show its own UI customized for that task.
Figure 1: Homebird high-level architecture inside the phone
The demonstration includes three plug-ins: Show latest photos,Show Flickr photos, and Adjust lights. Each plug-in waits for a WLAN network to be found, and then performs some background checking on that network, deciding whether to display a task for the user. All the plug-ins use the UPnP protocol for communicating with other networked devices: media servers, TVs, and networked light controllers. These are standard UPnP device APIs with no changes needed to enable task-based control, so the same task can work with devices from different manufacturers. The demo setup is shown in Figure 2.
The plug-in for adjusting lights shows how the tasks can hide the device paradigm from the user. The Adjust lights task controls all the light devices in the network at the same time. The user only sees one slider control that adjusts all the lights.
The Flickr plug-in uses the Atom protocol to download photos from the Flickr photo-sharing service [1]. It allows users to

browse through new photos from their subscribed Flickr users, and select a photo to view it on a nearby TV.
Figure 2: Demo setup for showing photos on a TV device, simulated by a laptop
Once the task has appeared, the user can select it to e.g. start showing photos on the TV. The tasks can be presented in different views, two of which are depicted in Figure 3. In the figure, a list of tasks is either visible all the time on the phone standby screen, or only visible when a particular application is started.
4. USER STUDY AND DISCUSSION We wanted to study how people perceive the use of the phone standby screen for presenting information about their home and the available tasks. Specifically, tasks that become available in the current context would appear on the standby screen to get people’s attention. We also wanted to understand their experiences on the corresponding tasks in their current life and their priorities there in order to be able to provide feedback for further development. To that end, we conducted a small user study. Seven participants were recruited in Finland—people who had previous experience with smart phones and who lived in houses, i.e. had their own property to maintain. Each participant was invited to a one-and-half hour session that consisted of a semi-structured interview and a few assignments. The participants were interviewed about their current practices in selected situations, and were afterwards introduced the idea of having the task-based user interface on the mobile device available for the related tasks. For each task, three alternative task-based UI presentations in the form of paper prototypes were presented and discussed. Finally, participants were asked to prioritize some potential tasks for automation based on their personal importance and frequency of use. We specifically focused on three use cases, selected based on our understanding of the main advantages of the task-based paradigm: (1) leaving home for an extended period of time, (2) finding out what the mobile phone as a remote control can do, (3) scheduling a TV recording remotely on your mobile device. These use cases for home control are meant to be more futuristic than the actual Homebird demonstration, which relies on existing standards and interfaces.
In the user study, we found that participants understood the task-based paradigm easily, and were able to discuss using it in their daily routines. People preferred the UI option where tasks appeared on the standby screen on the phone (Figure 3a), but it became clear that they also wanted to be able to customize which tasks appear there. The relative importance of particular tasks
varied from person to person, and some people did not like cluttering their standby screen with these items. Many felt it important to also make sure that if the phone is stolen, the perpetrator is not able to use the phone to remotely hack into the phone owner’s smart home.
(a) (b)
Figure 3: Two example views to the available tasks
For use case (1), we offered a task to check with one click that everything is secure when you leave home. People said they generally go round the house to check that electrical devices are switched off before they leave. They especially wished that the phone would automatically confirm that everything is secure as they close the front door and walk to the car. The task was also seen useful for peace-of-mind, because it could also be activated remotely.
With use case (2), people indicated that they often just browse the device menus to learn what features it has. We envisioned that with smart homes, a tutorial application would be used to learn about features that are available using several devices at once. In practice the people had rarely used the tutorials of any applications on either mobile phones or other computers. The more popular approach seemed to be to solve the problems as they come up. Any introductory tutorial would have to be readily available to remind the user to take a look at the tutorial.
For use case (3), scheduling TV recordings remotely, we asked how participants would like to initiate a remote connection to the home in order to perform the task. We found that people we interviewed prefer not to explicitly start a network connection to the home. Instead, they would like most to just tell the phone to schedule a recording and it should automatically happen at home. This calls for a user experience where the phone offers the user a selection of tasks that could be done, and the user merely needs to activate one of the tasks to do it. This approach comprises a technical challenge: since the tasks have to be cached in order for them to be available also outside the home network, it is not guaranteed that they are really available at the time. For example, the relevant devices may be switched off at home, and that predicament is only discovered after the network connection to the home is started. The user interface should take this into account, perhaps by indicating remote tasks as being only prospectively available.
We also asked the participants to categorize a set of example tasks according to importance in their environment. From that categorization, some tasks like Secure empty home, Check if home is OK, View calendar and View shopping list stood out as most

important, whereas e.g. Show latest video clips [on TV] or Viewphone screen on TV did not strike people as being very important. The participants also saw that they could select the relevant tasks for themselves from a comprehensive list, and try out which tasks work for them. Other than that, additional customization of the tasks was seen as too much work.
The user study participants gave us feedback on the overall concept. They indicated that the task-based solution would be suitable for them, assuming they would have tasks that work in their home and are able to provide useful service. In general, the advantage of a task-based approach is the minimal user interaction needed to perform complex tasks. With one or two clicks the user can achieve what earlier took almost ten clicks. Instead of having to select a TV device, a media server device, particular photos on a media server device and then starting the process of showing them on the TV, the user only needs one click to show photos. Once the photo viewing has started, the user can fine tune the experience by selecting what photos to show next. The user gets instant gratification because the feature “just works”, but still more complex tasks remain possible by continuing the task through its own UI.
Homebird is an example of a remote control for future homes, where devices are networked and bi-directional communication is available. Instead of having to manually configure infrared settings for a universal remote control, the remote control itself can detect what is available and suggest available tasks automatically. The home smart space is brought to the user instead of the user having to create it through configuration.
In addition to making it easier for end users, Homebird also aims to make it easier for software developers to add functionality to be performed in the home network. By creating a Homebird plug-in, the developer does not have to care about WLAN detection or running his application in the background, because the framework provides both of these features. Moreover, plug-ins are able to use the Homebird user interface to present tasks to the user. The tasks are useful for notifying the user of new items—they can be displayed on the phone standby screen, which gives the plug-in valuable screen real estate without being overly intrusive.
The weakness of a task-based approach is the difficulty of creating the logic that formulates tasks based on features of several discovered devices. In Homebird, the logic is encapsulated inside plug-ins. For simple use cases like media playback, it is possible to develop a generic plug-in that works with all standards compliant media devices. These use cases can also readily be formulated as tasks. In the future, work is needed to refine that capability with more ways to personalize the list of tasks. Automated or manual methods of defining tasks, as seen in existing work, may be integrated to the system and subsequently trialed with end users.
5. CONCLUSIONThe Homebird demonstration provides an example of a task-based user experience for home networks, running on a mobile phone. It
uses WLAN and UPnP to communicate with other devices in the network, and suggests things to do with those devices in the form of high-level tasks. The user can perform these tasks with one click of a button—their phone has done all the preliminary work already in the background. The task-based approach is easy to understand. A small user study indicates that people would like to personalize how the tasks are presented—this is an area of further work. In the end, interoperability between consumer electronics devices depends on device manufacturers. We hope to make Homebird publicly available and so contribute to a better user experience of smart homes.
6. REFERENCES[1] Flickr photo sharing service, http://www.flickr.com/[2] Isbell, C. L., Omojokun, O. and Pierce, J. S. 2004. From
devices to tasks: automatic task prediction for personalized appliance control. In Personal and Ubiquitous Computing, Volume 8, Issue 3-4 (July 2004). Springer-Verlag, London, UK, 146-153. DOI= http://dx.doi.org/10.1007/s00779-004-0273-z
[3] Lieberman, H. and Espinosa, J. 2006. A goal-oriented interface to consumer electronics using planning and commonsense reasoning. In Proceedings of the 11th International Conference on Intelligent User Interfaces (Sydney, Australia, January 29 – February 1, 2006). IUI’06. ACM Press, New York, NY, 226-233. DOI= http://doi.acm.org/10.1145/1111449.1111497
[4] Logitech. Universal Remotes. http://www.logitech.com/index.cfm/remotes/universal_remotes/&cl=roeu,en
[5] Mori, G., Paternò, F. and Santoro, C. 2004. Design and Development of Multidevice User Interfaces through Multiple Logical Descriptions. In IEEE Transactions on Software Engineering, Volume 30, Issue 8 (August 2004). IEEE Computer Society, 507-520. DOI= http://dx.doi.org/10.1109/TSE.2004.40
[6] Nichols, J., Rothrock, B., Chau, D. H. and Myers, B. A. 2006. Huddle: Automatically Generating Interfaces for Systems of Multiple Connected Appliances. In Proceedings of the 19th annual ACM symposium on User interface software and technology (Montreux, Switzerland, October 15 – 18, 2006). UIST’06. ACM Press, New York, NY, 279-288. DOI=http://doi.acm.org/10.1145/1166253.1166298
[7] Nokia, S60 Application Wishlist, http://www.s60.com/applicationwishlist[referred Mar 18, 2008]
[8] Omojokun, O., Pierce, J. S., Isbell, C. L. and Dewan, P. 2006. Comparing end-user and intelligent remote control interface generation. In Personal and Ubiquitous Computing, Volume 10, Issue 2-3 (January 2006). Springer-Verlag, London, UK, 136-143. DOI=http://dx.doi.org/10.1007/s00779-005-0019-6

������������ ��������� �� ��� � ����������������������������������������������������������
���� ��!"#����$����#����� �������#���� ��������
%#����&'()���������*������(�������#����+,#�#���(������
� ����������� �� �������������������� �� � ��� ������ ��� ��� ������ ������������������ ��� ��� �������� ����� ��� !� ���� ��������� ��� �������� �������������������������������� ��������������������������� �� ���� ���� ������ �� ��������� ��� ��� ����� ���� "�� ����������# ������� ������ ��� ������������ ��#�������$������������������� ������ �������������
����������� ����%�������������&�'�(���������������������� �����������)*�+�������#������,�����-���������������
.���� ������/���������!�� ���&���� �������
0���� ��/�� ��� ���#������ � !�� ��� ��� ���� ��� ���� 121�� ��� ���/���������
3�� �4��5�����54�1������������������������$ �������������������������� �������� ���������������� ������������������/�����#� #����� �� ���������� ���� � � � 6��� ��� ���� ������� �� ���� ��� ��� ���������1������� ������ ������ �������7��������� ����������������������� �������� #����� �� ������ ���� ������� ����� ���� �� ���� ����" ������ ������� �����$ ��� ��� ������� ����� ��������� ����� � � 6������������� ������������� ���� ����8������������$��������� �������������������
"��� ������ ��� ��������������� � �������� ��9���� #� ������:���� ����� ��� ������� ������� ������� ���� � � ���� ��� ����������� ����������� ������$���$������������ �� � �� ���������������� ������ ����� ������ ���+���� � ����� ������� ��� # ������ ����� ������ ��� ������� ��� �#� ���� � ���� �� �� ����� ���#��� ��� ��������$���� # �������� ����� � ���� ������ ���� ���$� �� ��� ������� �� ������ ���� ���$��#� ������ � ����"��� ������#���� ���� ����#������� ������������������������ ������� ����� �������� ������������������# ��������� ���� ���� ���������������� �����������/��������� ������ �� ����������� ����� ����� �#� ������ ��� ���� ������ �� �� ��������#� �������������
��������������������$���$� ��#�������������� ��$����������������� ���� ��� �� � ���������� ������� ��� �� �� �����������������# �� �� ����� ����� ��� ��� ��#������ �������� ����� #� ����� �������� ��� ��� �#� ������ ���� ���� ����� ����� �� �� ��� ��� �������������� � ����� ������ #� ��������� ������������������� ������ ������ �������� ������� 1� �� � ��� � ��� ��� �� ���������� ��� � ��� ����$� �" � ����� �� ������� ���� ��� �� �� �������� �7������� ���� �� $��� ��������� ��� ��� ���� ��� ������������� ���������������������������#�������
� �� �� ������ ��� �������� ������ ��� ����� �� � ��� ������ �������� ���� ������� ��������� �� ������� ������ ���� �� ���������������� ��� ������$ ��� �� � ���� ��� ��� � ����� ��� ��� "�� ��������������������������� ��� !�������������
� �
�
����� ��������� ������ ������ ���� ���� !� ����� ������ ������� ���������;��!��1������������������� ��� ����� ������ ���������������� �� ��������� �� �� ������ ���� ��������� ,� ������� ��� �������� ��� # ������� �8������� ���� ����7�������������� ��� �������������#����������������#����#� ����� ���� �������������������� �� ������������ ����������# ������"�������� ���������������#�������� # ����� ������������������� �������� ������ �������������� ����� ������ �������� ��� # ��� ����� ��� ����� ���������������� ������������ ��� ����
�� �� ������ � ��� �������� ���� ����� ������ ������� ���� � �� � �������7 � ���<1�������=���#���� � ��� ������ ����� �������#������#��������$� ��������������� ���#��## � ���� ������������ ���
��� �>?��>���5�0�� !����������������������7���������� �������� ����� �������( )� ������������ ��� ���� ���� ��� �� �#� � !� ����� @1��� ��������� �;�� ����� �� ��� �������� ���� ������� ����� �� ��������! �� �� ��� �� �� �#� ��� �� ���$� �� #����� �� ���� �������A� ��������� ����������������@�� � ������������;�� ��� #��������������
� ����"�������� ��� ������������������������������ ����� ������ ���� #����� �� ��� ���� ����� ������ ��������� !�� (2)��������� �����������������!�������������������������� $����������������� �������� ����� !� ���� ���� �������� ��� ������������ ������� 6����� ��� � ���
��$ �� ���� ���� #��� ��� � ��������$��� ����������� ����� ���������� �������� �2BBC�������������� 6���$���D� ������ �������� ,� @������;�� @����������"����;�� ��� @�������!�������!���;��(D)��
���� �#� ������ #����� �� ���� �� �������� ���� �� ��!����� ��� ������� � ���� ��� ����� ��� ����� ��� ����� �� �� ������ ��� ������ ������ �� ���� � ���� ������ ���� ����� ������ ��� �#� ��� ��� ������ �� �������� (C)�� ��� ��� �� � ��� ��� ����� ��� �������������������������� �� ����������#������������� ��������������������� ������� ��� ��� ���� �������� ��� ��������� ��� ���� ���������!����� ����� �� ����� � ������ �� ������ #��� ���� �������� �#�������� ���#���� �������������������������������� ������ ��
$�%��3&�'�� �(�)����� ���%�(�

�� ���� ������� � ���� �� �������� � ##������ 1������ ����� �������� ������������������������� ������������������������������������������������ ������ ��� ����
������������� �� ������������������������� ���� ��������� ����� � ��� (')� ���������� ������� ��� ��� �� � �� ��� ���$ �� ������� ������������������������� �������������������������������������������������������+� ������ ������� �� ������� ��� ������������� ������ ��������� �� ������ ��������� ���� �����$���
�������(E)� ���������$��� ������������� ����� � ��#������������ ����� �"������ ������������� ������������ � ������� ����������������� �������� ��������$�����������������������$������������� ��� ��� # ��� ���� ������� ����� ������ �� � ��� �������� �� �������������� # ��� � ���� ��������� ����� ���� ���� ������� ����� ������� ����������� ��������� �����������$����� ���������������� ������ �����
�#����������� ��� � ����#� ������ ���������� ����������������������� ��� ��� ����#��� � 7� �#� ������ �� ������� ������� ������ ������������������������� ����
*�� ��>4���5������ ������� �� �� ����� ������� ���� � ���� � � ���� ������ ����� ���� BB����� ����������#7���� �� ���������������$��� �� ���� ������������ #���������������$ ����� ��������������� �� �� �� �� ���������� #��� ������� �������� ������� ��� ���$� ��� �������� � �� �� �������������� ���������� ��#��������������������������/������� ��������� ������ � ���� �� ��� � ����� ��� ������ �� ������� ������������ ��������������������������� ����������� ��������#������#������� ��� �� ���������������� ����������#���������� $ �� ��� ����A���� ��� ����������� ���������� � ���� ���������� ������������
*�3� ����(����� �*�F����/ $���+������ �� �������������������F��� ����������������������D���� ��� ���/ $�����+������
�� F��� � �������� ����������������������� ������ �������������������$ ����� �������#�����
2�� F��� �������� ���� ��� ���$� #��� / $��� ��� +����������� �� ����� / $�� ��� +����;�� ��� ���� ���� ����� ��� # ����� ����� +������ F��� ���� ��� ��$� ����� ��� ����� ���������
D�� ����������� ���������� ������ ����/�����#����������� ���121����� ��� �� �����������������
*��� ���)��)����� �*�F����/ $���+������ �� �������������������F��� ����������������������D���� ��� ���/ $�����+������
�� F������������������������$�2�� F��� �������� ���� ��� ���$� #���/ $�� ���+����� � ����
� ��������������/ $�����+����������������� � ���� � ����+�����F������������� � ����������������$���$�������
D�� ����������� ���������� ������ �����+������� ������� ��� ��� ��������� ��� ������� ���� ��������� ������� �� �� ��� ��� � ���� �##���� ������� �� ��� ��� ����� ��� �� �����;���������� ����/�������������� ���#����������������� ��������������������� ������� ������ ���� �����������
���� ���# �� �#� ���$���$� ����� ������� �� ����� ����� #� ����� ������������� ��������������������� ��� � �������$���$��;��� ���#����������������������
*�*� ,�-��� �����%�(����� �*�F����/ $���+������ �� �������������������F��� ����������������������D���� ��� ���/ $�����+������
�� F��������������� !���������2�� F��� �������� / $�;�� ��� +����;�� ��� ���� �
����A��������������������������� � ���������� ���������������#�������������;���##���� ����� ����� �������� ��������� � ���� ����;�� ��� ��� ����� �� ��� # �� ���������������������
.�� �>��.4�G��/,?>/>4����54���$ �� �HBB� ������ ������� ��� /�#/�� �!+� ���� ����� ��� ��������������� �������" ���" ������� �����������HBB� �������������� ���������������$ ������������ ��������������� ���������� ��� ���� ������ �������� � �����2�� � ����� ������ ��� ���A� ������ ���������������������������+����� !� �� ������� ��� ����������������
��
�
������� �����������������������������$���$����� ����������������������������� ���� ���������� ���������������#��� ���������
.�3� ��������0����� �� �� ����������� � !� ������� �� ������� ��� ������ � ��� �������� ��� �� ������� "��� ����� �� ������ ��� ���� ����� ������������ �� ���� ������� #� ���� ��� ��� �� �$��� ��� # ���������9�$�������:����������+����������� ������7�����������$������ ���#������������������ ��������������������������������7������ ���� � � ��� �#� ������ �� ���� ��� ��� �� ������ ���� �������� ���������� �� ��� �������������������� ����#����#�� �������� � ���#�������� ���������/��� ��������� �� ������ ���������A�������������������� ��� ������������������ � ����� �� ����������������� �����7����������
���� �7�� � ����� ��$�� ���� ������ ��� � ���� ��� ���� �� �������� ������� ������ � ��� ���� ��������� ��� �7������ ��� ������ #������ ������������������������������������������ ������������ ������
$�%���&���(��� �� �1�����(���������� ��� ��(���$�����������(�� �0��� �� �1���

�����$�������� #����� �� ��$������������������������������ ������7�������������
��
.��� �������������#���� ��� ��� ���� � A��� !� �� ��� ��� ��� ���� ����� ��� ��� ����������� � !� ���� ������� ���� � ���� ��� ��� !�� ��� � ���� #����� �� ������ ���� ��� ��� ��� ��� ���� ����� ��� ���� ��� ����� ������������� ���!� ������ ����
�������$�#���� �����#��������
�� � !����������������������������� ���!��
2�� ������� �������� �� �������������
D�� ���������������������
C�� !�� �������������������#�������� ����#���� ������������������� � ��� �������������������
'�� #7������������#���������������������������
����� ��2�����'���A� �������� ������D����C������ �����������������������#� ���������������������� ���������������$�#����������� ������������
��
�
������ ����������������� ����� ��������� ����!������ ���!����+���� !��!�� ��� !� ������ ��� #���� ��� ������� ��������"�� ������ ����� !� ���������������������������������� ������� ����������� ��������������������������������������� ������������ ���!���������!� ��������� ���+����"������ �������������������!�����
!�� ��� !� �� ������ ���� �������� ������� �����$ �� ������������ ���� ����� !� ��� ������ #����� �� ����� ��� ����� ���� ������������ ������������ ������������ ��� ����� ����
������ ����������� ������ ����� ������ ��� ���� �HBB� � �� +��� ������ � ��� ���������� ��� ��������� �������1!2+DD��� !�1������ ���������� � � ����� ���� �� ��� �� �#� @F��� 2'I*��������������� ��� ��1;���
� !���������������� �������� ���!��!�� �������� �������������������������� �� ������� !����������
����� ��-��������������������� ������$ �� ������� ��������� @F��� 2'J*� �����������$ ��1;� ����������������$�������������" ���� �� �� ���� ����� ������ ���� �� 121� ������ ��� � � ���� ������/�����������/�� ��� ���������������� ����������#� ����
��� � ���� ��!"��������"���������/������������������� ��������������� �� ������ ������ ��� �� � ������� �#� �������� �� ���������� �������� ���������� ������ � #�������� ���� �� ������ �� ������ ������ ���� � ��� ����� ���� �7������ ��� �����# �������������#� ��������� ������� ��� ���������� �������������� ��� ��� ��� #� � ���� ������� ������ �7�� � ������ �� �����������
/�� ��� ��� ������� ���� ���� ��� ������� ������ �� "��!K�����������!�� ��� ��� �7����� �� ������ #������ ��� ���� ������� ���� �������������������������������������������#������� �����'������������������#����������� ����������
� ��
�
$�� >%�?&���54������� ��� ����������� ���� ���������� �������� #��� ������ ����"�� ������ 6��� ���� ������ ������� ��� ��� ���� ���� ����� ����� ,�@���������� �����#������� ������� ��;� �������'���
���$���$� �� � ����� ���� @������ ������;� ������ ��� �� ��� �������A���6�����������D��������@��������# ������������;�� ������� �����@�����;� ��� ��� "��� ���� � ��� �� ������� ������� ��� ���$���$����#�����# ��������������� ���� 6���������@# �;�������� ������ ������ �� " ��� ���� ���� �� ������� ��� �#� " � ��� ��� ���������� ������ �������� ����������� �������������������������������������� #� ���� ��������� ��� ��� �� �$��� ������ ���$���$� ������������ +���� ���� ��� �������� ����$� �� ��� �$��� ��� ��� ���� ���#����������������������������
������.(��)*��+���+������*�
������$(������* �� �,���*�-�� *���?�.��* �� �,��/*�0���0�.�0 ���
������!(�&*��������.����"�*���

��-0��3(�4�+-����.�&*��������*���+���*���
1� �� ������� ���#+��#� ������
2�������� 2�������� 3������ !�
��������������
�� ��
����*����4����
��0������
������� �������
�������
������� �������� ��������� �� ���#������� �� ����� ����� ����� �������������� ������� ���!���� ���������� � ����������� ������������� ����� ��� ���� ���� # �� ��� ���� ���� �������� �#� ����� �� ������ �� # ��� � ��� ���� ������ �������� ���� ��� ��� ���� �� ������������� ����������������������������������������� ������1!�������� �������;�� ��D� �������� ��� ����� �� ���� ��� ���� ����� ������ �������������� �����������#�� ����������#����� ������ �� ��� #���� �## � ��� ���� ����� �� � ��� ����������� �� ����� ���� ����� ����� �� ������ � ������ ��� ������ ������ �����
5�� �54�?&��54���� ����������������� ����������������������� ��� ������ ���������������� ��� ����� ������$ ��� +� ��� !� ���� � ������ ��������� ������ ���������������7��������� ���������������������� ���� #���� ����� ������ �� ���� ��� ����� ����� ���� � ��� ��� ������ ������� &�������� ������ �� ���� ��� ���� ��� ��� �� ��� ����������������
3������ �� ������ ����� �� �������� � ������� ������ ��������� � ��� ��� ���� ��� ���� �� � ��� ��� �## � ��� ������ �� ������� ������������������ �������� ������������������������� � ����#�������� ��� ����������
5�3� �������6��#*�3�������� ���� �������� ��� ������ �����$����������������$����#��������#������������ ����A�����#�������� # ������������ ��� ��� ����� #�� ����� ������ � ��� ���� ��� #������� �� �� #����� �� ��� ��� ����� � ���� �� ��� ��� ������;�� ��� ��������$�� #� ����� ����� ����� � ��� ���$� � ��� �������� ��� ��� ������������ ����� ���� ��� �� ���� ���� ����� �� ��� # ��� ���������� ��� � ��� <���$=� #����� �� ��� ��� ���� ��� �� ��� ����� � ������ �������� ��� ���������
+���� ������ � ������ �#� ��� � ��� ������� ����� ��� ������������ � �� ���� � ��� ���� ��� ��� ��� ��� ���� ������� �� ���� ���#�
�7����� ����������#�������"������������$������������������������� ����� ��� � ���� #����� �� ������� ������ �� ���� ���� ��������� �������������� �����
���� � ��� ���������� ���� ������ ������ ������� �� ��� ��$��� ��������� ������� ����� �� ��� ����� �� ��� ����������� ������ ��������� ���� ������ ��� ��� � !� �������� �������� �� ���� ���������� �� �������� ��� ��� �� ������� ��� ����� ��� �1���!�� ������ � !� ������� ��� ��� ��� ��� � ��� ��� ����� #��� ���������������7��� �����
����� �������� ����� ��������� ��������������������� � ����!��"�� �������������������������������!�#���121���� ������ � � ��������� ����� ��� ������� ����;�� ��� � ��� #����� ��� ����� ��� ��$���������������� ���������������� ����������������� � � � ����#���������������$ ������������������
7�� ��0456?>".>1>4���� �����$������������#������ �����/��� 7����#������������� ���#������ 2����� ���� ������� 3������ ���� ���� ���#���� �� ���� ��#����2BBE�� � ����������� ������� �������
8�� �>�>�>4�>��(')� KL�$$����1������� ��������1��� ��������� �������������
"��$�����1����� ���/�� ��������� ��!�� ����<13�/!�2BB'=��/� ������������2BB'�
(2)� � ��9 �������F����������F�##�/�������������1�������1��������� ��*�"���1�������#������������"�������������� ���"/��2BBB��
(D)� M����� ������ $���K�������� �����*�� !�/ ���������#�������� ������ � ���:��� � ���+���������� �� �������������:����$ ������ �����������������2BBE�BB2��/���J��2BBE�
(C)� 3����$6 ���9��2� ����������K�����������1��&���� ��������� ����F��� ���37��� ����������� ����#�1��� ����/�� ��������� ������ A���*������ ���1� � �������� ����1������ ����#�H�������� �����#��������+� A� ���������� ���+� ����2BBE�
(')� /�����#������������������&�����$���������#�������*������ ��� �������������������������������1������ ����#�1����� ���2BBI�
(E)� F����$ ������N�# ������$���/ �� ����9�����������*�������� ������ A���#���/�� ���������$ ����1������ ����#�/��23�&�2BBD�
�

Workshop on
Improved Mobile User Experience (IMUx 2008)
ORGANIZERS: Péter Boda (Nokia Research Center, USA)
Ákos Vétek (Nokia Research Center, Finland)
Patrik Floréen (HIIT, Finland)
Petteri Nurmi (HIIT, Finland)

Workshop on Improved Mobile User Experience - IMUx 2008
Péter Boda1, Akos Vetek1, Patrik Floréen2, and Petteri Nurmi2
1 Nokia Research Center P.O. Box 407 FI-00045 Nokia Group
{firstname.lastname}@nokia.com 2 Helsinki Inst. for Information Technology HIIT
P.O. Box 68, FI-00014 University of Helsinki {firstname.lastname}@cs.helsinki.fi
Foreword
Current interfaces of mobile devices are rather limited when adaptability, context-awareness and proactiveness are considered. For example, they do not utilize the context of the interaction, nor the environmental changes in the user’s proximity or the capabilities of the device itself. This context can include information about the situation and the user preferences, longer or shorter time usage histories, etc. To improve usability and to provide a better user experience, the interfaces of the devices should become more intelligent and require less intentional user inputs. In order to achieve this goal, novel interaction methods need to be developed and combined with statistical models of the user that capture, for example, her behavior, personal preferences and goals. Furthermore, the developed solutions need to be evaluated via extensive user tests to guarantee they are valuable to the users. To improve the dialogue between the different research areas and their practitioners, the workshop aims at bringing together researchers from the fields of user modeling, user interaction and user experience, with developers of mobile and ubiquitous applications. The ultimate goal of the workshop is to provide a common forum for exchanging ideas between these domains.
The workshop organizers thank all those who submitted papers to the workshop. Thanks also go to the Program Committee for reviewing the papers and to the Pervasive conference organizers.

The Challenges of Evaluating the Mobile andUbiquitous User Experience
Kasper Løvborg Jensen and Lars Bo Larsen
Section for Multimedia Information and Signal ProcessingDepartment of Electronic Systems
Aalborg University, Denmark,{klj,lbl}@es.aau.dk
Abstract. New methods are needed to face the challenges of evaluatingthe mobile and ubiquitous user experience. By utilizing the sensing andprocessing capabilities of today’s mobile devices it is possible to capturerich quantitative data about the usage and context of mobile and ubiqui-tous applications in the field. This can be used to conduct large-scale userexperiments in the field based on such data. This paper discusses how thecapture and analysis of this can be automated and put into a frameworkto facilitate such studies and presents a prototype implementation.
1 Introduction
The world has never been more mobile than today. Riding an avalanche of tech-nology a multitude of mobile and embedded devices are becoming wirelesslyinterconnected in networks ranging from local to global, enabling anywhere,anytime access to services and information. Emerging paradigms such as ubiq-uitous and pervasive computing are changing the way people think about anduse computers. With these paradigms comes a wave of novel application buildon e.g. context-awareness and adaptive interfaces. A great challenge for HCI re-searchers and practitioners is to evaluate the user experience of such applicationsto ensure that they are and will be both useful and usable.
This paper aims to address the way in which researchers and practitionersof mobile HCI can go about evaluating these systems. We suggest that it makessense to talk specifically about the mobile and ubiquitous user experience ratherthan the broader UX (User eXperience). Introducing a shorthand notion formobile and ubiquitous user experience we propose μX /mju : εks/. This is notto be confused with the abbreviation MUX, which is already used widely forMulti-User eXperience.
1.1 Defining μX
The point of defining μX is to be able to broadly refer to experience of usingthe diverse and growing class of systems, applications and services, which areinherently mobile and ubiquitous in their nature. They constitute a complex

user experience due to their mobility, ubiquity of use and sensitivity to contextin which they are used.
μX can be defined as:
”the user experience arising from systems, services and applicationswith which the interaction is essentially mobile and ubiquitous”
This can be further specified:
Mobile: Mobility should be attributed to the user and the device(s) duringinteraction as defined in [4], and not as static properties of the user or devicesthemselves. E.g. if the primary use of an application on a mobile phone isalways in a static context it is not considered mobile interaction and thusnot μX.
Ubiquitous: Meant in the broader sense i.e. that interaction happens anywhereand at any time, which together with mobility makes it possible to occur inany context. Note that this is different than Mark Weiser’s definition forubiquitous computing [20] since is can refer to a single personal device andtransparency of the technology/computer(s) is not required.
A μX application is an application on a mobile device which gives rise to themobile and ubiquitous user experience. It is more easily explained by contrastingit to it’s opposite, which would be the archetypal desktop application. Desktopapplications are run on relatively powerful desktop computers with plenty ofresources and a reliable network connection. The environment in which the in-teraction takes place is controlled and static. Often the user will be sitting down,calm in front of a big screen and focused on all that is going on both visuallyand audibly.
By contrast, μX applications are used in the wild. They are used anytime,anywhere and in any context - often while the user is on the move, and oftenas a secondary task to some primary activity done in parallel. The cognitiveload in most usage situations is significantly higher than average for desktopapplications and the user experience is sensitive to contextual parameters suchas environmental (noise, lighting, etc.), social (setting, presence of people, etc.)and network (availability, bandwidth, price, etc.) conditions.
Having defined μX applications, we can now address the challenge of evalu-ating them, since the only way to ensure that present and future μX applicationswill indeed be both useful and usable is to build and evaluate prototypes withreal users. The question is then how to do this most effectively and efficiently.
1.2 Paper Outline
Section 2 will discuss existing methods and why they are not ideally fit forthe characteristics of μX. Section 3 and section 4 will present and discuss anew method and framework from a theoretical and a practical point of viewrespectively, thus relating it to existing work and discussing implementation

issues. Section 5 presents a prototype implementation of the proposed frameworkwhich was used in a longitudinal field study. Section 6 will discuss the pros andcons of the proposed method and point to some research perspectives.
2 A Look in the Toolbox
By taking a look in the current toolbox of methods for user evaluation it can beseen that few methods are actually fit for μX . The characteristics of μX appli-cations as defined above suggest that they should optimally be tested under theconditions in which they are expected to run, i.e. in the field. However, researchhas shown that existing methods for doing so are very cumbersome and costlyto perform and the gain of such field evaluations has been questioned [13,?].
A survey of mobile HCI research in the years 2000-2002 concluded that eventhough most researchers thought field testing was the best approach, very fewstudies were actually based on field experiments [11]. They also showed that thepredominant approach is to do experiments in usability laboratories where usersare asked to interact with a prototype system in a controlled environment andcontext. The reasons for this are discussed in the following.
2.1 Laboratory vs. Field Evaluation
The issue at its core is whether or not field experiments are worth the hassle [13].High experimental control and easy data collection are virtues of the laboratory,while quite the contrary is true for field experiments. The general belief is alsothat field experiments are more costly with regard to time and resources. Thegain is realism when evaluating the services in their natural environment andcontext of use.
Whether or not to evaluate in the field is widely debated within mobile HCIwith some questioning the gain, [13, 10], and others claiming it is indeed worththe hassle [16]. It should be noted that most of the comparative studies areperformed based on usability metrics such as number and severity of the foundusability problems and not how well the methods investigate the broader UX. Ifthe aim is to look at more than just usability these comparative studies can notbe regarded as conclusive.
Often field studies have tried to bring the lab to the field. However, bringingmethods like the think-aloud verbal protocol, video capture and human observersout into the field takes a lot of resources [13]. Issues such as logistics, interferingwith the context and noisy data cause problems. Besides, in many contexts itwould be inappropriate for the test users to go about their business with anentourage of researchers.
Others have tried to bring the field to the lab e.g. in [12] combining fieldstudies (in situ) with lab studies (in vitro) to what they call in sitro - simulatingthe mobility and context in the lab. The limitations of this method are how reala context can actually be created, that only problems foreseen by the experi-menters can be tested and that it is essentially scripted scenarios of use just likea regular lab test. Also, it can be costly to set up.

Both are trying to get some of the best of lab and field testing, but both areessentially augmented versions of existing methods. Our belief is that radicallynew methods must be added to the toolbox to truly investigate μX.
2.2 Other Aspects
Evaluating some aspects of UX (and thus μX) requires studies over longer periodsof time, since the user’s initial response to an application might not reflect theway he or she feels about it after using it for a longer period. E.g., learnabilityand memorability, which are part of the usability goals [17], are difficult to assessfrom short duration experiments.
Existing methods are very good for finding usability errors in the interfacebased on fine grained analysis of observational data and user feed-back. Usage ofmethods such as the think-aloud protocol to capture what the users’ is thinkingis a good way to get insights into their mental models. However, this potentiallyinfluences the experiment e.g. the controversial Hawthorne effect [14].
Further, studies of this type of systems will some times require exploratoryexperiments since the dynamic nature of μX entail that the situations and prob-lems which will arise cannot be predicted.
In summary, the current trend is to evaluate μX applications with methodsadapted from regular desktop applications. To truly uncover the essence of themobile and ubiquitous user experience and thus to learn how to properly designμX applications new methods must be developed that focus on the unique char-acteristics of μX as discussed in section 1.1. We believe that it is very importantto explore how such studies can be conducted in more efficient and effectiveways, thus making it more attractive for both researchers and practitioners toexplore μX in the field.
3 A new Approach
The following will describe our ideas for a new method for investigating μX inthe field. First an overview will be given and related to existing knowledge andstate-of-the-art. After this section 4 will discuss key issues of implementing thismethod into a framework.
The basic ideas behind the approach are:
– The study of μX should be taking to the field and be unobtrusive to theuser’s interaction in the natural context.
– Utilize the sensing and processing powers of mobile devices to capture usageand context information.
– Large scale studies over longer duration and an increased number of users.– Focus on quantitative and objective data and results.
The solution is automating the time and resource consuming parts in doingfield experiments, thus enabling them to be run more or less autonomously. In
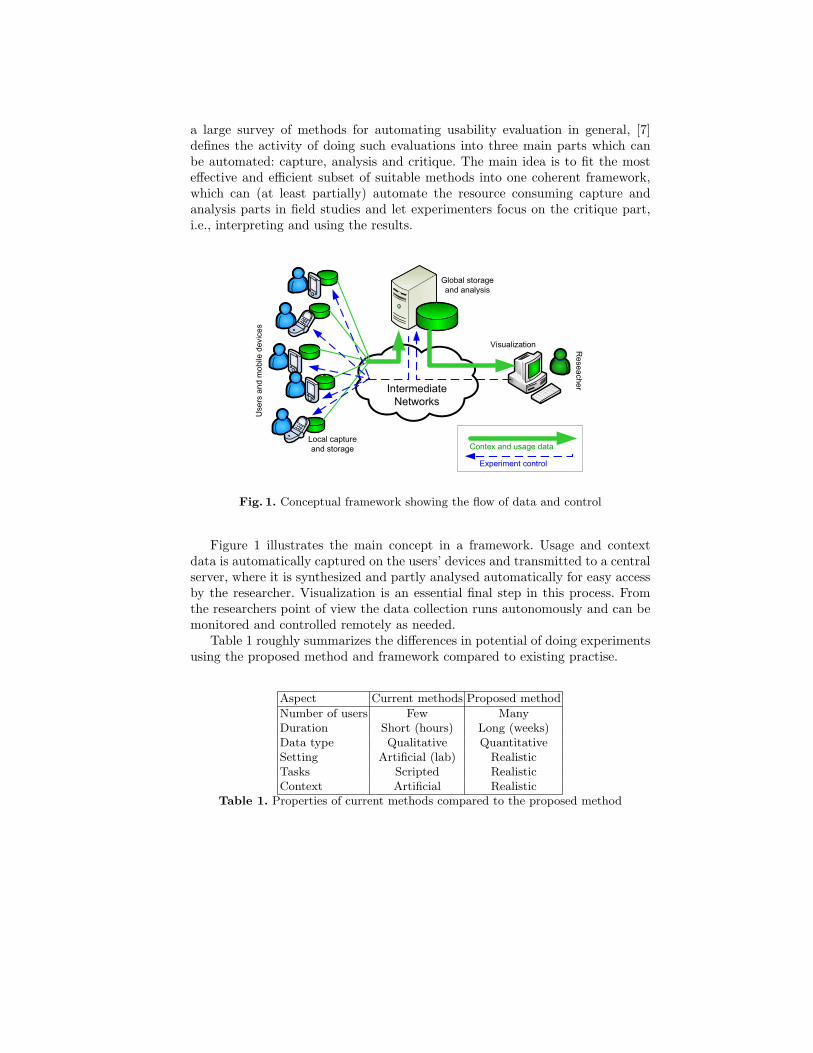
a large survey of methods for automating usability evaluation in general, [7]defines the activity of doing such evaluations into three main parts which canbe automated: capture, analysis and critique. The main idea is to fit the mosteffective and efficient subset of suitable methods into one coherent framework,which can (at least partially) automate the resource consuming capture andanalysis parts in field studies and let experimenters focus on the critique part,i.e., interpreting and using the results.
�������������� ���
��������
� ���������������
����������� ��� �
���
�����
�� �
������
���
� ��������������� ���
�� ����� ��������� ��
!���"� �
Fig. 1. Conceptual framework showing the flow of data and control
Figure 1 illustrates the main concept in a framework. Usage and contextdata is automatically captured on the users’ devices and transmitted to a centralserver, where it is synthesized and partly analysed automatically for easy accessby the researcher. Visualization is an essential final step in this process. Fromthe researchers point of view the data collection runs autonomously and can bemonitored and controlled remotely as needed.
Table 1 roughly summarizes the differences in potential of doing experimentsusing the proposed method and framework compared to existing practise.
Aspect Current methods Proposed method
Number of users Few ManyDuration Short (hours) Long (weeks)Data type Qualitative QuantitativeSetting Artificial (lab) RealisticTasks Scripted RealisticContext Artificial Realistic
Table 1. Properties of current methods compared to the proposed method

3.1 Automatic Capture and Analysis
Table 2 compares some state-of-the-art tools created for automatically capturingdata in field experiments. Larger companies such as Nokia have developed in-house tools which may be even more advanced than these, but they are notopenly available.
The data can roughly be categorized as relating to usage, context or sub-jective user feedback (qualitative). All three types of information have beencaptured with success in proof-of-concept studies. In this paper the focus is onusage and context. Important questions are what types of data to capture, whento capture it and how to use it afterwards to best investigate the μX?
Tool Context Usage User attitude Platform
ContextPhone [18] ∨ Symbian S60MyExperience [3] ∨ ∨ Windows MobileEDEM [5] ∨ ∨ JavaSocioXensor [19] ∨ ∨ ∨ Windows MobileRECON [15] ∨ ∨ ∨ Windows Mobile
Table 2. Existing tools for capturing data
Both usage and contextual information which are objective and quantitativecan be captured at many levels of abstraction and at various granularities ofdetail. The ”easy” approach is to simply capture everything - all the time justto be sure. This is sort of an analogy to video filming usability experiments in thelaboratory test. It leaves the researcher with a huge amount of post-experimentdata to analyze which is a very time consuming activity. The amount of dataproduced and the effort needed to analyse it is the main reason for also, at leastpartially, automating this phase.
Rich data can be sampled with regard to usage and context by using au-tomatic capture. Studies such as [1], [2] and [8] give nice glimpses of what canbe gained by mining such data from field studies. However, generally there is asignificant lack of proven methods for exploiting these vast amounts of data inorder to get insights into the user experience; specially how to include contextualdata.
The process of processing the data into user experience information is farfrom trivial. Every study seems to have its own ad hoc data analysis, and fewgeneric methods exits for addressing this. In [6], Hilbert and Redmiles surveyand classify some existing methods and tools for extracting usability informationfrom user interface events. This is further discussed in section 5.
4 Implementing the Framework
As stated, our goal is to combine the best of the methods and tools for capture,analysis and visualization into one coherent framework for conducting large scale

user experiments in the field. From an implementation point of view, the acronymSIERRA summarizes what we believe to be a range if essential qualities for sucha framework to have if it is to gain widespread use for evaluating μX systems.
Safe: Ensure privacy and security of the user’s data. This also implies robust-ness.
Invisible: Be transparent to the users and not interfere with the user experi-ence. This also implies efficiency and autonomy.
Efficient: Have a low footprint on the mobile device with regard to CPU andmemory usage. Use of network resources and battery should be minimal.
Robust: Should be fault tolerant and be able to recover from system crashesand take care of unexpected errors and events. Autonomy is implied by this.
Remotely controllable: Have some remote experiment control so that e.g. thelogging policy can be changed by the experimenters during a longitudinalstudy.
Autonomous: Some degree of ”intelligence” is needed e.g. for doing oppor-tunistic data reporting when network conditions are good.
The above mentioned aspects all dictate how the framework should operateat run-time i.e. during the experiment. Of equal importance are requirementsfor how the framework should be set up, deployed and used before and afterthe experiment. It should be sufficiently generic to apply to a large range ofplatforms and scalable enough to apply in all sizes of experiments. Also it mustbe time and resource efficient to set up.
5 Prototype Framework
Figure 2 shows a prototype implementation of a framework, which was used for afield evaluation of a mobile diabetes management service called DiasNet Mobile.Detail of the service, the study and the results can be found in [8] and [9].
In figure 2 interpretation refers to what [6] calls transformation i.e. the ab-straction of low level log events into higher level concepts of interest. Part ofthis process is also selection, which is separating interesting data from ”noise”.Such transformations have been done to transform the raw data of low levelinteraction and events into a logical structure that sorts the user’s interactioninto sessions, activities and actions. The translated log will form the basis for themain analysis, which is based on a combination of sequence detection and calcu-lating counts and summary statistics. The output from the automated analysis isan annotated log file and a set of tables which can be imported directly into anyspreadsheet program, R, Matlab etc. A set of scripts are used for automaticallygenerating the desired graphs and diagrams representing visualization which isapplied as a last analysis step to draw on the human brain’s ability to visuallyrecognize patterns and trends.
The study of DiasNet Mobile did however not include contextual information.Another study has been done resulting in a specific tool for capturing contextand usage information called RECON (REmote CONtext) [15]. This tool has

#�������
������� ��� ���� ���������� �� $�� �� %�����
$������&��� �'
� ������ ���( ���
������������� �
� �������������
)����*���������������
)������ ���� � � �
�������������� ���
+���������� (��� ���
,��
,������������
����
������-� ����������
����������
��������
� ���� �
�� ���� �
.����
.�
.�
.���� ������ .�
���� ���������
Fig. 2. The implemented prototype framework and how it was used in the DiasNetMobile field study
so far been tested with a few users, but has not yet used in a real large scalefield evaluation. Briefly described, RECON is able to monitor interaction withapplications, recording of context e.g. localization using WiFi. It can also promptusers for subjective input triggered by context events or specified usage patternsmodelled as Finite State Machines. The logging policy can be controlled remotelyduring the experiment.
6 Discussion
The approach presented here is purely quantitatively oriented. The need forqualitative and subjective measures is fully recognized as being essential foruncovering the true user experience. The focus on quantitative data may requiregrounding by qualitative input and feed-back from the users. Such knowledge canbe gained from using existing and proven methods or through some of the toolspresented in section 3.1 which support user feed-back through various experiencesampling methods. This is a very interesting combination indeed.
Doing this type of studies has several major drawbacks which must be ad-dressed. The single most critical challenge in our view is dealing with the uncer-

tainties inherent in the proposed type of studies. These uncertainties are rootedin the limited control of the experiment and incomplete knowledge due to lackof data. An interesting question is whether they can be properly compensatedfor, e.g. if the sheer amount of captured data can be used to filter out this noise,and good data can be uncovered. Sometimes the noise might actually be themost interesting, since it can represent special events. Another limitation is thedemand for a functional high fidelity prototype which makes it mostly applicablein the later phases of development.
The method is highly scalable and in theory any number of simultaneoususers could be active in the experiment for any period of time. Depending onhow many simultaneous users it can be costly to buy equipment for a large scaletest, but this should be weighed against the price of human resources and e.g. ausability lab.
6.1 Some Research Perspectives
The following summarizes what we believe to be some of the most interestingresearch directions related to this kind of framework:
– how to combine this methods with existing (qualitative) methods into acomplete UCD methodology for developing μX applications
– how to handle the uncertainties in the data– how qualitative/subjective user experience sampling can be combined with
the quantitative/objective context and usage data.– how to use the data to build and manage dynamic user models e.g. user
preferences in context-aware applications
6.2 Conclusions
We have defined μX and discussed the challenges of evaluating it compared tothe currently most used methods inherited from evaluating desktop applications.There is a definite need for new methods to address this and we have presentedone such method, namely to do automatic capture and analysis of quantitativeusage and contextual data in large scale field studies. We have presented anddiscussed how this type of studies can be catalyzed through a generic frameworkincorporating the best tools and methods for capture, analysis and visualizationand a prototype implementation of such a framework has also been presented.
7 Acknowledgments
The authors wish to thank Tais Holland Mogensen and Christian Ølholm fortheir work on RECON as part of their Master’s thesis [15].

References
1. A.Oulasvirta, R. Petit, M. Raento, and S. Tiita. Interpreting and acting on mobileawareness cues. Human-computer Interaction, 21:97–135, 2007.
2. N. Eagle and A. Pentland. Reality mining: Sensing complex social systems. Per-sonal and Ubiquitous Computing, 10(4), 2006.
3. J. Froehlich, M. Chen, S. Consolvo, B. Harrison, and J. Landay. Myexperience:A system for in situ tracing and capturing of user feedback on mobile phones. InMobiSys, 2007.
4. L. Gorlenko and R. Merrick. No wires attached: Usability challenges in the con-nected mobile world. IBM Syst. J., 42(4):639–651, 2003.
5. D. M. Hilbert and D. F. Redmiles. An approach to large-scale collection of applica-tion usage data over the internet. In ICSE ’98: Proceedings of the 20th internationalconference on Software engineering, pages 136–145, 1998.
6. D. M. Hilbert and D. F. Redmiles. Extracting usability information from userinterface events. ACM Comput. Surv., 32(4):384–421, 2000.
7. M. Y. Ivory and M. A. Hearst. The state of the art in automating usabilityevaluation of user interfaces. ACM Compututing Surveys, 33(4):470–516, 2001.
8. K. L. Jensen and L. B. Larsen. Evaluating the usefulness of mobile services basedon captured usage data from longitudinal field trials. In Mobility Conference, 2007.
9. K. L. Jensen, C. F. Pedersen, and L. B. Larsen. Diasnet mobile: A personal-ized mobile diabetes management and advisory service. In Second Workshop onPersonalization for E-Health, 2007.
10. A. Kaikkonen, A. Keklinen, M. Cankar, T. Kallio, and A. Kankainen. Usabilitytesting of mobile applications: A comparison between laboratory and field testing.Journal of Usability Studies, 1(1):4–17, 2005.
11. J. Kjeldskov and C. Graham. A review of mobilehci research methods. In Proceed-ings of the 5th International Mobile HCI 2003 conference, pages 317–335, 2003.
12. J. Kjeldskov and M. B. Skov. Studying usability in sitro: Simulating real worldphenomena in controlled environments. International Journal of Human-ComputerStudies, 22:7–37, 2007.
13. J. Kjeldskov, M. B. Skov, B. S. Als, and R. T. Høegh. Is it worth the hassle? ex-ploring the added value of evaluating the usability of context-aware mobile systemsin the field. In Proceedings of the 6th International Mobile HCI 2004 conference,pages 61–73, 2004.
14. R. Macefield. Usability studies and the hawthorne effect. Journal of UsabilityStudies, 2(3):145–154, 2007.
15. T. H. Mogensen and C. Ølholm. Recon: A framework for remote automated fieldevaluation of mobile systems. Master’s thesis, Aalborg University, 2007.
16. C. M. Nielsen, M. Overgaard, M. B. Pedersen, J. Stage, and S. Stenild. Its worththe hassle! the added value of evaluating the usability of mobile systems in thefield. In NordiCHI, 2006.
17. J. Preece, Y. Rogers, and H. Sharp. Interaction Design: beyond human-computerinteraction. John Wiley & Sons, 2002.
18. M. Raento, A. Oulasvirta, R. Petit, and H. Toivonen. Contextphone - a prototypingplatform for context-aware mobile applications. IEEE Pervasive Computing, 4(2),2005.
19. G. Ter Hofte. What’s that hot thing in my pocket? socioxensor, a smartphonedata collector. In Third International Conference on e-Social Science, 2007.
20. M. Weiser. The computer for the 21st century. Scientific American, 265(3):94–104,1991.

������������ �� ������������ ���� ����������������� ������������������������ ����
�������������
� ������������������������������������ ���� ���!"�#����$�� ����%� &'��!����(�
����������)� ����� �
���������� * +��� ��(� '��,���,�� ��,�� ������ ���� ,����(�� ' ������-�� '� ���(�� ��(� ' ���+-� ���&(�� �� ���� .� (�..������ (�,����� ��(� �����������,������..�����/�������������� ����(�����0�-���. ���� ���� &(�+��'�������(�� � '� '�� ����������/� ��� ������ ��,�� ������� "�� �(��� � � �&'' ��� '���� ��(���� -�+��&�� (�� ��������� �� ��� �� 0�(/�� ������(�(� � �(�������� ���� ��� ���&���,�� ��(� �..����,�� � +����� ��� .� ��'&�� ��(� &�'&�� (������� . ��(�..�������������&��������(�&��/��� �����������0������ 0���(�0����� �����/����� (�������� "�� ����� '�'��� "� ��,��0� � �� �������/� �''� ������ ��(� ��� � �����&'' ����/�&�� (�� ��������� ��(���/�����0�����'&�� . �0��(���'� ����� . �� (���-������� ���
���������&�� (���&���(����(���/������ � -�
�������������
1��+��/������ /����. ��&�� (����������� ������/� 0��/���'�(-��+&��������������������� .�&�(������(��/��+ &������������ �� .� '������'&����(� &�'&�� (�������. �� +��� ��(� '��,���,�� ��,�� ������� "�� �(��� � � �&'' ��� '���� ��(� ��� -�+��&�� (����������� �� ����� 0�(/��������(�(�� �(������������ ������&���,����(��..����,����'&����(� &�'&�� (�������. ��(�..�������������&��������(�&��/��� �����������0������ 0���(�0����� �����/����� (���������
* +��� ��(� '��,���,�� ��,�� ������ ���� ��0� �����/��� � � ��. ���� ��'��������� ���2��-��/��' ���+-�� '� ���(���,�� �������(�..������&����/ �����(�����(� '��� (�� .� ������� �� ��(� � ��������� �� �� � '&���/� ������ �..���� ������������� ����(� ����0�-� ��. ���� �� �� &(�+��'�������(� � � ����&�����3���� ���� �������(��-'�� .���. ���� ��0������+����,��/����� ��� ��0�����������/�'��������� ������ ��-� ������� ��,�� ������� ��4&�������� ���� +-� ��,�� ������ ��(� &����� � &(� ,����(�����������-����&��� ����
5����� +��� (�,����� ���� &��(� . �� ���� +�� ��/� ��� (�'��(���� �� ���� &���6��'�-����� ��,�� ����� ��(� �,���+���-� .� ����� (�,����� ��(� (�..������ ���,������ ! �����'�� ���� �#+���(� ���,����� ���� ..��� ��0� 0�-�� � � ��������� 0���� ���� '�-�������,�� ����� ������� ��#���&� �� �� ��-�� 5��� +��� (�,���� 0�� ���� ��� �� � � 0��������������/�0����(�..��������'����� .�������,�� �������

5 � '���-��&'' ������������ �����,��-��/����&��� ��������� �� .�&�� (����'&����(� &�'&�� ��� +��� ��(� '��,���,�� ��,�� ������ �� &(� +�� ���������(� ���� 5���4&���� ��� ���,���� ��� ����� � ������ ���&(�7����� ��� ��� ���� ��� �� ������� �� �������������������� ��������� ����������������� ����������������������������������� ����� ����������������������������� ���������������������� ������ � � �������� ��������� ����� ��� ��� ���� ��� ��� �������� � �� �������� ��� ������� ��� ����������� ���� ��� ���� ��������� ��� ��� ����������������������� ��������������������� ���������� ���������
3���� � �����/� ��. ���� �� .� � �������/� 0 ��� �����(� � � (�..������ ��'����� .���'&�� ��(� &�'&�� (������� ��(� &��� .� (������� ��� +��� ��(� '��,���,����,�� ������� "� � ����(� ����� ����� ����� .� ��������� ��� ���� 4&���� &���' ��(� ��(�.��/����(��* ����� 0�(/�� ����'������..�����/����������� �� .� '���� (���������� ���(�(� � � ������� ��� -�+�� &�� (�� ��������� �� . �� ,��-��/� ���&��� ���� "�� ����. 0��/� ����� ��� "� �� ��-� ��,��0��''� ��������(� ��� � ���� �&'' ����/� (���-������� �� '� ' ��(� ��� ���� ������&���� . 0�(� +-� -� '�������-� �&//���� �� . �� (���-������� ����� +�����(�'��,���,����,�� �������
���������� ������������������������������� ��������������
"�� ���� .��(� .� ��. ���� �� ,��&��8��� �� ,��� &�� ��� � ���� ��(� �''� ������ . ����. ���� ��'��������� ����,��+�������� (&��(��9���/����'�����'� ' ��(�����&(������,��&��8��� �� .� (���� .� (�..������ �-'��� ��(� �+������� �� �,���� ���� ,��&��8��� �� .������ ����'��+��0����(��������������(����� �� .���. ���� ��,��&��8��� ���������-�� .� ��������� �� ��(� .��(+����� ����,��&��8��� ��+���(� ��&���6�� ����� ��(� ���� � ���������&(��/�������� ������'������������(����(�(�,�����:;<��:=<��:><��:�<��5������''� ���������� ���-� ���/���(� ��� /��'����� '��������� ��� &���/� 0�#��8�(� �������� ��� ���������,�� �������
3���� (���/���/� &�� (�� ��'&�� ��(� &�'&�� . �� +��� ��(� '��,���,����,�� ������� ,��� &�� ��'����� �� &(� +�� ������ ��� � ��� &���� �3���� ��� ���� ����� .�&�� (����'&�������-�+���&..�������� � ..���&��'�� (���������(�� 0�'� '��� �(���(��0������ +����� ������-�0����� �&���������������� .� &�'&��������-������ &(����� ��� ����������� ����(����� ���+���(� �� ���� ��. ���� �� �,���+�� :$<��* (���-���� �-��&'' ����/�&�� (����'&��������(�(����� ����0��������&���������.�������(��� ��&'' �������/���� �� .�����(�..��������'&�� (����������
9���/���/� .�&�� (�� &�'&�����&(������������� ����(�� +����� �� .�&��'�� (��������5��������� �� .� &�� (�� ��&�� (��'��������� ������+��'��. ��(�+-�����(���/����0����(���/���/������-�����+-�����&����0����&���/������-���� ��+-����� �-���� ��� �&������ 5��� (���/�� '� ����� .� ��. ���� �#�������� �''� ������ ����-'���-� +���(� �� ����� ��(� ��. ���� �� ���-���� :?<�� : <�� 5��� (���/�� '� ����� . ��(���/���/�&�� (�� &���� �����.����� ���� +�� (�,�(�(� ��� � ������ +����� ���'�7� � ������������ ��� (���-�� ���� ����(� (���-�����8��� ��:@<��:A<��9&���/����������'��������. ���� �� � � '������� ��� �(����.��(�� �&���+�� (������� ���� � ����(� � � '������� �������. ���� ����(�����0�-��� 0�� �'�������������. ���� ��&���/�(�..������ (����������(�����+�(��� &����&�������:A<����� (&��(���. &�������'�(����/�0��������0�-��� ����(�������, &�� �� .��������&���/�'��������� ���

5��� ��'����� �..�����/� ���� ������ �� .� &�� (�� ��&�� (�� &�'&�� (����������� (&��(�+-��������/� (���-���� � ������(�.���0 �������&(�7��
�� ���������� (��B��/&�/�C���� �D����-��B��/���������� �� (�D��'� �����B��/�� ����� ����'� +��0���� ��'&�� ��(� &�'&��� .��(+����� ��� �� '��,���� ����(����(��/D�
�� ���������� ��� ������ �-'��� �+������� �� ��(� (����� �,��� ����� ����'��+��0���� ��. ���� �� ��(� ��. ���� �� �-'���� / �� .� ���� ��. ���� ��'��������� ��������� �+��'��. ��(�
�� ����� �/#���� .���&���� B��/�� ���� �-� ��'�+������D�� � �� ��� ��(�� /����,��� ���������'���������,����(�'��.��������
�� ����������� ������(�'�-�������,�� ������(�,���B�D�&��(�5�����. ���� ����(��(����-'����(����.��(�(&���/��������-���� .��������/�(���/��
.���0 ������(� (���-���� � ���������&���8�(����5�+��;��5���. 0��/��&+#����� ��� ���� (&��� � �� .� ������'������..�����/� ���� ������ �� .� (������� ��� ������(���/��.���0 ������� ���(������
���!����������������������
�E����� �� &(�+�� �0���� .� ������ �&������ ��,�� ����� ��(� �� 0�0����� (������������,���+��� ��������(�0����������������,����������� �� '�� ��������0��� &��+���/�(��������(� .� � ���� ������ !��(+����� ��� �� '��,���� �� ��(� ���(��/�� 0����� '�-� ����' ������ � �� ��� &�� (�� &���� �����.������ �� &(� ���+�� ���&���,�� ��������� �� +-��&'' ����/�����&���6������ ��� '���-���
���,��������� :;�<��&//����������/� ���� &�'&��0���� ��������'��(� ��'&�� ��-�����(����'��/�����&������. ��(��+ &�������,���+�� (���������(���������� ��' ���+��������5��-� ������ ����� &����� �� &(� ��,�� � ��� � ,��� (���-� ������ �� ��(� +�� �+�� � ��0����� (������� � ��, �(���(���� ,��� .� ������� ��� �3���,���������� :;;<���&(��(������� ���&��� .� � ���� '�-����� ��������� �� ' ���� .� ,��0� ��(� �����(� ����� &�'&�� (������� �� &(� +�� ��� ��� �-� 0���� ��'&�� (�������� �&�'&�� (-������� ����' ���� ����'��(����������� ����(�. ������� &(��� ���.����������'&��(-������&��(�+-�����&�����
3���� �&'' ����/� &�� (�� ��'&��� ��� �/��� +�� '���� � � �&'' ��� �� ' ���+��&�� (����'&�� '�� ������0�����&�� (������/���� ��'�������������&�����0���� � �&����F�� �(��/�� ��,�����������:;=<�&��������' �(�� �����/������������� /����,�� �(�+-����.���/� .� � &�� (�� � � &�� (�� ��������� �� ��� � /����,�� �(� �����������%�����-�'� '������(�,�(�(���� ���&���� &����(���4&������ ����/��� ���:;><�� �5���( ����������/���� ��'�����������+����. &�(�� �+��� �����������(������������ �����/����
*&�� (�� &�'&�� ���� ��������� ���� � +&������� .� ���� ��������� �� +-� '��������/���(&�(���� ��(� � '������-� ��. ���� �� +-� &���/� (�..������ (�������� �&�'&�� (�����������+��� +���(����,��� &��0�-��� ��&'' �����. ���� ��'��������� ����(���������� �� ��� ,��-��/� ���&��� ���� � 5��� ' ���+�� �-'��� .� � '����� �� +��0���� (������� ���� (&��(� +-� 2������� ��� ��� :@<� ���� �4&�,������� �'�����8��� �����(&�(���-��� '��������-�������.������(�� ��&�����-��* (�����������+��� +���(���' ��-�� �'����-�� �-��������-���(���������-��3���� ���� .����� ��������'����� .����� � +����� ��� . �&�� �� �� (���-� ��� �� '��������� �� .� ��. ���� ��� ��������

� +����� ��� ���(����� �,�-��/����������/� .���. ���� ��+-�����&��� .�� ' ����� (���������
���!���������������� �����������������
5���'��������� ���'� '������� .� (�������(�����+�����������/������(�0���������� .������ (���-����'��������/�'�����&����-'�� .���. ���� ����%��'�����'��������� ���. �����'����&����0��. ���'�������. ���� ���0������/&�/���&����. ��(�����'�� ������'���� (���-�����&���+��. ��'��������/� ,�������(�(&��� ��������&����&(� ��&����+����. ����' �����. ���� ����
1������/� (���-���� � �����������-�+���(� ����������(� .����(� ���(�����(������������������ ��(� '� '������� .� (�..������ (������� � � � �,�-� (�..������ ����� ��������������5�������� � �����&//����0�������(� .���. ���� ��� �'����������0�����&�� (�� (���-� �� � +����� �� .� (��������3���� � �� .� ������ ��� ����� ���� ��� /������ '&�' ��� :?<�� :;�<� ������ ���� ���/���(� ��� ��� �'���.��� '&�' ���� ����'����'�&�� (���� ����/� :;$<� �� �(&���� ��� &���(��� :;?<�� � �� .� ���� +����������+&���� .�����(�..������(���/��.���0 �������� � ������(���� ������������� (&��(����5�+��;��*��-� .������������/��''� ������������� ��+������ ���'����* ���/������'&�' ��� �''� ������ (���� �� � �� �,��� 0���� �� ������� ��(� ��������! ����!���� ����'� �����
!� �����:; <�����������(�,��� �������+����� .������''� ������(��&//�������������������/����� �,�� (���/����� �� &(� (���(�� &' �� ���� ���(� .� � ���'�&�� ����,��-� ���������.������ &(��&'' ������(����'�����&���&' ������� ������(�'�-��������.������ �� .� ���������,��-��5����(�,��� �� ���������� � �� �����(��� �,���0����� ���(�,�(�(� ��� ���/&�/�#+���(��(���B�������'������/���&��D���(����� �#+���(��(���B/��'������ &�(�� �� �D��! �����'�������(�..�������+��0������/���&�����(� �� ����������������� ��������(�(� � �+��'��. ��(�+-� ���� ,������%���&���������,�� � ��� &������,�������/�+��0����(�..������'��� ��� ���������+��&��(�. ��/�,��/���,�&�� ��' �����/�� ���� +�����0��������������/�0���������,�� ������
�&���..�� ��� ��� : <� �&//���� ����� ��� �((��� �� � � ��. ���� �� �-'���� �� ������������� ����� ���� �..���� ���� ������ �� .� &�'&���(��� ��(� ������� �� �..������� &������ �� / ��� (�����+�(� ���&(�7� '���&�(��� ��'����� (� ��������� ����������������������''�����(�����&���6�� (��0���������+��������� ������5���.���0 ���. ��&���(��� '��������� ��� ���� (&��(� +-� ����� ��� ��6�� :;?<� (���� �� � 0���� ����(����� ��� .��(�����'����� ��B��+ ���� �����'��������� ����+������� �D���(�� ��������(�4&����������&(��/����������������������,��-���(�&��.&������
* (������� ���� +�� � +���(� +���(� �� ������ �+������� � � '������� (�..������ �-'��� .���. ���� ��� ����&��� .� ���� (�..������ ���������������� .� (�������� � �� (����������� � '����� ����� ������ ��(� 0���� &��(� � /������� ������� ��� �����.���� ���' 0��.&������������� (���-�� ����! �����'���,��� ����(�� &����������&��-�&��(�� /������0��������/������&�(���&�������'&��� �� ����' ���� ����(��'�������� .������� ����(�0����/���&�����

���
"���� ���� &/�� �����.����� �� .� ��. ���� �� ��(��(��� �-'��� ���� (&��(� +-� �������/� (���/��.���0 �����
� "���� "���������� �����#!����������������
$���������� ����
% �����#!����
&���������������������'�()
%���������'&����(� &�'&��
���/&�/�������� ��
������,���������7�, ����� ,�����
F&(� ��,��&������'����B�������'������/���&����/��'������� &�(�� �� �D�
*������+�!�������� ����',)
%�������. �&�� �� &�'&��
���/&���������� /����+�����-����'�����
���������(-������
%��'�������� &���������'����
!�-������ �'�.)
�����'�&��(��������/�� &�'&����
�'�������(����������' ���
2��&�����&(�� �-�����'����
*�� ������+�!��������������'�/)
%������� &�'&��
F�� /�����/&������
"�. ���� ����'��������� ���'����'�� ����(����&��&���'� '�������
���������(-���������'������,��&�����&(�� �-�
0�� ����1�������� �������������������2������3���'4)
*&���(���'��������� ��� &�'&��
��-������� /�����
#� 2��&�����&(�� �-���������
5�����+� ���� ���������� ���� ����1'�,)
1(&���� ���&���(��� &�'&��
� ���������+����������'���������' ����4&������,���� ,�������
1�'����� ��B��'��������� ����+������� ������D��� ������B&��.&���������������,��-���&(����������������������D�
5������� &�(���/��'������� �� ����&���(���
!���� ��������� �� �������������3���'()6'�7)
� � ���'�&���'�-�����
��������(-�����
����������� �#���������
"�/�����&(� �����/&�/�#+���(��&(� �G�,��&��
!������ ���� �����������������8��������3���'�4)6'�9)
%���������'&��� &�'&��
%������ (�� .���'&����(� &�'&�� (�������
"�'&��B�,����+���(����������/�+���(D�� &�'&��B��������(-����D�
1����(�+�� (���&���+��. ���� (�������

�
��:!��������������������������������������������
*&�� (�� �����.����� �� &(� �(�'�� � � �������(�� ��(� �+������� .� (�..������ &����� ��(�(�..������ � ������� .� &��� :;A<��9-����� �(�'���� �� �'����� ����&��/�� .� (��������0���������� '������/������ ������������/��/���������(�� ���������'����&��� .� (������� ��� (�..������ ���&��� ��� ���� �&'' ��� �&��� '����'�� ��� ������� �� ��(�&�(������(��/��! �����'���/���&��������+��&��(�� ��&/���� ����'�����'�������'&������ ��-���,�� ����������0������. ��&�����0�����'������'����������
�+��� ,���������:;A<�� ���(��������&��,������������+���-������,��/�,�&��+ ���. ��(���+�(� &������ ��(� � �#(���+�(� &����� ��-��/� � � &��� ���� �-���� &�(��� �&+ '����� �(��� ���� 5��-� (�����+�� �� (���/�� �''� ����� 0����� ���&��� ��� �� &�� (�� &���������.�������������''� '������. ������&����������'���.������&��� ���5����''� ����(�,�(���������������� ��� ������������� �����������(�&����� �����������1�������� ����������(���0���� � ����� ��,�� ������ ��(�(�,���� � �����������0���� &���� � ��������� ���&(�� ����&���6�� �/� �/#����.���&������ �� �����(�� /����,��� ��������(�&����'��.���������5��� ��������� � �������/� (������� ��(� ���� � ���������� (�����+�(� ���� (�,�(�(� ��� �����/ ����� .����� �-��'����'�&��� � �����/&��������(�� /����,���..������
*&�� (���-� ���� �� � �&'' ���&��������/�+-� &���/�'����'�&�� ��������0����������&�����-����� ��&'��(������ �������3������6���� �-� .�&��'����� &��������������� ������ 0�� +�� /������� �����.������� +��0���� ������ ������/� ���/���B'����'�� �C� /���� ������' ���D������ �-� (�������B�&(�� �-��,��&�D��� (���B�'������,��&�D���(��������� .�,��&����. ���� ��B. �����+����D�:=;<��
:�������������� ��� ����������������
3����� �����/���. ���� ���+ &�������������/�0 ��������(�� �(�..��������'����� .���'&�� ��(� &�'&�� (������� ��(� ���� &��� .� (������� ��� +��� ��(� '��,���,����,�� ������� "� � ����(� ����� ����� ����� .� ��������� ��� ���� 4&���� &���' ��(� ��(�.��/����(��* ����� 0�(/��������(�(���'����-��+ &������ '����� +����� ��� .� (������� ��� (�..������ ���&��� ��� ��(� ����� ����'�� +��0���� ���� ��������� �� '� ��������-�����(� (���-� ������ ���F���� .��������'� .�-����������� "�����-��/� � ���������� ��� � ������� ,��0� .� ���&��� �..�����/� ���� ������ �� .� �&���+�� (������� . ��(�..������ ��������� �� ��(� ��. ���� �� '��������� �� '&�' ���� ��� (�..������ +��� ��(�'��,���,�����&��� ����
"�0 &(��&//����� +����/���. ���� ����'��������� ����(�� �����#+���(������� �� .� (�������+-�.�����������/�������. ���� ��0�����&���+�� '�� �����'��������� ������(� �.���� ������ �(����.-��/� �&���+�� (������� . �� ���� ���&��� �� ��� ���(� B&����� ��������������� �� '� ������ ��(� ��,�� ����D�� 3���� ���� ��������� �� (��B��/&�/�C'�-����D� ��� ���-� ������(� (&���/� ���� .����� ���'�� ��� ���� ���� +�� ����/�(�(&���/� ���� ��� �(� ���'�� � 5��� ��������� �� ��-�� B��/�� �������� �D� 0 &(� &�&�-� +��������(�(&���/�������� �(����'�� �+�����&'' ���&�����0����(�..�������,��� .�� /����,�� �(���
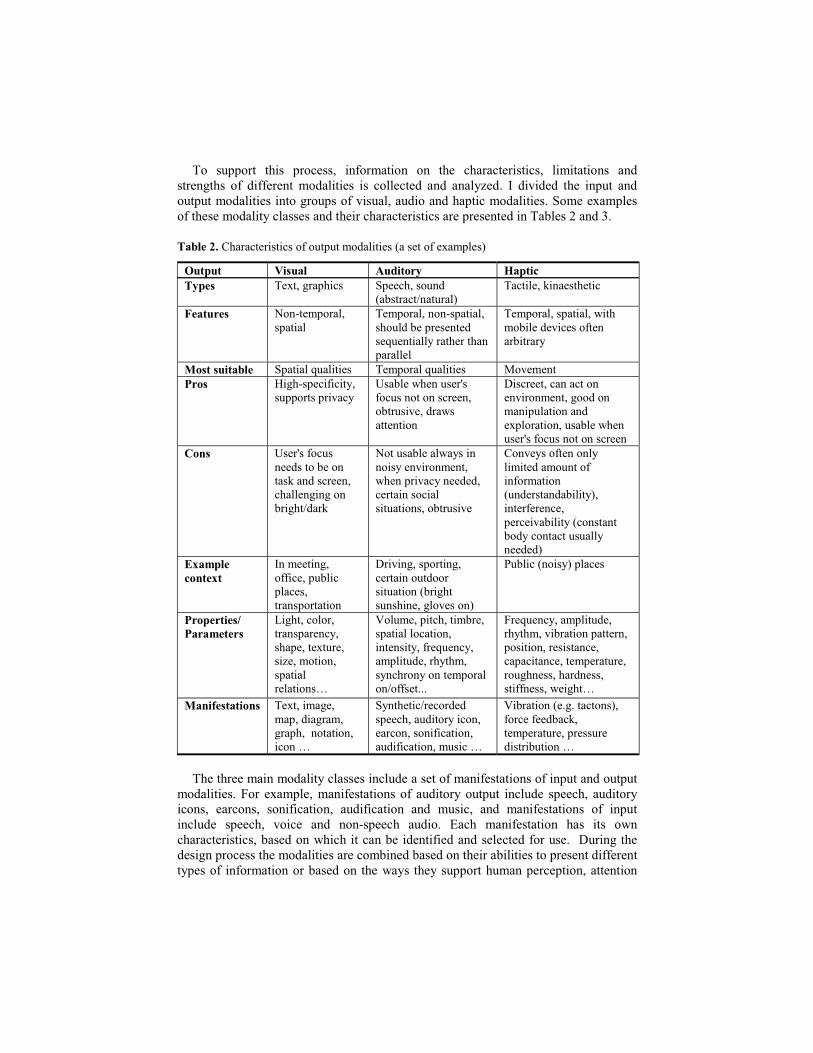
5 � �&'' ��� ����� '� ������ ��. ���� �� �� ���� ����������������� ������ ��� ��(������/���� .� (�..������ (������� ��� � ����(� ��(� ���-8�(�� "� (�,�(�(� ���� ��'&�� ��(� &�'&�� (���������� �/� &'�� .�,��&����&(� ���(���'���� (��������� �����'��� .������� (���-����������(���������������������������'�������(����5�+���=���(�>���
"����������������������� .� &�'&�� (�������B������ .����'��D�
8����� ;����� �������� 5�����"���� 5�����/��'������ �'������� &�(�
B�+������C���&��D�5��������������������
0������� � �#��' �����'������
5�' ����� �#�'�������� &(�+��'�������(���4&�����-�������������'������
5�' �����'������0���� +���(�,����� .������+�����-��
!����������� �'�����4&�������� 5�' ���4&�������� * ,������<��� ��/�#�'���.����-��
�&'' ����'��,��-��E��+��0����&���H��. �&��� �� ���������� +��&��,���(��0��������� ���
9����������������� ����,�� ������/ (� �����'&��� ����(���' ���� ���&��+��0����&���H��. �&��� �� ���������
%��� E���H��. �&�����(��� �+�� ���������(��������������/��/� ��+��/��C(�����
� ��&��+���0�-������ ��-���,�� ������0����'��,��-����(�(����������� �������&��� ���� +��&��,���
� �,�-�� .���� �-�����(�� &��� .���. ���� ��B&�(������(�+���-D�������.��������'�����,�+���-�B� �������+ (-�� ������&�&�-����(�(D��
=�� ����������
"�������/�� ..�����'&+���'�����������' ����� ���
9��,��/���' ����/���������� &�( �����&��� ��B+��/����&��������/ ,��� �D��
�&+���B� ��-D�'������
<���������#<��� �����
��/����� ��������'�����-�����'�������&������8��� �� ����'���������� ��I�
2 &���'��������+�����'����� ���� �����������-��.��4&���-���'��&(�����-�����-���� �-� ����' ��� �C ..��������
!��4&���-���'��&(�����-����,�+���� ��'��������' ���� �����������������'������������'����&����� &/����������(���������..������0��/��I�
!������������� 5�������/����'��(��/����/��'����� ���� ����� ��I�
�-�������C��� �(�(��'�������&(�� �-��� ������� ���� ��.����� ����&(�.����� ���&����I�
2�+���� ��B��/������ ��D��. ����.��(+�������'����&����'����&���(�����+&�� ��I�
�5������������� (���-�����������&(�������� .����.������ ��� .���'&����(� &�'&��
(��������! �� ���'������.������ ��� .� �&(�� �-� &�'&�� ���&(�� �'������ �&(�� �-��� ���� ���� ���� � ��.����� ��� �&(�.����� �� ��(� &����� ��(� ���.������ ��� .� ��'&�����&(�� �'������ , ���� ��(� � �#�'����� �&(� �� 1���� ���.������ �� ���� ���� 0�������������������+���(� ��0������������+���(����.��(���(�������(�. ��&���� �9&���/�����(���/��'� ��������� (������������ +���(�+���(� ���������+�������� �'�������(�..�������-'��� .� ��. ���� �� ��+���(� �� ����0�-�� ���-��&'' ����&���'����'�� ���������� ��

��(� &�(������(��/�� 5����� ��� �� � �/ ��/� 0 ��� �����(� � � ���� ' ���+�� ��(���� ��(�(�� +����� ��� .� (��������
"����:������������������ .���'&�� (�������B������ .����'��D�
����� ;����� �������� !��� ���"���� ������,��� ���
�/���G�'� ����-����� ����
�'������� &�(�B, ����G�� �#�'�����D�
%���&���� �� ���
0������� �&�����-����-�. ���'����,����'&���
5�' ��� 5-'���-��'������
!����������� �'�����4&�������� 5�' ���4&�������� * ,������<��� 5���� /����
�&���+����'����-�. ��'����,����'&���
E��+��0�������(��+&�-C&��,���+�C&����+���' ���+��� ����������0���������0���������B�&�����-D�� ��,���+���' ���+��� ����������0������(�,����0��������.&�������0�-��
��������'������(�'��(�� ���-'������&(����������'&����(�(���������'&��� ���
%��� � ���+�������� �����,����'&��-�������(����� /���� ������+��0 �������/��+-��/���� �(��� ����
� ��&��+������ �����'��,��-�� ��������
��-�����(�� &��� .�� ��� �/���&�������' ���+��B������/D��&�&�-����(�� ����'��������'� ��B3J�"3J%D��'�-������ ������� ���'&��(�,������� .�������(�(��
=�� ����������
3������/����������''� �����/�(�,�����
9��,��/��0 ����/�0�������(���
"��&(���� &�� ����&'' ����/�&����0����B�D��������,��/�/ ,��� ���( ��/��' ������������� �����/��'�����
!������������� �� ����-��'�����������,�� �������/�8����/���� ,����I�
�'�������� /���� ����, ���C�'��������� /���� ����� �#�'�����B0������/���&��/��������/����''��/����''��/DI�
%���&���B�-+ ������ �����(��������'��� ���D���'���B���(0�����/��/���&����(��0��/DI�
�5 � �&������� ��� &/�� �� ��'�� ���'��� ��� &�� � ���(��� �� ��,�/��� �� �-����
��. ���/� �� (��,��� �+ &�� ��� +������ �� ���� � �(�� 5��� '���� 0�-� � � '������� �������. ���� �� ��� � � ��� ����� ���� ���� �� B(������� �'����� ��. ���� �D�0���� (�����'�� ��B��/&������ ��. ���� �D�� � 5 � ������ ���� �&���+�� (������� . �� ����� ���&��� ��� ����� ��������(���������� ��/ ����� &(�+����&(��(���� ���(������5���&�������(��,��/���������(����(��-������� ��&'��(���(������ /����,�� �(�����(�&���5�������/ �� .�������. ���� �� '��������� �� ��� � � (��0� ������� �� � � ���� +������� 5����� ��'����� .� �������&��� ���&//����������&(� #+���(���������� ���� &(�+��� ���(���(���(�������������� ���� &(����(����������.. ���.� �����&�������' ���+���"��'��������� ��������������� ������������� ���� &(�+����� �/-��&'' ���(�+-������-���K�����/���+�����(� ���-����

��������(��".�����&�������� �����������������(����������� ��+-���������������� &(�� ��+����-�� ����� ����,�� ������ ������ ������(����/� ����&��� .��&(� ��3����� ��� � � ����� (��������������� &�'&��0 &(�'� +�+-�� ��+��.�����.�����&����( ���� ����,����� ����& &�� + (-� � ������ 0���� ���� (�,����� 0���� +��/��� �&������� � &(� �&//���� (�.-��/�����,��&����'��������� ��� �������������������� �����0������4&����/�'����� ������������&��� ���
/&���������������������1
*-� / �� ��� � � (�,���� �� '� ����� ����� ��� �&���+�� . �� ���� ������ �� .� ��� '���� (���-� �� � +����� �� .� (������� �&'' ����/� ��������� �� ��� (�..������ �,��-(�-����&��� ��� ��� +��� ��(� '��,���,�� ��,�� ������� "� �� ��&(-��/� ���� ����������������������/���� ��(� 0���������� .� (�..������ (������� ��(� &��� ����� ��. ���� �� (&���/���������� ��(���/��'� �������
���� .� ���� ���� �����/��� .� ����� 0 ��� ��� � � �������� ���� � ��������-� ��(�&�(������(�+���-� .� ���� ��������� �� 0���� �(�'���/� � � (�..������ ���&��� ��� ���������&�-� �� �&� �����-�� � 5 � �����,�� ������ ���� �-���� �� &(� �&'' ��� ���� &���� ����������/���(����������/���������� (�� .�������������(�.&���� ����-�+-�� &'��/����� ��������� �� � � ���� &���6�� �������/� ����� ��(� ��'������ ���� 5��� '���� 0�-�� � ��(�'�� ���� ��������� �� �� &(� +�� ����.&-� ��' ��(� � � ������� '���&��+��&�� (����������� ���
!&�&��� ��������� 4&���� ��� ���&(�7� � 0� � � ������ (������� +���� �&���(� . �� ����'�-����� ��,�� ������ ���� &���6�� � /����,�� � ������ ��(� ���� '��������� �� / ���� ��(�� 0�� �(�.���� &�'&�� (�������� ���������-�0 ��������� �-�0��������&���6����'&�L��
"�� ����� 0 ���� '� "� 0 &(� ���� � � (���&��� �+ &�� ���� �&���+�� �''� ������ . ��(���/���/� &�� (�� ��������� �� . �� +��� ��(� '��,���,�� ��,�� ������� � 0� � �.��(�� ��(� ���-8�� ���� ��-� ���&��� �..�����/� ���� ������ �� .� '���� ��������� �� (������� �������/��/���,�� �����L�� 0� � ����'� ���� ��������� ��� ����������0��������/��/���(� (�.-��/����� (���������� �(��/�� �����(�..���������&��� ��L�
2���������
;�� �.��8����� 9��� � ++��� 2��� � � 0����� 9�7� F� &��.��(� ��� � ��� .���0 ��� . �� ��. ���� ��,��&��8��� ��� "�7��� ��� .� ����F&�������� �-' ��&� �� "�. ���� ��,��&��8��� ��� , �=���''��$ ##??��F&��������� '&����� ����-�B=��>D�
=�������1���7�F�5�� � -� .�2��&��8��� ��5�����4&���&���/�����9������������.�������* (���"�7� �� ��� .� ���� "111� �-' ��&� �� "�. ���� �� 2��&��8��� ��� ''�� ?A## $�� "111� ���������0�J ���B=���D�
>�����(����M���*������-�� N�7� 5��� ���&��&��� .� ���� ��. ���� ��,��&��8��� ��(���/�� �'����� "�7��� ��� .�����;AA �"111��-' ��&� ��"�. ���� ��2��&��8��� ���''��A=##AA��"111����������0�J ���B;AA D�� �
������- ���9�7�5���� �� .���������-��������-�����(���/���"���������/�0����� '&������, �����''��;�=##;=>��1��,���������������0�J ���B;AA=D�
$��3���������� ����3������ *�7� 5 0��(�� �� ��� �-� .� &�� (�� ��������� ��� "�7� �� ��� .� ����FFF"�3 ���� '� ��*&�� (��"�������� ���FFF"�������C�5���*"5�������B;AA;D�

?�� ��������� ����7� * (���-� 5�� �-7� �&'' ����/� *&�� (�� "����.���� 9���/��� "�7� 1��"*�3 ���� '� �� *&�� (�� �&��#� '&���� "�������� ��� ''�;>##=>�� 1��"*� 3 ���� '���' ����B;AA>D��
���&���..���F�%���M&����0�������������� N�1�7�F���� (���(��(,�� �� � � . ��&���(���&���������.����(���/��� "�������� ���N &���� .��&��#� '&������&(�����, ��?���''��> $##>A=��1��,���������������0�J ���B=��?D�
@��2��������!�����/�-����7�F�!���0 ��� . �� ����� +����� �� ��(�����������8��� �� .��&�'&��* (�������� "�7� "��������,�� �-����7� 9���/��� �'���.����� ��� ��(� 2���.����� �7� ���"�������� ���3 ���� '��=���7���,���(���'�����''��>$##$����'���/�������(�+��/�B=��;D�
A�� � &����&�� ���� ������� J��� 2�������� !��� ��8�/������ 9�7� F� .���0 ��� . �� ���� �����/����&�� (��'��������� �� .���. ���� �����/����� ������/��, ��@?��''��>?A?##> ;>��1��,���������������0�J ���B=��?D�
;������,������*��������N������� ���N�F����,�����������������5������&���������������7�%&�(������. ��&�� (��&���������.����(���/���� &������ ��� .�����F�*��, ��� ��''��$ ##$A��F�*����0�J ���B=���D���
;;�� 3���,����� ��F�%��� 9����(����/����� N����� �,��+������ ��N�7� "�������� �� .� //��7� �� (���/��.���0 ���� �� &'������ ����(�.&���� ����� &/��.��(+������(�.��(. �0��(��"�7��� ��� .�����=���� � �.������� �� 9���/���/� ���������,�� �-����7� '� �������� '���������� ��� (��� ��(�������4&����''��; ##;@���F�*����0�J ���B=���D� �
;=���,����������� &�� ��������&��. �(����7�3����( �0�����������&�� (�-L7�� /����,�� �(���(�&�� (�� � &������ �� '��������� "�7� �� ��� .� ���� ?��� ��������� ��� � �.������� ��*&�� (�������.������''��;=A##;>?��F�*����0�J ���B=���D�
;>���,����������� &�� �������5 � ������O�� �������&��. �(������3��� ���*���������������7�5 0��(� �� ��� �-� .� �/���8�(� &�� (�� ����/���� �� '�������� (&���/� �&��#� '&������������� ���"�7��� ��� .�����$������������ ���� �.������� ��*&�� (�������.������''����##$;��F�*����0�J ���B=��>D�
;�������,�� ,���J���,���9������������� ���F�7�5 0��(����E��.��(�M� 0�(/�#����(�F''� ����� �* (���-��� �����"�K�*�%�=�� �3 ���� '� ��*&�� (���&�'&��%������� ���''��$##;$���5"5�3 ���� '��� ���(��/���������B=�� D�
;$�� ���+����� M�2�7� *�#5�� � -7� �� � ���'�&�� .���0 ��� . �� (���/���/� &��#���� �-�(��'�-���"�7��� ��� .�1�/����"�������� ���� �.������� ��"�. ���� ��2��&������ ���''��??$##? ���"111����������0�J ���B=���D�
;?�� ������ ������ *������� 9��� �����.�� ���� %��,���#M��&�� ��7� E���/� �� ��� ������� &���(������ � -�.���0 ����N &���� ��1(&���� ������ &��������� '&���/�BN1�"�D��, ��;��''��;##==��F�*����0�J ���B=��;D�
; ��!� ������9�*�7�5���9���/���'���� .�"����.��������0���#������(���+ ��� ������5���������&+����� ���B;AA=D�
;@���&���..���F���3��������7�*&���(���(���/��. ������0�+��"�51�F�5�=��>�5&� ����B=��>D�;A���+��� ,����P���F+������ N��� � ������,����9�7�E��,����� �������+���-���� ��&�� (��(���/��
���&����� &������ ��� .�����F�*��2 ��$���''��@>##@@��F�*����0�J ���B=�� D� �=����+��� ,����P���������,����9�7�* (���/�&�� (���&��#� '&������������� ���� '&�����
, ��> ��''��?$## =��"111����������0�J ���B=���D�� �=;�� 3�������� ��9�7� *&��'�� ��� &����� ��(� '��. ������ '��(���� ��� 5�� ������� "��&��� ���
1�/ � �������������2 ��>��''��;$A##; ��5�- ����(�!��������� �( ��B=��$D�� �

Performance of Ajax on Mobile Devices:A Snapshot of Current Progress
Mikko Pervila and Jussi Kangasharju
Department of Computer Science,P.O. box 68 (Gustaf Hallstromin katu 2b),FI-00014 University of Helsinki, Finland{pervila,jakangas}@cs.helsinki.fi
http://www.cs.helsinki.fi/
Abstract. Ajax applications have become ubiquitous on the traditional,desktop web and are slowly making their way into mobile versions of webpages. In this paper, we present the results from an extensive study ofAjax on mobile devices. Our emphasis is on evaluating the presenta-tion capability and measuring the performance of five mobile browserson three mobile devices, the Apple iPhone and Nokia models N95 andN800. The evaluation and performance measurements are done throughsubjective user evaluation and user-experienced response times. Our re-sults show that it is possible to have Ajax applications behave correctlyeven on mobile devices, but that the performance leaves a lot to be de-sired. Initial loading times of applications in our tests were almost alwaysover 5 seconds, with times over 20 seconds also appearing often. Contentreordering techniques can help overcome the slow loading times.
1 Introduction
For the first time ever, users are voluntarily downgrading to browsers with fewerfeatures than the earlier generation. These mobile browsers feature less displayarea, less processing power, lower network bandwidth but increased latency, andthe completely new factor of a limited battery lifetime. Simultaneously, the useof techniques like Ajax [1] involve browser capabilities that have become commonenough only during the past few years. A natural question is then whether mobiledevices can support Ajax to the extent needed by the applications.
In this article we focus on handheld devices. More specifically, our tests con-centrate on the browser performance of the least capable hardware platformsthat still are able to support Ajax. This subset is called the converged mobiledevices, and it is loosely defined as the set of devices that combine features frommobile phones, personal digital assistants (PDA), cameras, tablet computers,and other electronic aids. 80 million such devices were sold only in 2006 [3].
The contribution of this paper is a thorough evaluation of a large number ofAjax applications on 3 different converged devices using 5 different browsers inall. Our evaluation is based on (i) how correctly the browser is able to renderthe applications, and (ii) how long does it take to render the application.

2 The Overview of Ajax
Defining an Ajax application is a somewhat ambiguous task. When an applica-tion is said ”to be Ajax” or to ”use Ajax”, its implementation depends uponlower-level components or technologies, some of which may be validated againstexisting specifications. For example, pages may be written in (X)HTML andCSS, JavaScript may use the W3C DOM to manipulate partial redraws, andXMLHttpRequest (XHR) objects may be chosen as the asynchronous communi-cation channel. As Ajax depends on the underlying technologies, differences intheir implementation cause variation in the execution of the applications.
Ajax components are selected for different purposes. Their tasks can be di-vided into the layers describing the content, presentation, and behavior of theweb application [4]. Refactoring and updates are simplified by also separating thecode in different files. The division may be emphasized by writing the applicationgradually, beginning from the content and continuing through the presentationto its behavior. This iterative approach is labeled progressive enhancement [5],and it is very closely related to graceful degradation [6]. Common to both is theidea that the browser can ”decide” which parts of the application to displayby simply ignoring those layers that the browser does not support. On mobiledevices, progressive enhancement may be the better solution, since it tries toguarantee that even the most limited viewers are served a working solution.
If persistent connections are unavailable, each file request will yield its ownTCP handshake, which becomes noticeable on high-latency links [7]. The benefitsof content separation have to be re-evaluated in mobile environments where thehigh latency is typical. Placing layers into a single file may be the better choice,and it also allows for progressive enhancement. An example of this is the Googledefault search page, which embeds both script and styles into a single file.
The component technologies of Ajax may be further exchanged with alter-native solutions. For example, in closed environments the client-side scriptinglanguage could be exchanged to a proprietary choice. Similar alternatives arethe use of plain (X)HTML in lieu of more processor-intesive XML parsing, andthe use of the Bayeux protocol [9] (a.k.a. Comet [8]) to enable content pushingfrom the server. A specially notable alternative is the Hidden IFrame technique,which has enjoyed more wide-spread browser support than XHR objects.
3 Measuring Mobile Devices
Wilton-Jones has performed meticulous application measurements for a suiteof desktop browsers [10], noting significant variance between different browserand platform combinations. Further, he has noted that browser differences makesome measurement techniques unreliable [11]. For example, using JavaScript tomeasure JavaScript may yield inconsistent results due to a different ordering ofprocessing and presentation phases among the compared browsers.
Following the emphasis on practical testing set by Lilja [12], the measure-ments in this article try to avoid synthetic benchmarks. The benchmarked mobile

Table 1. Evaluated device and browser combinations
Device Browser
Nokia N800 OperaNokia N800 Mozilla-based (microb)Nokia N95 Opera (S60OM)Nokia N95 S60 Web Browser (S60WB)Apple iPhone Safari
devices are commercial, off-the shelf (COTS) products, not samples or devel-opment units. No modifications have been made to the hardware or their useragents, unless explicitly specified otherwise. All of the device measurements wererun without an attached charger to accommodate for power-saving features.
The selected browsers are the Opera- and Mozilla-based (microb) browserson the Nokia N800 Internet Tablet (Internet Tablet OS 2007), Opera Mobilev8.65 (S60OM) and the S60 Web Browser (S60WB) on the Nokia N95 (firmware12.0.013), and the Safari browser on the Apple iPhone (firmware v1.0.2). All ofthe browsers have passed initial testing of their basic Ajax functionality. Thismeans that using short example programs, the browsers have been verified tosupport the component technologies of Ajax. The devices and browsers are sum-marized in Table 1.
3.1 Grading and Results
We measured the browsers and devices using two metrics. First, we evaluatedthe capability of the browser to render the application correctly. Second, wemeasured the time it took to render the application.
For measuring the capability issues, we had each browser render the ap-plication and noted any possible defects in the displayed application. Note thatapplication speed is not considered in the grade, but may be noted in the analysis(if relevant). All defects are noted and explained in the corresponding analyses.Based on the defects, we gave each browser a grade on a scale from A to D,explained as follows.
A represents the highest possible grade, with no defects detected during use.B represents minor problems with the layout, or missing functionality.C represents major problems that clearly are a hindrance to the user.D represents a failure in the workflow, meaning that the user does not receive
the requested service from the application
It should be emphasized that the grading only refers to the ability of thebrowser to render the application correctly. Comparing rendering speeds is onlysensible with browsers obtaining similar grades and fast rendering times shouldnot be taken as indicators of performance. After all, the fastest way to render apage is to display a blank page.

3.2 Measurement Method
After the grading above, the application performance was measured by startingit ten times and using the initial loading time as a metric. With Ajax, the sub-sequent requests are regularly below the measurement method, even on mobiledevices. The loading time reflects user-perceived wall clock time, measured usinga stopwatch. Although this method limits the precision to 1/10 of a second atbest, it is fully adequate to represent human perception of the waiting time.
In slow networks the transmission time can dominate the overall wait timefor a page load [13]. We attempted to eliminate the effect of the network andconcentrate purely on browser performance. In all the cases, the network con-nection is a WLAN, with the access point connected to a very high-bandwidth,low latency network. All applications were accessed through a plain XHTMLlink page so that the WLAN connection was set up during the first request, notthe measured one. Our tests showed that the connection setup time may indeedbe much longer than the time taken to load an application.
The results are separated into cached and cache-cleared categories to cal-culate an approximation of the upper and lower bound of the perceived delay.In the cache-cleared category, the browser cache is cleared between each test,using the functionality offered by the browser. To further minimize the effect ofmemory caches, on the N95 and N800 the browsers are measured by interleav-ing the tests between browsers. On the iPhone, memory caches were flushed byexecuting other applications between iterations.
4 Evaluations and Benchmarks
Due to space constraints, we only present a subset of our results here. The fullresults and test notes are also available [2]. Out of the 20 applications evaluated,we present 7 in this article, with extensive benchmark results on two cases, shortreviews of three, and key conclusions for the remaining two cases.
4.1 Dojo Email
The demo email application [20] presented by the Dojo project was one of thefirst candidates selected for these measurements. Unfortunately, the applicationwas removed from the project’s web site just days before the testing phase begun.Therefore, these results have been run from our department’s main web server,against the application provided by version 0.9.0 of Dojo’s installation package.
Figure 1 shows the results for Dojo Email. The figure on the left shows theresults for the “cached” case and the figure on the right shows the “cache cleared”case, as described above. Each of the 10 iterations is shown as a point and weshow 5 lines, one for each of the device/browser combinations. The y-axis on thefigures shows the measured time and the legend shows the grade obtained by thebrowser. As mentioned in Section 3.1, the grade and time should be consideredtogether when evaluating the behavior and performance of a browser.

Fig. 1. Dojo Email Application, ../dojo-release-0.9.0/dijit/demos/mail.html
In case of Dojo Email, most of the browsers had problems with this applica-tion. Both the N95 browsers failed to display the message header list, or indeedmuch of the layout at all. In addition, all of the buttons remained unresponsive.The microb browser could not perform automatic completion on form fields andit felt quite sluggish in use. microb also crashed twice during the cached mea-surements, during iterations 7 and 9. This is quite probably indicative of leakingmemory, as no crashes were detected during the cache-cleared measurement.microb had problems just loading the application, as four iterations had to beredone by refreshing or clearing the cache and then retrying twice, in order torepopulate the cache. The N800 Opera displayed more severe problems with themessage header lists, bordering on an overall failure. In contrast to it, Safari onthe Apple iPhone presented the application correctly after corrupting the layoutonce. Despite rigorous retrying, the problem could not be repeated.
Curiously, Safari exhibits regular variation of the values in the cached mea-surement, prominently visible in Fig.1. Every second fetch of cached contenttakes significantly longer than the previous. The same phenomenon was visiblein the other tests. As our methodology is black box -oriented, further diagnosisbased on these measurements may be impossible. The most credible speculationis that Safari might check for cache freshness every second time, ignoring the ex-piration headers of HTTP. This suggestion might not be entirely insensible, sincecache freshness has been noted as a problematic area for browsers in general.
4.2 YTV Journey Planner for Cycling
The Journey Planner for Cycling [14] provides a pathfinder algorithm that plansnear-optimal cycling routes between locations in the greater Helsinki area. Thefunctionality is somewhat complex, as both selectable way points and a dy-

namically generated, scalable route image are served to the user. Our resultsindicated that this application has been well tested with the predicted field ofclient browsers, with all browsers rendering it well.
Safari makes the exception to this rule, since it crashes consistently each timethe application is accessed. Despite these problems, Safari must be noted for itsoverall stability, as this is the only application that did cause Safari to crash.Simultaneously, it must also be repeated to the application’s benefit that theiPhone had not yet been released in Europe at the time of testing. Therefore,the Journey Planner had probably not yet been tested with the Safari browser.
In addition to Safari, the S60WB crashed once during iteration five of thecached measurement. Outside of the crash, the S60WB’s presentation is quitegood. The arrow images used to move the map can not be accessed, but clickingon the way points centers the map correctly. Not all map levels seem to displayquite as intended, though. Automatic text completion seems to work, but onlyif the user clicks outside the input field containing the partial search term.
S60OM behaves similarly, although it has more problems with the text com-pletion. Due to the way Opera uses its selector field, the browser skips to theend of the list when it is scrolled. This means that only the last seven addressesare selectable. Using the Journey Planner on either of the N95 browsers requiressome zooming, as the design is based on a fixed layout. Opera on the N800 re-sembles its N95 version, but all the list elements are now selectable thanks tothe stylus-based input. Strangely, the arrow keys still refuse to work.
Ignoring the single network glitch encountered during iteration five, microbmanaged a fully functional presentation. The cost is high, though: microb wasapproximately a third slower than the N95 browsers, and more than twice as slowas Opera on the same device. The S60OM was the fastest browser in both of themeasurements, but its selector field is certainly problematic in some applications.Responsiveness is noticeably improved by presenting the user with the inputfields as early as possible. The benchmarks in Fig.2 reflect this: the measurementstops when the user may start to input data.
4.3 Acme Auctions
Direct Web Remoting (DWR) is a toolkit designed as the client-side counterpartfor server-side Java applications. The DWR toolkit also focuses on Reverse Ajax,meaning the category of push techniques that includes Comet [8]. Therefore, ahybrid application was selected for this test: the Acme Auctions demonstrationsite [15] designed by Webtide, the main developers of the open-sourced Javacontainer Jetty. In addition to DWR and Jetty, the auction application containsfeatures from Apache’s ActiveMQ Ajax. The purpose of this amalgam is todemonstrate the use of a Comet-style push technique.
Both Operas failed the capability test because the login button was inacces-sible from their user interface. More interestingly, Comet works in each of theother mobile browsers. The S60WB had some minor difficulties positioning thelater-arriving results properly, and major issues with unpredictable crashing. Itsscreen saver also disconnected the open TCP connection.

Fig. 2. YTV Journey Planner for Cycling, http://kevytliikenne.ytv.fi/.
Despite these difficulties, in the three functioning browsers, the passive HTTPconnection was kept alive for 10 minutes. Additional testing on the N800 showedthat connections remained open after 30 minutes. All three platforms mightwell be able to keep the TCP connection alive indefinitely. Further, it shouldbe emphasized that these tests were run through a network address translation(NAT) device. The capability evaluation has also been successfully repeated witha second N800 device and a separate, NAT-operated network.
4.4 XML 2006 Event Schedule
The XML 2006 event schedule [16] allows users to list currently active programitems, combined with color-coded information on upcoming and already passeditems. Users may enter comments on the program items, and the written text issaved through XHR calls. It is clear that mobile testing on this application hasbeen done well. Every single browser was able to present the application withno defects detected. While uniformly excellent support is encouraging from adesigner’s perspective, it leaves little to be analyzed. Fortunately, the measuredvalues provide additional insight. All of the browsers are able to process theHTML-formatted XHR data without incidents, except the S60WB.
Whereas the other browsers maintained loading times below five secondsboth with and without caching, the S60WB’s results were about 20 seconds.The browser seems to have serious performance problems parsing the table-like CSS layout. Further, the virtually nonexistent difference between the twomeasurement methods shows that S60WB’s poor performance has nothing to dowith caching. The exhibited slowness is fortunately not totally disruptive for theuser. While the page loads, the user may continue viewing the already parsedevent information. In fact, the loading of new items is visible by continuouslyscrolling the page downwards.

Fig. 3. Flickr Image Gallery, http://www.Flickr.com/.
4.5 Flickr
The target for the Flickr [17] benchmark was the loading of a single picture,together with the manipulation interface provided by the image gallery. Becausewe are interested in the performance of the interface, and not the actual imagepresented, these measurements target a dummy image consisting of a single blackpixel on a white background, with a size of 817 bytes.
Overall, Flickr was well supported by the browsers, most probably due toextensive testing. Only minor defects were encountered. In Fig.3, we see strongcorrelation between rendering an application correctly and the initial loadingtime. While this alternative may intuitively seem the obvious one, it shouldbe noted that the Journey Planner (Fig.2) demonstrated the exact oppositebehavior. These results show that it is possible for a browser to combine bothprecision and speed, but it may require skillful optimization.
4.6 Google Maps
Google uses graceful degradation extensively, which made testing hard. Al-though, as our tests indicate, both of the S60 browsers are capable of renderingAjax applications, Google Maps [18] only offers a very reduced version of theapplication for the S60WB, while giving others the full version.
Inconsistently, the degraded version also returns very dissimilar service. Thelimited version includes no Ajax functionality, but more importantly it also re-turns different result sets. Conversely, Google Maps on the iPhone is able tointeract with the locally installed widget. Search results are passed on to thewidget and visualized there instead of the Safari browser window. This featureis currently quite unique, but illustrates the benefits of progressive enhancement.

4.7 Google Suggest
Google Suggest [19] offers, in theory, extreme benefits for mobile browsers. Theapplications’ ability to predict search terms by suggesting strings matching thealready entered portion can greatly enhance the overall input speed of the user.Because the sheer physical size of the mobile devices forces the user to use lessoptimal input methods, Suggest is a very interesting choice for an often-usedfunctionality, searching for web sites.
Our evaluation showed that despite Suggest’s simplicity, some browsers hadtrouble presenting all of its functionality. Browser detection techniques causeda graceful degradation into the non-Ajax Google Search for S60WB. Bypassingthe detection phase yielded multiple defects in rendering. S60OM had troubleselecting the suggested results, whereas the N800 browsers did not execute theintended interface events. After some testing, the backspace key was discoveredto be the solution: pressing it returned the expected suggestions.
5 Conclusion
In this paper, we have evaluated the behavior and performance of several Ajaxapplications on different device and browser combinations. Our results are in-formative for both browser and toolkit developers, as well as web-based userinterface designers in general. The following list summarizes the key conclusions.
– Content reordering techniques are definitely helpful for the initially higherloading times of mobile Ajax.
– Graceful degradation based on browser detection can lead to serving usersunnecessarily low common denominators of the application.
– Progressive enhancement techniques should avoid coarse decisions (i.e., JS orno JS). Employing feature (object) detection maintains good compatibility.
– Many browsers gain speed when (erroneously) ignoring parts of the programlogic. As a rule, more exact presentations generally take longer to present.
– Despite this, it is possible for a browser to be both fast and exact. Adequatetesting and performance tuning is vital for mobile browser performance.
Overall, our results show that there are considerable differences between thebehavior of the applications on different browsers, but they also show that it ispossible to implement fully functional Ajax applications for mobile devices. Theuser-perceived performance of the applications varied between acceptable andslow, but was in most cases tolerable. Our results are intended as a snapshot ofthe current state of Ajax development on mobile devices and they clearly confirmAjax on mobile devices is feasible, if done correctly. We feel that for buildingcompatible Ajax applications, developing adequate toolkits is a key element;mobile manufacturers would do well to support such endeavours.
Acknowledgments. The original instructor, Kimmo Raatikainen must be spe-cially acknowledged for the innovation and naming of the M.Sc. thesis. Thus, hisideas have carried on to this article. Other people have also offered their help;they have been listed in the corresponding section of the full thesis.

References
1. Garrett, J. J.: Ajax: A New Approach to Web Applications. Adaptive Path es-say archives, Feb. 2005, http://www.adaptivepath.com/publications/essays/
archives/000385.php. [6.3.2008]2. Pervila, M.: Performance of Ajax Applications on Mobile Devices. M.Sc. Thesis,
Department of Computer Science, University of Helsinki. Also available from http:
//www.cs.helsinki.fi/u/pervila/Gradu/ (2008)3. IDC: Converged Mobile Device Market Surges Ahead on 42% Growth in 2006, Ac-
cording to IDC. IDC Press Release, 26.2.2007, http://www.idc.com/getdoc.jsp?containerId=prUS20578607. [1.1.2008]
4. Yank, K.: Simply JavaScript: The Three Layers of the Web. SitePoint,JavaScript & Ajax Tutorials, 27.7.2007, http://www.sitepoint.com/article/
simply-javascript/. [6.3.2008]5. Champeon, S.: Progressive Enhancement and the Future of Web Design. Web-
monkey, 18.6.2003, http://www.webmonkey.com/webmonkey/03/21/index3a.html?tw=design. [6.3.2008]
6. Olsson, T.: Graceful Degradation & Progressive Enhancement.Accessites. org, 6.2.2007, http://accessites.org/site/2007/02/
graceful-degradation-progressive-enhancement/. [6.3.2008]7. Souders, S.: High Performance Web Sites, http://stevesouders.com/hpws/.
[6.3.2008]8. Russell, A.: Comet: Low Latency Data for the Browser. Continuing Intermittent
Incoherency, 23.3.2006, http://alex.dojotoolkit.org/?p=545. [6.3.2008]9. Russell, A., et al.: Bayeux Protocol – Bayeux 1.0draft0. Dojo Foundation, 2007,
http://svn.xantus.org/shortbus/trunk/bayeux/bayeux.html. [6.3.2008]10. Wilton-Jones, M.: Browser speed comparisons, http://www.howtocreate.co.uk/
browserSpeed.html. [6.3.2008]11. Wilton-Jones, M.: Safari and page load timing. http://www.howtocreate.co.uk/
safaribenchmarks.html. [6.3.2008]12. Lilja, D. J.: Measuring computer performance: A practitioner’s guide. Cambridge
University Press, Cambridge, U.K., 2000.13. Laukkanen, M., Helin, H.: Web Services in Wireless Networks—What Happened
to the Performance? Proc. International Conference on Web Services (ICWS’03),Las Vegas, Nevada, USA, June 2003, pages 278-284.
14. Paakaupunkiseudun yhteistyovaltuuskunta (YTV): Journey Planner for Cycling,http://kevytliikenne.ytv.fi/?lang=en. [6.3.2008]
15. Webtide: Acme Auctions auction demonstration site, http://www.webtide.com/auctiondemo/. [6.3.2008]
16. PavingWays: XML 2006 Events, Mobile Event Finder, http://pwmwa.com/xml06/.[6.3.2008]
17. Yahoo! Inc.: Flickr, http://www.flickr.com/. [6.3.2008]18. Google: Google Maps, http://maps.google.com/. [6.3.2008]19. Google: Google Suggest, http://www.google.com/webhp?complete=1\&hl=en.
[6.3.2008]20. Dojo: Dijit Mail Demo, http://www.dojotoolkit.org/demos/email-using-1-0.
[6.3.2008]

Workshop on
Context-Awareness for Self-Managing Systems (CASEMANS 2008)
ORGANIZERS: Waltenegus Dargie (Technical University of Dresden, Germany)
Bruno Klauser (Cisco Systems, Switzerland)

The following CASEMANS 2008 workshop papers can be found in a proceedings published by the ACM.
A Fair and Energy‐Efficient Topology Control Protocol for Wireless Sensor Networks Rami Mochaourab & Waltenegus Dargie Context‐Aware Routing in Wireless Mesh Networks Peizhao Hu, Ricky Robinson, Marius Portmann & Jadwiga Indulska Localized Power‐Aware Routing in Linear Wireless Sensor Networks Marco Zimmerling, Waltenegus Dargie & Johnathan Reason A ZigBee‐based Sensor Node for Tracking People's Locations Tsutomu Terada & Satoshi Takahashi

Workshop on
Context-Aware Pervasive Communities: Infrastructures, Services and Applications (CAPC 2008)
ORGANIZERS: Seng Wai Loke (La Trobe University, Australia)
Shonali Krishnaswany (Monash University, Australia)
Andry Rakotonirainy (Queensland University of Technology, Australia)

PREFACE The pervasive computing vision calls for computation, sensing and networking to be ubiquitous, whether with users or embedded into everyday living environments. A result of ubiquitous networking and computational ability is to form digital boundaries around entities. As such, communities, whether geographically transcending or based at a place, formed with a priori agreements or ad hoc via simply a collocation of interacting devices members, transient or long-living, can form a digital matrix or space in which its participants interact, provide services or utilize services. Participants of such communities may be aware of the context and situations of individuals, the collective, or subgroups. Groups may be aware of other groups, or individuals being aware of groups or groups being aware of particular individuals. The levels of awareness, what one wants others to be aware of and what one wants to be aware of concerning others varies from application to application. Standardized techniques and protocols are needed to control such awareness as well as to manage such awareness, e.g., a standardized manner for a user (or an application on the user's mobile device) to access additional context information available from the surrounding infrastructure from the mobile device. Also, such context information should be shareable and understandable, perhaps based on underlying ontologies. In general, standardizing interfaces to place-based virtual communities can encourage widespread deployment and global scale roaming applications. Such awareness aids in forming service ecologies within a locality and helps processes, be it business processes, governmental processes, or tasks and processes in everyday living. These processes can be streamlined in the context of formed communities, or be dynamically tailored according to contexts. The workshop aimed to provide a forum, bringing together computing researchers and practitioners to discuss key enabling technologies, technical challenges, solutions, and applications for context-aware communities and processes. We have seven papers accepted for presentation - all submissions were peer-reviewed by at least two reviewers. We would like to thank members of the program committee: Patrick Brezillon, University Paris VI Anind Dey, Carnegie Mellon University Mohamed Gaber, CSIRO Jadwiga Indulska, The University of Queensland Karen Henricksen , NICTA, Australia Judy Kay, University of Sydney, Australia Bob Kummerfeld, University of Sydney, Australia Chris Ling, Monash University Hongen Lu, La Trobe University, Australia

Chris Lueg, University of Tasmania Evi Syukur , Monash University, Australia Bruce Thomas, University of South Australia, Australia Torab Torabi , La Trobe University, Australia Ryan Wishart, NICTA, Australia We also had the privilege of Professor Tim Kindberg as the keynote speaker. Workshop Co-Chairs, Seng Loke, Shonali Krishnaswamy, Andry Rakotonirainy

A Systematic Approach to Modeling and Verifying Context-Aware Services in SOAs
Dhaminda Abeywickrama, Sita Ramakrishnan Clayton School of Information Technology, Monash University, Australia {Dhaminda.Abeywickrama, Sita.Ramakrishnan}@infotech.monash.edu.au
Abstract
There has been significant recent interest within the pervasive computing community for representing context-aware services at various stages of the software life cycle. However, most of these efforts have concentrated on the design and implementation stages. Little work has been done at the software architectural level or during requirements engineering. This paper addresses our current efforts on a systematic approach for modeling and verifying context-aware services and their compositions in service-oriented software architectures. 1. Introduction
Context-aware pervasive computing is a study of pervasive computer systems that are aware of context and adapt to changes of context automatically. Context-aware pervasive systems have a wide range of applications which includes a relatively new service-oriented paradigm known as context-aware services. Ubiquitous environments facilitate the collection of information from various data sources in order to aggregate the context of entities such as users, places or objects. The context obtained from these sources can be used to automatically adapt a service’s behavior or the content it processes to the context of one or several parameters of a target entity in a transparent way, resulting in context-aware services [1]. With the proliferation of ubiquitous computing devices and mobile internet, it is envisaged that future context-aware services will be large-scale and operate at an inter-organizational level, with an increasing number of actors and constraints involved [2]. Therefore, designing and implementing context-aware services will be a complex task. There has been significant recent interest within the pervasive computing community in representing context-aware services at various stages of the software life cycle. However,
most of these approaches have concentrated on the design or implementation stages [3, 4] whilst little work has been done at the software architectural level or during requirements engineering process.
Use of models has been a popular approach used by engineers when constructing complex systems. Behavior modeling and analysis have been successfully used by software engineers to uncover errors of concurrent and distributed systems at design time. The concrete mathematical foundations exposed by behavioral models facilitate rigorous software process analysis and mechanical verification of properties using techniques, such as model-checking. In this paper, we discuss our ongoing efforts on applying behavioral modeling and analysis techniques for modeling context-aware services and their compositions, and verifying process behavior of these models against specified system properties. We evaluate our approach using a real-world case study in transport and logistics.
The rest of the paper is structured as follows. Section 2 provides the main behavioral analysis technique used in the approach. An overview of the case study is provided in Section 3. In Section 4, a systematic design methodology to model and verify context-aware services at software architectural level is discussed. This is presented in a step-by-step manner. Finally, Section 5 concludes the paper outlining future work. 2. Background
The model-based approach presented in this paper,
is particularly based on formal verification, validation and simulation techniques provided by the model-checker Labeled Transition System Analyzer (LTSA) and its process calculus Finite State Processes (FSP).
The LTSA [5] is a model-checking tool for concurrency modeling, model animation and model property checking. Software engineers use models, which are simplified representations of the real world,

to gain confidence in the adequacy and validity of a proposed design. The modeling approach of the LTSA is based on labeled transitions systems (LTSs) where transitions are labeled with action names in the state machine. The LTSA provides exhaustive exploration of state space by allowing the engineer to check for both desirable and undesirable properties for all possible sequences of events and actions.
FSP [5] is a process calculus provided by the LTSA for concisely describing and reasoning about concurrent programs. Dealing larger LTSs with large number of states is impractical and FSP provides a solution to this by allowing for textually specifying LTSs. In FSP, processes can be defined by using one or more auxiliary processes separated by commas and terminated by a full stop. Processes can be composed using the parallel composition operator. In the next section, we provide an overview of the case study.
3. The case study – an overview
Figure 1. Case study architecture (source: [6])
A real-world case study based on the ParcelCall
project [6] is used to evaluate the approach. ParcelCall is a parcel localization system based on an European Union project within the Information Society Technologies program. This case study is particularly appealing to us as it provides several scenarios for representing software services that inter-operate in a pervasive, mobile and distributed environment. Identity, location, temperature, pressure and acceleration are modeled as context parameters.
The case study (Figure 1) describes a scalable, real-time, intelligent, end-to-end Tracking and Tracing System (TTS) using Radio-Frequency Identification (RFID), sensor networks, and services for transport and logistics. Each transport item in the truck or container
is identified by an active RFID tag. RFID tags are compact reusable devices equipped with sensors, processing power and memory, which are capable of active two-way radio communication. RFID tags are used for item level identification and provide seamless end-to-end surveillance of status, location, and environmental data, such as temperature, pressure, acceleration, humidity and shock. RFID tags are particularly useful for perishable and sensitive goods such as grocery or pharmaceutical products, for which temperature needs to be monitored without interruption, or high-risk goods, such as shock sensitive electronic devices. RFID tags can be actively used for generating alarm messages if certain environmental constraints are violated. The TTS consists of three main components: the Mobile logistics server, the Goods tracing server and the Goods information server. 4. Service-oriented development of context-aware services
In this section, a systematic service-oriented development methodology for context-aware services at software architectural level is presented using the case study. The overall service-oriented development process is divided into three stages: service extraction, architecture definition and architecture modularization.
4.1. Service extraction
First, a service specification for the system under
consideration is defined. The service extraction step is initiated by determining the relevant use cases of the case study subset. To this end, the following use cases have been identified: monitor item location, generate alarm on item location, monitor item environment status, monitor temperature, monitor pressure, monitor acceleration, and generate alarm on item environment status. The identified use cases and their relationships are expressed using an UML use case diagram. After determining the use cases, we specify the services that realize those use cases. The term service is given different meanings by the software engineering community as it is used at various levels of abstraction. As defined by Kruger et al. [7], we identify a software service as the interaction pattern or the interplay of several components collaborating to complete a desired task. Further, we also identify services as first-class modeling elements as opposed to first-class implementation elements, such as Web services. We use message sequence charts (MSCs) provided by the LTSA-MSC tool to describe the interaction patterns defining the services. LTSA-MSC is an extension to

the LTSA tool, which allows documenting scenarios (interaction patterns of services) in the form of MSCs and generating a behavioral model of the specification in FSP. MSCs have been a widely used notation to document scenarios by software engineers. A MSC specification consists of several basic MSCs (bMSCs) and a high-level MSC (hMSC). A bMSC describes a sequence of messages represented as arrows between the interacting components while a hMSC provides hierarchy to the specification. A description of the services in the ParcelCall service specification is provided next. For reasons of brevity, precise MSC service specifications are not provided in this paper but an outline of the services extracted.
Service Interpret Context: The RFID tags and the GPS notify the Context interpreter that new context information is available. The Context interpreter obtains deriving rules from the Rules knowledgebase and derives secondary high-level context information. This service triggers two other services - the Aggregate context service and the Update database service.
Service Aggregate Context: The Context aggregator receives secondary high-level context information from the Context interpreter. The Context aggregator reacts by aggregating the context received and sends it to the Controller. The Update database service is triggered to store the new context information.
Service Update Database: This service stores any new context information it receives in the Context database. This service is referred by the Interpret context and the Aggregate context services.
Service Observe Events: The Controller obtains the behavior descriptions from the Behavior descriptions component. The Controller checks for events and upon the observation of an event the Controller triggers the Broadcast service, which executes the action specified in the condition rule.
Service Broadcast: The Controller commands the Notifier to broadcast a message to the Mobile client. The Notifier relays the message to the Mobile client.
4.2. Architecture definition
Second, the architecture for the system under consideration is defined. Towards this, first, we define a component configuration that implements the elicited services using an UML deployment diagram. The component configuration of the approach is based on a distributed version of the Observer pattern called the Event-Control-Action (E-C-A) architecture pattern [8]. Second, a behavioral representation of the service specification in the form of FSPs is generated
automatically using the LTSA-MSC tool’s FSP synthesis feature. This process essentially derives three behavioral models - an architecture model, a trace model and a constraint model. The architecture model provides the basis for modeling and reasoning about system design where the components are modeled as LTSs. The overall system is effectively the parallel composition of all the components in the specification.
4.2.1. Concurrency and distributed aspects. The initial architecture model is refined to introduce additional concurrency and distributed aspects of the interacting services. The generated FSP is edited in the standard LTSA tool to reason and further develop the system design, for example, specifying active and passive processes using threads and monitors, process interactions through shared objects and message passing, and concurrent architectures. 4.3. Architecture modularization with contextual-FSP
Third, the architecture model synthesized in the
previous step is modularized by applying separation of concerns. Separation of concerns is a design principle which identifies the need to deal with issues one at a time. Context-handling information is considered to be tightly coupling (crosscutting) the core functionality of the service at service interface level. This results in a complex design, which is hard to implement and maintain. Therefore, we present a model to decouple crosscutting context functionality from the core service logic at state machine level. For this purpose, we propose a new set of constructs called contextual-FSP (c-FSP). We provide explicit process representations of these c-FSP constructs using FSP semantics to facilitate process analysis by the LTSA tool. Our approach to separation of concerns is based on the ContextUML metamodel [9, 10]. However, the present approach is at the state machine level. 4.3.1. The notion of context. The notion of context used in this paper is based on a definition provided by Analyti et al. [11] for context in information modeling. They describe context as a set of objects, each of which is associated with a set of names and another context called its reference. Also, the set of objects of a context are structured using traditional object-oriented abstraction mechanisms of classification, generalization and attribution. 4.3.2. Modeling context. An UML class diagram (Figure 2) is used to represent the core service and

context elements of the model. State, transition, process and finite state machine classes represent the core service elements while context, context source, trigger, context constraint and action classes represent the context elements of the model. Source binding, context binding and triggering provide dependency relationships which associate service elements and context elements. The c-FSP constructs encompass the context elements and the dependency relationships of the model.
Figure 2. Modeling context and service elements
4.3.3. Mapping c-FSP constructs to FSP. In order to facilitate software process analysis we provide a manual mapping of each c-FSP construct using FSP notation. Case study examples are used to demonstrate the mapping process and the rules applied. To further illustrate the mapping process each FSP model generated is graphically represented with its corresponding LTS using the LTSA tool. 5. Conclusions and future work
To summarize, we have presented our current efforts on a systematic approach for behavioral modeling and verification of context-aware services and their compositions in service-oriented software architectures. The main contribution of this paper is a novel approach for systematically formalizing context in service specifications at state machine level.
As for future work, we intend to rigorously use formal software process model-checking techniques provided by the LTSA, such as safety, progress and deadlocks, to verify and validate the process behavior of the context-aware services against specified system properties. Furthermore, we intend to extend the design methodology presented in this paper to the aspect-oriented modeling level.
References [1] H. G. Hegering, A. Küpper, C. Linnhoff-Popien, and H. Reiser, "Management challenges of context-aware services in ubiquitous environments", In 14th IFIP/IEEE Workshop on Distributed Systems: Operations and Management, Springer-Verlag, Berlin, Germany, October 2003, pp 246-259. [2] T. Buchholz, A. Küpper, and M. Schiffers, “Quality of context: What it is and Why we need it”, In 10th Workshop of the HP OpenView University Association (HPOVUA’03), Geneva, Switzerland, July 2003. [3] J. P. A. Almeida, M. E. Iacob, H. Jonkers, and D. Quartel, “Model-Driven Development of Context-Aware Services”, In 6th IFIP International Conference on Distributed Applications and Interoperable Systems (DAIS2006), Springer-Verlag, Bologna, Italy, June 2006, pp 213-227. [4] S. K. Mostefaoui and B. Hirsbrunner, “Context aware service provisioning”, The IEEE/ACS International Conference on Pervasive Services, Beirut, Lebanon, July 2004, pp 71-80. [5] J. Magee and J. Kramer, Concurrency: State Models & Java Programs, 2nd Edition, John Wiley & Sons, April 2006. [6] A. Davie, “Intelligent tagging for transport and logistics: the ParcelCall approach”, Electronics & Communication Engineering Journal, Vol. 14, No. 3, June 2002, pp 122-128. [7] I. H. Krüger, J. Ahluwalia, D. Gupta, R. Mathew, P. Moorthy, W. Phillips, and S. Rittmann, “Towards a Process and Tool-Chain for Service-Oriented Automotive Software Engineering”. ICSE 2004 Workshop on Software Engineering for Automotive Systems, Edinburgh, Scotland, UK, May 2004, pp 33-41. [8] D. P Costa, L. F. Pires, and M. Sinderen, “Architectural Patterns for Context-Aware Services Platforms”, Second International Workshop on Ubiquitous Computing (IWUC 2005), Miami, USA, 2005, pp 3-19. [9] Q. Z. Sheng and B. Benatallah, “ContextUML: a UML-based Modeling Language for Model-Driven Development of Context-Aware Web Services”, International Conference on Mobile Business, Sydney, Australia, 2005, pp 206-212. [10] G. N. Prezerakos, N. D. Tselikas, G. Cortese, “Model-Driven Composition of Context-Aware Web Services Using ContextUML and Aspects”, IEEE International Conference on Web Services, Salt Lake City, USA, July 2007, pp 9-13. [11] A. Analyti, M. Theodorakis, N. Spyratos, and P. Constantopoulos, “Contextualization as an Independent Abstraction Mechanism for Conceptual Modeling”, Information Systems Journal, Vol. 32, No. 1, March 2007, pp 24-60.

An Adaptive Architecture for Context-Aware Interaction in Pervasive Applications
Alan Colman, Minh Tran, Jun Han Centre for Information Technology Research (CITR)
Swinburne University of Technology Melbourne, Victoria, Australia
{acolman, mtran, jhan}@ict.swin.edu.au
Abstract
Adaptation is one of the key challenges in pervasive computing. Context-aware applications need to respond to dynamic physical and computing environments. In this paper, we propose an adaptive architecture for context-aware pervasive systems. The basis of our approach is that entities (e.g., user, device, application or group) are modelled as self-managed composites. Each composite maintains a representation of its relationships with other entities and any context conditions that affect those interactions. It then uses this context model to monitor and control its interactions. This loosely coupled architecture allows flexibility in configuring and monitoring components of pervasive systems, and thereby helps the systems to be more adaptable.
1. Introduction
Pervasive or ubiquitous computing [23] is envisaged that computational power will be available everywhere and that heterogeneous computational devices can be integrated into the everyday life environment to support people’s social activities and work [1, 11, 16, 17]. Pervasive computing radically changes the way people access information, perform tasks and interact with one another. People can move throughout environments, such as home and office, while having persistent access to information and services anytime and anywhere. For this vision to become a reality, pervasive computing systems must have the capability of adapting to highly open and dynamic environments—both physical and social [2]. To do so, pervasive systems need to be able to understand environments in which the systems operate and provide users with relevant support. Environments include other people, their locations, activities, tools, social relationships and so on. Pervasive systems can mediate both tasks of individuals and cooperative tasks of a group. In both cases, systems need to understand and adapt to the changes of users’ context. In the case of group interaction, systems may also need to provide awareness information that helps users to be aware of
other people in the group (e.g., awareness information about people’s locations, presences, availability, activities, and so on). Research from related fields such as CSCW has shown that awareness information is valuable in group interaction because it helps a group to conduct natural and effective interaction. To date, however, research on pervasive computing primarily focuses on examining systems that utilise context information to support tasks of individual users. Motivated by this and the potential of pervasive system in facilitating group interaction, this research investigates an adaptive architecture of pervasive systems, which are context aware and aims to enhance user experience in group interaction. This paper is structured as follows. In the remainder of Section 1, we present a motivating scenario, identify some research problems illustrated in the scenario, and briefly describe our proposed approach to address those problems. Section 2 presents a discussion the proposed architecture. Section 3 discusses the deployment of context models in the architecture. Section 4 reviews related research. Finally, we conclude the paper with a summary and remarks on future research.
1.1 Motivating scenario
On the university Open Day, visitors including prospective students and their parents come to university to gather information about study courses and to explore the types of facilities and services offered by the university. Hence, it is a goal of the university to ensure that relevant information is accessible to visitors, and that they can speak with academics, course advisers and current students about study options and learning experience. To facilitate visitors’ experience on the Open Day, the university has decided to develop an Adaptive Context-aware Pervasive (ACAP) computing environment. The ACAP system is not a monolithic system. It is rather a loosely-coupled and open set of related services (a service eco-system) that can be composed to support information delivery and collaborative interaction amongst individuals and groups. The services that can be composed in various configurations using the ACAP system include identity

management systems for individual and groups, location-identity matching and navigation services, multi-media delivery services, media presentation, formatting and compression services, content-based information services that interface with the university systems, tools for supporting group interactions and awareness, smart-rooms, and so on. The service compositions that can be developed to support interaction between heterogeneous devices and between multiple applications, as well as allowing co-located / dispersed users to interact with one another. Visitors are able to use their own mobile devices (e.g., PDAs, laptops and mobile phones) to access various sources of information and to exchange information with other devices allocated around the university (e.g., fixed PCs and big screens). In addition, visitors are also able to interact with other people who are co-located in the same campus or geographically dispersed over different campuses. The ACAP system needs to be context-aware and adaptive. New services should be able to be dynamically added and integrated into the eco-system. The system should be able to cope with changing requirements of users, and changing levels of service provision form the constituent services. As each of the entities within the system may have different owners, the ACAP system also need to provide mechanisms by which those entities can control what is asked of them and what information they share. The above scenario typifies the open and dynamic context-ware pervasive computing environments that might become popular and even essential in personal, organisational and social interactions of the future. An ACAP system as illustrated in the above scenario is a composition of different entities (e.g., users, groups, devices, applications) and relationships.The relationships between these entities within the composition are highly dynamic as entities can join and leave the composition, and as devices and users move through the smart-spaces. Moreover, one entity can establish relationships and interact with multiple other entities of the same or different types. There is no fixed rule on how one entity is allowed to interact with another. Relationships between these entities are dynamically formed and diffused based on the context of which the entities interact. More specifically, users can be a group of individual users or collaborating groups of users interacting (possibly simultaneously) with a range of devices that are running a range of collaborating applications. These applications are in turn composed of a heterogeneous range of services. The relationships among users, devices, applications and smart-spaces are dynamically changing, many-to-many relationships.
1.2 Research problems
The above highly open and dynamic, context-aware pervasive computing scenario raises a number of research challenges, which need to be addressed to make such ACAP systems a reality. Firstly, we need to address the problem of how to model dynamic relationships of groups and manage the mutual awareness between individuals and groups in pervasive systems. For pervasive systems to mediate group interaction, the systems need to understand social relationships between members of a group (referred to as “social context”) and the context of a situation in which interaction occurs (referred to as “situational context”). In addition, to achieve natural and effective interaction, members of a group need to be aware of each other (e.g., other people’s locations, identities, activities, current tasks at hand, and so on). Furthermore, in open systems members need to have control over their own relationships, and therefore need to have control over how they represent their own contexts. An adaptive architecture should be able to model relationships from various participants’ perspectives. Secondly, an ACAP architecture needs to integrate entities (individuals and groups) that consume services into existing service eco-systems that provide services to those users. An architecture that has a consistent way representing both service consumers and service providers is therefore desirable. Furthermore, these entities may be running on heterogeneous infrastructures. The architecture ideally would be able to work across a range of such infrastructures with minimal modification. Finally, there is no widely accepted ontology or formalism for representing context. Although there have been attempts to broadly classify different types of context (e.g. [12]), the description of context is inherently open-end and multi-faceted. An adaptive architecture needs to work with various (arbitrary) ontologies for representing context. It needs to be able to sense changes in context and take appropriate action to adapt to those changes.
1.3 Our proposed solution
To address the above problems we propose an architecture for context-aware pervasive systems. The architecture is based on ROAD [9, 10] which focuses on relationships between entities of a system rather than on the entities themselves. We argue that from an entity’s point of view, a relevant social context is always defined in terms of its relationships with other entities. The proposed architecture ‘wraps’ with interaction-structures (composites) the entities that need to adapt. These composites represent the entities’

social contexts. Each composite has an internal view of itself, and external participatory views of other composites. Our ROAD-based architecture creates small runtime models that are encapsulated into self-managed composites. The model/composites contain no functional entities in themselves, but are rather interaction-structures that define a set of functional relationships (referred to as contracts) between entity roles. These contracts: � define permissible interactions over those
functional relationships, � define non-functional requirements related to
those interactions along with any context conditions that affect those requirements, and
� monitor the performance of entities with respect to those interactions.
Externally, these composites present themselves as services. Indeed, the ROAD architecture treats all entities within the system (individuals, groups, devices, applications, third party services, composites) as services. Developing pervasive systems is, therefore, considered as a dynamic service modelling and composition problem. The proposed architecture will enable each entity to control its own social context (and thus access to itself by others) by selecting and regulating its own external relationships taking into account environmental context information (location, technical environment, etc.)
2. Modelling Contexts
ROAD composites represent the set of relations an individual entity has with other entities within a particular context. They are both a model of those relationships, and can be implemented as self-managed composites (SMCs) using the ROAD framework. In this section we briefly describe the application of ROAD models to the domain of pervasive computing. Firstly, we describe how an entity’s relationships are modelled within a particular context and, secondly, how ‘propositions’ (correct or otherwise) about the context are represented.
2.1 Modelling relationships between individuals, devices, groups and services
In an open dynamic system in which each interacting entity may have a different owner and interests, there may be no global or consistent representation of context to which each entity can confer. To the extent that an entity is deliberatively adaptive it needs to maintain its own representation of its own context – that is, its relationships and the conditions that affect those relationships. In Figure 1,
an Entity A maintains a model of its relationships within a particular context Xa. In this model it represents itself as a role (Persona)1 as well as the other entities with which it interacts in that particular context, for example, Entity B which plays Role Mwith respect to A.
Figure 1. Entity A’s model of its relationships in Context Xa
An entity’s model of a context is subjective. Figure 2 illustrates Entity B’s model of its relationship with A in Context X. Note that B’s view of Context X (Xb) is different from A’s view. In this ‘post-modernist’ approach, there is no globally ‘correct’ view of a context2. While entities may share their perception of ‘propositions’ about a context with other entities, each participating entity needs to maintain its own construction of its context.
Figure 2. Entity B’s model of its relationships in Context Xb
1 An entity may have a number other contexts in which it participates and for which it maintains separate models. In each of these different contexts, these self-roles may be defined differently, that is, the entity may have different ‘personas’.2 In this approach then, a CSCW systems primary function would be to facilitate the sharing on context information and, perhaps, providing sensory input to context ‘propositions’, rather than providing a complete global construction of a context.
Entity B’s model of its relationships in Context Xb
Role N
Persona
Role O
AdaptiveEntity A
AdaptiveEntity B
Non-AdaptiveEntity C
Entity A’s model of its relationships in Context Xa
Persona
Role M
AdaptiveEntity A
AdaptiveEntity B

It follows that each entity sees its relationships with other entities through a context whose representation it constructs. In ROAD, this constructed model is reified as an interaction structure through which all interactions are mediated. In the case where two self-managed adaptive ROAD entities (e.g. A and B in the above figures), these entities interact through the contexts they create and maintain. Entities only need to create and maintain such context to the extent that they need to manage and adapt their behaviour. If an entity’s behaviour is invariant and it does not need to control or regulate its relationships (e.g. a resource Entity C in Figure 2), then there is no point modelling its context. In such a case, while non-adaptive entity participates in other entities contexts, it does not maintain its own context. Let us now illustrate this approach to modelling using our motivating scenario. For example, at the open day a prospective student registers an interest in a particular course run by a Faculty. The Faculty provides interactive multi-media sessions in various rooms and to remote student devices. These rooms and devices have varying capabilities to present media in different formats. In this scenario, there are a number of services that need to be combined to provide this composed service. An identity management system needs associate the individual user and their preferences with faculty and courses. A multi-media delivery system needs to work with the identity management system to ensure correct format is streamed to the device. A location-tracking system senses whether of or not the student is in the presentation room. If not, the system will attempt to deliver the presentation to the student’s device rather than the video screen in the room. The faculty also wishes to record on its information system if the student has had access to the presentation. An individual attending the open day with one or more devices will want to control the interactions those devices have with other systems, say, in restricting access to personal information. Likewise, the university’s system will need to control access and interactions to the various systems to which it provides and interface. In the context of our scenario, the different ‘owners’ in will have different set of relationships they may want to model and control. Some of the models required might include: � the individual’s view of their relationships to
various devices including their preference for each device;
� the identity management system’s view of the relationship between faculties, groups and individuals, and the access privileges associated with those relationships; and
� a multi-media delivery system’s model of the various devices, their presentation capabilities,
the format source media, available compression services and bandwidth capabilities of available communication channels.
Figure 3 shows a schematic of a user’s relationship to a number of devices with which he/she interacts. The individual will have a set of general preferences on how he/she likes to interact with devices in general (a user model). These preferences will be translated into specific contract properties that take account of the specifics of the relationship between the user role and a particular device. These specifics may relate to the device’s capability (e.g. a user may have a have a preference for large fonts), or relate other quality attributes such the user’s level of trust of the device (e.g. a user may not be happy for personal information to be stored on the device). As the composite in Figure 3 represents the user’s view of his/her relationships, the user role is not just a proxy for the user within the composite. The user role is also an organizer of the relationships within the composite (denoted by the bold rounded rectangle in the Figure). The organizer role is discussed in more detail in the Section 3.
Figure 33. An individual's relationships to his/her device context
Figure 4 shows another example of representation of relationships from our scenario. The Faculty creates a composition that allows information presentation to be delivered to prospective students in various locations. Note that the services playing the roles in this Faculty’s composite are themselves composites. The User-device composite service that plays a student/device role in Figure 4 aggregates information
3 The notation in Figures 3 and 4 is a simplified version of the notation used for ROAD concepts the semantics of which is described in [9].
User-Device composite
Device 3
Device 1
Device 2
Mobilephone
PDA
Infokiosk
User
Organizer role
Functional role
Contract
Self-managed composite service
Plays relationship
Service (Role player)
Self

about a user and devices as shown in Figure 3. The Faculty service (internal composition not shown) aggregates an Identity Management service, and the Faculty information system; and the Multi-media delivery service uses location tracking service, a compression service and information provided by the Faculty.
Figure 4. A Faculty’s composite representing relationships between individuals, group and
resource services
In a ROAD model, the contracts between roles terms define the mutual obligations of the participant roles in the given context. They define the interactions that are permissible or required by the participant roles. Contracts can also set arbitrary non-functional requirements on their roles’ interactions, and how conformance to those requirements will be measured. Next, we show how context can be represented in contracts.
2.2 Representing context
As pointed out in the section on related work below, there are a number of approaches to modelling context. We take a distributed approach where each entity maintains its own representation of the context relevant to it. Context is relevant to an entity (i.e. needs to be taken account of by the entity) to the extent that it affects its relationships with other entities. From this view, a situational context proposition is the object of a predicate condition that affects one or more interactions that a part of a social context of an entity. An entity’s store of situational context propositions can be related various types of context (e.g. computing context, user context or physical context) and can be statements about any aspects of that context (e.g. identity, time, state, etc.). These statements may be accord with the real-world or otherwise. The context for an individual is the sum of those propositions. For example, in Figure 3 the user entity (the owner/organizer of the context representation) may
have a preference not to use their mobile cell phone in a lecture theatre. The context proposition is that the user and their phone are in the lecture theatre (this may be true or not). This proposition affects to relationship between the user and the phone because the user as owner of the context relationships has set a rule that the phone will not signal the user when there is an incoming call. In ROAD, context is represented as conditions are written as arbitrary contract terms that govern the relationships between roles played by services bound to the composition. In this case, the contract between the user role and the phone role define permissible user-phone interactions. The rule that the phone will not signal the user is written as a term of that contract. However, it is worth reiterating that these contracts are only the entity’s own representation of its context. The entity on the other side of the relationship needs to conform to the terms of the contract in order for the terms of the contract to be fulfilled. Where the other entity is owned by a separate business this may require some form of external agreement (e.g. a service level agreement). In our example however, the user owns the phone, so provided the phone can conform with the contract term (e.g. it has a silent mode that can be triggered externally) the phone’s behaviour will be able to be made context sensitive.
3. Deploying Context Models
In this section we outline how the above context models can be deployed as self-managed composites using the ROAD framework [9, 10]. The ROAD framework provides a small set of abstract classes that can be extended to create adaptive applications. These classes realize the concepts introduced in the previous section: self-managed composite, contract, functional role and organizer.
3.1 Context models as service composites
ROAD composites are self-managed interaction structures that not only model the relationships between roles in a particular context, but manage and control those interactions over those relationships using contract objects. These composites are deployed as services. As services they externally present rich descriptions of one or more interfaces with which other services can interact. They also can be deployed on any compatible Web accessible server.
Internally, a ROAD composite is a self-managed role structure bound together by contracts. Contractsperform three functions in a ROAD composite role structure: composition, interaction control, and performance monitoring. As such, ROAD contract instances are dynamic and rich connectors between
Faculty’s Open day Group composite
InformationResource
Student
User-devicecomposite n
Multi-media-delivery service
Faculty
User-devicecomposite 1
StudentStudent / device
Self

roles. A contract stores the mutual obligations of the parties bound it and monitors interactions between the parties for compliance to those requirements. In this way contracts perform a similar function to inter-ceptors in conventional middleware. Each composite has an organizer role that tries to ensure the relationships within the composite, and the relationships with other entities, remain viable and continue to fulfil the composite obligations. Organisers are autonomic managers that create and destroy roles. They also make and break the bindings between composite roles and services (service selection), and create and revoke the contracts between the roles. They can thereby create various configurations of roles and services. Organisers set performance requirements for the contracts they control, and receive performance information from those contracts. They also maintain and update the store of context propositions used to evaluate the context relevant to the interactions that flow through its contracts. The interested reader is referred to [9] for a more details description of the ROAD framework and it adaptive capabilities.
3.2 Acquiring and communicating context
In order to monitor compliance to contract terms, contracts can have domain-specific utility objects attached to their terms. The evaluation methods of these objects are triggered as interactions pass through the contract. This same mechanism can be used to evaluate a context relevant to an interaction. At runtime, these utility objects provide the sensing and evaluation mechanisms to determine the state of the context, evaluate that state with respect to rules stored in the contract, and execute any subsequent action (e.g. stop the phone ringing). As described in the previous section, each entity controls the perception of its own context. Perception of context between entities can therefore vary. However, if two adaptive entities are to effectively interact within a given set of ‘objective’ context propositions, the entities may need communicate and agree on the context of the interaction. In ROAD, the organiser of composites present management interfaces over which requirements and capacity requirements can pass. It is proposed that the composite organiser use this same interface this context sharing. This management interface has not yet been implemented in the ROAD framework.
3.3 Adapting to changes in context
In context-aware pervasive applications, the structure and relationships with the composition may have to continually change as entities join and leave
the composition, and as changes in context affect the relationships between the entities. The ROAD framework has been designed to support adaptation resulting from both changes in requirements and changing levels of service provision. This adaptation can take the form of regulation (the terms of existing contracts are change in response to a mismatch between requirement and performance) or restructuring (where the structure of the composite is changed by adding or removing new roles or by selecting different role players). Composite organisers are provided with decision making strategies to execute such adaptation. Likewise, in adaptive context-sensitive applications the need for adaptation is also triggered by a mismatch between monitored performance and requirements as defined in the contracts. In the case of context-sensitive applications, however, the change in requirements is triggered by a change in context as determined by rules written into the contract terms (as described in Section 2.2 above). Apart from this different source of perturbation, the strategies for adaptation are the same as for a standard service oriented application.
4. Related Work
Context-aware computing focuses on studying how information about people context is modelled and used. Particularly, researcher efforts have been in two areas:
(1) understanding and modelling the context of pervasive systems, (2) developing architectures for context management.
4.1 Modelling context
Context has been defined as “information that can be used to characterize the situation of entities (i.e., whether a person, place, or object) that are considered relevant to the interaction between a user and an application, including the user and applications themselves” [12, p. 106]. Researchers have been investigated ways of modelling different aspects of context, such as user modelling [15, 21], location modelling (e.g., a symbolic model and a geometric model) [6], and device and sensor modelling [8], etc. In addition, different approaches to structure context information, including key value data structure [20], mark-up scheme model [7], ontology based model [15], aspect-oriented model [18], and so on. This paper does not attempt to address such semantic and formal aspects of context representation. Our approach is complementary to such concerns in the sense that we address where context should be represented in an

application architecture – that is, context is seen as a property that affects interactions, In relation to user’s awareness of group, previous studies from CSCW have modelled various aspects of groups and group awareness [14, 22]. Particularly, different aspects of group awareness have been examined, including conversational awareness (user awareness of communication), workspace awareness (user awareness of tasks, people, artefacts) and organisational awareness (user awareness of group/organisation structure). Again, this paper does not address the semantics of group contexts or how to present such context information to the user. Rather, our concern is to develop of meta-model that will allow group of entities and their relationships to be modelled in a software system. Such an architecture allows the relationships within the system to mirror the relationships between entities in the real-world.
4.2 Adaptive architectures for context-aware pervasive systems
A number of architectures have been proposed to support management of context information. Commonly, the architectures decouple the context sensing task and the pervasive application. This loosely coupled design aims to reduce the overhead of acquiring low-level data from sensors, representing it to the standardised format and using it in a useful manner. Context server can be centralized or distributed. In the centralized architecture, there is a centralized context server that provides context information to applications. Examples of the centralized architecture are shown in [12, 24]. On the other hand, in the distributed architecture context is acquired and managed at different servers, the applications need to search for context information that is useful to the applications, as shown in [5]. While this paper does not specify how context is acquired, the approach proposed here is inherently decentralised in that each entity is responsible for maintaining the representation of its own context (albeit with the option of using centralised if desired). In addition, there have been also different approaches to developing infrastructures that adapt to dynamic environments. In particular, two of these approaches have focused on adaptive pervasive systems. In the Aura project, Garlan et al. [13] define an adaptive framework for the construction of “task-aware” pervasive systems. Task models capture and model user goals and intent, and represent quality attributes of the services that perform those tasks. These quality goals can be conflicting. The adaptive system needs to find the optimal balance of qualities to suit the user’s goals. To do this it evaluates and
consolidates multi-dimensional utility functions. The Aura project introduces an important concept to control-oriented adaptation in software; that is, control loops are needed to adapt to both the external environment (user, system context, problem domain), and the computational/network environment (bandwidth, CPU, memory etc.). The multi-dimensional nature of quality attributes is recognised, and formalisms (albeit crudely modelled) are introduced to calculate optimal utility [19]. Another middleware approach to adaptive pervasive computing is Peer-to-Peer Pervasive Computing (3PC) which consists of both a middleware (BASE) [4] and a component model (PCOM) [3]. In 3PC, an application is viewed as a tree of components. Adaptation is seen as switching of sub-trees using search and selection based on the description of component interfaces and requirements. These contracts define offered functionality (both functional and non-functional qualities), required functionality, and required resources. 3PC applications are monolithic in the sense that a single application attempts to compose passive resources and services. .
5. Conclusion
In this paper, we propose an adaptive architecture for context-aware pervasive systems. The proposed architecture focuses on modelling entities as well as relationships within and between entities. To support adaptation, our proposed architecture ‘wraps’ the entities that need to adaptive in interaction-structures that represent the entities’ contexts. Each entity maintains the context(s) that is (are) relevant its own interactions but adding/modifying context proposition-action rules to the terms of its contracts. These loosely-coupled composites are self-managed in that they can alter their internal structure and relationships in response to changes in context. Externally, each composite is considered as a service composite, which has a standardized interface allowing interaction/ composition with other composites. The ROAD framework has been developed as a proof-of-concept prototype in which self-managed composites can dynamically alter their contracts and composition in response to changing requirements and component performance. However, it remains future work to instrument an application built on the framework with context-sensitive mechanisms. Interfaces for sharing and negotiating context information also need to be developed.
6. References
[1] G. D. Abowd and E. D. Mynatt, "Charting past, present, and future research in ubiquitous

computing," ACM Transactions of Computer Human Interaction, vol. 7(1), pp. 29-58, 2000.
[2] G. Banavar and A. Bernstein, "Software Infrastructure and Design Challenges for Ubiquitous Computing Applications," Communications of ACM, vol. 45(12), pp. 92-96, 2002.
[3] C. Becker, M. Handte, G. Schiele, and K. Rothermel, "PCOM - a component system for pervasive computing," Proceedings of the 2nd
IEEE Conference on Pervasive Computing and Communications PerCom'04, 2004, pp. 67-76.
[4] C. Becker, G. Schiele, H. Gubbels, and K. Rothermel, "BASE: A Micro-Broker-Based Middleware for Pervasive Computing," Proceedings of the 1st IEEE international Conference on Pervasive Computing and Communications, 2003, pp. 443- 451.
[5] W. Beer, V. Christian, A. Ferscha, and L. Mehrmann, "Modeling Context-aware Behavior by Interpreted ECA Rules," Proceedings of the International Conference on Parallel and Distributed Computing (EUROPAR'03),Klagenfurt, Austria, 2003, pp. 1064-1073.
[6] M. Beigl, T. Zimmer, and C. Decker, "A Location Model for Communicating and Processing of Context," Personal and Ubiquitous Computing, vol. 6(5-6), pp. 341-357, 2002.
[7] P. J. Brown, J. D. Bovey, and X. Chen, "Context-aware applications: from the laboratory to the marketplace," IEEE Personal Communications, vol. 4(5), pp. 58-64, 1997.
[8] D. J. Carmichael, J. Kay, and B. Kummerfeld, "Consistent Modelling of Users, Devices and Sensors in a Ubiquitous Computing Environment," User Modeling and User-Adapted Interaction, vol. 15(3-4), pp. 197-234, 2005.
[9] A. Colman, "Role-Oriented Adaptive Design," PhD Thesis, Faculty of Information and Communication Technologies Melbourne, Australia: Swinburne University of Technology, 2006.
[10] A. Colman and J. Han, "Using Role-based Coordination to Achieve Software Adaptability," Science of Computer Programming, vol. 64(2), pp. 223-245, 2007.
[11] G. B. Davis, "Anytime/Anywhere Computing and the Future of Knowledge Work," Communications of the ACM, vol. 45(12), pp. 67-73, 2002.
[12] A. K. Dey, D. Salber, and G. D. Abowd, "A Conceptual Framework and a Toolkit for Supporting the Rapid Prototyping of Context-Aware Applications," Human Computer Interaction, vol. 16(2-4), pp. 97-166, 2001.
[13] D. Garlan, V. Poladian, B. Schmerl, and J. P. Sousa, "Task-based self-adaptation," Proceedings of the 1st ACM SIGSOFT workshop on Self-managed systems, 2004, pp. 54-57.
[14] C. Gutwin and S. Greenberg, "A Descriptive Framework of Workspace Awareness for Real-Time Groupware," Computer Supported Cooperative Work, vol. 11(3-4), pp. 411-446, 2002.
[15] M. Hatala and R. Wakkary, "Ontology-Based User Modeling in an Augmented Audio Reality System for Museums," User Modeling and User-Adapted Interaction, vol. 15(3-4), pp. 339-380, 2005.
[16] L. M. Jessup and D. Robey, "The Relevance of Social Issues in Ubiquitous Computing Environments," Communications of the ACM, vol. 45(12), pp. 88-91, 2002.
[17] K. Lyytinen and Y. Yoo, "Issues and Challenges in Ubiquitous Computing," Communications of the ACM, vol. 45(12), pp. 63-65, 2002.
[18] J. Munnelly, S. Fritsch, and S. Clarke, "An Aspect-Oriented Approach to the Modularisation of Context," Proceedings of the 5th IEEE International Conference on Pervasive Computing and Communications PerCom'07,White Plains, New York, USA, 2007, pp. 114-124.
[19] V. Poladian, J. P. Sousa, D. Garlan, and M. Shaw, "Dynamic Configuration of Resource-Aware Services," Proceedings of the 26th International Conference on Software Engineering ICSE'04, 2004, pp. 604-613.
[20] B. N. Schilit, M. M. Theimer, and B. B. Welch, "Customizing mobile applications," Proceedings of USENIX Mobile & Location-Independent Computing Symposium, Cambridge, Massachusetts, 1993, pp. 129-138.
[21] O. Stock, M. Zancanaro, P. Busetta, C. Callaway, A. Krüger, M. Kruppa, T. Kuflik, E. Not, and C. Rocchi, "Adaptive, intelligent presentation of information for the museum visitor in PEACH," User Modeling and User-Adapted Interaction, vol. 17(3), pp. 257-304, 2007.
[22] M. H. Tran, Y. Yang, and G. K. Raikundalia, "F@: A Framework of Group Awareness in Real-time Distributed Groupware," Proceedings of the Eighth Asia Pacific Web Conference APWeb'06, Harbin, China, 2006, pp. 461-473.
[23] M. Weiser, "Computer for the 21st century," Scientific American, vol. 256(3), pp. 94-104, 1991.
[24] T. Winograd, "Architecture for Context," Human-Computer Interaction, vol. 16(2-4), pp. 401-419, 2001.

Information Art Based on Community Activity in a Large Workplace
James Constable, Raymes Khoury, David Carmichael, Judy Kay, Bob Kummerfeld The University of Sydney
{jcon6353, rkho9564}@mail.usyd.edu.au, {dcarmich, judy, bob}@it.usyd.edu.au
Abstract
One of the challenges of building a sense of
community within a large workplace building is due to people's lack of awareness of the people outside their immediate work areas. LAVAlamp is an information display which addresses this problem: it is an abstract visualisation of the people in a building. This paper describes its design, its implementation in terms of the pervasive infrastructure and user interface. We report a qualitative user study with 6 people to assess its utility for supporting awareness of building activity, its perceived value and appeal as well as people's views about privacy. Overall, participants found it an attractive ambient appliance, they could understand it and valued its depiction of the people in a building and considered its design addressed privacy concerns. 1. Introduction
Social awareness within a large workplace building is important but can be hard to achieve. People working in large buildings can be unaware of activities in other parts of the building and particularly, can fail to know what others are doing or where people are gathered. This can lead to a sense of disconnectedness from the workplace community. This can be particularly true of new employees or visitors to the workplace who may be unaware of some of the social patterns that exist.
LAVAlamp addresses this problem. It presents an abstract visual representation of the coarse-grained locations of the building’s occupants as well as other anonymised information related to their activity. The system is designed to be displayed on a screen or projector in common areas of the building, or simply on a user’s monitor. It is intended to unobtrusively inform the user of the human activity within the workplace in real-time, whilst being pleasing to watch and complementing its surrounding environment.
In this paper, we first review work related to information displays for community awareness, then
describe the design of LAVAlamp from a user’s perspective and from a technical and aesthetic perspective. In the next section we describe the implementation of LAVAlamp. After this we present a qualitative user evaluation of the system. Finally, we conclude on the strengths of LAVAlamp and future work. 2. Related Work
Reflecting the emerging recognition of the potential value of visualisations and the importance of social awareness, there has been a growing body of work integrating data visualisation and physical environments.
Redstrom et. al. [5] state that information art is the focus on “how traditional art objects, like paintings and posters, can be augmented, or amplified, and made to display information”. They identify that there should be a mapping between the design structure of the artwork and the information communicated such that rather than being an exact depiction of the information, the art is abstracted and aesthetic. They then explore effective methods to achieve this mapping including the alteration of properties like size, shape and colour, as well as the use of generative grammars. They believe that the purpose of the artwork is to be aesthetically pleasing while increasing awareness about otherwise hidden information from the physical environment around them. In contrast to ambient displays which are designed to communicate information completely in the periphery of the user, information artwork is designed to be interesting and allow the user to concentrate on them for moments of mental rest, as is the case with traditional artwork. At the same time it should be unobtrusive and not force the user to pay attention. We set about creating an information display to increase awareness of occupants in a building.
Ambient displays, as described by Dahley et. al. [2], “present information within a space through subtle changes in light, sound and movement, which can be processed in the background of awareness”. The

concept is that parts of the environment surrounding a user would change in a way that does not distract the user but nonetheless communicates information to them. This can manifest itself, for example, as a piece of artwork, such as a painting that subtly changes, as in [6].
More generally, peripheral displays, as described by McCarthy et. al. [7], are visual displays distributed throughout physical space to supplement those used for primary work activities. These displays do not necessarily have an emphasis on being aesthetic and can more accurately communicate information. In a number of instances, they have been used in order to attempt to increase social awareness in the workplace. The GroupCast [7] application, for example, uses a public display to deliver content that is of mutual interest to users nearby with the aim of sparking conversation between them and furthering the development of relationships. Other peripheral displays with similar objectives have also been developed and tested with some success, as in [4].
Dourish and Bly [3] state that awareness, in the social sense, “involves knowing who is ‘around’, what activities are occurring, who is talking with whom”. They state that awareness may lead to informal interactions, spontaneous connections and the
development of shared cultures. Large workplaces can hinder this social awareness, particularly if poorly designed. For example, those within the workplace may be large physical distances apart and hence not know what is happening in the other side of the office. This is the problem that LAVAlamp attempts to solve.
Izadi et. al. [1] also explored the notion of increasing awareness using location information in a family situation. The “Whereabouts Clock” is a device which is placed in a family home and the coarse-grained location of members of the family are displayed on it (home, work, school or elsewhere). The location information is detected by mobile phones being carried by users. In their user study, Izadi et. al. found that the clock brought a stronger sense of connection between members of the family. It increased the feeling of safety about family members and evoked feelings of connectedness and togetherness. This increased awareness about people around oneself through knowledge of their location is also what LAVAlamp attempts to achieve, however in a workplace environment, rather than a family one.
2. Design
Figure 1. Typical screenshot taken from LAVAlamp at 1:32pm, 4th December 2007.

Figure 2. A key to the visualisation.
We first describe LAVAlamp from a user’s
perspective. Figure 1 shows a screenshot of the visualisation during normal operation. Each shape on the screen represents a person detected within the building. The colour of the shape (which can’t be seen in the greyscale image) denotes the coarse-grained location of the person. In the context of this system, this correlates to which floor of the building the user was detected on.
The size of a shape denotes how long a person has been within the building. A square denotes a person who is at their desk or in their office, and a circle denotes a person who is mobile.
The shapes float around the screen with a velocity dependent on the total number of people in the building, i.e. the more people there are in the building, the faster the shapes move around.
As new people enter the building, new shapes are created in real-time; as they change location, their colour also changes; and the longer the person stays in the building, the larger their shape becomes. If they have not been detected in the building for a given amount of time (3 hours in this case), they will float to the top of the screen, where they will remain still for a period before disappearing.
It is important, now, to make a distinction between two types of people displayed on the system. The larger shapes on the screen are people who have registered with the underlying location-tracking system [9] and have chosen to have their data displayed. Their presence in the building, location, time spent in the building and whether or not they are at their desk are all shown in the display.
Other people, who have not registered with the system, but have still been detected in the building, are represented by the small ‘bubbles’ on the display. Only their presence within the building (and how that was
gathered) are shown on the display. The reason for this is that the data about these people is less accurate and also may present privacy concerns if more information about them was shown without their knowledge.
The graph on the right-hand side of the display indicates how many people have been in the building over the past 24 hours, with the newest data at the top. The bottom left has a display of the current time and date.
2.1. Design Objectives LAVAlamp had two main objectives:
1. Increase the viewer's awareness of the amount of activity in the surrounding workplace.
2. Be aesthetically pleasing to watch.
The following sections describe the approach we have taken to achieve these goals. 2.2. Increasing Workplace Awareness
Awareness, as mentioned in the related work, is a broad concept that involves knowing about one’s surroundings. As such, different elements of one’s awareness can be increased in different ways. For example, Huang et. al. [4] use a peripheral display which shows user-submitted “awareness items”. These articles might, for example, describe a project that is currently underway in the workplace. In this way, they attempt to increase awareness of co-workers’ current activities.
Information about the location of people can also be used to increase awareness as Izadi et. al. [1] demonstrated with the Whereabouts Clock. We extend this concept which was intended for a home setting into the workplace. Knowing the location of colleagues in the building, even if this information is anonymised, can help to increase a sense of community or connectedness. It can help people to determine where important events are occurring or social hot-spots and hence help develop relationships between people, particularly for those unfamiliar to the workplace. It can also prompt people to ask questions about behaviour they observe, leading to a better understanding of the social dynamics of a workplace. Simply knowing that people are around can help to reinforce a feeling of togetherness.
Participants who have some knowledge of the system can use the data it presents to infer even more about activity in the building. For example, if many people seem to be on Level 1 (where the tea-room is) at 10am, then a user might infer they have gone to have a coffee. This can enhance the usefulness of the system and increase awareness to an even greater extent.

Retrospective data that is expressed through the graph on the side and the floating to the top of undetected people aim to further inform a user of how activity now compares to activity in the recent past, further increasing awareness of the social activity in the workplace. 2.3. Aesthetic Design
We chose to visualise the location data abstractly. There were a number of reasons for this. First, the data available about people's locations was not fine-grained enough to produce a display that gave a more statistical representation. Such a representation may have also presented greater privacy concerns than the current system.
Secondly, an abstract representation allowed for a greater flexibility in making the display visually appealing [8]. There are many options when considering such a display in relation to how abstract the representation is and the attention required by users to absorb the data, as discussed in the related work. We chose to produce a display that we think is best classified as informative art. It aims to be aesthetic, just as a traditional piece of art is, but also to convey information in a way that can be understood by appropriately examining it. LAVAlamp attempts to allow users to get a different understanding of the display depending on whether they quickly glance at it or spend more time attending to it. Our aesthetic goal is that LAVAlamp not only complements the environment it is placed in but also increases interest in the information conveyed, so increasing its effectiveness.
The key concept for the display comes from the model for gas molecules moving in a container. As the gas heats up, the molecules move around faster. In LAVAlamp each person is represented by a circle or a square floating around the screen. As more people enter the building (more building activity) the speed at which these shapes move also increases, giving a sense of busyness to the display.
All visual aspects of the display are aimed at being calming. This includes the flowing motion of the shapes around the screen, the cool colours chosen, the use of transparency, the smooth transitions of colour and shape and the smooth graph on the side. The aesthetic design of LAVAlamp is intentionally simple to help aid viewers in understanding the display. The graph on the side of the display which depicts activity in the past 24 hours is also aimed at being aesthetic, trading some accuracy to be smooth.
3. Implementation
LAVAlamp is built upon a modified version of a system called MyPlace Locator [9]. MyPlace Locator collects data about the locations of people from Bluetooth sensors and sensors on computers. It uses an underlying framework called PersonisAD [10] which provides a mechanism for the modelling of people, sensors, devices and places for ubiquitous applications. Data about people’s locations is added to their models (as evidence) and a resolution process is used to determine their current location. Resolution involves examining recent pieces of evidence to determine which evidence is most likely to be true. MyPlace Locator also provides an interface for viewing location information about the people, places and devices around a person and controlling how their information is used.
PersonisAD uses a Berkley DB database to store data which has been shown to be sufficiently fast for most applications using the PersonisAD framework. LAVAlamp, however, can require a large amount of retrospective data if it is used to replay through a long period of time. While we still use a number of the mechanisms built into MyPlace Locator, we use a MySQL database for faster retrieval of the data. This also allows data that is not associated with a registered user of the system (anonymous users) to be used.
The system currently collects location data from Bluetooth sensors, which can detect any Bluetooth device, such as a mobile phone, and system sensors which detect activity on a computer. If a user is registered with the system then these devices will be stored in the user's model and so we can fairly reliably use data collected to reason about their location. If Bluetooth or system sensor data is collected about someone who is not in the system, it is used to represent anonymous people. As such, this data is less reliable. For example, a Bluetooth device may be attached to a computer somewhere and not accurately represent a person in the building. Similarly, a person not registered in the system who logs into a computer and is detected may also have a Bluetooth device and so appear twice on the display.
3.1. Application Design
LAVAlamp has been designed for flexibility. For this reason, the back-end of the system has been written as a server-side CGI script (in Python) which interfaces with the MySQL database and Personis and outputs results in XML format. This allows a wide variety of front-ends to be developed. We chose to develop the front-end visualisation as a Java applet.

3.2. Back-End
The back-end CGI script, written in Python, interfaces with the MySQL database and MyPlace Locator framework. It pulls location information out of the database and applies a resolver to it to determine the most likely location of each person. We use a simple office-bias resolver which will mark a user as in their office if any recent evidence (evidence within the last 15 minutes) shows them to be there.
The script can take 3 parameters: a start time, a stop time and a step period, which allow complete and convenient access to data from any time in history. These are all time values, measured in seconds. The start time is how many seconds ago to start retrieving location data. The stop time is how many seconds ago to stop retrieving location data. For example, if the start time is 10 seconds and stop time is 2 minutes, data between 10 seconds ago and 2 minutes ago will be retrieved. The step period determines the intervals at which to collect data; for example, if the step period is 10 seconds and the start time is 10 seconds, the script will extract data from points at 10 seconds ago, 20 seconds ago, etc. This is so that the time-granularity of data can be controlled and if one only wants a few data points in a period of time, say every hour, they can be efficiently extracted.
Output is in XML format. The XML is structured as a series of points in time with each point corresponding to an interval dependent on the arguments given. Each point contains a list of users detected at that point in time and their location. Hence, the XML has the form:
<point time=“12345”> <user id=“personA” ... location=“level1” /> <user id=“personB” ... location=“level2” /> </point> <point time=“12346”> <user id=“personA” ... location=“level3” /> <user id=“personB” ... location=“level2” /> <user id=“personC” ... location=“level1” /> </point>
Most often, only the most recent point in time is requested. Older data, however, can still be accessed if the display is to be replayed over a period of time.
The script also provides a very basic time-synchronisation facility to ensure that the front-end is kept at roughly the same time as the server storing the location information. 3.3. Front-End
The front-end of LAVAlamp is written as a Java applet for portability and to allow delivery over a network. The Processing [11] library was used to ease development.
The applet queries location data from the back-end script and caches it for later use. For example, one could query data from the past 24 hours and then play through that data on the display. The applet also queries the most recent data available at set intervals in time to allow for real-time playback. 4. Evaluation 4.1. Evaluation Design
The key objectives of the user evaluation were: 1. To determine how effective the display is in
communicating information to users. 2. To determine how intuitive the display is to a
user who has no prior experience with or information about the system.
3. To determine whether or not users find the display visually appealing.
4. To determine whether or not users are interested in the information provided by the display.
5. To explore ways in which the display could be improved.
6. To identify any privacy issues.
The evaluation was designed as a combination of think aloud use of the system and a series of questions about the participant’s understanding of, and response to it. This design provided the qualitative results that were needed to meet our goals.
Six participants were recruited from regular users of the School of IT building. This ensured that they matched the main target population, the community for whom the information is intended. Participants had no prior experience with, or information about, the system. This ensured that their initial response was that of a first time user.
The experiment began with participants being invited to explore the interface. They were provided with no information about its meaning. They were observed during this think-aloud phase, with the experimenter noting the participant’s actions and comments. Participants were then asked to write a free form comment on what they thought the display was showing.
Then they were asked to rate how aesthetically pleasing they considered it as an ambient display in a building. Responses were a Likert scale from 1 (poor) to 6 (attractive). Then they were asked if they would

like to see such a display in the building foyer, and to explain their answer. This phase informed Objectives 1 - 4, for the case where the user has no information about the display.
For the next step, participants were told that the acronym, LAVA, in the title of the display stood for Location Aware Visualisation Application and then asked to comment again about the meaning of the display. At this stage, participants were explicitly asked what they considered was represented by each of the main elements, described above in Section 2 and then to consider the historic display at different times of the day and its meaning. This phase informed Objectives 1 and 2.
For the third step, participants were provided with the full key, as it appears at the lower right of Figure 1. They were asked exactly the same questions as in Stage 1. This phase informed Objectives 1 - 3, for the case where the basic description was available, as we envisage it would be for an installation in a public area of a building.
This concluded the think-aloud phase where participants studied the display. They were asked how they would use the display, informing Objectives 1 - 4. The next questions asked for suggested improvements, both in terms of information and aesthetics, primarily informing Objective 5. Finally, we asked participants to comment on how they felt about the privacy the system offers, both in the case of registered users and others. This informs Objective 6.
After the main experiment, participants completed a demographic questionnaire, asking their gender, age, position in the University (staff, student, other as specified), length of use of the IT Building, frequency of use of it and familiarity with our Locator system [9]. The questionnaire was at the end of the experiment to avoid the possibility that participants’ main experimental result might be prejudiced by their having answered these questions before using the system. Pure demographic questions were to ensure that we would be aware of the profile of the participant population. Given the goals of the study, we did not plan to analyse the results against this data. The questions about building use were important for assessing the extent to which they were a part of the building community: we would expect that more frequent and long term users would have a stronger identification with the building community. The final question, about use of Locator, was to take account of the fact that the underlying location modelling infrastructure for both systems is identical and this may have affected people’s interpretation of the display.
Of the six participants, 4 were male. Five were students, with the other being a student who also works in the building. All had used the building for at least 7
months and four for more than a year. Five participants used the building at least 5 times per week; the other 2-4 times. Three participants had heard of Locator but had never used it. Two had registered for it and use it, one of them having participated in evaluations of it. One participant had used Locator but was not registered with it.
4.2. Results
For the first question, 5 of the 6 participants correctly guessed that the display was a visualisation of people’s activity. In terms of its aesthetic appeal, the display scored an average of 4.08 out of 6 (median value of 4.25), and all users agreed that they would like to see a display like this in the building foyer.
The results for the second question were quite mixed. Without the key, most users struggled to correctly identify every component, but were generally able to guess at least one or two correctly. All of the users suspected at some point that the floating shapes represented people, and all had a good idea of how the timeline on the side operated. The timeline itself proved to be a useful clue in helping the participants guess what the rest of the display was showing. Two of the users correctly guessed the meaning behind the shape of the objects. Other features like the colour seemed to be mysterious to all users.
Participant 4, who correctly guessed almost every component, did already have some background knowledge of the Locator system, so her accuracy might be partially due to the fact that she already knew what kind of data the system collects about people, and was just looking for a way to map it onto the interface.
Another point worth noting is that while the bouncing movement of the shapes actually encodes little information, most users thought that it must be representing something important (the most common suggested was that it indicated the activity level of the person represented by the shape). Although only one user wrote it down, most of them suggested at some point that the shapes floating to the top of the screen might indicate when a person has gone home.
It is striking that with so little information, participants were able to interpret so much of the display.
After seeing the key in Question Three, most of the participants had no problem identifying the different parts of the display. Some felt that the key was slightly unclear about the unregistered users, but still 5 of them worked it out without any assistance. Two of the participants still found the bouncing movement confusing even after seeing the key.
For the fourth question, all participants were readily able to interpret temporal data from the display, and

showed a good understanding of how the display changed over the course of a day. This was highlighted with Participant 3, who noticed that a number of people arrived quite late one night and tried to remember if there had been any events on on that night that could account for the change.
For Question Five (which required participants to grade the aesthetics on a scale of 1-6), the answers were identical those they gave in question 1, except for Participant 5, who changed from 4 to 5.
The results for Question Six were similar: once again all participants agreed that they would like to see a similar display in the building foyer. Two of them also noted that such a display would be contextually very appropriate within an IT building.
For Question 7, three of the users were able to suggest ways in which the display could be useful in daily life – these ranged from determining how full computer labs are, to gauging whether or not it would be worthwhile trying to contact someone within the building. The other three couldn’t see much use for the display as an information source, but felt that it still had value as a piece of art.
Regarding possible aesthetic improvements (Question 8), three of the users commented on the overall complexity of the display, and felt that it was trying to show too many different axes of information at once. They suggested that it might be better to simply leave out some of the information and aim for a cleaner, simpler interface. Two commented about the quality of the graphics (e.g. text wasn’t antialiased). Otherwise, the participants felt that the display as quite attractive.
In terms of the information being depicted, the main suggestions were to make the time in the bottom-left corner larger (one participant did not notice it until explicitly asked about it), use the position of the shapes to convey information instead of it being random, show finer-grain location data, and make sure that the key is clearly visible, either as part of the display or somewhere nearby.
In the final question, which deals with privacy, the participants all stated that as there are so many users in the system they did not consider privacy a concern: they noted that it is difficult to work out which shapes correspond to which users. They also felt that as the registered users have already given their consent to be shown on the display, they shouldn’t have any problem with their data being used in this way. Two participants noted that if there are only a few registered users in the building, privacy could become an issue, as it would be much easier to work out who the shapes were representing.
The participants also felt that there were no real privacy issues for unregistered users, since the data is
completely anonymised, and there are generally so many unregistered users in the building that privacy is guaranteed. One participant mentioned that it might also be a good idea to give unregistered users the option of hiding themselves from the system.
While all of the participants stated that they would be quite happy to register with the system, they varied in the information they would be willing to have shown on the display. Five said that they would be happy for the display to show their current location, as well as how long they had been in the building. Three said that they would not mind their name being shown on the display, although one of them said that if his name were shown, he would want his location kept secret. One user stated that he would not want to share any additional information.
Three of the participants had no additional comments regarding the privacy of the system, but the other three stated that people should be notified that their data is being collected upon entering the building, and should also have the ability to find out how much information the system is actually collecting about them. 5. Conclusions
We have described the design of LAVAlamp, an information display designed to help build community awareness. Even allowing for the potential that participants were likely to be polite, the qualitative evaluation suggests that it meets its key information and aesthetic goals, and would be suitable for use in a large workplace. 6. References [1] S. Izadi, A. Sellen, J. Kaye, B. Brown, A.S. Taylor and R. Eardley, Locating Family Values: A Field Trial of the Whereabouts Clock, 9th International Conference, UbiComp 2007, Proceedings, pages 354-371, 2007.
[2] A. Dahley, M. Gorbet, S. Brave, B. Ullmer, C. Wisneski, H. Ishii and P. Yarin, Ambient Displays: Turning Architectural Space into an Interface between People and Digital Information, Cooperative Buildings, Integrating Information, Organization, and Architecture: First International Workshop, CoBuild'98, Darmstadt, Germany, February 1998. Proceedings, page 22, 1998.
[3] P. Dourish and S. Bly, “Portholes: Supporting Awareness in a Distributed Work Group”, Proceedings
of the SIGCHI conference on Human Factors in Computing Systems, pages 541-547, 1992.
[4] T.J. Costa, J.F. McCarthy, E.M. Huang and J. Tullio, Promoting Awareness of Work Activities through Peripheral Displays, CHI ’02 Extended Abstracts on Human Factors in Computing Systems, pages 648-649, 2002.
[5] T. Skog, J. Redstrom and L. Hallnas, “Informative Art: Using Amplified Artworks as Information Displays”, Proceedings of DARE 2000 on Designing Augmented Reality Environments, pages 103-114, 2000.
[6] Z. Pousman, C. Plaue, J. Stasko, T. Miller and O. Ullah, Personalized Peripheral Information Awareness through Information Art, 6th International Conference, UbiComp 2004, Proceedings, pages 18-35, 2004.
[7] T.J. Costa, J.F. McCarthy and E.S. Liongosari, Unicast, Outcast & Groupcast: Three Steps toward Ubiquitous, Peripheral Displays, 3rd International
Conference, UbiComp 2001, Proceedings, pages 332-345, 2001.
[8] A. Lau and A.V. Moere, Towards a Model of Information Aesthetics in Information Visualization, Proceedings of the 11th International Conference Information Visualization, pages 87-92, 2007.
[9] J. Kay, M. Assad, D.J. Carmichael and B. Kummerfeld, MyPlace Locator: Flexible Sharing of Location Information, 11th International Conference, UM 2007, Proceedings, pages 410-414, 2007.
[10] J. Kay, M. Assad, D.J. Carmichael and B. Kummerfeld, PersonisAD: Distributed, active, scrutable model framework for context-aware services, 5th International Conference, PERVASIVE 2007, Proceedings, pages 55-72, 2007.
[11] C. Reas, and B. Fry, Processing: A Programming Handbook for Visual Designers and Artists, MIT Press, 2007.

Exposing Contextual Information for Balancing Software Autonomy and User Control in Context-Aware Systems
Bob Hardian1, Jadwiga Indulska1, Karen Henricksen2
1School of Information Technology and Electrical Engineering, The University of Queensland {bhardian, jaga}@itee.uq.edu.au
2 NICTA, Queensland Research Laboratory [email protected]
Abstract
Context-awareness in pervasive computing environment can reduce user interactions with computing devices by making applications adaptive and autonomous. Context-aware applications rely on information about user context and user preferences to guide their own behaviour. However, context-aware applications do not always behave as users expect due to imperfection of context information, incorrect user preferences or incorrect adaptation rules. This may cause users to feel loss of control over their applications. To mitigate these problems context-aware systems must provide mechanisms to strike a suitable balance between user control and software autonomy. Allowing users to scrutinise the system and allowing the system to sometimes include users in the adaptation decision making, can provide balance of user control. This paper presents our research on instrumentation of context-aware systems to allow run time system scrutiny for users with various levels of expertise in computing systems.
1. Introduction One of the goals of pervasive computing is to
decrease user’s distractions by reducing user interactions with computing applications: i.e., to make applications more autonomous and proactive. Such applications need to place greater dependence on context information (be context-aware) in order to dynamically adapt their behaviour to the environment and user requirements. As the context information upon which they base adaptation decisions can be imperfect (unknown, ambiguous, imprecise, or erroneous) [1], context-aware applications may not always adapt or
behave as the user expects. As the result users may feel loss of control over the behaviour of their applications. This unwanted behaviour may also occur due to incorrect user preferences or incorrect adaptation rules. Therefore, context-aware systems must strike a suitable balance between user control and software autonomy.
The design space for providing user control in context-aware applications can be characterised in terms of the continuum shown in Figure 1.
At the leftmost end (A), users are given full control over application behaviour, and applications have very little autonomy. Applications designed in this way are the most interactive. Conversely, at the other end (C), applications only require a small amount of user control, while pro-activity and autonomy play important roles in reducing interactions with users.
Applications can occupy any intermediate position on the continuum (position B). However, it cannot be assumed that one position is always better than another for a given application. The appropriate position along the continuum will be dictated by the user’s needs, situation and expertise.
In traditional applications, the trade-off between user control and software autonomy has been fixed at design-time. In contrast, context-aware applications may need to adjust the balance of user control and software autonomy at run-time by adjusting the level of feedback to users and the amount of user input.
Figure 1. Continuum of user control versus software autonomy
User controlApplication autonomy
A CBA

In context-aware applications, context information, preferences and adaptation rules dictate the application behaviour. Providing users with explanations of the system’s behaviour, when it is requested, and allowing the users to provide feedback to the system, will allow the users to feel that they are in control of the context-aware applications and are able to modify/improve their behaviour. This requires a mechanism for exposing context information, user-specific requirements/preferences and also a decision logic specified by the application designers. One of the great challenges is to provide explanations that are suitable for users with various levels of expertise in information technology.
This paper describes the instrumentation of context-aware systems that is designed to provide a balance of control for users with various levels of expertise. The structure of the paper is as follows. Section 2 presents related work and is followed by Section 3 that describes some background information about the context and preference models used in our solution. Section 4 discusses the requirements for revealing context information, preferences and adaptation rules. Sections 5 and 6 describe the design and implementation of the system, respectively. Finally, Section 7 concludes the paper.
2. Related work This section briefly reviews relevant approaches for
providing user control of context-aware systems. In general, the problem of balancing control between users and applications has not been fully addressed yet. The most advanced approaches are end-user programming, an extension to the Context Toolkit proposed by Newberger and Dey [2], and preference-based decision support described in this section.
2.1. End-user programming End-user programming allows users, rather than
application developers, to define the behaviour of context-aware applications. It aims to ensure a closer match between user requirements and system behaviours than is often achieved with traditional software engineering approaches, and allows users to add functionality that could not have been anticipated by system designers.
One example of an end-user programming system is a CAPpella [3], which supports a paradigm calledprogramming by demonstration. a CAPpella requires the user to demonstrate desired system behaviours by carrying out actions manually. It relies on machine learning techniques to build recognizers to detect the
situations in which the actions should occur. Once the system has been trained, it is able to carry out actions automatically without prompting from the user.
The Topiary tool [4] incorporates a simpler form of programming by demonstration for recording scenarios for prototyping purposes. However, it is not truly an end user programming solution – instead, it aims to support application designers by allowing them to create map-based location models, develop scenarios by moving objects around a location map, and create and run storyboards. Topiary is focused exclusively on location-based applications.
The Jigsaw editor [5] differs from a CAPpella and Topiary in that it supports end-user programming by assembly, rather than programming by demonstration. It provides a visual interface based on a jigsaw puzzle metaphor, which enables end-users to connect together components, such as sensors, displays and applications, to carry out tasks. Jigsaw primarily targets domestic environments – for example, by enabling users to construct doorbells or simple surveillance systems from input and output devices in the home.
Although end-user programming techniques generally provide better user control than traditional software engineering techniques, they are not appropriate for all application domains. They are most appropriate when the required system behaviours are reasonably straightforward. The simple tasks commonly described in the literature – for example, controlling lights or creating doorbells – are indicative of the level of complexity that can currently be achieved by end-user programming systems. A further problem is that most of the literature on programming by demonstration deals only with how to train the system initially, not with how to later override or modify behaviour (for example, when unexpected actions arise or user requirements change).
2.2. Context toolkit extension Newberger and Dey [2] propose a very specific
solution for application control, based on Dey et al.’s Context Toolkit [6]. This is based on the idea that if application state information is exposed in an accessible way, it can be leveraged for building separate user interface components that allow monitoring and control. The solution introduces an enactor component into the Context Toolkit. The idea behind this component is to encapsulate application state information and adaptation logic, and to facilitate external access through the provision of a standard API. This allows user interface components, such as Macromedia Flash components, to easily communicate with enactors. These user interface components can
support monitoring and control of the enactor, thereby facilitating fine-tuning of the enactor behaviour by the designer. Enactors have the following standard sub-components: references (for acquiring context data from widgets), listeners (for monitoring changes), and parameters (for controlling the behaviour).
Although this solution is primarily intended for use by application designers, it is easy to see that a similar solution could be developed to allow users to monitor and control context-aware behaviour.
2.3. Preference-based decision support One traditional approach to provide users with
control over their software is to incorporate preference or personalisation mechanisms. Personalisation of context-aware applications is more complex than personalisation of traditional applications, because of the potential for dependencies between the context and user preferences (specifically, user preferences may be predicated on the context).
Although there exist context-aware applications that allow configuration of user preferences, there are few general models and programming tools that support adaptation of application behaviour based on a combination of context and user preference information. Such models have been developed by Henricksen et al. [7]. This solution includes a generic preference model used to specify context-dependent user preferences, and programming models (the branching and triggering models) that allow preferences to be combined and evaluated together with context information to support adaptation decisions. Henricksen et al. have developed a variety of context-aware applications using this approach [8], and found that it improves user control, but does not always improve transparency and predictability, particularly when the preferences are complex.
3. Context and preference modelling Balance of user control in context-aware systems
can be achieved by providing a sufficient understanding of a system’s view of the context information, preferences and logic used to arrive at adaptation decisions. It requires selectively exposing some of the internal application state to users in the form appropriate for the user’s expertise. By exposing these types of information, users are better positioned to understand and correct inappropriate actions than when context-aware systems are developed in the form of “black boxes”. This, in turn, increases user control, as users may be able to trace inappropriate behaviours back to incorrect context or preference information (or
even to failed or mis-configured sensors), and to correct this information accordingly.
To date, the context-awareness community has placed much more emphasis on generic models of context information than on modelling preferences and adaptation logic. Preferences and adaptation logic are often handled directly within the application, in a manner that makes the logic relatively difficult to change or expose to users. The context modelling techniques developed so far provide a natural starting point for research on generic (i.e., application-independent) models for exposing adaptation decisions and the means by which they were derived, to users.
As our goal is to provide a generic solution for balancing user and application control, the work needs to build on formal context and preference models. As Henricksen et al.’s work, described in Section 2.3, is one of the few solutions that provide rich and generic context and preference models, we use these models as a starting point in our research. To support user control and feedback, we need to extend the middleware for context-aware applications that is based on these models. In our previous work, we have already extended the middleware by instrumenting it to provide traces of context and preference evaluations [9]. In this work we present the whole middleware extension responsible for providing balance of control. In the remainder of this section we briefly describe Henricksen et al.’s context and preference models as they play an important role in our solution presented in Sections 4 and 5.
3.1. Modelling context In Henricksen et al’s work, context is modelled
using the Context Modelling Language (CML). CML provides a graphical notation that assists designers with the tasks of exploring and specifying the context requirements of a context-aware application. The modelling approach provides two levels of abstraction: facts, which capture fine-grained information, and situations, which describe abstract classes of context described in terms of facts. CML is able to distinguish various types of context information, based on persistence and source (i.e., sensed, static, profiled and derived context), and allows quality of context information to be modelled.
The situation abstraction is intended as a means to define conditions on the context in terms of the fact abstraction of CML. Situations are expressed using predicate logic, and may evaluate to true, false or possibly true. As most users do not understand the predicate logic an appropriate mechanism to reveal situations to users is needed.

3.2. Modelling preferences The preference model builds on the situation
abstraction. Preferences work based on a scoring mechanism where users can assign a score in a particular context situation. The scores assigned by user’s (or multiple users’) preferences can be dynamically combined with system’s preferences, to support decision making on how a context-aware application should adapt.
Each preference takes the form of a named pair consisting of a scope and a scoring expression. The scope describes the context in which the preference applies in terms of situations. A preference is considered applicable within a given context only if the scope expression is true. The scoring expression assigns a score to a choice and increasing scores represent increasing desirability. This model supports the ranking of a set of candidate choices. Adaptation occurs within a context-aware application depending on the ranking.
3.3. Adaptation logic The context and preference models are used as a
basis for the application adaptations. There are two basic models for adaptation in context-aware applications: (i) application-initiated evaluation of the current
context and user preferences (i.e. application queries on context and preferences) to select a set of adaptation actions that suit the current context situation, and
(ii) adaptation triggered by context changes – i.e., a notification based approach in which applications subscribe for notifications about context changes. Re-evaluation of the current context information and preferences may trigger a notification about a change in situation and invoke an adaptation.
In both cases, an adaptation action is selected based on a set of rules which link both the particular values of context information and user/system preferences to particular adaptation actions. In Henricksen et al. these types of adaptation are implemented using the branching and triggering programming models (implemented by a programming toolkit), respectively.
The branching model supports a context and preference dependent choice amongst a set of alternatives. The triggering model is based on events, such as context changes, where a set of rules linking events with corresponding actions are defined by application designers (and potentially by users).
4. Requirements on revealing information In order to provide an appropriate control, the user
needs to understand how the applications operate, such as which context information and logic is used to arrive at certain automated actions (adaptations). Context-aware applications need to ensure that actions taken on behalf of users are both intelligible and accountable [10, 11]. By providing this information, users may be able to correct undesirable actions (for example, by changing context information or preferences appropriately). However, users can have varying levels of expertise in information technology, and this affects their understanding of system operations. This means that the system is required to provide mechanisms to tailor the exposed knowledge to a variety of users. Therefore, the challenge is not only to identify what application state information should be exposed, but also in what manner (e.g., with what level of explanation). In this section we discuss a set of requirements that have to be met to successfully reveal internal states of context aware applications to users with various levels of expertise.
4.1. Revealing context information Developing context-aware applications requires a
model for making some context affordances visible –i.e., exposing context information to users and differentiating the exposed information based on various levels of user expertise. The solution requires answering the following questions: • which context information used by applications
should be exposed and when the context information should be exposed so that the users develop a better understanding of the adaptation process used in the application, and
• how context facts and situations (expressed using predicate logic) are explained.
In order to decide which context information should be exposed, four issues need to be taken into account: (i) which types of context information are used by the application (i.e., which fact types), (ii) which current context facts are being evaluated by the application, (iii) what is the current state of the context information of the application (i.e., the current values of the fact instances), and (iv) which context fact instances are relevant to the particular user who is interacting with the application.
To define conditions on the context in terms of facts, the situation abstraction is used. These situations are expressed using predicate logic which is not easy for the end user to understand. Therefore, the use of

textual explanation or perceptual cues (visualisation, sounds, etc.) in exposing context information or situation can facilitate user understanding.
4.2. Revealing preference information In context-aware systems, users may need to
explicitly formulate their own preferences. This feature is provided by Henricksen et al., as discussed previously in Section 2.3. In this model, users provide simple preferences, and these are combined by the system to support potentially complex behaviours. However, the end result of this preference combination may be different to what the user intuitively expects. Therefore, the design for user scrutiny of the system behaviour needs to facilitate the users in viewing the particular preferences and context information that led to past application actions, and thereby allow them to “debug” and correct recurring problems.
The design requirements include how to expose: (i) the user’s preferences, (ii) other relevant preferences (e.g., system preferences describing system default behaviours), and (iii) the process used to combine the preferences for decision making. The mechanisms for exposing preferences should vary according to the nature of the application, and should be integrated as naturally as possible into the application’s user interface.
Our work extends Henricksen et al.’s solution by developing a mechanism for exposing preference information in a user-understandable manner, and thereby providing transparency, so users are able to understand the reasons for application adaptations, and to correct preferences if desired.
4.3. Revealing adaptation logic As discussed in Section 3.3, the adaptations are
implemented using branching and triggering programming models (implemented in the programming toolkit). Using both approaches, application developers have options to put the adaptation logic either inside or outside the application code. However, it is suggested to remove the adaptation logic involved in context-dependent choices from the application code. This means that mechanisms which reveal adaptation logic can be made transparent to the application.
For both of these models, the system should facilitate revealing selected aspects of the adaptation logic to users at run-time, as the adaptation occurs. As adaptation decisions are based on context and preference evaluations, as well as the current application state, the system should vary on how much
of the context and preference evaluation traces and the internal application state should be exposed and in what form this information should be exposed. In this research, it is assumed that the application developer uses the programming toolkit to externalize the adaptation logic.
4.4. Accounting for user expertise User control in context aware systems can be
enhanced by providing the user with the understanding of the current context, disclosing actions taken by the system, providing feedback to the user, and providing mechanisms for user control. However, users have different requirements and capabilities when it comes to interacting with context-aware systems. This means that the system needs mechanisms to tailor the exposed knowledge to a variety of users.
Over-exposing information might be acceptable for novice users, but it might be annoying for expert users, as one of the main objectives of context-aware systems is to reduce interaction with users and decrease user distraction. Context-aware systems need to vary the amount and nature of feedback, explanations, and control provided to users with respect to user’s requirements and capabilities. To support this, a model of user expertise that is suitable for use in context-aware systems is needed. Dreyfus et al. [12] discuss the need for fine-grained levels of expertise, and examine whether it is possible to build systems that can behave based on five levels skill acquisition. This work provides a valuable starting point, but does not specifically address the challenges of context-aware systems. The proposed solution should address this problem.
Several approaches that can be used for assessing user expertise include asking the user directly whether (s)he belongs to the expert/novice category; modelling user expertise based on inferring the user’s behaviour; or modelling through a selective questioning process. It is necessary to examine which of these approaches are suitable for various kinds of context-aware applications.
Finally, the user’s level of expertise should not only determine how much information but also what information should be revealed. At the lowest user’s level, the systems require exposing minimal amount of information to avoid confusing to the novice user, but the information should be more descriptive and possibly presented as multimedia (visualization, voice) to provide appropriate explanations. Conversely, at the highest user’s level, the systems may reveal all process traces, but it should be with minimal explanation.

5. System design There are two important aspects in providing
balance of control for context-aware applications. The first aspect is how the system reveals the knowledge of the system and its environment, so the user understands the behaviour of the context-aware application. The second aspect is how the user exploits the revealed information from the system and applies appropriate feedback to control the system behaviour. Hence, the design of the systems is a closed loop system where the user is put into the loop. There is an assumption that the user may request an explanation about the current application behaviour at any time during the execution of the application.
As already mentioned, our system for balancing control between users and applications is an extension of the previously developed middleware for context aware applications described in [8]. Figure 2 shows the system architecture in which the shadowed components represent parts of the previously developed middleware while the white components show the extension. The role of the new components is to facilitate (i) user scrutiny of the system (scrutiny of adaptation decisions and context information and preferences used to arrive at the decisions), (ii) user feedback to the system (e.g. change of preferences or user profile), and (iii) support for the application designer in preparation of the explanations used in (i). The users are able to scrutinise the system behaviour after evaluations have been made of the current situation.
Figure 2. The design of balancing control for context-aware systems
In the remainder of this section we describe the functionality of all components of the system.
The Context & Preference Manager is the previously developed component of the middleware [8], which manages models and instances of context and preference information. Each application has its own context information model represented as a set of fact types, a set of situations built from these facts, and
preferences associated with particular situations. As application’s adaptations are made by evaluating the current context facts, situation and preferences, the traces of this evaluation need to be recorded, so the user can scrutinize the evaluation process if needed. In our previous paper we reported on our work on instrumenting the Context & Preference Manager to trace evaluation of context facts, situation, and preferences [9].
The Programming Toolkit was built to ease programming of context-aware applications [8] by removing context and preference evaluation from the context-aware applications. As described in Section 3.3, an association between context situations and appropriate adaptation actions are specified in the Programming Toolkit. We extended the toolkit to trace the use of these adaptation rules at run time.
The Semantic Manager is a new component that holds semantic information required for explanations of the application behaviour. The Semantics Manager is responsible for three categories of information. Descriptions of context, situations, preferences, and adaptations rules are the first category of information managed by the Semantic Manager. The manager also stores additional information that can be used to support exposing this application state information to the users. This additional information could be of any multimedia type (such as sound, video, etc). It could even be a software component (simulation/animation) that could be run to support the explanation. There is an assumption that the required description (i.e. explanations about context, preferences, and adaptation rules for users with various levels of expertise) is prepared by the designer of the application. However, the designer is supported by the system which shows which context, preferences and adaptation rules belong to the particular application and should be explained. The designer is able to reuse the explanations if particular context information, preferences or rules have been already defined for other context-aware applications. The Semantic Manager has a rich interface (developed in Java) to allow retrieval of the descriptions and retrieval and instantiations of the multimedia components. Examples of the interface operations are: public ContextSemantic getContext(String contextName) throws RemoteException;
public SituationSemantic getSituation(String situationName) throws RemoteException;
public PreferenceSemantic getPreference(String preferenceName) throws RemoteException;
Context & Preference
Manager
Context and preference change Information Filter
&Explanation Generator
USER
Exposed application state information
User PreferenceDatabase
User Preference
User feedback
Informationrequest (scrutinize)
ContextDatabase
TracesDatabase
Programming Toolkit
Des
crip
tions
Con
text
Gra
ph
Use
r Mod
el
Semantic Manager
Des
crip
tions
Con
text
Gra
ph
Use
r Mod
el
Semantic Manager

Semantic explanations are written in the XML format. For example, a simple adaptation explanation may be written as follows: <adaptation> <name>Silent</name> <description profile="Novice" type=”txt”> The adaptation to the Silent profile is made to have little or no noise. Good for occasions when calls can be ignored and dealt with later. </description> <description profile="Competent" type=”txt”> In the Silent profile the phone will make little or no noise. </description> <description profile="Expert" type="audio" > silent.wav </description> </adaptation>
When the user decides to scrutinise the application behaviour, the information revealed to the user will be related to the current adaptation. This explanation can be further enhanced to support user’s understanding of the whole application by showing the user all the possible application adaptations and indicating the current one in this set. For this purpose we adopted the Contextual Graph approach [13] to show a graph of the application’s adaptation decision points and adaptation actions which can be taken at these decision points. We highlight the current adaptation in this graph. The context graph information is the second category of information managed by the Semantic Manager. We provide the designer with a tool to automatically generate the context graph based on the situation model and the association of situations with the adaptations.
The third category of information managed by the Semantic Manager is the User Model. It describes user profiles showing levels of expertise of users. In our approach we defined three level of user expertise: novice, competent, and expert. The user profiles are stored in XML format, for example: <profile> <name>Novice</name> <description> The profile is for a novice user. It shows minimal information but additional information may requested by the user </description> <properties> <name>ShowingAdaptation</name> <value>true</value> </properties> <properties> <name>ShowingContext</name> <value>false</value> </properties> <properties> <name>ShowingPreference</name> <value>false</value> </properties> <properties>
<name>ShowingSituation</name> <value>false</value> </properties> <properties> <name>ShowingEvalTraces</name> <value>false</value> </properties> <properties> <name>ShowingContextGraph</name> <value>false</value> </properties> </profile>
This profile indicates that the information shown to novice users is only the adaptations information, and no context, preferences, situations, evaluation traces, or context graph are exposed to the users.
The Information Filter & the Explanation Generator decides on what application state information and in which way is presented to the user. The Information Filter selects the information from the Semantic Manager and the Context & Preference Manager. The Information Filter selects the required information when quizzed by the user at run-time. The Explanation Generator matches the explanations to the user’s level of expertise.
6. System implementation The implementation of the middleware extension
described in Section 5 is illustrated in Figure 3.
SemanticDatabase
(xml)
UserModel(xml)
ContextGraph(xml)
ContextWindows
PreferenceDatabase
(sql)
TracesDatabase
(sql)
ContextDatabase
(sql)Context &PreferenceManager
Semantic Manager
ProgrammingToolkit
Context-aware phone
Figure 3. Systems implementation
We implemented the Semantic Manager and the ContextWindows component. The latter implements the information filter, the explanation generator and the user interface to the system. ContextWindow reacts to user requests for application behaviour explanations and interacts with the Semantic Manager and the Traces Database in order to select information from the traces and match it with the behaviour descriptionsbased on the user profile (level of expertise).

All the extensions are implemented using Java programming language. Java RMI is used for the interactions between ContextWindows and the Semantic Manager and also for ContextWindows subscriptions to the Context Manager for evaluation traces. For the Managers’ databases, both PostgreSQL DBMS and XML text files are used.
We have developed a proof of concept application of a context-aware phone and tested the extended middleware on this application by revealing its adaptations on user requests. This included exposing context information, situations, and preferences being used to switch the phone to defined profiles (i.e.:general, silent, meeting, etc) and adjusting the explanations the user expertise level.
7. Conclusions As adaptation decisions in context-aware
applications are often based on imperfect context information it is necessary to introduce some balance of control between users and applications by allowing users to scrutinise the applications’ behaviour and providing feedback that can modify the behaviour.
In this paper we described our extension of the middleware for context-aware applications that allows revealing behavioural information (context information, user preferences, and adaptation rules) to user with various levels of expertise in information technology. The proposed approach is generic - it assumes that context-aware applications are built based on well defined models of context facts, situations, preferences, and adaptation rules, and applies these models to reveal application adaptations and the reasoning that led to these adaptations.
The extension supports the application designers in preparations of behaviour explanations. Based on the models, the designer is shown which context, preferences and rules are relevant to the application and require explanations. In addition, a context graph of the application is also generated for the designer based on the models and can be further tuned by the designer before it is used for user explanations. The context graph shows all possible adaptations and decision points for these adaptations. The designer support will also be useful for usability studies of context-aware applications as it allows easy modifications of the behavioural explanations.
8. References [1] K. Henricksen and J. Indulska, "Modelling and using
imperfect context information," in Pervasive Computing and Communications Workshops, 2004. Proceedings of
the Second IEEE Annual Conference on, 2004, pp. 33-37.
[2] A. Newberger and A. Dey, "Designer Support for Context Monitoring and Control," Intel Research Berkeley Technical Report IRB-TR-03-017, 2003.
[3] A. K. Dey, R. Hamid, C. Beckmann, I. Li, and D. Hsu, "a CAPpella: programming by demonstration of context-aware applications," in Proceedings of the SIGCHI conference on Human factors in computing systems. Vienna, 2004, pp. 33-40.
[4] Y. Li, J. I. Hong, and J. A. Landay, "Topiary: a tool for prototyping location-enhanced applications," in Proceedings of the 17th annual ACM symposium on User interface software and technology. Santa Fe, NM, USA: ACM Press, 2004, pp. 217-226.
[5] J. Humble, A. Crabtree, T. Hemmings, K.-P. Åkesson, B. Koleva, T. Rodden, and P. Hansson, "Playing with the Bits - User-Configuration of Ubiquitous Domestic Environments," presented at Proceedings of the 5th annual conference on ubiquitous computing, 2003.
[6] A. K. Dey, G. D. Abowd, and D. Salber, "A conceptual framework and a toolkit for supporting the rapid prototyping of context-aware applications," Human-Computer Interaction, vol. 16, no. 2-4, pp. 97-166, 2001.
[7] K. Henricksen and J. Indulska, "Personalising Context-Aware Applications," in OTM Workshop on Context-Aware Mobile Systems, vol. 3762, Lecture Notes in Computer Science: Springer-Verlag, 2005, pp. 122-131.
[8] K. Henricksen and J. Indulska, "Developing context-aware pervasive computing applications: Models and approach," Pervasive and Mobile Computing, vol. 2, no. 1, pp. 37-64, 2006.
[9] B. Hardian, "Middleware support for transparency and user control in context-aware systems," in Proceedings of the 3rd international Middleware doctoral symposium. Melbourne, Australia: ACM, 2006, pp. 4.
[10] V. Bellotti and K. Edwards, "Intelligibility and accountability: Human considerations in context-aware systems," Human-Computer Interaction, vol. 16, no. 2-4, pp. 193-212, 2001.
[11] S. Anderson, M. Hartswood, R. Procter, M. Rouncefield, R. Slack, J. Soutter, and A. Voss, "Making Autonomic Computing Systems Accountable: The Problem of Human-Computer Interaction," in Proceedings of the 14th International Workshop on Database and Expert Systems Applications: IEEE Computer Society, 2003, pp. 718.
[12] H. L. Dreyfus, S. E. Dreyfus, and T. Athanasiou, Mind over machine : the power of human intuition and expertise in the era of the computer. New York: Free Press, 1986.
[13] P. Brézillon, "Context Dynamic and Explanation in Contextual Graphs," in Modeling and Using Context, vol. 2680, Lecture Notes in Computer Science: Springer-Verlag, 2003, pp. 94-106.

Monitoring System in Ubiquitous Smart Space�
Hyo-Nam Lee1, Sung-Hwa Lim1, Byoung-Hoon Lee1, Dong-Wook Lee1, Jai-Hoon Kim1, We-Duke Cho2
1Graduate School of Information & Communication, Ajou University, South Korea {narsisse, holyfire, componer, dwlee, jaikim}@ajou.ac.kr
2Center of Excellence for Ubiquitous System, Ajou University, South Korea [email protected]
� This research is supported by Foundation of ubiquitous computing and networking project (UCN) Project, the Ministry of KnowledgeEconomy(MKE) 21st Century Frontier R&D Program in Korea and a result of subproject UCN 08B3-S2-10M
Abstract
Many studies have been focused on the construction of convenient ubiquitous systems and their applications. Ubiquitous smart space consists of a ubiquitous environment to provide more convenient and intelligent service for users using the cooperation of diverse ubiquitous objects. In the ubiquitous smart space, it is necessary to monitor and analyze not only the individual function, performance and status of the ubiquitous objects but also the cooperative status.
This paper discusses the problems of the existing monitoring systems to adopt in ubiquitous smart space, and proposes the 7 requisites of a monitoring system to manage and monitor the ubiquitous smart space. We developed a monitoring system and applied to a ubiquitous smart space scenario to verify our proposal.
1. Introduction
Advances in ubiquitous technology allow users to utilize information whenever, wherever, whoever, at any circumstances through the connection with various smart devices. These Ubiquitous computing environments is called U-city environment, linkage of U-Home, U-Education, U-Traffic, U-Health, U-Government, and U-Shopping, which is applied to our daily life. It is required for user's satisfaction and QOS to provide systems outstanding reliability, availability, security, and safety [1].
In the ubiquitous environment, various types of smart objects are interconnected to provide proper services in the distributed situation. Inefficiency or faults can occur on these interconnections(e.g. bottleneck, connection error, malfunction of
collaboration, etc) which decrease performance of the system and satisfaction of users. Therefore, it is necessary to provide intelligent and periodic real-time monitoring services to check whether all service functions are working correctly in the ubiquitous smart space [2,3].
Many studies have been focused on the construction of convenient ubiquitous system and its application systems. However, to expand the application areas of ubiquitous technologies and to provide more convenient and continuous services, it is necessary to monitor and manage the components, resources and services through the administrative monitoring system. That is, in the ubiquitous smart space, diverse ubiquitous objects should be monitored and analyzed to be aware of current function and performance of services. Moreover, we can exploit these monitored information to infer current high-level situation, and to supply the appropriate information according to the diverse demand patterns of users [4].
In the ubiquitous environment, the vulnerable characteristics of the infrastructures, applications, and services are as follows: - Damage of infra (natural disaster or accidents) - Malfunctions of H/W, S/W and structural faults - Errors on services and applications - Faults of members that constitute a service - Limits of context aware techniques - Possibilities of excessive overhead and resource collision of smart objects
- Imperfect guarantee of service performance - Difficulties for online real-time managements
We also developed a monitoring system and applied to a ubiquitous smart space to verify our proposal. Monitoring system monitors function, performance and status of ubiquitous smart space.

Ubiquitous smart space consists of many kinds of ubiquitous objects to provide more convenient and intelligent service for users through the cooperation of diverse ubiquitous objects.
The technologies for the conventional monitoring methods are summarized in Table 1 which describes the characteristics and limitations of the technologies [5,6,7,8]. Current research areas for the monitoring method are limited to application software or hardware devices. Therefore, the previous monitoring systems are inappropriate for ubiquitous smart space.
Table 1. Analysis of related research System Limits
GAIA [5] • For system construction
Genesis [6] • No performance measurement
Empirix [7] • Subordinated to specific web application and performance evaluation
Infranix [8] • Can not manage about each unit
resource • Not appropriate for small size system
2. What Monitoring System Should Do for Ubiquitous Environment
It is important to note the requirements for the monitoring systems in the ubiquitous smart space environment. To develop and to employ an appropriate monitoring system for ubiquitous smart space, the following conditions need to be satisfied.
1) The addition and removal of ubiquitous objects should be easy to perform.
Various ubiquitous objects cooperate in a ubiquitous smart space. Due to the dynamic changing characteristics (user's movement, environmental changes, etc), it should be able to adjust to the changes. Therefore, the monitoring system should be able to dynamic addition and removal for ubiquitous objects using reconfiguration and adaptation.
2) It should be able to monitor not only the individual status of the ubiquitous objects but also the cooperative status.
There are various ubiquitous objects that need to be monitored in a ubiquitous smart space such as equipments, applications, services, and communications. It is important to monitor functions, performance, and status. However, the monitoring system should be able to observe the cooperative status of these ubiquitous objects. Errors can occur during the
interlocking of smart even if individual equipments have no errors. For an example, it should be able to monitor bottlenecks or errors during interlocking.
3) It should be able to process a variety of collected data to inference current situations data. A monitoring system in the ubiquitous environment
should be able to not only monitor the functions, performance, and status of an object but also provide feedback to provide the appropriate service for users. Moreover, it should be able to determine which objects are malfunctioning. For an example, it provides a feedback on whether the presented service has been appropriate to the user's behavior through the pattern perception technique. Moreover, while it presents the service it percepts the faults of ubiquitous objects and provides the feedback on the error possibility of objects.
4) Monitoring should be performed in real-time.Ubiquitous smart space exists in nearly every aspect
of our life. To provide the appropriate and optimized service all-the-time for all users, it should be able to monitor applications and services in real-time. Monitoring system should be able to process the functions of collecting, analyzing and displaying large amount of data within the required amounts of time. This means that it should guarantee processing data in real-time.
5) Monitoring should be light weight. Usually, ubiquitous objects in ubiquitous smart
space are required to operate in real-time. Therefore, the monitoring system should not seriously affect on the performance and functions of target object in ubiquitous smart space.
6) Both central-control and distributed-control methods for the monitoring should be utilized.
Various ubiquitous objects are distributed in the ubiquitous smart space environment. Therefore, distributed modules that collect data for each object being monitored are required. Each distributed module will embedded be on various ubiquitous objects. On the other side, it is required a central monitoring module which aggregates, filters, and analyzes collected information from distributed modules.
7) It should be able to clearly divide and develop the elements being monitored.The elements of the monitoring objects should be
clearly defined. The monitoring elements for hardware, software and communication, which are the ubiquitous objects, should be clear monitored and managed. It

should be also able to develop each monitoring module separately. The monitoring system should clearly divide independent and dependant parts to maximize the extension and portability.
3. Case Study
We developed an monitoring system and applied to a ubiquitous smart space is constructed for well-being home services by UCN (Ubiquitous Autonomic Computing and Network) [9].
3.1 Categorization of the elements being monitored
Figure 1 shows the categorization by level in order to extend its monitoring function to infer high level situation by analyzing the low level information monitored in a ubiquitous smart space.
Figure 1. Categorization by level
3.2 Examples of construction
Figure 2 and Table 2 show the monitoring system in ubiquitous smart space.
Figure 2. Architecture of monitoring system
Table 2. Feature of each module Module Feature
Agent • Register the ubiquitous objects • Collect the information of the objects
Monitoring Module
• Collect the data of the ubiquitous objects from several Monitoring Agents
• Categorize, filter, and aggregate the collected data
• Remove unnecessary information
Analyzing Module
• Categorize hardware and software elements from the data receive from the Monitoring Module
• Analyze and infer the received data, and create data
Viewer UI
• The information received from the Analysis Module
• Show the functions, performances, and status of the carious infra, applications, and services
3.3 Service scenario
Figure 3 and Table 3 show distribution of ubiquitous objects used for our test bed. [9]. The Sims game by MAXIS is used to draw Figure 3[10].
Figure 3. Well-being home scenario
Table 3. Ubiquitous objects Type Objects
Sensors Temperature Sensor, Humidity Sensor, CO2 Sensor, Pressure Sensor, Location Sensor, Finger scan Sensor, Voice Sensor
Devices Heater(2), Air cleaner, TV(2), Therapy, Air Conditioner, Light(2), Smart Table, Speaker, Magic Mirror, Stand
App. Infra Structure, Community Manager, Service Discovery, Context Broker, User Agent

The test bed is constructed for the well-being home scenario. When a user comes home, the magic mirror receives the information from user's bio clock and checks user's blood pressure, heart pulse, and body temperature. With the collected information, it determines user's stress index and provides an appropriate services for the user such as aroma therapy, music or illumination.
On monitoring system monitors the ubiquitous objects in this ubiquitous smart space. It can monitor not only the function, performance and status of the equipments but also their cooperative status. Moreover, it saves the data received from the objects to DB. In the analysis module, it infers the high-level context from the collected data. By supplying the information of error possibility, delay time, and user's satisfaction, it provides a stepping stone for better services. Figure 4 shows Viewer UI for manager or user to monitor each ubiquitous object.
Figure 4. Monitoring Viewer UI
Figure 4 shows screen shots of our monitoring system. It shows the overall flow of total system. It also shows the status of each module monitored. In addition, it presents the cooperative status of devices and applications at a glance. With different colors for warning, error, and error possibility, it is easy to discern. It can manage not only the total flow but also the minute elements such as the processing time of applications in the method unit and the data flow.
4. Conclusion
This paper discusses the problems in the existing monitoring systems, and proposes requisites for the monitoring system to inspect and manage the ubiquitous smart space. To verify our proposal, we design and apply our monitoring system for ubiquitous smart space to our test-bed. Monitoring system can monitor not only the separate status of each ubiquitous objects constructing ubiquitous smart space but also their cooperative status. On the basis of this research, many other studies on the monitoring system for ubiquitous environment will be carried out actively afterwards.
References
[1] Shiva Chetan, Anand Ranfanathan, and Roy Campbell, "Towards Fault Tolerant Pervasive Computing", IEEE Technology and Society, 2005, Vol. 24, No. 1, pp. 38-44.
[2] A. Ranganathan, R. H. Campbell, "A Middleware for Context-Aware Agents in Ubiquitous Computing Environments", ACM/IFIP/USENIX International Middleware Conference, Rio de Janeiro, Brazil, 2003, pp. 143-161.
[3] T. Gu, H.K. Pung, and D.Q. Zhang, "A Middleware for Building Context-Aware Mobile Services", IEEE Vehicular Technology Conference (VTC), 2004, Vol. 5, pp. 2656-2660.
[4] N. Kanaya, Y Tahara, N Kobayashi, S Suzuki, and S Sato, "Asynchronous Remote Event Notification Using a Distributed Object Model for Heterogeneous Remote Monitoring Systems and Control Systems at the 1.8-GeV Tohoku Synchrotron Radiation Source", Nuclear Science, IEEE Transactions, 2006, Vol. 53, Issue 5, Part 2, pp. 2853-2860.
[5] http://it.murdoch.edu.au [6] http://www.genesis.com [7] http://www.empirix.com [8] http://www.infranics.com/products_system.html [9] http://ubrain.net [10] http://www.maxis.com

Community-based Autonomous Service Activation and Failure Recovery in a Message-Oriented Pervasive Middleware
Chun-Feng Liao, Ya-Wen Jong, and Li-Chen Fu Department of Computer Science and Information Engineering
National Taiwan University, Taipei, Taiwan {d93922006, r96922022, lichen}@ntu.edu.tw
Abstract The message-oriented pervasive middleware is
getting considerable attentions in recent years. This type of middleware supports asynchronous, loosely-coupled, and reliable communication between software entities. However, little research has been done on service discovery, activation, and failure recovery issues in a message-oriented pervasive middleware. In this paper, we propose a community-based approach to deal with these issues. First, we define the Pervasive Node and Pervasive Communities object models. Based on the above models, community managers perform the service activation and failure recovery by negotiating on top of SSDP+, an enhanced version of SSDP. Next, we evaluate the feasibility of this work by implementing five pervasive services that support autonomous service activation and failure recovery. Finally, experiment results on service activation time as well as failure recovery time are presented and discussed. 1
1. Introduction Context-awareness has become a distinguishing
feature of pervasive systems. Pervasive services are usually triggered by “context”, which characterizes situation of a person, place, time, or device [1]. The “event-triggered” nature of system behaviors make message-oriented (or event-based) service architecture becomes a major point of research interest of pervasive middleware in recent years [2][3][4][5]. Messaging is a technology that enables asynchronous, loosely-coupled, and reliable communication. When compared with other paradigms, messaging is considered more immediate than file transfer, better encapsulated than shared database, and more flexible than RPC-style invocation [6]. The communication mechanism of a message-oriented system is supported by the message-oriented middleware (MOM). The MOM creates a “software bus” for integrating heterogeneous applications. The logical pathways between publishers and subscribers are called topics”, which reside in the MOM. Software entities (called “nodes”) in MOM
This research is supported by the National Science Council of Taiwan, under Grant NSC96-2752-E-002-007-PAE.
exchange messages via these logical pathways (see Fig. 1). Consequently, dependencies between “nodes” are removed: they depend on topics instead of depending on each other.
Based on the abovementioned “Node-Bus-Node” message-oriented architecture, the system can provide pervasive services by chaining nodes and topics together. For instance, node A, B, C, D, and F in Fig. 1 collectively provide an “adaptive air conditioner” service. In this service, node A and B are software adapter to wireless temperature sensors, node C is the context interpreter which transforms raw sensor data into high-level semantic context data, node D decides the commands to be taken by performing logical reasoning based on the acquired context data, and finally node F is responsible for controlling fans or air-pumps based on the commands issued by D.
Fig. 1: The Node-Bus-Node architecture
Adopting the message-oriented architecture in pervasive environments provides several benefits. First, this architecture comes up with unified abstractions of node behaviors. More specifically, all node behaviors can be reduced to three atomic forms: to receive messages, to process messages, and to send messages. Second, nodes are easy to mock and test. Consider node E in Fig.1, it can be tested separately without sensor node (node A) by using a mock node sending fake sensor messages. Finally, due to the loosely coupled nature, the failures of nodes are isolated. In Fig.1, if node A fails, other nodes are not affected.
Despite these advantages, to create a robust message-oriented pervasive system, there are still many issues to be explored:

1. The loosely-coupled nature of message-oriented architecture does not guarantee the availability of a device. For example, the “adaptive air conditioner” service will be unavailable if node C, D, or F fails.
2. Inappropriate activation of node causes Feature Interaction Problems [7]. If there are two instances of node D, then each command is issued twice, resulting in unexpected system behaviors.
3. It is tedious and error prone to maintain the state and lifecycle of nodes with human labors. Activating a service means to start up each participating node. Some of these nodes are required by two or more services at the same time while others’ behaviors are conflicting.
4. The message-oriented architecture does not deal with service discovery, which is an essential requirement in a highly dynamic pervasive environment.
The objective of this work is to deal with the challenges listed above. We begin by defining a Pervasive Node object model for message-oriented pervasive system, and then propose a community-based service activation and failure recovery mechanism on top of the object model. In order not to reinvent the wheel, we realize the above functionalities by extending portions of the SSDP (Simple Service Discovery Protocol) protocol stack, which is part of UPnP (Universal Plug and Play) [8], an ISO/IEC home networking protocol standard (ISO/IEC 29341) [9]. The reason for choosing SSDP/UPnP is three fold: (a) it is one of the few dynamic service discovery protocols that do not need a dedicated and centralized service registry [10], which is more feasible in a pervasive environment. (b) SSDP/UPnP is platform and language independent, as it is based on SOAP/HTTP protocol. (c) SSDP/UPnP is an ISO standard. The major weakness of SSDP is that it does not support property-based service lookup. In this paper, we also address this problem by enhancing SSDP with a key-value based service lookup mechanism.
The organization of the rest of this paper is as follows. In section 2 and section 3, we present the object models of Pervasive Node and Pervasive Communities, which provide proper contexts for successive discussions. In Section 4, we describe how to realize autonomous service activation and failure recovery by enhancing SSDP protocol. Section 5 shows the implementation and evaluation results of this work. Section 6 compares the proposed approach to related works. Finally, conclusions are presented and suggestions are made for further research.
2. The Pervasive Node object model Before entering into detailed discussions of
proposed mechanisms, we propose a Pervasive Node object model for a message-oriented pervasive middleware (see Fig.2). In this model, we will use the term “Pervasive Node” to refer to an atomic software entity in a message-oriented pervasive middleware.
Fig. 2: The Pervasive Node object model
As illustrated in Fig.2, there are two subtypes of Pervasive Node: Kernel Node and Service Node. Kernel Nodes are designed for administrative purposes. For example, the PSM (Pervasive Service Manager) and PHM (Pervasive Host Manager) perform node administration tasks instead of providing service to the user. We will discuss PSM and PHM in more detail in section 3. On the other hand, Service Node is the basic component of a pervasive service. In Fig.1, nodes A~F are classified as Service Nodes. We can further classify Service Node into 3 sub-categories according to their behaviors: 1. Sensor Node is used to specify the Service Node
that is capable of sending messages. 2. Actuator Node is used to specify the Service Node
that is capable of receiving messages. 3. Process Node is used to specify the Service Node
that is capable of both sending and receiving messages.
Fig. 3: States of a Pervasive Node

It is noteworthy that the names of sub-categories imply the primary behavior of nodes. Take nodes in Fig.1 as an example, node A and B are Sensor Nodes, which bridge to hardware sensors and always send messages to the SENSOR topic. Similarly, Node C and D are Process Nodes that encapsulate logics of message processing.
Fig.3 indicates the lifecycle of a Pervasive Node. Since a node is a software entity, it has to be installed on a host machine. The installation procedure includes: (a) place binaries of the Pervasive Node in a pre-defined file directory, and (b) register its metadata to PSMR (Pervasive Service Metadata Registry, we will discuss PSMR in more detail in section 3). After being installed, a node enters the “installed” state. Next the node can be loaded into main memory, starting in “dormant” state. Note that a node is “discoverable” in an UPnP network in dormant state, but it does not perform any message-processing task. A node enters “active” state when it is activated. Similarly, nodes can be removed out of memory by a “shutdown” service call, or fall back to “dormant” state by a “rest” service call. Having discussed about the Pervasive Node object model, now we are able to develop the concept of two interrelated virtual communities, which is taken up in the next section.
TABLE 1: Virtual Communities in Fig.1. Community Name Community
Type Community Members
Sensor Map Service Pervasive Service Community
A, E
Adaptive Air Conditioner Service
Pervasive Service Community
A, B, C, D, F
Server 1 Pervasive Host Community
A, B
Server 2 Pervasive Host Community
C, D, F
Server 3 Pervasive Host Community
E
3. Architecture of pervasive communities In this paper, we define the term “pervasive
community” as a collection of Service Nodes, which is meaningful for a specific task. To put it more precisely, two pervasive communities co-exist in a message-oriented pervasive system: From users’ point of view, the “Pervasive Service Community (PSC)” consists of one or more nodes that collectively provide a pervasive service to user; from the system administrator’s point of view, the “Pervasive Host Community (PHC)” means the collection of nodes that co-locates in the same computing device. Note that members of these communities are overlapped. Consider the system depicted in Fig.1, besides “adaptive air conditioner” service, node A and node E collectively forms a
“Sensor Map” service. If we deploy these nodes in 3 distributed computing devices, namely, server 1, server 2, and server 3, then there will be 2 PSC and 3 PHC in this system (see Table 1). PSC is meaningful to service user, since the users only care about the availability of services instead of the underlying locality of nodes. Instead, system administrators are mainly interested in PHC, since a computing device is usually the unit of maintenance. In the following subsections, we will examine the architecture of PSC and PHC from both structural view and operational view.
Fig. 4: The structure of a Pervasive Service Community.
3.1. Structural view of PSC and PHC In short, PSC is a group of Service Nodes that
collectively provide a pervasive service to the user. In Fig.4 we can see the structure of a PSC. Each PSC is composed of one or more Service Nodes. These PSCs are managed by a Pervasive Service Manager (PSM). PSM activates and manages its community members according to a PSDL (Pervasive Service Description Language). The PSDL keeps track of the corresponding service nodes needed by a pervasive service, including their criteria, the number of instances, restrictions and other information. Note that except from PSM, all members of PSC are dynamic. PSM is responsible for selecting Service Nodes that most fit the criteria specified in PSDL during runtime.
Fig. 5: The structure of a Pervasive Host Community.
As sketched in Fig.5, a PHC contains many Services Nodes located in the same machine in addition to a PHM that manages the lifecycle of these Services Nodes. Each node, after their installation in

the machine, registers their metadata to the PSMR, so that they can be enquired for. 3.2. Operational view of PSC and PHC
Now we will take a closer look at the collaboration between PSM and PHM when the system activates a pervasive service. Note that we focus on presenting overall ideas that facilitates service activation and failure recovery here. The protocol-level mechanisms are examined further in section 4.
Fig. 6: Interactions between PSM, PHM and Service Nodes when activating Sensor Map service.
The UML activity diagram in Fig.6 shows the interaction s between PSM, PHM and Service Nodes when activating Sensor Map service. To activate a service, The PSM will first issue discovery requests to find its community members, that is, Service Nodes listed on PSDL (i.e. node A and node E). PHM receives the discover requests and does service matching with the members located in the same host. If there is a match, PHM will load the node, starting in dormant state. Finally, after PSM finds out all its community members, it will issue commands to activate all Service Nodes at once. The pervasive service is now available. We will use the term “operative” to denote the state of a service when all Service Nodes listed in PSDL are properly activated.
After a service is operative, PSM is responsible for ensuring all members in its community are in active state. If one of them fails, then the service is “in-operative”. In this case, PSM will perform a failure recovery operation. Fig.7 indicates the interactions between PSM, PHM and nodes when performing fail recovery operation on the Sensor Map service. In Fig.7, PSM will notice that the node A, one of its service community members, fails. PSM will first try to use the nodes that are already loaded (i.e. in dormant or in activate state), since loading a service from disk to memory takes longer time than just activating a node that is already in memory. Therefore, the Sensor Map
PSM detects there is another node G matches its criteria and activates it. Assume that the node G is unstable and also fails after a short period of time and PSM can not find any loaded nodes; on that occasion the PSM will try to re-perform the service activation procedure mentioned above (see Fig.7, step 3-7). If PSM still can not find the needed nodes, then the service can not be recovered and PSM will have to report an error.
There are some details needs to be further elaborated, such as how does a PSM aware of the existences of other PHMs, what is the underlying negotiate mechanism, and what if there are multiple qualified Service Nodes found. These questions are to be addressed in the next section.
Fig. 7: Interactions between PSM, PHM and Service Nodes when perform failure recovery procedure of the Sensor Map service. 4. Autonomous service activation and
failure recovery This section introduces the design of service
activation and failure recovery in protocol-level. As mentioned in section 1, UPnP is chosen as a backbone not only due to it is an ISO/IEC standard, but also because of its extensibility and de-centralized nature. In the following, we will first introduce preliminaries of UPnP and attempt to project UPnP Device Architecture to the Pervasive Node object model. Based on these observations, we propose an additional SSDP message type (SSDP+: phc-discover) and the pseudo-code that realize autonomous service activation and failure recovery in a pervasive environment.
4.1. UPnP and SSDP preliminaries The UPnP Device Architecture is revealed in Fig.8.
An UPnP Device is composed of a set of Services, and each UPnP Service provides a set of Actions. It is also
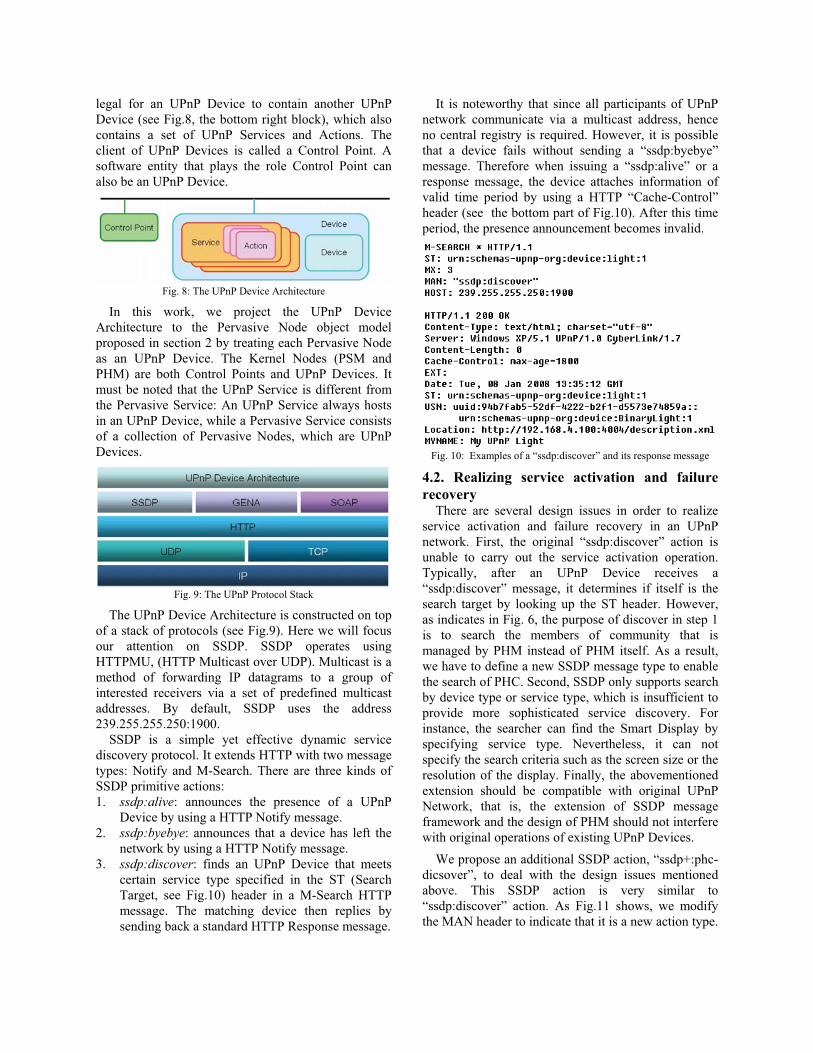
legal for an UPnP Device to contain another UPnP Device (see Fig.8, the bottom right block), which also contains a set of UPnP Services and Actions. The client of UPnP Devices is called a Control Point. A software entity that plays the role Control Point can also be an UPnP Device.
Fig. 8: The UPnP Device Architecture
In this work, we project the UPnP Device Architecture to the Pervasive Node object model proposed in section 2 by treating each Pervasive Node as an UPnP Device. The Kernel Nodes (PSM and PHM) are both Control Points and UPnP Devices. It must be noted that the UPnP Service is different from the Pervasive Service: An UPnP Service always hosts in an UPnP Device, while a Pervasive Service consists of a collection of Pervasive Nodes, which are UPnP Devices.
Fig. 9: The UPnP Protocol Stack
The UPnP Device Architecture is constructed on top of a stack of protocols (see Fig.9). Here we will focus our attention on SSDP. SSDP operates using HTTPMU, (HTTP Multicast over UDP). Multicast is a method of forwarding IP datagrams to a group of interested receivers via a set of predefined multicast addresses. By default, SSDP uses the address 239.255.255.250:1900.
SSDP is a simple yet effective dynamic service discovery protocol. It extends HTTP with two message types: Notify and M-Search. There are three kinds of SSDP primitive actions: 1. ssdp:alive: announces the presence of a UPnP
Device by using a HTTP Notify message. 2. ssdp:byebye: announces that a device has left the
network by using a HTTP Notify message. 3. ssdp:discover: finds an UPnP Device that meets
certain service type specified in the ST (Search Target, see Fig.10) header in a M-Search HTTP message. The matching device then replies by sending back a standard HTTP Response message.
It is noteworthy that since all participants of UPnP network communicate via a multicast address, hence no central registry is required. However, it is possible that a device fails without sending a “ssdp:byebye” message. Therefore when issuing a “ssdp:alive” or a response message, the device attaches information of valid time period by using a HTTP “Cache-Control” header (see the bottom part of Fig.10). After this time period, the presence announcement becomes invalid.
Fig. 10: Examples of a “ssdp:discover” and its response message
4.2. Realizing service activation and failure recovery
There are several design issues in order to realize service activation and failure recovery in an UPnP network. First, the original “ssdp:discover” action is unable to carry out the service activation operation. Typically, after an UPnP Device receives a “ssdp:discover” message, it determines if itself is the search target by looking up the ST header. However, as indicates in Fig. 6, the purpose of discover in step 1 is to search the members of community that is managed by PHM instead of PHM itself. As a result, we have to define a new SSDP message type to enable the search of PHC. Second, SSDP only supports search by device type or service type, which is insufficient to provide more sophisticated service discovery. For instance, the searcher can find the Smart Display by specifying service type. Nevertheless, it can not specify the search criteria such as the screen size or the resolution of the display. Finally, the abovementioned extension should be compatible with original UPnP Network, that is, the extension of SSDP message framework and the design of PHM should not interfere with original operations of existing UPnP Devices.
We propose an additional SSDP action, “ssdp+:phc-dicsover”, to deal with the design issues mentioned above. This SSDP action is very similar to “ssdp:discover” action. As Fig.11 shows, we modify the MAN header to indicate that it is a new action type.

In addition, a new header, CRITERIA, is added to support the property-based lookup. In a CRITERIA header, the key-value pairs are separated by a comma. In our current design, the comma represents an “and” relation In other words, a Service Node is matched if and only if it fulfills all requirement specified by the key-value pairs. Take Fig.11 for example, this SSDP message is a “ssdp+:phc-dicsover” action (in MAN), it searches for a light device type (in ST), and its search criteria are : light id equals to 21 and located in living room (in CRITERIA).
Fig. 11: “ssdp+:phc-discover”
Fig.12 to Fig.14 is a series of three diagrams illustrating pseudo codes for implementing service activation and failure recovery of PSM. The FindServiceNode procedure in Fig.12 is reused by AutonomousServiceActivation (Fig.13) and AutonomousFailRecovery (Fig.14). The input parameter of FindServiceNode is ServiceNodeDescriptor, which contains required information to perform service matching. Typically this information can be extracted from PSDL (see section 3.1). The output parameters contain a list of Service Nodes (ServiceNode[]) as well as a flag indicating the search result. According to the input ServiceNodeDescriptor, the FindServiceNode procedure performs a SSDP discover, if there is no matching service, then it will ask PHM to search its members by sending a “ssdp+:phc-discover” message.
There are two stages in a AutonomousServiceActivation procedure. In the first stage, the PSM extracts a list of ServiceNodeDescriptor from PSDL. For each ServiceNodeDescriptor, PSM use the FindServiceNode procedure to find its community members. After each iteration, PSM records the search results in a buffer called ServiceNodeTable. This table is an internal data structure used to track status of Service Nodes in a PSC. In the second stage, PSM validates Service Nodes records at ServiceNodeTable to prevent conflicting behaviors. If more than one matching service is founded, PSM will also select one of them based on predefined rules. Notice that resolving feature interaction and the optimization mechanisms used to select Pervasive Nodes are out of the scope of this work. Here we only aim to provide a framework for these mechanisms. In our current work, we assume that all service confliction are specified by the developer. When there are multiple Service Nodes
candidates, the PSM will take the first-fit approach. AutonomousFailRecovery is very similar to service activation except that the service needs to reactivate is known in advance. Therefore the FindServiceNode procedure will only apply to the ServiceNode that fails.
Fig. 12: Pseudo code of FindServiceNode procedure
Fig. 13: Pseudo code of AutonomousServiceActivation procedure
Fig. 14: Pseudo code of AutonomousFailRecovery procedure
5. Implementation and evaluation We implement the prototype platform mainly based
on JDK 6.0. Some nodes are implemented with C# and

others in C++. We use ActiveMQ 4.1.1 [11], an open source MOM as the message exchange platform. ActiveMQ uses a cross-platform messaging protocol, and supports several programming languages such as C, C++, C#, and Java. Therefore a PSC can be composed of Service Nodes implemented by means of heterogeneous technologies. This ability is important in developing pervasive applications. For instance, the real-time image-processing components are better implemented with C or C++ while server-side components are usually implemented with Java language. The cross-platform interoperability is an inherited nature of the message-oriented applications, which is very hard to achieve in other application model. To support UPnP, we use Intel UPnP SDK[12] for C# and C++ based Pervasive Nodes, and Java-based Pervasive Nodes are developed with Cyberlink UPnP for Java[13]. The middleware and all Pervasive Nodes are distributed on three P4/1GHz mini-PC with 1GB memory.
We verify the feasibility of the proposed mechanisms by developing five pervasive services (see Fig. 15, Table 2, and Table 3). Table 2 shows all Service Nodes deployed in the experiment environments. These nodes are located in three different hosts (H1, H2 and H3), each host has a PHM. Table 3 lists required service types and criteria of pervasive services. Notice that there are five PSCs and three PHCs in this experiment. Some service types have several node instances. Therefore the PSM can choose one of them, as the ValidateAndSelect() indicates in the AutonomousServiceActivation procedure (see Fig.13). For instance, the “adaptive air conditioner” service requires service type S1, P3 and A2. There are two nodes with service type S1 (PL-2303 and Taroko), hence the PSM can activate one of them when performing autonomous service activation.
As indicated in Fig.13 and Fig.14, PHM loads all matching Service Nodes after receiving a SSDP+ search request. Take PS4 (see Table 3) as an example, PHM loads both Taroko and PL-2303, and we assume that PSM chooses to activate Taroko. In this case, PL-2303 is redundant. If we destroy one of them, PSM performs a “hot-recovery” operation: it activates PL-2303 instead of reloading Taroko. If both Taroko and PL-2303 are failed, then PSM will perform a “cold-recovery”: loading both PL-2303 and Taroko, and then activates one of them.
The experiment consists of three scenarios. Initially, only five PSM instances and three PHM instances are activated. We can obtain the “service activation time” by measuring the time from the experiment starts to the time when all services are available. Next, we measure the “hot-recovery time” of PS1, PS2, PS4, and PS5 by
turning down Service Nodes that have at least one redundant node of the same service type. PS3 is not tested since it does not have redundant nodes. Finally, for all pervasive services, we measure their “cold-recovery time” by turning down a Service Node that does not have a redundant backup.
TABLE 2: Implemented Service Nodes Node Name Type
ID Type / Criteria
Name Host
PL-2303 Sensor Adapter S1 Wireless Sensor Node
H1
Taroko Sensor Adapter S1 Wireless Sensor Node
H1
Ekahau Position Engine Adapter
S2 Location Detector H2
Smart Floor Adapter S2 Location Detector H1 AXIS 207MW Network Camera Adapter
S3 Fall Detector H1
Control and Monitoring Web Application
A1 Web Application Server
H2
Home Appliance Controller
A2 Home Appliance Controller
H2
Smart Display A A31 Smart Display, location=livingroom
H1
Smart Display B A32 Smart Display, location =studyroom
H2
Smart Display C A33 Smart Display, location =kitchen
H3
Short Message System Gateway
A4 SMS H2
Media Follow Me Logic P1 Logic, name= Media Follow Me
H3
Fall Detection Logic P2 Logic, name= Fall Detection
H3
Air Conditioner Logic P3 Logic, name= Air Conditioner
H3
Burglar Detection Logic P4 Logic, name=Burglar
H3
TABLE 3: Pervasive Services Service ID
Service Community Name Community Members Type ID
PS1 Web-based Control and Monitoring
S1, A1, A2
PS2 Media Follow Me S2, P1, A31, A32, A33 PS3 Fall Detection Alert S3, P2, A2, A4 PS4 Adaptive Air Conditioner S1, P3, A2 PS5 Burglar Detection Alert S1, P4, A2, A4
Table 4 shows the experiment results. In this experiment, each test is performed ten times. ASAT is the average time needed to start a service using the proposed autonomous service activation. HFRT is the average time to perform hot failure recovery, Wait Time is the timer we set for HFRT and CFRT so that the PSM can detect the failure, discover and activate the backup service, if no timer was set, the PSM wouldn’t know the existence of the backup service and would perform cold failure recovery directly. Finally CFRT is the average time to perform cold failure recovery. Notice that average HFRT, excluding the Wait Time, is much lower than CFRT. In a multiple

services environment the system availability will increase. This is because more loaded nodes mean there are more redundant nodes. Also note that there is a slight increase of ASAT when the number of nodes in a PSC increases, on the other hand, HFRT and CFRT are not highly related to the number of nodes.
TABLE 4: Experiments Results: Avg. ASAT=Average Autonomous Service Activation Time, Avg. HFRT=Average Hot Failure
Recovery Time, Wait Time = Wait Time for HFRT, CFRT=Average Cold Failure Recovery Time.
Svc ID
Avg. ASAT (ms)
Avg. HFRT (ms)
Fixed HFRT Wait Time (ms)
Avg. CFRT (ms)
Fixed CFRT Wait Time (ms)
PS1 4347 5016 5000 7016 3500 PS2 6778 6016 6000 5544 3500 PS3 4525 -- -- 4869 3500 PS4 4335 5032 5000 5531 3500 PS5 5381 5016 5000 5352 3500
6. Related works Many service discovery systems have been designed
to support interaction between heterogeneous devices in a pervasive environment. Among them, Jini[14], UPnP, SLP[15] and Salutation[16] are the most discussed. The SSDP of UPnP differs from other service discovery protocols in that it uses a decentralized approach which is preferred in a pervasive environment. The above mentioned protocols allows failure detection either by using polling mechanism or monitoring periodic announcements, but none of them support automatic recovery after failure detection, since discovery systems generally expect application software to initiate recovery, guided by an application-level persistence policy [17]. The protocol described in this work has carried out the recovery part relieving the pervasive services designers’ work. 7. Conclusion
We have presented a community-based service activation and failure recovery mechanism for a message-oriented pervasive middleware. First, we define the structure and life-cycle of an atomic software entity, that is, a Pervasive Node. Second, we introduce two types of pervasive community, PSC and PHC, from both structural and behavioral perspectives. We enhance SSDP by adding an additional message type: “ssdp+:phc-discover”. Next, the pseudo code of PSM and PHM is provided to illustrate how PSM and PHM cooperatively provide service activation and failure recovery mechanism at run-time. Finally, we evaluate the feasibility of this work by developing several pervasive services for two dissimilar demo sites as well as carry out experiments on failure recovery time.
There are still many important issues not addressed in this paper, for example, we only provide a framework to resolve the service optimization [18] and feature interaction problems. In addition, the failure recovery is only applied to the Service Nodes. The recovery methods for Kernel Nodes such as PSM and PHM will be explored in the future research. Besides, we are also investigating the scalability issues of UPnP. In a heavy-loaded network, UDP is very likely to lose a lot of packets and causing SSDP to become inefficient. We are therefore planning to enhance UPnP by replacing original UDP by a “reliable UDP” protocol stack such as JGroup [19] in the future. References [1] A.K.Dey, “Understanding and using context,” Personal and Ubiquitous Computing Journal, issue 5, vol. 1, 2001. [2] G.P.Picco, A.L.Murphy, and G.-C.Roman, "Developing mobile computing applications with LIME," Proceedings of the 2000 International Conference on Software Engineering, 2000. [3] C.Curino, M.Giani, M.Giorgetta, A.Giusti, A.L.Murphy, and G.P.Picco, "TinyLIME: bridging mobile and sensor networks through middleware, " Proceedings of Third IEEE International Conference on Pervasive Computing and Communications, 2005.(PerCom 2005), 2005. [4] E.Souto, G.Guimaraes, G.Vasconcelos, M.Vieira, N.Rosa, and C.Ferraz, “A Message-Oriented Middleware for Sensor Networks,” in Proc. 2nd International Workshop on Middleware for Ubiquitous and Ad-Hoc Computing, Toronto, Ontario, Canada, 2004. [5] J.Borchers, M.Ringel, J.Tyler, and A.Fox, "Stanford interactive workspaces: a framework for physical and graphical user interface prototyping, " IEEE Wireless Communications, Vol.9, Issue.6, pp.64-69, 2002. [6] G.Hohpe and B.Woolf, Enterprise Integration Patterns: Design, Building, and Deploying Messaging Solutions, Addison Wesley, MA, 2004. [7] M. Kolberg, E. H. Magill, and M. Wilson, "Compatibility issues between services supporting networked appliances," in IEEE Communications Magazine, Vol. 41, Issue 11, Nov. 2003. [8] UPnP Device Architecture 1.0, UPnP Forum, Dec. 2003. [9] UPnP Device Architecture 1.0, ISO/IEC DIS 29341. [10] F.Zhu, M.W.Mutka, and L.M.Ni, "Service Discovery in Pervasive Computing Environments, " IEEE Pervasive Computing, Vol.4, Issue.4, pp.81-90, 2005. [11] ActiveMQ, URL:<http://activemq.apache.org/> [12] Intel Tools for UPnP Technologies, URL:<http://www.intel.com/cd/ids/developer/asmo-na/eng/downloads/upnp/overview/index.htm> [13] CyberLink for Java: A Development Package for UPnP Devices, URL:<http://www.cybergarage.org/net/upnp/java/> [14] Jini Technology Core Platform Specification,v. 2.0, Sun Microsystems, June 2003. [15] Service Location Protocol,v. 2, IETF RFC 2608, June 1999. [16] Salutation Architecsture Specification, Salutation Consortium, 1999. [17] C.Dabrwoski, K.Mills, “Understanding Self-Healing in Service Discovery Systems” in Proceedings of the first workshop on Self-healing systems, Charleston, SC, USA, 2002. [18] J.P.Sousa, V.Poladian, D.Garlan, B.Schmerl, and M.Shaw, “Task-based adaptation for ubiquitous computing,” IEEE Transactions on Systems, Man and Cybernetics - Part C, vol.36, no.3, pp.328-340, May 2006. [19] JGroup: A Toolkit for Reliable Multicast Communication, URL:<http://www.jgroup.org>

�������������� �� ���������������� � �������� �����
����������� ���������������������������������������������������� ����� ��� ��� ��� ����������
�������������������� �� ��!�!"#��$�� �$���$��
�������
%���������������������������������������������� ���������������������!��� �������!���������$����� ����� � �&������ � ��' � '� ���� � ������ � � � ����'�(� �!�������� ����)������ ���� ���������� � ����'�( � �� ���������������� ����������� ���������������'�������$
*�������������������������������������'������� ������'����� �������������������������������� ����+ �,�(�-��)./������������'����$�.��������������'�� �� ��� � ����� � �0���� � ������ � ����$ � ���� � '�( � �� ��������� � �� �������� � ������ � ���&�!�� ���� ���'���� �� ���������������������������1����������$
����� ����� �
��������������������������� ���������������������� �� ��� ����� �����!�"����������������� �������������� ���������#��������#�����������������!�$�������������� � �� � �� � ������� � �� � �����#��� � ��� � ������������������������������������������������������������������� ����������������� �����������������������������������#���������� ����������� �������!
$���� � ������������ ���������������� �#����� �������������� � ��� � ���������%���������� � � ����� � �� � ������������ ������������������&'( ������ ��� �������� ��������������������#���������� ��!
)������ � * � �� ���� � ��� � ��������� � ��� � ����� �����!� �)�������+������������ ����� ������ ��� �� �����������������#�������!��)�������,������������������������� � ��� � � ��� � ������ � ���������! � � )������ � - � ���#�������������!
������� ���
.�� � �� ��� � � ��� ����� � ������ � ��������������� � �� �� � ����� � �� ���� � ��� � ������� �#��� � ������������ ����� � ���������! �/��� ������ � �������� ��� ���������������������� ������������0�� ����������������������������� ������!�"������������������������������������� � �� � ��� ��0 �#��� ����� � ���������� � �� � ��� � ������������� � �� � ��� ������ � ���� �� � ���� � ��������������0��! � �"����� �������������� ��������� �����������������1������������������������������������ ������� ���
#������������������������������ ��������������������� 1�� ��������0�!
$�� � ��� ������ � �� � ���� ������ � ��� � ��� � ��� ��� �����!�"������������������������������� �������������������������� �� ����������� � ���� ������������������������ �������� � ����� � � � 2����2 � � �������! � 3��� � ���� ������ � ������� � ����� �� ��� � �� ���� �� ������ � �� � �������� ��� ��������� �#��� ������������ � ���������! �3������ � � �������� � #���� � ��� � ���� � �� � � � ������������� ������������������2��2�� �������!�$����� ��������� ���������������0��������� �������������������������������� ��������������������������������������� ��� ������ ����������� ��������������� �������������� �������!�4���� �������������������� �������������������������� ���� � �� � � ������ � �� � ���� � ����� � ��� � ��� ��0������������ ������������ ������!�$����� ���������������������������������� �������������� �������������2��2����������� �� ���� ������ ����0������� ���� ��0�� ������������ ���������5���������������������������������� ������� ����������#�����������!
"� � �������� � �� � ��� � �����0�%��� ����� � �������������� � ��� � ��� � ���������%���������� � � ����� � ����������������� � ����� ���������������������#���������� � �� � �������� � �� � ��� ������ � ���� � ��� � �0�������#���� �� �����#� ��������� ������������������! � �$�������� �������� ������ ������ ������ ��������������! �$��� ������������������ ������ � ��������� ��� ������������������ ��� ��������������������������� ������� �������� ������� ���������������� ��������������������� ���������������� � � ������� � #���� � �� � ���� � �� � ������ � �0�������� ��������������������� ����������������!
)� ���������� � ��������� � �� � ������ � ���� � ��� � ����������������������������������������������������� ������������!
$�� � ����� � ������ � �� � ����� � ����� � �� � � ���� � �������������������� ��������������������� �������� ��� �� �������������������������������������#���!
"����� � � �� � ���� � �� � ��� � �������� � �����0�������#���������������������������� �������������� ����������������! �6����0�� �� �)������ ���! ���!�&*(������������������������ �������������������0�������������!�"�������#������������������������������0����������������������� � ���� � � ������� � � � �#����� � � ����� � ����������������������������#������������!

)�������� �7��� ��� �8�����&+(����������������� �� � �����9������������������������ ����:���!
$��������������������� �������;������0�� ������������� � �� � �� �� � ��� � ��� �� �#������ � �� � � � ����� � ������������ �� ��������� ����� ���� � ���� �����������&,( ��� ���������������������������� ����������&-(!
$���� � ��� � �� ���� � �� ��#� � �� � ��� � ����� � ���� �����������������������0�� ���&<(!
.�� � � ����� � ������� � ������� � �� � �� ���� � ������������ ���������������� ��������� ��� �#����� ���� ���� ��� � ������ �� � ��� � ��� ������ � �� � ��� � �������� ������� � ��� � �� � #� � ��# � ���������� � ���� � ���� � ����������� � �� � ��� � ��# � ������ � �� �� � ������ � ���� � ��� ��� � ���0���� � ��������� � ���� � �0 ����� � ���������������������� � �� � ���� � �� � ������ � ����� � �� ��9���������� � ��� � ������� � ���� � �� � �������� � �� � ��� ��� � ��� ���!
6�� � ���� � ���� ��� ������� ��� � �������� ������������������ � �� � �� � �� ������ � ���� � ��# � ������ � �� �� � ��������� � ���������� � ���� � �� � �0������ � ������! �3� ���#����������� � ��# � ��� � ������ � #�� � ��� � ���� � ����� �������!
�� ������� ������ � ����� �
$��� ����������������������#������������������������ �� �� ��#����� �;������������ ��������������#��������������������2�����2������������=����������������#���������������������������������!�"��������������� ��������� � ����� � �� � ��� � ��������� � �� � ������������ � ������������������ ����� � ���� � �� � ����� � �� ������� � �� � ����������!
$��� ����� ���# �������� ���������� �����# ����� � ������#������������������ ������;�����>��?����������� ������������������� ����������"4��������� �������� ��� ������������ �!
����!���"� �#� ��$��
$���>��?�����) ���������������������#���� ������������������ � ��� ��� ������ �#���� � ��� � �������� � �� �������� �������� ���������������� � �� � ������ ������������������� � ��� � ������ � �� � ������ � ���� ���� ���� �>���! � "� � ��� ������������������ �>��?�����) ��� ����������������������� ����������������������������������� ����������������� � &@(! �$�� � ������������ � �� � � �� � ������� � � ����� � ���'A1*A������� ������������ ��������������#����! �$����
Figure 1: Exploiting sensors to determine whether a person is entering or exiting.

����������#���������� �� ������������������� ��������1��������������������������!
3���� ������������� �) ���� ���� � ������������ � �������� � ������� � �� � � � �����9� � ���� � �� � ���� � 1 � ���������������� � ����� � �����1����� � ������� � B� � �� ��������CA*!''� �������D������ ���! �$�������������� ������ ���������� �������� �#���� ���� ����������� � ������� � ��������!�
$���>���������� �� ������������������� ������������� � ��� � ����������� � � ���� � ��� � ������ � ���� � �����������������������#�����������!
7� �������#���#������������������������0���������������������"��������������������� �������������������"������E�����F ��� ����� 9����9 ���� ����� ������� �������������! � $�� � ������ � ����� � #�� � ����� � ������������ �� ����� � �����0�� � ��� � ��� ������ � ������������� ������ � ������� � ��� � ������� � �������� � �� � ������ ���������������������#���������������!
$�� � ����������� � ������ � ��� � ����� � �� � � � ��������������� ������������ �#��� ������0�� �������� �������������G���������������������� �� �����������!�
���� ����%�����&'��
"������� � ������� � ��� � ���G������ � ���� � �� � ���������������������������������� ����������� �� ��!�
$�� � ������� �� � ��� � ��� ������ � � "����14�� � B�"4D����������� ������� �����������������G����� ��������������� � �� � ��� � 9��������9 � ��� ����� � �� � ��� � ������������������������ �������������������������!�$����"4���������������������� ���#�����B������������������������0��%��� ������D � ���� � ��G����� � �������������������9��������9���� �����!
4�����#����������������������������������#�������� � ���� � �� � ��������� � � �� � �� � ������! � $������� �������������������������������������"4�!
(��������������������� ���� ��������� �
3��� � ��� � ��� � �� � ���� � � � �"4 � ������ � ��� � � � ������#���� � �� � �� � ������� � �� � ���� � #��� � ��������������������������� ����������������������0������������!���� ������ � ��� � �"4 � �� � ��� � ���� � �� � ��� � ���� �#� � ������������� � �� � ��� � �"4 � ��� � �������� � � � ������������������������������������������������������� �����B�� ����� ��� � ��� ����� ��#����D � ��� ������ � ����� � ������������ � ��� � ������� � �� � �0���� � ����� � ��� � ����! ������������� � ���� � ��������� � #��� � ����������� � ��������������B�������������������>��?��������� ������D �#����������������������� ������#��������������������������������#���� ���������������������#������������������ � �������� � ���� � ���� � #��� � ��� � ��� � #�� � ����������������!
"� ��������� � ���� � ������ � �� � ����� � ��������������#��� � ����� � ��� � �������� � ������ � �� � ����� ������������������������������ ���!�
$�� � ���� � �� � � � �����#�; � � �>��? � ������ � � � ����������� � ��� � � � �"4 � ������� � � � ���� � #��� � ��� � �"4����������� � ���� � ��� � ������ � �� � ��� � ����! �7 � ������������� � � �>��? � ����������� � ��� ��� �� � ������� � ��������!
"����� ��������������������� ���������� �'������ �����-�������; � ��� � 9 �����9 � #�� � �� � �������� � �� � ��������������= � ��� � >��? � ������ � 9���H�9= � ��� � >��?������������ �9���H�9 �#�������������������9 �����9=�9 ��9���� � ���� � � �����1��� � ������= � ��� � 9����H������9 � �������� ������� ���� ��� �����! �$����������� � �� ���� �����#������������ � �� � ������ � '; � ����� � �������� � � � >��?������������ � � ������� � ��� ����� � ���� � ��� � ��� �>��������� � ������� � ��� � ����������� � ��� ����� � � � ���� � ����������� � �� ������ � ���� � ���H� � ��� � ���� � ����������H� � B��������� � �� � ���� � ��� � �������� � 'D! � � 4�����#���������H������;������������������ �����������������������������B*D��������������������������������������������� � ����� ��������� ��� � ���� � ��� � ����� � �������� ���������������������� ����������B+D!
$��� ������������ ������� ���� �����! ��� ��������������������������������������������#��������������������������������������"4���� ���1 ����!�"������������������� � ������� �#��� � ���� � ����� ������� � ���� ��� ��������������������������B,D!� �$���������������H���������������������� ������ ������������ �������#������������H��B-D!�$������������ ��������������������������������B<D!�
$��� ���� ���� ��� � 9����9 � ��� ����� � �� ����H� �������� ��� � ���� �����# � ���� ��� � � ������ � �� � ����� � �� � ���B������������B'D�B-D����B<D!�$�������������������������������������������������������������� ���B@D!�$��������� ������� � �� � ��� � � ������ � �� � ��� � 9����9 � ��� ����� � �������������� � #������ � ��� � � ������ � �������� � ���� � ����������������0�� �� ��� �������������! �"����B'D����� ��������� � ����� �� � ��� � � � B-D � ��� � B<D � �� � � ��� � ���������B#����������#��������D��������������������������������������������%�0���� ���!�"����B-D�������������������� ���������B'D���� ������� ��������������������������������������� ��������������������!�"����B<D��������������� ���5���� ������������������#���������������������� ����������0����� � I � �� � �� � ����9� � #� � ��� � ����� � ���� � ���� � ������������ � B��� ���� ������ � �� ���� ���� � ��� ��"4D! �$��� � ������� � ���� � �� � � � ���� � �� � ���� � ��������� � ��� ����� � ��� �����!�
(���'��������������� �
$�� � ����� � ������� �� � ��� � �� � ��� � ���� � E ���� � J� ������; �������F �#���� ���� � ������� �������� ������������������������� ���������������������0 ���������������������������������������������! �6����0�� ����������������������������B+D���� ����;
K!%��������L�J�E!MF�;�$/���K!%���������L%�����������������;K!%��������L

7�������������������������������������������������� � ��� � �������� � ��� �����! � $�� � ��� � � ����� � ���E#����� ������ ��� ������ ��� ����������������� �������� � ���� ������ � � ���� �������� � ��� � ������� � �0 ��������E!MF�$/����������������������9�������������� �������������������������������������������������������������������������������!F�4������������������������������ �����������������������#�������������� ����#�� ������������������������������������� ��������������������!
7�� � ��� � �� � ������ � �� � �� � ��� � �0�� �� � ����#�#�������������������������B*D;
K!%������L � J � 2!M2 � ; � $/�� � !%�������������� �����;KK!%������L%�����������������L
$��� � ����� � �� � E#��� � � ������ � �� � ����� � �� � �������������� ������������������������������������������0 ������� � E!MF � $/�� � ��� � ���� � �����9� � ������������ ����� � ��� � ����� �����; � ��� � ������ � �����9��������������������!F
��������������� ��� �#��������� ���#� �� ��� ���������������� �#��! �4���� ��������#���������������������������� � � ������ � ��� � ����� �#� � ��� ���� ������������� �������������������������� ��������� ������#������� ��������#����������#���������������� ���������! �$�������� ���������B@D���� ���� ������� �������� �� ����������;
K!%����L � J � E!MF � ; � $/�� � K!%���������L%�����������������;�K��������� ��N!%����L
$��������� ��������������������������������������������B+D � ��#� �� � ��� � ���������� � ���� � ���K��������� ��N!%����L!�$����������������������� �� ��������� ����������� ������������ ������9����9! �4���� ������� � ������ � ��������� � ����� � ��� � �� � ���� � ���� � ��������� �� � �� � ������ � �� � ��������� � ��� � � B����������#������ � ������� � �� ��������� ��� ��0�����D ���� �������������� � ��� � �� � ��� � ���� � E��������F � E�0�����F � ���E�������F ������������������������� ������������������������ ������������� �������������������� ���!
���������������������������� ���������#���#������������� � ���������� � � ������ � �� � ���� � ����������������������� �����9����������!�
(���) ���*����
$�� ���� � ����� � �0�� �� �#�� � �� �������� �#�������� �<� ����� � ����� ���� �� ��0������� �'A � ����� ��� � ������� �� � B#������ � �� � �����D! � $��� � �0�� ��������������� � ��� � ���� � �� � �������� � �� � ��# � ��������#��� � ��� � ������ � ��� � ��� � ����������� � �� � ��������� ������ � #��� � ���� � ����� � ��� � ��� � ������ � �� � ��#����!
+�) ������ ��
�������� � � ��������� � ��� � ���� � ��������%�0�� � ������������ � � � ����������� � ����� � ��� ��� �#���� � �0�����
�������������������1�������� ���������������������������� ��� � ���� � � �� ����� � �� � ��� � ���� � ����� � #����������! �7 �E������F � B� �������� � ���� � �� � ��� �0���������� ��D�&'(�#������������������������������������ �������������#���������������������������! �$���"��������� ���������������������������0��������������#��������������� ����������������� �����!��� ��������������������� ������������������������������������� �����!
O���� � ��� � � ������� ��������� � �����#�� � �������������� � �� � � ���� � ����� � �� � ��� � ������ � ��� � ������������� � �� � � ���� � �0 ������ � �� � ����� � ������������������� � ���� �#��� � ��� � ������� � ���� ������� � �� ���!�$��� � ������� � � ����� � ������������ � ��� � ���� � ��������������������������������#���������0��������������������#�������������������������������������������!�$�������������������� ���������� ��� �����#���������������������������������#�������� �������������������������#�������������������������������� ����������������������!
'��������
&'( � P!�7���� � �!��! � ���������� � �!���� � �����!�����������! ���������7�;����������������� ����������������� � �����#�� � ��� � �����0�1�#��� � ��� ����! � "��)��������� � �� � )2/3��.32 � ��� � 4�� � .����������� �5�������� � �� � )����� � 5�������� � ����� � ,,CA � ���6������,��������5��������������� �����--1@*!�) �������*AA@!
&*( � )������ � �! � 7���� � >! � 3��� � 4! � E�����0�1�#������� ����� � � ��������� �.222� *�(���� � �� � 7�!��� �5���������� �����������������������)��������:��7�O)'QQ,'
&+( ������ ��! �$������ ��! �������5��� ��! �)����� �R!/!���������$!�E7��� ��� �:��������������0�1�#������� �����F�)��������� � �� � ��� � 4�� � .����������� � 5�������� � ����!�0�������5����������!�5����8����)�������37�O)7��*AA+� �����QAI'A<
&,( �����7! ���� ����� �7������������ �)� ��� �������������������0��7#����7 ���������������������*AAA
&-(������P!������� ���!�3�����#�� �>!�3��������!��������)! �6���� ��!�EP������ �������� ��������� ������������������������ ���������;�$������������������F)�������������7�,�29::��������"�������'QQQ
&<( �R�����#�� � �! ������� � �)! ���P���� �7! � )���� � "!�R�������!�E�������� ������������:��� ����� ������#����F � ��!�����$�8��4��*AA-� �����'-QI'@<
&@(�$!)!�)� ������!���������!�R�������$!�������E�� �����$��� �$����.��S��;�$���>��?�����) �������F��� ���������� � ��� ���� � )������ � ��� � /���������� � O�� ������ � ���3����������*AA<

Workshop on
Pervasive Expression: Pervasive Visual, Auditory and Alternative Modality Information Display
ORGANIZERS: Andrew Vande Moere (University of Sydney, Australia)
Kirsty Beilharz (University of Sydney, Australia)
Bert Bongers (University of Technology, Sydney, Australia)
Stephen Barrass (University of Canberra, Australia)

Pervasive Expression: Visual, Auditory and Alternative Modality Information Display
MOTIVATION A new research direction is currently emerging in which pervasive display technology is used to reveal information about wearers and inhabitants, their activities or their surrounding environment. Such applications tend to be multidisciplinary in nature, and cover areas such as location-aware way-finding, environmental monitoring, preventive healthcare, self-expression, ambient persuasion, social networks interfaces, e-fashion, interactive architecture, media facades or emotive artworks. These approaches focus on the "output" side of pervasive computing, as a multimodal "feedback" mechanism for the wearers or any other person in their vicinity. Pervasive display technology often experiments beyond the use of simple LCD or pixel-based displays, instead utilizing a wide set of alternative output technologies such as LED light arrays, e-textiles, electroluminescent wires, thermo-chromatic inks, shape-changing materials, inflatables, smell emitters, tangible feedback mechanisms or complex sound generators. Although recent advances in pervasive technology have advanced knowledge about sensor data interpretation, context recognition and their applications, still much more needs to be known about how information can be communicated back to the user in an expressive but pervasive way. The development, implementation and use of such technology inherently encounters important considerations, such as privacy, ethics, usability, control, comprehensibility, engagement and technical development, spanning a spectrum from informative representation to artistic experience. This workshop brings together researchers, practitioners, technologists and artists from different domains, interested in the visual or auditory representation of information for users in the pervasive realm. We also explore how novel visual, auditory and alternative modalities (e.g. tactile, olfactory, visceral) materials can function as a physical communicative layer that is truly pervasive. A few potential questions we asked contributors include: • How to embed pervasive expressive displays in physical reality and materials, such as artifacts, garments and spaces? • What are valid data mapping metaphors for expressive displays that are pervasive, and still can be intuitively understood? • How can the design of pervasive expressive displays influence the experience (e.g. engagement, reflection, persuasion, interpretation),
conviction, attitude or behavior of onlookers, users, wearers or any person in its vicinity?
ORGANIZERS Andrew Vande Moere, Key Centre of Design Computing and Cognition, Faculty of Architecture, Design and Planning at the University of Sydney Kirsty Beilharz, Key Centre of Design Computing and Cognition, Faculty of Architecture, Design and Planning at the University of Sydney Bert Bongers, Faculty of Architecture, Design and Building at the University of Technology Sydney (UTS). Stephen Barrass, School of Creative Communication and Co-Director of the Sonic Communications Research Group at the University of Canberra
COMMITTEE Steffi Beckhaus, Interactive Media & Virtual Environments, University of Hamburg, Germany. Joanna Berzowska, Extra Soft Labs, Canada. Remo Burkhard, Chair for Information Architecture, ETH-Zurich, Switzerland. Mark Burry, Spatial Information Architecture Laboratory, RMIT, Australia. Anne Cranny-Francis, Society, Culture, Media and Philosophy, Macquarie University, Australia. Régine Debatty, we-make-money-not-art.com & twenty1f.com. Berry Eggen, Industrial Design, Eindhoven University of Technology, The Netherlands. Mathias Gmaschi, Loop.pH Ltd, UK. Ian Gwilt, Visual Communication, UTS, Australia. Nigel Helyer, SonicObjects & AudioNomad, University of NSW, Australia. Thomas Hermann, Sonification, Data Mining & HCI, Bielefeld University, Germany. Jeffrey Huang, Media and Design Laboratory, EPFL, Switzerland. Andy Hunt, Music & Media Technology, University of York, UK. Sarah Kettley, Speckled Computing Consortium, UK. Maja Kuzmanovic, FOAM, Belgium. Nicolas Nova, Media & Design Laboratory, EPFL, Switzerland. Garth Paine, Digital Musics, University of Western Sydney, Australia. Zach Pousman, Interactive Computing, Georgia Tech, US. Johan Redström, Interactive Institute, Sweden. Stefania Serafin, Medialogy, Aalborg University, Denmark. Clarisse Sieckenius de Souza, Human-Computer Interaction, PUC Rio, Brazil. Mette Ramsgard Thomsen, Information Technology & Architecture, The Royal Danish Academy of Fine Arts, Denmark. José Luis de Vicente, Visualizar Media Lab Prado, Spain. Danielle Wilde, CSIRO Textile and Fibre Technology, Australia.

Urban Empathy: Work in Progress
Teresa Almeida Independent Artist/Researcher
ABSTRACT In this paper I present the body of work that I have been developing since 2005: Modes for Urban Moods -Space Dress, Yuga, and Lags. An ongoing project, which aims to evolve through time and in different urban spaces, this suite of wearable mechanisms are intended to help coping with our social sphere in a rather whimsy fashion. Being more or less technological, each of the garments and accessories have a specific reason for being, and are designed according to the research context of location, influence, and availability, while at the same time being aware that different modes of expression are meaningful, or other misunderstood, depending on (self)experience.
Keywords Wearable, everyday life, urban space, inflatable, sound, social jet lag
INTRODUCTION Dynamic structures fashioned to the body and public space were the relationships that framed my initial research, together with the urgency in incorporating technology into our everyday life in order to sense and respond to our needs and demands. Does technology make us happier and help us cope with mundane situations, such as daily commute, or can it change the nature of work itself and determine our well-being in an office space, in voicing our feelings and frustrations? I was initially intrigued by inflatable structures and the possibilities they offer to transform and animate. I wondered if a mutating wearable accessory could reflect one's experience in urban space. May it be a remedy to urban illnesses such as stress or anxiety? Can it effectively communicate moods? In this paper I propose a series of wearable designs that originated as a form of personal expression, while utilizing and embedding technologies into their construction as a way of affecting and effecting both user and audience.
WEARABLE COPING MECHANISMS
In my search for responsive models of expression between beings and their environment and their distinct use of technologies and techniques as a means of interaction within a cultural and social context, I found the most diversified examples in art, fashion, and architecture, such as those that use electronic textiles [2], clothing that transforms into portable architectures [7], a remote control dress [3], or materials of and for resistance [1]. Most of these works are often presented as social commentary and they range from issues of the politics of borders and orders, to the personal and the built - place, city, body, to critiques of the establishment through the analysis of sign systems and technologies of power [6]. This is also what I started exploring with Modes, and continued through the latter projects. Self-expression and control
With this series of wearables I also question if our need for technology means that we are losing our sense of immediate physical reality, as in the case of reclaiming personal space, or does embedding garments and accessories informed by technology in our everyday life mean that we are set to rely exclusively on outside inputs to determine our well-being. As I try to demonstrate in the following works, one can still be in control and be the main executer, maintaining individuality, while utilizing pervasive modes of expression. WORK IN PROGRESS (NEW YORK CITY, LJUBLJANA, KUALA LUMPUR)
Modes for Urban Moods
Modes for Urban Moods are a suite of wearable coping mechanisms that explore relationships in public spaces and materialize invisible social networks. They are tactile, spatial, sculptural expressions fashioned to the body, and are bizarre representations of situations which critique or identify the existence or absence of conditions, and transform meanings, senses, and dynamics through their actions. They juxtapose the surreal and bring to life the unseen and humanize the technologies we are being urged to incorporate in our lives.

Fig. 1 Modes for Urban Moods: Emergency Ring, Loud Bubble, Space Dress, and Wings - sketches and illustrations. Modes for Urban Moods consist of four elements: Emergency Ring, Loud Bubble, Space Dress, and Wings (figure 1). Each addresses different needs – the need to escape, the need for space, the need to breathe, and the need to ask for help or reclaim attention. Each is designed to (re)act under a specific set of circumstances such as stress, claustrophobia, panic, or comfort. They are whimsical wearable accessories which aim to offer inhabitants of the city the ephemeral possibility of coping and circumventing the urban pressures imposed on their daily rhythms. Modes explore dynamic structures fashioned to the body for use in public space. Modes for Urban Moods are: Emergency Ring is a piece of jewelry with an inflatable mechanism ready to pop up whenever the wearer decides it is necessary - either in a case of emergency or loneliness. Loud Bubble is a mechanism consisting of earmuffs, a microphone, and soap bubbles. It visualizes noise pollution by picking up sound and transforming it into soap bubbles... It can be used as an aid in helping restrict this noise, or it can be used as a prop for some urban events and parties. Space Dress is a dress that inflates according to its user decision and in specific situations. It is designed to cope with stress, anxiety and claustrophobic situations - or simply to provide comfort. It was originally designed for rush hour in New York City's subway system, and other crowded public spaces. It negotiates social bounds, communicates beyond protection/defense, and makes visible individuals/members of a community. Wings is a mechanism that aims to help manage stress. By offering its user the possibility of controlling one’s breath it encourages rhythm while commuting or dwelling in crowed spaces.
Modes are portable spaces, products, and artwork… and anyone may be a user. They are designed and created to provide a moment of rupture in everyday life [5]. They are catalysts for situations in public space. Emergency Ring, Loud Bubble and Wings are concept designs, while Space Dress is a final prototype. The dress starts inflating if the user hits a switch (figure 2). It deflates when the same switch is off.
Fig. 2 Space Dress

The technologies and materials used for Space Dress are rip-stop nylon, micro fans, miscellaneous electronics, and a switch. Yuga Yuga consists of two wearable products: a belt and a handbag (figure 3). Both use sound as object, amplifying moods by the use of space. The handbag helps managing feelings of frustration - of communication, misunderstanding or alienation. It functions as an external body that 'screams for you', when you throw it on the floor. Whimsy and playful, like a child’s toy, it comprises a pre-recorded shout that when the bag, intentionally, hits the ground, is set off. It is made of a simple shock sensor handmade by Luka Frelih at Ljudmila1, a record/playback module and speaker, plugged in and out of an Arduino2. This handbag is also an original item/free giveaway from the Croatian Railways. The belt, made out of felt, deals with attention – it interacts with the environment by detecting physical proximity and movement. According to the data collected it may create brief compositions – that allow others to notice this wearable user’s presence or thus the user him/herself to reclaim spontaneous attention and/or interact with the surroundings. The accompanying dress is designed after Courreges and, like the belt, is made out of felt, which symbolically refers to feeling and protection [8]. The technology used consists of an Arduino board, a Ping sensor, a record/playback module and speaker, an amplifier, conductive Velcro and conductive thread, and miscellaneous electronics.
Fig. 3 Yuga
1 http://www.ljudmila.org 2 http://arduino.cc
Yuga is also a sonic and spatial translation of the physical transformations that, eventually, occur when new connections are created. By affecting or engaging people in the immediate vicinity of the wearer, it alters the site experience for onlookers, and the passive or neutral presence of the user. This project was developed while in residency at Ljudmila-Ljubljana Digital Media Lab, within the frame of the Pepiniéres European Programme of Residencies for emerging artists3. Lags Lags are a series of patches for coping with social jet lag. Social jet lag is, according to European researchers/scientists, putting as at risk of chronic fatigue and it manifests when our body’s circadian rhythm is out of sync with the demands of our environment [4]. Our behavioral patterns may alter and despite all the modern technologies available we still fall out of logic. Lags are the result of living in a mirror-world, and are out of tune with the environment. They are the outcome of my current stay in Southeast Asia. Having moved there for work, I have felt again the urgent need to adapt. This constant need to cope with new surroundings is indeed a source of stress and exhaustion. The space/time dislocation and the mismatch of our bodies no longer fitting their surroundings are the motif for Lags, which are part of my ongoing research on wearable coping mechanisms for urban spaces. They are made of free accessories handed out on an intercontinental flight from London to Singapore, applied textiles designed using traditional Batik materials and wax-
Fig. 4 EyeLag
3 http://www.art4eu.net

resist patterning technique learnt in Malaysia, and combined with low-tech electronics. Lags are designed for an office site: EyeLag (figure 4) consists of a pair of goggles equipped with a warm yellow LED (Light Emitting Diode) in the inside, reassuring ‘sunlight’, and aims to help maximizing comfort and productivity in a space deprived of natural light. HeadLag is a bracelet and soft pillow, for when one needs to nap. A small inflatable is triggered by the head’s position on the arm, action that can be commonly associated with office napping. Other Lags are in research and development. CONCLUSION
This paper presents work in progress with an emphasis on the personal and social issues involved in the creation and design of those products/artworks. Due to their nature, they might engage and be interpreted differently by different groups of people, while still communicating and displaying information that otherwise would be hidden. The increasing need and use of technology might help us cope with our physical reality, and embedding technological infused garments and accessories into our everyday life registers and challenges the way we perform in public space. Therefore, these are proposals to be discussed and developed in the context of the Pervasive Expression Workshop.
REFERENCES 1. af Petersens, M. Fashination. Available at
http://www.modernamuseet.se/v4/templates/template3.asp?lang=Eng&id=2379.
2. Berzowska, J. Electronic Textiles: Wearable Computers, Reactive Fashion, and Soft Computation. Available at http://www.xslabs.net/theory.html.
3. Evans, C., Menkes, S., Polhemus, T. and Quinn, B. Hussein Chalayan. NAI Publishers-Groninger Museum, Rotterdam, 2005.
4. Harkin, J. Social jet lag (the mismatch paradigm). Available at http://www.guardian.co.uk/commentisfree/story/0,,1832765,00.html.
5. Lefebvre, H. Everyday Life in the Modern World. Transaction Publishers, New Jersey, 1984.
6. Martin, L. H. Gutman, H., and Hutton P. H. (eds). Technologies of the Self: A Seminar with Michel Foucault. University of Massachusetts Press, Amherst, 1988.
7. Pinto, R., Bourriaud, N. and Damianovic, M. Lucy Orta. Phaidon Press, London, 2003.
8. Turner, N. K. Joseph Beuys. Available at http://artscenecal.com/ArticlesFile/Archive/Articles2001/Articles0701/JBeuysA.html.

Taxtile Nerve Extensions
Stephen Barrass Faculty of Design and Creative Practice
University of Canberra ACT Australia 2601
+61 2 6201 2945 [email protected]
ABSTRACT A taxtile is a smart fabric that integrates tactile sensors and actuators in the same flexible material, inspired by human skin. Tactile illusions such as the ‘shrinking waist’ and the ‘stretching nose’ demonstrate that bodily awareness is dynamic and is not constrained to the physical body. The design sketch for Fauxy the Fake Fur Coat with Feelings has vibrotactile buttons sewn on the inside to connect the fabric sensor to skin sensations. We propose that bodily awareness could flow into the coat through these ‘taxtile nerve extensions’ to position the wearer’s perceptual systems as the smarts in the Smart Fabric.
KEYWORDSTextile, Tactile, Neuroscience, Animated Garment, Fashion
INTRODUCTIONThe convergence of computing and textile technologies is marked by the inaugural conference on Smart Fabrics in 2005 [Smart Fabrics 2005]. Commercial products, such as the SensaTex Smart Shirt and the VivoMetrics Life Shirt are woven with sensors that register many of the same kinds of information that skin does. One day Smart Fabrics may even synthesise vitamins, repair DNA and heal physical cuts and bruises like skin does. However in current Smart Fabric designs there is a distinct gap between the sensors in the fabric and the senses in the skin. What if the sensors in the Smart Fabric were connected to the skin of the wearer to reposition the wearer from a source of ‘data’ to the ‘smarts’ in a wearable information system?
The ability of blind people to read Braille with their fingertips shows that skin provides a communication channel to the brain that can be used to understand abstract and symbolic information. There have been experiments on sensory substitution and the recognition of 2D images projected by electrical or vibro-tactile stimulation onto the skin since the 1960’s. The Forehead Retina System consists of a miniature camera mounted in sunglasses that sends video to an array of 512 electrodes in the headband that transduce the image to nerves in the skin [Kajimoto et. al. 1999]. The Haptic Radar, modeled on cats whiskers, consists of a fibre that senses distance and transduces it to a vibro-tactile cue on the skin directly beneath it. The researchers suggest the whisker interface may be more efficient than visual-to-tactile systems for path finding and collision avoidance [Cassinelli et. al. 2006]. The e-Skin project has the ambitious aim to develop a textile modeled on the human skin. e-Skin is envisioned as a multilayered flexible textile that senses stimuli and has actuation mechanisms for tactile feedback on both inner and outer surfaces [Kirstein et. al. 2003]. The consortium in this project combines expertise from the fields of human computer interaction, wearable computing, bio-mimetic robotics and ergonomic design. BODY IN THE BRAIN The nerve connections between skin and brain are drawn on the neural cortex in Figure 1 [Penfield and Rasmussen 1950]. This ‘body in the brain’ with its outsized hands and lips that reflect the density of nerves and neurons dedicated to each part of the body, is known as the ‘sensory homunculus’. The parts of the body are re-arranged, so that the hand is adjacent to the face in the middle. Some amputees feel the phantom sensation of their missing hand when their face is touched due to crosstalk between these adjacent regions in the homunculus [Ramachandran & Blakeslee 1999]. The homunculus is also used to explain the disappearance of body parts from conscious perception with certain types of brain damage, and distortions in the size of body parts during episodes of epilepsy or migraine.

Figure 1. Mapping of nerves from the skin to the brain [Penfield and Rasmussen 1950] The sensory-homunculus has a twin, known as the motor-homunculus, that maps the afferent nerves in the other direction, from the brain to the muscles and skin. The homunculus twins, shown together in Figure 2, share many features, such as the enlarged hands and lips. However the motor homunculus differs more from one person to the next and over time, so that, for example, the motor homunculus hands of a surgeon increase in size with surgical training.
Figure 2. The Sensory and motor homunculus twins The fluidity of body awareness is demonstrated by the Pinocchio Illusion in which the nose is felt to extend up to an arms-length out from the face. The illusion can be produced by having someone hold their nose while at the same time touching a vibrator to the biceps tendon of that arm. The nerves from the fingers and nose signal contact, while the vibrator stimulates nerves that signal that the bicep is extending [Lackner 1988]. The person feels their
nose stretch as the brain resolves the sensations by extending the neural image of the nose along with the extending arm. Physically, of course, the nose and arm are not moving at all. When the opposing triceps tendon is vibrated the nose feels like it is shrinking. The related ‘shrinking-waist’ illusion is produced by having someone place their hands on their hips, and then vibrating the tendons of their wrist. This illusion was repeatedly used in a brain-imaging experiment using fMRI to investigate the neural correlates of changes in the self-perception of the size of body parts [Ehrsson et. al. 2005].
TAXTILE NERVE EXTENSIONS The data from sensors in Smart Fabrics is usually transmitted to a computer for analysis of aspects of the wearer’s movement, or location or health. In the other direction, wearable information systems communicate data to the wearer through a head-mounted display with visual and audio interfaces. We propose that an actively tactile textile, or taxtile, can be used to create a unified sensing and communication system tightly integrated with the users body. To demonstrate this possibility we constructed a Smart Fabric that can sense a hand stroking it using the ‘tribo-electric effect’ that occurs when electrons move between materials that rub together [Barrass 2007]. Most people will be familiar with this effect from science demonstrations where a glass rod is rubbed with silk cloth so it becomes charged and can be used to pick up small pieces of paper. Skin is at the extreme positive end of the tribo-electric scale, whilst polyester, vinyl, and plastics are at the negative end. This means that when skin rubs against synthetic fabrics there is a transfer of charge, which is why polyester shirts are ‘sticky’. In tropical climates polyester can be worn more comfortably because water vapor in the humid air allows the charges that build up to dissipate. Cold air holds less water and static sparks can become frequent and irritating if you wear polyester in sub-zero temperatures. A prototype taxtile, shown in Figure 3., consists of a square of fake fur with a ‘nervous system’ sewn from conductive thread connected to a microprocessor ‘brain’. A level of excitement is computed from static charge generated by stroking the fabric, and sent through the efferent nerve to actuate fluffy vibrating appendages. The result is the highly-strung strangely-geometric run-over poodle-like object we called Scruffy. Stroking Scruffy causes the tail-like appendages to wag in spasmodic frenzy so he quivers all over with what looks like joyful excitement. In colder climates or dryer weather that cause static charges to build up, Scruffy can be excited by people walking over carpet several metres away without any direct physical contact.

Figure 3. Scruffy – a prototype Taxtile Based on the neuroscience of body image and our experiments with Scruffy we hypothesise that a taxtile could close the gap between sensors in a smart fabric and the perceptual system of the wearer. These ‘taxtile nerve extensions’ would allow the wearer to perceive information conveyed from the sensors to the brain through the skin. These augmented perceptions would position the wearer, rather than a computer, as the ‘smarts’ in a wearable information and communications system. In the design sketch for Fauxy the Fake Fur with Feelings, shown in Figure 4. modular ‘taxtile buttons’ with independent static sensing nerves are sewn in any arrangement, doing away with the need to custom sew efferent and afferent nerves through the fabric to each one.
Figure 4. Sketch for Fauxy the Fur Coat with Feelings The taxtile buttons on the inside of the coat, shown in Figure 5, are prototype ‘taxtile nerve extensions’ that bridge the gap between the cloth and the skin. These buttons are designed to extend the perceptions of the wearer into the coat, augmenting their skin with the capability to feel static electricity all around. The buttons on the outside have feathery extensions that visually amplify the vibrations for the purposes of external
expression and communication. In further work we aim to develop the concept of an animated ‘pet’ garment that has its own persona and moods independent of the wearer. We envisage Fauxy will become excited when she is taken out of the wardrobe for an outing, and will raise her hackles if someone passes wearing real fur. Figure 5. Concept sketch for tactile nerve extension buttons
CONCLUSIONWe are exploring the concept of ‘taxtile nerve extensions’ that connect sensors in a Smart Fabric to the ‘body in the brain’ of the wearer. Based on the neuroscience of body image we hypothesise that these taxtile nerve extensions may allow bodily awareness to flow into the garment, and enable augmented perceptions. The design sketch for Fauxy the Fake Fur with Feelings develops the Scruffy taxtile into an immersive wearable information system. We are currently developing a modular ‘taxtile button’ that can be sewn on the inside of Fauxy, as prototype taxtile nerve extensions. In future work we will explore the effects Fauxy has on the behaviour, sensations and body image of the wearer. Rather than using a smart fabric to project information about the wearer to the outside world, we aim to project the outside world into the mind of the wearer.
REFERENCES1. Barrass S. 2007, Faux Fur Taxtiles: bridging the gap
between cloth and skin. in Proceedings of the Workshop on Transitive Materials, International Conference on Ubiquitous Computing (Ubicomp 2007), Innsbruck, September 2007.
2. Cassinelli, A, Reynolds C, and Ishikawa M. 2006, Augmenting Spatial Awareness with Haptic Radar. in Proceedings of the Tenth International Symposium on Wearable Computers (ISWC), October 11-14, Montreux, Switzerland.
3. Ehrsson HH, Kito T, Sadato N, Passingham RE, and Naito E. 2005, Neural Substrate of Body Size: Illusory Feeling of Shrinking of the Waist. Public Library of Science Online Journal of Biology, Vol 3, Num. 12.

4. Kajimoto, Kawakami, Maeda, and Tachi, 1999, Tactile Feeling Display using Functional Electrical Stimulation, in Proceedings of the Ninth International Conference on Artificial Reality and Telexistence, Waseda University, Japan.
5. Kirstein T, Lawrence M, and Tröster G. 2003, Functional Electrical Stimulation (FES) with Smart Textile Electrodes, in Proc.eedings of Wearable Systems for e-Health Workshop, December 11-14, Pisa, Italy.
6. Lackner JR. 1988, Some Proprioceptive Influences on the Perceptual Representation of Body Shape and Orientation, Brain, Vol. 111, pp. 281–297.
7. Penfield W and Rasmussen T. 1950,The Cerebral Cortex of Man, Macmillan, New York.
8. Ramachandran VS and Blakeslee S. 1999, Phantoms in the Brain: Probing the Mysteries of the Human Mind,Harper Perennial, 1999.
9. Smart Fabrics 2005, www.intertechusa.com/smartfabrics.html

Soundscapes at Workspace Zero – Design Explorations into the Use of Sound in a Shared Environment
Berry Eggen, Koert van Mensvoort, David Menting, Emar Vegt, Wouter Widdershoven, Rob Zimmermann
Department of Industrial Design Eindhoven University of Technology
5600MB Eindhoven, NL +31 40 2472218 [email protected]
ABSTRACT In this paper, we describe three design explorations into the use of sound in a shared workspace. The focus of these explorations is on the interaction between people and the environment that surrounds them. Challenges include designing in context, designing for the periphery of people’s attention, balancing the aesthetic and information qualities of information displays, and the design of playful interaction styles to control the auditory display.
Keywords Auditory information display, soundscape, workspace
INTRODUCTION In this paper we present three design explorations into the use of sound in a shared workspace. The focus of these explorations is on the interaction between people and the environment that surrounds them. How does a pervasive soundscape influence the social behavior of the inhabitants of the space? And, how is the soundscape itself shaped by intentional and/or unintentional actions of people?
Smooth information exchange between co-workers is considered one of the basic conditions to guarantee an effective workflow [6]. In the field of Human-Computer Interaction (HCI) and, more specifically, in the area of Computer Supported Collaborative Work (CSCW) a vast amount of knowledge is available on how information and computer technology can be applied to improve the effectivity, efficiency and satisfaction of work processes [4]. Most of the reported design and research efforts, however, concentrate on ‘productivity’-related aspects and favor visual interaction solutions. Only a relatively small group of designers and researchers has systematically explored the possibilities of sound as an alternative for visual interaction [3] [9] [2].
In [7] the complementary nature of the auditory and visual modes of information is pointed out. Gaver states that “a simple way to contrast listening and looking is to say that although sound exists in time and over space, vision exists in space and over time.” ([7]; pp70-71). From a design perspective, this contrast leads to clear possibilities and limitations for the design of information displays (Fig. 1). In particular, the observation that ‘sound exists over space’ calls, in our opinion, for a further exploration of the design of environmental auditory information displays.
Figure 1: Complementary modes of sound & vision [7].
In the remainder of this paper we first introduce and discuss a number of different aspects that we used to define the design space to be explored. Next, we briefly describe the ‘Birds Whispering’ project that was used as a starting point for the three design explorations that form the main body of this paper. Three master students of the Industrial Design department of the Eindhoven University of Technology (TU/e) each conducted one of these design explorations in a separate project. A more detailed description of the Birds Whispering project is currently being published elsewhere [5]. Together with the students we carefully studied the findings of the earlier Birds Whispering project. Based on this joint activity and together with the coaches each student identified and defined a more specific but related design challenge to be explored in the separate project. We took

care that the chosen design challenges did not overlap too much but rather build on the most interesting and promising findings of the Birds Whispering project. To put the three student projects as well as the earlier Birds Whispering project in context the actual project descriptions are preceded with a section describing the more generic design challenges that span the design space of environmental auditory design displays. At the end of the paper the main findings related to the design challenges addressed in the three student projects are briefly summarized.
DESIGNING ENVIRONMENTAL AUDITORY INFORMATION DISPLAYS In this section we discuss a number of aspects we consider important for the design of environmental auditory information displays.
Soundscapes ‘in situ’ Previous studies have demonstrated that sound at the user interface can indeed enhance human-computer interaction [1] [7] [10] [11]. In general, it has been shown that also sound design should adhere to well-established heuristics for interaction design. In addition, sound-specific knowledge on interaction design for user-system interaction is available in literature [9] [2]. However, this knowledge mainly concerns direct interaction of a person with a computer system. Much less is known about the application of sound in situations in which the interaction between people (i.e., more than one person) and the systems that surround them is much less direct [1] [11].
The present design studies were carried in such a ‘pervasive computing’ setting. The physical space of the design studio in which the designers carry out their daily design activities is supposed to become an intelligent space. This shared workspace should not only inform its inhabitants to increase workflow, it should also support everyday social interactions at the workplace. From a sound design perspective, this means that the soundscape should become part of this multi-user multi-system environment. It should merge with existing soundscapes and it should adjust (or be adjustable) to the situation at hand or the changing environmental conditions. The overall environmental sound level could, for example, signal the number of people in the design studio and the nature of their activities.
Information decoration People decorate physical spaces to create atmospheres that feel more comfortable to work in. Also, people use decorative patterns to give identity to their workplace. We believe environmental information designers can learn from the world of decoration [12]. The primary goal is not information but aesthetics. Information decoration, means seeking a balance between aesthetic and informational qualities. We want to emphasize that information decoration should go further than just making data look
better: it requires a genuinely different information model. Traditional information theory usually advises against things like ambiguity and repetition. In information decoration, these factors play an influential role, because ambiguity and repetition are classic aesthetic means of achieving interesting images. The big advantage of information decoration is that when it is not informative, it is still decorative. This seems more than you can say for most contemporary information carriers. Information decoration is not only about aesthetics but can also be considered a means to make the environmental ‘noise’ acceptable.
Background/foreground – calm technology Generally speaking, sound easily becomes annoying when it does not contain meaningful information for the listener. In the previous section we have seen that decorative qualities of the sound can compensate for this lack of information. In case neither informative nor decorative qualities are present, sound becomes noise and noise potentially interferes with ongoing activities. The chances sounds will be perceived as noise not only increase when more people are simultaneously exposed to the same soundscape, but also when more systems have the capability to simultaneously use the auditory mode of information. This situation resembles the pervasive scenario sketched above.
As people do not have ‘ear lids’, auditory displays should be designed in such a way that the soundscapes they display can easily fade into the background of everyday life. On the other hand, the moment the soundscape (again) contains relevant information it should quickly move from the periphery to the center of people’s attention. According to Weiser and Brown [14], ‘Calm Technology’ should enable smooth transitions between these two perceptual modes of communication. This calls for a completely different design approach of information displays. Traditionally, designers are trained to create designs that attract people’s attention. Designing for the background is something different, but can be equally challenging as, according to Weiser and Brown [14]: “The periphery is informing without overburdening because people can attune to information without explicitly attending to it.” Recently, it has been argued that this focus on calm computing should be shifted towards challenges in the area of “engaging UbiComp experiences” [13].
Interactive sound - pervasive expression So far, environmental soundscapes that have been described in literature do not support interaction. Although the soundscape dynamically adjusts to the changing state of the system, it is usually not designed to evoke playful interaction of people with the environment. In our designs we tried to explore this interaction dimension to allow people to intentionally change the soundscape as integral part of their environment.

BIRDS WHISPERING The goal of this first project was to create a subtle indoor soundscape that was pleasant to have around, but also informative in relation to the presence of people in the space. The project was conducted inside one of the office gardens at the TU/e Industrial Design faculty. The goal was to create a virtual colony of birds inside the office space that would react to the movement and activities of people in the space. Below we briefly describe the project. More detail can be found in [5].
Sound Design The choice for bird sounds was made at an early stage of the project. After considering different types of more abstract soundscapes, we readily converged to the use of bird sounds. Although we were a bit concerned that the user group would perceive the bird sounds as kitsch, it turned out they appreciated them as long as they were lively and non-repetitive and kept in the background. To meet this requirement a system was build to generate dynamic and complex bird whistling from snippets of bird sounds.
Scenarios Another important design decision dealt with the relation between the birds and the people. Various scenarios were considered. In an early scenario, which was not implemented, the idea was to have the bird sounds represent absent people. The main function of this concept is that the emptiness, created by an absent colleague, will be filled up, so that a team of co-workers always is “complete”. Every person has got her own representative sound. Absent colleagues would be able to communicate through the birds, for instance when working at home.
In the ‘Utility Bird’ scenario, the soundscape is used to convey information about devices and activities inside and/or relevant for the workspace: the printer, meeting rooms, coffee machine, elevator, toilets. The soundscape is supposed to stay in the periphery of people’s attention, so it will never force itself upon people present in the workspace. We think it is positive that this ‘Utility Bird’ scenario has a learning curve. If you work in a place for a longer period of time, you will probably just know where all the bird songs are coming from, without anybody telling you. We don’t want to tell people what the birds are telling, they would have to find out by themselves. The exciting thing about this concept is that you will create a bond with the system because every day you will understand it better.
A third concept, which we fully implemented, was the idea of the bird colony as an autonomous entity, with a natural tendency to move to the quiet places in the office space. This was realized with a system consisting of eight speakers and eight microphones. Using Max MSP the sound levels of the eight locations in the room were continuously measured. The virtual birds could move between speakers and did so depending on the sound volume measured at the location of the speaker. Once people would move into a quiet area and started conversations or made other kinds of sounds, the
birds would find their way into a more quiet area of the office space. The final result was a subtle soundscape of bird sounds that emphasized the quiet locations in the office space to the inhabitants (Fig. 2).
Based on informal observations of people working in the office space we decided to further explore specific aspects of the Birds Whispering project in three subsequent student projects. The ‘Utility Bird’ scenario was further developed by Emar Vegt in the ‘Mediated Intuition’ project. More explicit and tangible ways to interact with soundscapes were investigated in the ‘IrisBox’ project by David Menting. Wouter Widdershoven designed ‘Holaire’, a mechanically played acoustic guitar providing information about people entering the space.
Figure 2: If someone turns on the music or produces ‘noise’, the birds will search for another place. The birds will always fly to the quietest place [5].
THREE DESIGN EXPLORATIONS ‘Mediated Intuition’ by Emar Vegt The goal of this project is to provide people in the office with information that they would have to actively search for otherwise. The system communicates this information through sound, in such a way that it remains in the background, unobtrusive, not claiming attention or effort from the user, yet passively providing insight into what goes on outside the local environment of the user. Instead of actively shifting from the periphery to the centre of people's attention, this system always stays in the background. It is the user who decides about relevance and required focus, instead of the system. It builds on people's ability to filter out background noise and focus on relevant sounds. The sound itself can contain a level of detail that is not noticed at first when not paying attention, but when focusing, it provides the user with another layer of more detailed information.
If the system works well, it could create a kind of ‘Mediated Intuition’, allowing people to do their daily tasks more efficiently and goal oriented. Because you know more about the state of things that you might need for such a task (information that you actively have to look for otherwise)

the execution of the task can potentially benefit from the enhanced awareness.
Based on brainstorm sessions in which inhabitants of the actual workspace (floor 0) participated, the current queue at the printer located in a different area (floor 2) was chosen as a suitable and practical source of information. If a person who is in the workspace is subtly informed of the size of the queue, it can be judged whether or not it is the right time to go upstairs, preventing unnecessary walks between printer and workspace to check if the printer is free. Just checking the status of the printer on the computer also is a conscious act that requires attention and distracts from the actual task. Even merely wondering if the printer is available calls for attention. With a continuously available soundscape that displays printer information, a person does not have to be consciously aware of the state of the printer - one just knows ‘intuitively’ and acts accordingly. Although printer status can be considered a simple and one-dimensional example, it perfectly illustrates the setting in which sound can create added value without intruding into the user’s space, both physically and mentally.
Another reason for choosing the printer is that the status information can be gathered without requiring explicit user input. This matches the goal of creating a passive system to which people do not need to devote explicit attention.
System and sound design The final system and its components are shown in Fig. 3.
Figure 3: Schematic overview of the final system
The left part of Fig. 3 shows the location of the printer on floor 2. The following components can be identified:
� A webcam, attached to computer 1; This live webcam-feed was used to extract the direction of people moving towards and away from the printer
� Computer 1, attached to the network, displaying the print queue, visual basic with textcaptureX, maxmsp with jitter and cv;
The right panel of Fig. 3 depicts the system components located at ‘Workspace Zero’ on floor 0:
� Computer 2, attached to network, running maxmsp; this computer renders the continuously changing soundscape.
� Audio interface, attached to computer 2;
� Two microphones, attached to the audio interface, detecting the present level of ambient noise;
� Speakers, attached to the audio interface. The speakers are positioned high in the room so that the sound is equally distributed throughout the room, resulting in a similar perceived loudness at all desks.
The actual sound design consisted of in-depth explorations, iterations and improvements of the audible output of the system to tailor it to the real world situation. The final soundscape contained five components:
� A filtered pink noise bed, to prevent complete silence;
� Two sinus tones, indicating the status of the connection of the system;
� Event sounds that are triggered if there is movement in front of the printer/copier, derived from the ticking against a wine glass, with a pitch difference indicating movement towards and away from the machine;
� An event sound that signals changes in the print queue, lower pitched but still derived from the ticking against a wine glass;
� A chord that has its absolute amplitude and rhythmic speed mapped to the total number of pages in the queue;
Discussion Abstracting from the specific printer case, the system could be classified as a ‘calm’ auditory information display. The context in which the system will be placed defines its meaning to a large extent: if the installation would be placed in a museum, for example, it loses all but the aesthetical values of the soundscape. People that experience the soundscape in this way might appreciate it, but the informative aspects of the system only become apparent if the presented information is of value to the listener. If this is not the case, the system is reduced to decoration.
This information doesn’t have to be valuable to all people in an environment at all times, as long as there is a clear purpose and benefit in having this system. Because of its subtlety, it might take a while before people understand the system and make use of it, just as it would take time to be able to distinguish one bird from another. It requires people to become skilled. If there are multiple systems like this, people will specialize, mastering the systems that are the most relevant for them, while only partly understanding others.
Zooming out even further, you end up at the notion of an informative environment, where multiple layers of information are unobtrusively embedded into a space. This is part of the vision on pervasive computing. Within this area, the philosophy of calm technology is already more than twelve years old. Yet, projects and products practically

implementing this as concrete and tangible designs are still rather scarce. The same is true for auditory output that is designed both from an aesthetics and an information point of view. The ‘Mediated Intuition’ project implemented both approaches.
‘IrisBox’ by David Menting The focus of this project is on the availability and willingness of people to communicate with others, i.e. people’s interruptability [4]. With the current multitude of available communication channels and people’s busy schedules it seems interesting and relevant to know if someone indeed is available for communication or not. The goal of the project, therefore, was to design a system that uses sound to present continuous information about the availability and location of people close-by, in order to stimulate social interaction.
The system that was designed, the IrisBox, uses an always-present soundscape as output medium. The soundscape carries information on specific people in your environment. The information displayed consists of two components: the person's openness (or: willingness to communicate with the outside world), and the person's location (physical or abstract). The goal of this system is to provide a form of connectedness, lowering the threshold for face-to-face social interaction.
Throughout the project ‘the door’ was used as a metaphor. Rooms have doors, and everyone knows how to use them. A closed door keeps out unwanted influences: strangers, weather, and noise. When open, the door provides a channel of access between one space and another. But it was not this primary function of access we wanted to focus on. A door has a semantic function as well. By looking at the position of a door, people can judge whether they can come in or not. In most cases, a closed door means: don’t come in or at least knock. But the information can be richer and more subtle. A slightly opened door can have different meanings for different people. In these cases correct interpretation is not only linked to the absolute position of the door, but also determined by the behavior and context of the ‘owner’ of the door. If someone slams a door, it could mean a big ‘do not disturb’, but the specific context could equally well disambiguate this event into a signal that indicates your music is being played too loud. ‘Reading’ such cues can become natural, almost subconscious. But actions that provide input to the system can become almost subconscious as well. If you want to close yourself off and work concentrated you close the door without even thinking about it. And vice versa, if you want to feel connected to your environment, the door can be set wide open. Throughout the design process, this metaphor proved to be a valuable aid in searching for possibilities and making decisions.
Each person who ‘owns’ an IrisBox is represented by a personal sound. Each person’s sound has a steady, quickly pulsating rhythm if that person is busy or does not want to
be disturbed. If that person is open to communication, his or her personal sound changes to a short and abrupt tone, with a longer pause between the tones. The tones add up to a soundscape of availability information. Individual people can be identified by their sound profile, just as you can tell instruments apart in a song.
Your own level of availability is set by twisting the large ring on the face of the IrisBox (see Fig. 4). When the ring is twisted, people that have you in their contact list hear the rhythm of your sound change, indicating a change in your level of availability. When the large ring is twisted clockwise, an iris diaphragm gradually shuts off the illuminated speaker behind it. The position of this aperture represents your availability visually. At the same time, the soundscape output is lowered and filtered, effectively shutting you off from the outside world. Turning the ring anti-clockwise opens the aperture, increases the output volume and sets your status back to available.
Figure 4: The IrisBox. Left: the owner of this box is available for communication. Right: the aperture is almost closed which indicated a low willingness to communicate.
The aperture acts like a portal for communication with the outside world. The aperture ring is used to set your status to an appropriate level. Just as with a door, the appropriate level will be found in equilibrium between total quiet (when shut off, thus unavailable) and maximum level (allowing you to clearly hear the full soundscape).
System design The IrisBox houses a loudspeaker, an amplifier, readout electronics and a microcontroller. The IrisBox sends the aperture ring’s position to the host computer via USB. In the prototype, a Max/MSP patch on the host computer makes sure that the level of availability is broadcast to the people that have you in their contact list, and at the same time controls the soundscape coming from your speaker.
Every participant in the system has an IrisBox on his or her desk. A unique sound profile is compiled using software on the host computer. The same software allows them to manage the people they want to hear in their soundscape. There is a limit to the number of people you can discern, so the contacts have to be chosen carefully.
Sound is very well suited for informing about continuous status in an unobtrusive way. Therefore, the availability of

others is represented by sound. However, there is a limit to the number of sounds we can distinguish when multiple streams are playing. This limit depends on the dimensions of the sounds and the experience of the listener. There is a trade-off to be made here: tracking the availability of many people in a complex way that requires additional user input (for instance, selecting groups of people), or listening to the status of a small number of important people. The latter option was chosen to guarantee a pure and elegant interaction.
The input for the system is the aperture ring. Just as with the door, the aperture serves two functions: controlling the output level of the soundscape, and determining the level of openness of the user. The input ring and output speaker are directly stacked. This allows for interaction close to the output source. In the design, as much effort as possible was put in reducing the distance from speaker diaphragm to iris diaphragm.
Your own status is represented by the openness of the aperture and the level of damping applied to the output sound. The openness of the aperture acts as a metaphor for your openness to the outside world. The outside world, in this case, is represented by the illumination of the speaker.
Even though the aperture does not actually block the sound effectively, they form a logical augmentation to the damping and filtering of the output sound. To maximize the effect of this visual representation, a matte black aperture blade was used to contrast with the silver of the speaker. Visual and tangible mapping is clear: your own state is immediately visible, and the resulting change in output level is immediately audible.
From literature on interruptability research it is known that people are reluctant to actively input their status if it takes too much effort. Therefore, we have attempted to make the interaction as effortless and inviting as possible. The IrisBox is placed at arm’s length, where the large knurled ring begs to be touched due to its shape, size and color. The face of the IrisBox is tilted towards the user, giving it a friendly appearance and making the interaction more accessible.
We tried to prevent that people would see the IrisBox as an ordinary loudspeaker. To differentiate, a speaker without dome was chosen and the speaker’s rubber rim was hidden behind the aperture ring. As opposed to a volume control, but more like a faucet, the stream of sound is cut off when twisting the aperture ring to the right.
The IrisBox is about the sound and the aperture, not about the box. The box itself therefore had to have an insignificant appearance, to steer the focus towards the aperture ring and speaker diaphragm.
Sound design According to Buxton, Gaver and Bly [3], sounds that provide status information should consist of sustained tones or repeating patterns. We decided to use such repeating
patterns to express availability. Initially we used a short sine tone to represent a person, and we used a repeating two-tone motif. The two tones were subsequently played at an interval. The interval served as an indicator for availability. This approach had two pitfalls. Firstly, it turned out to be difficult for people to identify other people on the basis of the absolute pitch of the pure sine tone. Secondly, using an interval to map information makes it necessary to listen to multiple tones before being able to judge someone’s availability.
The sound mapping had to be changed so that the sounds themselves carried information. We decided to keep the rhythm mapping, as it is easily understandable and recognizable by people. Availability information was no longer coded as an interval, but it was represented by manipulating the attack and decay times of the sound. A person who is not available is represented by a faster repetition of tones (= busy) but the envelope of the individual tones is characterized by a slowly rising and slowly falling sound (=not demanding attention). An open IrisBox results in an abrupt tone, i.e. fast attack and decay times (=demanding attention), but with a slower repetition of the individual tones (=not busy).
Discussion The IrisBox is a prototypical example of tangible interaction. Both input and output means are tightly coupled at the same physical location. In this way, the portal function of the IrisBox intimately links two distant partners and the tangible interaction seems to offer a natural and intuitive way of controlling the partner’s mutual concerns about interruptability (availability and willingness to be disturbed).
In the current implementation only two IrisBoxes were built and informally tested. In this situation the identification of a person is not really a problem. Future research is planned to study alternative sound mappings to allow for a more substantial amount of people that connected to a larger set of IrisBoxes. When a network of IrisBoxes is emerging, new functionality is needed to effectively control the next generation IrisBox. For example, a means to select people from your contact list is a function that immediately comes to mind.
At the moment, the IrisBox can be considered a powerful platform on which alternative implementations can be explored. Other applications, for example, like instant messaging, mobile phone or email can be integrated with the current functionality. New multimodal extensions, in which sound is integrated with other modalities like smell, light and/or touch, are envisioned.
‘Holaire’ by Wouter Widdershoven In this project the ‘Holaire’ system was designed. Holaire is a small awareness system clicked on regular acoustic guitar. The name is a combination of the Spanish words: Hola and Aire, meaning hello and tune (melody). This guitar is

placed at the entrance of an office or indoor public space (a bank, or city counter). In our case, Holaire is designed in our design studio (Workspace Zero) and placed at the entrance.
Figure 5: Door sensors provide input for Holaire.
Holaire listens to the door through simple sensors. It is focused on what kind of people enter and how they enter. Infrared beams tell Holaire if someone is tall or short. A variable resistor connected to the door hinge gives info on how the door is handled in terms of speed and pattern.
This information is sent to the little device on the guitar neck. The device rolls over the strings to play a chord that fits the entering person. An extra actuator (a solenoid) can be activated to make it a suspended (sus4) chord. An arm unfolds under the body, hitting the strings with a pick. The strings vibrate harmonically and are amplified by the guitar body. The sound coming from the guitar welcomes the passing person. The other people in the environment (who cannot see the person entering) hear what happens. They recognize the typical sound. After welcoming, Holaire shortly plays a short history of people that just entered before, giving an impression of what just happened. This play of the past lets the person who enters know what to expect and how to position oneself in the context.
There are two types of users in the scenario: the person being greeted and informed and the present person only being informed. The focus in the current system is put on the person who is being greeted friendly while passing the door. This also is the person who interacts with the system and who decides about the character of this interaction. The interaction can be playful or people can even cheat. Other people in the workplace can only experience the sounds produced by the Holaire system. Although Holaire is
aiming at playful interaction, it is also supposed to be a system that would fit the everyday working environment.
Figure 6: Holaire attached to the neck of an acoustic guitar.
Holaire is connected to an acoustic guitar with the goal not to change it into a robot. Holaire is supposed to be an add-on. To not overwhelm people and to accentuate the inherent beauty of the guitar’s shape and materials, Holaire’s construction is kept minimal. The entire shape also points towards (and focuses on) the guitar while folding elegantly its curved arms around the guitar neck.
The prototype of Holaire is laptop based. A Phidget interface is used in combination with multithread Flash action script.
Discussion We could only observe Holaire in real life for a relatively short period of time. This makes it difficult to envision how Holaire would change the environment in the long run. Informal comments seem to indicate that the inhabitants of our workspace got attached to Holaire and considered it is fun to play with the door. When Holaire was removed from its position at the door, people remarked they missed the system in their entering routine. Some people were more skeptical about Holaire questioning its added value to their daily routines. Some people indicated they just got used to the sound playing at their door.
Whether or not Holaire is a ‘calm’ system that creates awareness at a subconscious level is difficult to say. However, we can definitely state that Holaire influenced people’s behavior inside the workspace or at the door.

Some people played with the system; expressing themselves to other people like they would have done through other means like clothing or handshakes. Others tricked the system (or their peers) by, for example, holding up their arms to look taller. Potentially people can differentiate themselves by entering the workplace in personalized ways.
Holaire showed that you can combine the information providing functionality of an ambient awareness system, with a friendly design that is attractive to people and that elicits playful interactive behavior. Holaire seems to rise to the level beyond interactive and is becoming a social presence in the space.
CONCLUSION In three different design projects we explored the design of environmental auditory information displays. In the precursor project ‘Birds Whispering’, it was shown that a soundscape can not only serve as an information carrier, but that the sounds can also have a decorative value. This aspect was further explored in the ‘Mediated Intuition’ project. The resulting soundscape was developed and implemented in a shared workspace. Its informational and aesthetic qualities got their meaning in this workspace and were appreciated by its inhabitants. In the original ‘Birds Whispering’ project people could control the background/foreground characteristics of the soundscape through their behavior. By making noise the birds would move to a distant location and silence remained. The possibility to actively control this moving back and forth between background and foreground was further explored with the ‘IrisBox’. A tangible interface was developed which offers a natural and intuitive way of controlling two partner’s mutual concerns about interruptability. Playful interaction with the auditory information display was observed in the ‘Birds Whispering’ project and further explored in the ‘Holaire’ project. ‘Holaire’ allowed people to express themselves by generating personalized variations of the soundscape.
All design activities have been carried out in the same workspace in which the final designs are supposed to be installed and operate. This design in context has had a great impact on the final results.
REFERENCES 1. Ackerman, M., Hindus, D., Mainwaring, S.D. and Starr,
B. (1997). Hanging on the 'Wire: A Field Study of an Audio-only Media Space. ACM Transactions on Computer Human Interaction 4, 39-66.
2. Brewster, S. A. (2000). Chapter 12: Non-speech auditory output. In Jacko, J. and Sears, A. (Eds.), The Human Computer Interaction Handbook, pp. 220-239, Lawrence Erlbaum Associates, USA, ISBN 0-8058-4468-6.
3. Buxton, W., Gaver, W. and Bly, S. (1991) The use of nonspeech audio at the interface. Tutorial Notes, ACM
Conference on Human Factors in Computing Systems (CHI'91, New Orleans, LA, April 28 - May 2, 1991).
4. Dabbish, L. and R. Kraut. Controlling Interruptions: Awareness Displays and Social Motivation for Coordination. in CSCW. 2004: ACM Press.
5. Eggen, B. and Mensvoort, K. Van. (2008). Making sense of what is going on ‘around’: Designing environmental awareness information displays. In Markopoulos, P., MacKay, W. and Ruyter, B. de (Editors) Awareness systems. Springer Verlag (to appear).
6. Erickson, T. and W.A. Kellogg, Social Translucence: An Approach to Designing Systems that Support Social Processes. ACM Transactions on Computer-Human Interaction, 2000. 7(1): p. 59-83.
7. Gaver, W. W. (1989), The Sonic Finder: An interface that uses auditory icons. Human-Computer Interaction, 4 (1), pp 67 - 94, 1989.
8. Gaver, W.W., Smith, R.B. and O’Shea, T. (1991). Effective Sounds in Complex Systems: The ARKola Simulation. Proceedings of the ACM CHI’91 Conference on Human Factors in Computing Systems, 85-90.
9. Gaver, W. (1997) "Auditory Interfaces," Handbook of Human-Computer Interaction, 2nd Edition, M. G. Helander, T. K. Landauer, and P. Prabhu, Editors, Elsevier Science, Amsterdam (1997).
10. Greenberg, S. and Kuzuoka, H. (2000). Using Digital but Physical Surrogates to Mediate Awareness, Communication and Privacy, in Media Spaces. Personal Technologies 4, 1-17.
11. Hindus, D., Mainwaring, S.D., Leduc, N., Hagstrom, A.E. and Bayley, O. (2001). Casablanca: Designing Social Communication Devices for the Home. Proceedings of the ACM CHI’01 Conference on Human Factors in Computing Systems, 325-332.
12. Mensvoort, K. van. (2006) Exploring Next Nature: Nature changes along with us. In Seltman, G., Lippert, W. (Editors) Entry Paradise, New Design Worlds, Birkhauser, ISBN: 3764376961.
13. Rogers, Y. (2006) Moving on from Weiser's vision of of calm computing: engaging UbiComp experiences. In: P. Dourish and A. Friday (Eds.) Ubicomp 2006 Proceedings, LNCS 4206, pp. 404-421, Springer-Verlag.
14. Weiser, M. and Brown, J.S. (1996). The Coming Age of Calm Technology. PowerGrid Journal v 1.01. http://www.teco.edu/lehre/ubiq/ubiq2000-1/calmtechnology.

Integrating Textiles with Electronic Systems Cecilia Heffer
University of Technology, Sydney [email protected]
ABSTRACT/POSITION STATEMENT
As a textile lecturer and designer I am interested in the intersection between emerging technologies and traditional textile practice. Exploring the structural properties of a fabric and creating potentially new geometries or systems in cloth and pattern are a key interest. Embedding electronics into fabric surfaces has great potential for collaboration and pervasive textile artworks. I would like to apply to participate in The Pervasive Workshop in order to present my own ongoing research collaborations and to open discussions on integrating textiles with display technology. I have little technical experience in electronics however I can contribute to discussions in terms of textile experience. Out of these dialogues potential collaborations and future new works have the potential to arise. Key Words
Textile systems, e-textiles, thermo chromatic inks, LED light circuits, non woven fabrics, traditional textile constructions, intersections of technology with fabric structures, pervasive textile artwork INTRODUCTION
Against the current climate of multi-disciplinary design collaboration traditional textile constructions are merging with new technologies. In terms of textile manufacturing some of the most interesting intersections between traditional textiles and technology are happening in Japan. Textile Designers are collaborating with scientists and engineers to produce extraordinary results. Artists find themselves in an age where they can merge two opposites – hand and technology( Wada 2002) Two key areas have emerged in textiles. Smart fabrics that can resist stains and act like skins to control heat and insulation. Electronic textiles that can be wearable and incorporate small computations within the cloth.. In such cases conductive threads are incorporated to enable conductivity. This can result in fabrics emitting sound, smell and light (Berzowska 2005). It is against this background that I have made early explorations of hand and technology in my textile work and would like to incorporate more possibilities and outcomes in this spirit of exploration.
Figure 1: Reticella Lace Series Photo credit Paul Pavlou
Background Research Projects
An ongoing pre-occupation in my practice is to create contemporary lace interpretations, (fig.1). The impetus behind this work talks into the integration of technology with traditional textile constructions. Encoded in the process is the tradition of a textile history that is continually responding to creative technologies evolving within each age ( Heffer 2007). The illustrated work entitled “Reticella Lace Series” (fig. 1 and 2) is from a solo exhibition of contemporary lace works funded by the Visual Arts/Craft Board of the Australia Council under the category of New Emerging Work. Contemporary Lace is a collection of work that specifically investigates new textile possibilities and configurations. The intention is to create new emerging textile works that combine current innovative technologies with existing traditional craft skills. I am interested in creating a dialog between the old and the new existing along side each other. One informs the other. This interaction of the two creates a new form. Laser technology can be combined with hand-finishing, the drawn and hand painted translated through the digital imaging ( Cochrane 2004). Consequently the Pervasive Workshop could open up possible collaborations in this field. I am interested in adapting this new open work system of lace with conductive threads. I would like to embed electronics in the lace to explore thermo chromatic inks in order to create shifting patterns that respond to heat and touch. Ongoing future textile research projects will experiment with cloth and sound and work with light. These will be linked to the work I have already developed through exploring contemporary lace translations
My investigation into to construction of lace as a new system of open work fabric focuses on the construction of

Figure 2: LACED Contemporary Textiles, Solo Exhibition
Sheffer Gallery, June 2006
space as a means to identify form. It looks at the interplay between positive and negative, between the interface of the background and foreground (Shepherd 2003). As individuals we identify ourselves by what we are placed next to. We associate ourselves through objects however we also identify ourselves by the spaces we inhabit between those objects (Lynn 2001). We notice the differences between ourselves and other cultures in order to understand our own cultural identity. In this respect the new textile works can be seen as a new place, an intersection between tradition and technology, a third lace. This new area of research is a major departure from my previous professional textile design practice. Up until now I have developed textile skills and solved design problems within the practical constraints of a client brief. The emerging work is a creative shift that enables me time for research and reflection. Thus it aims not to pursue a technique in a traditional manner but to unravel and question it and in doing so create new work and meaning. The conceptual approach to this work sits outside the original function of the object. Research into lace has fed directly into my lecturing on innovative textiles at the University of Technology Sydney where I coordinate textiles and lecture.
LACE CURTAIN COMMISSION FOR GOVERNMENT HOUSE
In March 2007 I completed a commission to design a contemporary lace curtain for the State Rooms at Government House Sydney, (fig. 3). The project was part of the Historic Houses Trust To Furnish a Future Program. The lace curtain is contemporary in its translation and is designed to drape behind the original crimson damask provided by Lyon, Cottier & Co in 1879. The damask was subsequently reproduced for Government House by the French firm Lelievre Lyons. The lace commission has been woven as Nottingham Lace on an hundred year old loom in Scotland. The loom is the only one of its kind worldwide. Linked to a CAD system it is a wonderful living example of technology integrating with tradition and history. RESKIN THE FUTURE OF WEARABLE TECHNOLOGY
In January 2007 I was selected to participate in the first Australian Wearables Technology Research and Development Laboratory. The lab was called reSkin, The Future of Wearable Technology and was an initiative of the Australian Network for Art and Technology in partnership with Craft Australia and the Australian National University School of Art and Design. In this intensive workshop twenty two designers, artists, and sound engineers worked in collaboration under the guidance of International and National facilitators. Directions specifically for smart textiles and their application to future design outcomes were played with and explored. This resulted experimental works entitled Pods, ( Fig.3). This exercise attempted to integrate one of history’s oldest textiles, felt, with simple electric circuits and LED lights. The result is a felt vessel that illuminates in the dark (Fig 5 and 6).
Figure 3: The Government House Lace was woven by Morton Young & Borland, Textiles Group, Scotland. Image provided by Morton Young & Borland

Figure 4: Pods, 2007 felt, electrical circuits, led lights, digital prints.
Photo credit Paul Pavlou
Future Collaborations
While very simple in its exploration this work forms the basis of new developmental research and a collaboration with artist Danielle Wilde. Wilde explores the poetic in the design and use of interactive and wearable elements and systems. Together we are going to explore embedding LED lights and circuits within nonwoven felt lace works. The intention is to create a felt garment that responds to touch and interacts with the movement of the body. CONCLUSION
With the knowledge that extraordinary outcomes are emerging in this field of soft computation and electronic textiles I would like to see how this can be adopted into my own practice. As a result of the reSkin Workshop a lot of questions arose in terms of the practical challenges of sources of energy and ways to incorporate electronics into cloth. The Pervasive Workshop will open these discussions with a collective group of specialists that can lead to new collaborations and possibilities in this field.
Figure 5: Felt Pods, 2007, Felt with embedded LED lights, parallel electric circuit. Photo credit Paul Pavlou
Figure 6: Felt Pods, 2007, Felt with embedded LED lights, parallel electric circuit. Photo credit Paul Pavlou
ACKNOWLEDGMENTS I would like to thank Danielle Wilde for her ongoing contributions to this area of research
REFERENCES 1. Berzoska, J Electronic Textiles: wearable
Computers, Reactive Fashion and Soft Computation, p.2-19 Textiles, Volume 3,Issue . Berg.Printed in the United Kingdom, 2005
2. Cochrane,G Craft Australia National Papers. Handmade at the heart of things, 2004
3. Heffer,C., catalogue artist statement. In Integration – The Nature of Objects, p.20 Ivan Dougherty Gallery, College of Fine Arts, The university of New South Wales 2007.
4. Lynn, V. Space Odysseys: Sensation & Immersion, exhibition catalogue. Sydney: The Art Gallery of NSW, 2001
5. Sheperd, R., Lace: definition and classification, Powerhouse Museum, Sydney, 2003
6. Wada,Y Memory on cloth : shibori now New York : Kodansha International, 2002.
/

Development of Sonification Strategies Facilitating Auditory Display
Hong Jun Song Kirsty Beilharz Key Centre of Design Computing and Cognition
Faculty of Architecture, Design and Planning University of Sydney
hson5790, [email protected]
ABSTRACT Information sonification is an emerging field of pervasive computing and is applicable in many wearable artificial sensory systems. This paper presents some strategies that can be employed in auditory interface design where using sound as representation gives insight into the improvement of comprehension and recognition of information sonification in an auditory graphing system. The design strategies are based on listening tests gathering contour identification responses and listening experiences from participants. The analysis of these responses from identification testing and surveys then suggests the method of the usage of auditory dimensions in auditory display. The empirical evidence benefits the development of sonification design strategies for auditory interfaces that can be extended to a wide range of interactive wearable applications. Our discussion will include potential applications of this knowledge in the fields of ambient information display and wearable auditory or audio-visual displays, i.e. ways in which timbre and spatialization can enhance the identification and discriminability of sonified data streams.
Keywords Information sonification, spatialization, timbre, quantitative measurement, qualitative measurement, aesthetic display
INTRODUCTION In everyday life people communicate and collect information by using all their physical senses, including vision, hearing and touch. Sound is regarded as an informative medium to support an information-seeking task or activity. For example, many devices such as doorbells, ovens and telephones use sounds (auditory cues and auditory alerts) to communicate events, environment, and gain awareness. Sounds are a natural consequence of the physical environment and although being seldom aware of it, people are always listening and using sounds in many ways [1]. Also due to its intuitive connection with symbolic meanings, sound has been extensively used as a means for Human Computer Interaction (HCI), in which it can provide a rapid comprehension of the processing status, alarm or warnings in the user interface. In novel HCI paradigms such as ubiquitous, pervasive and wearable computing, interactive sonification provides alternatives to
visual display, intuitive responses and augmented channels of communication [2, 3]. Apart from its accessibility for visual impaired users [4], sonification can also be used for navigation cues [5], representing complex scientific data such as neural spike propagation data [3] (the reference gives an example where a group of players can collaborate with each other and their actions transferred through a percussive controller were responded to composed pieces of music), forecasting real-time financial data [6, 7], and other responsive real-time data, such as capturing dynamic non-visual weather data [8]. Taking account of humans’ pervasive experience with sound and intuitive response to sound, representing information in an auditory display is intended to aid and enhance comprehension of the data represented, and to meet the needs of extending computational data processing with the fast growth of digitalization in our society. Some multi-dimensional sets of data benefit from auditory representation (sonification) because the time-based, linear representation of sound allows us to easily recognize trends, patterns, information clusters and recurrences of behaviour. This leads to easier assimilation of the displayed information, especially in visually overloaded workplaces. However, because of the instantaneous features of sound, auditory interface design appears to be challenging. For sonification to be of optimal benefit, the rapid cognition, comprehension and assimilation of auditory information in a non-demanding, intuitive representation are essential to its efficacy.
AIM AND MOTIVATION This study is motivated by a desire to systematically examine how spatial separation and timbre assist on the ability of listeners to understand sonification, taking the advantage of pervasive listening to sound. It aims to explore sonification design strategies that facilitate efficient information representation and that have great applicable

potentials in various wearable synthetic systems. An important issue in auditory interface design is to convey the intent of the designer and present an easily-understood auditory display for users. In information sonification, various types of information need to be displayed clearly and unambiguously, and some obstacles have to be addressed for an efficient representation. In order to achieve the goal, sonification research involves multidisciplinary investigation in the fields of acoustics, psychoacoustics, psychology, cognition and human computer interaction. It is a significant challenge to determine how to design a “comprehensible” auditory display and to map information onto adaptive sound variables, because of the lack of applied theories of mapping generation for a successful sonification. The gap can be bridged by comprehensively investigating the essential components in sonification design. Mapping is a core process in auditory interface design to establish linkages between the data domain and the sound domain, e.g., connecting data quantity, activity or numerical values to auditory attributes such as pitch, rhythm and location. This computational process determines to a high degree how successfully a listener is able retrieve the information defined in the mapping process. In other words, the mapping of data onto sound requires a deep understanding of the way of information retrieval by a listener – the recognition of information embedded in sound – and must take into account the user’s capability while carrying out tasks in the real environment.
EXPERIMENT I – USAGE OF SPATIAL SEPARATION TO IMPROVE IDENTIFICATION AND RECOGNITION When two sound sources are oriented from different directions, a listener needs to keep tracking and integrating auditory messages from two spatially separated locations. Spatial rehearsal allows tracking the orientation locations in the working memory and spatial reasoning is augmented due to the identification of the masking and interference occurring between two auditory streams. It is possible to degrade the performance if an interactive interface designer uses this strategy (analogous to the findings in visual display [9, 10]). In other words, cognitive overload and complexity may hinder performance. While intuition may indicate that spatial separation can be used in the mapping scheme of auditory interface design [11], due to its feature of having less interaction with other parameters such as pitch and rhythm and interaural time/level differences [12, 13], there is little empirical information in literature supporting and investigating the effects of non-speech spatialization. Experiment I especially examined the possibility of spatial separation used as mapping strategy to assist listeners during the deciphering information embedded in sound. Our concern is particularly to develop an understanding of the potential application of spatialization in sonification
using commercially available binaural reproduction. The results from this experiment confirmed the benefits of spatial separation in information sonification with headphone representation.
Method Forty stimuli were included for the 32 volunteer participants and their task was to identify the contours of pairs of various auditory graphs. The pairs of simultaneous auditory graphs were configured both in a single location and in two separated virtual locations (see Figure 1). The spatial rendering was simply in terms of image direction, without any attempt to vary the virtual distance or other aspects of auditory space. The combination of 20 stimuli in display mode 1 and 20 stimuli in mode 2 was played in a random sequence to the participants and the subjects’ task was to pick up the correct pair of contours from 12 given options. The experiment used headphones for binaural reproduction with generic Head-related Transfer Functions (HRTFs) and no head-tracking was involved. We recognized that the accuracy of head-tracking, individualized HRTFs or loudspeaker reproduction is greater, but these laboratory conditions do not simulate the workplace, such as the stock trading data analysis context and are not applicable for pervasive computing systems. The auditory interface (shown in Figure 2), creating stimuli for the listeners, are designed in Max/MSP [14], which is a real-time programming environment. Parameters such as the energy envelope can be easily altered by editing the graphic icons.
Fig. 2. Spatial configuration in experiment I. Mode 1: both streams are from the middle line (azimuth= 0ºand elevation=0º); Mode 2: they are spatially separated, 60 degrees away from the middle line symmetrically.
Fig. 1. Spatial configuration in experiment I. Mode 1: both streams are from the middle line (azimuth= 0ºand elevation=0º); Mode 2: they are spatially separated, 60 degrees away from the middle line symmetrically.

Results When the participants identified the pairs of contours, a significant difference ( ) was found between the two display modes. When the two auditory streams were spatially separated, the errors that occurred were fewer than when the same pair was co-located. The result indicates that spatial separation can be used as a mapping strategy in auditory interface design where it is able to improve the comprehensibility, when a listener has to pay attention to two simultaneous auditory events. The other outcomes are summarized as:
• The human factor of musical background did not influence a listener’s performance where the listening task was about sketching relative differences (i.e., pitch contour) rather than judging absolute differences (i.e., magnitude estimation – degree of pitch difference).
• Timbre has the potential to enhance spatialization in sonification. Although in this experiment, pairs of auditory streams used the same timbres, differences were found between pairs with different timbres. The analysis of acoustic attributes showed that the timbres with a long attack performed better than those with a short attack.
EXPERIMENT II – USE OF INDIVIDUAL TIMBRE TO ENHANCE SPATIALIZATION AND AESTHETICS The usage of timbre in sonification is not an easy task because timbre is not defined by a single value but by a
group of dynamic and static sound properties [15]. In music and speech, timbre is the quality that distinguishes different types of sounds of musical instruments or voices. In sonification, it is regarded as a remarkable dimension [16] that allows characterization, distinction and comparison of sounds. Additionally, timbre is an important variable when presenting an aesthetic auditory display. Previous studies [17, 18] on timbre tried to characterize timbre in a perceptual space. These investigations contribute to a better representation of timbre by restricting the number of dimensions to three perceptually related dimensions. This assists in the determination of auditory variables to generate compatible timbres in this experiment.
Fig. 3. Screenshot of the synthesizer to create auditory graphing stimuli. The up-left module was a group of preset graphical lines and the shape can be displayed in the up-right screen visually. The two modules at the bottom are able to generate different timbres for pairs of timbres.
Fig. 4. Screenshot of the synthesizer to create auditory graphing stimuli. The up-left module was a group of preset graphical lines and the shape can be displayed in the up-right screen visually. The two modules at the bottom are able to generate different timbres for pairs of timbres.
Fig. 5. Sample stimulus. The stimulus consisted of two concurrent auditory streams. Numerical values of graphical lines were mapped onto pitches on the y-axis and the movement of pitch over time was along the x-axis. Each stream had its own timbre and sound location (60 degrees away from the middle line). Therefore, stream segregation benefits from both timbral quality and spatial separation.

Different from timbre space studies, experiment II augmented a measurement of timbre for a cognition task – in order to understand whether timbre assists recognition of contours. Experiment II aims to explore key factors influencing the use of timbre when designing an auditory interface. The evaluation was performed from the angles of “informativeness”, “aesthetics” and “clarity”. The selection of “distinct” pairs of timbres were based on the features that are not only able to differentiate concurrent auditory streams but also able to aid the identification of contours. The decision about the mapping strategy, concerning timbre, was derived not only from the survey about the participants’ listening experiences but also from identification performance.
Method The timbres used were created with Fourier-based additive synthesis. Each auditory stream has its own individual timbre (see Figure 3). The graphical values were mapped onto fundamental frequencies and the output was a sequence of digital signals, each of which was a summation of the fundamental and the harmonics/partials. The generation of timbre was controlled by altering the attack portion, ratio and number of harmonics/partials, and amplitude envelope. Additive synthesis also allows an evolutionary change in timbre with the change in frequencies reflecting numerical data values. Thirty-six volunteer participants, who ranked themselves in the post-experiment survey as music novices, in terms of their musical background, were included in experiment II. They had only one chance in the identification task to listen to each stimulus in order to avoid an incorrect listening strategy – listening to one stream and then the other when replaying. But when accomplishing a semantic differential scaling task, the stimuli can be played as many times as the listeners required. A semantic differential technique was used to compare and identify the degree of sensation of distinctiveness of pairs of synthesized timbres and the sensation of the sound quality of selected outstanding auditory streams. These bi-polar scales define the strength level of each feeling. The sound quality scales were rated from five perspectives of subjective listening experiences: relaxation (focused/diffuse), aesthetics (smooth/rough), clarity (obvious/subtle and soft/hard) and psychoacoustics (sharp/dull). Using a set of rating scales derived from the semantic differential method, the subjects judged and described each of five different feelings in terms of their own emotional impressions. Acoustic measurement was also involved. The analysis was predominantly in the spectral domain and was based on feature extraction from six perspectives: number of harmonics, average intensity, peak frequency, ceiling amplitude, spectrum width and spectral centroid.
Results Combining the performance and the listeners’ ranking of the distinctiveness between pairs of timbres, a significant correlation was shown ( ). This indicates that in auditory interface design, auditory streams could have their individual timbres because distinct pairs of timbres can provide assistance to both stream segregation and information recognition. Semantic differential scaling illustrates underlying listeners’ underlying emotional meanings to sound. The verbal descriptors portrayed the main characteristics of the striking/noticeable auditory stream of a pair. These selected streams have individual prominent timbral features that attract the listeners’ attention and perceptually separate them from simultaneous streams. Therefore, the descriptors of “obvious” and “focused” are most significant and consistent. The correlation between smooth/rough and soft/hard indicates that aesthetics and relaxation characteristics are related and “smooth” sounds have less perceptual tensity. Acoustic measurements illustrate that performance is affected by the spectrum width and spectrum centroid of the pairs of timbres. Integrating the performance, semantic differential scaling and acoustic measurements, the outcomes are summarized below:
• It is shown that distinctiveness of timbres is a feature that can enhance the performance of a spatialized information sonification in the contexts of concurrency, comparison and recognition.
• Distinct timbre pairs can help not only stream segregation (perception only) but also contour identification (cognition).
• Sharpness of sound makes an auditory stream perceptually prominent, which helps stream segregation but does not help contour identification. Therefore, for a better sonification display, the concurrent auditory steams should be differentiated in timbre but the differentiation should be achieved using the property of sharpness.
• Acoustic measurement shows that the differentiation can be achieved by enlarging the gap of spectrum width and spectral centroid between two auditory streams, but not by increasing ceiling amplitude and peak frequency.
DISCUSSION AND CONCLUSION The results of the two experiments, which gathered the responses and listeners’ opinions in a real environment, contribute to the development of strategies for ubiquitous interactive auditory interface design. The study presented can be applied into a wide range of interactive interfaces and could be incorporated with visual and haptic devices to develop creative information display systems.

These strategies can be especially applied in a complex auditory display including concurrent auditory display where a listener has to pay attention to and recognize the pattern of both auditory streams. In information sonification, although single stream representation is relatively easier to follow and recognize compared with multiple streams, it has limitations which restrict bandwidth and the competence of communicating with information. For two time-based data sets, for a single stream display either by a compound of two data sets (i.e., differentiating in timbre), or individually in succession, the time cue is easily lost and comparison (finding differences or relationships between two streams) becomes very difficult. A display containing concurrent auditory streams unties the restriction of single stream display, allows consecutive processing of multiple equally important auditory streams and carries more information. In order to overcome the difficulties of concurrent display such as interference and masking when two streams are harmonically related [19], the differentiation strategies found are able to distinguish streams in order for people to have an adequate understanding of the sonification. In specific relation to application in wearable expression, e-fashion and mobile body-bound contexts, spatialization of audio faces some restrictions. Small wearable displays might be limited to a single speaker or loudspeaker sound production systems that offer little spatial separation between channels or to binaural (headphone) display. In this case, our findings about timbral spectra and differentiating streams for identification and separation will be most useful. As time-based audio display is often continuous, a cue-based or alert system might better suit a wearable display. Spatialisation adds a dimensions for sonification that, when worn, might imbue the wearable with a sense of directionality. However, in an architectural (interactive architectural or responsive architectural) or sensate context, such as for ambient information display, bi-modal and interactive sonifications or installations in public spaces, both spatialization and timbral differentiation can enhance the understanding of auditory information representation. Panning, for example, is easily achievable in a display with well-separated speakers. In ambient contexts where the listener is likely to encounter interference of ambient noise and complexity created by environmental, conversational and other competing sounds, strategies that enhance stream identification and comprehension of concurrent data encoding contribute to usability and sustained listening for the user. Further, most existing sonification toolkits and time-based displays emphasize the dimensions of pitch and periodicity for representing data attributes and we believe the findings in this paper support both the validity and advantage of using other (additional) sonic parameters to express information. Subtleties such as timbral nuance and a rich array of location sources in the spatial image arguably contribute to a deeper emotive and persuasive quality of sonification. In particular, we aim to give greater importance to the
aesthetic aspects of auditory display for social and community contexts, so that people enjoy wearing or inhabiting the display. In regard to the potentially expressive nature and aesthetics of wearable displays, the additional subtlety and dimensionality afforded by using an array of timbral (tone quality) variations is both limitless and more textural or sensitive than only using pitch and periodicity. We think a parallel might even be drawn between the textural nuances of timbre and the materiality of textiles, relating qualities of surface, smoothness, roughness, suppleness, distortion of sound quality and fabric character. Our current and continuing work extends these findings to time-based data and emphasizing qualitative measurement, which is able to uncover the interaction between listeners and auditory display and to reflect on the “process” through which a listener experiences decoding sounds.
REFERENCES 1. Barrass, S. (1997). Auditory Information Design, PhD
degree dissertation, Australian National University 2. Rath, M. and Rocchesso, D. Continuous Sonic
Feedback from a Rolling Ball, IEEE Multimedia Special Issue on Interactive Sonification.
3. Weinberg, G. and Thatcher, T. (2006). Interactive Sonification: Aesthetics, Functionality and Performance, Leonardo Music Journal, 16.
4. vOICe 2004 Draw Your Own Sound: Image to Sound Mapping http://www.visualprosthesis.com/javoice.htm Aug-15-04.
5. Lokki, T., Grohn, M., Savioja, L. and Takala, T. (2000). "A Case Study of Auditory Navigation in Virtual Acoustic Environments", 9th International Conference on Auditory Display (ICAD'03), Boston, MA, USA.
6. Ciardi, F. C. (2004). "Smax a Multimodal Toolkit for Stock Market Data Sonification", 10th International Conference on Auditory Display (ICAD'04), Sydney, Australia.
7. Ben-Tal, O. and Berger, J. (2004). Creative Aspects of Sonification, Leonardo, ISAST, 37 (3): 229-232.
8. Paine, G. (2004). "Reeds: A Responsive Sound Installation", International Conference of Auditory Display (ICAD), Sydney, Australia.
9. Han, S. H. and Kim, M. S. (2004). The Role of Spatial Working Memory in Visual Search Efficiency, Psychonomic Bulletin & Review, 11: 275-281.
10. Repovs, G. and Baddeley, A. (2006). The Multi-Component Model of Working Memory: Explorations in Experimental Cognitive Psychology, Neuroscience, 139: 5-21.
11. Best, V., van Schaik, A., Jin, C. and Carlile, S. (2005). Auditory Spatial Perception with Sources Overlapping in Frequency and Time, Acta Acustica United with Acustica, 91: 421-428.
12. Best, V., Ihlefeld, A. and Shinn-Cunningham, B. (2005). "The Effect of Auditory Spatial Layout in a
Divided Attention Task", 11th International Conference on Auditory Display (ICAD'05), Limerick, Ireland, pp. 17-22.
13. Shinn-Cunningham, B. G. (2005). "Influences of Spatial Cues on Grouping and Understanding Sound", Forum Acusticum 2005 Budapest.
14. Puckette, M. and Zicarelli, D. (1990-2008).Max/Msp, Cycling74/IRCAM, URL: http://www.cycling74.com/
15. Loureiro, M. A., Paula, H. B. d. and Yehia, H. C. (2004). "Timbre Classification of a Single Musical Instrument", the 5th International Conference on Music Infor mation Retrieval (ISMIR 2004), Barcelona, Spain.
16. Bregman, A. S. (1990). Auditory Scene Analysis, The MIT Press, Cambridge, MA, USA.
17. Terasawa, H., Slaney, M. and Berger, J. (2005). "Perceptual Distance in Timbre Space", 11th International Conference on Auditory Display (ICAD'05).
18. Grey, J. M. (1977). Multidimensional Perceptual Scaling of Musical Timbres, the Journal of the Acoustical Society of America, 61 (5): 1270-1277.
19. Best, V., Gallun, F. J., Carlile, S. and Shinn-Cunningham, B. G. (2006). Binaural Interference and Auditory Grouping, Journal of the Acoustical Society of America, 121 (2): 1070-1076.

A Framework for Architecture as a Medium for Expression
ABSTRACT We propose a conceptual design framework for the classification and design of applications that augment architectural environments with digital information. The dimensions of the framework consist of the layers that compose architectural space (façade, interior and structure)and its embodiments (expressive medium, responsive space and social actor). We further introduce design characteristics for each application area within the framework. Accordingly, we describe two conceptual prototypes that we developed to investigate the validity of the framework as a conceptual design tool. Keywords Pervasive media, ambient displays, interactive architecture, responsive environments INTRODUCTION The application of architecture as a medium for expression can be traced back to the first days of human evolution. Ancient caves with featured paintings from that time represented an intellectual instrument to encourage discussion or storytelling [9]. The expression of architecture has changed over time, often in line with the various epochs of human history. For example the purpose of ceiling frescoes, which were highly popular during the Renaissance period, was to express storytelling and major beliefs of that period [5]. Put into a social context the intention of ceiling frescoes was to communicate the power and wealth of the proprietors to the people visiting the architectural space. Social contexts emerge from mutual coexistence of architecture and people sharing the architectural space. By changing the way people interact with each other and their environment, architectural spaces potentially develop an encouragement of sociability [4], i.e. the environment evokes conversations among people sharing the same space.The term architecture not only refers to the physical structure of an architectural environment, but also spans
interior design, décor and other spatially related disciplines like landscape architecture. Architectural environments have several layers of built components that reach beyond their pure physical structure [2]. Pervasive expressive architecture is defined as spatial representation of specific information relevant to the immediate environment or the people, who use that space. The advent of new information technologies, such as sensors, displays and networking technologies, allow for the exploration of new applications in that realm. Examples for application areas are: the representation of remote data (e.g. activity patterns of a distant loved one [18]), conveying information about other co-located people (e.g. interests of colleagues [11]), revealing user-specific details (e.g. to-do lists, physical parameters, etc. [17]) or visualizing information that was not visible before (e.g. energy consumption within a building, see Figure 3). Furthermore, spatial data (e.g. sound, see Figure 2) lends itself very well for visually mapping its abstract representations onto architectural spaces.In this paper we describe a framework for the classification of pervasive expressive architecture. Accordingly, we present two conceptual prototypes based on the framework to investigate its applicability as a design tool. BACKGROUND It was not before the second half of the 20th century that architects and artists gained access to multimedia technologies that enabled them to augment architectural environments with digital information. The integration of media and architecture eventually led to the notion of mediatecture. Representatives of this paradigm are multimedia systems that extend architectural environments, typically in public or semi-public contexts. The NASDAQ Tower on Times Square, which displays financial news, market highlights and advertisements on a seven stories high multimedia display represents an example for this paradigm. Mediatecture applications affect their immediate architectural environment and therefore change the way people perceive and interact with their environment, e.g. starting conversations with other passers-by. More recently advances in information and communication technologies have led to the notion of pervasive computing, which is more environment-centric than traditional computing paradigms, such as desktop-based or mobile computing
Martin TomitschResearch Group for
Industrial Software (INSO)Vienna University of Technology
Andrew Vande Moere Faculty of Architecture,
Design & Planning The University of Sydney [email protected]
Thomas Grechenig Research Group for
Industrial Software (INSO) Vienna University of Technology

[16]. The well-thought integration of information technologies into everyday environments based on this paradigm has the potential of turning architectural space into an interface between people and digital information [20]. Both, mediatecture and pervasive computing build a conceptual and technological foundation for pervasive expressive architecture applications. LAYERS The layers that depict the components of architectural environments represent the first dimension for our framework. We based the instances for this dimension on Brand’s classification of buildings into “shearing layers of change” [2]. Brand investigated how buildings change over time. He identified several layers of buildings and noticed that their longevity determines the pace of change. Rodden and Benford transposed this concept to the pervasive computing area [15]. They discussed Brand’s classification scheme as means for understanding behaviour in the home and providing design guidance for the development of new applications in domestic environments. For our framework we investigated the layers suggested by Brand not in terms of longevity but for determining potential layers of architectural environments for pervasive expressive architecture. We adapted the following layers for the framework: • Façade is identical with the skin as described by
Brand. This is the exterior surface, i.e. the façade, of a building. Mediatecture applications typically exploit this layer.
• Interior spans all fixed surfaces that are inside a building, like the walls, floors, ceilings, etc., but not their structural arrangement. Objects that Brand classifies into “stuff” would be partly based on this layer, e.g. a picture could be placed on a wall. An example for an application from this layer is a wall within a building that is augmented with digital information.
• Structure covers the foundation and load-bearing elements as well as what Brand calls space plan, which is the interior layout (i.e. the arrangement of walls, ceilings, floors and doors). Examples within this layer introduce new structural elements into the architectural space, such as a wall that acts as a display.
EMBODIMENTS Current trends in the field of pervasive expressive architecture suggest a classification into the following categories of embodiments: expressive medium, responsivespace and social actor. These categories are not mutually exclusive, but have a cumulative character. For example a responsive space always acts as an expressive medium as well. Figure 1 illustrates the relations between the different instances of the dimensions. Architecture as expressive medium exploits the layers façade, interior and structure, as a medium for expression. They affect the way passers-by perceive their surroundings and potentially engage them into dialogues with others sharing the space. However they do not support direct or indirect interactions between passers-by and the architectural space. Ambient displays [10], which are information systems that communicate information in the periphery of human attention, are a well-known example for an application area within this category. Pervasiveexpressive displays apply the concept of ambient displays for visual representations of information within architectural environments. They should be calm, non-obtrusive and opportunistic, revealing information only for interested inhabitants or passers-by [19], in order to avoid distraction for other people in their vicinity. We therefore identified the following characteristics for applications based on this category: (1) non-obtrusive, (2) informativeand (3) socially engaging. As an example consider the GroupCast display [9]. The display is integrated into the hallway of a building and does not require user interaction (non-obtrusive). It displays information about interest of people passing the display (informative), which might stimulate conversation between people sharing the same interests (socially engaging). A responsive space is an environment that interacts with the people who pass through it [3]. Thus, this category describes spaces that allow for interaction between passers-by and their surroundings. Pervasive computing environments are equipped with sensors, embedded displays and networking technologies, allowing tracking of people, movement and environmental conditions. The aim of such interactive systems is to create a digitally enhanced social space, inviting people to interact with their environment as well as with each other. Once a user decided to interact with the system it should stimulate an engaging dialogue, maintaining the user’s attraction and interest. In addition to the three characteristics of expressive medium, responsive spaces are therefore also (4) interactive and (5) enjoyable. An example for this category is iFloor [8], a system developed for a library setting. It
Figure 1. The dimensions of the framework: embodiments(expressive medium, responsive space, social actor) and layers(façade, interior, structure).

allows visitors to post questions and send answers to each other. The items spread on the floor are controlled through body movement (interactive), which turns into a playful challenge when more than one person interacts with the floor (enjoyable). A social actor is a space equipped with technologies that mimic typical behaviour of humans, animals or plants, such as physical features or emotions. Environments embodying social actor can invoke social responses from users [14]. They are perceived as social characters and evoke the feeling that they need our attention to survive, that we have to take care of them. Systems from this category rely on sensors and other pervasive computing technologies to communicate with people in a non-verbal direct or indirect way. In addition to the characteristics of expressive medium and responsive spaces, applications within this category are (6) social and (7) adaptive. For example the performative ecologies project [7] features three autonomous robots suspended from the ceiling that continuously search their environment for inhabitants and try to engage them in non-verbal communication by performing different gestural patterns (social). They further remember and teach each other about which performances were most successful (adaptive). CASE STUDIES In the course of exploring the different design dimensions of pervasive expressive architecture we prototyped the sound-responsive ceiling display and a persuasive ambient wall display. These examples allow us to verify the framework in investigating the design considerations for applications within this field. Sound-Responsive Ceiling Display The sound-responsive ceiling display consists of an array of 12 microunits that cover the ceiling of a room (see Figure 2). The system reflects the current distribution of the room’s sound level through dynamically changing light patterns in real-time. A possible application scenario foresees the installation of the ceiling display in a café or bar, allowing visitors to judge the different sound levels inside the space by simply glancing at the ceiling. Each of the 12 units is equipped with a microphone that features a directional characteristic (i.e. it reacts more sensitive to sounds received directly beneath the microphone) and a light emitting diode (LED). The units are connected to each other, allowing a basic networked communication between the units. Each of them broadcasts the measured value representing the sound level, which allows adapting the light intensity of each LED to the overall sound inside the room. The motivation of this project was to investigate the potential of the architectural ceiling as a useful surface for responsive display. The objective was to develop a system that would serve as an ambient display for ambient sound and also allow for interaction between passers-by and the environment. The ceiling was chosen for its peripheral character, which supports a spatial representation of
ambient sound. Using these objectives as input parameters for the framework, the application accordingly represents a responsive space based on the interior layer. Therefore we used the characteristics (1) to (5) to guide the conceptual design:• the application is non-obtrusive since the ceiling sits at
the periphery of human attention; • it provides passers-by with additional information,
which is of informative nature;• the represented information relates to individuals as
well as groups sharing a space, potentially evoking dialogues between them, which means that it is socially engaging;
• it is interactive, since passers-by influence the visual appearance indirectly as well as directly; and
• the light patterns produced in real-time based on ambient sound in combination with the aesthetics of blue LEDs make the application enjoyable to use.
The project is still work in progress and we are currently developing a second revised generation of microunits. Nevertheless, the initial installation already demonstrated that this additional spatial information adds to the perceived quality of a room, while also inviting people who are inside the room to interact with the system. Persuasive Ambient Wall Display In this project we use a commercially available large screen LED display as an ambient wall display. The application features different visual representations, depending on the presence of people. In its idle mode it dissolves into the existing architectural environment to avoid constant disharmonic distraction (see Figure 3, left). The system is equipped with a camera for tracking motion and the presence of people. If people are present but distant the visualization changes to provide an actual representation based on energy data. If the display detects people in its immediate vicinity, it switches into a mode that supports direct interaction, enabling people to explore and navigate the representation. Another representation uses the low-resolution display to mimic breathing or the beating of a heart, where the speed is determined by the current energy
Figure 2. The sound-responsive ceiling display: one of theunits equipped with a microphone and an LED (left) and thecurrent installation of the system on a ceiling (right),reflecting the relative distribution of the sound level withinthe room.

consumption within the building (see Figure 3, right). Thus, a relaxed and calm pulsing light tells of low energy consumption, while a nervously pulsing light signals atypically high consumption. The goal of this project is to investigate the use of spatial ambient display for increasing energy awareness among people sharing a public space. Using these objectives as input parameters for the framework provided us with the following insights: The application has to follow the design constraints of social actor, since its purpose is to persuade people to use less energy and it therefore has to actively engage people in conversations. Further, it has been proven that computing systems mimicking social actors are a powerful tool for persuasion [6]. Since the display is augmenting a wall with digital information, it is situated on the interior layer, although the fact that the display is moveable would also allow its application as structure.According to the framework, the conceptual prototype was based on the design characteristics (1) to (7): • the application is non-obtrusive since it is designed as
an ambient display and only engages people into conversations that are in its immediate vicinity;
• it is informative since it provides passers-by with additional information about their environment;
• the representation of energy data potentially evokes dialogues between passers-by, which makes the application socially engaging;
• it is interactive since it allows passers-by to explore the representation;
• the aesthetic integration of a high technology display into the public everyday environment provides an enjoyable character;
• the social character is achieved through mimicking breathing or heartbeat; and
• it is adaptive, since it knows about the presence of people and adapts its representation accordingly.
The project is currently in its implementation phase. To assess the display’s impact on people’s behaviour and to
further validate the framework an evaluation of the final system in its real context is planned. DISCUSSION The framework presented in this paper was particularly developed for pervasive computing applications that augment architectural environments with digital information. It provides researchers, designers and artists in this area with both a classification scheme and a conceptual design tool. The two-dimensional nature of the framework (i.e. layers and embodiments) allow for a classification of applications based on the pervasive computing paradigm that are situated in architectural environments. While the framework specifically aims at new applications, it can also potentially be applied for classifying historic examples of architectural art. For example, ceiling frescoes exploit the interior layer and represent an expressive medium. The purpose of compiling a classification of pervasive expressive architecture applications is that it can point out current trends and potential areas for future research, similar to a taxonomy [13]. The main strength of the framework lies in its applicability as a conceptual design tool. We demonstrated its validity in this respect by discussing two case studies and relating them to the framework. The framework worked well for situating the case study applications within the design space. The design characteristics that we introduced as part of the framework provided us with requirements for the conceptual design of the applications. However, further application of the framework will be necessary to evaluate its usefulness for other applications. Eventually this will also lead to a refined list of design characteristics to provide more extensive guidance during the conceptual design process.A potential of the framework that we have not explored so far is its applicability for evaluating pervasive computing applications that augment architectural environments with digital information. CONCLUSION The main contributions of the framework presented in this paper are: (1) a categorization for applications that use architecture for expression based on two dimensions, (2) an analysis of the layers of pervasive expressive architecture and its embodiments, and (3) a set of characteristics for designing or evaluating applications from this realm. The potentials of this new paradigm have not yet been fully explored, mainly due to the fact that the design space is extremely large. However, the field has seen a growing interest within the last years. Pervasive computing technologies are increasingly applied within architectural environments and concepts [7,8,11,20]. We therefore believe that the field will experience a shift from simple points of interactions scattered within architectural spaces towards fully adaptive, environmentally aware and socially reflective environments that involve inhabitants and passers-by in constant unobtrusive, subtle and informative conversations.
Figure 3. The persuasive ambient wall display (mockup): thedisplay in its idle state, dissolving into the background (left)and an example for the notion of a social actor – a pulsinglight that is connected to the current energy consumption andmimics breathing (right).

The application of the framework for the conceptual design of two prototypes proved its validity and usefulness for designing applications that exploit architectural environments for expression. The framework therefore not only allows a classification of applications retrospectively, but can also guide the development of new applications in this field. ACKNOWLEDGMENTS We would like to thank Gerhard Rzepa for his support with the implementation of the sound-responsive ceiling and Andrea Lau for providing valuable comments on an early draft of this paper.REFERENCES 1. Beilharz, K. Responsive Sensate Environments: Past
and Future Directions. Proceedings of the International Conference on Computer-Aided Architectural Design Futures (CAADFutures’05), Springer, 361-370, 205.
2. Brand, S. How Buildings Learn. New York, Viking, 1994.
3. Bullivant, L. Responsive Environments: Architecture, Art and Design. V&A Publications, London, UK, 2006.
4. Bullivant, L. 4dsocial: Interactive Design Environments. Architectural Design, vol 77 (9), Wiley-Academy, London, UK, 2007.
5. Burda-Stengel, F. Andrea Pozzo und die Videokunst: Neue Überlegungen zum barocken Illusionismus (Andrea Pozzo and Video Art: New Reflections about Baroque Illusionism). Mann (Gebr.), 2001.
6. Fogg, B.J. Persuasive Technologies. Morgan Kaufmann Publishers, San Francisco, CA, 2003.
7. Glynn, R. Performative Ecologies. Installation, 2007. http://www.interactivearchitecture.org/portfolio/performativeecologies.html
8. Graves-Petersen, M., Gall Krogh, P., Ludvigsen, M. and Lykke-Olesen, A. Floor interaction HCI reaching new ground. Extended Abstract on Human factors in Computing Systems (CHI’05), ACM Press, Portland, Oregon, 1717-1720, 2005.
9. Johnson, P. Art: A New History. Harper Collins, 2003. 10.Mankoff, J., Dey, A., Heish, G., Kientz, J., Lederer, S.,
and Ames, M. Heuristic evaluation of ambient displays. Proceedings of the International Conference on Human Factors in Computing Systems (CHI’03), ACM Press, 169-176, 2003.
11.McCarthy, J.F. Costa, T.J., and Liongosari, E.S. UniCast, OutCast & GroupCast: Three Steps Toward
Ubiquitous, Peripheral Displays. Proceedings of the International Conference on Ubiquitous Computing (Ubicomp’01), ACM Press, Atlanta, Georgia, 332-345, 2001.
12.Petersen, J.E., Shunturov, V., Janda, K., Platt, G. and Weinberger, K. Dormitory residents reduce electricity consumption when exposed to real-time visual feedback and incentives. International Journal of Sustainability in Higher Education, vol. 8 (1), Emerald Group Publishing Limited, 16-33, 2007.
13.Pousman, Z. and Stasko, J. A taxonomy of ambient information systems: four patterns of design. Proceedings of the working conference on Advanced visual interfaces (AVI’06), ACM Press, 67-74, 2006.
14.Reeves, B., and Nass, C. The Media Equation: How People Treat Computers, Television, and New Media Like Real People and Places. Cambridge University Press, New York, 1996.
15.Rodden, T. and Benford, S. The evolution of buildings and implications for the design of ubiquitous domestic environments. Proceedings of the International Conference on Human Factors in Computing Systems (CHI’03), ACM Press, 9-16, 2003.
16.Saha, D. and Mukherjee, A. Pervasive computing: a paradigm for the 21st century. Computer, vol. 36 (3), IEEE, 25-31, 2003.
17.Streitz, N., Prante, T., Röcker, C., Van Alphen, D., Magerkurth, C., Stenzel, R., and Plewe, D. Ambient Displays and Mobile Devices For the Creation of Social Architectural Spaces. Public and Situated Displays,O’Hara, K. et al. (eds.), chapter 16, Kluwer Academic Publisher, 2003.
18.Tomitsch, M., Grechenig, T., and Mayrhofer, S. Mobility and Emotional Distance: Exploring the Ceiling as an Ambient Display to Provide Remote Awareness. Proceedings of the International Conference on Interactive Environments (IE’07), 164-167, 2007.
19.Vande Moere, A. Towards Designing Persuasive Ambient Visualization. Proceedings of the Pervasive’07 Workshop on Ambient Information Systems, 2007.
20.Wisneski, C., Ishii, H., Dahley, A., Gorbet, M., Brave, S., Ullmer, B., and Yarin, P. Ambient Displays: Turning Architectural Space into an Interface between People and Digital Information. Proceedings of the International Workshop on Cooperative Buildings (CoBuild'98), 22-32, 1998.

Extruding the Body with Light to Make Visible the Spatial Relationships inherent in Gesture and Posture
Danielle Wilde Monash University Faculty of Art and Design1
CSIRO Division of Textile and Fibre Technology2 [email protected]
Figure 1: sketches of light-based planar extrusions originating at the hips, spine, arms, legs and shoulder blades.
1 Monash University Faculty of Art and Design, 900 Dandenong Road
Caulfield East, VIC 3145 Australia 2 CSIRO Division of Textile and Fibre Technology, Colac Road Belmont,
VIC 3216 Australia.
ABSTRACT This proposal describes a modular system for creating light-based planar body extrusions that make visible the spatial relationships inherent in gestures and postures. The aim of the system is to afford clearer insight into the dynamics of gesture, and the spatial interplay between body parts, a person and their surroundings. Two different forms of light-extrusions are proposed. The system is envisioned to be of use to designers of tangible and embedded interactive systems, bio-mechanists, theatre and performance artists, costume designers, architects, and any who desire to broaden their understanding of the body’s dynamic structure and function.
Keywords light, spatial relationships, gesture, posture, extrusion
INTRODUCTION The motion of the human body is complex and dynamic. Gaining insight and understanding of the inherent and resulting spatial relationships can prove a rich resource for creating works of art, or with which to inform the design of body-centric interfaces, irrespective of medium or context. Physically extruding the body allows us to magnify and draw focus to the relative position of different body parts. It also allows us to consider how postures and gestures might impact surrounding space. If the extrusions are realized with light they would not constrict the body, hinder movement, or otherwise affect the wearer or their
surroundings, except to inform both wearer and observer of dynamic changes in the resulting spatial relationships. Light, therefore, seems an ideal medium for this purpose. The proposed system consists of strips of LEDs that can be placed directly on the body. Two different iterations are mooted. The first allows wearer and observer to see points of light at the outer limits of the room – on the floor, walls and ceiling. The second incorporates sufficient artificial smoke to make visible the entire beam of light emitted by each LED, from its origin at the body to the extremities of the room. By making visible body position and inter-relationships, through magnification and extrusion, the hope is to gain insight into the mechanics as well as the spatial and experiential impact of gesture and posture.
BACKGROUND AND RELATED WORK Work by the Author I am currently engaged in an investigation into how technology can be paired with the body to poeticise experience. The research is motivated by the idea that we can access deeper, unfiltered experiences than we normally allow ourselves or access in everyday life, if we engage in full- or core-body actuation and control of sonic and other interfaces. A guiding premise is that through thoughtful, playful, poetic applications of technology to the body we can shift our relationship to our bodies and to technology. Related projects share the aim, with the proposed wearable light arrays, of drawing focus to body position and stimulating movement.
Red

Figure 2: Danielle Wilde and Romy Achituv’s faceClamps worn
here by Yasmeen Godder (left) and Danielle Wilde (right)
faceClamps [1] (fig. 2) precedes the current research project by ten years, but provides a clear example of an interface that affords insight into movement by extruding the body into space. The faceClamps physically extrude the face in order to measure the opening and closing of the mouth to control sound. The interface mechanically magnifies the subtle movements of the mouth, so affords both increased visual and higher resolution mechanical reading of the movement than would be available without this extrusion. Additionally, the reading of the movement is augmented through the application of the resulting data to real-time manipulation of sound.
hipDisk [8] (fig. 3) is a self-contained wearable system for performance and play that augments the body with instrumental capabilities. The interface extrudes the body on two horizontal planes, one at the hip and one above the waist. The wearer of hipDisk can trigger simple musical tones within a one-octave chromatic scale by tilting their hip and torso towards each other until the two disks touch. Through repetition of this action on different angles, tunes and melodies incorporating any of the twelve notes of the chromatic scale may be performed. By physically extruding the body above and below the waist, the hipDisk draws the attention of both wearer and viewer to the relative position of hip and torso. The addition of sound serves to both accent and motivate the wearer’s movement. The gesture�sound project, [2] (fig. 4) in contrast, has no visible physical interface. Yet, by tightly coupling movement with sound, the eye of the observer is focused
Figure 3: Danielle Wilde demonstrating the hipDisk
Figure 4: Ross Bencina, Danielle Wilde and Somaya Langley
performing different gesture � sound experiments
on body movement and posture, and extends them invisibly into the surrounding environment. gesture�sound explores how one might successfully mesh gestural/physical and sonic composition. The aim is to develop systems that support kinæsthetic-auditory synchresis, where human body motion is mapped into sound in such a way that sound production becomes an inherent and unavoidable consequence of moving the body. The intention is to engage both performer and audience in a fluid experience of the relation between performed sound and gesture. The resulting symbiosis between gesture and sound affords different ways of looking at the body in space.. hipThings, a proposed series of hip-controlled interfaces, is also relevant to this proposal. hipThings directly question and explore the impact of the choice of soft, hard, embedded or extended interface, and how this choice might inform our understanding of body mechanics and impact on experience.
Related Work by Other Artists and Researchers
An obvious connection can be made between the proposed project and the dresses from Hussein Chalayan’s Spring/Summer 2008 Collection Readings [3] that incorporate servo-driven lasers and crystals (fig. 5). In Chalayan’s work the lights are driven by servo motors, to refract out from the body of the model into the space in
Figure 5: Hussein Chalayan, Spring/Summer 2008

Figure 6: Eadweard Muybridge Headspring, a Flying Pidgeon
Interfering. 1885
dynamically changing directions. While highly engaging, this does not extrude the body in relation to its underlying mechanics. My proposal uses the movement of the body alone to affect changes in direction of beams of light, so offers insight directly into the mechanics of the underlying movement. The explorations into animal and human locomotion undertaken in the late 1800s by Etienne-Jules Marey, [5] in France and Eadweard Muybridge, [6] in the United States provided groundbreaking insight into body mechanics. Through photography their work gives us insight into movement as it occurs over time and through space – presenting the body as an integrated whole comprised of linked parts and dynamically shifting relationships. Muybridge used multiple cameras for his motion studies (fig. 6). Marey, on the other hand, invented chronophotography to capture cycles of movement through time in a single camera frame (fig. 7).
Figure 7 (a-c) : Etienne-Jules Marey. Man Running 1882
As shown in figure 7(a-b), for some of his experiments, Marey dressed his subjects in black and attached white ping pong balls and stripes to their clothing to expose the sine waves formed by their limb movements in space. The resulting abstraction relates clearly to this proposal, as well as to optical and magnetic motion capture systems, which use markers on the body to track movement; and mechanical motion capture systems that attach a kind of exoskeleton of straight metal pieces to the back of the performer. [4] The lines and dots resulting from the proposed LED arrays, though, will project out perpendicular to the body, or sit at the outer limits of the room, rather than sit against the body or reflect its form in parallel. This will afford a very different perspective to that offered by Muybridge, Marey and different motion capture systems. Since as early as 1990, Merce Cunningham has worked with motion capture and movement synthesizing in his choreography. He has made extensive use of the Life Forms software program and was involved in the subsequent development of the Dance Forms choreographic software. Cunningham has been quoted as saying that Life Forms lets you “see movement in a way that was always there – but wasn’t visible to the naked eye.” [7] The proposed system clearly shares this aim, but is focused quite specifically on relationships – between the different parts of the body and its surroundings. It is not clear the role a consideration of these relationships might play in Dance Forms, but in most motion capture the interest in this is limited, if for no other reason than technical limitations. Also, in stark contrast to motion capture, the proposed system is a relatively low-tech, low-cost, light-based alternative aimed at providing inspiration and insight through real-time feedback, rather than quantifiable data. It is not, in any traditional sense, a technical tool. It can provide information, and hopefully inspiration, for an audience as well as a practitioner, but not hard data. Its use can also be a means and an end in and of itself, unlike motion capture, which is clearly a tool, no matter how artistic the application. Finally, by extruding the body with light, the underlying movement and relationships can unfold dynamically before the eyes of both wearer and observer. The information is not broken down over time, or preserve for later referral, such as in the aforementioned systems and approaches. This difference is important.
PROPOSED IMPLEMENTATION The proposal is to create strips of highly focused LEDs that can be attached to the body in a modular fashion. These LED arrays will be embedded in fabric so as to sit comfortably on the body. The method of attachment is still to be ascertained, but will most likely incorporate Velcro, press-studs or snaps, and some form of adjustable strap. The system will be passive. It will not change over time or in response to any particular event, so will not require the inclusion of a microcontroller and will not need to be programmed to respond or behave in any way. The

electronic circuit will thus be simple, consisting of LEDs, resistors and a power supply. Points and Beams of Light The light output from the LED arrays will be visible as dots on a wall, or as beams of light when the air is fogged with artificial smoke, as outlined below. It is envisioned that both of these modes of viewing will be of interest – by offering different perspectives they will afford different insights.
Dots on the Wall Single points of light corresponding to each LED will be visible on the walls at the edge of the space. This will allow shapes to be drawn, or rather suggested, as the eye of the observer “connects the dots” and connects the dots with the body part that is supporting the source of each point of light.
Extruding Light Beams When smoke is added to the room, the entire beam of light from each LED will be visible, extending, literally, from the body to the outer limits of the space. This will magnify and extrude, so highlight, the position and tilt of each body part that supports an array. Extruding the body with light in these ways will allow us to see and envision the different planar extensions that may not otherwise be apparent. It will thus allow us to examine the interactions and relationships between different body parts, as well as how our physical presence might impact on and interact with our environment. The proposed system affords insight into the body by allowing wearer and observer:
(i) to examine the interplay between individual beams and points of light, as in the case of the spine or other parts of the body which can be curved or twisted – for example the hip, upper torso and waist area; and
(ii) to examine the interplay between different collections of beams or dots in the space, so the interrelation and spatial orientation of different parts of the body and how these might impact on the surrounding space.
CONCLUSION
The aim of the proposed system is to provide qualitative, rather than quantitative information about the body’s underlying mechanics, and how our physical presence might impact on the surrounding space – to inspire as it informs. The proposal is still in its conceptual stages and has not been extensively developed or tested. The desire is to open up the ideas for discussion with an interested audience, so provoke development in new and unexpected directions.
Figure 8: an excerpt from a Merce Cunningham dance work
ACKNOWLEDGMENTS Thanks to Dr Richard Helmer and Dr Melissa Miles for supervision of my doctoral research, thanks to Ross Bencina for reflection and support.
REFERENCES 1. Achituv, R., Wilde D. faceClamps (1998). Website:
http://www.daniellewilde.com/docs/faceclamps/faceClamps.htm. Accessed 31 January 2008
2. Bencina, R., Wilde, D., Langley, S. gesture�sound Experiments (2007). Website: http://www.daniellewilde.com/docs/gesture-sound.html Accessed 20 February 2008
3. Evans, C., Menkes, S., Polhemus, T., Quinn, B., Chalayan, H. Hussein Chalayan. NAi Publishers, Rotterdam, 2005. See also http://www.husseinchalayan.com/ Accessed 20 February 2008
4. Furniss, M. Motion Capture: An Overview Animation Journal 8:2 Spring, 2000.
5. Marey, E. Etienne-Jules Marey (Photo Poche) Centre de la Photographie, Paris, 1994
6. Muybridge, E. Muybridge’s Complete Human and Animal Locomotion : All 781 Plates from the 1887 Animal Locomotion : New Volumes 1-3 (Reprints of original Volumes 1-4 ; 5-8 and 9-11). Dover Publications, Mineola NY, 1979
7. Schibsted, E. LifeForm Wired 4:10 172-173 (October 1996)
8. Wilde, D. hipDisk: using sound to encourage physical extension, exploring humour in interface design. Special Edition International Journal of Performing Arts and Digital Media (IJPADM). Intellect. 2008. Forthcoming
View publication statsView publication stats