a systematic comparison of the … systematic comparison of the westerbork and euroloop...
TRANSCRIPT

A SYSTEMATIC COMPARISON OF THE WESTERBORK AND EUROLOOP
HIGH-PRESSURE GAS FLOW FACILITIES
Jos G.M. van der Grinten1 and Frans Doorman2 1 NMi EuroLoop, Petroleumweg 36, 3196 KD Rotterdam, The Netherlands, [email protected]
2 Private consultant, Elandhof 145, 9675 JG Winschoten, The Netherlands, [email protected]
ABSTRACT This paper describes a unique systematic comparison of the Westerbork and EuroLoop calibration facilities. In a period of two and a half years more than 100 meter calibrations were performed with 7 meters divided over 4 packages. The target of the intercomparison was a normalized deviation of �� ≤ 0.5 applied to the WME (weighted mean error). Due to the drift of the meters in the packages this criterion was applied to the trend of the calibration results. Out of 104 calibrations 90 results (86.5%) met this criterion, 13 results (12.5%) met 0.5 < �� ≤ 1.0, and 1 result (1%) exceeded �� = 1. The bandwidth of the difference between the first and the second meter of a package is for both Westerbork and EuroLoop of the same magnitude as the bandwidth of the meter curves. This indicates there is a limit to the resolution that can be achieved with intercomparisons.
INTRODUCTION In the Rotterdam Vondelingenplaat area NMi has built the new EuroLoop calibration facility for the calibration of industrial gas meters. The new facility combines the capabilities of the Westerbork and Bergum high-pressure calibration facilities. After more than 30 years of stable and reliable operation both facilities will be closed for calibrations. EuroLoop also has a new traceability chain based on the GOPP (Gas Oil Piston Prover) and TraSys. Bergum and Westerbork are traceable to the existing traceability chain. In the past years many successful cross checks between the existing and new traceability chains were performed. Part of the replacement is an extensive comparison between Westerbork and EuroLoop. In a period of two and a half years more than 100 meter calibrations were performed with 7 meters divided over 4 packages. This comparison is unique: never in the history of high-pressure gas flow calibrations has such a systematic long-term intercomparison between two facilities been undertaken.
Meter packages and calibration protocols
Meter package 1 consists of two identical 20” ultrasonic flow meters of which the second is mounted such that the flow is measured in reverse direction. Package 2 consists of an upstream 20” ultrasonic meter and a downstream 20” turbine meter. Package 3 consists of two identical 20” turbine meters. Package 4 consists of a single 24” ultrasonic gas meter. All 20” meters were reconditioned in 2009. The turbine meters and the us2064 were not used in the field after they were reconditioned, so these are - in a metrological sense - new meters. The other meters were not used intensively
before the initial calibration in July 2010. All 20” ultrasonic flow meters require upstream pipes coated with Flowcoat, which are provided by Gasunie. Upstream of the 24” ultrasonic flow meter a 10d, schedule 40, uncoated pipe is used. This configuration is compliant with NAM specifications. Table I: Piping configuration for all meter packages. The blue text is the part identical for both Westerbork and EuroLoop. Spool pieces specified with a number are used in all facilities. The other lengths are minimum specifications. The black text refers to installation specific configuration.
1 24”>20” – ...d – SCPA50E – 20d98-046 – us2044 – 5d02-001 – 2Pt20-001 – 5d02-002 – us2045-R – 3d – ...d – 20”<24”
2 24”>20” – ...d – SLaws – 20d98-046 – us2064 – 17d – tm50062 – 3d(Pt1d) – ...d – 20”<24”
3 24”>20” – ...d – 18d – tm54287 – 12d(Pt1d) – SLaws – 20d – tm74187 – 3d(Pt1d) – ...d – 20”<24”
4 24“ – ...d – 30d – 10dSchedule40 – us3015 – 3d(Pt1d) – ...d – 24”
Calibration protocols
At both facilities the calibrations have been performed in conformity with the standard calibration procedures, i.e. master meter method with double timing method. In Westerbork the S-GERG [3] equation of state is used, in EuroLoop GERG 2004 [4] has been utilized. In Westerbork the MUT section is located in the open field under a shelter that protects the section from rain and direct solar radiation. The piping has been thermally insulated to minimize radial temperature gradients in the pipe sections. The big volume between references and MuT requires line pack correction. In EuroLoop the calibrations are performed indoor. The pipe sections upstream of the meters have been thermally insulated. The gas temperature is controlled such that the difference between the gas temperature and ambient temperature is less than 2°C. Doors of the hall are kept closed during calibrations; especially at flow rates below 1500 m3/h. Initially, linepack corrections were calculated. However, due to the very good pressure and temperature stability linepack influences are far less than 0.01%. A periodic evaluation of possible linepack effects is made at EuroLoop. EuroLoop and Westerbork share an ISO 17025 accreditation issued under number K161 [5] by RvA, the Dutch Council for Accreditation. Both facilities have entries in the BIPM Key Comparison Database: NE06 for EuroLoop and NE09 for Westerbork. The meters are calibrated at the following flow rates based on section 7.2 of OIML R32 [1]: 100%, 70%, 40%, 25%, 10%, 5% and 2% of �� .

COMPARISON RESULTS The comparison between Westerbork and EuroLoop is based on the weighted mean errors (WME) of the flow meters. The WME is the flow weighted mean error of the flow meter determined according to OIML R137-1:2006 [2]. In Figure 1 – 4 the WME of the meter is displayed versus the date of calibration. Each meter is marked with a different colour. Calibrations performed in Westerbork are indicated with solid markers, EuroLoop calibrations are indicated with open markers. The data points for Westerbork and EuroLoop are connected with dotted and dashed lines respectively. For each meter a trend line is shown based on a least squares approximation of all calibration results, including calibration results obtained in Westerbork before July 2010. Each trend line is accompanied with two parallel lines marking the acceptance interval of ±0.17%, corresponding to �� = 0.5. The population average is plotted in Figure 4 together with package 4. The plotted WME is the average of the WME of all 7 individual meters. For the population trend the acceptance interval is ±0.10%, corresponding to �� = 0.5. The majority of the results lie within the acceptance interval. In the period of December 2011 till February 2012 results of the us2044, us2045-R, tm50062, tm54287, tm74187 and the population average are outside the acceptance interval. The December results were confirmed when they were repeated a few days later.
The exception to this trend is made by the us2064, which remains within the criteria during all calibrations, and the us3015, which is only outside the criteria in September 2012. In the discussion section possible explanations are discussed. Between July 2010 and January 2011 three out of four ultrasonic meters showed in Westerbork a decrease of the WME. The results of the us2045 are outside the acceptance interval. When all meters under test show a sudden change in plus or minus, the first thing to look at is the references. The quality assurance system both for EuroLoop and Westerbork prescribes two weekly tests in which all master meters are compared with an arbitrary meter under test. In EuroLoop frequent comparisons with travelling references showed changes in the order of 0.2%, which may be expected. Another tool is the permanent comparison between the turbine masters and ultrasonic masters, which showed a constant difference before, during and after the period of December 2011 - February 2012. However, there is an operational change: since November 2011 a 10 µm filter has been inserted at the end of the test section. After February 2012 the meter curves have stabilized around the trend line. The meters under test that were outside the acceptance criteria during December 2011 till February 2012, were coated with Flowcoat. The two other meters have a nickel coating and no coating at all. Also in Westerbork observed master meter changes were within requirements, see [8].
Figure 1: Flow weighted mean error [%] versus the calibration date for meter package 1.
Figure 3: Flow weighted mean error [%] versus the calibration date for meter package 3.
Figure 2: Flow weighted mean error [%] versus the calibration date for meter package 2.
Figure 4: Flow weighted mean error [%] versus the calibration date for meter package 4 (orange) and for the population of all meters (black).
0.102 %/year
0.085 %/year
-0.30
-0.20
-0.10
0.00
0.10
0.20
0.30
0.40
0.50
0.60
0.70
Mar-10 Sep-10 Mar-11 Sep-11 Mar-12 Sep-12 Mar-13
Flo
w W
eig
hte
d M
ea
n E
rro
r [%
]
Date of calibration
USM 2044 Westerbork
USM 2044 Trend
USM 2044 EuroLoop
USM 2045 Westerbork
USM 2045 Trend
USM 2045 EuroLoop
0.013 %/year
0.048 %/year
-0.30
-0.20
-0.10
0.00
0.10
0.20
0.30
0.40
0.50
0.60
0.70
Mar-10 Sep-10 Mar-11 Sep-11 Mar-12 Sep-12 Mar-13
Flo
w W
eig
hte
d M
ea
n E
rro
r [%
]
Date of calibration
TM 54287 Westerbork
TM 54287 Trend
TM 54287 EuroLoop
TM 74187 Westerbork
TM 74187 Trend
TM 74187 EuroLoop
-0.001 %/year
0.065 %/year
-0.30
-0.20
-0.10
0.00
0.10
0.20
0.30
0.40
0.50
0.60
0.70
Mar-10 Sep-10 Mar-11 Sep-11 Mar-12 Sep-12 Mar-13
Flo
w W
eig
hte
d M
ea
n E
rro
r [%
]
Date of calibration
USM 2064 Westerbork
USM 2064 Trend
USM 2064 EuroLoop
TM 50062 Westerbork
TM 50062 EuroLoop
TM 50062 Trend
-0.064 %/year
0.035 %/year
-0.30
-0.20
-0.10
0.00
0.10
0.20
0.30
0.40
0.50
0.60
0.70
Mar-10 Sep-10 Mar-11 Sep-11 Mar-12 Sep-12 Mar-13
Flo
w W
eig
hte
d M
ea
n E
rro
r [%
]
Date of calibration
USM 3015 Westerbork
USM 3015 Trend
USM 3015 EuroLoop
Population Westerbork
Population Trend
Population EuroLoop
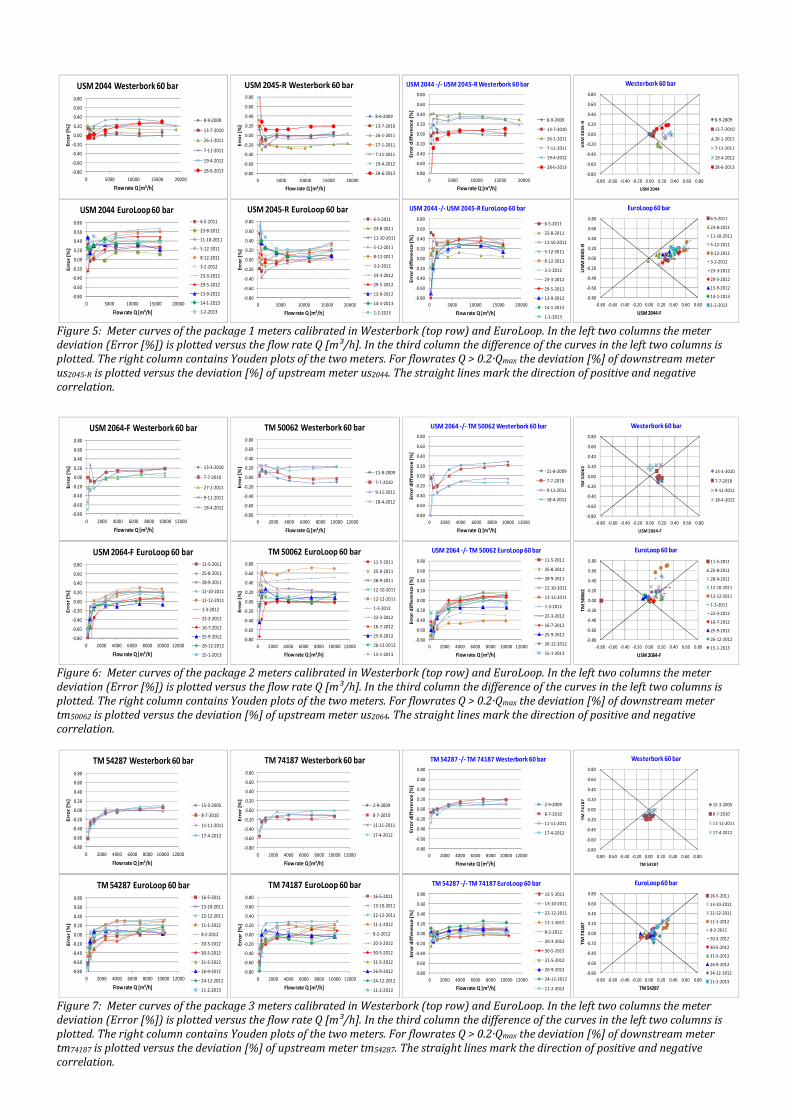
Figure 5: Meter curves of the package 1 meters calibrated in Westerbork (top row) and EuroLoop. In the left two columns the meter deviation (Error [%]) is plotted versus the flow rate Q [m³/h]. In the third column the difference of the curves in the left two columns is plotted. The right column contains Youden plots of the two meters. For flowrates Q > 0.2·Qmax the deviation [%] of downstream meter us2045-R is plotted versus the deviation [%] of upstream meter us2044. The straight lines mark the direction of positive and negative correlation.
Figure 6: Meter curves of the package 2 meters calibrated in Westerbork (top row) and EuroLoop. In the left two columns the meter deviation (Error [%]) is plotted versus the flow rate Q [m³/h]. In the third column the difference of the curves in the left two columns is plotted. The right column contains Youden plots of the two meters. For flowrates Q > 0.2·Qmax the deviation [%] of downstream meter tm50062 is plotted versus the deviation [%] of upstream meter us2064. The straight lines mark the direction of positive and negative correlation.
Figure 7: Meter curves of the package 3 meters calibrated in Westerbork (top row) and EuroLoop. In the left two columns the meter deviation (Error [%]) is plotted versus the flow rate Q [m³/h]. In the third column the difference of the curves in the left two columns is plotted. The right column contains Youden plots of the two meters. For flowrates Q > 0.2·Qmax the deviation [%] of downstream meter tm74187 is plotted versus the deviation [%] of upstream meter tm54287. The straight lines mark the direction of positive and negative correlation.
-0.80
-0.60
-0.40
-0.20
0.00
0.20
0.40
0.60
0.80
0 5000 10000 15000 20000
Err
or
[%]
Flow rate Q [m³/h]
USM 2044 Westerbork 60 bar
8-9-2009
13-7-2010
26-1-2011
7-11-2011
19-4-2012
28-6-2013-0.80
-0.60
-0.40
-0.20
0.00
0.20
0.40
0.60
0.80
0 5000 10000 15000 20000
Err
or
[%]
Flow rate Q [m³/h]
USM 2045-R Westerbork 60 bar
8-9-2009
13-7-2010
26-1-2011
27-1-2011
7-11-2011
19-4-2012
28-6-2013 -0.80
-0.60
-0.40
-0.20
0.00
0.20
0.40
0.60
0.80
0 5000 10000 15000 20000
Err
or
dif
fere
nce
[%
]
Flow rate Q [m³/h]
USM 2044 -/- USM 2045-R Westerbork 60 bar
8-9-2009
13-7-2010
26-1-2011
7-11-2011
19-4-2012
28-6-2013
-0.80
-0.60
-0.40
-0.20
0.00
0.20
0.40
0.60
0.80
-0.80 -0.60 -0.40 -0.20 0.00 0.20 0.40 0.60 0.80
US
M 2
04
5-R
USM 2044
Westerbork 60 bar
8-9-2009
13-7-2010
26-1-2011
7-11-2011
19-4-2012
28-6-2013
-0.80
-0.60
-0.40
-0.20
0.00
0.20
0.40
0.60
0.80
0 5000 10000 15000 20000
Err
or
[%]
Flow rate Q [m³/h]
USM 2044 EuroLoop 60 bar6-5-2011
23-8-2011
11-10-2011
5-12-2011
8-12-2011
3-2-2012
23-3-2012
29-5-2012
13-9-2012
14-1-2013
1-2-2013
-0.80
-0.60
-0.40
-0.20
0.00
0.20
0.40
0.60
0.80
0 5000 10000 15000 20000
Err
or
[%]
Flow rate Q [m³/h]
USM 2045-R EuroLoop 60 bar6-5-2011
23-8-2011
11-10-2011
5-12-2011
8-12-2011
3-2-2012
23-3-2012
29-5-2012
13-9-2012
14-1-2013
1-2-2013
-0.80
-0.60
-0.40
-0.20
0.00
0.20
0.40
0.60
0.80
0 5000 10000 15000 20000
Err
or
dif
fere
nce
[%
]
Flow rate Q [m³/h]
USM 2044 -/- USM 2045-R EuroLoop 60 bar
6-5-2011
23-8-2011
11-10-2011
5-12-2011
8-12-2011
3-2-2012
23-3-2012
29-5-2012
13-9-2012
14-1-2013
1-2-2013
-0.80
-0.60
-0.40
-0.20
0.00
0.20
0.40
0.60
0.80
-0.80 -0.60 -0.40 -0.20 0.00 0.20 0.40 0.60 0.80
US
M 2
04
5-R
USM 2044-F
EuroLoop 60 bar
6-5-2011
23-8-2011
11-10-2011
5-12-2011
8-12-2011
3-2-2012
23-3-2012
29-5-2012
13-9-2012
14-1-2013
1-2-2013
-0.80
-0.60
-0.40
-0.20
0.00
0.20
0.40
0.60
0.80
0 2000 4000 6000 8000 10000 12000
Err
or
[%]
Flow rate Q [m³/h]
USM 2064-F Westerbork 60 bar
13-3-2010
7-7-2010
27-1-2011
9-11-2011
18-4-2012
-0.80
-0.60
-0.40
-0.20
0.00
0.20
0.40
0.60
0.80
0 2000 4000 6000 8000 10000 12000
Err
or
[%]
Flow rate Q [m³/h]
TM 50062 Westerbork 60 bar
21-8-2009
7-7-2010
9-11-2011
18-4-2012
-0.80
-0.60
-0.40
-0.20
0.00
0.20
0.40
0.60
0.80
0 2000 4000 6000 8000 10000 12000
Err
or
dif
fere
nce
[%
]
Flow rate Q [m³/h]
USM 2064 -/- TM 50062 Westerbork 60 bar
21-8-2009
7-7-2010
9-11-2011
18-4-2012
-0.80
-0.60
-0.40
-0.20
0.00
0.20
0.40
0.60
0.80
-0.80 -0.60 -0.40 -0.20 0.00 0.20 0.40 0.60 0.80
TM
50
06
2
USM 2064-F
Westerbork 60 bar
13-3-2010
7-7-2010
9-11-2011
18-4-2012
-0.80
-0.60
-0.40
-0.20
0.00
0.20
0.40
0.60
0.80
0 2000 4000 6000 8000 10000 12000
Err
or
[%]
Flow rate Q [m³/h]
USM 2064-F EuroLoop 60 bar11-5-2011
25-8-2011
28-9-2011
12-10-2011
12-12-2011
1-3-2012
22-3-2012
16-7-2012
25-9-2012
26-12-2012
15-1-2013
-0.80
-0.60
-0.40
-0.20
0.00
0.20
0.40
0.60
0.80
0 2000 4000 6000 8000 10000 12000
Err
or
[%]
Flow rate Q [m³/h]
TM 50062 EuroLoop 60 bar11-5-2011
25-8-2011
28-9-2011
12-10-2011
12-12-2011
1-3-2012
22-3-2012
16-7-2012
25-9-2012
26-12-2012
15-1-2013
-0.80
-0.60
-0.40
-0.20
0.00
0.20
0.40
0.60
0.80
0 2000 4000 6000 8000 10000 12000
Err
or
dif
fere
nce
[%
]
Flow rate Q [m³/h]
USM 2064 -/- TM 50062 EuroLoop 60 bar
11-5-2011
25-8-2011
28-9-2011
12-10-2011
12-12-2011
1-3-2012
22-3-2012
16-7-2012
25-9-2012
26-12-2012
15-1-2013
-0.80
-0.60
-0.40
-0.20
0.00
0.20
0.40
0.60
0.80
-0.80 -0.60 -0.40 -0.20 0.00 0.20 0.40 0.60 0.80
TM
50
06
2
USM 2064-F
EuroLoop 60 bar
11-5-2011
25-8-2011
28-9-2011
12-10-2011
12-12-2011
1-3-2012
22-3-2012
16-7-2012
25-9-2012
26-12-2012
15-1-2013
-0.80
-0.60
-0.40
-0.20
0.00
0.20
0.40
0.60
0.80
0 2000 4000 6000 8000 10000 12000
Err
or
[%]
Flow rate Q [m³/h]
TM 54287 Westerbork 60 bar
15-3-2005
8-7-2010
11-11-2011
17-4-2012
-0.80
-0.60
-0.40
-0.20
0.00
0.20
0.40
0.60
0.80
0 2000 4000 6000 8000 10000 12000
Err
or
[%]
Flow rate Q [m³/h]
TM 74187 Westerbork 60 bar
2-9-2009
8-7-2010
11-11-2011
17-4-2012
-0.80
-0.60
-0.40
-0.20
0.00
0.20
0.40
0.60
0.80
0 2000 4000 6000 8000 10000 12000
Err
or
dif
fere
nce
[%
]
Flow rate Q [m³/h]
TM 54287 -/- TM 74187 Westerbork 60 bar
2-9-2009
8-7-2010
11-11-2011
17-4-2012
-0.80
-0.60
-0.40
-0.20
0.00
0.20
0.40
0.60
0.80
-0.80 -0.60 -0.40 -0.20 0.00 0.20 0.40 0.60 0.80
TM
74
18
7
TM 54287
Westerbork 60 bar
15-3-2005
8-7-2010
11-11-2011
17-4-2012
-0.80
-0.60
-0.40
-0.20
0.00
0.20
0.40
0.60
0.80
0 2000 4000 6000 8000 10000 12000
Err
or
[%]
Flow rate Q [m³/h]
TM 54287 EuroLoop 60 bar16-5-2011
13-10-2011
22-12-2011
11-1-2012
8-2-2012
20-3-2012
30-5-2012
31-5-2012
26-9-2012
24-12-2012
11-2-2013
-0.80
-0.60
-0.40
-0.20
0.00
0.20
0.40
0.60
0.80
0 2000 4000 6000 8000 10000 12000
Err
or
[%]
Flow rate Q [m³/h]
TM 74187 EuroLoop 60 bar16-5-2011
13-10-2011
22-12-2011
11-1-2012
8-2-2012
20-3-2012
30-5-2012
31-5-2012
26-9-2012
24-12-2012
11-2-2013
-0.80
-0.60
-0.40
-0.20
0.00
0.20
0.40
0.60
0.80
0 2000 4000 6000 8000 10000 12000
Err
or
dif
fere
nce
[%
]
Flow rate Q [m³/h]
TM 54287 -/- TM 74187 EuroLoop 60 bar
16-5-2011
13-10-2011
22-12-2011
11-1-2012
8-2-2012
20-3-2012
30-5-2012
31-5-2012
26-9-2012
24-12-2012
11-2-2013
-0.80
-0.60
-0.40
-0.20
0.00
0.20
0.40
0.60
0.80
-0.80 -0.60 -0.40 -0.20 0.00 0.20 0.40 0.60 0.80
TM
74
18
7
TM 54287
EuroLoop 60 bar
16-5-2011
13-10-2011
22-12-2011
11-1-2012
8-2-2012
20-3-2012
30-5-2012
31-5-2012
26-9-2012
24-12-2012
11-2-2013

Calibration curves
For each package all recorded calibration curves are shown in the figures 5, 6, 7 and 8. Each figure displays the calibration curves for each meter in the package. In order to limit the number of curves per graph the results obtained in Westerbork and EuroLoop are displayed in separate graphs. The division of 0.20% per gridline on the vertical scale is identical for all meters. In order to exclude the influence of the master meters (references) the difference of the curves in a meter package is also plotted in figures 5, 6 and 7. Also in these figures the Westerbork results and EuroLoop results are plotted in separate graphs. The vertical division (0.20% per gridline) is identical to the plots with the meter curves. The correlation of the results of the upstream and downstream meters in each meter is visualized in so-called Youden plots, in which for > 0.2�� the deviation [%] of the downstream meter is plotted versus the deviation [%] of the upstream meter. If the data are on a straight line with regression coefficient 1 the results are positively correlated, if the regression coefficient is -1 the results are negatively correlated. Purely horizontally or vertically aligned data sets are not correlated at all. The right-hand columns of Figures 5, 6 and 7 show weak correlations between the ultrasonic meters of package 1, no correlation between the ultrasonic meter and turbine meter of package 2, and a strong correlation between the turbine meters of package 3.
Figure 8: Meter curves of the package 4 meter calibrated in Westerbork and EuroLoop. The meter deviation (Error [%]) is plotted versus the flow rate Q [m³/h]. Looking at the meter curves in the Figures 5 – 8 a band of curves is observed. The bandwidth of these curves can be defined as the maximum difference of the results at a specific flow rate. In order to achieve comparable results it is best to perform this procedure in the horizontal part of the meter curves, i.e. for flow rates above 0.20·Qmax. Table II summarizes the results. From Table II it appears that the bandwidth in EuroLoop is generally higher than observed in Westerbork, the exception being the us2045-R. Considering that the uncertainty of the calibration results in Westerbork is 0.20% and in EuroLoop 0.28%, the bandwidths are not bigger than twice the expanded uncertainty (±U). The only exception is meter tm50062. However, if the December results are considered to be an outlier, results are comparable. The bandwidth of the difference between the first and the second meter is for both Westerbork and EuroLoop of the same magnitude as the bandwidth of the meter curves. Only for package 3 the difference between the
two turbine meters is smaller than the bandwidth of each of the individual turbine meters. This observation is supported by the correlation shown in Youden plots of Figure 7. Conclusion is that turbine meters packages are more reproducible than ultrasonic meter packages. Also the correlation between the turbine meters is much better than between the ultrasonic meters. Table II: Observed bandwidth [%] of meter curves for flow rates above 0.20·�� . Superscripts 1 and 3 refer to the complete data sets. Reduced datasets are marked by 2 omitting calibrations before the start of the comparison and by 4 excluding the December 2011 data and September 2012 (us3015).
P Meter number Wb1 Wb2 EL3 EL4
1 2044 0.36 0.22 0.55
1 2045-R 0.46 0.46 0.38
1 2044 -/- 2045-R 0.39 0.37 0.39
2 2064 0.17 0.17 0.37 0.37
2 50062 0.35 0.27 0.75 0.54
2 2064 -/- 50062 0.42 0.36 0.58 0.47
3 54287 0.13 0.13 0.44
3 74187 0.17 0.17 0.47
3 54287 -/- 74187 0.11 0.11 0.28
4 3015 0.33 0.18 0.47 0.35
The good repeatability for turbine meters is not a predictor for a good reproducibility. The tm54287 shows the best reproducibility. Despite excellent repeatability the tm50062 shows the worst reproducibility of all turbine meters both in Westerbork and in EuroLoop. Apart from the calibration result in September 2012 the us3015 shows identical bandwidth in Westerbork and EuroLoop. The maximum flow rate of the us3015 could not be achieved in Westerbork, but was available in EuroLoop showing even a lower bandwidth at higher flow rates. DISCUSSION In this chapter a number of effects are discussed that may or will influence the results of the intercomparison. a. Stability of master meters
As discussed before the stability of the master meters in all test facilities is the subject of an extensive quality control program consisting of two weekly checks and quarterly checks. In Westerbork all calibrations are monitored by a 20” ultrasonic meter that is permanently installed upstream of the meters under test. The results obtained in Westerbork were consistent with the results of the 20” monitor. In addition periodic checks are performed on the Westerbork master meters. An overview was given by Mijndert van der Beek [8]. Despite the changes of the individual masters in the order of 0.2%, the average of the masters is very stable: 0.005%. In EuroLoop the turbine master meters are monitored by ultrasonic meters. In order to make a meaningful comparison flowrates are rounded to the G-series
-0.80
-0.60
-0.40
-0.20
0.00
0.20
0.40
0.60
0.80
0 5000 10000 15000 20000 25000 30000
Err
or
[%]
Flow rate Q [m³/h]
USM 3015 Westerbork 60 bar
7-4-2008
13-7-2010
26-1-2011
7-11-2011
19-4-2012
10-1-2013-0.80
-0.60
-0.40
-0.20
0.00
0.20
0.40
0.60
0.80
0 5000 10000 15000 20000 25000 30000
Err
or
[%]
Flow rate Q [m³/h]
USM 3015 EuroLoop 60 bar
19-5-2011
17-10-2011
28-12-2011
7-2-2012
3-4-2012
20-6-2012
17-7-2012
18-9-2012
17-12-2012

applicable for turbine meters and pressures are rounded to a multiple of 10 bar. In Figure 9 the relative mass flow difference ��� ��� − 1[%]⁄ between the ultrasonic master meters and the turbine meters M1..M5 is shown as a function of the date. Since we are interested in the stability of the meters, the difference is not corrected for the known deviations of the master meters. The example refers to flowrates of 4000 m³/h ± 25.9% at an absolute pressure of (60 ± 5) bar in the period between July 2012 and June 2013. On a short time scale the maximum difference between high values and low values is 0.3%, on a longer time scale the maximum difference is 0.4%. These results are consistent with observations at other facilities [9].
Figure 9: Comparison of ultrasonic and turbine meters in EuroLoop. The uncorrected difference �� �� − 1[%]⁄ between the ultrasonic master meters and the turbine meters M1..M5 is shown as a function of the date. b. Pulsations and acoustic noise
As pulsations can have a substantial influence on the performance of turbine meters [11] pulsations have been the subject of a study during the design of the facility. During the initial operations of EuroLoop pulsations were observed, especially during the utilization of the small (10”) test lines. This was confirmed in a study conducted later. The mechanism is that in order to achieve flow rates lower than 8000 m³/h part of the flow needs to be diverted through a bypass. The flow returning from the meter under test and the bypass are joined in a T-joint, which leads to unstable flow conditions. Variations in the bypass flow will lead to variations in the main flow. The influence become bigger as the main flowrate is lower. On request of EuroLoop VSL has built a pulsation monitor which became operational in the fall of 2012. The instrument records the pulse inputs of the master meters and the meter under test and shows the frequency spectrum obtained by FFT (Fast Fourier Transformation). The pulsation monitor does not show distinct frequencies, but variable pulsation frequencies. If the monitor shows pulsations, these can be heard in the hall. These pulsations disappear by changing a valve position or blower frequency. In the summer of 2013 the blower’s minimum rpm, which is currently 1000, will be lowered to 200. The objective of this change is to lower the bypass flowrate, which will result in a lower pulsation level and more stable low flows. c. Particle deposits
During the calibrations at EuroLoop one point of
discussion referred to the deposit of rust particles in the meters. During the construction of EuroLoop all parts of the pipe work were hydro-tested. Unfortunately, the pipes were not blown dry with hot air. The combination of water, CO2 and oxygen provoked oxidation of the inner pipe wall. Pressure fluctuations provoke scaling to come loose from the pipe wall. In a conventional test facility like Westerbork all contamination is blown down-stream of the calibration test line. In order to prohibit pollution of the master meters they are positioned upstream of the meter under test. EuroLoop is a closed circuit and all particles that are inside the facility will circulate. The only option for removing particles is the application of filters. Since November 2011 a 10 µm particle filter has been applied. From May 2013 a 5 µm filter is installed. In the turbine meters rust particles are found in the inlet. However due to the higher gas velocity in the meter annulus less particles are deposited in this part of the meter. Deposit of particles on the turbine blades would be consistent with an increase of the meter deviation in the order of several tenths of a percent. The reason is that the increase of the roughness of the turbine blade will create a thicker boundary layer. Such a layer of rust would not be easily blown off. However if dust would have remained on the turbine blades, the Westerbork results of November 2011 and April 2012 would not be the same. Also in the ultrasonic meters dust particles are found to be uniformly distributed in the meter. The particles are dry and the meter coating is visible through the dust layer. Such a layer could lead to a deviation increase by 0.04% maximum. If the surface roughness changes due to the deposit of a layer the flow profile may also be affected. An extensive literature survey on the influence of surface roughness on the flow profile as a function of the Reynolds number can be found in Schlichting [7]. However, a 10 µm structure in a 500 mm pipe is still hydraulically smooth. So no effects are to be expected here. All turbine meters and the ultrasonic meters of package 1 are coated with Flowcoat, an orange layer which is very smooth. Meter us2064 has a nickel coating on the inside pipe wall and the us3015 has no coating inside. The spools provided by Gasunie also have a Flowcoat coating. During all calibrations these spools were mounted upstream of the all 20” ultrasonic flow meters. With a very smooth inside pipe wall it takes a longer distance for the flow profile to develop fully. This might result in more variable flow profiles than when the pipe interior is rougher. d. Log file analysis
During most ultrasonic meter calibration log files were recorded. The meter diagnostics was used to see if there are phenomena that could explain the observed changes of the WME, e.g. flow distortions. For this analysis we concentrated on the velocity profile and the swirl. An extensive study on the interaction between the velocity profile and the acoustic paths was performed by GERG [10]. Here we will limit ourselves to the diagnostics that is provided by the manufacturer. The ratio of the gas velocities as measured by the axial
-1.50%
-1.00%
-0.50%
0.00%
0.50%
jul-12 okt-12 dec-12 apr-13
rela
tiv
e d
iffe
ren
ce
be
twe
en
US
an
d t
urb
ine
ma
ste
r
Date
4000 m³/h ± 25.9% @ (60 ± 5) barA
M1 M2 M3 M4 M5

paths over the gas velocities as measured by the swirl paths of the USMs is called the Profile Factor or PF in short. It describes the flatness of the gas velocity distribution in the USMs. A completely flat velocity profile has PF=1. For the USMs used in this comparison the expected figure (that is in perfectly developed flow conditions) for this PF is around 1.04. For package 1 the data analyses were performed for velocities greater than 1 m/s. The analysis revealed the following: • Initial profile factors were in July 2010 1.04. All
other calibrations showed profile factors of approximately 1.055. Only in the period between December 2011 and February 2012 profile factors were 1.065. Generally, higher PF values are consistent with higher meter deviations. However, no physical cause could be found for the occurrence of more pointy flow profiles: the upstream configuration is behind a flow conditioner and all spools were identical during the calibrations.
• In package 1 the 2045R had an on average 0.66% higher PF than the 2044F. However the double experimental standard deviation of PF is approximately 1.5%.
• The PF of the (downstream) us2045-R had often a non-constant PF during the calibration runs, the intervals in which the flow rate is supposed to be constant. Figure 10 shows both profile factor, its 30 s moving average and gas velocity versus the sample number for the July 2010 calibrations in Westerbork. The profile factor is not entirely constant and increases during low flows, which is consistent with our expectation of a more pointy flow profile at lower Reynolds numbers.
• In all facilities the observed flowrate of the us2045-R appears to fluctuate more than the us2044. The most likely cause for this instability is two thermowells only 5d upstream of the us2045-R. The other disturbance is the ring in which the Pt100’s were mounted. The ring was a few millimetres wider than the adjacent pipe walls.
Figure 10: Profile factor, moving average of profile factor, and gas velocity (blue line) versus the sample number for calibrations of the us2044 (left) and us2045-R (right) in Westerbork. As us2045-R is running reversely the velocity scale is negative. The gap in the PF signal corresponds with a threshold of 1 m/s. Also for package 4 the log files were analyzed. The reason for doing so was the unexpected result in September 2012. In Table III profile factors and swirl angles are shown for subsequent calibrations. Profile factors of the us3015 were always below 1.05. The swirl angle in September was more than 0.23° higher than of the other calibrations. However from Table III it
is not possible to correlate WMEs with observed swirl angles. The swirl angles in degrees are normally represented by integer number. By using the formulas of the manufacturer is was possible to calculate rational values of the swirl angle. Table III: WMEs, profile factors (PF) and swirl angles for a series of subsequent calibrations of package 4. The applied velocity threshold was 0.5 m/s.
3015 7 Jul
2012
18 Sep
2012
17 Dec
2012
10 Jan
2013
WME 0.02 -0.15 0.11 0.08 Average PF 1.043 1.047 1.039 1.048 2·s(PF) 0.024 0.023 0.021 0.022 Average Swirl angle [°]
0.012 0.342 0.110 -0.007
2·s(swirl angle) [°]
0.868 0.792 0.724 0.593
2·s(average swirl angle)
0.007 0.006 0.006 0.007
Figure 11 displays the graphs in which both swirl angle and gas velocity are plotted versus the sample number for two different calibration dates. Even at low gas velocities the plot runs in a straight line. During the EuroLoop calibration of 17 December 2012 the swirl angle is on the average constant. At lower flowrates the swirl angle starts to increase. The September 2012 calibration shows blocks of different swirl levels, which coincide with changes of the gas velocity. Unfortunately the log was started after completion of the first calibration point. Upstream influences are not likely: the meter is more than 40d downstream of a Zanker flow conditioner that had been in place during all calibrations. The other suggestion is that partial clogging of the downstream filter may cause upstream swirl. However, the relationship between swirl level and meter error is unknown.
Figure 11: Swirl angle [°], moving average of swirl angle [°] and gas velocity v [m/s] (blue line) versus the sample number for calibrations of the us3015 in EuroLoop. The gaps in the swirl signal correspond with a velocity threshold of 0.5 m/s. e. Installation effects in Westerbork and EuroLoop
In the analyses of the data several installation effects are discovered. Examples of these installation effects are: • The short distance between the (downstream) meter
and the downstream expander. • The short distance between the (downstream) meter
and the downstream filter, both the expander and the filter may have caused upstream instable profile factors in the us2045-R and tm50062. If these instabilities were indeed present, even the turbine meters may have been influenced by these phenomena. The 24” USM was always far enough
0
5
10
15
20
25
30
1
1.02
1.04
1.06
1.08
1.1
0 2000 4000 6000 8000 10000 12000 14000 16000 18000 20000
Vg
as [
m/s
]
Pro
file
Fa
cto
r [
-]
2044F Westerbork 2010-07-13
-30
-25
-20
-15
-10
-5
0
1
1.02
1.04
1.06
1.08
1.1
0 2000 4000 6000 8000 10000 12000 14000 16000 18000 20000
Vg
as
[ m
/s ]
Pro
file
Fa
cto
r [
-]
2045R Westerbork 2010-07-13
0
5
10
15
20
25
30
-3.00
-2.00
-1.00
0.00
1.00
2.00
3.00
0 3600 7200 10800 14400 18000
v [
m/s
]
Sw
irl a
ng
le [
°] (@
v>
0.5
m/s
)
Sample number
3015 Euroloop 2012-09-18
0
5
10
15
20
25
30
-3.00
-2.00
-1.00
0.00
1.00
2.00
3.00
0 2000 4000 6000 8000 10000 12000 14000 16000
v [
m/s
]
Sw
irl a
ng
le [
°] (@
v>
0.5
m/s
)
Sample number
3015 Euroloop 2012-12-17

upstream of these disturbances which may be the reason of its good behaviour.
• The close proximity of thermowells may be the cause of these instabilities for the us2045-R. The ring in which the thermowells are mounted is not flush with the upstream and downstream pipe sections.
• Over time there were several changes in upstream piping configurations also may be the reason for changes in metering behaviour. The filter mentioned earlier introduced a sudden change in the swirl pattern of the us3015 on 2012-09-18. The changes are coinciding with changes in gas velocity as can be seen in Figure 12.
• Despite the application of thermal lagging the occurrence of convective flows at low flow rates due to temperature gradients could not be entirely avoided.
For EuroLoop this has resulted in a changed quality procedure specifying a more precise and detailed instruction for the test section configuration, in which the straight length downstream of the meter has increased from 3d to 5d and preferably 10d for ultrasonic meters. CONCLUSIONS AND RECOMMENDATIONS The intercomparison between Westerbork and EuroLoop is a unique project. In a period of two and a half years two-monthly calibrations were conducted on a fixed population of 7 meters, resulting in more than 100 meter calibrations. The turbine meters and the us2064 were not used in the field after they were reconditioned, so these can be considered as “new” meters. The other meters were not used intensively before the initial calibration in July 2010. For reference, gas meters are generally re-calibrated in a period of 5 to 10 years after their previous calibration. In the open literature a comparable study could not be found. The target of the intercomparison was a normalized deviation of �� ≤ 0.5 applied to the WME (weighted mean error). Due to the drift of the meters in the packages this criterion was applied to the trend of the calibration results. Out of 104 calibrations 90 results (86.5%) met this criterion, 13 results (12.5%) met 0.5 < �� ≤ 1.0, and 1 result (1%) exceeded �� = 1. In the period of December 2011 till February 2012 four of the seven meters showed deviations in EuroLoop that were higher than the target bandwidth. After February 2012 calibration results are back to previously observed results. As there are no apparent reasons for this behaviour further analysis resulted in the following observations. • The monitoring of the turbine master meters with
the ultrasonic master meters showed no trend in the difference of the references.
• Analysis of the log files of the ultrasonic meters showed slightly higher profile factors during this period than outside this period. Higher profile factors are consistent with a higher deviation of the ultrasonic meters. However the size of the change in
the profile factor is not consistent with the size of the change in meter deviation. Also the cause for the change in flow profile could not be retrieved.
• Just before the calibrations of December 2011 NMi EuroLoop started to apply a 10 µm particle filter at the end of the test section. In the first months the filter cloth had to be replaced frequently. The distance between the downstream meter and filter varied between 3d and 10d. Clogging of the filter cloth does not occur in a uniform way. As a consequence flow distortions are introduced that can have an upstream influence. Unfortunately, the existence of filter related flow distortions could not be confirmed by diagnose of the log files of the ultrasonic meters.
• The surface of the inner pipe wall may have an influence. The five meters that showed a relatively high shift of the meter curve had an inside coating of Flowcoat. The two other meters, the us2064 and us3015, have a nickel coating and a steel wall respectively. In addition the stability of the us2064 and us3015 over the entire intercomparison period is better than the two other ultrasonic meters. The possible influence of the inner pipe surface could not be confirmed. All meter interiors and the inner surface of upstream piping can be classified as hydraulically smooth and there was no significant difference between the profile factors of the ultrasonic flow meters.
When comparing calibrations it appears that the bandwidth of the meter curves observed in EuroLoop is higher than the bandwidth observed in Westerbork. Considering that the uncertainty of the calibration results in Westerbork is 0.20% and in EuroLoop 0.28%, the bandwidths are not bigger than twice the expanded uncertainty (±U). The bandwidth of the difference between the first and the second meter in a package is for both Westerbork and EuroLoop of the same magnitude as the bandwidth of the meter curves. Only for package 3 the difference between the two turbine meters is smaller than the bandwidth of each of the individual turbine meters. Conclusion is that turbine meters packages are more stable than ultrasonic meter packages. The calibration results show that turbine meters are better repeatable than ultrasonic meters. The good repeatability of turbine meters is not a predictor for a good reproducibility. During the calibrations additional experiments were performed with noticeable results. • From the diagnostics of the us3015 it appears that
the swirl in the 24” test line is low: ±1°. • For the us3015 two upstream spools were used for
the calibration: the 10d spool NAM-1939-2005 and the G061 spool. Both spools have the same length and diameter and also the wall roughness is approximately the same. The spools were alternately used in Westerbork. Differences between the results were less than the repeatability.
• During one of the one of the calibrations in EuroLoop

the G061 spool was not installed directly upstream of the meter but downstream. The other upstream spool fitted the meter diameter within 2%. The change between the WME of two subsequent calibrations was 0.02%.
• Package 3 consisting of two turbine meters was calibrated in both the 24” test line and the 16” test line. The differences between two subsequent calibrations were less than the repeatability of the meter.
• In addition the positions of the upstream and downstream meters were exchanged. Again no difference was observed beyond the repeatability of the meters.
• In August 2011 the Laws flow conditioner 20d upstream of the us2064 in package 2 was erroneously switched with the CPA50E flow conditioner. Immediate re-calibration in September 2011 showed a change in the WME of 0.01%.
Finally, there are some lessons learned in the intercomparison project, which will be useful for future calibration. • In the project a lot of effort was put into a constant
upstream configuration. Not foreseen was that expanders or particle filters mounted at a relatively short distance downstream of a meter under test, may cause upstream disturbances sensed by the meter and causing unintended deviations of the meter under test. Additional downstream piping with the MuT’s diameter will solve this problem. For EuroLoop this has resulted in a changed quality procedure specifying a more precise and detailed instruction for the test section configuration.
• When using meter packages it gives interesting information to plot the difference of the two meters versus the flow rates. This gives an impression of the stability of the difference between the meters in the package. In addition Youden plots give visual information on the correlation of the two meters in the package. A smaller bandwidth of the differential meter curves corresponds to a more correlated dataset in the Youden plot.
• In this project all meters used were manufactured by one single manufacturer. This implies a risk for that manufacturer if results are not good. For future intercomparisons it is advisable to use meters from different manufacturers.
• When the bandwidth of meter curves obtained during subsequent calibrations, equals the bandwidth of the difference of the two meters, a fundamental limit on the resolution of the
intercomparison has been reached. In this research turbine meters performed better than the ultrasonic meters. However, the ultrasonic technology has developed and the newer generation ultrasonic meters can perform better.
REFERENCES [1] OIML R32 (1989): Rotary piston gas meters and
turbine gas meters, OIML, Paris. [2] OIML R137-1 (2006): Gas meters, OIML, Paris. [3] GERG TM 5 (1991): Standard GERG Virial
Equation for Field Use. Simplification of the Input Data Requirements for the GERG Virial Equation – an Alternative Means of Compressibility Factor Calculation for Natural Gases and Similar Mixtures, M. Jaeschke and A.E. Humphreys, Groupe Européen de Recherche Gazière (GERG) Technical Monograph 5.
[4] GERG TM 15 (2007): The GERG-2004 wide range reference equation of state for natural gases and other mixtures, O. Kunz, R. Klimec, W. Wagner and M. Jaeschke Groupe Européen de Recherche Gazière (GERG) Technical Monograph TM15, VDI Verlag, Düsseldorf 2007.
[5] RvA (2012): Scope of accreditation of NMi EuroLoop, K161, pp 1-4.
[6] Dopheide, D., B. Mickan, R. Kramer, M. van der Beek, G.J. Blom, O. Gorieu and J.P. Vallet (2005): The harmonized European gas cubic meter for natural gas as realized by PTB, NMi-VSL and LNE_LADG and its benefit for user and metrology, Revue Française de Metrologie, No. 2, 2005-02, pp. 35-42.
[7] Schlichting, H (1951): Boundary-Layer Theory, Translation of Grenzschicht-Theorie, seventh edition, McGraw-Hill, New York, 1979.
[8] Beek, Mijndert van der (2012): EU Harmonized Reference Value for High Pressure Gas, an update, lecture presented at the 4th Milestones in Metrology conference, 7-9 May 2012, Venice, Italy.
[9] Vieth, Detlef (2012): Oral communication. [10] GERG TM 11 (2000): GERG Project on Ultrasonic
Gas Flow Meters, Phase II, edited by P. Lunde, K.-E. Frøysa and M. Vestrheim, Groupe Européen de Recherche Gazière (GERG) Technical Monograph 11.
[11] Stoltenkamp, P.W. (2007): Dynamics of turbine meters, Ph.D. thesis Eindhoven University of Technology.