a systematic literature review to support the … · dr veronica lambert; [email protected];...
TRANSCRIPT
(13/10/2014 Final Version) Page 1
School of Nursing and Human Sciences (SNHS)
A systematic literature review to support the
development of a National Clinical Guideline – Paediatric Early Warning System (PEWS)
Final Report
Systematic Review Team
Dr Veronica Lambert (VL), Lecturer in Children’s Nursing, SNHS, DCU Ms Marie T O’Shea (MO’S), Research Assistant, SNHS
Ms Catherine Walshe (CW), Research Assistant, SNHS Associate Professor Anne Matthews (AM), Senior Lecturer in Health Sciences, SNHS
Dr Melissa Corbally (MC), Lecturer in General Nursing, SNHS Dr Donal O’Mathuna, Senior Lecturer in Ethics, Decision-Making & Evidence, SNHS
Professor Anthony Staines, Professor of Health Systems Research, SNHS Ms Caroline O’Connor, Nurse Quality Practice and Research Coordinator, Temple Street,
Children’s University Hospital
Corresponding Author Dr Veronica Lambert; [email protected]; 01-7007161
School of Nursing and Human Sciences, Dublin City University, Dublin 9
Date: October 13th 2014 Funding: This review was funded by the Department of Health (DoH); and overseen by the National Clinical Effectiveness Committee (NCEC) and the Health Service Executive
(HSE) PEWS Guideline Development Group (GDG)

(13/10/2014 Final Version) Page 2
TABLE OF CONTENTS Page
Executive summary of finding (strengths, limits, gaps) 6 Systematic review report 10 1. Introduction 10
1.1. Operational Definition - Paediatric Early Warning Systems (PEWS) 10 2. Aim and Objectives 10
2.1. Aim 10 2.2. Objectives 11
3. Methods 11 3.1. Guiding framework 11 3.2. Work plan 11 3.3. Criteria for considering evidence for inclusion in the review (PICOs) 11
3.4. Search methods for identifying evidence for the review 13 3.4.1. Search strategy 13
3.4.2. Electronic searches 13 3.4.2.1. Clinical guidelines 13 3.4.2.2. Research studies 13 3.4.2.3. Grey literature 13 3.4.3. Consultation process with paediatric hospital experts 14
3.4.3.1. Online survey consultation 14 3.4.3.2. Telephone consultations 14
3.5. Data collection and analysis 15 3.5.1. Search Outputs 15
3.5.1.1. Clinical Guidelines 15 3.5.1.2. Research Studies 15 3.5.1.3. Grey Literature 16
3.5.2. Screening and Data Extraction 17 3.5.2.1. Clinical Guidelines 17 3.5.2.2. Research Studies 17 3.5.2.3. Grey Literature 18
3.5.3. Data synthesis 18 3.5.4. Assessment of level of evidence 18
4. Systematic review results - clinical section 21 4.1. Clinical Guidelines 21 4.2. Research Literature 22 4.3. Cross-sectional surveys on use, implementation and prevalence of PEW detection and response systems 23 4.4. Detection systems for identifying child clinical deterioration 25
4.4.1. Systematic review papers 25 4.4.2. Research literature 26 4.4.3. Detection systems for identifying neonatal clinical deterioration 41 4.4.4. Detection systems for identifying clinical deterioration in paediatric emergency departments 43 4.4.5. Grey literature 44
4.4.5.1. Findings from online survey consultation 46 4.4.5.2. Points of note from telephone consultations 49
4.5. Response systems for timely identification of child clinical deterioration 50 4.5.1. Systematic review papers 50 4.5.2. Research literature 54 4.5.3. Family activated response systems for identification of child clinical deterioration 65

(13/10/2014 Final Version) Page 3
4.5.4. Grey literature 66 4.6. Implementation of PEW detection and response systems 68
4.6.1. Research studies 68 4.7. Educational interventions related to PEW detection and response systems 76
4.7.1. Research literature 76 4.7.2. Grey literature 80
4.8. Culture, socio-technical & organisational issues impacting on detection & response systems for identifying and timely intervention to child clinical deterioration 82
4.8.1. Research literature 82 4.8.1.1. Situation awareness 84
4.9. Other grey literature 88 4.9.1. Discussions, commentaries, conference presentations 88 4.9.2. Ongoing studies – no data yet available 89
5. Economic Section 90 5.1. Economic literature 90 5.2. Detailed consideration of budget impact and resource implications 91
6. Expert Advisory Group 96 References 97 Tables Table 1: Population, Intervention, Comparison, Outcomes, Study Design (PICOS) 12 Table 2: Level of Evidence 19 Table 3: Detection systems: study research designs 27 Table 4: Overview of PEW scoring systems (original and adopted/modified) 28 Table 5: Development of original PEW scoring system 29 Table 6: Measurement/scoring parameters of original PEW system scores 29 Table 7: Measurement/scoring parameters of adopted/modified PEW system scores 32 Table 8: Age dependent reference ranges for physiological measurements 36 Table 9: Performance criteria of PEWS scoring systems 40 Table 10: Survey consultation: use of PEWS 46 Table 11: Survey consultation: type of PEWS used 47 Table 12: Survey consultation: child age range for which PEWS used 47 Table 13: Survey consultation: child hospital ward/setting PEWS used in 47 Table 14: Survey consultation: hospital guidelines for PEWS 47 Table 15: Survey consultation: content of hospital guidelines 47 Table 16: Survey consultation: evidence underpinning guideline development 48 Table 17: Survey consultation: training programme for PEWS 48 Table 18: Survey consultation: type of training provided for PEWS 49 Table 19: Survey consultation: frequency of training for PEWS 49 Table 20: Survey consultation: costs of implementing PEWS 49 Table 21: Survey consultation: clinical impact of PEWS implementation 49 Table 22: Response systems: study research designs 55 Table 23: Title of response teams 55 Table 24: Composition of response teams 56 Table 25: Trigger/calling criteria for response team activation 57 Table 26: Availability of response teams 58 Table 27: Ward areas served by response teams 58 Table 28: Activation process for calling response teams 59 Table 29: Clinical outcomes measured (response systems) 60 Table 30: Process outcomes measured (response systems) 61 Table 31: Modes of education reported in relation to response systems 63 Table 32: Overview of training, trainers, trainees, evaluation, outcomes and costs 63

(13/10/2014 Final Version) Page 4
Table 33: Implementation process: study research designs 68 Table 34: PEWS training manuals 81 Table 35: Barriers and facilitators to MET activation 83 Table 36: Advantages and disadvantages of MET 84 Table 37: Negative influences of achieving situational awareness 85 Table 38: Positive influences of achieving situational awareness 86 Table 39: Situation awareness intervention 87 Table 40: Approximate WTE per staff group 92 Table 41: Salary scales and education delivery/participation cost calculations 93 Table 42: Summary of the annual economic impact 95 Figures Figure 1: Flowchart of search outputs for clinical guidelines 15 Figure 2: Flowchart of search outputs and screening for electronic databases 16 Boxes Box 1: Inclusion and exclusion criteria 15 Appendices 104 Appendix 1: Review work plan and timelines 105 Appendix 2: Clinical guideline databases search and outputs 109 Appendix 3: Google and Bing search and outputs 110 Appendix 4: CINAHL search and outputs 111 Appendix 5: MEDLINE search and outputs 116 Appendix 6: PUBMED search and outputs 121 Appendix 7: EMBASE search and outputs 125 Appendix 8: COCHRANE database search and outputs 130 Appendix 9: Summary of overall search outputs from initial screening 132 Appendix 10: Grey literature search and outputs 133 Appendix 11: Trial register searches and outputs 134 Appendix 12: Professional organisations and associations search and outputs 135 Appendix 13: Ethics approval letter for survey consultation 136 Appendix 14: Plain language statement - consultation process 137 Appendix 15: Informed consent form - consultation process 139 Appendix 16: Online consultation survey 141 Appendix 17: Clinical guideline screening 143 Appendix 18: Clinical guideline rigour of development assessment 144 Appendix 19: Clinical guideline data extraction 167 Appendix 20: Data Extraction: Detection systems 172 Appendix 21: Data Extraction: Detection systems - neonatal 203 Appendix 22: Data Extraction: Detection systems – paediatric emergency departments 206 Appendix 23: Data Extraction: Response systems 210 Appendix 24: Data Extraction: Family activated response systems 256 Appendix 25: Data Extraction: Implementation of PEW detection and response systems 264 Appendix 26: Data Extraction: Education interventions 282 Appendix 27: Data Extraction: Culture, socio-technical and organisational issues 290 Appendix 28: Data Extraction: Cross-sectional surveys 301 Appendix 29: Data Extraction: Economic studies 307 Appendix 30: AACODS: authority, accuracy, coverage, objectivity, date, significance 310 Appendix 31: Screening/evaluation of grey literature 312 Appendix 32: Data extracted from grey literature 313 Appendix 33: Table on screening and key comments extracted from discussion papers, commentaries and conference papers retrieved through electronic databases 319

(13/10/2014 Final Version) Page 5
Appendix 34: Overview of studies included in the review 326 Appendix 35: Online survey consultation results 329 Appendix 36: Key points of interest from telephone / face-to-face consultations 337

(13/10/2014 Final Version) Page 6
PAEDIATRIC EARLY WARNING SYSTEMS SYSTEMATIC REVIEW EXECUTIVE SUMMARY OF FINDINGS (strengths, limits and gaps)
This systematic review (of 11 clinical guideline documents, 70 research papers and various sources of grey literature), has identified that Paediatric Early Warning (PEW) Systems are extensively used internationally in paediatric inpatient hospital settings; however there is no consensus and limited evidence about which PEW system is most useful or ‘optimal’ for paediatric contexts. Owing to the lack of level-one evidence, and mixed outcomes from other grades of evidence (i.e. observational and quasi-experimental studies), definitive conclusions cannot be made on the ‘effectiveness’ of PEW systems for the detection and/or timely identification of, and response to, deterioration in improving clinical outcomes for children aged 0-16years in inpatient hospital settings. However, some of the evidence body surrounding PEW systems does highlight positive directional trends in improving clinical based outcomes (e.g. reduced cardio-pulmonary arrests, earlier intervention and transition to PICU) for children who are clinical deteriorating, in addition to reporting potentially favourable outcomes for enhanced multi-disciplinary team work, communication and confidence in recognising, reporting and making decisions about child clinical deterioration. Notwithstanding these promising trends, a core limitation to the evolving volume of evidence on PEW systems is that, despite many reporting on the complexity and multi-faceted nature of PEW systems, no evidence was sourced which examined PEW systems as a ‘complex health-care intervention’. Rather, the various bodies of evidence reviewed examined PEW systems in a ‘piece-meal manner’ by focusing on one particular aspect of the PEW system such as detection using PEW system scores or focusing on the response mechanism such as medical emergency teams; this is reflected in our review in how we have categorised the available evidence into detection, response, implementation, education and cultural, socio-technical and organisational issues for example. The consequence of not giving attention to, developing and/or investigating PEW systems as a complex intervention is that, not only does it lack a strong theoretical model to underpin its implementation and evaluation (consequently with no consistency on how it is defined, implemented and measured thereby creating challenges for evaluating effectiveness), but with its multiple components we are still unclear on what the true “active ingredients” of PEW system interventions are in contributing to the detection and/or timely identification of, and response to, deterioration in improving clinical outcomes for children in inpatient hospital settings. However, identified through our consultation with experts, there is evidence of some emerging work commencing in this area in the UK. In considering the systematic review aims and objectives, below we summarise some of the main findings identified from the review.
No robust evidence-based clinical guidelines to support the implementation of PEWS detection and/or response systems were identified.
Based on research evidence and anecdotal accounts, PEW detection (i.e. PEW system score) and response systems (i.e. RRT, MET) are extensively used in paediatric inpatient hospitals internationally.
PEW detection systems
A large volume of published and unpublished PEW detection scoring systems are in use; some of which have been validated, however many remain un-validated.

(13/10/2014 Final Version) Page 7
Of those PEW detection scoring systems which have been validated, the majority have been evaluated at one point in time (once-off) in single site paediatric hospital settings
One multi-centre study was identified which validated the Bedside PEWS across inptaient units in four children’s hospitals.
The majority of PEW detection system scoring have been developed by diverse expert opinion/multi-disciplinary working groups in diverse contexts and consequently there is, some, but, limited consistency/consensus across scoring systems in the number, type, classification of, scoring and calling criteria of the measurement parameters for PEW detection systems. This is further illustrated by the various modifications made to PEW detection system scores to meet local need.
Limited uniformity exists on the reference range values used for physiological measurements for various age groups of children in assessing the deviations on PEWS system scores; additionally the sources of evidence underpinning the selected ‘optimal’ reference range value cut-offs is unclear, lacking or based on expert clinical consensus. Recent publications were identified which recommended updating reference ranges for vital signs with new thresholds.
There are also different standards for cut-off threshold points and for what is taken to be the endpoint or surrogate marker for ‘clinical deterioration’ in terms of measuring clinical outcomes (e.g. cardio-pulmonary arrest, PICU admission, mortality, escalation to higher level of care) for PEW detection system scores.
Diversity in PEW detection system score physiological (and other) parameters, differences in age dependent vital sign reference ranges, and limited consensus on clinical deterioration outcome measures makes it difficult to compare and contrast the performance criteria of PEW detection scoring systems; however although rare for any system to have both a high specificity and sensitivity, some scoring systems did show some promising sensitivity and specificity (e.g. Duncan, Parshurum). Alongside considering validity of the scoring system many contexts chose simplicity and clinical utility as a priority in electing which PEW detection system score to implement.
All the aforementioned diversities in PEW detection systems hinders the ability to make any definitive comparisons between bodies of evidence, not only on what might be an optimal PEW detection system to use but also what the optimal combination of physiological parameters might be for detecting and timely identification of clinical deterioration in children.
PEWS detection system scores specifically for use in neonatal populations were rare. Evidence to support use of PEW detection systems score use in paediatric emergency
departments is limited with the small volume of citations suggesting caution in recommending EWS as triage tools to prioritise patients based on lack of evidence on patient outcomes and cost analysis comparing PEWS to conventional triage tool systems. Although, unpublished work on POPS (paediatric observation priority score), designed for emergency department use, has promising uptake and outcomes.
PEW response systems
Response systems (e.g. RRT and MET) appear more prevalent in use in the USA, as opposed to the UK and in tertiary care children’s hospital as opposed to district general hospitals with paediatric units (this would appear consistent with the contextual settings for where the majority of the research studies were conducted in this field).
Diversity exists in how institutions operationalise and evaluate the performance of PEW response systems such as RRT and MET with limited standardisation (and often limited details describing the specific intervention) in relation to adopting a one or two tiered response system; team composition; activation/calling criteria and clinical and process outcomes measured (including challenges with deciphering whether studies are adopting the same or different terms/definitions for outcomes measured); thereby making any comparative conclusions difficult.

(13/10/2014 Final Version) Page 8
There is mixed evidence on the impact of PEW response systems on clinical outcomes; while many studies report trending reductions in cardio-pulmonary arrests rates, mortality rates, transfer time to PICU, time to interventions, for instance, these are often not statistically significant. For any study that reports some statistically significant finding, there is an equal counterbalance of another study of which findings are non-significant thereby limiting any consistent and/or consensual evidence; all studies are conducted in single site settings.
No evidence was sourced on the validation of activation/calling criteria for PEW response systems; rather these were determined locally through expert clinical consensual opinion based on local need/situational context.
For studies reporting specifically on PEW response systems limited data was reported in relation to training such as modes, timing, trainers, trainees, evaluation and costs; of data that was reported it was limited and variable with no standardised training process identified and no educational outcomes reported.
Family activated response initiatives are promoted, however the limited volume of evidence available suggest that families infrequently activate the response system and when they do the reason is largely as a consequence of communication failures rather than clinical deterioration; the effectiveness of family activated response systems in preventing clinical deterioration has not been established.
PEW system implementation strategies/processes
Despite the fact that many anecdotal accounts emphasis the important of the implementation process when introducing PEW systems, a dearth of published literature was sourced in this area.
What is published is diverse in approach ranging from adopting social marketing principles to quality/performance improvement initiatives to chart reviews and pre-post implementation surveys, thereby making comparative evaluations difficult with no conclusions being drawn what is the ‘optimal’ implementation strategy to use to influence changes in clinical/process outcomes (or indeed what are the best process and clinical outcomes to measure).
Notwithstanding, this dearth of evidence, there is value in the evidence that maps out the diverse implementation used in diverse contexts to gain insights into clinical and ‘real-life’ barriers and facilitators associated with the implementation of PEW systems.
As a result, within this systematic review report some space is given to the studies that offer detailed insights into their unique perspectives of navigating the terrain of PEW systems implementation; an area about which much has been undocumented in the published literature.
PEW systems – educational interventions A limited body of evidence was identified that specifically focused on the educational
aspect of PEW systems; two structured interventions/packages were identified – COMPASS and RESPOND (and a third intervention specific to paediatric interns hand-off using SBAR).
These aforementioned packages favoured self-directed e-learning mechanisms and peer training models such as train the trainer, alongside short real-life problem-solving scenario based face-to-face sessions.
While these interventions/packages report favourable results such as improved teamwork, communication, improved documentation of vital signs these results are largely based on self-completed evaluation surveys post participation in the training programmes. Of the studies that did examine clinical data, no significant differences in hospital mortality, unplanned admissions to critical care areas were identified.

(13/10/2014 Final Version) Page 9
PEW systems – cultural influences
A considerable topical argument in relation to the failure of PEW systems has transpired, perhaps as a realisation of the broader and complex nature of PEW systems, that of health care cultural contexts. Yet, hard evidence is limited to support or refute.
Drawing on emergent qualitative evidence, we outline barriers and facilitators most notably discussed in the literature in relation to PEW response systems.
This leads us to dip into an arguably a new ‘translational’ integration of the concept of situational awareness into the healthcare ‘patient safety/risk’ forum; most notably the work of Brady.
PEW systems – economics
No economic evaluations covering the resource implications of a complete PEW system (implementation, education, detection, response) were found.
A cost-benefit analysis of a MET in a children’s hospital in the US found that children who had experienced ‘critical deterioration’ (CD) (arrest, ventilation or vasopressor infusion), preventable by MET intervention, cost more than those admissions to PICU who did not; and that savings from even a modest reduction in CD events will offset the MET costs.

(13/10/2014 Final Version) Page 10
PAEDIATRIC EARLY WARNING SYSTEMS –SYSTEMATIC REVIEW REPORT
1. INTRODUCTION The goal of this tendered review is to support the decision to develop a Paediatric Early Warning Score (PEWS) to the level of National Clinical Guideline in Ireland, assured by the National Clinical Effectiveness Committee, through the completion of a systematic clinical and economic literature review. This is an appropriate response to the requirement for early detection of and response to the clinical deteriorating child given that, in the nomenclature of Roland (2013 p. 358) “the reliable identification of the critically ill or deteriorating child has been both the Holy Grail and Achilles’ heel of paediatric practice for some time.” Although the percentage of paediatric cardiopulmonary arrests has been reported as low (e.g. 0.7-3%) for inpatient admissions (Tucker et al. 2009, Chapman et al. 2010); survival to discharge for children that experience in-hospital cardiopulmonary arrest has been reported as poor (11-37%) (Tucker et al. 2009, McLellan et al. 2013). With increased acuity of care and higher technology dependency recent years have witnessed an increased risk of paediatric cardiopulmonary arrest, and its associated mortality, in acute healthcare settings (Robson et al. 2013). Given this, and the evidence that many paediatric deaths are identified as either avoidable or potentially avoidable (CEMACH 2008), with evident deterioration of symptoms (physiological and behavioural) often present in the 24 hours preceding an arrest (Robson et al. 2013, McLellan et al. 2013), there is a solid foundation for an increased attention to prevention; early detection through implementation of early warning scores and appropriate timely responses (e.g. medical emergency team; rapid response team) to the clinically deteriorating child. The requirement for a robust system specifically for identification of the clinically deteriorating child is important because the application of early warning scoring systems to paediatric patients is more complex than to adults. There are several reasons for this: variation in age specific thresholds for normal and abnormal physiology; children’s inability or difficulty in articulating how or what they feel; children’s compensatory mechanisms; staff training issues and the need for more focused attention on respiratory deterioration (Haines et al. 2006). While many systems have been developed and tested uncertainty remains as to which system is most useful for paediatric patients. The aim of this tendered review was to deliver, within 9 weeks of the commencement of the project, a systematic clinical and economic literature review on early warning systems or track and trigger systems used in paediatric patients in acute healthcare settings, including emergency departments, for the detection of deterioration/timely identification of deterioration. 1.1. Operational Definition - Paediatric Early Warning Systems (PEWS) For the purpose of this review the term paediatric early warning systems is used, as opposed to paediatric early warning score, to capture the concept of a ‘system’ as opposed to merely focusing on a ‘score’. It is important to acknowledge that many terms related to early warning systems are used interchangeably throughout the literature (e.g. early warning scoring systems, rapid response systems); and in referring to paediatric early warning systems we operationally define this as being inclusive of systems that detect and respond to clinical deterioration in child in-patients in hospital. 2. AIMS AND OBJECTIVES 2.1. Aim The purpose of this review was to assess the evidence on the use, validation, education and cost-effectiveness of early warning, or track and trigger, systems used in paediatric patients in acute healthcare settings, including emergency departments, for the detection and/or timely identification of deterioration in children aged 0-16 years.

(13/10/2014 Final Version) Page 11
2.2. Objectives The review objectives were to identify;
What neonatal and paediatric early warning, or track and trigger, systems (including escalation protocols and communication tools) are currently in use internationally for the detection of deterioration and/or timely identification of deterioration in children aged 0-16 years? This included early warning scores for the emergency department.
What is the level of clinical validation of these neonatal and paediatric scoring systems including escalation protocols and communication tools?
What education programmes have been established to train healthcare professionals in the delivery of neonatal and paediatric early warning scoring systems?
What level of evaluation has been used for these education programmes? What are the findings in the economic literature of cost effectiveness, cost impact and
resources involved with early warning or track and trigger systems in the detection and/or timely identification of deterioration in paediatric patients, including implementation costs?
To conduct a budget impact analysis on the implementation of PEWS This aim and objectives were confirmed with the HSE PEWS Guideline Development Group (GDG) and DoH Clinical Effectiveness Unit (CEU) through the nominated contact points prior to the commencement of the review.
3. METHOD 3.1. Guiding framework The methodology for this review followed the Centre for Reviews and Dissemination (CRD) (2008) guidance for undertaking systematic reviews in healthcare and the National Clinical Effectiveness Committee Guideline Development Manual (NCEC) (2013) with regard to considering evidence for the review; search methods; data collection and analysis including data extraction, quality assessment and data synthesis. Additionally, HIQA’s (2010) guidelines for budget impact analysis of health technologies in Ireland was adopted to guide budget impact analysis. 3.2. Work plan Our work plan for this systematic review was structured around four strands related to the evidence bases we needed to investigate (Appendix 1). Strand 1 assessed the research evidence (i.e. searching, screening, extracting, assessing and synthesising) related to PEWS. Strand 2 determined the clinical guideline evidence base (i.e. searching, screening, extracting, assessing and synthesising) related to PEWS. Strand 3 examined grey literature (unpublished and ongoing) (i.e. searching, screening, extracting, assessing and synthesising) related to PEWS. Strand 4 involved the completion of a budget impact analysis (i.e. inclusive of economic searches, gathering inputs and data sources related to population and intervention and conducting a budget impact analysis calculation). In reviewing the research, clinical guideline and grey literature evidence we considered the 3 cross-cutting themes of; (1) clinical use and validation of PEWS; (2) education and training of PEWS; including evaluation (3) economic evidence on the cost-effectiveness, cost impact, resources and implementation costs related to PEWS (+ conduct of budget impact analysis). While all four strands ran, and all three themes were examined, concurrently, it was very much an iterative process with much back and forth movement between the suggested work plan over the 9 week time frame as we collated various forms of research, clinical guideline and grey literature evidence. 3.3. Criteria for considering evidence for inclusion in the review (PICOS) Drawing on the experience of the National Early Warning Score published review (NCEC 2013a), scoping preliminary searches of the electronic databases MEDLINE, CINAHL, PUBMED and EMBASE, a review of key words from previous research studies in the field and engagement with a subject librarian, PICOS parameters for the review search strategy were determined

(13/10/2014 Final Version) Page 12
(Table 1). In mapping out the PICOS, S was not specified as no limits were applied to study type/designs. These PICOS were finalised a priori, reviewed by our expert advisory group and agreed with the HSE PEWS Guideline Development Group prior to the commencement of the review. The overarching PICOS question was;
Is the use of PEWS effective in the timely identification of clinical deterioration in
acutely ill children (aged 0-16 years)?
Table 1: Population, Intervention, Comparison, Outcomes, Study Design (PICOS)
PICO Indicative Terms
Population Newborn/neonate/infant/child/adolescent/young person patient Newborn/neonate/child/adolescent/young person acute patient Critically ill/deteriorating paediatric/pediatric patient Sepsis/septic infection/shock in
newborn/neonate/infant/child/adolescent/young person patient
Intervention Neonatal/Paediatric/Pediatric Early Warning Score/System/Tool/Chart Neonatal/Paediatric/Pediatric Modified Early Warning
Score/System/Tool/Chart Bedside PEWS/BPEWSParent Activated Early Warning Systems Sepsis Six Track and Trigger Systems/Tools Instrument Validity/Reliability/Evaluation Calling Criteria/Rapid Response/Escalation Protocols/ Communication
Tools/Situation Awareness Education/Training/ALERT™/COMPASS©
Comparison# Neonatal/Paediatric/Pediatric Early Warning Score/System/Tool/Chart Neonatal/Paediatric/Pediatric Modified Early Warning
Score/System/Tool/Chart Bedside PEWS/BPEWS Parent Activated Early Warning Systems Sepsis Six Track and Trigger Systems/Tools Validity/Reliability/Evaluation Calling Criteria/Rapid Response/Escalation Protocols/ Communication
Tools/Situation Awareness Education/Training/ALERT™/COMPASS© (comparison against each other or with no intervention)
Outcome
Clinical outcomes Detection, and/or timely identification, of clinical deterioration of the newborn/neonate/child/adolescent/young person patient and all relevant sequalae; and diagnostic accuracy Instrument sensitivity/specificity Economic outcomes Costs and results
Healthcare resource use Training/Education costs Staff time costs ICU outreach costs/additional referrals Results e.g. number of unplanned ICU admissions; number of cardio-
pulmonary arrests; ongoing care costs, hospital mortality Immediate call to resuscitation team/MET (medical emergency team)
team/CCRT (Critical Care Response Team) Cost savings Cost-effectiveness measures (e.g. ICER)

(13/10/2014 Final Version) Page 13
3.4. Search methods for identifying evidence for the review A variety of electronic databases and other resources were searched to retrieve published and unpublished evidence nationally and internationally; including clinical guidelines, primary research studies, secondary reviews, economic evaluations/analysis and grey literature. These are outlined below. 3.4.1. Search strategy Our search strategy comprised of three stages. These stages were conducted in consultation with our health sciences Subject Librarian and Information Staff at Dublin City University and were related to identifying all types of evidence; clinical guidelines, primary research studies, secondary reviews, economic evaluations/analysis and grey literature. In Stage 1 we used a limited set of free text key words and databases (e.g. MEDLINE and CINAHL) to find potentially relevant evidence related to PEWS. Similarly we used a limited set of key words to search the internet to identify potentially relevant clinical guidelines related to PEWS. We conducted a brief review of the retrieved evidence, from the databases and the internet, in an effort to expand our key words and phrases for a more in-depth search, in addition to, determining if any systematic reviews already existed on the use, validation, education and cost-effectiveness of PEWS. Prior to progressing to our second search stage we agreed on the finalised search terms with the nominated contact points for the HSE PEWS Guideline Development Group (GDG) and DoH Clinical Effectiveness Unit. In Stage 2 we repeated stage 1 searches and expanded these searches to other databases (i.e. PUBMED, EMBASE, COCHRANE as outlined in section) and other resources/grey literature (as outlined in section) using the full list of key words (both free text and the databases controlled vocabulary e.g. MeSH, Thesarsus, Emtree, Subject Headings) developed in Stage 1. Stage 3 of our search entailed searching the reference lists of identified articles.
3.4.2. Electronic searches 3.4.2.1. Clinical guidelines The following electronic guideline clearinghouses were searched using various key words specific to paediatric early warning systems; United States National Guideline Clearinghouse (www.guideline.gov); the National Institute for Health and Clinical Excellence (www.nice.org.uk); and the Scottish Intercollegiate Guidelines Network (www.sign.ac.uk) (Appendix 2). Google and Bing searches were conducted for evidence based clinical guidelines related to PEWS using a variety of combination of key search terms for paediatric early warning systems (Appendix 3). 3.4.2.2. Research Studies The electronic databases of PubMed, MEDLINE, CINAHL, EMBASE and Cochrane (inclusive of Cochrane Database of Systematic Review; Database of Abstracts of Review Effects (DARE), and CENTRAL - Cochrane Central Register of Controlled Trials) were searched using various combinations of controlled vocabulary and free text words (Appendices 4-9). These search strategies emanated following mapping of PICOS (Table 1 above), scoping searches of the databases, a review of key words from previous research studies in the field and engagement with subject librarian. 3.4.2.3. Grey Literature In order to identify unpublished and ongoing evidence not retrieved via the bibliographic databases, we searched for grey literature (as defined in DoH 2013, p.3) as follows: (1) specific grey literature databases; (ii) trial registers; (iii) professional organisations and association websites; (iv) consultation process with paediatric hospital experts internationally Specific grey literature databases were searched using various key words specific to paediatric early warning; the Research Inventory for Child Health in Europe (RICHE); the

(13/10/2014 Final Version) Page 14
Agency for Healthcare Research and Quality; Open Grey and PsycEXTRA (Appendix 10). Trial registers were searched for completed, current and/or ongoing controlled trials and results; ISRCTN, the MetaRegister of controlled Trials, clinicaltrials.gov, ANZCTR and the WHO international clinical trials registry platform (Appendix 11). Professional organisations and association websites were searched using various key words specific to paediatric early warning; Royal College of Paediatrics and Child Health; Paediatric Nursing Association Europe; European Federation of Critical Care Nursing Associations; Association of Anaesthetists of Great Britian and Ireland; American Society of Anesthesiologists; American Academy of Pediatrics; European Association for Children in Hospital; Action for Sick Children UK; Children’s Hospital Association US; Royal College of Physicians (inclusive of National Clinical Guideline Centre) (Appendix 12). 3.4.3. Consultation process with paediatric hospital experts internationally In an attempt to gather data on grey literature and more specifically evidence based clinical guidelines on paediatric early warning systems internationally; a consultation process was undertaken with key paediatric experts and paediatric hospitals internationally. This was achieved by two routes; an online survey and telephone discussions. Prior to commencing this process ethical approval, through Notification Procedure for low risk social research was granted by the Research Ethics Committee at Dublin City University (Appendix 13). This included drafting plain language statements (Appendix 14) and consent forms (Appendix 15). 3.4.3.1. Online Survey Consultation The online survey was developed using the Online Survey Software & Insight Platform, Qualtrics; http://www.qualtrics.com/. An outline of the survey is provided in Appendix 16. The survey was distributed to a cross-section of paediatric experts in the field of early warning scoring systems and a cross-section of children’s hospitals internationally. A variety of methods were used to determine contact details of experts worldwide i.e. hospital websites, google searches, LinkedIn, and contacts identified through grey literature conference presentations and research papers. In total, the online survey consultation link was distributed via email to individual experts (n=31) and key contacts in paediatric hospitals (n=15) worldwide (including the USA, UK, Netherlands, Belgium and Denmark for example). Experts contacted included paediatricians, clinical nurse specialists, senior lecturers, nurse consultants, and consultants in paediatric medicine. Additionally, a number of organisations were contacted to determine the possibility of sending mailshots to member lists (e.g. American Society of Anesthesiologists; American Academy of Pediatrics; Royal College of Paediatrics and Child Health (RCPCH); Paediatric Nursing Association of Europe (PNAE)). Some responded highlighting this was not possible and others had high cost implications. Two organisations (PNAE, RCPCH) distributed the survey details and link to their mailing lists/advertisement in their newsletter. A summary of the survey outputs in presented at a later point. 3.4.3.2. Telephone Consultations In addition to the online survey consultation, telephone consultations were undertaken with six key clinical experts (e.g. paediatricians, advanced nurse specialists), from the UK, USA and Australia, in the use and implementation of paediatric early warning score systems. One face-to-face consultation was also undertaken with paediatric experts at the Nationwide Children’s Hospital, Columbus, Ohio USA. These discussions were valuable in consolidating information we had already and identifying ongoing studies and new innovations in the field not yet published. A summary of the first-hand comments from these discussions, not reported elsewhere, are presented at a later point.

(13/10/2014 Final Version) Page 15
3.5. Data Collection and Analysis 3.5.1. Search Outputs 3.5.1.1. Clinical Guidelines The final outputs of the clinical guidelines search strategies and screening for eligibility for inclusion in the review identified 1 guideline as potentially eligible for inclusion in the review. The outputs of individual search strategies are displayed in Appendix 2. The final outputs of the scoping searches of Google and Bing identified 7 clinical guideline documents related to PEWS as potentially eligible for inclusion in the review (Appendix 3). One clinical guideline document was received through personal communication and 4 were retrieved through the online consultation survey (however 2 of these guideline documents were non-English emanating from Germany and Denmark). Thus, the final total of clinical guideline documents deemed eligible for review was 11 (Figure 1). All searches and screening were conducted and outputs cross-checked by at least two members of the review team (VL, MO'S, CW). Figure 1: Flowchart of search outputs for clinical guidelines
3.5.1.2. Research Studies The final outputs of the electronic database search strategies and screening for eligibility for inclusion in the review are outlined in Figure 1 below. The outputs of individual search strategies are displayed in Appendices 4-9. Box 1 below outlines the inclusion and exclusion criteria. All searches and screening were conducted and outputs cross-checked by at least two members of the review team (VL, MO'S, CW). Box 1: Inclusion and exclusion criteria Inclusion Criteria
Neonatal and/or paediatric early warning score (PEWS) systems ; inclusive of rapid medical response systems and teams
Outcomes were specific to the identification of and/or response to clinical deterioration Child patients aged 0-18 years Neonatal and paediatric hospital settings (including emergency departments) All study designs (i.e. qualitative, quantitative, mixed methods, case reports)
Exclusion Criteria
Neonatal or paediatric community health settings PEWS specific to intra and/or inter- hospital transfer and/or transport of critically ill children Trigger tools for identification of adverse events and/or harm caused by medical
treatments/interventions Severity of illness scales and patient classification systems which focused solely on illness acuity
and mortality identification as opposed to early warning and response to child clinical deterioration (except in cases where such studies included PEWS/RRT systems as comparative severity of illness interventions)
Studies which included both child and adult populations where child data could not be exclusively explicated
11 guidelines included
13 guidelines identified Guideline clearinghouses = 1 guideline
Google/Bing = 7 guidelines Personal communication/email = 1 guideline
Online consultation survey = 4 guidelines
2 guidelines excluded Rationale: non-English

(13/10/2014 Final Version) Page 16
Figure 2: Flowchart of search outputs and screening for electronic databases
* Discussions, commentaries and conference presentations were included under grey literature
Stage 1 & 2 screening: Titles/Abstracts
Reviewed
106 papers potentially included
Stage 3 screening: Full Texts Reviewed
70 research papers included in the review
2434 papers identified PubMed = 1071 papers MEDLINE = 851 papers CINAHL = 321 papers
EMBASE = 191 papers
2328 papers excluded Duplicates Adult focused Discussion papers;
commentaries; conference abstracts etc.*
16 papers included identified via secondary citations personal communications web-resources
Databases PUBMED, MEDLINE, CINAHL, EMBASE, COCHARNE
52 papers excluded Adult focused Unable to segregate child
and adult data Not specifically focused on
outcome of ‘clinical deterioration’
Focus on transportation Focus on severity/acuity of
illness Discussion papers;
commentaries; conference abstracts etc.*
54 papers included; met inclusion criteria

(13/10/2014 Final Version) Page 17
3.5.1.3. Grey Literature The final search outputs and screening of the grey literature identified the following number of documents (after removal of duplicates), as displayed in the Appendices 10-12, as potentially eligible for inclusion in the review; grey literature databases (n=4) (Appendix 10); trial registers (n=3) (Appendix 11); and professional organisations and association websites (n=0) (Appendix 12). All searches were conducted and outputs cross-checked by at least two members of the review team (VL, MO'S, CW). Other grey literature resources identified were;
Paediatric Observation Priority Score (POPS) (http://www2.le.ac.uk/departments/cardiovascular-sciences/research/cardiovascular-physiology-and-pathophysiology/emergency-medicine-group/research/pemla/pops)
Paediatric International Patient Safety and Quality Community PEWS Resources (http://www.pipsqc.org/PaediatricEarlyWarningScorePEWSResources.aspx)
A Quality and Patient Safety Division newsletter, FIRST Do No Harm, from Massachusetts retrieved through secondary citation – includes an article on the Children’s Hospital Boston Early Warning Score (CHEWS) (http://www.mass.gov/eohhs/docs/borim/newsletters/qps-august-2010.pdf)
Personal communication (e-mail) with clinical charge nurse, paediatric intensive care unit, Starship children’s hospital, Auckland, New Zealand.
Personal communication (e-mail) with New South Wales Clinical Excellence Commission about the initiative “Between The Flags” (http://www.cec.health.nsw.gov.au/programs/between-the-flags)
Discussion papers, commentaries and conference presentations retrieved during searches of the electronic databases (CINAHL n=10; MEDLINE n=1; PUBMED n=11; EMBASE n=28; Other n=2)
Unpublished data was also obtained through the online consultation survey and telephone consultations with paediatric experts internationally.
All of these will be referred to at a later point. 3.5.2. Screening and Data Extraction 3.5.2.1. Clinical Guidelines We followed the NCEC (2013b) Guideline Development Manual to screen retrieved clinical guidelines. This included at least two reviewers (VL, MO’S) independently assessing the question covered; the publication date and the ‘rigour of development’ (as outlined by HIQA in 2011 in the National Quality Assurance Criteria). Any discrepancies were resolved by discussion with a third reviewer (AM). We mapped our screening exercise in a matrix as recommended by NCEC (2013b) (Appendix 17 and 18). At least two review authors (VL, MO’S) extracted and reviewed data from clinical guidelines. Data extracted from clinical guidelines included; scope and purpose; stakeholder involvement; development stage; and recommendations (Appendix 19). Any discrepancies in data extraction between the two review authors were resolved through consultation with a third review author (AM). 3.5.2.2. Research Studies We followed CRD’s (2008) systematic review guidelines for screening the research literature retrieved. Two reviewers independently assessed each title and abstract retrieved from the electronic searches for relevance (VL, MO’S). Any discrepancies were resolved through discussion with a third reviewer (AM). If no abstract was available, the full paper was sourced and assessed. For studies deemed to meet the inclusion criteria, full texts of the studies were obtained. Two review authors independently assessed these full texts against the inclusion criteria before a final decision regarding inclusion/exclusion was confirmed (VL, MO’S). Any discrepancies were resolved by discussion with a third review author (AM). We recorded research studies excluded from the review; noting reasons for exclusion. A full audit trail of all the screening processes was maintained and we used an adapted PRISMA flow chart to visually report the screening and selection process for research studies (see Figure 1 above).

(13/10/2014 Final Version) Page 18
We designed, piloted and amended a data extraction form for research studies based on previous templates the review authors had used for systematic reviews. At least two review authors independently extracted and managed data from the research studies (VL, MO’S, CW, MC). In general, data extracted from research studies included items related to study aim; study design; participant details; intervention and comparison details; outcomes measure and findings. Any discrepancies in data extraction between the review authors were resolved through consultation with a third review author (AM). Owing to the diversity of studies examining different aspects of PEWS systems (e.g. studies specific to the development of pews scoring tools, studies focusing on the rapid response, studies investigating education interventions, and studies conducted in specific contexts such as the emergency department) we divided our data extraction tables accordingly as outlined below.
Detection systems for identifying child clinical deterioration (Appendix 20) Detection systems for identifying neonatal clinical deterioration (Appendix 21) Detection systems for identifying clinical deterioration in paediatric emergency
departments (Appendix 22) Response systems for timely intervention to child clinical deterioration (Appendix 23) Family activated response systems for timely intervention to child clinical deterioration
(Appendix 24) Implementation of detection and response systems for identifying and timely
intervention to child clinical deterioration (Appendix 25) Educational interventions for detection and response systems for identifying and timely
intervention to child clinical deterioration (Appendix 26) Culture, socio-technical and organisational issues impacting on detection and response
systems for identifying and intervening to child clinical deterioration (Appendix 27) Cross-sectional surveys on the use, implementation and prevalence of paediatric early
warning detection and response systems (Appendix 28) Economic studies (Appendix 29)
3.5.2.3. Grey Literature Unpublished grey literature was screened and evaluated using a checklist from Flinder’s University - AACODS (Tyndall 2010) (Appendix 30). This included at least two reviewers (VL, MO’S) independently assessing the authority (i.e. credibility of the author - individual/organisation), accuracy (i.e. is it supported by documented references, has it a clearly stated aim and methodology, is it in line with other work on the same topic.), coverage (i.e. parameters that define content coverage such as population group, limits stated clearly), objectivity (i.e. can bias be detected - expert opinion, author’s standpoint, balanced view), date (i.e. easily discernible date that confirms relevance; if no date rule of thumb avoid such material), and significance (i.e. value judgement (e.g. utility, unique, impact) of the item in context of the relevant research area). We mapped our screening exercise in a matrix (Appendix 31) and extracted relevant data (Appendix 32). Any discrepancies were resolved by discussion with a third reviewer (AM). For discussion papers, commentaries and conference presentations retrieved during searches of the electronic databases we tabulated screening and pertinent comments (Appendix 33). 3.5.3. Data synthesis The results of the review are summarised narratively and tabulated to display data as deemed appropriate. 3.5.4. Assessment of the level of evidence Assessing comparative quality across the eligible studies included in this systematic review proved difficult due to the heterogeneous nature of the research methodologies employed (e.g. disparate research designs; different ranges of time-period for collecting data over

(13/10/2014 Final Version) Page 19
months/years; localised small case and comparative group selections; and diverse clinical contexts ranging from general medical and surgical units to specialised settings such as oncology, cardiac, endocrine, rehabilitation units). However, to gain some understanding of the body of evidence available and to inform standards required for the development of a PEWS national clinical guideline, the type of study was classified according to the hierarchy of evidence by drawing on the SIGN criteria for assignment of levels of evidence. This was conducted by two reviewers (VL, AM) with discussion to reach consensus on the overall hierarchy of evidence of rating as illustrated in Table2 below. Table 2: Level of Evidence (R=retrospective; P=prospective) Author Study type Level of
evidence PEW System
Chapman Review (of observational/quasi-experimental studies) 2 Detection Chan Review (of observational/quasi-experimental studies) 2 Response VanderJagt Review (of observational/quasi-experimental studies) 2 Response Winberg Review (of observational/quasi-experimental studies) 2 Response Duncan Case control – frequency matched (R) 2 Detection Edwards 2009 Cohort (P) 2 Detection Edwards 2011 Cohort (P) 2 Detection Fuijkschot Cohort studies x 3 (Rx2;Px1) 2 Detection Haines Cohort (with a random control sample) (P) 2 Detection McLellan Cohort (with convenient comparison group) (R) 2 Detection Parshuram 2009 Case control (frequency matched) (P)
Survey interview (R) 2 Detection
Parshuram 2011a Case control (frequency matched) (P) + survey interview (R); (International multi-centre study)
2 Detection
Parshuram 2011b Before & after (P) + survey 2 Detection Robson Case control (R) 2 Detection Sefton Before & after cohort (P) 2 Detection Skaletzky Case control (R) 2 Detection Zhai Case control (R) 2 Detection Holme Case cohort – 2 groups - 1 classed as ‘unwell’ and 1 class as
‘well’ (R) 2 Detection
Edgell Case control (R) pilot 2 Detection Seiger Cohort (P) 2 Detection Bonafide 2014a Interrupted time series & (R) chart review 2 Response Bonafide 2012 Cohort (R) 2 Response Hanson Interrupted time series & (R) chart review 2 Response Hunt Before & after (R/P) 2 Response Kotsakis Before & after (R/P) (Interdisciplinary multi-centre study) 2 Response Lobos 2014 Cohort (R) 2 Response Sharek Cohort – before & after 2 Response Theilen Cohort (P) 2 Response Zenker Pre-post design (R/P) + staff satisfaction survey 2 Response McCrory Pre-post design (P) 2 Education McKay Controlled before and after design (P) 2 Education Brady Times series study 2 Cultural Bonafide 2014b Cohort (R) 2 Economic Duncan & Frew Cost analysis exercise (P) 3 Economic Akre Chart review (R) 3 Detection Bell Chart review (R) 3 Detection Monaghan Descriptive pilot/audit - chart review (R) 3 Detection Solevag Chart review (R) 3 Detection Tucker Descriptive study - chart review (P) 3 Detection Tume Audit - chart review (P) 3 Detection Roland 2010 2 studies - both chart reviews (Rx1;Px1) + qual. survey 3 Detection Bradman Audit - chart review (R) 3 Detection Breslin Chart review (P) 3 Detection Avent Case report 3 Response Brilli Performance improvement project – (R) pre post chart
review + staff performance assessment survey 3 Response
Haque Audit - chart review (R) 3 Response Panesar Before after database review (R) 3 Response

(13/10/2014 Final Version) Page 20
Author Study type Level of evidence
PEW System
Tibballs 2005 Chart review – before & after (R/P) 3 Response Tibballs & Kinney Chart review - before & after (R/P) 3 Response VanVoorhis & Willis Case examples 3 Response Wang Database review (R) 3 Response Demmel Pilot; pre & post (R/P) 3 Implementation McLellan & Connors 3 pilot studies; chart reviews + clinican interviews (R) 3 Implementation Kukreti Pre & post survey (based on expert opinion) 4 Implementation Tume Survey (based on expert opinion) 4 Education Hayes Quality improvement initiative (multi-centre multi-
disciplinary collaborative) 4 Implementation
Lobos Quality improvement initiative (multi-centre – reports on same study as Kotsakis – focus of this paper is on the implementation process)
4 Implementation
Randhawa Quality improvement initiative 4 Implementation Dean Quality improvement initiative 4 Family Ray Quality improvement initiative 4 Family Heuckel Quality improvement initiative 4 Family Paciotti Qualitative (interviews) (based on expert opinion) 4 Family Azzopardi Survey (based on expert opinion) 4 Cultural Bonafide 2013a Qualitative (interviews) (based on expert opinion) 4 Cultural Brady & Goldenhar Qualitative (interviews) (based on expert opinion) 4 Cultural Roberts Qualitative interviews (based on expert opinion) 4 Response Chen Survey (based on expert opinion) 4 Response Roland 2013 Survey (based on expert opinion) 4 Detect/Respond Sen Telephone survey (based on expert opinion) 4 Response VandenBerg Telephone survey (based on expert opinion) 4 Response
Level 1 Evidence (n=0): The review identified no level one evidence (i.e. meta-analysis, systematic reviews of RCT’s; or RCT’s) on the effectiveness of PEW systems for the detection and/or timely identification of, and response to, deterioration in improving clinical outcomes for children aged 0-16years in inpatient hospital settings. The levels of evidence sourced ranged from level 2 to 4 (Table 2 above). Level 2 Evidence (n=33): 33 papers were classified as level 2 evidence; inclusive of review papers of studies other than RCT’s such as descriptive, observational and/or quasi-experimental studies; and localised single site observational studies such as case control and cohort studies and quasi-experimental designs such as interrupted time series and/or before and after studies. It is worth noting that while these studies have been classed as level 2 evidence based on the fact that they have been described as case control or control studies often the data collection methods in these studies were similar to those described in level 3 evidence (i.e. retrospective data extraction from medical charts/databases and/or prospectively evaluating patient physiological measurements/early warning scores or documented rapid response team data). Of the level 2 evidence, two multi-centre studies were identified. One multi-centre study focusing on PEW detection systems was conducted in four hospitals (3 in Ontario and 1 in Birmingham) with a total number of 2,074 patients (case 686; control 1388) (Parshuram et al. 2011a). Owing to the multi-centre nature and larger sample size of this study perhaps it could be classified at the upper end of the level 2 evidence in comparison to other studies. However, arguably the study was also limited in that the study involved individual units within each hospital as opposed to hospital wide inclusion. The other level 2 multi-centre study was conducted in 4 hospitals in Ontario Canada and focused specifically on PEW response systems (Kotsakis et al. 2011). Although specific to one site and cultural context, the work of Brady et al. (2013) offers promise in assisting one to move beyond considering “early warning” of clinical deterioration as merely a solitary ‘score’ but rather as a complex ‘system’ with a multitude of components; all of which will be influenced by the ‘patient safety/risk’ cultural milieu of the health care system within which it is situated.

(13/10/2014 Final Version) Page 21
Level 3 Evidence (n=20): 20 papers were categorised as level 3 evidence; largely inclusive of chart reviews and case reports. The research designs of these studies were generally described in line with the method of data collection such as descriptive audits and/or before and after chart reviews. While chart reviews provided valuable retrospective and prospective data on PEW system detection tools and rapid response systems the studies often suffered from missing data and how such missing data was managed varied across different studies ranging from assuming missing data as normal; using the most recently reported data; excluding incomplete data from analysis; and/or replacing missing data by a value drawn from an estimate of distribution of variance to create a complete dataset. This was also pertinent for some level 2 evidence whereby the primary means of data collection for some case control and/or cohort studies was patient medical records and/or localised electronic databases as aforementioned. Level 4 Evidence (n=17): 17 papers were identified as level 4 evidence, classified as expert opinion approaches inclusive of localised quality improvement initiatives; qualitative interviews and cross-sectional survey design studies which drew on small localised samples to gather the perspectives of various interdisciplinary members of the health care team. Notwithstanding these limitations, these studies offer a valuable contribution in understanding the complexities of implementing PEW systems. One level 4 study described a multi-centre multi-disciplinary collaborative improvement project conducted across 20 children’s hospital under the Child Health Corporation of America (Hayes et al. 2012). 4.0. SYSTEMATIC REVIEW RESULTS - CLINICAL SECTION 4.1. CLINICAL GUIDELINES The sourcing of clinical guideline documents was a particular challenge of the review. In total 11 guidelines and/or protocols related to PEWS systems were included in the review (Appendices 17-19). Ten of these derived from the UK (Mid-Essex 2009, Kettering 2011, Worcestershire 2011, Manchester 2011, Bristol 2012, Royal Cornwall 2012, Worcestershire 2013, East Cheshire 2013, Tameside 2014, Hillingdon 2014) and 1 from the USA (Institute for Clinical Systems Improvement 2009). In all instances, guidelines were developed for use in paediatric ward settings in district general hospitals located in trust areas. Guidelines were published between 2009 and 2014; 4 between March 2011 and January 2014 (Mid-Essex 2009, Kettering 2011, Manchester 2011, Worcestershire 2011, Tameside 2014) and 5 were scheduled to be reviewed between June 2015 and May 2017 (Royal Cornwall 2012, Bristol 2012, East Cheshire 2013, Worcestershire 2013, Hillingdon 2014). Of those reviewed, individuals involved in developing the guidelines ranges from including multiple unidentified paediatric nurses, ward sisters/managers, pharmacists, consultant paediatricians, member of a risk management team, pain management team lead, HDU ward team lead, a consultant paediatric intensivist, an education development practitioner, a children’s service manager, a resuscitation officer and a consultant anaesthetist. Guidelines varied widely, with each hospital trust area implementing revised PEWS tools utilising different parameters. Within guidelines a number of references were cited to provide justification of the guideline development; these included Monaghan (2005), Haines et al. (2006) and Tume (2007) for Mid-Essex 2009 guidelines; Duncan et al. (2006) for Kettering 2011 guidelines; Duncan et al. (2006) for Worcestershire 2011 protocol; Monaghan (2005) for East Cheshire 2013 guidelines; and Monaghan (2005) for Tameside 2014 guidelines. The Tameside (2014) guidelines developed their policy for paediatric services in line with their Clinical Care Outreach/PARS policy relating to adults. Both Worcestershire guidelines from 2011 and 2013 clearly state that all healthcare professionals must exercise their own professional judgement when using the guidelines and that any decision to vary from the guideline should be documented in patient records to include the reason for variance and the

(13/10/2014 Final Version) Page 22
subsequent action taken. In many cases these documents are plans to introduce guidelines therefore recommendations vary with the most common falling under the broader headings of ownership and responsibilities, standards, best practice, training, implementation, monitoring and auditing. Specific recommendations were defined in the Kettering (2011) guidelines, which included implementing an early warning scoring system, training staff on physiological observation procedures and their relevance, defining a twelve hour observation monitoring schedule, increasing observations if abnormal physiology is detected and developing and delivering a graded response strategy for patients identified as being at risk of clinical deterioration. See Appendices 17-19. 4.2. RESEARCH STUDIES In total, 70 papers were identified for inclusion in the review. We categorised the papers according to review papers (n=4); studies which focused specifically on paediatric early warning detection systems (n=25) (these included early warning detection systems specific for neonatal populations n=2 and for use in paediatric emergency departments n=4); studies which focused specifically on paediatric early warning response systems (n=21) (these included family activated response systems n=4); papers which specifically described the process of implementing paediatric early warning detection and response systems (n=6); studies that focused specifically on educational interventions for paediatric early warning detection and response systems (n=3); studies that specifically examined cultural, socio-technical and organisational factors impacting on the implementation of paediatric early warning detection and response systems (including situational awareness) (n=5); cross-sectional surveys that investigated the use, implementation and prevalence of paediatric early warning detection and response systems (n=4) and finally papers that specifically reported on the cost and cost-effectiveness of implementing paediatric early warning detection and response systems, or other relevant associated costs (n=2) (Appendix 34). Although, for many papers, there was cross-over between whether it could be classified, such as detection, response and/or implementation, we made a judgement on where best the papers would fit in the overall classification based on what we deemed to be the central focus of the paper (i.e. detection, response, implementation process). The papers included were;
4 literature review papers; 1 review examined early warning detection systems (Chapman et al. 2010) and 3 reviews examined early warning response systems (Winberg et al. 2008, Chan et al. 2010, vanderJagt 2013);
25 papers which focused specifically on detection systems for identify child clinical deterioration (Monaghan 2005, Duncan et al. 2006, Haines et al. 2006, Tume 2007, Bradman & Maconochie 2008, Edgell et al. 2008, Parshuram et al. 2009, Edwards et al. 2009, Akre et al. 2010, Roland et al. 2010, Edwards et al. 2011, Parshuram et al. 2011a, Parshuram et al. 2011b, Shaletzky et al. 2012, Tucker et al. 2009, Bell et al. 2013, Holmes et al. 2013, McLellan et al. 2013, Solevag et al. 2013, Robson et al. 2013, Seiger et al. 2013, Breslin et al. 2014, Fuijkschot et al. 2014, Sefton et al. 2014, Zhai et al. 2014);
o 2 of these 25 papers focused specifically on neonatal populations (Roland et al. 2010, Holmes et al. 2013) and 4 focused specifically to paediatric emergency department settings (Bradman & Maconochie 2008, Edgell et al. 2008, Seiger et al. 2013, Breslin et al. 2014);
21 papers focused specifically on response systems (Tibballs et al. 2005, Brilli et al. 2007, Sharek et al. 2007, Zenker et al. 2007, Hunt et al. 2008, Dean et al. 2008, Tibballs & Kinney 2009, Ray et al. 2009, VanVoorhis & Willis 2009, Hanson et al. 2010, Haque et al. 2010, Avent et al. 2010, Wang et al. 2010, Kotsakis et al. 2011, Bonafide et al. 2012, Hueckel et al. 2012, Theilen et al. 2013, Bonafide et al. 2014a, Lobos et al. 2014, Paciotti et al. 2014, Panesar et al. 2014);
o 4 of these 21 focused specifically on parent activated responses (Dean et al. 2008, Ray et al. 2009, Hueckel et al. 2012, Paciotti et al. 2014);

(13/10/2014 Final Version) Page 23
6 papers focused specifically on outlining the implementation process of the detection and/or response system for identification of child clinical deterioration (Demmel et al. 2010, Lobos et al. 2010, Randhawa et al. 2011, Hayes et al. 2012, McLellan & Connors 2013, Kukreti et al. 2014);
3 papers were specific to educational interventions (McCrory et al. 2012, Tume et al. 2013, McKay et al. 2013);
5 papers addressed cultural, socio-technical and organisational factors (Azzopardi et al. 2011, Bonafide et al. 2013a, Brady & Goldenhar 2013, Brady et al. 2013, Roberts et al. 2014);
4 papers were cross-sectional survey focusing on the use, implementation and prevalence of paediatric early warning detection and response systems (VandenBerg et al. 2007, Roland et al. 2014, Sen et al. 2013, Chen et al. 2014)
2 economic papers was sourced (Duncan & Frew 2009, Bonafide et al. 2014b) o Note: Both economic papers are referred to within the section on the economic
literature and budget impact analysis. Each of these will be dealt with in turn in the sections to follow. Appendix 34 4.3. CROSS-SECTIONAL SURVEYS ON THE USE, IMPLEMENTATION AND PREVALENCE OF PAEDIATRIC EARLY WARNING DETECTION AND RESPONSE SYSTEMS Study overview Four cross-sectional surveys were identified all of which reported on the use, implementation and prevalence of paediatric early warning detection and response systems (VandenBerg et al. 2007, Sen et al. 2013, Roland et al. 2014, Chen et al. 2014) (Refer to Appendix 28 for data extraction table). One survey was conducted in the UK (Roland et al. 2014), 2 in the U.S (Sen et al. 2013, Chen et al. 2014) and one in Canada (VanDenBerg et al. 2007). All four studies looked at early warning response systems in paediatric hospitals. One of the studies sought to determine the prevalence, characteristics, and opinions of RRTs in hospitals with PICUs in the United States (Chen et al. 2014), while another sought to determine the use of both paediatric early warning systems (PEWS) and rapid response teams (RRTs) in paediatric units in Great Britain (Roland et al. 2014). Another study describes the levels of care, the frequency of near or actual cardiopulmonary arrest (code-blue events), identification mechanisms, and responses to evolving critical illness in hospitalized children (VanDenBerg et al. 2007). The final study aimed to compare rapid response team efficacy across paediatric hospitals (Sen et al. 2013). Design, setting, participants All four studies used cross sectional surveys. One study surveyed both child and adult hospitals that care for children (Chen et al. 2014). One study identified all hospitals with inpatient paediatric services in Great Britain (n=157); 126 hospitals were classified as a district general hospital (DGH) and 31 as a tertiary hospital (Roland et al. 2014). One study surveyed both Canadian and American hospitals with >=50 paediatric acute care beds or >=2 paediatric wards (VanDenBerg et al. 2007). The final study selected 34 academic US paediatric hospitals by using the top US News and World Report rankings for participation (Sen et al. 2013). The four studies surveyed medical professionals two of which included medical directors of PICU’s (Chen et al, 2014, Sen et al. 2013) as well as Arrest Committee members (Sen et al. 2013), while another included resuscitation committee chairs, paediatric intensive care directors, and acute care clinical nurse specialists (VanDenBerg et al. 2007). In Roland et al. (2014) the electronic survey link was sent to the clinical directors of NHS trusts in England. In Scotland and Wales, the electronic survey link was sent to all college tutors by the office manager of the Royal College of Paediatrics and Child Health.
(13/10/2014 Final Version) Page 24
Survey/data collection All four studies developed surveys, two of which were telephone surveys (VanDenBerg et al. 2007, Sen et al. 2013). One was developed by two investigators and had 42 questions in total (VanDenBerg et al. 2007). Another survey instrument was designed by the primary investigator with input from a survey methodology expert and paediatric critical care content experts (Chen et al. 2014). One study created a survey in Survey Monkey which included questions in the 2005 PEWS survey as well as additional questions on the number of beds, composition of an RRT if used and derivation, auditing and validation of a PEWS tool if present. A question on the parameters used in PEWS was taken directly from the results of the 2005 survey with an additional field of ‘other’ with a free text response (Roland et al. 2014). Sen et al. (2013) selected 34 academic US paediatric hospitals for participation in a 62-question telephone survey. Two studies piloted their surveys (Chen et al. 2014, Roland et al. 2014). In one study surveys were pilot tested among critical care physicians at the primary investigator’s institution and edited for clarity (Chen et al. 2014). In the other study the survey was piloted on a small number of consultants known to use PEWS in their departments (Roland et al. 2014). Survey distribution varied across the studies. One was distributed over an 8 week period (Vandenberg et al. 2007). Another survey was distributed by three waves of contact from April 2010 through June 2010 (Chen et al. 2014). Similarly, another study distributed their survey over a three month period between March and May 2012 (Sen et al. 2013). In another study surveys were distributed between July 2011 and July 2012. In one study surveys were distributed online and by mail, with the option of responding via either route (Chen et al. 2014) and by telephone in two studies (VanDenBerg et al 2007, Sen et al. 2013). A short telephone survey was also completed with hospitals that had not completed the electronic survey (Roland et al. 2014). Regression analysis identified factors associated with the frequency of code-blue events after adjustment for hospital volume (VanDenBerg et al. 2007). Outcomes Each study had various outcomes. The first study found that of the 130 respondents, 103 (79%) hospitals had an RRT (Chen et al. 2014). Characteristics of these RRT’s included: all available 7 days a week, 24 hours a day; 80% of institutions had RRT that was separate from cardiopulmonary resuscitation team; typical patient events that would trigger RRT activation included respiratory distress (95%), circulatory issues such as shock or arrhythmia (90%), neurologic issues such as seizure or mental status changes (92%), and general concern from the ward staff regarding clinical status (85%); RRTs could be activated by families in 69% of the responding hospitals; automatic triggers (defined as activation of the RRT via predetermined changes in the patient’s vital signs or overall clinical status) were present in 34% of hospitals; and RRT composition had a median of 3 individual members (range: 2–8) including physicians (critical care attending physicians, critical care fellows hospitalists, and/or residents) in 77% of responding institutions. Of these teams, 47% included attending physicians, 37% included fellows and 55% included residents. Nurses (PICU, transport and/or ward) were present in 100% of teams and respiratory therapists in 89%. The RRT leader was either, a physician (63%), nurse (29%), nurse practitioner (3%), or a combination of these individuals (5%). Hospitals tracked the number of activations (96%) and outcomes associated with RRT’s (84%). Opinions: Respondents from institutions with RRTs were more likely to agree that RRTs improve patient safety than respondents from institutions without. They are more likely to disagree that RRTs are not worth the money invested and more likely to disagree that RRTs are not worth the staff invested. Early adopters of RRTs were more likely than late adopters to believe that RRTs reduce the number of codes on the wards. Among hospitals with RRTs, 81% answered that their ward teams felt comfortable activating an RRT, and 21% of respondents thought that their institutional RRT was underutilized.

(13/10/2014 Final Version) Page 25
In the second study 85% of units using PEWS /18% had an RRT in place (Roland et al. 2014). Tertiary units were more likely than district to have implemented PEWS, 90% versus 83%, and an RRT, 52% versus 10%. Large numbers of PEWS were in use, majority of which were unpublished and invalidated systems. Respiratory and heart rates were the two most common criterion used in the PEWS systems with over 50% of respondents using these and oxygen saturations, abnormal consciousness and effort of breathing. Implementation of PEWS inconsistent with large variation in the PEWS used, the activation criteria used, availability of an RRT and the membership of the RRT. The third study which carried out a survey found that of the responses from 388 (84%) hospitals identified the 181 eligible paediatric hospitals were included in this survey (VanDenBerg et al. 2007). All had a PICU, 99 (55%) had high-dependency units, 101 (56%) had extracorporeal membrane oxygenation therapy, and 69 (38%) used extracorporeal membrane oxygenation therapy for refractory cardiopulmonary arrest. All of the hospitals had immediate-response teams. They were activated 4676 times in the previous 12 months. Twenty-four percent of hospitals had activation criteria for immediate-response teams. Urgent-response teams to treat children who were clinically deteriorating but not at immediate risk of cardiopulmonary arrest were available in 136 (75%) hospitals; 29 (17%) had formal medical emergency teams, and 92 (51%) consulted the PICU. Code-blue events were more common in hospitals with extracorporeal membrane oxygenation therapy cardiopulmonary bypass, and larger PICU size. In the final study, thirty of the 34 hospitals were successfully contacted by a single investigator (response rate 88%). All 30 responding hospitals reported maintaining 24 hour/day–7 day/week arrest teams and RRTs. Roughly one-quarter (23%) provide additional support for RRTs, including salary support for fellows, nurses, or respiratory therapists. More than one-half (60%) of the hospitals reported receiving family-activated calls in 2011 (range, 3-12 calls). Almost one-half (47%) perform routine follow-up after RRT calls, most commonly within the first 6 hours (range, 1-48 hours). The hospitals reported a median of 130 RRT calls in 2011 (range, 11-664; n = 27), with a median rate of 4.3 RRT calls/1000 patient-days (range, 0.76-6; n = 9). More than one-half (57%) of the participating hospitals standardize their arrest rates to patient-days; 30% standardize the RRT calls similarly. A median of 52% of RRT calls led to PICU transfer (range, 25%-80%, n = 24). Almost three-quarters (73%) of the hospitals track RRT call times, with 82% reporting that the majority of calls occur in the daytime. 4.4. DETECTION SYSTEMS FOR IDENTIFICATION OF CHILD CLINICAL DETERIORATION Research Literature 4.4.1. Systematic Review Papers One systematic review was identified which focused on paediatric alert criteria (PAC) for identifying hospitalised children at risk of critical deterioration (Chapman et al. 2010). The purpose of the review was to identify the number and nature of published paediatric alert criteria and evaluate their validity, reliability, clinical effectiveness and clinical utility. Eleven studies were included in the review describing PAC published from 2005-2009; of which 10 described paediatric alert criteria, 6 described the introduction and use of the paediatric alert criteria in practise, 4 examined the development and testing of the paediatric alert criteria and one described both. The papers and PAC identified were:
1. Duncan 2006: developed an original tool in Canada for ages <3 to >12. Alert criteria were both age dependent and aggregate weighted with a total of 19 parameters. Regarding study design, the authors used a retrospective case control, expert opinion (modified Delphi method) which was of adequate quality.

(13/10/2014 Final Version) Page 26
2. Haines 2006: PAC was adapted from a paediatric and adult tool. Based in England. Intended for children aged 0 to >12. Type of alert criteria was age dependent and single parameter. There were a total of 14 parameters. Regarding design, authors used expert opinion and retrospective case control study using 360 cases with 180 controls which was of adequate quality.
3. Brilli 2007: developed an original tool covering all ages in the USA. Alert criteria were single parameter with a total of 7 parameters. The design was a retrospective case note review, expert consensus using 44 cases. Inadequate quality.
4. Hunt 2008: PAC developed an original tool for all ages in the USA. Alert criteria were single parameter with a total of 12 parameters.
5. Shilkofski 2007: developed an original tool for all ages in the USA. Alert criteria were single parameter with a total of 12 parameters (describing same as Hunt therefore 11 papers on 10 PAC).
6. Tibballs 2009: PAC was adapted from a paediatric tool used for patients aged ‘term’ to >12 years in Australia. Alert criteria were age dependent and single parameter with a total of 9 parameters.
7. Edwards developed an original tool for ages <1 year to 12 years in Wales University Hospital. Alert criteria were age dependent and single parameter with a total of 8 parameters. In terms of design, the authors used a prospective cohort study with 1000 cases. Adequate quality.
8. Monaghan 2005 PAC was adapted from an adult tool. Catered to all ages. Based in England. Alert criteria were ‘aggregated weight’ with a total of 5 parameters.
9. Tucker 2009: PAC was adapted from a paediatric tool. Catered to all ages. Based in the USA. Alert criteria were aggregate weighted with a total of 5 parameters. Design was prospective, descriptive with 2979 cases. Adequate quality.
10. Sharek 2007: PAC adapted from a paediatric tool. Catered to all ages. Based in the USA. Alert criteria were single parameter and a total of 6 parameters were used.
11. Tibballs 2005: PAC adapted from adult tool. Intended for ages ‘term’ to >12 years. Based in Australia. Alert criteria were age dependent and single parameter and a total of 9 parameters were used.
As shown above, the studies varied across all aspects of the paediatric alert criteria including the method of development and the number and type of component parameters. Five studies explored the predictive validity of the paediatric alert criteria but only 3 reported appropriate methodologies. One study evaluated reliability and none evaluated clinical utility of paediatric alert criteria, thus leading to the conclusion that the evidence supporting the validity, reliability and utility of paediatric alert criteria was weak. Other recommendations were the need for more studies to determine which physiological parameters or combinations of parameters best predict serious adverse events and a prospective evaluation of validity reliability and utility before widespread adoption. 4.4.2. Research Studies Overview of studies Nineteen papers specifically focused on the development and evaluation of PEWS tools for accurately detecting and/or timely identification of clinical/critical deterioration in children in general medical and surgical units (Akre et al. 2010, Bell et al. 2013, Duncan et al. 2006, Edwards et al. 2009, Edwards et al. 2011, Fuijkschot et al. 2014, Haines et al. 2006, McLellan et al. 2013; Monaghan 2005, Parshuram et al. 2009, Tucker et al. 2009, Parshuram et al. 2011a, Parshuram et al. 2011b, Robson et al. 2013, Sefton et al. 2014, Shaletzky et al. 2012, Solevag et al. 2013, Tume 2007, Zhai et al. 2014) (Refer to Appendix 20 for data extraction tables). In some instances specialist ward settings were identified including transplant, pulmonary, adolescent and endocrine units (Bell et al. 2013); oncology wards (Fuijkschot et al. 2014, Robson et al. 2013), cardiac units (Bell et al. 2013, McLellan et al. 2013) and one rehabilitation unit (Robson et al. 2013). Six studies emanated from the UK (Edwards et al. 2009, Edwards et al. 2011, Haines

(13/10/2014 Final Version) Page 27
et al. 2006, Monaghan 2005, Sefton et al. 2014, Tume 2007), 6 from the USA (Tucker et al. 2009, Akre et al. 2010, Bell et al. 2013, McLellan et al. 2013, Robson et al. 2013, Shaletzky et al. 2012), 1 from Netherlands (Fuijkschot et al. 2014), 4 from Canada (Duncan et al. 2006, Parshuram et al. 2009, Parshuram et al. 2011a, Parshuram et al. 2011b) and 1 from Norway (Solevag et al. 2013). With the exception of Parshuram et al. (2011a) who conducted a multicentre study across four children’s hospitals, all studies were conducted at local single site hospitals; with the majority being conducted in free-standing, tertiary children’s hospital settings with the exception of Parshurum et al. (2011b) who implemented the Bedside Paediatric Early Warning System in a 22-bed inpatient paediatric ward within a community hospital context.
Research designs The majority of studies were observational in design. Six studies employed cohort designs, of these four were conducted prospectively and two retrospectively. Six studies used case-control designs; four were conducted retrospectively and two prospectively. One study used a before and after cohort design. The remaining six studies were reported as descriptive audits, evaluations or chart reviews; two of which were prospectively performed and four were retrospective. Four studies also incorporated staff survey elements. See Table 3 below. Paediatric early warning system scoring tools Throughout these nineteen papers a number of original (n=7) and/or adopted/modified (n=8) paediatric early warning scoring systems were referred to, used and validated in paediatric in-patient settings (see Table 4 below). Two further studies compared the utility and validity of a number of different tools in detecting clinical deterioration in child populations (Tume 2007, Robson et al. 2013) and one study compared a newly developed EHR based automated algorithm to two PEWS scores (Zhai et al. 2014). Table 3: Detection systems: study research designs Author/ Research Design
Retrospective evaluation /audit/chart review
Prospective evaluation/audit/chart review
Prospective case control
Retrospective case control
Prospective cohort design
Retrospective cohort design
Before & after cohort study
Survey elements
Akre X
Bell X
Duncan x
Edwards 2009
x
Edwards 2011
x
Fuijkschot x x
Haines x
McLellan x
Monaghan X x
Parshuram 2009
x x
Parshuram 2011a
x x
Parshuram 2011b
x
Robson x
Sefton x
Skaletzky x
Solevag X
Tucker x
Tume x
Zhai x
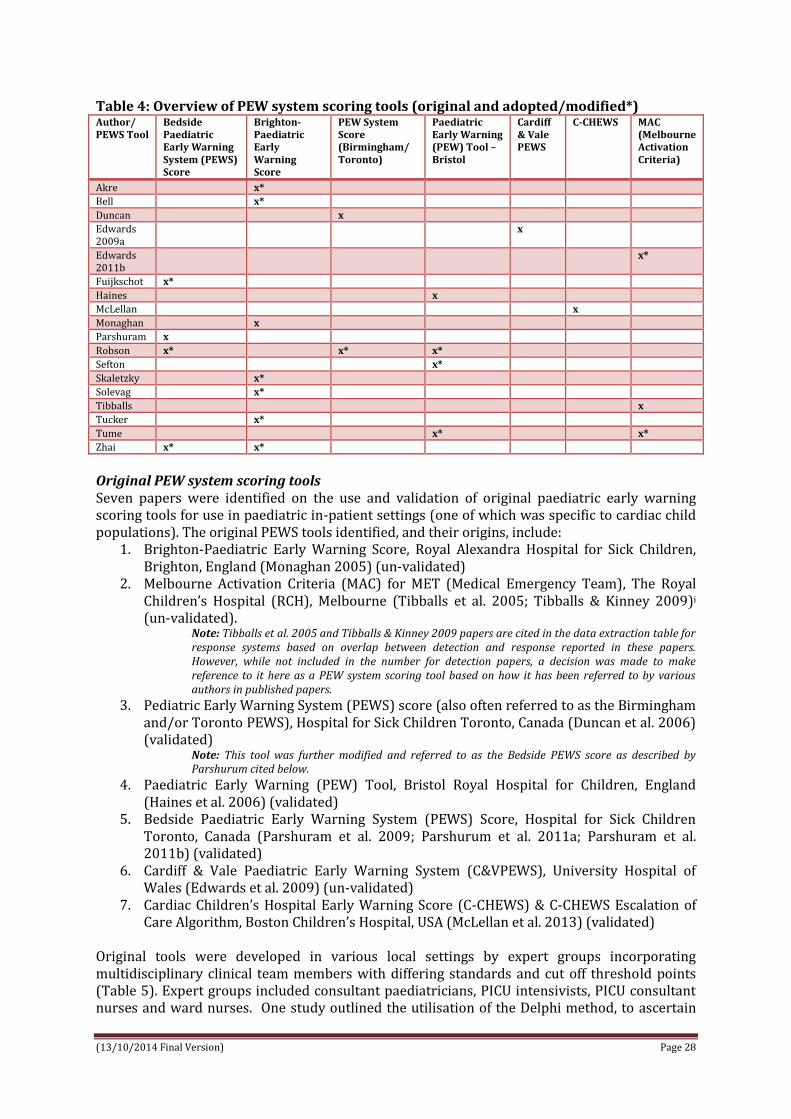
(13/10/2014 Final Version) Page 28
Table 4: Overview of PEW system scoring tools (original and adopted/modified*) Author/ PEWS Tool
Bedside Paediatric Early Warning System (PEWS) Score
Brighton-Paediatric Early Warning Score
PEW System Score (Birmingham/ Toronto)
Paediatric Early Warning (PEW) Tool – Bristol
Cardiff & Vale PEWS
C-CHEWS MAC (Melbourne Activation Criteria)
Akre x*
Bell x*
Duncan x
Edwards 2009a
x
Edwards 2011b
x*
Fuijkschot x*
Haines x
McLellan x
Monaghan x
Parshuram x
Robson x* x* x*
Sefton x*
Skaletzky x*
Solevag x*
Tibballs x
Tucker x*
Tume x* x*
Zhai x* x*
Original PEW system scoring tools Seven papers were identified on the use and validation of original paediatric early warning scoring tools for use in paediatric in-patient settings (one of which was specific to cardiac child populations). The original PEWS tools identified, and their origins, include:
1. Brighton-Paediatric Early Warning Score, Royal Alexandra Hospital for Sick Children, Brighton, England (Monaghan 2005) (un-validated)
2. Melbourne Activation Criteria (MAC) for MET (Medical Emergency Team), The Royal Children’s Hospital (RCH), Melbourne (Tibballs et al. 2005; Tibballs & Kinney 2009)i (un-validated).
Note: Tibballs et al. 2005 and Tibballs & Kinney 2009 papers are cited in the data extraction table for response systems based on overlap between detection and response reported in these papers. However, while not included in the number for detection papers, a decision was made to make reference to it here as a PEW system scoring tool based on how it has been referred to by various authors in published papers.
3. Pediatric Early Warning System (PEWS) score (also often referred to as the Birmingham and/or Toronto PEWS), Hospital for Sick Children Toronto, Canada (Duncan et al. 2006) (validated)
Note: This tool was further modified and referred to as the Bedside PEWS score as described by Parshurum cited below.
4. Paediatric Early Warning (PEW) Tool, Bristol Royal Hospital for Children, England (Haines et al. 2006) (validated)
5. Bedside Paediatric Early Warning System (PEWS) Score, Hospital for Sick Children Toronto, Canada (Parshuram et al. 2009; Parshurum et al. 2011a; Parshuram et al. 2011b) (validated)
6. Cardiff & Vale Paediatric Early Warning System (C&VPEWS), University Hospital of Wales (Edwards et al. 2009) (un-validated)
7. Cardiac Children’s Hospital Early Warning Score (C-CHEWS) & C-CHEWS Escalation of Care Algorithm, Boston Children’s Hospital, USA (McLellan et al. 2013) (validated)
Original tools were developed in various local settings by expert groups incorporating multidisciplinary clinical team members with differing standards and cut off threshold points (Table 5). Expert groups included consultant paediatricians, PICU intensivists, PICU consultant nurses and ward nurses. One study outlined the utilisation of the Delphi method, to ascertain

(13/10/2014 Final Version) Page 29
expert opinion and build consensus through a series of structured questions with feedback at each stage in the development of the PEWS score (Duncan et al. 2006). Table 5: Development of original PEW scoring systems PEWS tool How developed?
Brighton PEW Score Multidisciplinary working group developed on available adult systems which were not specified
Melbourne Activation Criteria Expert group; developed from adult criteria with age appropriate normal ranges
PEW System score (Birmingham/Toronto)
Expert group of nurses utilising a modified Delphi approach to achieve consensus on parameters and ranges
PEW Tool (Bristol) Expert group; pilot tool based on an un-validated tool developed at Derriford Hospital, Plymouth, UK, with modifications from criteria developed at Melbourne Children’s Hospital, Australia, and similar adult systems. Modifications were made by expert opinion of the investigating team including study research nurse, two supervisors, a PICU Intensivist and PICU Consultant Nurse.
Bedside PEW system score Expert group and statistical methods (evaluated alongside score comparison & score progression)
Cardiff & Vale PEW system C&VPEWS developed using physiological parameters based on the 2005 advanced paediatric life support (APLS) guidelines for recognition of the sick child. Expert group set up - general paediatricians, a regional nurse educator and a paediatric intensivist – who reviewed other early warning systems to modify age-related normal ranges and to identify other parameters for inclusion in the score. The group reached a consensus opinion to agree the eight parameters and trigger criteria.
C-CHEWS Expert group; developed from CHEWS - a multidisciplinary panel assessed which risk factors were unique to the cardiovascular patient population and incorporated these risks into a new tool resulting in (C-CHEWS)
As a consequence of diverse expert opinion groups developing PEWS scores in diverse contexts, there is, some, but, limited consistency across scoring systems in the number, type, classification of, scoring and calling criteria of the measurement parameters for paediatric early warning scoring systems (Table 6). Table 6: Measurement/scoring parameters of original PEW system score
Original PEW system score
Measurement/Scoring Parameters Action Algorithm/Calling Criteria/Triggers
1. Brighton PEWS (Monaghan 2005) 5 parameters Aggregrate score Score range 0-13
(1) Behaviour Playing/Appropriate (score 0) Sleeping ( score 1) Irritable (score 2) Lethargic/confused or Reduced response to pain
(score 3) (2) Cardiovascular
Pink or capillary refill 1-2 seconds (score 0) Pale or capillary refill 3 seconds (score 1) Grey or capillary refill 4 seconds. Tachycardia of 20
above normal rate (score 2) Grey and mottled or capillary refill 5 seconds or
above. Tachycardia of 30 above normal rate or bradycardia (score 3)
(3) Respiratory Within normal parameters, no recession or trachea
tug (score 0) >10 above normal parameters, using accessory
muscles, 30+% FiO2 or 4+ litres/min (score 1) >20 above normal parameters recessing, tracheal
tug. 40+% FiO2 or 6+ litres/min (score 2) 5 below normal parameters with sternal recession,
tracheal tug or grunting. 50% FiO2 or 8+ litres/min (score 3)
Child's total score dictates one of 4 actions: (i) informing nurse in charge (ii) increasing frequency of observations (iii) calling for medical review and informing the outreach team (iv) calling out the full medical team and outreach team If child's score in red column, or greater >4, the protocol recommends calling the full medical team
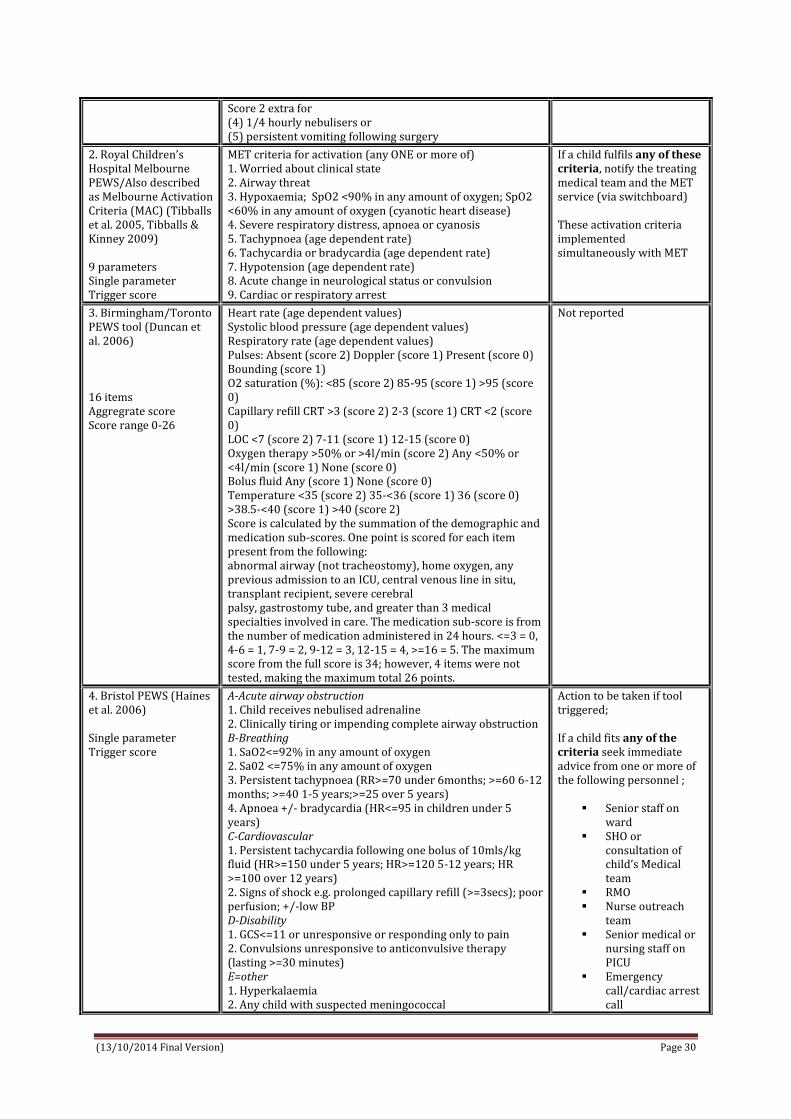
(13/10/2014 Final Version) Page 30
Score 2 extra for (4) 1/4 hourly nebulisers or (5) persistent vomiting following surgery
2. Royal Children’s Hospital Melbourne PEWS/Also described as Melbourne Activation Criteria (MAC) (Tibballs et al. 2005, Tibballs & Kinney 2009) 9 parameters Single parameter Trigger score
MET criteria for activation (any ONE or more of) 1. Worried about clinical state 2. Airway threat 3. Hypoxaemia; SpO2 <90% in any amount of oxygen; SpO2 <60% in any amount of oxygen (cyanotic heart disease) 4. Severe respiratory distress, apnoea or cyanosis 5. Tachypnoea (age dependent rate) 6. Tachycardia or bradycardia (age dependent rate) 7. Hypotension (age dependent rate) 8. Acute change in neurological status or convulsion 9. Cardiac or respiratory arrest
If a child fulfils any of these criteria, notify the treating medical team and the MET service (via switchboard) These activation criteria implemented simultaneously with MET
3. Birmingham/Toronto PEWS tool (Duncan et al. 2006) 16 items Aggregrate score Score range 0-26
Heart rate (age dependent values) Systolic blood pressure (age dependent values) Respiratory rate (age dependent values) Pulses: Absent (score 2) Doppler (score 1) Present (score 0) Bounding (score 1) O2 saturation (%): <85 (score 2) 85-95 (score 1) >95 (score 0) Capillary refill CRT >3 (score 2) 2-3 (score 1) CRT <2 (score 0) LOC <7 (score 2) 7-11 (score 1) 12-15 (score 0) Oxygen therapy >50% or >4l/min (score 2) Any <50% or <4l/min (score 1) None (score 0) Bolus fluid Any (score 1) None (score 0) Temperature <35 (score 2) 35-<36 (score 1) 36 (score 0) >38.5-<40 (score 1) >40 (score 2) Score is calculated by the summation of the demographic and medication sub-scores. One point is scored for each item present from the following: abnormal airway (not tracheostomy), home oxygen, any previous admission to an ICU, central venous line in situ, transplant recipient, severe cerebral palsy, gastrostomy tube, and greater than 3 medical specialties involved in care. The medication sub-score is from the number of medication administered in 24 hours. <=3 = 0, 4-6 = 1, 7-9 = 2, 9-12 = 3, 12-15 = 4, >=16 = 5. The maximum score from the full score is 34; however, 4 items were not tested, making the maximum total 26 points.
Not reported
4. Bristol PEWS (Haines et al. 2006) Single parameter Trigger score
A-Acute airway obstruction 1. Child receives nebulised adrenaline 2. Clinically tiring or impending complete airway obstruction B-Breathing 1. SaO2<=92% in any amount of oxygen 2. Sa02 <=75% in any amount of oxygen 3. Persistent tachypnoea (RR>=70 under 6months; >=60 6-12 months; >=40 1-5 years;>=25 over 5 years) 4. Apnoea +/- bradycardia (HR<=95 in children under 5 years) C-Cardiovascular 1. Persistent tachycardia following one bolus of 10mls/kg fluid (HR>=150 under 5 years; HR>=120 5-12 years; HR >=100 over 12 years) 2. Signs of shock e.g. prolonged capillary refill (>=3secs); poor perfusion; +/-low BP D-Disability 1. GCS<=11 or unresponsive or responding only to pain 2. Convulsions unresponsive to anticonvulsive therapy (lasting >=30 minutes) E=other 1. Hyperkalaemia 2. Any child with suspected meningococcal
Action to be taken if tool triggered; If a child fits any of the criteria seek immediate advice from one or more of the following personnel ;
Senior staff on ward
SHO or consultation of child’s Medical team
RMO Nurse outreach
team Senior medical or
nursing staff on PICU
Emergency call/cardiac arrest call

(13/10/2014 Final Version) Page 31
3. Any child with diabetic ketoacidosis 4. Any child whose condition is worrying
5. Bedside PEWS score (Parshuram et al. 2009, 2011) Aggregrate score Score range of 0-26 Cut-off score 8
Heart rate (age dependent) (score range 0,1,2,4) Systolic blood pressure (age dependent) (score range 0,1,2,4) Capillary refill time (<3seconds score 0; >=3 seconds score 4) Respiratory rate (age dependent) (score range 0,1,2,4) Respiratory effort (normal score 0; mild increase score 1; moderate increase score 2; severe increase / any apnoea score 4) Transcutaneous oxygen saturation (>94% score 0; 91-945 score 1; <=90 score 2) Oxygen therapy (room air score 0; any to <4L/min or <50% score 2; >=4L/min or >=50% score 4)
Not reported
6. Cardiff & Vale PEWS tool ( Edwards et al. 2009) 8 Parameters; each scored 0 if normal and 1 if abnormal (overall score between 0-8) (Was evaluated as both a single and as a multiple parameter trigger)
(1) Airway threat e.g. stridor (2) Oxygen required, any amount, to keep saturations greater than 90% (3) Respiratory rate outside age dependent criteria (4) Abnormal respiratory observation e.g. recession or accessory muscles used (5) Bradycardia or tachycardia range outside age dependent criteria (6) Blood pressure outside age dependent range (7) Level of consciousness (A=alert; V= voice; P=pain; U=unresponsive) (8) Nurse or doctor worried about clinical state
Not reported
7. Cardiac Children’s Hospital Early Warning Score (C-CHEWS) (McLellan et al. 2013) Aggregrate score
C-CHEWS score ≥ 3 requires immediate action by the patient’s team of clinicians
Behaviour/Neuro: Playing/Sleeping appropriate/alert at patient’s baseline (score 0); Sleeping, somnolent when not disturbed ( score 1); Irritable, difficult to console, increase in patients baseline seizure activity ( score 2); Lethargic/confused, floppy, reduced response to pain, prolonged or frequent seizure, pupils asymmetric or sluggish (score 3) Cardiovascular: Skin tone appropriate for patient, capillary refill <=2 seconds (score 0); Pale, capillary refill 3-4 seconds, mild tachycardia, intermittent ectopy or irregular heart rhythm (not new) (score 1); Grey, capillary refill 4-5 seconds, moderate tachycardia (score 2); Grey and mottled, capillary refill >5 seconds, severe bradycardia, new onset bradycardia, new onset/increase in ectopy, irregular heart rhythm or heart block (score 3) Respiratory: Within normal parameters, no retractions (score 0); mild tachypnoea, mild increased work of breathing (flaring, retracting), up to 40% supplemental oxygen via mask, up to IL NC > patient’s baseline need, mild desaturation (<5 below patient baseline), intermittent apnoea self-resolving (score 1); moderate tachypnoea, moderate increased work of breathing (flaring, retracting, grunting, use of accessory muscles), 40-60% oxygen via mask, 1-2L NC > patient’s baseline need, nebs q 1-2hours, moderate desaturation (<10 below patient baseline), apnoea requiring repositioning or stimulation (score 2); severe tachypnoea, RR below normal for age, severe increased work of breathing (head bobbing, paradoxical breathing), > 60% oxygen via mask, > 2L NC > patient’s baseline need, nebs q 30min-1hr, severe desaturation (<15 below patient baseline), apnoea requiring interventions other than repositioning or stimulation (score 3) Staff Concern (concerned score 1) Family Concern (concerned or absent score 1)
C-CHEWS Escalation of Care Algorithm 0-2 green Continue assessment every 4 hours 3-4 yellow Notify charge nurse and MD/NP Discuss treatment plan as a team Increase frequency of assessment of care Consider a higher level of care (ICP) > 5 red MD/NP evaluate at bedside Notify attending physician Discuss treatment plan as a team Consider activation of 8 South Evaluation via charge nurse and possibly ICU transfer For immediate assistance at any time – Cardiac Code

(13/10/2014 Final Version) Page 32
Adapted/modified PEWS scoring tools Eight studies reported adopting and/or using modified versions of originally developed PEW scoring systems to validate for application in their own specific child hospital setting, population groups and for different end points; including,
1. Children’s Hospitals and Clinics of Minnesota, USA adopted the Brighton PEWS originally described by Monaghan (Akre et al. 2010)
2. University Hospital of Wales adapted the Melbourne Activation Criteria (MAC) from Tibballs & Kinney 2009 (Edwards et al. 2011)
3. Miami Children’s Hospital, Miami, Florida; validated a modified version of Brighton PEWS originally described by Monaghan (Skaletzky et al. 2012)
4. Cincinnati Children’s Hospital, USA; validated modified version of Brighton PEWS tools which originally described by Monaghan (Tucker et al. 2009)
5. Texas Children’s Hospital modified the Brighton PEWS originally described by Monaghan and validated by Tucker et al. and entitled it the Paediatric Advanced Warning Score (PAWS) (Bell et al. 2013)
6. Akershus University Hospital, Norway; translated and modified the Brighton PEWS originally described by Monaghan (Solevag et al. 2013)
7. Radboudumc Amalia Children’s Hospital Netherlands; modified PEWS based on Parshurum’s Bedside PEW system score (Fuijkschot et al. 2014)
8. Alder Hey Children’s NHS Trust Foundation UK adapted a modified Bristol PEWS previously validated by Haines et al. (Sefton et al. 2014)
Five studies validated modified versions of the Brighton PEWS tool initially described by Monaghan in 2005 (Tucker et al. 2009, Akre et al. 2010, Bell et al. 2013, Skaletzky et al. 2012, Solveg et al. 2013). This most frequently adopted tool, the Brighton PEW score (Monaghan 2005) was originally un-validated with no outcomes reported. The tool was piloted for three months in a 24 bed medical surgical unit using an audit tool to capture patient observations. A staff survey collected data on the usefulness of the PEWS system. Over 88% of staff felt that the PEWS improved their confidence in recognising children at risk. One study modified Parshuram’s Bedside PEW system score (Fuijkschot et al. 2014). One study adopted the Bristol PEWS originally developed by Haines et al. (Sefton et al. 2014) and one study adopted the Melbourne Activation Criteria (MAC) for MET described originally by Tibballs et al. 2005 (Edwards et al 2011). Modifications to the various PEW scoring systems ranged from no modifications (e.g. Edwards et al. 2001) to minor wordings changes (e.g. Akre et al. 2010); exclusion of parameters such as nebulisation and vomiting (e.g. Skaletsky); addition of parameters such as temperature (e.g. Fuijkschot et al. 2014), AVPU (e.g. Solevag et al. 2013) and oxygen saturations and diaphoresis (e.g. Bell et al. 2013); simplifying parameter definitions (e.g. Fuijkschot et al. 2014); reordering parameters (e.g. Solevag et al. 2013) and changing scoring criteria (e.g. Bell et al. 2013); all illustrating the limited consensus on the number, type, classification of, scoring and calling criteria of the measurement parameters for paediatric early warning scoring systems (Table 7). Table 7: Measurement/scoring parameters of adopted/modified PEW system score
MODIFIED PEW system score
MODIFICATIONS to Measurement/Scoring Parameters
Akre et al. (2010) Modified Brighton PEWS (Monaghan 2005)
Slight wording modifications as highlighted in bold/italic below: 1) Behaviour: Playing/Appropriate (score 0); Sleeping ( score 1); Irritable ( score 2); Lethargic/confused or reduced response to pain (score 3) (2) Cardiovascular: Pink or capillary refill 1-2 seconds (score 0); Pale or dusky or capillary refill 3 seconds (score 1); Grey or cyanotic or capillary refill 4 seconds OR Tachycardia of 20 above normal rate (score 2); Grey or cyanotic and mottled or capillary refill 5 seconds or above OR Tachycardia of 30 above normal rate or bradycardia (score 3) (3) Respiratory: Within normal parameters, no retractions (score 0); >10 above

(13/10/2014 Final Version) Page 33
normal parameters OR using accessory muscles OR 30+% FiO2 or 3+ litres/min (score 1); >20 above normal parameters OR retractions OR 40+% FiO2 or 6+ litres/min (score 2); >=5 below normal parameters with retractions or grunting OR 50+% FiO2 or 8+ litres/min (score 3) Score 2 extra for every 15min nebs (includes continuous nebs) or persistent post-op vomiting
Edwards et al. (2011) adopted MAC from Tibballs
No modifications were made MET criteria for activation (any ONE or more of) 1. Nurse or doctor worried about clinical state 2. Airway threat 3. Hypoxaemia; SpO2 <90% in any amount of oxygen; SpO2 <60% in any amount of oxygen (cyanotic heart disease) 4. Severe respiratory distress, apnoea or cyanosis 5. Tachypnoea (age dependent rate) 6. Tachycardia or bradycardia (age dependent rate) 7. Hypotension (age dependent rate) 8. Acute change in neurological status or convulsion 9. Cardiac or respiratory arrest
Brighton PEWS modified from Monaghan (2005) by Skaletzky et al. (2012)
Slight wording modifications as highlighted in bold/italic below: 1) Behaviour: Playing/Smiling (score 0); Irritable, consolable ( score 1); Irritable, inconsolable ( score 2); Lethargic/confused or Decreased response to pain (score 3) (2) Cardiovascular: Pink or capillary refill 1-2 seconds (score 0); Pale or capillary refill 3 seconds (score 1); Grey or capillary refill 4 seconds OR Tachycardia of 20 above normal rate (score 2); Grey and mottled or capillary refill 5 seconds or above OR Tachycardia of 30 above normal rate or bradycardia (score 3) (3) Respiratory: Within normal parameters, no retractions (score 0); >10 above normal parameters OR using accessory muscles OR 30+% FiO2 or 3+ litres/min (score 1); >20 above normal parameters OR retractions OR 40+% FiO2 or 6+ litres/min (score 2); 5 RR below normal parameters with retractions and/or grunting OR 50+% FiO2 or 8+ litres/min (score 3) Did not include nebulisers and vomiting items thus overall maximum score was 9.
Brighton PEWS modified from Monaghan (2005) by Tucker et al. (2009)
Slight wording modifications as highlighted in bold/italic below: (1) Behaviour: Playing/Appropriate (score 0); Sleeping ( score 1); Irritable ( score 2); Lethargic/confused or Reduced response to pain (score 3) (2) Cardiovascular: Pink or capillary refill 1-2 seconds (score 0); Pale or capillary refill 3 seconds (score 1); Grey or capillary refill 4 seconds. OR Tachycardia of 20 above normal rate (score 2); Grey and mottled or capillary refill 5 seconds or above. OR Tachycardia of 30 above normal rate or bradycardia (score 3) (3) Respiratory: Within normal parameters, no recession (score 0); >10 above normal parameters, using accessory muscles, OR 30+% FiO2 or 3+ litres/min (score 1); >20 above normal parameters retractions 40+% FiO2 or 6+ litres/min (score 2); 5 below normal parameters with retractions OR 50% FiO2 or 8+ litres/min (score 3) Score 2 extra for (4) 1/4 hourly nebulisers or (5) persistent vomiting following surgery Algorithm incorporated tiered response to scores; increased PEWS or responded to increased allocation of resources to patient. Score 0–2 = no additional intervention; Score 3 = senior RN assess patient; Score 4 = bedside RN notify the paediatric resident of the patient’s PEWS; Score 5 = senior RN /paediatric resident assess the patient; Score 6 = senior RN, paediatric resident, and senior resident assess the patient at the bedside; Score 7 or above = bedside RN activate the hospital’s MET
Brighton PEWS modified from Monaghan (2005) by Bell et al. (2013); modified tool titled Texas PAWS 3 parameters
Behaviour, cardiovascular, respiratory Modification made to respiratory parameter; Pulse oximetry added as the monitor for breathing instead of the litres of oxygen per minute. No change was made to the respiratory rate criteria but respiratory parameter changed to include changes in oxygen saturations within baseline limits, 5 points below baseline, or more than 5 points below baseline. Changes were made to the scoring criteria descriptors in the behaviour parameter; Removed category 1 term “sleeping” as a descriptor of behaviour, felt term did not

(13/10/2014 Final Version) Page 34
Each can score 0-3 points; additional 2 points if respiratory treatments are needed every hour (versus every 15 minutes with PEWS) or if there is persistent vomiting following surgery. Highest possible cumulative score is 13
sufficiently capture early symptoms of deterioration in mental status. It was replaced with “irritable (consolable)” Category 2 changed to “irritable (inconsolable)” as felt that irritable (consolable) behaviour usually precedes irritable (inconsolable) behaviour and are better descriptors of the observed behaviour seen during deterioration. Category 3 descriptors remained “lethargic/ confused” “Reduced response to pain” descriptor in category 3 removed because considered late sign of progression to clinical deterioration. Changes to cardiovascular category: Diaphoresis added to cardiovascular parameter in category 2 as an early warning symptom for deterioration (heart failure). This addition to the cardiovascular parameter was made to accommodate deterioration in large population of cardiac patients.
Brightom PEWS modified by Solevag et al. (2013)
Modifications made include: The Brighton PEWS was translated to Norwegian The order of the 3 items (behaviour, cardiovascular, and respiratory) was changed to match the ABCD algorithm (airway, breathing, circulation, disability). The AVPU (Alert, Voice, Pain, Unresponsive) scoring system was incorporated for the assessment of disability/behaviour The scoring system was divided into 1) respiratory, 2) circulatory, and 3) behavioural signs of clinical deterioration, which were scored on a scale from 0 to 3 for each parameter. Respiratory rate and heart rate are assessed according to the normal range of values for different age categories, as defined by Akre et al. Two additional ‘points’ are awarded if either continuous inhalation medications or continuous positive airway pressure (CPAP) are being administered, and 2 additional points for presence of persisting postoperative vomiting. Score ranges from 0 to 13
Bedside PEW systems core modified from Parshuram et al.(2011) by Fuijkschot et al. (2014) 8 parameters Scoring range 0-28
Added temperature to scoring system (addition of maximal 2 points to the total score of a patient) expecting to increase PEWS performance, especially in sepsis. Other minor adjustments made to adapt system to setting and improve user-friendliness included a simplified definition of work of breathing (normal or mildly, moderately, severely increased) and supplemental oxygen (room air, low-flow or high-flow supplemental oxygen). e.g. 3months-1year Heart rate (age dependent) (score range 0,1,2,4) Systolic blood pressure (age dependent) (score range 0,1,2,4) Capillary refill time (<3seconds score 0; >=3 seconds score 4) Respiratory rate (age dependent) (score range 0,1,2,4) Respiratory effort (normal score 0; mild increase score 1; moderate increase score 2; severe increase / any apnoea score 4) Transcutaneous oxygen saturation (>94% score 0; 91-94% score 1; <91% score 2) Oxygen therapy (room air score 0; low flow oxygen score 2; NRB-mask score 4) Temperature 36.5-37.5 score 0; 36-36.4 or 37.6-38.5 score 1; <36 or >38.5 score 2
Bristol PEWS modified by Sefton et al. (2014) The tool is triggered if any one of the parameters are breached.
A-Acute airway obstruction (seek prompt assistance) 1. Child receives nebulised adrenaline OR no improvement after nebulised adrenaline 2. Clinically tiring or impending complete airway obstruction B-Breathing 1. SaO2<=92% in any amount of oxygen 2. Sa02 <=75% in any amount of oxygen (cyanotic heart disease) 3. Persistent tachypnoea (RR>=70 under 6months; >=60 6-12 months; >=40 1-5 years;>=25 over 5 years) 4. Apnoea +/- bradycardia (HR<=95 in children under 5 years) 5. Marked increased effort of breathing (3+ on table front sheet) 6. Respiratory depression RR<20 0-3months, <=half lower value for resps for age (table front sheet) C-Cardiovascular 1. Persistent tachycardia following one bolus of 10mls/kg fluid (HR>=150 under 5 years; HR>=120 5-12 years; HR >=100 over 12 years) 2. Poor perfusion; prolonged capillary refill (>=3secs); +/-low BP, large central/peripheral temp gradient

(13/10/2014 Final Version) Page 35
Two further studies were identified which compared the utility and validity of a number of different tools in detecting clinical deterioration in child populations. These included;
1. At the Children’s Hospital Central California, USA, Robson et al. (2013) compared the differences in variables measured across three tools; Parshuram’s Bedside PEWS Score, Haines et al.’s PEWS Tool, and Duncan et al.’s PEW System Score.
2. At a specialist children’s hospital in the North West of England, Tume (2007) retrospectively matched children’s physiological data against two PEW tools - the Bristol PEWS tool described by Haines et al. and the Royal Children’s Hospital Melbourne Australia PEWS/Melbourne Activation Criteria for MET tool described by Tibballs et al. 2005 to ascertain whether child observations would have ‘triggered’ one of these tools and thus be of potential use in their patient group/setting.
Following their audit and prospective chart review of clinical observations Tume (2007) adopted an unmodified version of the Bristol PEWS for future use in the specialist children’s hospital in the North West of England. Robson et al.’s (2013) study in the US compared the validity (sensitivity and specificity) of three original paediatric early warning system scores - the Pediatric Early Warning System (PEWS) score (Duncan et al. 2006); the Paediatric Early Warning (PEW) Tool (Haines et al. 2006) and the Bedside Paediatric Early Warning System (PEWS) Score (Parshuram et al. 2009) in predicting acute care patients at risk of impending or actual cardiopulmonary arrest. In their study population, Robson et al. (2013) found that the Pediatric Early Warning System (PEWS) score (Duncan et al. 2006) was a stronger predictor (sensitivity 86.6% and specificity 72.9% at a score of 5; AUROC 0.85 P<0.05) of cardiopulmonary than either the Paediatric Early Warning (PEW) Tool (Haines et al. 2006) or the Bedside Paediatric Early Warning System (PEWS) Score (Parshuram et al. 2009). However, notwithstanding this, Robson et al. (2013) highlights that the challenge associated with the Pediatric Early Warning System (PEWS) score (Duncan et al. 2006), with its large number of parameters, is its utility at clinical level. One study in the USA (Cincinnati Children’s Hospital) conducted a retrospective case control study develop and compare the effectiveness a newly developed EHR-based automated algorithm with two published Paediatric Early Warning Scores (PEWS) (i.e. the Brighton PEWS by Monaghan and the Bedside PEWS by Parshurum) to predict the need for Paediatric Intensive Care Unit (PICU) transfer in the first 24 h of admission (Zhai et al. 2014). The performance of
D-Disability 1. GCS<=11 or falling. Children score by AVPU; responding only to pain or unresponsive 2. Fitting; unexpected OR not responding to prescribed anticonvulsants E=other 1. Hyperkalaemia K>=6.0mmol/Litre 2. Any child with pH <7.2 whatever the cause 3. Any child with unresolved pain on current analgesic therapy 4. Any child whose condition is worrying – but not triggering on above parameters Action to be taken if PEW tool is triggered Tool does not replace clinical judgement. If a child is deteriorating rapidly or periarrest put out an arrest call immediately. Medical review expected within 30 minutes, within 10 minutes if it is an airway trigger; otherwise
Alert nurse in charge on ward Increase frequency of observations Notify patients own medical team Out of hours contact the call team and inform Night Matron Complete PEW tool assessment on meditech under nursing assessment Children triggering PEW must be discussed with registrar

(13/10/2014 Final Version) Page 36
the new algorithm on a held-out test data set was also evaluated. Zhai et al. (2014) used the first 24 hours of inpatient encounters at a children’s hospital, existing clinical data in the EHR and machine learning to develop and validate a prediction algorithm for PICU transfer of hospitalized patients in the first 24 hours. Through a process using expert clinician opinion, categorization and machine learning, the authors built a model consisting of 29 variables for predicting PICU transfer. The algorithm achieved a 0.912 (95% CI 0.905–0.919) AUC in the test set. This result was statistically significantly higher than application of two existing PEWS in the test data set (Brighton & Bedside PEWS). Age dependent reference range values for physiological measurements All PEW scoring systems record measurements of the rate of various physiological vital signs such as heart rate, respiratory rate, systolic blood pressure and temperature. These rates are then converted to numerical scores by applying age specific reference range values or thresholds. However, not only were the reference range values, where cited, diverse across studies (Table 8), the source of evidence underpinning the specifically selected ‘optimal’ physiological measurement thresholds was often unclear, scarce, lacking and/or based on clinical consensus. Yet, having accurate reference ranges are not only key to assessing whether vital signs are abnormal but also influence the validity of the PEWS scoring system – if thresholds are set too high there is the risk of missing a clinical deteriorating child, whereas if thresholds are too low there is the risk of over-diagnosis (Fleming et al. 2011, Bonafide et al. 2013b, Seiger et al. 2013). While some authors cite the APLS cut-off levels for physiological measurements, recent publications recommend updating reference ranges for vital signs with new thresholds (Fleming et al. 2011, Bonafide et al. 2013b). For instance, in a UK systematic review of 69 studies with heart rate data for 143,346 children and respiratory rate data for 3881 well children in non-hospital settings, Fleming et al. (2011) found a striking disagreement when comparing centiles with existing published reference ranges for heart rate and respiratory rate; limits from published ranges frequently exceeded the 99th and 1st centiles, or crossed the median. To assist the development of cut-off values for use in clinical settings, Fleming et al. (2011) provide suggested values for heart rate and respiratory rate for 13 age groups between birth and 18 years of age. In their cross-sectional survey, Bonafide et al. (2013b) examined six months of nurse electronically documented heart (n=116,383) and respiratory (n=116,383) rates of 14,014 unwell children on general medical and surgical wards at two tertiary-care children’s hospitals in the US. Using this data, Bonafide et al. (2013b) developed, validated and compared percentile curves with EWS parameters and textbook reference ranges. The results indicated that up to 54% of heart and 40% of respiratory rate observations were outside textbook reference ranges and up to 38% of heart and 30% of respiratory rate observations would have resulted in increased early warning systems scores. Bonafide et al. (2013b) contended that their newly developed percentiles could serve as useful references for clinicians to inform the development of evidence-based vital sign parameters for physiological monitor alarms, inpatient electronic health record vital sign alerts, medical emergency team calling criteria, and EWSs.
Table 8: Age dependent reference range values for physiological measurements
Original PEW system score Age dependent reference ranges for physiological measurements
1. Brighton PEWS (Monaghan 2005) Note: These reference ranges were cited in Akre and Solevag and were not originally reported in Monaghan and/or Tucker; thus in originally reporting this tool it relied on staff knowing the age appropriate normal
Heart Rate at rest Newborn (birth – 1 month) 100-180 Infant (1-12 months) 100-180 Toddler (13 months – 3 years) 70-110 Preschool (4-6 years) 70-110 School (7-12 years) 70-110 Adolescent (13-19 years) 55-90 Respiratory rate at rest

(13/10/2014 Final Version) Page 37
ranges for HR, and RR. Skaletzky also adopted the Brighton PEWS, however used different age groupsing and reference range values for HR and RR. They also categorised HR into awake and sleeping.
Newborn (birth – 1 month) 40-60 Infant (1-12 months) 35-40 Toddler (13 months – 3 years) 25-30 Preschool (4-6 years) 21-23 School (7-12 years) 19-21 Adolescent (13-19 years) 16-18
2. Royal Children’s Hospital Melbourne PEWS/Also described as Melbourne Activation Criteria (MAC) (Tibballs et al. 2005, Tibballs & Kinney 2009)
Age Respiratory rate Term-3 months >60 4-12 months >50 1-4 years >40 5-12 years >30 12 years+ >30 Age Heart rate Term-3 months <100 >180 4-12 months <100 >180 1-4 years <90 >160 5-12 years <80 >140 12 years+ <60 >130 Age BP (systolic) Term-3 months <50 4-12 months <60 1-4 years <70 5-12 years <80 12 years+ <90
3. Birmingham/Toronto PEWS tool (Duncan et al. 2006)
Age specific items for heart rate (HR), respiratory rate (RR), systolic blood pressure (SBP) <3months HR <90 (score 2) 90-109 (score 1) 110-150 (score 0) 151-180 (score 1) >180 (score 2) RR <20 (score 2) 20-29 (score 1) 30-60 (score 0) 61-80 (score 1) >80 (score 2) SBP <50 (score 2) 50-59 (score 1) 60-80 (score 0) 81-100 (score 1) >100 (score 2) 3-12months HR <80 (score 2) 80-99 (score 1) 100-150 (score 0) 151-170 (score 1) >170 (score 2) RR <20 (score 2) 20-24 (score 1) 25-50 (score 0) 51-70 (score 1) >70 (score 2) SBP <70 (score 2) 70-79 (score 1) 80-100 (score 0) 99-120 (score 1) >120 (score 2) 1-4years HR <70 (score 2) 70-89 (score 1) 90-120 (score 0) 121-150 (score 1) >150 (score 2) RR <15 (score 2) 15-19 (score 1) 20-40 (score 0) 41-60 (score 1) >60 (score 2) SBP <75 (score 2) 75-89 (score 1) 90-110 (score 0) 111-125 (score 1) >125 (score 2) 4-12years HR <60 (score 2) 60-69 (score 1) 70-110 (score 0) 111-130 (score 1) >130 (score 2) RR <12 (score 2) 12-19 (score 1) 20-30 (score 0) 31-40 (score 1) >40 (score 2) SBP <80 (score 2) 80-90 (score 1) 90-120 (score 0) 120-130 (score 1) >130 (score 2) >12years HR <50 (score 2) 50-59 (score 1) 60-100 (score 0) 101-120 (score 1) >120 (score 2) RR <8 (score 2) 8-11 (score 1) 12-16 (score 0) 15-24 (score 1) >24

(13/10/2014 Final Version) Page 38
(score 2) SBP <86 (score 2) 85-101 (score 1) 100-130 (score 0) 131-150 (score 1) >150 (score 2)
4. Bristol PEWS (Haines et al. 2006)
Persistent tachypnoea; RR>=70 under 6months; >=60 6-12 months; >=40 1-5 years;>=25 over 5 years) Apnoea +/- bradycardia; (HR<=95 in children under 5 years) Persistent tachycardia following one bolus of 10 mls/kg fluid; (HR≥150 under 5 years; HR≥120 5-12 years; HR≥100 over 12 years)
5. Bedside PEWS score (Parshuram et al. 2009, 2011a, 2011b)
Heart rate (bpm) 0 to < 3 months; > 110 & <150 (score 0) ≥150 or ≤110 (score 1) ≥180 or ≤ 90 (score 2) ≥ 190 or ≤ 80 (score 4) 3 to < 12 months; > 100 & <150 (score 0) ≥ 150 or ≤100 (score 1) ≥ 170 or ≤ 80 (score 2) ≥ 180 or ≤ 70 (score 4) 1-4 years; > 90 & < 120 (score 0) ≥ 120 or ≤ 90 (score 1) ≥ 150 or ≤ 70 (score 2) ≥ 170 or ≤ 60 (score 4) > 4-12 years; > 70 & < 110 (score 0) ≥ 110 or ≤ 70 (score 1) ≥ 130 or ≤ 60 (score 2) ≥ 150 or ≤ 50 (score 4) > 12 years; > 60 & < 100 (score 0) ≥ 100 or ≤ 60 (score 1) ≥ 120 or ≤ 50 (score 2) ≥ 140 or ≤ 40 (score 4) Systolic blood pressure (mmHg) 0 to < 3 months; > 60 & < 80 (score 0) ≥ 80 or ≤ 60 (score 1) ≥ 100 or ≤ 50 (score 2) ≥ 130 or ≤ 45 (score 4) 3 to < 12months; > 80 & < 100 (score 0) ≥ 100 or ≤ 80 (score 1) ≥ 120 or ≤ 70 (score 2) ≥ 150 or ≤ 60 (score 4) 1 to 4 years; > 90 & < 110 (score 0) ≥ 110 or ≤ 90 (score 1) ≥ 125 or ≤ 75 (score 2) ≥ 160 or ≤ 65 (score 4) > 4 to 12 years; > 90 & < 120 (score 0) ≥ 120 or ≤ 90 (score 1) ≥ 140 or ≤ 80 (score 2) ≥ 170 or ≤ 70 (score 4) > 12 years; > 100 & < 130 (score 0) ≥ 130 or ≤ 100 (score 1) ≥ 150 or ≤ 85 (score 2) ≥ 190 or ≤ 75 (score 4) Respiratory rate (breaths/minute) 0 to < 3 months; > 29 & < 61 (score 0) ≥ 61 or ≤ 29 (score 1) ≥ 81 or ≤ 19 (score 2) ≥ 91 or ≤ 15 (score 4) 3 to < 12 months; > 24 or < 51 (score 0) ≥ 51 or ≤ 24 (score 1) ≥ 71 or ≤ 19 (score 2) ≥ 81 or ≤ 15 (score 4) 1 to 4 years; > 19 or < 41 (score 0) ≥ 41 or ≤ 19 (score 1) ≥ 61 or ≤ 15 (score 2) ≥ 71 or ≤ 12 (score 4) > 4 to 12 years; > 19 or < 31 (score 0) ≥ 31 or ≤ 19 (score 1) ≥ 41 or ≤ 14 (score 2) ≥ 51 or ≤ 10 (score 4) > 12 years; > 11 or < 17 (score 0) ≥ 17 or ≤ 11 (score 1) ≥ 23 or ≤ 10 (score 2) ≥ 30 or ≤ 9 (score 4)
6. Cardiff & Vale PEWS tool ( Edwards et al. 2009)
Respiratory rate 20-50 (<1yr) 15-45 (1-2yr) 15-40 (2-5yr) 10-35 (5-12yr) 10-30 (>12) Heart rate 90-160 (<1yr) 80-150 (1-2yr) 75-140 (2-5yr) 60-120 (5-12yr) 55-100 (>12) Blood pressure 70-90 (<1yr) 80-95 (1-2yr) 80-100 (2-5yr) 90-110 (5-12yr) 100-120 (>12)

(13/10/2014 Final Version) Page 39
Performance criteria of paediatric early warning scoring systems Performance criteria (i.e. sensitivity, specificity, receiver operating characteristic curve, positive predictive value, negative predictive value) were reported in 12 of the 19 papers that focused on paediatric early warning detection systems (Table 9). These performance criteria are used to evaluate the validity of the data produced from the PEWS screening tool (sensitivity and specificity) and the feasibility of the PEWS screening tool (positive and negative predictive values). Drawing on the work of Tucker et al. (2009) and Robson et al. (2013) these criteria are defined below;
Sensitivity is the ability of a PEWS tool to correctly identify children who are clinical deteriorating (however this is defined by each individual study such as CPA, unplanned ICU transfer/admission) (i.e. the probability of testing positive (scoring high) on the PEWS screening tool when the outcome measure is truly present).
Specificity is the ability of the tool to demonstrate a low score in children who are not clinical deteriorating (i.e. the probability of testing negative on the PEWS screening tool (scoring low) when the outcome measure is truly absent. Low specificity indicates high rate of false positives).
The most effective PEWS screening tool would demonstrate both high sensitivity and high specificity with the receiver operating characteristic curve (ROC) demonstrating the balance between sensitivity and specificity. As sensitivity increases specificity will decrease and vice versa. A tool that correctly identifies children who are clinical deteriorating and those who are not with 100% accuracy would give an area under the ROC (AUROC) of one. The closer AUROC is to one, the better the tool will perform in correctly identifying child clinical deterioration.
Positive predictive value (PPV) is the probability that a child is truly clinically deteriorating given that they scored a high PEWS.
Negative predictive value (NPV) is the probability that a child is not clinically deteriorating given that they scored low on the PEWS tool.
Different settings adopted and self-regulated different markers and/or endpoints for clinical deterioration (i.e. code blue call, PICU admission, death, and interventions), resulting in multiple threshold scores and wide ranging sensitivity and specificity percentage values (Table 8). It is rare to identify PEWS triggers that have both a high in sensitivity and specificity. In the majority of instances sensitivity was sacrificed for specificity and vice versa. Additionally the sensitivity and specificity of PEWS scores to detect deterioration may depend not only on the score itself but also on definition of deterioration used in the study (e.g. Duncan et al. 2006, Skaletzky et al. 2012). One study, Duncan et al. (2006) reported favourable scores with 78% sensitivity and 95% specificity and an AUROC curve at 90%. However the score itself is complex, with numerous variables and a score of between 0-26. As a result the tool may not be as user-friendly as simpler versions (e.g. Monaghan 2005) and may be less likely to be completed in full. The Bedside PEWS is the only PEW system score identified that was validated in multi-sites with a large child patient population; other validation studies were conducted with small child patient ranges in single hospital sites with variable outcomes. The Bedside PEWS was initially developed and validated by Duncan et al. (2006) at the Hospital for Sick Children Toronto (titled the Pediatric Early Warning System (PEWS) score). This PEWS score was further modified and referred to as the Bedside PEWS score which was further validated by Parshurum et al. (2009) at the Hospital for Sick Children Toronto. Following this, the performance (validity & feasibility) of the Bedside PEWS score was described in a larger population (n=2074; including n=686 patients with adverse events; n=305 code blue events and n=381 patients urgently admitted ICU without code blue events) across multi-sites; four paediatric hospital sites (3 in Canada and 1 in the UK). This case control study, alongside retrospective survey interviews of nurses’ global ratings of risk of a clinical deterioration event, reported a sensitivity of 64% and a specificity of
7. Cardiac Children’s Hospital Early Warning Score (C-CHEWS) (McLellan et al. 2013)
Respiratory Rate/Heart Rate classified as mild, moderate or severe for age, however no reference range values are provided. Mild: Infant >=10%; Toddler and Child >=10% Moderate: Infant >=15%; Toddler and Child >=25% Severe: Infant >=25%; Toddler and Child >=50%
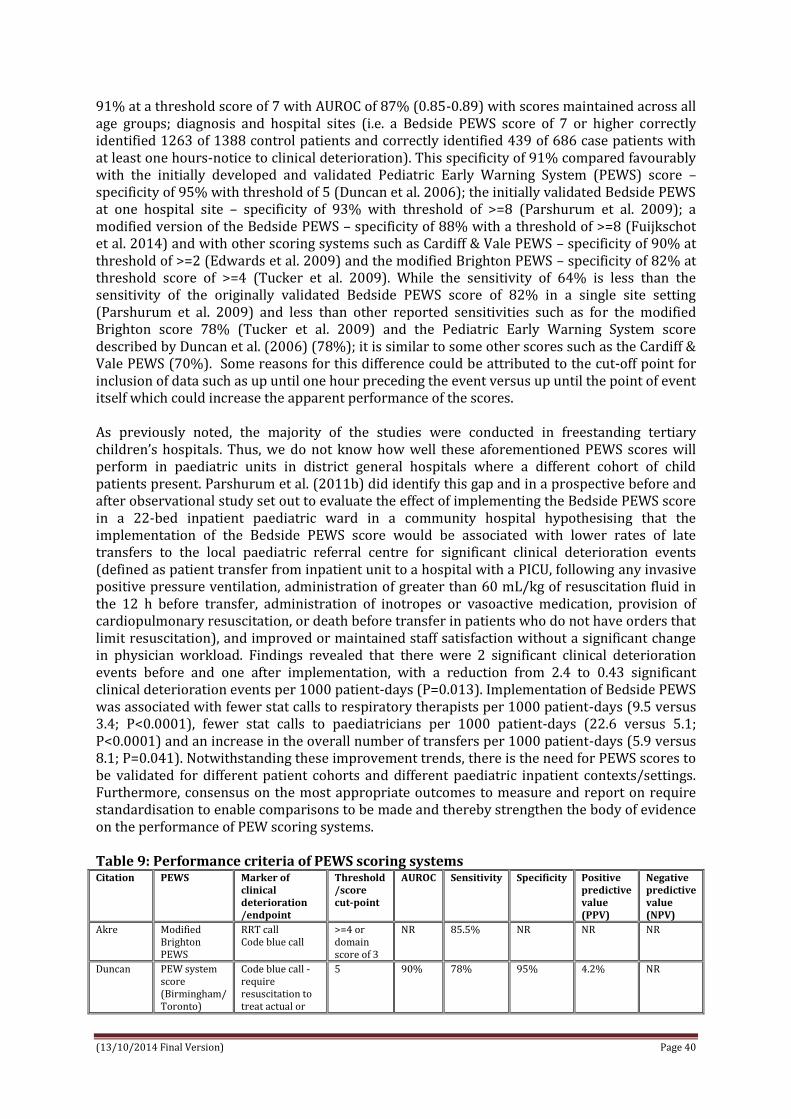
(13/10/2014 Final Version) Page 40
91% at a threshold score of 7 with AUROC of 87% (0.85-0.89) with scores maintained across all age groups; diagnosis and hospital sites (i.e. a Bedside PEWS score of 7 or higher correctly identified 1263 of 1388 control patients and correctly identified 439 of 686 case patients with at least one hours-notice to clinical deterioration). This specificity of 91% compared favourably with the initially developed and validated Pediatric Early Warning System (PEWS) score – specificity of 95% with threshold of 5 (Duncan et al. 2006); the initially validated Bedside PEWS at one hospital site – specificity of 93% with threshold of >=8 (Parshurum et al. 2009); a modified version of the Bedside PEWS – specificity of 88% with a threshold of >=8 (Fuijkschot et al. 2014) and with other scoring systems such as Cardiff & Vale PEWS – specificity of 90% at threshold of >=2 (Edwards et al. 2009) and the modified Brighton PEWS – specificity of 82% at threshold score of >=4 (Tucker et al. 2009). While the sensitivity of 64% is less than the sensitivity of the originally validated Bedside PEWS score of 82% in a single site setting (Parshurum et al. 2009) and less than other reported sensitivities such as for the modified Brighton score 78% (Tucker et al. 2009) and the Pediatric Early Warning System score described by Duncan et al. (2006) (78%); it is similar to some other scores such as the Cardiff & Vale PEWS (70%). Some reasons for this difference could be attributed to the cut-off point for inclusion of data such as up until one hour preceding the event versus up until the point of event itself which could increase the apparent performance of the scores. As previously noted, the majority of the studies were conducted in freestanding tertiary children’s hospitals. Thus, we do not know how well these aforementioned PEWS scores will perform in paediatric units in district general hospitals where a different cohort of child patients present. Parshurum et al. (2011b) did identify this gap and in a prospective before and after observational study set out to evaluate the effect of implementing the Bedside PEWS score in a 22-bed inpatient paediatric ward in a community hospital hypothesising that the implementation of the Bedside PEWS score would be associated with lower rates of late transfers to the local paediatric referral centre for significant clinical deterioration events (defined as patient transfer from inpatient unit to a hospital with a PICU, following any invasive positive pressure ventilation, administration of greater than 60 mL/kg of resuscitation fluid in the 12 h before transfer, administration of inotropes or vasoactive medication, provision of cardiopulmonary resuscitation, or death before transfer in patients who do not have orders that limit resuscitation), and improved or maintained staff satisfaction without a significant change in physician workload. Findings revealed that there were 2 significant clinical deterioration events before and one after implementation, with a reduction from 2.4 to 0.43 significant clinical deterioration events per 1000 patient-days (P=0.013). Implementation of Bedside PEWS was associated with fewer stat calls to respiratory therapists per 1000 patient-days (9.5 versus 3.4; P<0.0001), fewer stat calls to paediatricians per 1000 patient-days (22.6 versus 5.1; P<0.0001) and an increase in the overall number of transfers per 1000 patient-days (5.9 versus 8.1; P=0.041). Notwithstanding these improvement trends, there is the need for PEWS scores to be validated for different patient cohorts and different paediatric inpatient contexts/settings. Furthermore, consensus on the most appropriate outcomes to measure and report on require standardisation to enable comparisons to be made and thereby strengthen the body of evidence on the performance of PEW scoring systems. Table 9: Performance criteria of PEWS scoring systems Citation PEWS Marker of
clinical deterioration /endpoint
Threshold /score cut-point
AUROC Sensitivity Specificity Positive predictive value (PPV)
Negative predictive value (NPV)
Akre Modified Brighton PEWS
RRT call Code blue call
>=4 or domain score of 3
NR 85.5% NR NR NR
Duncan PEW system score (Birmingham/ Toronto)
Code blue call - require resuscitation to treat actual or
5 90% 78% 95% 4.2% NR
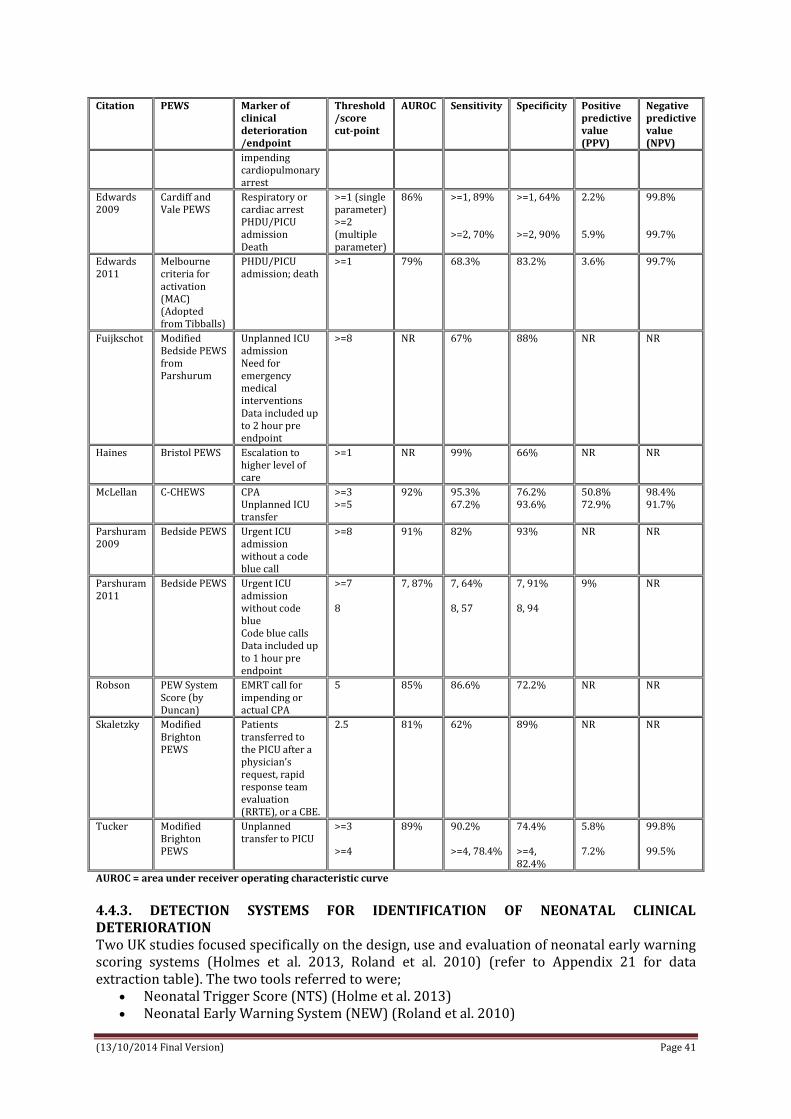
(13/10/2014 Final Version) Page 41
Citation PEWS Marker of clinical deterioration /endpoint
Threshold /score cut-point
AUROC Sensitivity Specificity Positive predictive value (PPV)
Negative predictive value (NPV)
impending cardiopulmonary arrest
Edwards 2009
Cardiff and Vale PEWS
Respiratory or cardiac arrest PHDU/PICU admission Death
>=1 (single parameter) >=2 (multiple parameter)
86%
>=1, 89% >=2, 70%
>=1, 64% >=2, 90%
2.2% 5.9%
99.8% 99.7%
Edwards 2011
Melbourne criteria for activation (MAC) (Adopted from Tibballs)
PHDU/PICU admission; death
>=1 79% 68.3% 83.2% 3.6% 99.7%
Fuijkschot Modified Bedside PEWS from Parshurum
Unplanned ICU admission Need for emergency medical interventions Data included up to 2 hour pre endpoint
>=8 NR 67% 88% NR NR
Haines Bristol PEWS Escalation to higher level of care
>=1 NR 99% 66% NR NR
McLellan C-CHEWS CPA Unplanned ICU transfer
>=3 >=5
92% 95.3% 67.2%
76.2% 93.6%
50.8% 72.9%
98.4% 91.7%
Parshuram 2009
Bedside PEWS Urgent ICU admission without a code blue call
>=8 91% 82% 93% NR NR
Parshuram 2011
Bedside PEWS Urgent ICU admission without code blue Code blue calls Data included up to 1 hour pre endpoint
>=7 8
7, 87% 7, 64% 8, 57
7, 91% 8, 94
9% NR
Robson PEW System Score (by Duncan)
EMRT call for impending or actual CPA
5 85% 86.6% 72.2% NR NR
Skaletzky Modified Brighton PEWS
Patients transferred to the PICU after a physician’s request, rapid response team evaluation (RRTE), or a CBE.
2.5 81% 62% 89% NR NR
Tucker Modified Brighton PEWS
Unplanned transfer to PICU
>=3 >=4
89% 90.2% >=4, 78.4%
74.4% >=4, 82.4%
5.8% 7.2%
99.8% 99.5%
AUROC = area under receiver operating characteristic curve
4.4.3. DETECTION SYSTEMS FOR IDENTIFICATION OF NEONATAL CLINICAL DETERIORATION
Two UK studies focused specifically on the design, use and evaluation of neonatal early warning scoring systems (Holmes et al. 2013, Roland et al. 2010) (refer to Appendix 21 for data extraction table). The two tools referred to were;
Neonatal Trigger Score (NTS) (Holme et al. 2013) Neonatal Early Warning System (NEW) (Roland et al. 2010)

(13/10/2014 Final Version) Page 42
Neonatal Early Warning System (NEW) (Roland et al. 2010) At Derriford hospital (a network neonatal intensive care unit within the Peninsula Neonatal network), Roland et al. (2010) conducted a retrospective review over a two year period of observations on neonatal unit babies to compare key observations with proposed early warning criteria to determine whether assessment would have altered management. Alongside this, Roland et al. (2010) undertook a three month prospective study where at risk babies (ARNI) were observed using the NEW chart to determine effectiveness of the clinical tool. A questionnaire to obtain midwives qualitative view of the process was also conducted. Roland et al. (2010) piloted an observation chart with prompts to aid identification of ARNI’s. Physiological observations included temperature, pulse, respiratory rate, breathing/conscious level. Observation values were classified into red (significantly abnormal), amber (abnormal) or green (normal) ranges. The values used were an amalgam of those found in standard neonatal textbooks. Clinical observations of ARNIs were plotted on NEW chart to gauge whether pre-identified trigger criteria would have prompted earlier medical review. Retrospective Review: The initial audit conducted identified 122 term infants, 51% of these infants fulfilled ARNI criteria. Eighty-four per cent were correctly identified as such. Only 48% (25/52) of those infants recognised as being ARNIs had observations recorded, but half would have been reviewed earlier (13/25) by a neonatal doctor or nurse practitioner if their observations had been charted on the NEW chart. Of the babies admitted not classified as ARNIs, few had observations recorded (5/55 – 8%). This audit was of infants admitted to the NICU and does not contain data on those infants who were safely discharged home. Based on this data the decision to conduct a prospective study was made. Also, retrospective review results were used to inform educational programme (presentations & written material) which was aimed at maternity unit clinical staff. It was designed to raise awareness of NEW programme, familiarise staff with NEW chart and structure of the proposed study (Roland et al. 2010). Prospective Review: An increase in retrievable observations from 48% in the retrospective audit to 72% in the prospective audit was observed. NEW chart threshold criteria prompted management decisions in nine (47.3%) of 19 infants who required intervention. The chart was considered beneficial by a majority of midwives; comments included chart increased awareness of normal parameters for a newborn with 50% responding that the chart was overcomplicated suggesting a different style might be easier to interpret (Roland et al. 2010). Neonatal Trigger Score (NTS) (Holme et al. 2013) The second study was conducted in a neonatal unit in Whittington Health, London by Holme et al. (2013). This was a case cohort study with two groups of neonates; ‘well’ and ‘not well’. The ‘not well’ group consisted of neonates that required admission to NICU. The ‘well’ group included neonates that did not require admission to NICU. Holme et al. (2013) developed The Neonatal Trigger Score (NTS) which was developed by expert group consensus and guidance from the Neonatal Life Support (2010), the National Institute for Clinical Excellence Postnatal Care and a neonatal scoring chart provided by Flannigan and Hogan (2011; as cited by Holmes et al. 2013). The NTS included 5 compulsory measures of temperature, heart rate, respiratory rate, respiratory distress, and conscious level as well as additional objective measures if indicated by past history such as pre-feed blood glucose level. Each parameter scored a minimum of 0, with maximum scores ranging from 1 to 3. The score from each separate parameter was then combined to generate a cumulative score (min 0, max 15). Sensitivity and specificity of NTS was evaluated, including receiver operating (ROC) curves determining its ability to differentiate between well neonates and those requiring NICU

(13/10/2014 Final Version) Page 43
admission and intervention for different score cut-offs. Admission to NICU was the outcome measure for this study. Scores were calculated for 485 neonates. NTS score area under ROC was 0.924 with a threshold score of 2 or more predicting need for admission to NICU with 79.3% sensitivity and 93.5% specificity. Mean NTS significantly was higher for neonates in group 1 ‘unwell’ (2.8 compared with mean 0.35 in group 2 ‘well’, P <.001). NTS out-performed PEWS, with significantly better sensitivity, particularly in neonates who deteriorated within the first 12 hours after birth (P <.001) or in neonates with sepsis or respiratory symptoms (P < .001). 4.4.4. DETECTION SYSTEMS FOR IDENTIFICATION OF CLINICAL DETERIORATION IN PAEDIATRIC EMERGENCY DEPARTMENTS Four studies focused specifically on the validation of PEWS for use in paediatric emergency department settings (Bradman & Maconochie 2008, Breslin et al. 2014, Edgell et al. 2008, Seiger et al. 2013) (refer to Appendix 22 for data extraction table). All of the studies were conducted in single sites; 2 were conducted in the UK (Bradman & Maconochie 2008, Edgell et al. 2008); 1 in the USA (Breslin et al. 2014) and 1 in Netherlands (Seiger et al. 2013). Two studies were described as retrospective audits or pilot evaluations (Bradman & Maconochie 2008, Edgell et al. 2008) and 2 were prospective observational studies (Breslin et al. 2014, Seiger et al. 2013). Population sample sizes ranged from 95 (Edgell et al. 2008) to 383 (Breslin et al. 2014), 424 (Bradman & Maconochie 2008), and 17,943 (Seiger et al. 2013). Bradman & Maconochie (2008) and Breslin et al. (2014) both examined the validity of the Brighton PEWS tool for use in the emergency department; whereas Edgell et al. (2008) designed and determined the validity of a new tool entitled the ‘Paediatric Advanced Warning Score (PAWS)’ and Seiger et al. (2013) compared the performance of ten different PEWS (i.e. authored by Monaghan, Akre, Skaletzky, Duncan, Egdell, Parshuram, Tibballs, Edwards, Haines, Brilli) for use in paediatric emergency departments. The outcomes measured across these studies were the prediction of ICU admission (Breslin et al. 2014, Edgell et al. 2008, Seiger et al. 2013) and/or hospital admission (Bradman & Maconochie 2008, Breslin et al. 2014, Seiger et al. 2013) in children visiting paediatric emergency departments. With a low sensitivity (37% with a PEWS score of >=2 and 24% for a PEWS score of >=4), (specificity for threshold of 4 or more 96%), Bradman & Maconochie (2008) found the Brighton PEWS of limited value in predicting children presenting to emergency department need for hospital admission. In their prospective observational study, to test the hypothesis that higher PEWS at time of emergency department disposition would be associated with a need for higher level of care (discharge, acute care unit, ICU), Breslin et al. (2014) found that a PEWS score of 1 or more had a maximum discriminant ability for predicting acute care admission (sensitivity 63%; specificity 68%) and a PEWS score of 3 or more had a maximum discriminant ability for predicting ICU admission (sensitivity 56%; specificity 72%). Breslin et al. reported that this poor discriminate ability of the Brighton PEWS meant that it was not be possible to establish a single cut point that distinguished patients requiring intensive care from those requiring acute care and those requiring admission or discharge. They contended that a PEW score of 1 or greater was not a clinically useful cut-off, while a PEW score of 2 of greater cut-off would miss the majority of patients requiring admission in addition to identifying a subgroup of patients with more than a two-fold increased probability of admission. By contrast, using their newly designed Paediatric Advanced Warning Score (PAWS), Egdell et al. (2008) found in their pilot study that at a threshold trigger score of 3 PAWS could discriminate between cases requiring admission directly to PICU and controls admitted directly to the general paediatric ward from the emergency department (sensitivity 70%; specificity 90%; AUROC curve 0.86 (p 0.0001)). However, in a larger prospective study comparing the performance of ten different PEWS to predict ICU or hospital admission of children visiting the emergency department, Seiger et al. (2013) reported wide variability in sensitivity (range 61.3-94.4 for ICU admission and 36.4-85.7 for hospital admission; AUROC moderate to good 0.6-0.82)

(13/10/2014 Final Version) Page 44
and specificity (range 25.2-86.7 for ICU admissions and 27.1-90.5 for hospital admission; AUROC poor to moderate 0.56-0.68) of PEWS tools at optimal cut-off levels. While none of the PEWS tools were high for both sensitivity and specificity, Seiger et al. (2013) contended that PEWS can be useful to detect children presenting to emergency department in need of ICU admission (although not necessarily hospital admission), however they remained cautious in recommending early warning systems as triage tools to priortise patients based on the lack of evidence on patient outcomes and cost analysis comparing PEWS to conventional triage tool systems. They did identify that scoring systems using numeric values, as opposed to trigger systems requiring just one positive parameter, were better able to identify patients at risk. Highlighting that the characteristics of the different PEWS scoring systems were not statistically different, Seiger et al. (2013) recommended when selecting the best PEWS for use in paediatric emergency departments that attention also be given to other factors such as ease of use, and that before implementation the scoring system should be evaluated for the individual setting. 4.4.5. Grey Literature Three further PEWS systems were identified through grey literature; these included;
Paediatric Observation Priority Score (POPS), Children’s Hospital Early Warning Score (CHEWS), Boston Children’s Hospital, USA STARSHIP PEWS CHART, Starship Children’s Hospital, Auckland, New Zealand
Paediatric Observation Priority Score (POPS): POPS is an aggregate early warning scoring system designed for emergency department use (Kelly et al. 2013). POPS is a method of identifying children with potentially serious illnesses requiring hospital admission and supporting staff in redirecting and/or safely discharging children who do not need ongoing care (NHS Health Education East Midlands 2014). As a checklist (including heart rate, respiratory rate and temperature, work of breathing, oxygen saturations, level of alertness, nurses’ gut feeling and other), it enables all staff, of any level of experience, to risk assess and prioritise children at the entry point to emergency healthcare. Each variable (n=8 in total) is assigned a score between 0-2 (i.e. a normal heart rate for child’s age would score 0 whereas a very high rate would score 2) (overall score range between 0-16). POPS was originally developed by Dr Damian Roland and Dr Ffion Davies in 2009 and implemented initially into three paediatric emergency department at Leicester Royal Infirmary, Mansfield and Derby. POPS was independently adopted in the emergency department of North Manchester General Hospital and findings from a conference presentation outline how useful POPS was to predict the likelihood of admission from the emergency department (Kelly et al. 2013). Physiological and observational data were collected retrospectively to calculate POPS on 2068 children <16 years over a 1-month period presenting to a paediatric emergency department at a UK District General Hospital. The effect of POPS at first presentation on admission to hospital within the subsequent 72 hours was investigated. POPS had a statistically significant positive effect on admission. A one point increase in POPS was associated with a 70% increase in the odds ratio (OR) of admission (p<0.001), with an area under the ROC of 0.72 (medical patients OR 1.67, area under ROC 0.73, p<0.001; trauma patients OR 1.77, area under ROC 0.69, p<0.001). The sensitivity and specificity of POPS to predict admission likelihood were: POPS≥2 (sensitivity 50% (predicts 50% of children should be admitted), specificity 85% (predicts 85% of children should be discharged)), POPS≥3 (sensitivity 36%, specificity 93%).
The external validity of POPS has also been tested in 3 other UK emergency departments (Bath, Bristol, Gloucestershire) who prospectively collected data (n=1659 data points) on initially recorded POPS score (i.e. a 0,1,2 score against heart rate, respiratory rate, temperature, saturations, work of breathing, AVPU, past medical history and nursing overall gut feeling) (NHS Health Education East Midlands 2014). These scores were matched against outcomes of discharge, admission and admission for > 24 hours revealing an overall admission rate of 33.8%

(13/10/2014 Final Version) Page 45
across the 3 sites and 12.8% for admission greater than 24 hours. The ROC curve was 0.752 for prediction of admission for greater than 24 hours with categories of 0-1,2-4,5-8 and 8+. A POPS of < 2 predicted 94.3% of children who were discharged or admitted for less than 24 hours. This ROC curve is similar to that of Kelly et al. (2013), reported above. Boston Children’s Hospital Early Warning Score (CHEWS) (Kleinman & Romano 2010). CHEWS adapted from an existing PEWS system (i.e. Monaghan) and included the objective domains of neurology, respiratory and cardiovascular and subjective measure of staff/family concern. The overall score total range was 0-11 with a score of 0-2 representing minimal concern and a score of >=5 indicating a sign of at risk of clinical deterioration. CHEWS is linked to an action algorithm; 0-2 green continue assessment every 4 hours; 3-4 yellow bedside nurse to notify charge nurse and primary resident team who discuss patient condition and plan of care, frequency of monitoring increased with evaluation by ICU team advised; >=5 red nurse requests primary resident evaluation of patient at bedside, notifies attending physicians of change in patient, if patient quickly deteriorating any member can activate RRT or code team. CHEWS piloted on inpatient surgical wards alongside enhanced nurse education on recognition of deteriorating child and RRT. Following implementation on surgical units (comprising of approximately 90 inpatient beds) an increase in the number of RRT activations was observed with a stretch of 202 days without a cardiorespiratory arrest achieved. Subsequent to this CHEWS implemented on all units and the electronic health record was modified to support CHEWS integration. An education campaign with physicians was undertaken. CHEWS was developed and implemented as one aspect of a campaign to prevent inpatient cardiac arrests. This led to development of C-CHEWS (Cardiac Children’s Hospital Early Warning Score) and C-CHEWS Escalation of Care Algorithm. STARSHIP PEWS CHART was implemented into clinical practice in May 2014 (Starship Children’s Hospital, Auckland, New Zealand). In developing the new chart, a local working group considered PEW score charts from a number of health systems including; Bedside PEWS (the chart used during the EPOCH trial); South Island Alliance Child Health PEWS; PEWS chart currently used in South Island of New Zealand; Queensland Health Children’s Early Warning Tool (Australian); New South Wales Health (Australian) and Birmingham Children’s Hospital. The following principles were used in developing the chart; most up to date early warning score evidence where available; most up to date physiological normative data available; “human factors” research to maximize usability; best aspects of other existing charts; aimed for the chart to work in the local clinical environment and ensured consistency with existing Starship policies and procedures (e.g. code calls, nursing practice guidelines already in use in Starship).
Chart Design:
4 charts for age groups 0-11 months; 1-4 years; 5-11 years; > 12 years Observations are documented on the chart by plotting points on the graphs to see trends
over time. Any observations outside the range of the graph are written as a number. New parameters for heart rate, respiratory rate and systolic BP have been used. These
have been based on more recent cohort data for normal ranges for children in hospital (Bonafide 2013 published in American Academy of Pediatrics)
7 parameters make up the score – heart rate; systolic BP; capillary refill; respiratory rate; respiratory distress; oxygen saturations and oxygen delivery.
There are 4 scores (0,1,2,4) + E for emergency call There is a 4 stage escalation pathway: Total score 0-3; 4-5; 6-7; 8+ Chart colours are linked with code calls already embedded in practice in Starship; pink
zone (consider code pink i.e. medical emergency team call (up to 15 minute response from team); blue zone (call code blue – paediatric emergency call (immediate response from team).
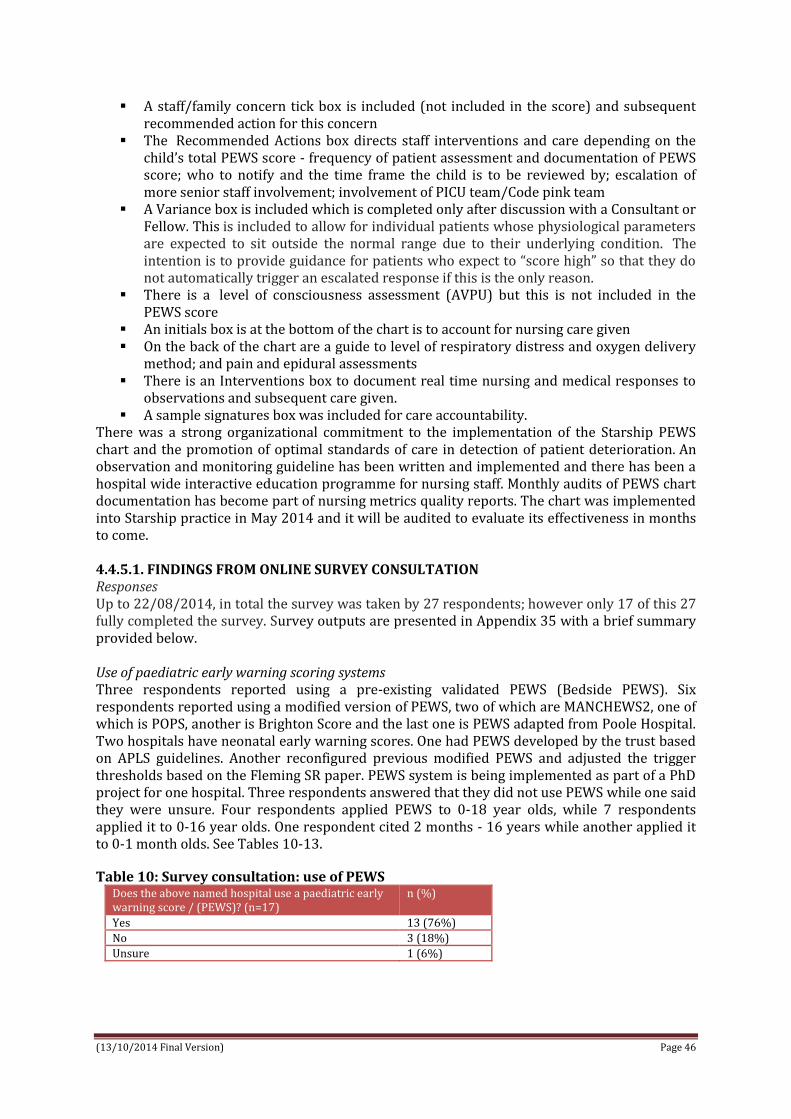
(13/10/2014 Final Version) Page 46
A staff/family concern tick box is included (not included in the score) and subsequent recommended action for this concern
The Recommended Actions box directs staff interventions and care depending on the child’s total PEWS score - frequency of patient assessment and documentation of PEWS score; who to notify and the time frame the child is to be reviewed by; escalation of more senior staff involvement; involvement of PICU team/Code pink team
A Variance box is included which is completed only after discussion with a Consultant or Fellow. This is included to allow for individual patients whose physiological parameters are expected to sit outside the normal range due to their underlying condition. The intention is to provide guidance for patients who expect to “score high” so that they do not automatically trigger an escalated response if this is the only reason.
There is a level of consciousness assessment (AVPU) but this is not included in the PEWS score
An initials box is at the bottom of the chart is to account for nursing care given On the back of the chart are a guide to level of respiratory distress and oxygen delivery
method; and pain and epidural assessments There is an Interventions box to document real time nursing and medical responses to
observations and subsequent care given. A sample signatures box was included for care accountability.
There was a strong organizational commitment to the implementation of the Starship PEWS chart and the promotion of optimal standards of care in detection of patient deterioration. An observation and monitoring guideline has been written and implemented and there has been a hospital wide interactive education programme for nursing staff. Monthly audits of PEWS chart documentation has become part of nursing metrics quality reports. The chart was implemented into Starship practice in May 2014 and it will be audited to evaluate its effectiveness in months to come. 4.4.5.1. FINDINGS FROM ONLINE SURVEY CONSULTATION Responses Up to 22/08/2014, in total the survey was taken by 27 respondents; however only 17 of this 27 fully completed the survey. Survey outputs are presented in Appendix 35 with a brief summary provided below. Use of paediatric early warning scoring systems Three respondents reported using a pre-existing validated PEWS (Bedside PEWS). Six respondents reported using a modified version of PEWS, two of which are MANCHEWS2, one of which is POPS, another is Brighton Score and the last one is PEWS adapted from Poole Hospital. Two hospitals have neonatal early warning scores. One had PEWS developed by the trust based on APLS guidelines. Another reconfigured previous modified PEWS and adjusted the trigger thresholds based on the Fleming SR paper. PEWS system is being implemented as part of a PhD project for one hospital. Three respondents answered that they did not use PEWS while one said they were unsure. Four respondents applied PEWS to 0-18 year olds, while 7 respondents applied it to 0-16 year olds. One respondent cited 2 months - 16 years while another applied it to 0-1 month olds. See Tables 10-13.
Table 10: Survey consultation: use of PEWS Does the above named hospital use a paediatric early warning score / (PEWS)? (n=17)
n (%)
Yes 13 (76%)
No 3 (18%)
Unsure 1 (6%)

(13/10/2014 Final Version) Page 47
Table 11: Survey consultation: type of PEWS used What PEWS does the named hospital use? Tick as many as appropriate (n=13)
n (%)
A pre-existing validated survey 3 (27%)
Modified version of a PEWS 6 (40%)
Modified version of an Adult Early Warning Score 0 (0%)
Neonatal Early Warning Score 2 (13%)
Other 3 (20%)
Table 12: Survey consultation: child age range for which PEWS used For what child age range group is the PEWS intended and used for / within the named hospital? Tick as many as appropriate (n=13)
n (%)
0-1mth 12 (92%)
2-23mth 12 (92%)
2-5yr old 12 (92%)
6-12yr old 12 (92%)
13-16yr old 12 (92%)
17-18yr old 4 (8%)
Table 13: Survey consultation: child hospital ward/setting PEWS used in Where in the hospital is it used? Tick as many as appropriate (n=13)
n (%)
General ward areas (e.g. medical/surgical) 11 (85%)
Intensive/critical care areas (PICU/NICU) 5 (38%)
Specialist area (e.g. oncology/metabolic) 8 (62%)
Emergency care areas (e.g. emergency departments/triage) 11 (85%)
Other 2 (15%)
Clinical guidelines on paediatric early warning scoring systems Twelve respondents stated that their hospital had PEWS system guidelines, 1 did not (Tables 14-15). Four of these respondents uploaded their guidelines to the survey database. Table 14: Survey consultation: hospital guidelines for PEWS
Does the hospital have specific guidelines/protocols/policies for / the identification of clinical deterioration (n=13)
n (%)
Yes 12 (92%)
No 1 (8%)
Unsure 0 (0%)
Table 15: Survey consultation: content of hospital guidelines What do the PEWS guidelines include? Tick as many as appropriate (n=12)
n (%)
Standards for measuring and recording physiological observations 11 (92%)
Protocol for documenting a total PEWS score 12 (100%)
Process of communicating concern about the severity/deterioration of a child's condition
12 (100%)
Graded response strategy for abnormal physiological observations 12 (100%)
Role and responsibilities of health professionals in relation to observation, detection and response to clinical deterioration of a child
11 (92%)
Policy for addressing the education and training of health professionals for observing, detecting and responding to the clinical deterioration of a child
4 (33%)
Parent role and responsibility in initiation of rapid response 1 (9%)
Other 1 (9%)
Nine respondents cited the following as being present in their hospital guidelines:

(13/10/2014 Final Version) Page 48
1. Standards for measuring and recording physiological observations. 2. Protocol for documenting a total PEWS score. 3. Process of communicating concern about the severity/deterioration of a child’s
condition. 4. Graded response strategy for abnormal physiological observations. 5. Role and responsibility of health professional in relation to observation, detection and
response to clinical deterioration of a child. One respondent stated only the first four were contained in their guidelines while another had an extra guideline stating the following:
6. Policy for addressing the education and training of health professionals for observing, detecting and responding to the clinical deterioration of a child.
Another respondent stated 1-6 were contained in their guidelines along with one final one stating:
7. Parent role and responsibility in initiation of rapid response. Clinical guideline development process Content was developed by any of 4 means; on site by team of clinical experts; by conduct of literature review in area of PEWS; by conduct of research studies; or adopted from other hospitals. In one case content was developed on site in addition to using content adopted from other hospitals. In another case content was developed on site, by conduct of literature review and by adopting another hospitals PEWS. The most common means of content development was on site, by conduct of literature review and by research studies which was the case for 3 respondents. See Table 16.
Table 16: Survey consultation: evidence underpinning guideline development What informed the development of the content of the / guidelines/policies/protocols. Tick as many as appropriate (n=12)
n (%)
Content developed on site of hospital by clinical development team based on clinical expertise
11 (92%)
Content informed by conduct of literature review in field of PEWS. 9 (75%)
Content informed by research study/studies conducted. 6 (50%)
Content adopted from other hospital/organization 7 (59%)
Other 0 (0%)
Evaluation/Audits Three hospitals conducted audits. Education/Training Nine hospitals reported providing specific PEWS training programs. Three respondents were unsure and one did not. Training was given yearly in 6 cases, every 3 or more years in 2 cases. Training was delivered as a once off basis in 4 cases with one respondent being unsure of training provided. Five respondents cited formal training was given, with 3 citing informal training. Four respondents cited both formal and informal training was given. Nine respondents cited face to face training as main mode of delivery, 3 cited online or e-learning and one respondent cited the training package RESPOND. Face to face training included; presentations, mandatory lectures, training sessions, in service training, study days or as part of orientation. Informal training was also delivered at bedside. See Tables 17-19.
Table 17: Survey consultation: training programme for PEWS Does the named hospital have a training program for educating / health professionals on the use? (n=13)
n (%)
Yes 9 (69%)
No 1 (8%)
Unsure 3 (23%)

(13/10/2014 Final Version) Page 49
Table 18: Survey consultation: type of training provided for PEWS What type of training is provided to health professionals on the / use and implementation of PEWS? Tick as many as appropriate (n=12)
n (%)
Formal 7 (58%)
Informal 7 (58%)
Other 2 (17%)
Table 19: Survey consultation: frequency of training for PEWS How often is training provided? (n=12) n (%)
Once off on introduction of PEWS 4 (33%)
Yearly 6 (50%)
Every 2 years 0 (0%)
Every 3 years 1 (8%)
More than every 3 years 1 (8%)
Costs Six respondents were unsure of costs involved in PEWS system implementation. Seven respondents cited materials costs including printing, e-learning, ‘patient track’ and chart re-formatting. Four studies cited staff costs. See Table 20. Table 20: Survey consultation: costs of implementing PEWS
What costs have been encountered in the implementation of PEWS? Tick as many as appropriate (n=12)
n (%)
Material costs 6 (50%)
Staff training costs 5 (42%)
Other 1 (8%)
Unknown 6 (50%)
Outcomes Five respondents cited evidence of altered clinical outcomes examples of which include rate of arrest showing some improvement, early warning signs in several cases likely to be spotted earlier than before PEWS. It has raised awareness of a lot of babies in difficulty and has helped escalate care appropriately, average time to see doctor improved with more observations being done. Four respondents were unsure of altered clinical outcomes since implementing PEWS. Two respondents stated no evidence of clinical outcomes obtained. Two respondents cited studies carried out in their hospitals proving positive outcomes such as increased time between codes. See Table 22.
Table 21: Survey consultation: clinical impact of PEWS implementation Is there evidence that the introduction of PEWS has altered / clinical outcomes? (n=13)
n (%)
Yes 8 (62%)
No 2 (15%)
Unsure 3 (23%)
4.4.5.2. POINTS OF NOTE FROM TELEPHONE CONSULTATIONS A summary of the telephone and face-to-face discussions (n=7) are presented in Appendix 36. These discussions confirmed existing evidence, offered insights into personal experiences of clinical experts and highlighted new emerging innovations. One such innovation is the Rottman Index (an automatic early warning system) gaining momentum in the US as a replacement system for PEW systems with the added value of being able to present trends over time. Across all discussions the complex and multi-faceted nature of PEW systems was highlighted with core emphasis given to the importance of the implementation process. Emphasis was given to having local champions of PEWS and ‘buy-in’ from all staff and management/leadership. The core

(13/10/2014 Final Version) Page 50
challenge of ‘culture change’ was highlighted; with consideration to be given to empowering people to take action and seek a second ‘pair of eyes’ to assist with this cultural transformation. The formal and informal nature of education was stressed with enhanced weighting given to a real-life clinical scenario based approach to detecting ‘clinical deterioration’. Indeed, despite vast education many reported staff not scoring correctly. Limited consensus on PEW parameters, vital sign values, and metrics for defining and measuring outcomes were discussed as vital to enhancing the evidence base underpinning PEW systems. On the other hand, the need to give cognisance to the ‘context’ was underscored highlighting the diverse child patient populations, illness cohorts and clinical settings which might not appropriately lend to the concept of a ‘one size fits all’ approach to PEW system implementation. The limitations of ongoing work such as EPOCH were raised such as limited data, exclusion of cohorts of high risk patients and a non-hospital wide approach. Further studies were highlighted including the commencement of a large 4-year mixed method project on PEWS in the UK. This project is being by Dr Colin Powell and is underway and examining PEWS implementation and evaluation as a ‘complex intervention’ across a number of sites; something which has been missing from the published literature to date. 4.5. RESPONSE SYSTEMS FOR RESPONDING TO CHILD CLINICAL DETERIORATION Research Literature 4.5.1. Systematic Review Papers Three review papers examining response systems were identified (Winberg et al. 2008, Chan et al. 2010, vanderJagt 2013). Each review is summarised below. The first literature review, conducted in Sweden, evaluated and summarised current knowledge about paediatric rapid response systems (Winberg et al. 2008). In their review Winberg et al. (2008) defined the Medical Emergency Team (MET) as a physician led team and a Rapid Response Team (RRT) as a nurse led team. Eight studies were retrieved and reviewed. The studies and a summary of Winberg’s review are presented below.
1. VandenBerg 2007 - cross sectional survey of levels of care and response mechanisms for evolving critical illness in hospitalised children in Canada and the USA; revealed that 136 paediatric hospitals (75% of relevant responding and eligible hospitals) had urgent response teams to treat children who were clinically deteriorating but not at immediate risk of or suffering cardiac arrest; 29 hospitals (17%) had a paediatric MET/RRT; 6 of these used criteria to determine when to activate the team.
2. Tibballs 2005 – development of a trigger tool in Royal Children’s Hospital, Australia. Adapted from adult studies. Included age adjusted parameters and parental and ward staff concern. Most common calling criteria hypoxaemia, respiratory distress and ‘worry.’ Criteria not formally validated. Data supports ability to identify deteriorating child who suffers a medical emergency or are admitted to PICU.
3. Duncan 2006 – PEWS tool containing 20 dynamic and static variables 3 of which were age adjusted; tool developed and evaluated with a retrospective frequency matched case control design at Hospital for Sick Children Toronto. Variables chosen by expert opinion. Case patients (< 18 years) had a ‘code blue’ call.
4. Haines 2006 - Validate Bristol PEWS. 360 patients included. Control population of 180. Seventy-three (20%) patients in the group scoring needed paediatric intensive care or care in a High Dependency Unit (HDU) and 227 (63%) required at least additional monitoring on the ward. The tool was further modified, excluding poor discriminator criteria. Final version used on same population of 360 patients with 326 now scoring. A review of the 34 patients no longer scoring showed that 12 did require a higher level of care. Seventy-two of the 73 patients who required PICU or HDU admission were scoring in the new version. Sensitivity and specificity not calculated.

(13/10/2014 Final Version) Page 51
5. Tume 2007 - Royal Children’s Hospital Liverpool, tertiary paediatric hospital; prospective chart review of patient data; unplanned admissions to PICU or HDU. Eighty-eight per cent of children admitted to PICU and 83% admitted to HDU would have triggered the Bristol PEW tool. Eighty-eight per cent and 89% respectively would have triggered the RCH criteria. Physiological data obtained from 50% of children admitted to PICU and 61% children admitted to HDU retrospectively matched against Bristol PEWS tool and RCH triggering criteria.
6. Brilli 2007 -Cincinnati Children Hospital, tertiary paediatric hospital; MET implementation study where triggering criteria were ranked by their association with patients suffering cardiac and/or respiratory arrest outside ICU. Seven activation criteria developed based on expert judgement and practical considerations. Most frequent triggering criterion-staff concern followed by ‘increased work of breathing.’
7. Zenker 2007 - implementation and impact of a RRT in a children’s hospital; did not use specific criteria or a PEWS to activate the RRS; at Children’s Hospitals and Clinics of Minnesota, a tertiary paediatric hospital, in the United States, any staff member or parent who recognised a worrying change in child’s clinical condition could call RRT; respiratory distress and/or hypoxaemia were main reasons for RRS activation calls.
8. Sharek 2007 - effect of a rapid response team on hospital-wide mortality and code rates outside ICU in a Children’s Hospital; did not use specific criteria or a PEWS to activate the RRS; at Lucile Packard Children’s Hospital (LPCH), a quaternary care paediatric hospital in the United States, staff member concern or acute change in one of 5 vital parameters warranted team activation; respiratory distress and/or hypoxaemia were main reasons for RRS activation calls.
Four of above studies published on RRS implementation in paediatric hospitals; all non-controlled, non-randomised, single-centre observational studies using historical controls. Tibballs et al. (2005) reported preliminary results from a comparison of retrospective incidence of cardiac arrest, death and unplanned admission to ICU before and after the implementation of a MET. MET replaced the existing ‘code-blue’ team creating a one-tiered emergency response. Introducing MET coincided with a non-significant reduction of cardiac arrest from 0.19/1000 admissions to 0.11/1000 admissions (P = 0.32) and mortality rate from 0.12/1000 admissions to 0.06/1000 admissions (P = 0.28). The low incidence of in-hospital cardiac arrest in children suggested as reason for lack of statistical difference. Unplanned PICU admissions increased slightly and incidence of transgression of MET call criteria in children who arrested decreased dramatically. Brilli et al. (2007) used retrospective chart review and a prospectively designed program implementation. A two tiered response system with a MET in addition to the existing ‘code alert’ team was introduced. There was a statistically significant reduction in respiratory plus cardiorespiratory arrests outside the ICU, decreasing from 0.27/1000 patient days to 0.11/1000 patient days (P = 0.03). A non-significant association with decreased mortality rate was found. A survey was completed by 88/215 (41%) staff involved in the MET consult. Eighty per cent of ward staff were satisfied with MET team interaction. Zenker et al. (2007) reported on the introduction of RRT at Children’s Hospital and Clinics of Minnesota using retrospective pre-implementation data and prospective observations. A two-tiered response system was created. While incidence of cardiac and respiratory arrests tended to decrease this was not statistically significant and mortality rate remained unchanged. Nurses’ satisfaction rate was high. At Lucile Packard Children Hospital a cohort study design with historical controls was conducted to introduce MET as a one-tiered system replacing the ‘code blue’ team (Sharek et al. 2007). The hospital mortality rate decreased significantly from 1.01 deaths per 100 discharges

(13/10/2014 Final Version) Page 52
pre-RRS to 0.83 deaths per 100 discharges post-RRS (P = 0.007). There was also a 72% reduction of respiratory and cardiac arrest rates outside the ICU (P = 0.007). In summary, Winberg et al. (2008) found one study that showed a statistically significant reduction in mortality rates after MET implementation (Sharek et al. 2007). Two studies reported a non-significant association with decreased mortality rate (Tibballs et al. 2005, Brilli et al. 2007) and in one study mortality rate remained unchanged (Zenker et al. 2007). In all 4 before and after studies, cardiac and/or respiratory arrest rates decreased, with statistical significance reported in two studies (Brilli et al. 2007, Sharek et al. 2007). In concluding their review, Winberg et al. (2008) stated that existing data does support the effectiveness of paediatric RRS; however there is limited evidence on the most optimal system to implement with a lack of comparable data. Winberg et al. (2008) does draw attention to a published consensus document offers recommendations for standardised reporting of RRS data (see Peberdy et al. 2007) and suggests that with low mortality rates in paediatric populations other parameters beyond mortality be considered such as unplanned ICU admission and length of stay, in-hospital emergency rates including but not limited to cardiorespiratory arrest, costs and staff satisfaction. The authors also emphasise the need for validation of activation criteria. The second systematic review, stemming from the USA, conducted a meta-analysis to assess the effects of rapid response teams on reducing cardiopulmonary arrests and hospital mortality (Chan et al. 2010). Eighteen studies from 17 publications were identified; 5 of these studies pertained to child populations, including; Brilli, Hunt, Sharek, Tibballs, and Zenker. Chan et al. (2010) reported that in four (Zenker, Sharek, Brilli, Hunt) of the five paediatric RRT studies reviewed, a statistically significant reduction in rates of cardiopulmonary arrests (CPA) outside of ICU occurred. Pooled analysis found that RRT implementation was associated with a (37.7%) reduction in rates of CRA outside of ICU (RR 0.62; 95% CI, 0.46-0.84). This result was robust to subgroup analysis. Two (Sharek, Tibballs & Kinney) of the paediatric studies reviewed reported a significant reduction in mortality, whereas no effect was found in two other studies (Zenker, Brilli). RRT implementation was associated with lower paediatric patient hospital mortality rates (pooled RR 0.79; 95% CI, 0.63-0.98) however significant heterogeneity was observed and the pooled estimate was not robust to sensitivity analysis. Chan et al. (2010) concluded that although RRTs appear to reduce cardiopulmonary arrest rates outside ICU, consistent evidence is limited to support association with improved survival; the principal reason for their instigation. The third review recently undertaken in the USA by VanderJagt (2013) aimed to outline what is known about the use and organisation of paediatric resuscitation teams (code teams) and paediatric rapid response systems. For this review we specifically focus on, and summarise here, the aspect of VanderJagt’s (2013) review on paediatric rapid response systems. VanderJagt (2013) included 10 studies on paediatric rapid response systems in the review (Brilli; ul-Haque; Avent; Hunt; Hanson; Lobos; Mistry; Sharek; Tibballs; Zenker). RRT/MET composition: VanderJagt (2013) reported that 7 of the 10 studies had a PICU Attending/Fellow as part of their team (Brilli; ul-Haque; Hunt; Hanson; Lobos; Sharek; Tibballs). 2 studies had a PICU Resident/NP as part of their team (ul-Haque; Mistry). 9 of the 10 studies had a PICU Registered Nurse as part of their team. 8 had an RT as part of their team. 4 had a Senior Resident, 1 had 2 Junior Residents/Interns, 1 had an Emergency Department Medical Doctor, 1 had an Emergency Department Registered Nurse and finally 4 studies had a Registered Nurse/Super as part of their team. Evidence for Success: Seven of the 10 studies were reviewed for evidence of success (Chan; Sharek; Brilli; Hunt; Tibballs; Hanson; ul-Haque). 6 studies noted a significant decrease in

(13/10/2014 Final Version) Page 53
cardiac/respiratory arrests (Chanl; Sharek; Brilli; Tibballs; ul-Haque). VanderJagt (2013) found that while Hunt noticed no significant change (although a trend) in cardiac arrests, they clearly noticed a change in respiratory arrests decreasing from 1.46 to 0.4/1000 discharges (p = .04). While Hanson noticed no change in cardiac arrest rate/1000 admissions they did demonstrate a significant increase in time intervals between ward arrests once a RRT was implemented. 3 studies noted a significant decrease in rates of mortality (Chan; Sharek; Tibballs) while one study noted no significant change in rates of mortality (Brilli). Implementation: As noted by VanderJagt (2013), cultural and professional barriers interfere with the development of RRT/MET. Drawing on work from the adult literature (e.g. Bagshaw, Jones, Hillman), VanderJagt (2013) highlighted the following barriers to RRT/MET implementation including:
Nurse allegiance to primary medical team; calling them first instead of RRT/MET Lack of recognition of severity of illness, monitoring results and/or vital signs resulting
in failure to call the RRT/MET. Fear of criticism from other staff and RRT/MET itself Lack of education about the process.
VanderJagt (2013) outlined the work of Lobos in Canada who adopted an implementation strategy which accounted for the need to change the social framework of healthcare professionals. As part of the study a paediatric RRT was implemented across four hospitals using a 3 phase approach. Phase 1included recruitment of site champions, defining objective outcome measures, promoting RRRS concept using social marketing tools, recruiting MET members who were trained using standardized program. Phase 2 day time, during the week pilot for three months to refined RRS based on real experiences. Phase 3 RRS was implemented 24 hours a day, 7 days a week. Marketing strategies employed including surveys sent out to 1066 health care providers (physicians, nurses, allied health professionals, and residents) to assess both personal barriers as well as perceived institutional barriers. Identified system barriers to implementing PRRT included;
cultural and professional norms (hierarchies within current system, doctor-nurse disengagement, inter-professional resistance)
resource constraints including nurse multi-tasking, work-load pressures, and data collection/maintenance resource
professional infrastructures such as reluctance to cross professional boundaries and unwillingness to engage
role modelling (lack of RRT-familiar staff/need for champion users) training/educational concerns (loss of learning experiences due to RSS takeover,
ambiguity regarding core competencies required) evidence for RRS (uncertain published evidence for RRS, unfamiliar concept)
This information was used to develop a social marketing strategy based on 6 components of the rapid response system: Product; Price; Place; Promotion; Publics; and Partnerships. Three years after implementation a very high activation of the MET was noted at 0.44/1000 admissions and based on a follow up survey (25% response rate), 90% of respondents felt the MET had improved patient safety and 94% believed it to be helpful to patients. VanderJagt (2013) advises when implementing RRT/MET that the following organising and implementing tips be considered:
Identify physician and nurse champions (general inpatient, intensive care units, quality/safety leadership)
Identify key stakeholders (general inpatient units nurses, physicians, resident trainees, ICU staff, parents)
Determine measurable process and outcome objectives (e.g. time between arrests)

(13/10/2014 Final Version) Page 54
Establish call criteria (consider use of PEWS on all patients with instruction what score triggers a call; consider use of family initiated call, alongside staff initiated call; and determine whether other parameters such as pain should be incorporated)
Clarify the roles and priority of calling for the primary team versus the RRS Determine team composition and insure it has sufficient experience to assess and
intervene Determine whether the code team and rapid response teams are separate or the same Outline a quality improvement/evaluation process before implementation (required
data to be collected for each rapid response; simple data labels for easy analysis and easy query systems that can generate standard statistical quality reports)
Determine training requirements for both initial and ongoing training Determine resource requirements (staff, data entry/analysis, internal marketing,
administration)
4.5.2. Research Studies Overview of studies Seventeen papers specifically examined rapid response, medical emergency or emergency response teams (Tibballs et al. 2005, Brilli et al. 2007, Sharek et al. 2007, Zenker et al. 2007, Hunt et al. 2008, Tibballs & Kinney 2009, VanVoorhis & Willis 2009, Wang et al. 2010, Avent et al. 2010, Hanson et al. 2010, Haque et al. 2010, Kotsakis et al. 2011, Bonafide et al. 2012, Theilen et al. 2013, Bonafide et al. 2014a, Lobos et al. 2014, Panesar et al. 2014) (refer to Appendix 23 for data extraction tables). The majority of these papers (n=10) emanated from USA (Brilli et al. 2007, Sharek et al. 2007, Zenker et al. 2007, Hunt et al. 2008, VanVoorhis & Willis 2009, Wang et al. 2010, Avent et al. 2010, Hanson et al. 2010, Panesar et al. 2014, Bonafide et al. 2014a); two emerged from Canada (Kotsakis et al. 2011, Lobos et al. 2014); two from Australia (Tibballs et al. 2005, Tibballs et al. 2009); one from Pakistan (Haque et al. 2010) and one from the UK (Theilen et al. 2013). Settings The majority of studies (n=6) were conducted in tertiary care paediatric hospitals (Tibballs & Kinney 2009, Wang et al. 2010, Avent et al. 2010, Theilen et al. 2013, Bonafide et al. 2014a, Lobos et al. 2014); 6 were conducted in free standing paediatric hospitals (Tibballs et al. 2005, Zenker et al. 2007, Brilli et al. 2007, Sharek et al. 2007, Bonafide et al. 2012, Panesar et al. 2014); 1 in a university affiliated paediatric hospital (Hanson et al. 2010); 1 in a tertiary care academic children’s hospital (Hunt et al. 2008); 1 in a tertiary care academic hospital with two dedicated paediatric wards (Haque et al. 2010). One study was conducted across 4 academic paediatric hospital sites in Ontario (Kotsakis et al. 2011), while another, a case study, focused on two cases set in two paediatric hospitals in North Carolina (VanVoorhis & Willis 2009). Of the above 1 hospital specialised in paediatric haematology/oncology (Avent et al. 2010) and 1 setting was a quaternary care children’s hospital (Sharek et al. 2007). The majority were single site studies conducted hospital wide (n=11) (Brilli et al. 2007, Zenker et al. 2007, Hunt et al. 2008, Tibballs & Kinney 2009, VanVoorhis & Willis 2009, Wang et al. 2010, Hanson et al. 2010, Kotsakis et al. 2011, Theilen et al. 2013, Lobos et al. 2014, Panesar et al. 2014); 1 focused on medical and surgical wards only (Bonafide et al. 2014a); 1 on patients in paediatric wards in a large tertiary care hospital (Haque et al. 2010); 1 on all wards excluding non-obstetric, non–nursery-based, non-ICU medical or surgical wards (Sharek et al. 2007); and 1 on all wards excluding neonatal and paediatric intensive care units (Tibballs et al. 2005) and 1 on all non-ICU medical and surgical wards excluding cardiology step-down, tracheostomy-ventilator, and obstetrics units (Bonafide et al. 2012). Study Designs Seven studies employed retrospective audit designs (Brilli et al. 2007, Tibballs and Kinney 2009, Wang et al. 2010, Hanson et al. 2010, Haque et al. 2010, Panesar et al. 2014, Bonafide et al. 2014a); 2 were interrupted time series (Hanson et al. 2010, Bonafide et al. 2014); 2 were before
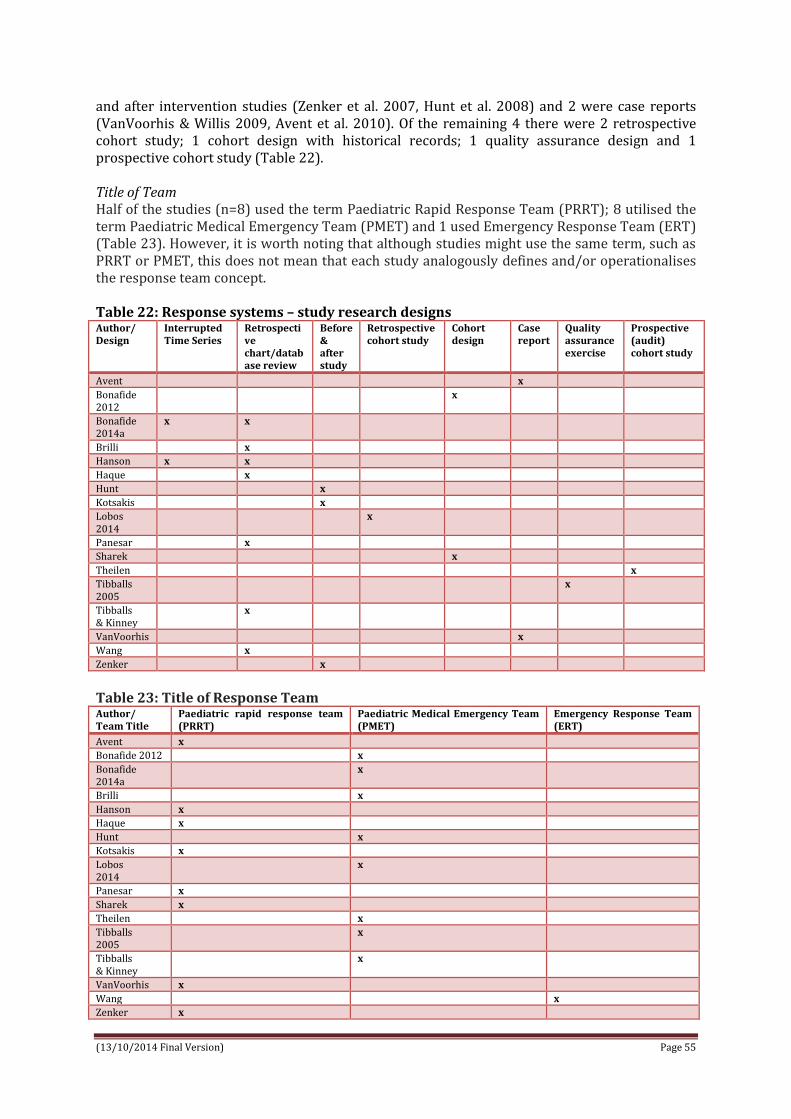
(13/10/2014 Final Version) Page 55
and after intervention studies (Zenker et al. 2007, Hunt et al. 2008) and 2 were case reports (VanVoorhis & Willis 2009, Avent et al. 2010). Of the remaining 4 there were 2 retrospective cohort study; 1 cohort design with historical records; 1 quality assurance design and 1 prospective cohort study (Table 22). Title of Team Half of the studies (n=8) used the term Paediatric Rapid Response Team (PRRT); 8 utilised the term Paediatric Medical Emergency Team (PMET) and 1 used Emergency Response Team (ERT) (Table 23). However, it is worth noting that although studies might use the same term, such as PRRT or PMET, this does not mean that each study analogously defines and/or operationalises the response team concept. Table 22: Response systems – study research designs Author/ Design
Interrupted Time Series
Retrospective chart/database review
Before & after study
Retrospective cohort study
Cohort design
Case report
Quality assurance exercise
Prospective (audit) cohort study
Avent x
Bonafide 2012
x
Bonafide 2014a
x x
Brilli x
Hanson x x
Haque x
Hunt x
Kotsakis x
Lobos 2014
x
Panesar x
Sharek x
Theilen x
Tibballs 2005
x
Tibballs & Kinney
x
VanVoorhis x
Wang x
Zenker x
Table 23: Title of Response Team Author/ Team Title
Paediatric rapid response team (PRRT)
Paediatric Medical Emergency Team (PMET)
Emergency Response Team (ERT)
Avent x
Bonafide 2012 x
Bonafide 2014a
x
Brilli x
Hanson x
Haque x
Hunt x
Kotsakis x
Lobos 2014
x
Panesar x
Sharek x
Theilen x
Tibballs 2005
x
Tibballs & Kinney
x
VanVoorhis x
Wang x
Zenker x

(13/10/2014 Final Version) Page 56
Team Composition There was no standardisation of team composition across all studies, with huge variety in terms of membership (Table 24). The majority of studies had teams comprising of four staff members (n=5). The most common staff member on Response Team was a PICU Respiratory Therapist (n=13); following from this a PICU/Critical Care Nurse (n=11) and a PICU Fellow/Attending Physician (n=10). A manager of patient services/bed management/nursing supervisor was present in five teams; a PICU/CICU/ED charge nurse was involved in four studies; a senior paediatric resident involved in four studies; while a paediatric pharmacist was on the team across three studies. The remaining staff members were ERT PICU/CICU anaesthesia/surgical fellows (n=2), paediatric critical care residents (n=2), in-house residents (n=2), Resource RN (n=2), ED attending (n=2), messenger (n=2), a senior assistant resident (n=1), a junior assistant resident (n=1), an intern (n=1), a patient bedside nurse (n=1), a dedicated RRT nurse practitioner (during daytime) (n=1), clinical nursing co-ordinator (n=1), security officer (n=1) and hospital chaplain (n=1) across seven studies. Table 24: Composition of Response Teams (NR=not reported) Author/ Team Member
Paediatric ICU (PICU) fellow or attending physician
PICU / Critical care nurse
PICU/ CICU/ED charge nurse
PICU resp. therapist
Senior paediatric resident
Patient services / bed manager/ nurse supervisor
Paediatric pharmacist /pharmacist
Other
Avent x x Clinical nursing coordinator
Bonafide 2012
NR NR NR NR NR NR NR NR
Bonafide 2014a
x x x
Brilli X x x x x
Hanson x x x Paediatric critical care resident
Haque x
Hunt x x x x x Junior & senior assistant resident An Intern Security Officer Hospital Chaplin
Kotsakis x x x Lobos 2014
x x x Paediatric critical care resident
Panesar x x x Bedside nurse Dedicated RRT nurse practitioner (during daytime)
Sharek x x x x Theilen NR NR NR NR NR NR NR NR
Tibballs 2005
x x x x
Tibballs & Kinney
x x x x
VanVoorhis x x X x ERT PICU/CICU anaesthesia/surgical fellows ED attending In-house residents Resource RN Messenger
Wang x x X x ERT PICU/CICU anaesthesia/surgical fellows ED attending In-house residents Resource RN Messenger
Zenker x x
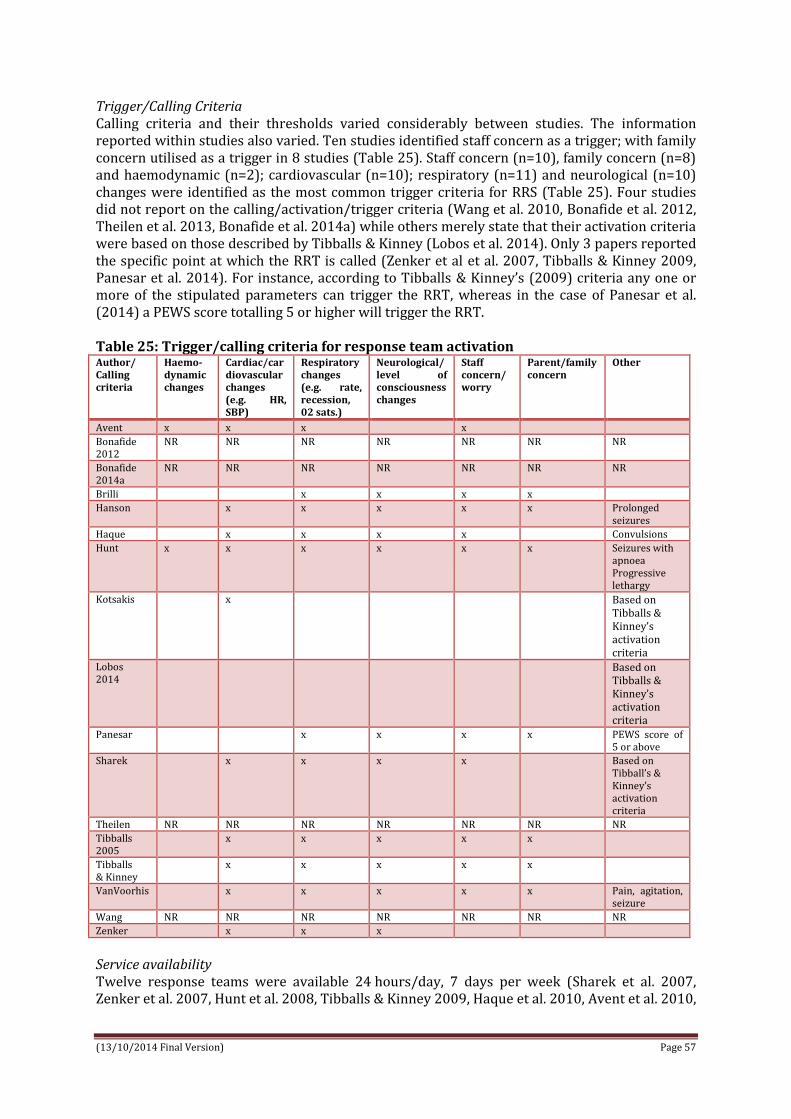
(13/10/2014 Final Version) Page 57
Trigger/Calling Criteria Calling criteria and their thresholds varied considerably between studies. The information reported within studies also varied. Ten studies identified staff concern as a trigger; with family concern utilised as a trigger in 8 studies (Table 25). Staff concern (n=10), family concern (n=8) and haemodynamic (n=2); cardiovascular (n=10); respiratory (n=11) and neurological (n=10) changes were identified as the most common trigger criteria for RRS (Table 25). Four studies did not report on the calling/activation/trigger criteria (Wang et al. 2010, Bonafide et al. 2012, Theilen et al. 2013, Bonafide et al. 2014a) while others merely state that their activation criteria were based on those described by Tibballs & Kinney (Lobos et al. 2014). Only 3 papers reported the specific point at which the RRT is called (Zenker et al et al. 2007, Tibballs & Kinney 2009, Panesar et al. 2014). For instance, according to Tibballs & Kinney’s (2009) criteria any one or more of the stipulated parameters can trigger the RRT, whereas in the case of Panesar et al. (2014) a PEWS score totalling 5 or higher will trigger the RRT. Table 25: Trigger/calling criteria for response team activation Author/ Calling criteria
Haemo-dynamic changes
Cardiac/cardiovascular changes (e.g. HR, SBP)
Respiratory changes (e.g. rate, recession, 02 sats.)
Neurological/level of consciousness changes
Staff concern/worry
Parent/family concern
Other
Avent x x x x
Bonafide 2012
NR NR NR NR NR NR NR
Bonafide 2014a
NR NR NR NR NR NR NR
Brilli x x x x
Hanson x x x x x Prolonged seizures
Haque x x x x Convulsions
Hunt x x x x x x Seizures with apnoea Progressive lethargy
Kotsakis x Based on Tibballs & Kinney’s activation criteria
Lobos 2014
Based on Tibballs & Kinney’s activation criteria
Panesar x x x x PEWS score of 5 or above
Sharek x x x x Based on Tibball’s & Kinney’s activation criteria
Theilen NR NR NR NR NR NR NR Tibballs 2005
x x x x x
Tibballs & Kinney
x x x x x
VanVoorhis x x x x x Pain, agitation, seizure
Wang NR NR NR NR NR NR NR Zenker x x x
Service availability Twelve response teams were available 24 hours/day, 7 days per week (Sharek et al. 2007, Zenker et al. 2007, Hunt et al. 2008, Tibballs & Kinney 2009, Haque et al. 2010, Avent et al. 2010,
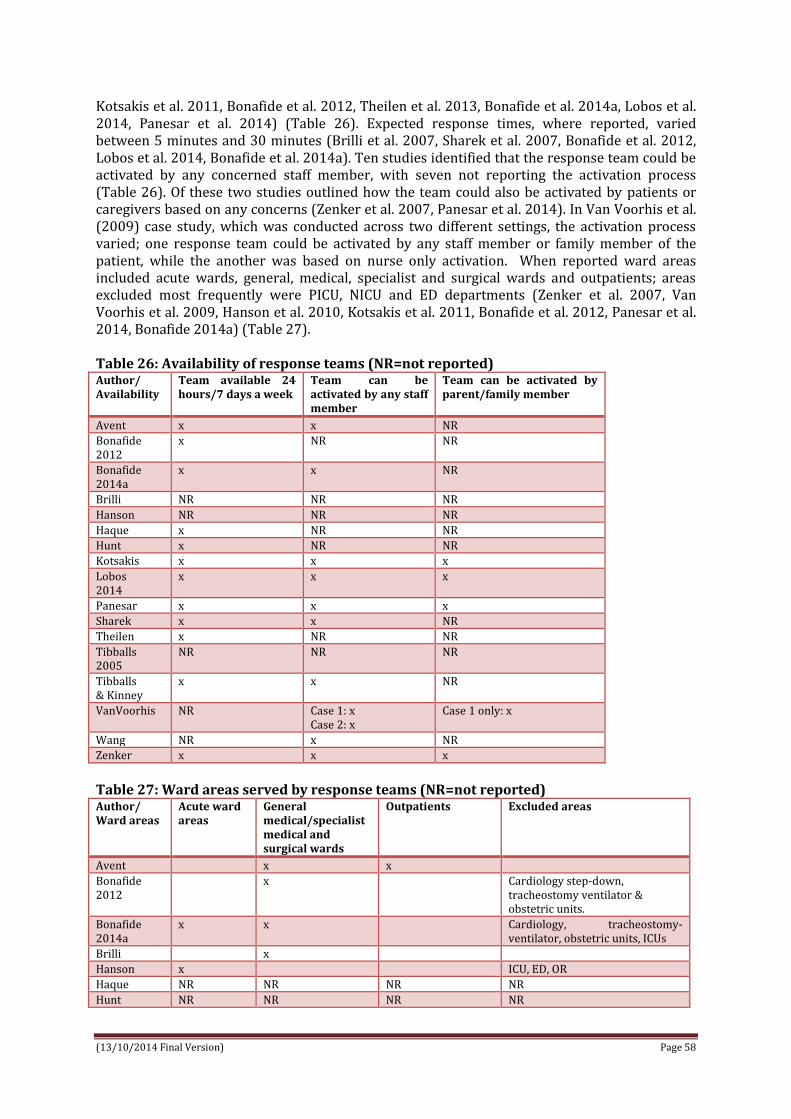
(13/10/2014 Final Version) Page 58
Kotsakis et al. 2011, Bonafide et al. 2012, Theilen et al. 2013, Bonafide et al. 2014a, Lobos et al. 2014, Panesar et al. 2014) (Table 26). Expected response times, where reported, varied between 5 minutes and 30 minutes (Brilli et al. 2007, Sharek et al. 2007, Bonafide et al. 2012, Lobos et al. 2014, Bonafide et al. 2014a). Ten studies identified that the response team could be activated by any concerned staff member, with seven not reporting the activation process (Table 26). Of these two studies outlined how the team could also be activated by patients or caregivers based on any concerns (Zenker et al. 2007, Panesar et al. 2014). In Van Voorhis et al. (2009) case study, which was conducted across two different settings, the activation process varied; one response team could be activated by any staff member or family member of the patient, while the another was based on nurse only activation. When reported ward areas included acute wards, general, medical, specialist and surgical wards and outpatients; areas excluded most frequently were PICU, NICU and ED departments (Zenker et al. 2007, Van Voorhis et al. 2009, Hanson et al. 2010, Kotsakis et al. 2011, Bonafide et al. 2012, Panesar et al. 2014, Bonafide 2014a) (Table 27). Table 26: Availability of response teams (NR=not reported) Author/ Availability
Team available 24 hours/7 days a week
Team can be activated by any staff member
Team can be activated by parent/family member
Avent x x NR
Bonafide 2012
x NR NR
Bonafide 2014a
x x NR
Brilli NR NR NR
Hanson NR NR NR
Haque x NR NR
Hunt x NR NR
Kotsakis x x x
Lobos 2014
x x x
Panesar x x x
Sharek x x NR
Theilen x NR NR
Tibballs 2005
NR NR NR
Tibballs & Kinney
x x NR
VanVoorhis NR Case 1: x Case 2: x
Case 1 only: x
Wang NR x NR
Zenker x x x
Table 27: Ward areas served by response teams (NR=not reported) Author/ Ward areas
Acute ward areas
General medical/specialist medical and surgical wards
Outpatients Excluded areas
Avent x x
Bonafide 2012
x Cardiology step-down, tracheostomy ventilator & obstetric units.
Bonafide 2014a
x x Cardiology, tracheostomy-ventilator, obstetric units, ICUs
Brilli x
Hanson x ICU, ED, OR
Haque NR NR NR NR
Hunt NR NR NR NR

(13/10/2014 Final Version) Page 59
Author/ Ward areas
Acute ward areas
General medical/specialist medical and surgical wards
Outpatients Excluded areas
Kotsakis x x ED, OR, post-anaesthetic care unit, NICU
Lobos 2014
NR NR NR NR
Panesar x x ED, NICU
Sharek NR NR NR NR
Theilen x x
Tibballs 2005
NR NR NR NR
Tibballs & Kinney
NR NR NR NR
VanVoorhis x x x NICU, PICU
Wang NR NR NR NR
Zenker x x ED. NICU
Activation Process Activation processes varied across study sites (Table 28). Teams could be activated by placing a call to the hospital switchboard on a dedicated internal number (Tibballs et al. 2005, Sharek et al. 2007, Tibballs & Kinney 2009, Avent et al. 2010, Wang et al. 2010). These calls would result in either an overhead loud-speaker call and/or paging response team members via beepers or personal telephone; via calling a dedicated pager (Brilli et al. 2007, VanVoorhis & Willis 2009, Kotsakis et al. 2011, Lobos et al. 2014); and via an overhead paging system (VanVoorhis & Willis 2009, Panesar et al. 2014). In 6 studies the activation calling process was not outlined (Zenker et al. 2007, Hunt et al. 2008, Hanson et al. 2010, Bonafide et al. 2012, Theilen et al. 2013, Bonafide et al. 2014a); however in the instance of Hanson et al. (2010) it was identified that the calling criteria process was outlined in poster format throughout the hospital. Studies that reported family members could activate the response team stated they could do so via their primary nurse or physician (Kotsakis et al. 2011, Lobos et al. 2014). Table 28: Activation process for calling response teams (NR=not reported) Author/ Activation process
Place a call to hospital operator on dedicated internal number
Overhead loud-speaker call and/or dedicated pager
Other
Avent x
Bonafide 2012 NR NR NR
Bonafide 2014
NR NR NR
Brilli x
Hanson Displayed on poster throughout hospital
Haque NR NR NR
Hunt NR NR NR
Kotsakis x
Lobos 2014
x
Panesar x
Sharek x
Theilen NR NR NR
Tibballs 2005
x
Tibballs & Kinney
x
VanVoorhis x Public announcement
Wang x
Zenker NR NR NR

(13/10/2014 Final Version) Page 60
Clinical outcomes Clinical outcomes measured across study varied substantially (Table 29). Rates of cardio/respiratory arrest, mortality rates, unplanned transfers to PICU and interventions required were the most common outcomes reported. Table 29: Clinical outcomes measured (response systems) (NR=not reported) Author/ Clinical Outcome
Unplanned transfer/ admission to PICU
PICU readmission
Rate of cardiac arrest
Rate of respiratory arrest
Rate of cardio-pulmonary arrest
Mortality/ rate of deaths
Interventions required (i.e. intubation, mechanical ventilation, vasopressors)
Length of stay
Avent x x x (PICU)
Bonafide 2012
x
Bonafide 2014a
x x x x x
Brilli x x x x x x x (PICU and General Wards)
Hanson x x x x
Haque x
Hunt x x
Kotsakis x x x x
Lobos 2014
x
Panesar x x
Sharek x x
Theilen x x x (PICU)
Tibballs 2005
x x x
Tibballs & Kinney
x x x x
VanVoorhis
x x
Wang NR NR NR NR NR NR NR NR
Zenker x x x
Eight RRT studies reported an evident reduction in rates of cardiac arrest (Tibballs et al. 2005, Brilli et al. 2007, Hunt et al. 2008, Tibballs & Kinney 2009, VanVoorhis & Willis 2009, Hanson et al. 2010, Kotsakis et al. 2011, Bonafide et al. 2014a). Three studies reported a notable reduction in respiratory arrest (Brilli et al. 2007, Hunt et al. 2008, Bonafide et al. 2014a). One study highlighted that the incidence of cardiopulmonary arrest decreased by 60% after MET implementation compared with baseline (Brilli et al. 2007); another indicated that the incidence of both cardiac and respiratory arrests decreased from 8 to 5.1 per 1000 discharges a decrease of 36% (p=.19) (Zenker et al. 2007). However no findings were statistically significant. The most frequent interventions reported were mechanical ventilation, vasopressors and suctioning. One study (Bonafide et al. 2014a) reported that the rapid response system, utilising an adjusted interrupted time series model, was associated with a considerable decrease in the trajectory of mechanical ventilation use in the 12 hours following transfer to the ICU and a net reduction in events by 83% in comparison with the pre-implementation trend. Similarly, it was also associated with a notable decrease in the trajectory of vasopressor use in the 12 hours following transfer to the ICU and a net reduction in events by 80% in comparison with the pre-implementation trend (Bonafide et al. 2014a). Again, no findings were statistically significant. Seven studies reported hospital mortality data. No results for hospital mortality improvement were statistically significant, however there was a trend towards reduced PICU mortality and overall hospital mortality across all studies (Brilli et al. 2007, Sharek et al. 2007, Hanson et al. 2010, Haque et al. 2010, Kotsakis et al. 2011, Bonafide et al. 2014a). One of these studies reported a substantial reduction in hospital mortality (Kotsakis et al. 2011); whilst another Haque et al. (2010) reported that mortality rates of patients admitted to PICU from wards

(13/10/2014 Final Version) Page 61
decreased from 50% to 15%. Bonafide (2014a) reported unchanged rates of hospital mortality. Duration of stay was reported in 3 studies (Brilli et al. 2007, Avent et al. 2010, Theilen et al. 2013); of these two reported PICU length of stay; whilst Brilli et al. (2007) reported both PICU and main hospital ward length of stay. Thirteen studies reported on the number of unplanned transfers to PICU (Tibballs et al. 2005, Brilli et al. 2007, Zenker et al. 2007, Tibballs & Kinney 2009, VanVoorhis & Willis 2009, Hanson et al. 2010, Avent et al. 2010, Kotsakis et al. 2011, Bonafide et al. 2012, Theilen et al. 2013, Bonafide et al. 2014a, Lobos 2014, Panesar et al. 2014). Of these one study found that the rate of unplanned transfers to ICU was substantially higher in the post-implementation period than in the pre-implementation period (Bonafide et al. 2014a); one study reported that 30% of all activations led to an unplanned PICU admission (Kotsakis et al. 2011) and one study found that the majority of unplanned PICU admissions were without involvement of the RRT team (Theilen et al. 2013). Process outcomes Similarly to clinical outcomes, process outcomes measured across studies varied substantially (Table 30). Rates of MET utilisation/calls and Code Blue activations were the most common outcomes reported (n=14) (Table 29). Table 30: Process outcomes measured (response systems) Author/ Process outcome
MET /code blue utilisation/MET/code blue calls
Time to team arrival
Time from ICU transfer to life saving interventions
Time to transfer to ICU
Timing of activation
Costs
Avent x x NR
Bonafide 2012
x
Bonafide 2014a
x x NR
Brilli x x NR Hanson x x NR Haque x x NR Hunt x NR Kotsakis x NR Lobos 2014
x x NR
Panesar x x NR Sharek x NR Theilen NR Tibballs 2005
x NR
Tibballs & Kinney
x NR
VanVoorhis
x NR
Wang x x NR Zenker x NR
Broad categories were used to report reasons for activation, with respiratory distress being the most common indication for activating RTT/METs (Brilli et al. 2007, VanVoorhis & Willis 2009, Haque et al. 2010, Kotsakis et al. 2011, Lobos et al. 2014). Cardiovascular, circulatory, neurological and staff concerns were also identified as additional reasons for activation. One study (Panesar et al. 2014) found that the most significant reason RRTs were called were for tachycardia. Another study (Brilli et al. 2007) reported staff concern about the patient as the most frequent trigger to activate MET, and laboured breathing as the most frequent physiologic

(13/10/2014 Final Version) Page 62
disturbance cited for activation. In relation to family activated RTT calls, one study identified that the mean number of calls increased significantly from 16 to 24 calls per 1000 discharges, yet family concern was recorded as a reason for activation in 6% of all calls (VanVoorhis & Willis 2009). Four studies reported (Wang et al. 2010, Haque et al. 2010, Lobos et al. 2014, Panesar et al. 2014) on timing of activations; however there was no statistical difference between non-winter (April-September) and winter (October-March) months. In one instance statistically, there were significantly more ERT activations during day shifts (6 am-6 pm) compared to night shifts (P < 0.001) (Wang et al. 2010). Two studies reported time of transfer to ICU (Avent et al. 2010, Hanson et al. 2010); three studies reported on timing from ICU transfer to life saving intervention (Brilli et al. 2007, Bonafide et al. 2012, Bonafide et al. 2014a); and one paper reported time to team arrival (Avent et al. 2010). There were no notable significant findings pertaining to time of team to arrival, team interventions and time in transferring to PICU/ICU. However in one study, faster transportation time to ICU (within 40minutes of RTT activation) was recorded (Avent et al. 2010). Theilen et al. (2013) reported a reduction (23% to 2%) in the number of patients who received a first response to deterioration after more than 12 hours and additionally found that a reduction in time for escalation of deteriorating patients (n=56) to intensive care support was most marked out-of-hours (median time 11 h vs. 7 h, p = 0.038). Education (reported in response systems papers) None of the seventeen studies outlined the model of training used to educate staff members of the response process. Modes of education included presentations at shift changes, meetings and conferences (Brilli et al. 2007); lectures and case based scenarios, plus quarterly ward instruction and updates (Haque et al. 2010); simulation and video recording of scenarios for staff review (Theilen et al. 2013); sick child workshops (Tibballs et al. 2005, Tibballs & Kinney, 2009); clinical practice reviews of MET calling process utilising illustrative cases (Tibballs et al. 2005, Tibballs & Kinney 2009); role play and mock scripts (VanVoorhis & Willis 2009); and electronic chart education reminders for nursing staff (VanVoorhis & Willis 2009). Aids such as wallet sized index cards were provided to all relevant staff which outlined the RTT process (Sharek et al. 2007). Family activation education included bilingual flyers in visitor areas and waiting rooms and large colourful bilingual posters in patient rooms with tear-off card mechanism for activation by non–English-speaking families were available next to the poster in every room (VanVoorhis & Willis 2009). In one study the only information provided was that education was conducted hospital wide (Hanson et al. 2010). Education aimed to impart key skills on the process, criteria and circumstances appropriate to activate the response team (Sharek et al. 2007, Zenker et al. 2007, Haque et al. 2010). It also sought to educate staff on how to initiate ICU transfer for interventions lasting more than 30 minutes (Zenker et al. 2007); and how to identify signs of deterioration that should lead to an RTT call (VanVoorhis & Willis 2009). (see Table 31 below). Education sessions ranged between one and four months pre and during the implementation of the RRT process (Tibballs et al. 2005, Brilli et al. 2007, Sharek et al 2007, Hunt et al. 2008, Tibballs & Kinney 2009, VanVoorhis & Willis 2009, Haque et al. 2010) (Table 32). Education continued during implementation across three studies, either quarterly or during staff debriefing of response calls (Brilli et al. 2007, Hunt et al. 2008, Haque et al. 2010). One study went into greater detail, explaining how education was conducted via 4 and 10 training session per year; with each session averaging two hours (Theilen et al. 2013). Only two studies identified the education trainers; in one instance there were two trainers (one consultant, one senior nurse) conducting each training session (Theilen et al. 2013); and in the other, nurses trained family members (VanVoorhis & Willis 2009) (Table 32 below).

(13/10/2014 Final Version) Page 63
Table 31: Modes of education in relation to response systems (NR=not reported) Author/ Education Mode
Lecture/ workshops
Aids e.g. electronic chart education reminders/wall sized index cards
Case based scenarios
Role play & mock scripts
Presentations at change of shifts/ meetings/ conferences (both nursing & physician)
Simulation training; video recordings of scenarios
Review of clinical practice/ debriefing using illustrative cases
Avent NR NR NR NR NR NR NR Bonafide 2012
NR NR NR NR NR NR NR
Bonafide 2014a
NR NR NR NR NR NR NR
Brilli x
Hanson NR NR NR NR NR NR NR Haque x x
Hunt NR NR NR NR NR NR NR Kotsakis NR NR NR NR NR NR NR Lobos 2014
NR NR NR NR NR NR NR
Panesar NR NR NR NR NR NR NR Sharek x
Theilen x
Tibballs 2005
x x
Tibballs & Kinney
x x
VanVoorhis
x x
Wang NR NR NR NR NR NR NR Zenker NR NR NR NR NR NR NR Nurses and physicians were the majority of clinical staff members receiving training. Across two studies additional staff receiving training included those facilitating rapid response calls such as ward clerks and telephone operators (Hunt et al. 2008) and respiratory therapists, chaplains, security and communications staff (VanVoorhis & Willis 2009). In one instance (Sharek et al. 2007) trainees were identified as staff on non-obstetric, non–nursery-based, non-ICU medical or surgical patient care units. No information was provided on education evaluation or costs in any of the seventeen studies (Table 32). Results on educational outcomes were limited with only three studies discussing its impact or success on any level. These outcomes were not validated however it was noted that MET training impacted on improved recognition of evolving illness (Hunt et al. 2008); and family and patient education on rapid response systems enabled parents to summon care when necessary (VanVoorhis & Willis 2009). One study found that education was not linked to increased RTT outcomes and/or improvements (Sharek et al. 2007). Worth noting was the fact that as senior management supported the rapid response programme, adequate training time was provided for relevant clinician staff resulting in attendance rates of >95% (Theilen et al. 2013). Table 32: Overview of training; timing, trainers, trainees, evaluation, outcomes and cost Author Timing
(of training) Trainers Trainees Evaluation
(of training) Outcomes (of training)
Cost (of training)
Avent NR (not reported) NR NR NR NR NR Bonafide 2012
NR NR NR NR NR NR
Bonafide 2014a
NR NR NR NR NR NR
Brilli 4 months spanning pre & during implementation
NR Nurses Physicians
NR NR NR

(13/10/2014 Final Version) Page 64
Author Timing (of training)
Trainers Trainees Evaluation (of training)
Outcomes (of training)
Cost (of training)
Hanson NR NR NR NR NR NR Haque 1 month pre
implementation Quarterly (cont.)
NR Nurses Physicians
NR NR NR
Hunt 2 months pre implementation Continued during staff debriefing of PMET calls
NR Staff caring for patients who might need to call the team Those notified that the team called – physician faculty Responding team members Call facilitatirs – ward clerks, tel. operators
NR NR NR
Kotsakis NR NR NR NR Improved recognition of evolving illness
NR
Lobos 2014
NR NR NR NR NR NR
Panesar NR NR NR NR NR NR Sharek 2 months pre
implementation NR Staff on all non-
obstetric, non-nursery based and non-ICU medical or surgical patient care units
NR Education not linked with increased RRT outcomes and improvements
NR
Theilen 4-10 sessions per year Duration of training session 2 hours (included 2 scenarios and debriefing)
2 trainers 1 consultant 1 senior nurse
All team members staffing PMET on a rotational basis
NR Senior hospital management support Protected time for training with no other concurrent clinical duties Attendance rates > 95%
NR
Tibballs 2005
3 months pre implementation
NR Nurses Medical staff
NR NR NR
Tibballs & Kinney
3 months pre implementation
NR Nurses Doctors
NR NR NR
VanVoorhis
4 months pre implementation
Nurses to families
All medical staff including; Physicians Nurses Respiratory therapists Chaplains Security officers Communications staff Family members
Audit RRT help families summon help; move toward a hospital-wide culture of recognising families as critical members of medical team
NR
Wang NR NR NR NR NR NR Zenker NR NR All clinical staff NR NR NR

(13/10/2014 Final Version) Page 65
4.5.3. FAMILY ACTIVATED RESPONSE SYSTEMS Four papers, all emerging from the USA (Children’s Hospital of Pittsburgh; North Carolina Children’s Hospital, Duke University Hospital Children’s Health Centre and the Children’s Hospital of Philadelphia) reported on family activated response systems (Dean et al. 2008, Ray et al. 2009, Hueckel et al. 2012, Paciotti et al. 2014) (refer to Appendix 24 for data extraction table). Three of these papers outline quality improvement initiatives – two describing Condition Help (Dean et al. 2008, Hueckel et al. 2012) and one describes a Family Activated Rapid Response Team (FARRT) (Ray et al. 2009). Both interventions (Condition Help and FARRT) were modelled on the concept of RRT through which families can alert a rapid response team when concerned about a change in their child’s condition. Dean et al. (2008) describes how families call a specific telephone number based on the following calling criteria; noticeable medical change in patient that not addressed by healthcare team; breakdown in how care is being delivered or uncertainty in patients treatment; patient receives medication that patient or family feels will have adverse effects or that not explained to patient/family by medical team and patient receives treatment or medication that he/she/family feels is intended for another patient or believes is different from what doctor ordered. This results in deployment of a specialised multidisciplinary rapid response team including a physician, a nursing supervisor and a patient advocate. If this team identifies physiological changes the call is then escalated to Condition A (CPA) or Condition C (crisis that may result in immediate arrest) with the main hospital RRT summoned. SBAR is used in the documentation of Condition HELP. Ray et al. (2009) describe how the families ring for the RRT using the same number as the medical team do to call the main RRT. The specific focus of two of these papers was on paediatric nurses teaching families about Condition Help/Family Activated Rapid Response Team and the conduct of follow up surveys with family members to evaluate their understanding of Condition H/ Family Activated Rapid Response Team (Ray et al. 2009, Hueckel et al. 2012). Through random in-person surveys, Ray et al. (2009) found that on average only 27% of families surveyed (n=376 families) understood when and how to activate RRT. Family awareness ranged from as high as 58% and as low as 6%, and varied greatly between paediatric services and on the same service each month. Hueckel et al. (2012) found that of the 88% of families who completed their survey on PBMTU all indicated they had heard about Condition Help and could provide reason for calling Condition Help; only 1 family needed additional instruction on how to call Condition Help. On the intermediate ward, 81% of families (n=81) participated in the survey and all but 2 families (98%) heard about Condition Help; 64 (74%) could describe reason for calling Condition Help and 66 (76%) answered correctly when asked how to call a Condition Help (Hueckel et al. 2012). Ray et al. (2009) found that since the introduction of family activation the mean number of RRT calls had increased significantly from 16 to 24 calls per 1,000 discharges. Family concern was noted as a reason for activation in 5% of all calls and two calls were directly activated by families. Hueckel et al. (2012) reported that in the 12 weeks prior to Condition H implementation, there were 40 RRT activations and no Condition H calls in the Children’s Hospital. There were 47 RRT activations during the 12-week implementation and 2 of these were Condition H (family initiated) calls (one call was from pilot ward other call was not). Two calls in both cases parents were following up on signs and symptoms they had been told by medical staff to watch for; both appropriate and did not need higher level of care. In describing their 2-year analysis of Condition Help Dean et al. (2008) reported on the number of calls to Condition Help and reasons for calls to Condition Help; 42 calls from patients and parents to Condition HELP team over the 24 month study period and the main reason for each call was communication breakdown between patient/parents and the clinical staff (physician/nurse) with 15 calls related to management, coordination or plan of care; 6 calls for medication or pain control; 6 calls related to discharge; 6 calls for dietary status and 6 calls for delays. As a

(13/10/2014 Final Version) Page 66
consequence of these outcomes Dean et al. (2008) reported a number of quality improvement changes they implemented based on their introduction of family activated response systems; most notably related to improved communications around realistic expectations, pain management, discharge planning and family involvement. These initiatives illustrate that families appear to infrequently activate the response system. When they do activate the response system, the reason for them doing is a consequence of communication failures rather than critical care deterioration. The effectiveness of family activated rapid response systems/medical emergency teams in preventing critical deterioration has not been established. One study (Paciotti et al. 2014) did not describe the Family Activated Medical Emergency Team (FAMET) but rather used a qualitative design to explore physician’s perspective on the value that families could provide in the identification of child clinical deterioration and the potential options of enabling families to activate an MET independently. While physicians valued family input and particularly depended on families to explain the child’s baseline condition and identify subtle child changes from their baseline 63% (n=19); 93% (n=28) of physician’s felt families should not be able to directly activate an MET for the following reasons;
family activation would lead to misuse of resources (64%, n=18); families lack training and clinical knowledge to determine when MET call is indicated
(43%, n=12); family activation would undermine therapeutic relationship between clinicians and
families (25%, n=7); availability of Family Activation burdens families/increases anxiety (18%, n=5); evidence demonstrating a relationship between FAMET implementation and improved
patient outcome is needed (18% n=5) CHOP implemented FAMET in 2012 with results of this study informing the development of education materials for clinicians and families which focused on enhanced collaborations between clinicians and families before escalation of care. One FAMET call activated by family member – primary reason for call was communication breakdown between family and staff; outcome was lab testing and consult with specialist services with child remaining on unit and did not require transfer to higher level of care. 4.5.4. Grey Literature Four documents were identified from grey literature searches which were evaluated using the AACODS criteria. Of these, 3 reported on rapid response teams (un-authored (North Carolina Children’s Hospital) and undated, Hueckel et al. undated, Willis & Hanson 2013) and 1 focused on a simple scoring system (based on the Brighton PEWS) and action algorithm (Vossmeyer & Tucker 2014) (see Appendix 31 for screening and evaluation and Appendix 32 for data extraction). All 4 documents scored ‘yes’ on Authority. Two scored ‘yes’ on accuracy (Hueckel et al. undated, Willis & Hanson 2013) and 2 scored unsure (based on absence of methodological data reported) (un-authored (North Carolina Children’s Hospital) and undated, Vossmeyer & Tucker 2014). Date of publication was recorded on only two documents (Willis & Hanson 2013, Vossmeyer & Tucker 2014). Objectivity across all four documents was difficult to establish, as they were written from the perspective of clinicians working within their own local clinical setting. All documents scored yes on significance based on perspectives offered; some repetition of research study findings and other unique contextual recommendations. Of the rapid response team documents, 2 teams were clinician activated (un-authored (North Carolina Children’s Hospital) and undated, Hueckel et al. undated) and 1 was family member activated (Willis & Hanson 2013). While no differences or additional information to any of the family specific studies already noted were identified, Willis & Hanson (2013) did outline the key elements of the planning and development process for clinicians and/or clinical settings interested in implementing a family activated paediatric RRT such as leadership buy-in, discussions with

(13/10/2014 Final Version) Page 67
other institutions, piloting the concept, developments of standardised education materials, staff training and program expansion plan, in addition to, resources required such as staffing, costs, leadership support, and “buy-in”(See Appendix 32). ‘Buy-in’ and addressing resistance was also mentioned by North Carolina Children’s Hospital (un-authored, undated) with loss of control highlighted as a main concern of staff. In addition, the importance of having a champion was deemed paramount to the RRT adoption process. Hueckel et al.’s book chapter reported on a unique ‘proactive’ concept introduced at Duke Children’s Hospital, North Carolina entitled the “Rover Team”. The Rover Team makes scheduled visits (“Roves”) to non-ICU inpatient paediatric ward to provide a critical care resource to medical and nursing staff and to systematically review patients at risk of clinical deterioration prior to meeting RRT criteria. Thus, it is complements the reactive response system of PRRT. Concurrent initiation of PRRT and Rover teams resulted in a reduction in the number of in-hospital cardiopulmonary arrests on paediatric wards with an increased number of days between codes; improved patient continuity between the critical care and non-ICU inpatient areas, and strengthened multidisciplinary team culture and communication. Between the Flags Initiative: The New South Wales Clinical Excellence Commission “Between The Flags” (http://www.cec.health.nsw.gov.au/programs/between-the-flags). The Clinical Excellence Commission implemented Between the Flags (BTF) in January 2010 to improve recognition and response to deteriorating patients. The system uses the analogy of Surf Life Saving Australia’s lifeguards who keep swimmers safe by observing them and ensuring they do not venture into unsafe areas; and if they get into trouble, that rescue occurs rapidly. A five-element strategy was introduced in all New South Wales (NSW) public hospitals (n= 225) which together provides a safety net for deteriorating patients, including: governance structures; standardised calling criteria (incorporating a suite of standard observation charts); Clinical Emergency Response Systems (CERS), including minimum standards for escalation; specially developed education materials; and standard key performance indicators. BTF started by focusing on the adult population and started with paediatrics in January 2011.
The CERS incorporated standardised observation charts; five age specific Standard Paediatric Observation Charts (SPOC) and one Standard Newborn Observation Chart (SNOC). The charts utilise a colour coded warning system to identify minimum standards for escalation; with clinical review criteria marked in yellow and rapid response criteria identified in red. Clinical review criteria include; any observation in the yellow zone, increased oxygen requirement, decreased circulation, excess blood loss, decreased consciousness, and concern by any staff member or family member. If any one of the above criteria is present, the nurse in charge is to be consulted immediately and assess whether a clinical review is required. Observations are to be increased as indicated by the patient’s condition, at a minimum every 30 minutes. If a clinical review is not attended within 30 minutes the patient must be escalated to the rapid response team. Rapid response criteria include all cardiac or respiratory arrests, airway obstructions, unresponsiveness, any observation in the red zone, deterioration not reversed within one hour of critical review, seizures, increased oxygen requirement to maintain oxygen saturations greater than 90% and serious staff and family concern. As with the critical review, if any patient has any one or more of these parameters a rapid response team must be called. Education and training are broken into three tiers; tier 1, an online program awareness training package for all staff including non-clinicians; tier 2, DECTECT education materials for all clinical staff to aid the recognition and response to deteriorating patients; and tier 3, specific training for all rapid response staff. An evaluation element of the system was incorporated to assess all five elements against the aims and objects of the program.
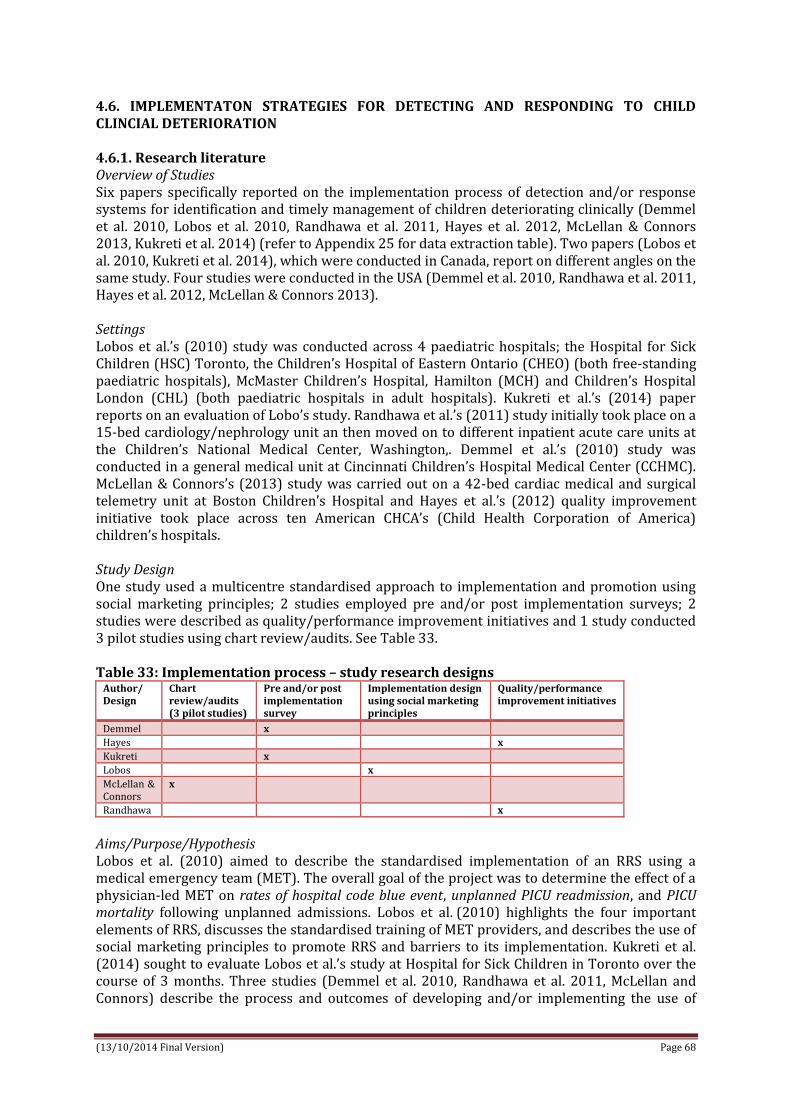
(13/10/2014 Final Version) Page 68
4.6. IMPLEMENTATON STRATEGIES FOR DETECTING AND RESPONDING TO CHILD CLINCIAL DETERIORATION 4.6.1. Research literature Overview of Studies Six papers specifically reported on the implementation process of detection and/or response systems for identification and timely management of children deteriorating clinically (Demmel et al. 2010, Lobos et al. 2010, Randhawa et al. 2011, Hayes et al. 2012, McLellan & Connors 2013, Kukreti et al. 2014) (refer to Appendix 25 for data extraction table). Two papers (Lobos et al. 2010, Kukreti et al. 2014), which were conducted in Canada, report on different angles on the same study. Four studies were conducted in the USA (Demmel et al. 2010, Randhawa et al. 2011, Hayes et al. 2012, McLellan & Connors 2013). Settings Lobos et al.’s (2010) study was conducted across 4 paediatric hospitals; the Hospital for Sick Children (HSC) Toronto, the Children’s Hospital of Eastern Ontario (CHEO) (both free-standing paediatric hospitals), McMaster Children’s Hospital, Hamilton (MCH) and Children’s Hospital London (CHL) (both paediatric hospitals in adult hospitals). Kukreti et al.’s (2014) paper reports on an evaluation of Lobo’s study. Randhawa et al.’s (2011) study initially took place on a 15-bed cardiology/nephrology unit an then moved on to different inpatient acute care units at the Children’s National Medical Center, Washington,. Demmel et al.’s (2010) study was conducted in a general medical unit at Cincinnati Children’s Hospital Medical Center (CCHMC). McLellan & Connors’s (2013) study was carried out on a 42-bed cardiac medical and surgical telemetry unit at Boston Children’s Hospital and Hayes et al.’s (2012) quality improvement initiative took place across ten American CHCA’s (Child Health Corporation of America) children’s hospitals. Study Design One study used a multicentre standardised approach to implementation and promotion using social marketing principles; 2 studies employed pre and/or post implementation surveys; 2 studies were described as quality/performance improvement initiatives and 1 study conducted 3 pilot studies using chart review/audits. See Table 33. Table 33: Implementation process – study research designs
Author/ Design
Chart review/audits (3 pilot studies)
Pre and/or post implementation survey
Implementation design using social marketing principles
Quality/performance improvement initiatives
Demmel x
Hayes x
Kukreti x
Lobos x
McLellan & Connors
x
Randhawa x
Aims/Purpose/Hypothesis Lobos et al. (2010) aimed to describe the standardised implementation of an RRS using a medical emergency team (MET). The overall goal of the project was to determine the effect of a physician-led MET on rates of hospital code blue event, unplanned PICU readmission, and PICU mortality following unplanned admissions. Lobos et al. (2010) highlights the four important elements of RRS, discusses the standardised training of MET providers, and describes the use of social marketing principles to promote RRS and barriers to its implementation. Kukreti et al. (2014) sought to evaluate Lobos et al.’s study at Hospital for Sick Children in Toronto over the course of 3 months. Three studies (Demmel et al. 2010, Randhawa et al. 2011, McLellan and Connors) describe the process and outcomes of developing and/or implementing the use of

(13/10/2014 Final Version) Page 69
PEWS tools and escalation algorithms. Hayes et al.’s (2012) paper describes CHCA’s (Child Health Corporation of America) multidisciplinary improvement collaborative of 20 children’s hospitals which implemented a suite of prevention, detection and correction strategies on targeted inpatient units with the aim of reducing the number of inpatient paediatric cardiopulmonary arrests by 50% and improving the culture of patient safety scores by 5 percentage points in 3 key domains (i.e. non-punitive response to error, handoffs and transitions, and communication openness). Driver for quality improvement initiatives Four of the studies were driven by quality improvement/improvement of care initiatives (Lobos et al. 2010, Demmel et al. 2010, Hayes 2012, McLellan & Connors 2013). Two of the studies were driven by Child Health Corporation of America (CHCA) initiatives. In Hayes et al. (2012) the CHCA implemented a multidisciplinary improvement collaborative of 20 children’s hospitals which implemented a suite of prevention detection and correction strategies on targeted inpatient units. In 2008, Children's Hospital Boston, an academic tertiary paediatric institution, participated in the Child Health Corporation of America Collaborative, ‘Eliminating Codes on the Inpatient Units’ (McLellan & Connors 2013). According to Demmel et al. (2010) the Cincinnati Children’s Hospital Medical Centre (CCHMC) made a major commitment to improving patient safety and developed a patient safety program initiative including preventing/eliminating preventable codes outside of ICU. The goals included prevention of unit cardiopulmonary arrests, provision of a clear standardised assessment process by which to alert a large multidisciplinary care team with varying levels of experience to the signs of clinical deterioration, early identification of children who were clinically deteriorating outside the ICU, enhanced understanding of triggers of clinical deterioration that would signal the need for further assessment and possible intervention, and empowerment of the nursing staff to call for assistance and development of predictable responses by all levels and members of the interdisciplinary team according to an algorithm linked to the PEWS score. Similarly in Lobos et al. (2010) the Ministry of Health and Long Term Care of Ontario funded a demonstration project to test the RRS as part of the provincial critical care strategy to improve critical care services in four paediatric hospitals. In December 2006, the Institute for Health Care Improvement launched a new patient safety initiative, the 5-Million Lives Campaign, designed to reduce harm to patients over a 2-year period. One recommendation of the campaign was to deploy a rapid response team (RRT) to the patient’s bedside to prevent cardiopulmonary arrest (CPA) at the first sign of clinical deterioration. Roll Out Five of the 6 studies piloted their interventions (Lobos et al. 2010, Demmel et al. 2010, Randhawa et al. 2011, McLellan & Connors 2013, Kukreti et al. 1014). One study had two pilot phases (Randhawa et al. 2011). Two studies piloted the intervention from Mon-Fri 8am-4pm for 3-month period (Lobos et al. 2010, Kukreti et al. 2014). In another study the intervention was first piloted on a 15-bed cardiology/nephrology unit for one year (Randhawa et al. 2010). This was then piloted again on a 39-bed general medical unit in a different inpatient acute care unit to determine the applicability of the tool within different patient populations for 9 months. Another study piloted the intervention on a general medical unit (Demmel et al. 2010). The final study piloted the intervention 3 times (McLellan & Connors 2013). Following the initial pilot, three studies rolled out the intervention in 3 ‘cycles’ or ‘phases’ with the third ‘cycle’ or ‘phase’ of all three studies involving the full roll out of the intervention (Lobos et al. 2010, Randhawa et al. 2011, Kukreti et al. 2014). For two of the three papers Phase 1 involved recruiting site champions, defining outcome measures, promoting the RRS concept using social marketing principles, MET providers recruited and trained according to pre-agreed standardised educational program while phase 2 involved piloting the paediatric RRS, which used a physician-led MET piloted from Mon-Fri 8am-4pm for 3-month period (Lobos et at. 2010, Kukreti et al. 2014). During phase 3 the MET was made available 24 hours a day 7 days a week.

(13/10/2014 Final Version) Page 70
The other study (Randhawa et al. 2014) describes in ‘cycles’ the implementation with the first cycle involving the piloting PEWS on a 15-bed cardiology/ nephrology unit. The second cycle involved implementing PEWS in different inpatient acute care unit. At the third cycle PEWS implemented in all acute care areas (additional 136 beds, including haematology/oncology, surgical, respiratory, short stay and neurosciences units). Finally, in Hayes et al.’s (2012) study, after a comprehensive paediatric specific change package was developed, 3 categories of changes with increasing complexity from foundation to midlevel to advanced were identified and rolled out. Calling Criteria/Activation Two studies used colour coding systems (Randhawa et al. 2011, McLellan & Connors 2013). One study adapted the original color-coding system used for increased situational awareness which was: Score 0 to 2 green, 3 to 4 red and any score >5 blue, or ‘code blue’ (Randhawa et al. 2011). In McLellan and Connors (2013) study an Escalation of Care Algorithm was developed which involved an escalation of resources to a patient's bedside to assess and treat deterioration based upon the C-CHEWS score. CCHEWS score of 0–2 (green) clinicians to continue routine care, monitoring and assessments; score of 3–4 (yellow) patient's nurse to notify the charge nurse and patient's resident or nurse practitioner of the elevated score; score 5 or greater (red), the same steps are followed as described for colour code yellow (score 3–4) with the addition of notifying the patient's attending physician of their patient's elevated CCHEWS score. Another study (Demmel et al. 2010) used a score of 0 to 2 meaning the child is stable and calls for ongoing routine monitoring; 3 to 5 meaning the child is at risk of clinical deterioration and requires more frequent assessment and attention from the health care team. A score of 7 to 9 warrants evaluation by the RRT. In relation to activation, in one study MET was activated through a dedicated pager when patient met calling criteria (Lobos et al. 2010). The patient’s primary physician was also called by hospital operator at time of MET activation. Lobo et al. (2010) used Tibballs et al.’s (2005) calling criteria which included age-specific physiologic criteria and concern expressed by healthcare professional (HCP) or family member. At all four sites primary HCP activated MET through hospital operator if family member asked For MET. At MCH families could also activate MET directly through hospital operator. The MET arrived within 5 minutes of activation. How was the intervention implemented? Across the studies the process of how the interventions were implemented varied. Two papers described beginning the implementation of the intervention by standardising the RRS afferent component with social marketing in healthcare (Lobos et al. 2010, Kukreti et al. 2014). Social marketing principles provided the conceptual framework to link system level goals and process level performance. These principles included (i) market research and contextualisation, (ii) definition of measurable objectives and (iii) marketing strategy. Within the first principle ‘market research and contextualization’ promotion strategies were divided into ‘user components’ (i.e. what personal barriers exist that prevent HCP from activating RRS?) and ‘system components’ (i.e. what institutional barriers prevent activation of RRS?). Both of these components were addressed using a pre-implementation survey mailed/emailed to 1066 HCPs including nurses, physicians, residents, allied health professionals. In terms of (ii) definition of measurable objectives, site leaders met every 2 months and agreed on transparent data collection process and on the basis of objectives, surrogate and objective indicators. The focus initially was on increasing awareness and early adoption of RRS and later on maintaining RRS uptake. Lobos et al.’s marketing strategy consisted of 6 components: RRS product, price, place, promotion, publics, and partnerships (see data extraction table in Appendix 25). Phase 2 involved standardizing efferent components, which were seen as essential to effective RRS. A standardised education program for MET providers was delivered and they also standardised delivery of service. Standardization entailed consideration of team composition, calling criteria, the MET’s role and other issues. Kukreti et al. (2014) described the implementation of Lobos et

(13/10/2014 Final Version) Page 71
al.’s study in the Hospital for Sick Children, Toronto. In Phase 1: planning and development of core team requirements occurred. A hospital wide algorithm for activating the MET, as well as the calling criteria was agreed upon. In Phase 2 MET service was introduced on a limited basis Mon to Fri, 08:00 to 16:00. In Phase 3 full 24/7 service rolled out to all areas of the hospital. Kukreti et al. (2014) then evaluated this using survey. Similar to Lobos et al. (2010), Randhawa et al. (2011) described the implementation of PEWS in three cycles; the first cycle involved piloting PEWS on a 15-bed cardiology/nephrology unit. The second cycle involved implementing PEWS in different inpatient acute care unit to determine the applicability of the tool within different patient populations. At the third cycle PEWS was implemented in all acute care areas (additional 136 beds, including haematology/oncology, surgical, respiratory, short stay & neurosciences units). Randhawa et al. (2011) implemented evidence based change using Plan-Do-Check-Act methodology for performance improvement. In Demmel et al. (2010) baseline scoring trends pertaining to unplanned ICU transfers from the oncology unit, changes in patients’ clinical status, frequency of calls to the RRT and preventable code rates were obtained by nursing staff who scored patients at intervals of every 4hrs for 1 month before PEWS was implemented. PEWS implementation team analysed data and reviewed for any patients transferred to the ICU for clinical deterioration. Scores of patients transferred to the ICU retrospectively examined for 5 -24hrs prior to transfer, to assure scoring process appropriately reflected patients’ increasing acuity prior to ICU transfer. Nursing staff posted each patient’s score on unit’s PEWS Score Board, a laminated grid including room number and each hour within 24-hour period. Once baseline scores obtained algorithm developed and PEWS distributed to staff and posted throughout the unit at strategic locations, including computer and nursing stations. Each child’s PEWS score was indicated by drawing a coloured circle on the board at the corresponding room number and hour of day the score was obtained. The colour corresponds with the colour associated with the patient’s score on the algorithm. PEWS whiteboard provides multidisciplinary team with dynamic snapshot of the unit’s acuity level and view of the sickest patients at any given time. Two studies use whiteboards placed near the nurses’ station to record PEWS score and assign a colour to each numeric value (Demmel et al. 2010, Randhawa et al. 2011). McLellan and Connors (2013) implemented the intervention in three pilot stages. At the first pilot stage Monaghan’s (2005) PEWS was modified to develop a Children's Hospital Early Warning Score (CHEWS). The CHEWS incorporated the PEWS domains and scoring, plus the addition of two subjective domains of “family concern” and “staff concern”. A review of electronic health record documentation and clinician interviews (charge nurse, patients' nurses, nurse practitioners or fellows) was conducted. Staff nurse, qualified in use of CHEWS tool, scored all patients on the unit during two consecutive 12-hour shifts, and conducted concurrent interviews with clinicians to identify their most acute patients and/or those they had concerns about; including asking nurses to indicate if patients' families had concerns or were absent from the bedside (to score “family concern” of CHEWS). Patients' clinical events and bed assignment (higher dependency bed or not) was also recorded. Clinicians' assessments, patients' clinical events, bed assignment and calculated CHEWS scores all compared. Consistent agreement about patients' acuity among clinicians' assessments, bed assignments, and clinical events were used to describe patients' clinical presentations. 29.6% (n=8) of patients had lower CHEWS scores than the acuity severity of their clinical presentation should have warranted; of patients that scored too low, 3 were urgently transferred to the CICU during the pilot, with 1 intubated on arrival to CICU. None of 3 patients' CHEWS scores were above a normal range and would not have triggered escalation of care response using CHEWS. An expert multidisciplinary panel from CICU, ICU and cardiac unit reviewed patients' clinical presentations and CHEWS scores; with the following identified as sources for score discrepancies; behaviour (absence of sleeping appropriately); cardiovascular (absence of presence of arrhythmia and heart rate range limits not accounting for wide age range of patients, esp. newborns and infants); and respiratory

(13/10/2014 Final Version) Page 72
(absence of presence of apnoea or cyanosis; oxygen flow rates too high for younger patients; respiratory rate range limits not accommodate wide age range of patients, esp. newborns and infants). At the second pilot stage, the tool modified to take account of variables identified from analysis of pilot 1 findings and named; Cardiac Children's Hospital Early Warning Score (C-CHEWS) tool. A second pilot was conducted with C-CHEWS tool using previously described methods from pilot 1. 7.5% (n=4) of patients' C-CHEWS scores did not correlate with acuity of their clinical picture; this time it was equal mix of patients either scoring too high or too low. Presence of patients' baseline abnormalities accounted for discrepancies: behaviour (baseline seizures); cardiovascular (baseline arrhythmias); respiratory (baseline use of supplemental oxygen flow rate & baseline cyanosis). The tool was then modified to take account of analysis from pilot 2. Should a patient have any of these pre-existing abnormalities at baseline they would not score high, whereas if a patient had a new onset of any of those clinical findings, or it was unknown, the findings would generate a higher C-CHEWS score. A third pilot was conducted on the updated C-CHEWS using the same methods. Pilot with updated C-CHEWS tool demonstrated 100% of C-CHEWS scores matched the acuity of patients' clinical presentations. Final version of C-CHEWS tool approved for use on the cardiac unit and Escalation of Care Algorithm conformed to existing critical response structures within the Cardiovascular Program. In Hayes et al.’s (2012) study a comprehensive, paediatric specific change package of practices with evidence supporting their efficacy, low risk of harm, and feasibility of implementation and measurement was developed. Three categories of changes with increasing complexity were identified. Foundational changes were relatively simple to implement and recommended to be put into practice early in the collaborative (e.g. implementing “SBAR,” or Situation, Background, Assessment, Recommendation). Midlevel changes, such as developing a RRT, were implemented as the foundational changes were accomplished. Advanced changes (e.g. family activation of the RRT) were considered more complex and were generally implemented once several other change types had been achieved. Multidisciplinary Team The multidisciplinary teams involved in the implementation varied across studies. In Lobos et al.’s (2010) study physicians, registered nurses and respiratory therapists were recruited as site leaders. Site leaders agreed to implement RRS with MET team of a PICU physician, critical care nurse, and respiratory therapist. At the Children’s Hospital for Eastern Ontario (CHEO), Children’s Hospital London (CHL), McMaster Children’s Hospital (MCH) the MET was comprised of an in-house PICU attending and resident during day and in-house PICU resident or fellow overnight with a PICU attending back-up. At The Hospital for Sick children, Toronto (HSC), an in-house fellow and resident with PICU attending back-up was available 24 hours a day. In Randhawa’s study the multidisciplinary team comprised of nursing unit manager, 3 staff nurses, and medical unit director. The PEWS multidisciplinary team in Demmel et al. (2010) consisted of staff nurses, educators, charge nurses, residents, oncologists, a haematologist, unit nursing leadership, performance improvement facilitators, an ICU staff member and leadership staff from the unit where PEWS was initially implemented at CCHMC where the haematology/oncology/bone marrow transplant nursing and medical leadership team were responsible for its implementation. In Hayes et al.’s (2012) study the collaborative was designed by a multidisciplinary paediatric advisory panel, including participating hospital staff and external subject matter experts. Each hospital assembled a multidisciplinary team with designated administrative and/or physician sponsors. McLellan & Connors (2013) report on how an expert multidisciplinary panel from the CICU, ICU and cardiac unit was involved in implementing the intervention. In one study, site leaders met every 2 months in person and by monthly teleconference during first 3 months and every two weeks during last 3 months of phase 1 (Lobos et al. 2010). During meetings site leaders discussed their roles, the development of efferent and afferent components and promotional strategies, data collection and quality

(13/10/2014 Final Version) Page 73
improvement strategies. Periodic PEWS Implementation Team meetings to review compiled data to ensure a sound design also occurred in another study (Demmel et al. 2010). Education In one study, registered nurses (RN) and respiratory therapists (RT), MET providers were trained using a standardized and peer reviewed two day Province of Ontario paediatric RRS provider course developed for the Canadian Resuscitation Institute by Paediatric critical care physicians, educators and simulation experts (Lobos et al. 2010). When not involved in MET, the RN and MD MET providers were involved in RRS data collection and research activities and offered educational support on in-patient units and in PICU. They were also involved in presenting case rounds on the basis of their actual MET patient encounters. In one study it was noted that all team members attended simulation-based courses re identification, assessment & management of deteriorating paediatric patient (Kukreti et al. 2014). An education curriculum was developed that met the educational needs of ward/clinic staff. Forums for delivery included; lunch and learn sessions, monthly rounds/meetings, hour-long in-services, and twice yearly full day simulation based education session. Another study provided education and training sessions to registered nurses, medical and ancillary staff in small teams prior to implementation using a variety of formats such as classroom lecture and electronic educational materials (Randhawa et al. 2011). All nurses underwent a validation process to determine ability to score 3 patients with the PEWS. The implementation team used train the trainer model to educate staff. First step of train the trainer model involved training individuals as experts in using PEWS tools. Trainers were educated on how to use PEWS and how to score patients correctly. These trainers then trained and confirmed knowledge gained by nurses on cardiology/nephrology unit. Nursing and medical staff were also educated on the process for documentation of the PEWS score and the expected interventions (i.e. Escalation Algorithm). All nurses previously not educated and trained in PEWS completed a training packet and a validation process to determine their ability to correctly score 3 patients with PEWS. All medical staff were educated about the PEWS process, the use of Escalation Algorithm and the expected interventions. One study provided pre-implementation education which focussed on history and development of PEWs; rationale for and the goals of the initiative; scoring process; integration into routine nursing assessments; normal vital sign parameters reviewed (Demmel et al. 2010). On-going educational training on scoring system; case studies; education presented at staff meetings; education available electronically was also provided in the form of interactive case scenario scoring practice and reviewing case histories involving patients staff had previously cared for. In McLellan & Connors (2013) paper they describe how all cardiovascular staff were required to complete a short computer-based learning module using 3 case studies; this educational material was reinforced during staff meetings and unit's monthly newsletter. The C-CHEWS tool and companion Escalation of Care Algorithm was posted throughout the unit for reference before and during implementation. The education initiative occurred over a 2-month period and all clinical staff knew the date designated for the C-CHEWS tool to “go-live” and become standard of care. Outcomes Outcomes measured by Randhawa et al. (2011) included;
CPA rates Clinical Assessment and Triage (CAT) Team activations
Results revealed that after three cycles of change introducing PEWS into 2 pilot units, cardiopulmonary arrests reduced by 37% in the cardiology/nephrology unit and 25% in general medical unit with an aggregate in two pilot units of 31%. At organisational level after implementation of PEWS across all acute care units there was a 23.4% reduction in CPA (0.21

(13/10/2014 Final Version) Page 74
codes/1000 patient days). The number of CAT team calls across all acute care units also reduced by 19.4% (103 activations pre PEWS to 83 activations post PEWS); suggesting bedside nurses had improved their early detection skills with use of PEWS and had escalated patient care needs without activating the CAT team in certain situations. A total of 213 medical records were evaluated during three separate sessions. Only 152 patients had a documented PEWS score at a minimum of every 4 hours (71.4%). The colour assignment was accurate in 193 charts (91%) of the audits cases. Reassessment compliance of patients was evident in 141 charts (66.2%); this correlated with the number of RRT activations with a noted electronic PEWS score (20 of 32, 62.5%). Of the patients with a PEWS score ≥3 (requiring more frequent assessments and/or notification of a licensed independent practitioner), 189 charts (88.7%) had complete notification documentation and response (Randhawa et al. 2011). Two papers used staff surveys to evaluate findings (Demmel et al. 2010, Kukreti et al. 2014). The pre-implementation survey distributed by Kukreti et al. (2014) indicated a need for a service that the staff could call to seek help and advice about rapidly deteriorating patients. Post implementation surveys found that over 92% of physician and nurse respondents had participated in the care of a patient with the MET; Most respondents (98%) agreed that the MET was used primarily for consults for unstable patients on the ward; Respondents identified that MET were used to support end of life discussion and education and advice on drugs. The majority of respondents (>95%) to the survey were satisfied with both the quality and timeliness of the MET service. Also >90% of respondents believed that the MET has had a positive impact on patient care. When asked if there were barriers to calling the MET 23% answered in the affirmative. Of these, over 70% identified “MET responds negatively if they deem the call inappropriate. At the Hospital for Sick Children in Toronto, a significant reduction in the Code Blue rate or the readmission rate to the CCU with implementation of the MET was not observed. When comparing the readmission rates as well as the outcome following readmission during the three eras (the two years before MET, 2 early MET, and 2 mature MET years; span of 2005 to 2011) there was no significant difference in the readmission rate. Demmel et al. (2010) used a staff evaluation survey which found that PEWS scoring process improved communication among multidisciplinary team members and defined clear actions for new less experienced staff members to address patient clinical deterioration. Elevated PEWS scores facilitated the timely arrival of appropriate staff to the bedside for further evaluation and intervention. Staff and charge nurses found board helpful to glance at during shift. A high level of charge nurses helped keep the initiative alive during weekends and shift to shift. Positive feedback was received from the multidisciplinary team about being able to determine which patients were most ill by viewing the PEWS scoring board. The overall evaluation found that it removed barriers that prevented the timely referral of children that require immediate help. The days between codes improved. Prior to implementation of PEWS the number of days between cardiopulmonary arrests on unit was 299 and post implementation the days between increased to 1053 sustained for 2 years. However, scoring every four hours was reported as monotonous and mundane for patients with low pews scores. Ongoing data management was seen as cumbersome and time consuming. Future directions include additional scoring parameters including blood pressure and adapting and refining algorithm for specific populations. In McLellan and Connors (2013) study a chart review of patients who had an unplanned transfer to the CICU or experienced an arrest on the cardiac unit typically had elevated C-CHEWS scores with exception to sudden onset of compromising arrhythmia. In comparing the rate (transfers per 1000 patient days) of these events 1 year pre- and 1 year post- C-CHEWS implementation, there was a reduction in unplanned transfers. For Hayes et al.’s (2012) the primary outcome measure was reduction in codes per 1000 patient days, with the secondary outcomes being the days between codes and change in patient safety culture scores. Some of the

(13/10/2014 Final Version) Page 75
most widely implemented change areas during the collaborative were in the use of staff training and competency in recognition of deterioration and response algorithms. The most dramatic change implemented was the use of paediatric early warning system, starting out in no hospitals and implemented in 92% of hospitals within 12 months of the end of the collaborative period. Change in median code rate did not reach statistical significance for Group A (difference in rate 0.01, 95% confidence interval [CI]: –0.05, 0.16, P = .284). For Group B, the decrease in median code rate was statistically significant from baseline performance to action period performance (difference in rate 0.10, 95% CI: 0.00–0.31, P = .039). Group B had a higher pooled baseline median code rate than the 8 teams not reporting post-collaborative data, although this did not reach statistical significance (P = .066); Group B also had a lower pooled median code rate during the action period, although this again did not reach statistical significance (P = .399). Although 75% of the hospitals in each of these groups began the collaborative with an existing RRT, there were differences noted between Groups A and B in RRT implementation during the project. In Group B, 100% had a RRT in place by the end of the action period. At the conclusion of the action period in the group of 8 hospitals not reporting post-collaborative data, no additional hospitals had implemented a RRT. Patient safety culture scores improved in all 3 targeted domains of the AHRQ HSOPS for the 14 hospitals (70%) that conducted the survey. When comparing the baseline and final surveys, the domains improved between 4.5 and 8.5 percentage points compared with the collaborative goal of 5 percentage points. The only statistically significant improvement was seen in “non-punitive response to error” (39% positive response baseline, 47% positive response post-collaborative, P = .02). The remainder of the survey improvements were not statistically significant and failed to achieve priori goal of a 50% reduction in codes after 1 year. Across all 20 hospital study sites a modest 3% decrease in the median code rate was realized during the 1-year implementation period Challenges/Barriers Two of the papers cite inter-professional and hierarchical issues as barriers (Lobos et al. 2010, Kukreti et al. 2014). A survey conducted by Lobos et al. (2010) found the most substantial perceived barriers to implementation were;
historical doctor-patient relationships; concerns about communication between the physician-led MET and the primary
medical; hierarchies within the current hospital system
Almost 1/3rd of respondents did not feel supported by their superiors to activate MET and a similar proportion worried about the communication between MET and primary medical team. In light of the survey findings site leaders decided to strengthen the case for adopting RRS through activation of physician-led MET by engaging both clinical and nonclinical stakeholders in planning RRS implementation through RRS partnerships. System factors later identified included;
culture and professional norms (hierarchies within current system, doctor-nurse disengagement, inter-professional resistance);
resource constraints (nurse multitasking, work-load pressures, data collection/maintenance resource);
professional infrastructures (reluctance to cross professional boundaries, unwillingness to engage);
role modelling (lack of ‘RRS-familiar’ staff/need for champion users); training/educational concerns (loss of learning experience due to ‘RRS takeover,’
ambiguity regarding core competencies required); evidence for RRS (uncertain published evidence for RRS, unfamiliar concept)

(13/10/2014 Final Version) Page 76
In another paper (Kukreti et al. 2014) strategies used to overcome apparent and potential barriers were;
For six months every stakeholder group in the hospital (clinicians, managers) were given presentations about the team and answered the questions and concerns raised)
Callers were asked to always inform the most responsible physician at the same time they requested a MET consult and include the paediatric residents to increase collaboration and address concerns about de-skilling of residents.
Hayes et al. (2012) also found barriers which included;
Each hospital starting from a different place along a continuum of existing systems, and each then implemented different elements of the change package to varying degrees
Each hospital using their own internal definition of a “code”; depending on the definition, some may have been more preventable than others. Interventions employed were process improvement/systems changes and were likely implemented with varying levels of zeal and acceptance at different institutions.
4.7. EDUCATION INTERVENTIONS RELATED TO PEW DETECTION AND RESPONSE SYSTEMS 4.7.1. Research Literature Overview of studies Three studies specifically investigated educational interventions related to PEW detection and/or response systems (McCrory et al. 2012, Tume et al. 2013, McKay et al. 2013) (refer to Appendix 26 for data extraction table). One study was conducted throughout a large children’s hospital in the North West of England (Tume et al. 2013), 1 in the USA at John Hopkins University Hospital Simulation Centre (McCrory et al. 2012) and 1 in Australia in two inpatient paediatric wards within a tertiary hospital providing regional paediatric care (McKay et al. 2013). Two studies used prospective pre-and post-intervention designs (McCrory et al. 2012, McKay et al. 2013) and 2 studies employed surveys (Tume et al. 2013, McKay et al. 2013). Study aims Two studies sought to evaluate the development and impact of newly designed education courses for recognising child clinical deterioration (COMPASS; RESPOND) (McKay et al 2013, Tume et al. 2013). McKay et al.’s (2013) COMPASS education package was rolled out as part of a larger multi-faced intervention including a PEWS scoring chart and MET response system. One study aimed to evaluate an education intervention for teaching ABC-SBAR to paediatric interns; this included evaluating the content and time factors of patient hand-offs in a simulated near-arrest scenario with the hypothesis that a hand-off tool based on SNAR would help a first responder to concisely and quickly communicate critical information in an emergency situation (McCrory et al. 2012). Educational interventions McKay et al. (2013) and Tume et al. (2013) both implemented and evaluated the education programs - COMPASS and RESPOND respectively, whereas McCrory et al. (2012) implemented an orientation educational session entitled ‘Rapid Response: Why, when and how”. Each intervention is described below. RESPOND (Recognising Signs of Paediatric hOspital iNpatients Deterioration) is a multi-professional one day course aimed at ward nurses and junior doctors (foundation years 1 and 2) to improve children’s ward based teams’ ability to recognize and act on patient deterioration earlier, thus preventing cardiopulmonary arrest and potentially intensive care unit admissions. A programme and educational material (course book) for RESPOND course was devised by a multi-professional team comprising senior nurses, a nurse specialist in resuscitation, consultant

(13/10/2014 Final Version) Page 77
medical staff and a senior physiotherapist. The course mirrors the philosophy and ethos of the Acute Life-threatening Events – Recognition and Treatment (ALERT) course for adults. The course programme consists of an initial introduction and background of evidence of paediatric deterioration on ward areas and use of EWT; a brief key note lecture on assessing the deteriorating child on the ward; a group split into smaller multi-professional groups (of 4–6) to examine real (anonymized) patient case scenarios in more depth (critical analysis of case, and practice escalation of concern – SBAR); a short interactive ‘management of the condition’ lectures highlighting specific ‘red flags’ of clinical signs that should provoke concern amongst health professionals reviewing a patient and lastly clips from an in-house DVD produced specifically to improve the knowledge and skill of junior staff in undertaking careful clinical observations were used to illustrate key points. COMPASS; McKay et al.’s (2013) multifaceted programme aimed to assist health professionals detect changes in vital signs and recognise child clinical deterioration. It included a newly designed ward observation chart, 5-age specific PEWS scoring charts, the education package COMPASS and a formalised 2-tier medical response for child with clinical instability. COMPASS consists of an e-learning package and 3 hour face to face low fidelity simulation package which aims to promote the understanding of physiological principles of vital signs, reasons for measurement and provides a structure for succinct communication and initial resuscitation. ‘Rapid Response: Why, when and how” (McCrory et al. 2012); as part of this intervention paediatric interns participated in a video-recorded mock patient hand-off (i.e. entered a simulated patient room; read (1 of 2) scenario (warranting a rapid response) from a computer screen; picked up the phone, after which a mock ‘‘rapid responder’’ entered, and the intern gave a video- recorded verbal patient hand-off). Mock responders included staff members, senior residents, and critical care fellows who were instructed to only come in and introduce themselves as the rapid response team. After the first simulated hand-off, interns attended a 45-minute didactic session discussing the rapid response team at the institution as well as learning the mnemonic: ABC-SBAR. Each intern then participated in a second video-recorded simulated patient handoff using the other scenario that intern had not already encountered (approx. 1 hour after first simulated hand-off). Participants and data collection In one study data was collected via a self-formulated evaluation tool which assigned a score to paediatric intern (n=26) patient hand-offs using 10 items (McCrory et al. 2012). Essential hand-off content were identified a priori including the reason for the call, ABC assessment, patient background (e.g., reason for admission), and assessment or recommendation regarding overall course of action. The evaluation tool also incorporated the order in which information was given, with points assigned for prioritizing information needed for immediate stabilization (ABCs, reason for call) before patient background and assessment or recommendation. McKay et al. (2013) collected data from both staff and patients. A staff survey was distributed to 67 (41 pre- and 26 post-intervention) health-care workers with a response rate of 63.1%. Data was also gathered from patient records (n=262 pre- and n=221 post-intervention) including all vital sign measurements documented, PEWS recorded during the intervention period and any communication documented between nursing and medical staff following clinical instability. In the third study (Tume et al. 2013) study 65 participants undertook the RESPOND course over 4 separate days; including ward nurses n=44 (68%), healthcare assistants n=2 (3%), foundation year 1 doctors n=2 (3%), foundation year 2 doctors n=2 (3%), senior house officers n=2 (3%), medical students (year 5) n=13 (20%). After each of the course days participants completed an anonymous evaluation form (63 of 65 completed; 97% response rate) and provided their e-mail address for a further electronic survey to be sent to them 12 weeks after the course to assess its impact on their practice.

(13/10/2014 Final Version) Page 78
Outcomes Two studies demonstrated significant outcomes after SBAR training (McCrory et al. 2012, Tume et al. 2013). McCrory et al. (2012) included 52 paediatric intern hand-offs for analysis. The primary outcome measured was the total score on the intern’s SBAR evaluation tool.
The mean total score of hand-offs on the evaluation tool improved significantly after ABC-SBAR training (pre-intervention: 3.1 of a possible 10 vs post-intervention: 7.8 of 10, P<0.001).
Secondary outcomes measured included; inclusion of content items, order of content items with appropriate prioritization of key factors earlier and time factors (time to situation, airway or breathing, circulation and total hand-off time). Results showed;
Each component of the ABC assessment was included in a higher percentage of hand-offs after training. Hand-offs including either airway or breathing assessment improved after training from pre-intervention (9/26 [35%]) to post-intervention (22/26 [85%]) (P = 0.001).
Hand-offs including an assessment or recommendation by the intern also significantly increased after training (pre-intervention: 1/26 [4%] vs post-intervention: 22/26 [85%], P<0.001).
Proportion of hand-offs with ABCs or situation prioritized before background increased for each component after training (pre-intervention: <=5% vs post-intervention: >=77%).
Elapsed time from the start of hand-off until the intern stated essential content items significantly decreased after ABC-SBAR training.
Hand-offs that were given a score of a perfect ‘‘10’’ on the evaluation tool increased after ABC-SBAR training. Of those familiar with ABC-SBAR, 69% agreed that it is easy to use in a clinical situation, 90% agreed that it improves care, and 100% would recommend it be taught to all incoming interns. On their initial paper evaluation survey post the RESPOND course, Tume et al. (2013) found that the two most useful aspects of RESPOND were: the discussion and review of real life cases and learning to use the SBAR communication process.
87% (55/63) respondents stated they had learnt ‘new’ material from attending the RESPOND course.
89% (56/63) respondents stated that the RESPOND course would improve their communication with colleagues at work, by using the SBAR method.
All the respondents rated the scenarios used as helpful to learn from and there were a number of suggestions provided for other cases, to capture a broad range of different specialities.
One common theme in the free text responses was that many participants felt there was a huge benefit of using a multi-professional approach to the course delivery, as this improved the understanding among each professional group when dealing with cases of possible deterioration. Some nurses said that they still felt that it was not their place to be directing doctors on how to do their job, however junior medical staff in that session said that they wanted nurses to continue to articulate clinical concerns and advise them of the usual process for dealing with such situations. The junior medical staff acknowledged that they had a lot of theoretical knowledge at university, but felt that they had limited paediatric experience and required guidance on the normal working processes within the hospital. Medical participants highlighted to nursing participants the challenges they faced when on call, being contacted by various staff about patients who were of concern. They sometimes found it difficult to prioritize responses as the information they were given was too vague, and described how they are thinking constantly during the interaction around mentally triaging the response required. They often told the nurses that they needed to be clearer in articulating that they were concerned that a child is deteriorating using specific information succinctly, to quickly grab their attention.
(13/10/2014 Final Version) Page 79
Only 18% (12/65) of respondents completed the follow up online survey at 12 weeks post participation in the RESPOND course; of these, five were staff nurses, three were charge nurses, one foundation year 1 doctor and three medical students. 75% (9/12) had encountered a situation of a patient deteriorating on the ward since they had attended the course and the scenarios described were predominantly respiratory difficulties; increasing respiratory distress and one described a patient with increasing sepsis and shock. When asked to consider whether the RESPOND course had helped them to manage this situation, 50% (6/12) said the course helped a lot, with 42% (5/12) saying it had helped a little, only one person said the course had not helped them managing this situation. 83% (10/12) stated that the course had made them think different in their daily clinical work with 16% (2/12) saying it had partially made them think differently. The most useful things participants felt they had learned on the RESPOND course were:
improved communication between the doctors and nurses working more as a team using the SBAR communication technique (cited as really helpful by 50% participants) working through the real life cases
In their discussion, Tume et al. (2013) reported that hospital cardiac arrests had reduced from a mean of 21.3 (2009–2011) to 13 (in 2012) since the introduction of the RESPOND course. Primary outcomes for the third study (McKay et al. 2013) included;
daily frequency of vital signs measured documented incidences of health professional communication documented incidences of medical reviews
Secondary outcomes for the third study (McKay et al. 2013) included; unexpected admissions to PHDU/ICU number of calls to MET unexpected deaths increase in confidence in health professionals managing a deteriorating child
Results revealed significantly improved documentation of vital signs, communication and time to medical review. No significant differences in hospital mortality, medical emergency team reviews or unplanned admissions to critical care areas, some reduction in the number of patients requiring an unplanned admission to the paediatric high dependency unit), but this did not reach statistical significance. No significant change in any of the other patient outcomes.
Significant improvement in the daily documentation of many vital signs during the intervention period including: level of consciousness (0 (0–0) vs. 7.8 (5.8–12.0), P < 0.001), respiratory effort (0.0 (0–0) vs. 7.8 (5.8–12.6) P < 0.001), capillary refill (0 (0–0) to 1.1 (0–3.1) P < 0.001) and blood pressure (0.0 (0.0–1.1) vs. 0.0 (0.0–1.6), P = 0.007). All the other vital sign measurement frequency remained the same during the two periods.
Fewer children breached MET criteria in the intervention period (38.9% (n =102) vs. 20.4% (n = 45)).
Significant improvement in the number of documented communication episodes from nursing staff to the patient’s medical team following clinical instability during the intervention period (8.5% vs. 40.9%, P < 0.001).
Of the patients reviewed following clinical instability, the time to review was reduced from 30.0 (10.0–60.0) to 0 (0–30.0) minutes (P < 0.001).
Following the implementation of the intervention, improvements were seen in many areas (e.g. improved confidence/knowledge from training); but these improvements did not reach statistical significance.

(13/10/2014 Final Version) Page 80
4.7.2. Grey literature Education Paediatric Observation Priority Score (POPS) (specific to paediatric emergency department settings): A large aspect of the implementation process of POPS was education using a peer training model. This involved training being delivered at local sites by nursing staff with an education or research role (0.2WTE time allocated via HIEC funding; overseen by the lead investigators); this included a senior educator (with no clinical duties and was adult-practice based) at Leicester; a band 5 nurse with good paediatric skills but no formal education experience at Derby and a senior sister and a band 6 nurse who job-shared the role and represented the “average” skillset for most Emergency Departments at Mansfield. Initially the ‘educators’ received training delivered through short joint sessions on the POPS scores, quality improvement and audit theory and data collection methodologies. Educators then produced local training packages (these are referred to in Table 34 below). These packs were similar in form and function as they were based on a common model developed by the educators. The educator’s role was to deliver face-to-face training to staff members. Resourced developed during the project lifetime were a video learning resource (i.e. background to POPS; examples of POPS being used in practice; ad a demonstration of how to calculate the score); a POPS app and a HIEC promotional video. There is also a specific learning resource focusing on recognition of serious illness in children entitled ‘spotting the sick child’ (www.spottingthesickchild.com). To assess the impact of POPS on practice one common day was chosen to collect adherence and outcome of POPS across all three sites. There was evidence of increased use of POPS at all three sites (Leicester, Derby, Mansfield). Positive results from the peer learning included;
large number of staff trained; staff had enhanced confidence in assessing potentially sick children; staff had greater confidence in communicating any concerns; scoring system popular among nursing staff without paediatric training as POPS gave
confidence in their decision making with the peer approach facilitating and encouraging engagement;
nurses found POPS app useful to check physiological parameters against norms HIEC funding enabled development of a POPS electronic recording tool which went live in Leicester in September 2012. Challenges which the POPS project faced included:
time for HIEC educator data collection inhibited by paper based systems difficulty accessing electronic records ensuring senior staff buy-in dovetailing with existing scoring systems on wards
Training Manuals: Four training manuals were identified (Table 34). Three of these four training manuals were related to POPS, described previously, which was developed in the UK. The final manual is the COMPASS manual developed in Australia, also referred to previously. The three POPS manuals contain four scenarios for trainee’s to practise scoring on. COMPASS trains using a CD and manual to be worked through independently, an online quiz and a 3-hour face-to-face session. Leicester POPS, Mansfield POPS and COMPASS contain scores and what to do when a certain score is obtained. All three POPS manuals provide methods of evaluation for trainers which assess trainees’ ability to assess and recognise a sick child. Trainees are also given the option to write a reflection and action plan. Trainee’s for the Derby POPS include CED staff, while Leicester and Mansfield POPS are intended for health care professionals/staff involved in performing nursing observations in children’s emergency department. COMPASS is the only training manual to describe communication among healthcare professionals in the form of ISBAR.
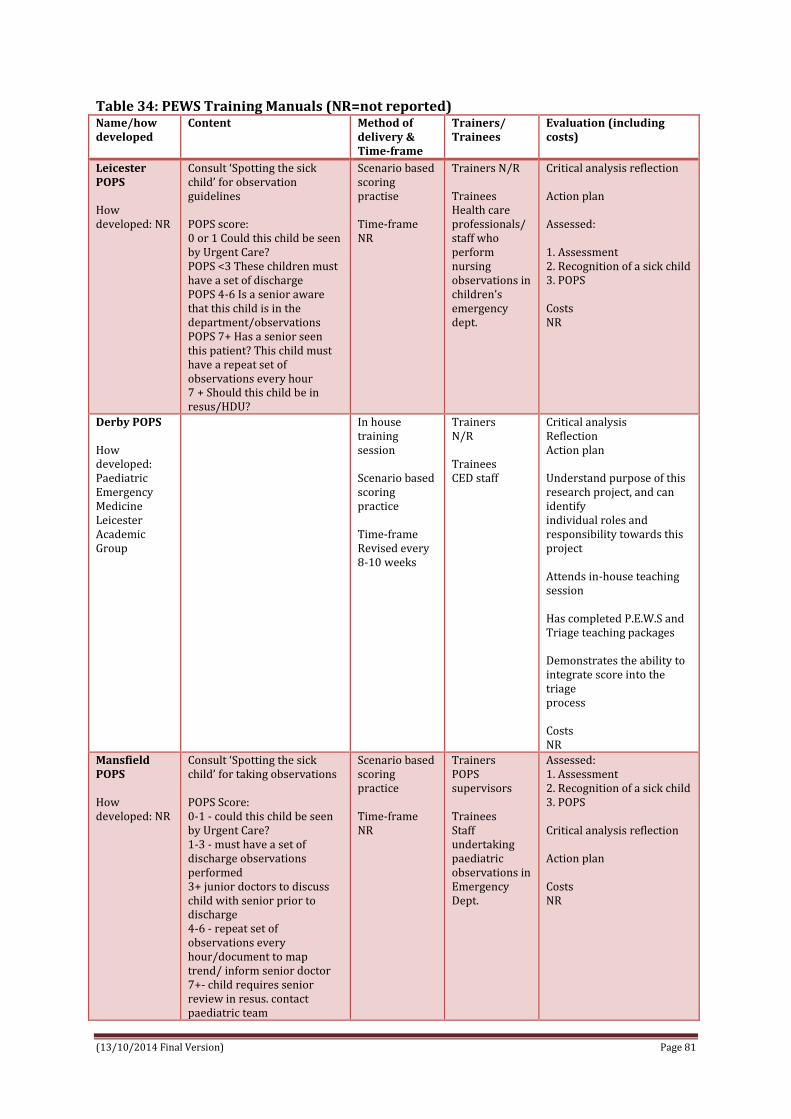
(13/10/2014 Final Version) Page 81
Table 34: PEWS Training Manuals (NR=not reported) Name/how developed
Content Method of delivery & Time-frame
Trainers/ Trainees
Evaluation (including costs)
Leicester POPS How developed: NR
Consult ‘Spotting the sick child’ for observation guidelines POPS score: 0 or 1 Could this child be seen by Urgent Care? POPS <3 These children must have a set of discharge POPS 4-6 Is a senior aware that this child is in the department/observations POPS 7+ Has a senior seen this patient? This child must have a repeat set of observations every hour 7 + Should this child be in resus/HDU?
Scenario based scoring practise Time-frame NR
Trainers N/R Trainees Health care professionals/ staff who perform nursing observations in children’s emergency dept.
Critical analysis reflection Action plan Assessed: 1. Assessment 2. Recognition of a sick child 3. POPS Costs NR
Derby POPS How developed: Paediatric Emergency Medicine Leicester Academic Group
In house training session Scenario based scoring practice Time-frame Revised every 8-10 weeks
Trainers N/R Trainees CED staff
Critical analysis Reflection Action plan Understand purpose of this research project, and can identify individual roles and responsibility towards this project Attends in-house teaching session Has completed P.E.W.S and Triage teaching packages Demonstrates the ability to integrate score into the triage process Costs NR
Mansfield POPS How developed: NR
Consult ‘Spotting the sick child’ for taking observations POPS Score: 0-1 - could this child be seen by Urgent Care? 1-3 - must have a set of discharge observations performed 3+ junior doctors to discuss child with senior prior to discharge 4-6 - repeat set of observations every hour/document to map trend/ inform senior doctor 7+- child requires senior review in resus. contact paediatric team
Scenario based scoring practice Time-frame NR
Trainers POPS supervisors Trainees Staff undertaking paediatric observations in Emergency Dept.
Assessed: 1. Assessment 2. Recognition of a sick child 3. POPS Critical analysis reflection Action plan Costs NR

(13/10/2014 Final Version) Page 82
Name/how developed
Content Method of delivery & Time-frame
Trainers/ Trainees
Evaluation (including costs)
COMPASS How developed: NR
Adult: How to calculate early warning score Track and trigger procedures Paediatric: age specific observation charts, example of PEWS for MET, heart rate, blood pressure, oxygen delivery, oxygen saturation, temperature (provided by GOSH) Describes what to do for each score. For example, for patients with a PEWS ≥ 4 • Review by CNC or Team Leader • Frequency of vital signs - ½ hourly for the first hour (more frequently if the patient’s condition dictates). If the patient’s condition improves they may then progress to: - 1/24 for the next four hours - 4/24 for the next 24 hours • Escort off ward area PEWS activation protocol Paediatric communication (ISBAR)
The CD and manual to be worked through independently. • An online quiz. • A 3-hour face-to-face session. Time-frame NR
Trainers N/R Trainees Nurses
Quiz to be completed online Cost NR
4.8. CULTURE, SOCIO-TECHNICAL AND ORGANISATIONAL ISSUES IMPACTING ON IMPLEMENTATION OF PEW DETECTION AND RESPONSE SYSTEMS (including situational awareness) 4.8.1. Research Literature Five papers focused specifically on cultural, socio-technical and organisational issues (including situational awareness) related to detection and response systems for reducing unrecognised child clinical deterioration (Azzopardi et al. 2011, Bonafide et al. 2013a, Brady & Goldenhar 2013, Brady et al. 2013, Roberts et al. 2014) (refer to Appendix 27 for data extraction table). Four papers emanated from the USA (Bonafide et al. 2013a, Brady & Goldenhar 2013, Brady et al. 2013, Roberts et al. 2014) and 1 from Australia (Azzopardi et al. 2011). Three papers reported using a qualitative approach to conduct interviews with nurses, physicians and other healthcare staff (Bonafide et al. 2013a, Brady & Goldenhar 2013, Roberts et al. 2014), 1 study employed an observational time series approach (Brady et al. 2013) and 1 study undertook an electronic survey (Azzopardi et al. 2011). The studies took place in either a tertiary (Azzopardi et al. 2011, Bonafide et al. 2013a, Roberts et al. 2014) or a quaternary-care (Brady & Goldenhar 2013, Brady et al. 2013) children’s hospital. Bonafide et al. (2013a) and Roberts et al.’s (2014) papers relate to the same study being conducted at Children’s Hospital of Philadelphia (CHOP) with the same population of respondents (i.e. 27 nurses and 30 physicians on general medical and surgical units) with the overall aim of identifying mechanisms by which early warning scores affect safety, the barriers to calling for urgent assistance and the role of families in the recognition of deterioration and MET activation; both papers report on different angles. Bonafide et al.’s (2013a) paper reports

(13/10/2014 Final Version) Page 83
on mechanisms beyond statistics to predict clinical deterioration by which physicians and nurses use of EWS to support their decision making, whereas Robert’s et al. (2014) report on the barriers to calling for urgent assistance in a children’s hospital despite the availability of a paediatric rapid response system (PRRS). Using a qualitative approach, semi-structured interviews were undertaken with 27 nurses and 30 physicians caring for children in general medical and surgical units at CHOP (Roberts et al. 2014). Both nurses and physicians valued RRS; believed it enhanced patient safety and improved relationships between clinicians in general care areas and in ICUs. Alongside facilitating factors, a number of barriers were identified that at times shaped decisions about whether or not to activate the MET (Table 35). Also, some staff reported regretting that they had not been more assertive in situations involving delays in escalation of care; such issues emerged for nurses both with limited and with extensive experience and also for medical residents; however attending physicians did not express any lack of self-efficacy regarding recognition of deterioration or activation of MET. Table 35: Barriers and Facilitators to MET activation Barriers Facilitators
Criticism/negative comments & attitudes from MET staff especially if patient not deemed unwell (significant more so for nurses and less experienced staff) Staff concern that their clinical decision making would be evaluated Nurses told not to call MET by doctors Poor staff self-efficacy who doubt ability to recognise patient’s clinical deterioration Staff lack of appreciation for severity of the patient’s condition (significantly more so for nurses and less experienced staff) Staff preference for calling the attending team/PICU before calling MET (80% nurses and 45% doctors who were MET callers reported this) Preserving relationships within own team – this becomes problematic when it prevents clinicians from seeking assistance from MET Hierarchical barriers challenging to navigate and led to delays in care of patients with deteriorating conditions Expectations of clinical outcomes from MET activations and intensive care unit transfers could strongly shape escalation-of-care behaviour due to previous experience Reluctance among subspecialty attending physicians to transfer patients to intensive care unit for fear of inappropriate management.
Teaches nurses better management of severely ill patients Presence of self-efficacy to overcome hierarchical norms and resistance Use of mechanisms to overcome such barriers e.g. teaming up with charge nurse Expectations of MET call outcomes - Previous positive experiences more likely to activate MET quickly
In a quantitative online survey of medical (n=127) and nursing staff (n=280) who were MET callers and MET responders, Azzopardi et al. (2011) also reported on attitudes and barriers to MET (Table 35). One important thing about PEWS/MET is early intervention and none delay; however in Azzopardi et al.’s (2011) survey 128 (44.3%) staff reported a situation where MET activation was delayed. Nurses were more involved than doctors in delayed activation (50.0% vs. 33.3%, p < 0.01). Preference to contact either the attending doctor or PICU directly were common reasons; 41% nurses reported being told not to call a MET by doctors; 15% nurses and 30% doctors had not appreciated the severity of the patient’s condition; nurses and less

(13/10/2014 Final Version) Page 84
experienced staff were significantly more reluctant to call MET because of fear of criticism. Less experienced staff reported delayed MET call because they did not appreciate how unwell the patient was. Alongside describing some barriers and facilitators to MET activation, Azzopardi et al. (2011) and Roberts et al. (2014) identify a number of advantages and disadvantages of MET reported by health professionals (Table 36). Table 36: Advantages and Disadvantages of MET Disadvantages Advantages
Inadequate training of medical MET responders MET de-skills doctors in managing unwell patients Overuse of MET - nurse MET responders views & MET callers medical staff Calling MET even if vital signs normal (half of clinical staff) Not activating MET if vitals abnormal as patient looked well (32% nurses and 47% doctors) Increase in workload for MET responders Too many people attending MET Lack of clear leadership and defined roles
Teaches nurses better management of severely ill patients Immediate support from experienced staff Early intervention MET initiated by anyone at any time
4.8.1.1. Situation Awareness Two papers (Brady & Goldenhar 2013, Brady et al. 2013) conducted in the US examined the role of situation awareness (SA) in relation to clinical deterioration. Situation awareness is defined as ‘knowing what is going on’ exists at three levels; perception of environmental elements within a volume of time and space, comprehension of the meaning of these elements in context and projection of the status of these elements in the near future (Brady & Goldenhar 2013, Brady et al. 2013).
In examining situation awareness, Brady & Goldenhar (2013) sought to learn more about factors that influence a front-line healthcare providers’ ability to achieve and maintain SA and to identify, address and escalate the recognition of risk for patients in inpatient setting. In the second study, Brady et al. (2013) designed a system to identify, mitigate, and escalate patient risk by using principles of high-reliability organizations. The authors hypothesized that a novel care system would decrease transfers determined to be unrecognized situation awareness failures events (UNSAFE). One study used qualitative methods (Brady & Goldenhar 2013) while the other was a quantitative observational time series study (Brady et al. 2013). Both studies were conducted at Cincinnati Children's Hospital a 523-bed academic, quaternary-care, free- standing children’s hospital. In Brady et al.’s (2013) paper it is reported that an RRT (called a medical response team [MRT]) had been in place since 2006 with defined activation criteria (i.e. as described by Brilli) and a modified version of the Monaghan paediatric early warning score (PEWS) was tested and spread across the hospital in 2007. Brady and Goldenhar (2013) invited 700 inpatient charge and bedside nurses, respiratory therapists (RTs) & senior paediatric residents to participate in focus group interviews. Thirty-one staff participated; including 10 charge nurses, 8 bedside nurses, 3 RTs, and 10 2nd year or 3rd year residents. Over ½ of nurse/RT participants had 10 or more years of experience and 33% had worked at CCHMC for over 20 years. Participants were assigned to one of seven semi-structured focus group interviews based on their role (e.g. charge nurse, resident).

(13/10/2014 Final Version) Page 85
Using a constant comparative analysis, Brady and Goldenhar (2013) categorised three emergent themes (team based care, availability of standardised data, and standardised processes and procedures) and nine sub-themes (family empowerment; nurse empowerment; unit culture that supports teamwork, accountability and safety; standardised data elements/scores; tools for entering, displaying and monitoring data and data trends; shared training and language regarding patient risk; structure to proactively identify and plan for risk; structure to support handoffs and continuity of care; and structure that supports adequate workload/staffing) as social, technological and organisational system inputs that influenced, either positively and/or negatively, the achieving of SA and identifying, mitigating and escalating the recognition of patient risk (Tables 37 & 38). In proposing implications of these findings and guidance for future steps Brady & Goldenhar (2013) suggest that social inputs may improve with specific interventions targeted at improving safety culture and interventions such as structured nurse and family participation in rounds; technological inputs would be aided by electronic health records, however further research is required to improve the accuracy of early warning scores and in the development of evidence-based user interfaces; organisational inputs such as training around shared language and ‘huddles’ to proactively search for risk were important areas stipulated for further evaluation and improvement.
Table 37: Negative influences to achieving Situational Awareness Social Technological Organisational
Nurses fear of speaking up and/or being wrong in front of peers, supervisors and physicians Disagreements about plans among team members and lack of collegiality/teamwork Lack of familiarity with and trust of team members on MET
Objective algorithms not used in standardised manner across units or providers; this limits effectiveness Algorithms not applicable for use with certain patients (e.g. high PEWS score could be a baseline for certain patients) Clinical staff (e.g. nurses, doctors, respiratory therapists) all chart information differently and in different places – makes it more difficult to share patient information
Inexperienced providers (e.g. new nurses and residents)
unfamiliar with standardised processes thus may have task fixation as opposed to seeing the whole picture
reluctant to ask for a second opinion being asked to care for complex
patients with diseases they are unfamiliar with
Variation in understanding and application of standardised terms/language (e.g. ‘watcher’ and ‘high-risk therapy’) Lack of standardised practices and procedures for identifying and planning for risk – leads to lack of role clarity, missed communication, and misunderstandings Caring for very sick patients or those with whom providers have less personal and clinical familiarity (e.g. disease type) Fewer resources available (e.g. night shifts) and competing demands due to heavy workloads

(13/10/2014 Final Version) Page 86
Table 38: Positive influences to achieving Situational Awareness Social Technological Organisational
Family empowerment – listening to, engaging with and giving families power to escalate concerns to a higher levels Nurse empowerment – having a powerful, equal and welcomed voice in huddles and within patient care team; having the ability and confidence to ‘go up the chain’ and escalate a situation A culture that facilitates and builds trusting relationships Willingness to ask for second opinions Being accountable for carrying out mitigation plans and escalating patient care if needed Open team communication and supportive teamwork
In addition to ‘gut feeling’, having objective standardised algorithms/PEWS for conducting patient assessment Electronic health care record; ability to display data trends over time
Training providers in common language and terminology (e.g. ‘watcher’ defined as ‘gut feeling’ about a patient that is at risk for deterioration) Experienced providers in deterioration/critical care (better assessment skills, critical thinking, clinical judgement, resource use) Experienced providers ability to train others through peer coaching, mentoring and debriefs Structures to proactivity identify and plan risk – huddles; proactive assessment and planning; clear MET calling criteria Standardised ‘hand-off’ practices Knowledge of patient history and baseline Knowledge of patient’s family Documented ‘follow-up’ plan Adequate staffing – improved staff-to-patient ratio An experienced and diverse team of providers available on all shifts with staff knowledge of disease/patient population Extra resources available if needed
Brady et al.’s (2013) situation awareness (SA) intervention was described as including (see Table 39):
(1) formalized process where bedside nurses proactively identified the following 5 factors*;
family concern about patient safety, high-risk therapies including unfamiliar therapies on the unit elevated PEWS of >=5 ‘watcher’ or a patient where a clinician had a “gut feeling” that the patient was
at risk for deterioration or “close to the edge,” communication concern that may impact patient safety
(2) unit-based huddles where charge nurses and physicians discussed identified factors and developed mitigation plans (3) initiation of 3-times daily inpatient huddles where individual patient risk was discussed and specific predictions made (4) development of a continuous learning system to evaluate SA and UNSAFE transfers (5) and 1 year later, development of a “robust” and explicit plan for patients identified as having 1 of the risk factors.
*Note: These five risk factors were determined following two investigators review of 20 consecutive serious safety events (SSE) and 80 consecutive ICU transfers to identify potential predictors of deterioration. The presence of at least 1 of these 5 risk factors was found in each case.

(13/10/2014 Final Version) Page 87
Table 39: Situation awareness intervention (Brady et al. 2013) Proactive identification of risk
Unit-based huddles 3-times daily inpatient huddles
Continuous learning system to evaluate SA
Robust plan
Fundamental job of bedside nurse and intern was to identify any of 5 risk factors – most touch time with patient but often least experienced Tools developed to support bedside nurse identifying risk factors during routine assessments – structured yes/no questions ‘Watch-stander’ asks bedside nurse if aware of any SA risk factors? 1. Do you have any patients who are ‘watchers’? 2. Do you have any patients on ‘high risk or unfamiliar meds/therapies’? 3. Do you have any ‘communication concerns’ that could impact safety? 4. Do you have any ‘family concerns’ that could impact satefy? 5. Do you have any patients with a high ‘PEWS’?
Huddles between charge nurse & bedside nurse every 4hours, regardless of identified risk Huddles also promoted whenever new risk factors identified Huddles were led by a watch-stander charge nurse and senior resident when risk was identified A plan to mitigate that risk developed This process provided a standardised opportunity for more experienced clinicians to coach less experienced in patient management and communication/escalation techniques Note: ‘watch-stander’ term was borrowed from military to highlight that the primary job of charge nurse & senior resident was to know which patients were at high risk for deterioration
8am, 4.30pm, 12mn Huddles between all inpatient charge nurses, manager of patient safety (MPS) and safety officer of the day (SOD)-an experienced paediatrician Charge nurse from each inpatient unit (1) reported on the presence of any risk factors not fully addressed and (2) predicted any MRT activations MPS and SOD provided coaching on how to address concerns raised; provided positive reinforcement of key behaviours and role modelling
Development of a data a system to rapidly identify process and outcome failures 1. apparent cause analysis (ACA) forms were completed within 1hour of each floor to ICU transfer to identify UNSAFE transfers and associated process failures 2. password-protected database constructed to integrate information from these forms and the EHR 3. process and outcome data distributed each week to unit level clinical and medical directors with a story of patient-level SA 4. control plan designed with inpatient leaders to identify special cause on tracked process and outcome measures and target further interventions
1 year after SA work began, improvement team worked with one inpatient unit to develop and test a checklist to improve mitigation/escalation process for patients with identified risk. A ‘robust plan’ bundle was proposed; 1. plan with proposed treatment change 2. explicit communication with care team 3. prediction of expected outcome 4. outcome deadline 5. escalation plan if outcome not achieved by deadline (usually MRT or discussion with SOD/MPS) This tool tested, adapted and implemented throughout all inpatient units
In evaluating their SA intervention, Brady et al. (2013) collected data initially from each unit on each nursing shift to measure the reliability that each shift identified all patients at risk and mitigated or escalated that risk. This data was captured through a checklist-based form completed by each charge nurse according to the SA flow algorithm used in the hospital. UNSAFE transfers were identified from the ACA process and validated against review of the EHR for each ICU transfer. SSEs were captured through a safety reporting process. Brady et al. (2013) found that the rate of UNSAFE transfers per 10,000 non-ICU inpatient days was significantly reduced from 4.4 to 2.4 over the study period. The days between inpatient SSEs also increased significantly. The number of units by week where >=90% of weekly nursing shifts fully identified and mitigated or escalated patient risk were tracked on run charts and revealed both improved and sustained performance for 11 months of tracking. On each participating unit, 90% to 95% of identified risk was mitigated by the primary team with no escalation needed.

(13/10/2014 Final Version) Page 88
Each inpatient huddle took less than 30 minutes. Initially there was substantial variation in the number of patient risks that were escalated, a median of 2 risks for each huddle were escalated the first year. This increased over the study period with a median of 7.5 concerns escalated in May 2012. An initial decrease in UNSAFE transfers occurred, though it did not meet rules for special cause and was not sustained. Analysis of UNSAFE transfers through an ongoing ACA process revealed that in the vast majority of UNSAFE transfers, patient risk had been identified but not fully mitigated on unit or escalated to the MRT or safety team the rate of UNSAFE transfers improved from a baseline of 4.4 to 2.4 transfers per 10 000 non-ICU inpatient days, meeting criteria for special cause variation with 8 points below the median line. A significant change in the days-between inpatient SSEs from 100 days to >400 twice was observed in association with the intervention. As discussed by Brady et al. (2013), their SA intervention supplements early warning scores with other risk domains, most notably the concept of the ‘watcher’ (i.e. a patient that a clinician has a ‘gut feeling is close to the edge’); thereby acknowledges the tacit knowledge of experienced clinicians. Brady et al. (2013) highlight that their intervention is somewhat similar to the ‘Rover team’ concept described by Hueckel in that both are involved in the ‘proactive assessment of risk’, however the SA intervention differs in its staffing model and broader scanning for risk. Brady et al.’s (2013) work was conducted in a single site and while the work was underpinned by a SA conceptual model it did not have a specific measure for SA; thereby unable to reveal whether SA improved as a result of the SA intervention, and/or whether improved SA was the mediator between the identify, mitigate, and escalate intervention and the decreased rate of UNSAFE transfers. 4.9. Other grey literature 4.9.1. Discussions, commentaries, conference presentations As mentioned previously, a number (n=52) of discussion papers, commentaries and conference presentations were retrieved during our searches of the electronic databases (Appendix 33). These are summarised here.
10 conference abstracts (Ahmed et al. 2005, Dryden-Palmer et al. 2010, McLellan et al. 2011, Zuckerman et al. 2011, Schroeder et al. 2012, Holme et al. 2013, Raymond et al. 2013, Szadkowski et al. 2013, Norville et al. 2013, McLellan et al. 2014)
3 commentaries (Comden et al. 2011, McKay 2011, Fraser et al. 2012) 3 discursive papers (Tume & Bullock 2004, Naddy 2012, Roueché & Runnacles 2014) 6 summaries (Greenhouse et al. 2006, Rushforth 2006, Adshead & Thomson 2009,
Chapman 2009, Oldroyd & Day 2011, Henderson 2012) 15 presentations; 11 of which were presentation abstracts. 6 of these were poster
presentation abstracts (Ryan 2011, Banque & Obra 2011, Flannigan & Hogan undated, Sefton et al. 2011, Fuijkschot et al. 2013, Gawronski et al. 2013), 3 were oral presentation abstracts (Aramburo et al. 2011, Sefton et al. 2011, Kolovos et al. 2013) and 2 presentation abstracts (Waller 2008, Joudrie et al. 2014). 4 were power-point presentations (Monaghan 2009, Sellers et al. 2011, Sefton et al. 2011, Ceely 2013).
1 audit report abstract (Joshi et al. 2011) 1 study abstract (Lloyd-Hughes et al. 2011) 1 interview study (McCabe & Duncan 2008) 1 speaker abstract (Sefton et al. 2013) 1 critical analysis (Roland 2012) 1 retrospective review (Oliver 2010) 2 position papers (McCabe et al. 2009, Pearson & Duncan 2011) 2 editorials (Guise & Lowe 2006, Nowak & Brilli 2007) 4 letters to the editor (Haines 2006, Tibballs & Kinney 2006, Frost & Wise undated,
Sharek & Roth 2007) 1 article (Duncan 2007)

(13/10/2014 Final Version) Page 89
The specific focus of these documents included: Detection systems: 30 pieces looked at PEWS with 5 looking specifically at PEWS
development (Rushforth 2006, McCabe et al. 2009, Monaghan 2009, Oliver 2010, Naddy 2012). 2 looked at PEWS audits (Joshi et al. 2011, Lloyd-Hughes et al. 2011), 5 described PEWS (Tume et al. 2004, Adshead et al. 2009, Oldroyd et al. 2011, Pearson & Duncan 2011, Fraser et al. 2012), 5 looked at PEWS in relation to observation and monitoring (Tibballs et al. 2006, McCabe et al. 2008, Sefton et al. 2011, Sefton et al. 2011, Roueche et al. 2014) while 10 evaluated PEWS (Ahmed et al. 2005, Waller 2008, Aramburo et al. 2011, Sefton et al. 2011, Sellers et al. 2011, Banque et al. 2011, Roland 2012, Szadkowski et al. 2013, Fuijkschot et al. 2013, McLellan et al. 2014). 2 pieces looked at neonatal early warning scores (Flannigan & Hogan undated, Holme et al. 2013) and one looked at the psychometric properties of PEWS (Ryan 2011).
Response systems: 3 pieces looked at rapid response teams (Sharek & Roth 2007, Nowak & Brilli 2007, Frost & Wise undated), while another looked at an MET team (Raymond et al. 2013) and another looked at Track and Trigger (Duncan 2007).
Implementation: 6 pieces of literature looked at PEWS implementation (Greenhouse et al. 2006, Dryden-Palmer et al. 2010, Zuckerman et al. 2011, Schroeder et al. 2012, Henderson 2012, Norville et al. 2013). 3 pieces looked at RRT implementation (Kolovos et al. 2013, Ceely 2013, Joudrie et al. 2014).
Education: 4 pieces looked at education (Guise & Lowe 2006, McKay 2011, Comden et al. 2012, Sefton et al. 2013).
Outcomes: All outcomes were similar to those reported in other screened studies.
4.9.2. Ongoing studies – No data available as yet European Union Network Patient Safety and Quality of Care (PaSQ) - Pan-European
project; Paediatric Early Warning Score (PEWS). Project funded from Apr. 2013 until Mar. 2015. Seven work packages. Aim is to support the implementation of the Council Recommendations on Patient Safety. http://www.eu-patient.eu/whatwedo/Projects/Non-EPF-Led-EU-Projects/European-Union-Network-for-Patient-Safety-and-Quality-of-Care-PaSQ/
Evaluating Processes of Care & the Outcomes of Children in Hospital (EPOCH) http://clinicaltrials.gov/ct2/show/NCT01260831?term=paediatric+early+warning&rank=2
Triage of Children at the Emergency Department: Manchester Triage System or Pediatric Early Warning Score? http://clinicaltrials.gov/ct2/show/NCT02094404?term=paediatric+early+warning&rank=3
UK project being led by Colin Powell just commenced examining PEWS implementation and evaluation as a ‘complex intervention’ across a number of sites; something which has been missing from the published literature to date.
An executive summary of the main findings from this systematic review has been provided at the outset of this report (pages 6-9).
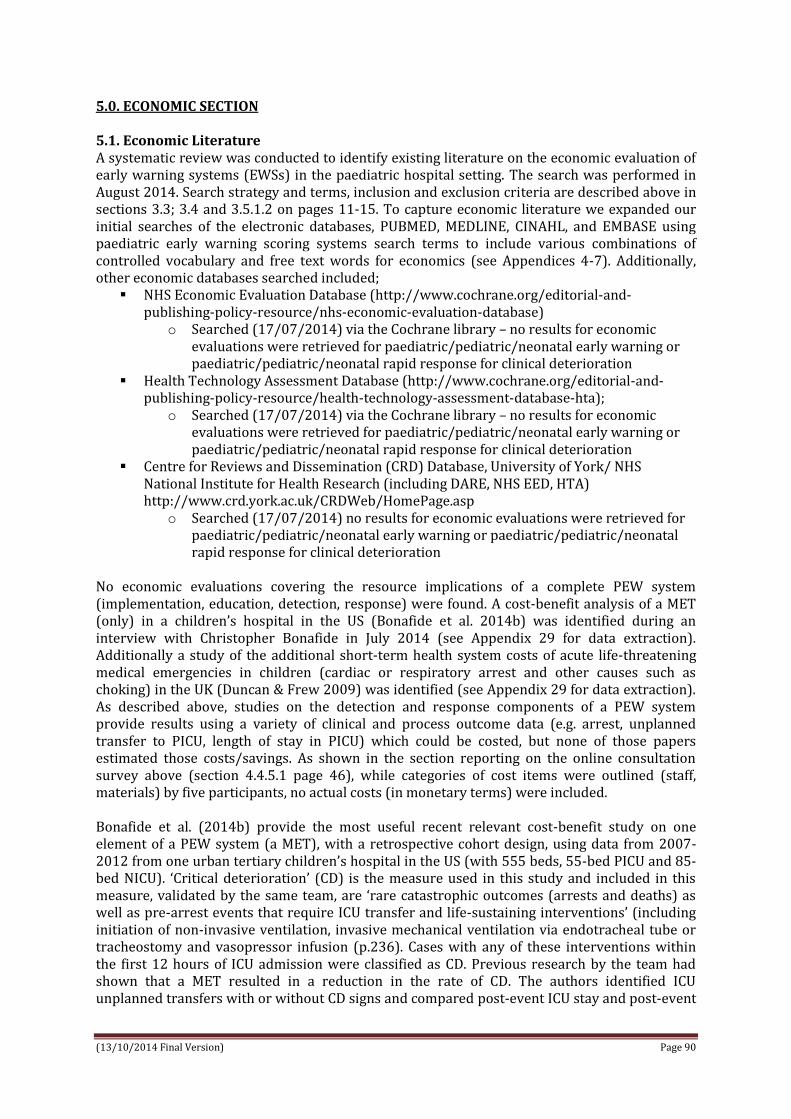
(13/10/2014 Final Version) Page 90
5.0. ECONOMIC SECTION 5.1. Economic Literature A systematic review was conducted to identify existing literature on the economic evaluation of early warning systems (EWSs) in the paediatric hospital setting. The search was performed in August 2014. Search strategy and terms, inclusion and exclusion criteria are described above in sections 3.3; 3.4 and 3.5.1.2 on pages 11-15. To capture economic literature we expanded our initial searches of the electronic databases, PUBMED, MEDLINE, CINAHL, and EMBASE using paediatric early warning scoring systems search terms to include various combinations of controlled vocabulary and free text words for economics (see Appendices 4-7). Additionally, other economic databases searched included;
NHS Economic Evaluation Database (http://www.cochrane.org/editorial-and-publishing-policy-resource/nhs-economic-evaluation-database)
o Searched (17/07/2014) via the Cochrane library – no results for economic evaluations were retrieved for paediatric/pediatric/neonatal early warning or paediatric/pediatric/neonatal rapid response for clinical deterioration
Health Technology Assessment Database (http://www.cochrane.org/editorial-and-publishing-policy-resource/health-technology-assessment-database-hta);
o Searched (17/07/2014) via the Cochrane library – no results for economic evaluations were retrieved for paediatric/pediatric/neonatal early warning or paediatric/pediatric/neonatal rapid response for clinical deterioration
Centre for Reviews and Dissemination (CRD) Database, University of York/ NHS National Institute for Health Research (including DARE, NHS EED, HTA) http://www.crd.york.ac.uk/CRDWeb/HomePage.asp
o Searched (17/07/2014) no results for economic evaluations were retrieved for paediatric/pediatric/neonatal early warning or paediatric/pediatric/neonatal rapid response for clinical deterioration
No economic evaluations covering the resource implications of a complete PEW system (implementation, education, detection, response) were found. A cost-benefit analysis of a MET (only) in a children’s hospital in the US (Bonafide et al. 2014b) was identified during an interview with Christopher Bonafide in July 2014 (see Appendix 29 for data extraction). Additionally a study of the additional short-term health system costs of acute life-threatening medical emergencies in children (cardiac or respiratory arrest and other causes such as choking) in the UK (Duncan & Frew 2009) was identified (see Appendix 29 for data extraction). As described above, studies on the detection and response components of a PEW system provide results using a variety of clinical and process outcome data (e.g. arrest, unplanned transfer to PICU, length of stay in PICU) which could be costed, but none of those papers estimated those costs/savings. As shown in the section reporting on the online consultation survey above (section 4.4.5.1 page 46), while categories of cost items were outlined (staff, materials) by five participants, no actual costs (in monetary terms) were included. Bonafide et al. (2014b) provide the most useful recent relevant cost-benefit study on one element of a PEW system (a MET), with a retrospective cohort design, using data from 2007-2012 from one urban tertiary children’s hospital in the US (with 555 beds, 55-bed PICU and 85-bed NICU). ‘Critical deterioration’ (CD) is the measure used in this study and included in this measure, validated by the same team, are ‘rare catastrophic outcomes (arrests and deaths) as well as pre-arrest events that require ICU transfer and life-sustaining interventions’ (including initiation of non-invasive ventilation, invasive mechanical ventilation via endotracheal tube or tracheostomy and vasopressor infusion (p.236). Cases with any of these interventions within the first 12 hours of ICU admission were classified as CD. Previous research by the team had shown that a MET resulted in a reduction in the rate of CD. The authors identified ICU unplanned transfers with or without CD signs and compared post-event ICU stay and post-event

(13/10/2014 Final Version) Page 91
hospital stay for the two groups. Patients who have CD costs more to care for overall while they are in ICU and for the remaining hospital stay; the authors highlight that CD events do not just represent adverse outcomes for patients and their families, but are very costly for health systems. They costed staffing wages and administering (team leader costs) the MET. The costs of eight different MET models (freestanding versus teams with concurrent responsibilities in ICU) with varying team composition (Registered Nurse (RN) + Respiratory Therapist (RT), and RN, RT + critical care fellow/ a nurse practitioner/ a critical care attending physician) were calculated and cost-benefit analysis conducted. The researchers estimated the reduction in CD events necessary to offset the costs of the MET team in the eight scenarios. Using the RN and RT team, who had concurrent responsibilities in ICU (cost per hour to staff team of $107, the lowest costed team), three CD events would offset the costs of the MET (compared to pre-MET). This rose to 24 events needed to offset the costs of the free-standing ‘RN, RT and attending’ team (the most expensive team). Beyond this break-even point, all CD events averted (by the MET) after that would represent savings, as patients with CD events have higher costs. Bonafide et al.’s (2014b) study just examined the cost-effectiveness of a MET in a tertiary hospital setting, representing one option as part of the response arm of a EWS. The setting is somewhat comparable to perhaps the two Dublin children’s hospitals with ICUs. METs have not been introduced as part of the adult EWS in Ireland. It is unlikely that apart from the two tertiary children’s hospitals in Dublin (and eventually the national children’s hospital), that a paediatric MET would be established, and even in those sites, existing teams may more likely be involved in the response arm of the EWS. Duncan & Frew (2009) in the UK present costs of in-hospital paediatric life-threatening events as part of research to identify preventative strategies (such as ‘early responses and emergency team stabilisation teams’ (p 533)). The focus of that study was on costs of CPR and after care and not of detection and response to clinical deterioration; however the results can provide some relevant information as the goal of an EWS goal is to prevent further deterioration to such medical emergencies. The study took place in a UK children’s hospital with 175 beds and 20 PICU beds. Prospective data were collected over a 27 month period 2004-2007. Costs of children requiring post-event care and follow-up were compared with a control group of children requiring PICU admission, matched for age and specialty, but without an arrest/other life-threatening event. Costs included the CPR attempt, CPR preparedness, post-CPR stay in PIC and until discharge. Costs for cardiac arrest and respiratory arrest and other events are given as overall annual cost and cost per event (in GB£); outcomes and costs are compared for those with arrests/ events and other urgent PIC admission and the authors highlight the differences with recorded adult outcomes and costs (paediatric costs are higher). All efforts to prevent all arrests/events and all urgent PIC admissions are recommended by the researchers, as post-admission costs for the latter are higher than arrest/event cases. 5.2. Detailed consideration of budget impact and resource implications Initial phase Cost – educational package Several educational packages used in paediatric settings using PEWS were reviewed above, including COMPASS and RESPOND. There does not appear to be a cost structure for the educational packages themselves, but training/travel by the developers may be required. COMPASS is being used in the adult settings in Ireland to support the ViEWS in place.

(13/10/2014 Final Version) Page 92
Savings Several children’s hospitals services in Ireland have been using PEWS, though no cost information on existing education packages to support them is available to this team for Irish settings. As there is no national/ formal education programme running related to PEWS in children’s services, it is likely that there will be no or minimal savings on existing educational costs. Costs – staff There is some difficulty in identifying the exact numbers working in children’s hospitals services in Ireland. The structure of paediatric services is outlined in HSE (2013) and this provides some useful data with which to estimate staffing numbers for children’s care by nurses and doctors (neonatal nurses have not been included here) (Table 40). There are:
11 peripheral hospitals which have paediatric units: Ballinasloe, Castlebar, Cavan, Clonmel, Kilkenny, Letterkenny Mullingar, Portlaoise, Sligo, Tralee and Wexford.
o The typical manpower profile is stated to be three consultant paediatricians, 10 NCHDs, 22 paediatric nurse WTEs.
So total of approximately 110 WTE NCHDs, 33 paediatricians, 242 RCNs in these settings overall
The 5 regional units are Cork (biggest service), Drogheda, Galway, Limerick and Waterford.
o It is stated that on average these regional units comprise of: 7 paediatric consultants, 8 registrars, 8 SHOs, 39.7 Paediatric nurse WTEs.
o However it is noted that Cork University Hospital has: 10 paediatric consultants, 2 registrars, 7 SHOs, 1 intern; 70 Paediatric nurses
But taking the average as stated: total of approximately WTE 35 consultant paediatricians, 40 registrars, 40 SHOs, 200 RCNs in these settings overall
The 3 Dublin paediatric hospitals: from individual hospital reports (HSE 2013) o RCNs: OLHC 690 + CUH 373 + NCH (100 estimate, no data)= 1163 WTE o Consultant paediatricians: OLHC 75 + CUH 50 + NCH 12= 137 WTE o NCHDs: OLHC (39 + 34 + 35= 108) + CUH (27 + 28 + 24= 79) + NCH (7 + 7 + 13 +
1= 28)= 215 WTE
Table 40: Approximate WTE per staff group (HSE 2013)
The number (not WTE) of RCNs employed in in children’s hospital sector is stated to have been 2,114 in 2012 (1,956 WTEs) (HSE 2012). This was stated to be 1,665 in 2009 (Behan et al. 2009), based on the data from the National Children’s Nurses Retention and Recruitment Project. However it is not clear if this includes registered general nurses in settings with children (e.g. ED in general hospital). It is also possible that nurses in general hospitals may have undergone training in the use of ViEWS (using COMPASS). As for the NEWS, not all nurses will require this education (e.g. those in administration) and recent graduates may receive it as part of their programme. However it can be estimated that approximately 2,000 nurses would undergo the training.
Peripheral Regional Tertiary Total WTE
RCNs 242 200 1,163 1,605 Consultants 33 35 137 205 NCHDs 110 80 215 405

(13/10/2014 Final Version) Page 93
A proportion of doctors will also require education. Using data from HSE (2013) there are approximately 205 consultants and 405 NCHDs in children’s services (excluding neonatology). If one third are trained, based on a similar proportional number as in the NEWS budget impact analysis, this equates to 200 trainees. There are incomplete data on allied health professionals available, but an additional 100 allied health professionals (physiotherapists, occupational therapists etc) might be trained; though this is an arbitrary estimate as further enumeration is required of allied health professionals in the children’s hospital services setting. So in total 2,300 will be trained. Estimating the time required to undertake the programme at 8.5 hours (as for COMPASS, NEWS), then using the HSE salary scales below, the costs for staff to undertake the programme are estimated at €491,368 (Table 41). As some studies reviewed above highlight, this training can be incorporated within existing programmes. Table 41: Salary scales (DoH 2013) & education delivery/participation cost calculations
Profession Grade costed (DoH 2013, pre-2010 scales chosen)
Annual salary
Full labour cost (pay + employer PRSI salary costs of 10.75% + 4% imputed cost on pay + overheads of 25% on pay)
Number being trained
Cost for 8.5 hours of training – allocated as 1 working day
Costs per professional group for training attendance (2000 nurses, 200 doctors, 100 AHPs)
Costs for 2 weeks (per trainer)
Costs per profession for trainers (10 of each)
Nurse Staff nurse (RCN)- point 6 on 11 point scale
€37,408 €52,278 2,000 €201 €402,136 €2,011 €20,106.80
Doctor Registrar- point 4 on 6 point scale
€60,010 €83,864 200 €323 €64,511 €3,226 €32,255.38
Allied health professional
Physiotherapist- point 6 on 12 point scale
€45,993 €64,275 100 €247 €24,721 €2,472 €24,721.24
Total €491,368 €77,083
If, as per the NEWS, a multi-disciplinary ‘train the trainer’ model is adopted for implementation of the education programme, the staff groupings involved are identified in the above table. It is acknowledged however that the majority of those to be trained are nurses and it may be more feasible to have a greater proportion of trainers who are nurses (perhaps in existing education roles, e.g. Centres for Nurse Education). It is not known if staff working in child services have already been trained to deliver the programme (for example the COMPASS programme) but it can be assumed that they have not. As per NEWS, delivering an education session could be estimated to take 8 hours (6 hours education and 2 hours preparation time) and again the average education sessions could include 10 trainees (per 2 trainers). The number of sessions each trainer would be required to deliver would vary hugely depending on the site (tertiary,

(13/10/2014 Final Version) Page 94
regional, peripheral). Overall if training is to be delivered to 2,300 staff members across the country, assuming each trainer trains 7 groups of 10, approximately 30 trainers would be required (each trainer spends 8 hours x 8 groups = 64 hours training = 2 working weeks). If this was delivered by a multi-disciplinary team (10 of each profession), assuming the same average salary costs as before the staff time cost involved to deliver education is an estimated € 77,083 (trainers) (Table 41). Since staff will not usually be replaced while delivering or undergoing training, these costs are not cash costs but opportunity costs and have been incorporated into other training programmes being undertaken (e.g. induction for new staff). Additional training will be a challenge in the current child health service where staffing has been identified as a challenge (HSE 2013) Costs – materials Manuals, CDs, sample observation charts and ISBAR Charts, for 2300 staff to be trained are estimated to cost €2000 based on costing for NEWS materials (which required training and therefore materials by a multiple of ten compared to children’s services). On-going intervention costs Costs – staff For the scoring aspect of the PEWS, a number of observations are taken, charted and a score is calculated. If additional observations are added (which is not the case e.g. with the Toronto PEWS) this will add a short amount of time per set of observations. As with NEWS these are taken to be negligible in time and cost terms. Depending on the response approach chosen within a PEW system, there may be additional costs, but also savings based on prevented arrests and other emergencies. As described above (Bonafide et al. 2014b), the costs of a PMET are met by savings in preventing arrests and other critical deterioration, which are costly (Duncan & Frew 2009). As with NEWS it is likely that ongoing education would consist of a short refresher course to be completed every 2 years. If the refresher education programme takes approximately 1 hour with no additional material costs, the ongoing education would cost €61,421 approximately annually, based on the same number of staff (2,300) estimated to need the initial education (one-eighth of that cost). Costs – materials As with NEWS the replacement of the existing observation sheets with the PEWS chart will have negligible costs. Cost savings from improved outcomes As stated above, no economic evaluations of a PEW system in its entirety have been identified. Research in the review has suggested improved clinical outcomes and savings associated with a MET, where critical deterioration is prevented, such as shorter ICU stay and shorter overall hospital stay (post-event) (Bonafide et al. 2014b). Other studies have shown better clinical outcomes associated with detection and response systems studied. While the trend is towards better outcomes for children and fewer invasive interventions (implying less cost) where a component of a PEWS has been studied, the available limited data on costs are less clear and somewhat contradictory (for example Duncan & Frew 2009 which found higher costs for control group (urgent PICU admission, not after event calls) than for post cardiac arrest admissions). Therefore it is not possible to identify the savings to the health service which are linked with improved outcomes.

(13/10/2014 Final Version) Page 95
As with the NEWS it is acknowledged that these will not amount to cash savings but to a freeing up of resources much needed in the paediatric system. Table 42: Summary of the annual economic impact
Category Item Approximate cost (€)
Initial phase* Non-staff Materials (manuals, CDs,
sample observation charts and ISBAR charts)
2,000
Staff** Trainees 491,368 Trainers 77,083 Ongoing intervention costs Non-staff PEWS charts Negligible Staff Additional measurements Negligible Charting score Negligible Additional resources to
respond to triggers Depends on response system
chosen Ongoing education 61,421 Savings Licence fee for system in
current use? Not known
Health service savings (e.g. ICU bed days)
Not known
Follow-up disability treatment from reduction in cardiac, respiratory arrests
Not known
Other * These are the one off costs associated with the initial roll out of the chosen education programme nationally. ** As per NEWS, it is assumed that the staff cost for delivering and participating in training is an opportunity rather than a cash cost and will require local planning and agreement.

(13/10/2014 Final Version) Page 96
6.0. Expert Advisory Group This national paediatric expert advisory group was established prior to the commencement of the systematic review with the remit to offer clinical and contextual expertise from an Irish context on considering the emergent evidence on PEW systems. We would like to acknowledge and thank the group members for their input. Dr. Cormac Breatnach Consultant Paediatric Intensivist, Chair of Resuscitation Committee
& Chair of the Hospital Clinical Guidelines Committee, Our Lady’s Children’s Hospital, Crumlin, Dublin
Dr. Sharon Condon Consultant Paediatrician, Kerry General Hospital, Kerry Ms. AnneMarie Dowling CNM 3, Emergency Department, Temple Street Children’s
University Hospital, Dublin Dr. Orla Franklin Chairman of Cardiac Services, Consultant Paediatric Cardiologist,
Our Lady Children's Hospital, Crumlin, Dublin Ms. Amanda Halpin Subject Librarian, Dublin City University, Dublin Ms. Una McAree CNM 2, Paediatric Ward, Cavan General Hospital Ms. Ann Moran Clinical Placement Coordinator Children, Cork University Hospital ,

(13/10/2014 Final Version) Page 97
REFERENCES
Akre M, Finkelstein M, Erickson M, Liu M, Vanderbilt L, Billman G. (2010) Sensitivity of the Pediatric Early Warning Score to Identify Patient Deterioration. Pediatrics. 215:2763-e769. Avent Y, Johnson S, Henderson N, Wilder K, Cresswell J, Elbahlawan L. (2010) Successful use of a rapid response team in the pediatric oncology outpatient setting. The Joint Commission Journal on Quality and Patient Safety. 36(1):43-45. Azzopardi P, Kinney S, Moulden A, Tibballs J. (2011) Attitudes and barriers to a Medical Emergency Team system at a tertiary paediatric hospital. Resuscitation. 82: 167-174. Behan J, Condon C, Milicevic I, and Shally C. (2009) A Quantitative Tool for Workforce Planning in Healthcare: Example Simulations. Report by the Skills and Labour Market Research Unit, FÁS on behalf of the Expert Group on Future Skills Needs. Dublin: FAS. Bell D, Mac A, Ochoa Y, Gordon M, Gregurich MA, Taylor T. (2013) The Texas Children’s Hospital Pediatric Advanced Warning Score as a Predictor of Clinical Deterioration in Hospitalized Infants and Children: A Modification of the PEWS Tool. Journal of Pediatric Nursing. 28:e2-e9. Bonafide CP, Roberts KE, Priestley MA, Tibbetts KM, Huang E, Nadkarni VM, Keren R. (2012) Development of a Pragmatic Measure for Evaluating and Optimizing Rapid Response Systems. Pediatrics. 129:e874-e881. Bonafide PC, Roberts KE, Weirich CM, Paciotti B, Tibbetts KM, Keren R, Barg FK, Holmes JH. (2013a) Beyond Statistical Prediction: Qualitative Evaluation of the Mechanisms by which Pediatric Early Warning Scores Impact Patient Safety. Journal of Hospital Medicine. 8(5):248-253. Bonafide CP, Brady PW, Keren R, Conway PH, Marsolo K, Daymont C. (2013b) Development of Heart and Respiratory Rate Percentile Curves for Hospitalized Children. Pediatrics. 131;e1150. Bonafide CP, Localio R, Roberts KE, Nadkarni VM, Weirich CM, Keren R. (2014a) Impact of Rapid Response System Implementation on Critical Deterioration Events in Children. JAMA Pediatrics. 168(1):25-33. Bonafide CP, Localio AR, Song L, Roberts KE, Nadkarni VM, Priestley M, Paine CW, Zander M, Lutts M, Brady PW, Keren R. (2014b) Cost-benefit analysis of a medical emergency team in a children’s hospital. Pediatrics. 134(2): 235-241. Bradman K & Maconochie I. (2008) Can paediatric early warning score be used as a triage tool in paediatric accident and emergency? European Journal of Emergency Medicine. 15:359-360. Brady PW & Goldenhar LM (2013) A qualitative study examining the influences on situation awareness and the identification, mitigation and escalation of recognised patient risk. BMJ Quality and Safety. 0:1-9. Brady PW, Muething S, Kotagal U, Ashby M, Gallagher R, Hall D, Goodfriend M, White C, Bracke TM, DeCastro V, Geiser M, Simon J, Tucker KM, Olivea J, Conway PH, Wheeler DS. (2013) Improving situation awareness to reduce unrecognised clinical deterioration and serious safety events. Pediatrics. 131(1):e298-e308.
(13/10/2014 Final Version) Page 98
Breslin K, Marx J, Hoffman H, McBeth R, Pavuluri P. (2014) Pediatric Early Warning Score at Time if Emergency Department Disposition is Associated with Level of Care. Pediatric Emergency Care. 30(2):97-103. Brilli RJ, Gibson R, Luria JW, Wheeler TA, Shaw J, Linam M, Kheir J, McLain P, Lingsch T, Hall-Haering A, McBride M. (2007) Implementation of a medical emergency team in a large pediatric teaching hospital prevents respiratory and cardiopulmonary arrests outside the intensive care unit. Pediatric Critical Care Medicine. 8(3): 236-246. Bureau of Labor Statistics. (2014) Health data 2012-2014. Available at: http://countryeconomy.com/countries-cpi/usa?sector=Health&sc=IPC-M Centre for Reviews and Dissemination (2008) Systematic Reviews: CRD’s guidance for undertaking reviews in health care. Centre for Reviews and Dissemination, University of York. Chan PS, Jain R, Nallmothu BK, Berg RA, Sasson C. (2010) Rapid response teams: a systematic review and meta-analysis. Archives of Internal Medicine. 170(1):18-26. Chapman S.M, Grocott M.P.W, Franck L.S. (2010) Systematic review of paediatric alert criteria for identifying hospitalised children at risk of clinical deterioration. Intensive Care Medicine. 36:600-611. Chen JG, Kemper, A. R., Odetola, F., Cheifetz, I. M., & Turner, D. A. (2012). Prevalence, characteristics, and opinions of pediatric rapid response teams in the United States. Hospital pediatrics, 2(3), 133-140. Confidential Enquiry into Maternal and Child Health (CEMACH). (2008) Why children die – a pilot study 2006. CEMACH, London. Dean B.S, Decker MJ, Hupp D, Urbach AH, Lewis E, Benes-Stickle J. (2008) Condition HELP: A Pediatric Rapid Response Team Triggered by Patients and Parents. Journal of Healthcare Quality. 30 (3): 28-31. Demmel KM, Williams L, Flesch L. (2010) Implementation of the Pediatric Early Warning Scoring System on a Pediatric Hematology/Oncology Unit. Journal of Pediatric Oncology Nursing. 27(4):229-240. Department of Health (DoH) (2013) Consolidated salary scales 2013. Available at: http://www.hse.ie/eng/staff/Benefits_Services/pay/July%202013.pdf Duncan H, Hutchison J, Parshuram CS. (2006) The pediatric early warning system score: A severity of illness score to predict urgent medical need in hospitalized children. Journal of Critical Care. 21:271-279. Duncan HP, Frew E. (2009) Short-term health system costs of paediatric in-hospital acute life-threatening events including cardiac arrest. Resuscitation. 80(5): 529-534. Edwards ED, Powell CVE, Mason BW, Oliver A. (2009) Prospective cohort study to test the predictability of the Cardiff and Vale paediatric early warning system. Archives of Diseases in Childhood. 94:602-606.
(13/10/2014 Final Version) Page 99
Edwards ED, Mason BW, Oliver A, Powell CVE. (2011) Cohort study to test the predictability of the Melbourne criteria for activation of the medical emergency team. Archives of Diseases in Childhood. 96:174-179. Egdell P, Finlay L, Pedley DK. (2008) The PAWS score: validation of an early warning scoring system for the initial assessment of children in the emergency department. Emergency Medicine Journal. 25:745-749. Fleming S, Thompson M, Stevens R, Heneghan C, Plüddemann A, Maconochie I, Tarassenko L, Mant D. (2011) Normal ranges of heart rate and respiratory rate in children from birth to 18 years of age: a systematic review of observational studies. Lancet. 377:1011-1018. Fuijkschot J, Vernhout B, Lemson J, Draaisma JMT, Loeffen JLCM. (2014) Validation of a paediatric early warning score: first results and implications for usage. European Journal of Pediatrics. PMID: 24942238 (Epub ahead of print) Haines C, Perrott M, Weir P. (2006) Promoting care for acutely ill children – development and evaluation of a paediatric early warning tool. Intensive and Critical Care Nursing. 22: 73-81. Hanson CC, Randolph GD, Erickson JA, Mayer CM, Bruckel JT, Harris BD, Willis TS. (2010) A reduction in cardiac arrests and duration of clinical instability after implementation of a paediatric rapid response system. Postgraduate Medicine Journal. 86:314-318. Haque A, Saleem AF, Zaidi S, Haider SR. (2010) Experience of Pediatric Rapid Response Team in a Tertiary Care Hospital in Pakistan. Indian Journal of Pediatrics. 77(3): 273-276. Hayes LW, Dobyns EL, DiGiovine B, Brown A, Jacobson S, Randall KH, Wathen B, Richard H, Schwab C, Duncan KD, Thrasher J, Logsdon TR, Hall M, Markovitz B. (2012) A Multicenter Collaborative Approach to Reducing Pediatric Codes Outside the ICU. Pediatrics. 129(3): e785-e791. Health Service Executive (HSE) (2013) National Clinical Programme for paediatrics and neonatology: Review of Paediatric and Neonatology Services and Framework for Future Development. Clinical Strategy and Programme Directorate HSE, Royal College of Physicians Ireland. Available at: http://www.hse.ie/eng/about/Who/clinical/natclinprog/paediatricsandneonatologyprogramme/Workplan/review/framework.pdf Health Service Executive (HSE) (2012) Draft Report on the Review of Undergraduate Nursing and Midwifery Degree Programmes Workforce Planning Advisory Group (unpublished). HIQA (2011) National Quality Assurance Criteria for Clinical Guidelines.
http://www.hiqa.ie/publications/national-quality-assurance-criteria-clinical-guidelines
Holmes H, Bhatt R, Koumettou M, Griffin MAS, Winckworth LC. (2013) Retrospective evaluation of a new neonatal trigger score. Pediatrics. 131:e837-e842. Hueckel RM, Mericle JM, Martin PL, Champagne MT. (2012) Implementation of Condition Help Family Teaching and Evaluation of Family Understanding. Journal of Nursing Care Quality. 27(2):176–181.

(13/10/2014 Final Version) Page 100
Hunt EA, Zimmer KP, Rinke ML, Shilkofski NA, Matlin C, Garger C, Dickson C, Miller MR. (2008) Transition from a Traditional Code Team to a Medical Emergency Team and Categorization of Cardiopulmonary Arrests in a Children’s Center. Arch Pediatr Adolesc Med. 162(2):117-122 Kelly J, Rowland AG, Cotterill S, Lees H, Kamara M. (2013) The paediatric observation priority score (POPS): a useful tool to predict likelihood of admission from the emergency department. Emergency Medical Journal. 30 (10): 866-880 [Conference presentation]. Kleinman M, Romano J. (2010) Children’s Hospital Boston EarlyWarning Score: early detection + early treatment = better outcomes. FIRST Do No Harm. August 2010. Available at: http://www.mass.gov/eohhs/docs/borim/newsletters/qps-august-2010.pdf Kotsakis A, Lobos AT, Parshuram C, Gilleland J, Gaiteiro R, Mohseni-Bod H, Singh R, Bohn D & on behalf of the Ontario Pediatric Critical Care Rsponse Team Collaborative (2011) Implementation of a Multicenter Rapid Response System in Pediatric Academic Hospitals is Effective. Pediatrics. 128: 72-78. Kukreti V, Gaiteiro R, Mohseni-Bod H, (2014) Implementation of a Pediatric Rapid Response Team: Experience of the Hospital for Sick Children in Toronto. Indian Pediatrics. 51:11-15. Lobos AT, Fernandes R, Ramsay T, McNally JD. (2014) Team (MET) Activation: Disposition Depends on Who Activates the Team Patient Characteristics and Disposition After Pediatric Medical Emergency. Hospital Pediatrics. 4(2):99-105. Lobos AT, Costello J, Gilleland J, Gaiteiro R, Kotsakis A, on behalf of the Ontario Pediatric Critical Care Response Team Collaborative. (2010) An implementation strategy for a multicentre pediatric rapid response system in Ontario. The Joint Commission Journal on Quality and Patient Safety. 36 (6): 271-280. National Clinical Effectiveness Committee. (2013a) Guideline Developers Manual. Available at: http://www.patientsafetyfirst.ie/images/stories/docs/ncec_guideline_development_manual_january13.pdf. National Clinical Effectiveness Committee. (2013b) National Clinical Guideline No. 1, http://www.patientsafetyfirst.ie/images/stories/docs/news_main_report.pdf. McCrory MC, Aboumatar H, Custer JW, Yang CP, Hunt EA. (2012) “ABC-SBAR” Training improves simulated critical patient hand-off by pediatric interns. Pediatric Emergency Care. 28 (6): 538-543. McKay H, Mitchell I, Sinn K, Mugridge H, Lafferty T, VanLeuvan C, Mamootil S, Abdel-Latif ME. (2013) Effect of a multifaceted intervention on documentation of vital signs and staff communication regarding deteriorating paediatric patients. Journal of Paediatrics and Child Health. 49; 48–56 McLellan M & Connors JA. (2013) The cardiac children’s hospital early warning score (C-CHEWS). Journal of Pediatric Nursing. 28: 171-178. McLellan MC, Gauvreau K, Connor JA. (2013) Validation of the Cardiac Children’s Hospital Early Warning Score: An Early Warning Scoring Tool to Prevent Cardiopulmonary Arrests in Children with Heart Disease. Congenital Heart Disease. 9:194-202.

(13/10/2014 Final Version) Page 101
Monaghan A. (2005) Detecting and managing deterioration in children. Paediatric Nursing. 17(1):32-35. NHS Health Education East Midlands (2014) POPS Implementation Report. POPS: Excellence in assessment of the acutely ill child. Office for National Statistics. (2014) Consumer Price Inflation Reference Tables. Table 21 detailed figures by division (to inflate 2005 GB£ to 2014 prices for health division). Available at: http://www.ons.gov.uk/ons/publications/re-reference-tables.html?edition=tcm%3A77-323589. Paciotti B, Roberts KE, Tibbetts KM, Oaine CW, Keren R, Barg FK, Holmes JH, Bonafide CP. (2014) Physician Attitudes toward Family-Activated Medical Emergency Teams for Hospitalised Children. The Joint Commission Journal on Quality and Patient Safety. 40(4):187-192. Panesar R, Polikoff LA, Harris D, Mills B, Messina C, Parker MM. (2014) Characteristics and outcomes of pediatric rapid response teams before and after mandatory triggering by an elevated pediatric early warning system (PEWS) score. Hospital Pediatrics. 4 (3):135-140. Parshuram CS, Hutchinson J, Middaugh K. (2009) Development and initial validation of the Bedside Paediatric Early Warning System score. BioMed Central Critical Care. 13:R135. Parshuram CS, Duncan HP, Joffe AR, Farrell CA, Lacroix JR, Middaugh KL, Hutchinson JS, Wensley D, Blanchard N, Beyene J, Parkin PC. (2011a) Multicentre validation of the bedside paediatric early warning system score: a severity of illness score to detect evolving critical illness in hospitalised children. BioMed Central Critical Care. 15:R184. Parshuram CS, Bayliss A, Reiner J, Middaugh K, Blanchard N. (2011b) Implementing the Bedside Paediatric Early Warning System in a community hospital: a prospective observational study. Paediatric Child Health. 16(3):e18-e22. Pearson G & Duncan H. (2011) Early warning systems for identifying sick children Paediatrics and Child Health. 21(5): 232-233. Peberdy MA, Cretikos M, Abella BS et al. Recommended guidelines for monitoring, reporting, and conducting research on medical emergency team, outreach, and rapid response systems: an Utstein-style scientific statement: a scientific statement from the International Liaison Committee on Resuscitation (American Heart Association, Australian Resuscitation Council, European Resuscitation Council, Heart and Stroke Foundation of Canada, Inter- American Heart Foundation, Resuscitation Council of Southern Africa, and the New Zealand Resuscitation Council); the American Heart Association Emergency Cardiovascular Care Committee; the Council on Cardiopulmonary, Perioperative, and Critical Care; and the Interdisciplinary Working Group on Quality of Care and Outcomes Research. Circulation 2007; 116: 2481–500. Randhawa S, Roberts-Turner R, Woronick K, DuVal J. (2011) Implementing and Sustaining Evidence-Based Nursing Practice to Reduce Pediatric Cardiopulmonary Arrest. Western Journal of Nursing Research. 33(3):443-456. Ray EM, Smith R, Massie S, Erickson J, Hanson C, Harris B, Willis TS. (2009) Family Alert: implementing direct family activation of a pediatric rapid response team. The Joint Commission Journal on Quality and Patient Safety. 35(11)575-580.

(13/10/2014 Final Version) Page 102
Roberts KE, Bonafide CP, Paine CW, Paciotti B, Tibbetts KM, Keren R, Barg FK, Holmes JH. (2014) Barriers to calling for urgent assistance despite a comprehensive pediatric rapid response system. American Journal of Critical care. 23(3): 223-229. Robson MJ, Cooper CL, Medicus LA, Quintero MJ, Zuniga SA. (2013) Comparison of three acute care pediatric early warning scoring tools. Journal of Pediatric Nursing. 28: e33-e41. Roland D, Madar J, Connolly G. (2010) The Newborn Early Warning (NEW) system: development of an at-risk infant intervention system. Infant. 6(4):116-120. Roland D, Oliver A, Edwards ED, Mason BW, Powell CVE. (2014) Use of paediatric early warning systems in Great Britain: has there been a change of practice in the last 7 years? Archives of Disease in Childhood. 99:26–29. Roland D. (2013) Paediatric early warning scores: Holy Grail and Achilles’ heel. Postgraduate Medical Journal. 89: 358-365. Ryan N. (2011) The Psychometric Properties of the Pediatric Early Warning Score System in the Pediatric Medical Surgical Units Society of Pediatric Nurses doi:10.1016/j.pedn.2011.01.236 Abstract of poster presentation. Sefton G, McGrath C, Tume L, Lane S, Lisboa PJG, Carrol ED. (2014) What impact did a Paediatric Early Warning system have on emergency admissions to the paediatric intensive care unit? An observational cohort study. Intensive and Critical Care Nursing. DOI: 10.1016/j.iccn.2014.01.001. [Epub ahead of print] Seiger N, Maconochie I, Oostenbrink R, Moll HA. (2013) Validity of different pediatric early warning scores in the emergency department. Pediatrics. 132(4):e841-e849. Sen AI, Morgan RW, Morris MC. (2013) Variability in the Implementation of Rapid Response Teams at Academic American Pediatric Hospitals. Journal of Pediatrics. 163:1772-1774. Sharek PJ, Parast LM, Leong K, Coombs J, Earnest K, Sullivan J, Frankel LR, Roth SJ. (2007) Effect of a Rapid Response Team on Hospital-wide Mortality and Code Rates Outside the ICU in a Children’s Hospital. JAMA. 298(19):2267-2274. Skaletzky SM, Raszynski A, Totapally BR. (2012) Validation of a Modified Pediatric Early Warning System Score: A Retrospective Case-Control Study. Clinical Pediatrics. 51(5):431-435. Solevag AL, Eggen EH, Schroder J, Nakstad B. (2013) Use of a Modified Pediatric Early Warning Score in a Department of Pediatric and Adolescent Medicine. PLoS ONE. 8(8): e72534. Theilen U, Leonard P, Jones P, Ardill R, Weitz J, Agrawal D, Simpson D. (2013) Regular in situ simulation training of paediatric Medical Emergency Team improves hospital response to deteriorating patients. Resuscitation. 84:218-222. Tibballs J, Kinney S, Duke T, Oakley E, Hennessy M. (2005) Reduction of paediatric in-patient cardiac arrest and death with a medical emergency team: preliminary results. Archives of disease in childhood. 90(11): 1148-1152. Tibballs J, Kinney S. (2009) Reduction of hospital mortality and of preventable cardiac arrest and death on introduction of a pediatric medical emergency team*.Pediatric Critical Care Medicine. 10(3): 306-312.

(13/10/2014 Final Version) Page 103
Tucker K, Brewer TL, Baker RB, Demeritt B, Vossmeyer MT. (2009) Prospective evaluation of a pediatric inpatient early warning scoring system. Journal for Specialists in Pediatric Nursing. 14(2):79-85. Tume L. (2007) The deterioration of children in ward areas in a specialist children’s hospital. British Association of Critical Care Nurses. 12(1):12-19. Tume LN, Sefton G, Arrowsmith P. (2013) Teaching paediatric ward teams to recognise and manage the deteriorating child. British Association of Critical Care Nurses. 19 (4): 196-203. Tyndall J. (2010) AACODS (Authority, Accuracy, Coverage, Objectivity, Date, Significance) Checklist. Flinders University, Archived at the Flinders Academic Commons: http://dspace.flinders.edu.au/dspace/ VandenBerg SD, Hutchison JS, Parshuram CS. (2007) A cross-sectional survey of levels of care and response mechanisms for evolving critical illness in hospitalized children. Pediatrics, 119(4): 940-946. VanderJagt EW. (2013) Improving pediatric survival from resuscitation events: the role and organization of hospital-based rapid response systems and code teams. Current Pediatric Reviews. 9:158-174. Van Voorhis KT, Willis TS. (2009) Implementing a pediatric rapid response system to improve quality and patient safety. Pediatric Clinics of North America. 56(4): 919-933. Wang GS, Erwin N, Zuk J, Henry DB, Dobyns EL. (2010) Retrospective review of emergency response activations during a 13-year period at a tertiary care children's hospital. Journal of Hospital Medicine. 6(3): 131-135. Winberg H, Nilsson K, Aneman A. (2008) Paediatric Rapid Response Systems: A literature review. Acta Anaesthesiologica Scandinavica. 52: 890-896. Zenker P, Schlesinger A, Hauck M, Spencer S, Hellmich T, Finkelstein M, Thygeson MV, Billman G. (2007) Implementation and Impact of a Rapid Response Team in a Children’s Hospital. The Joint Commission Journal on Quality and Patient Safety. 33(7): 418-425. Zhai H, Brady P, Li Q, Lingren T, Ni Y, Wheeler DS, Solti I. (2014) Developing and evaluating a machine learning based algorithm to predict the need of pediatric intensive care unit transfer for newly hospitalized children. Resuscitation. 85: 1965-1071.

(13/10/2014 Final Version) Page 104
APPENDICES

(13/10/2014 Final Version) Page 105
APPENDIX 1
Review Work Plan and Timelines
Summary of work plan, timelines, outputs
Timelines / evidence
Wk 16th Jun (W.1) PICO
Wk 23rd Jun (W.2,3) SEARCH
Wk 23rd Jun (W.3,4) SCREEN
Wk 30th Jun & 7th Jul (W.4,5,6) EXTRACT
Wk 14th Jul (W.5,6) ASSESS/EVALUATE
Wk 21st Jul (W.6,7) SYNTHESIS
28th Jul, 4th & 11th Aug (W.7,8,9) REPORT
Research studies (RS)
Finalise PICOs and prepare work plan/timelines
Compile search strategy & search for research evidence
Screen & identify eligible research evidence
Extract data from research studies
Assess quality of research studies and categorise acc. to hierarchy of evidence
Synthesis research studies data; and consider with CG & GL data
Draft and final report writing
Clinical guidelines (CG)
Finalise PICOs Compile search strategy & search for research evidence
Screen & identify eligible clinical guidelines
Extract data from clinical guidelines
Appraise clinical guidelines (HIQA 2011)
Synthesis clinical guideline data; and consider with RS & GL data
Draft and final report writing
Grey literature (GL)↔
Determine potential sources to search for grey literature
Compile search strategy & Search grey literature
Screen & identify eligible grey literature
Extract data from grey literature
Assess grey literature (AACODS)
Synthesis grey literature data; and consider with RS & CG data
Draft and final report writing
Budget Impact Analysis (BIA)
Gather data such as demographies that might be used for BIA
Run economic searches in databases and gather other inputs and data sources (i.e. population & intervention costs) for BIA
Continue to compile data for BIA (wk 6) and conduct BIA calaculation (wk 7) In doing the above we will adapt HIQA’s (2010) guidelines for budget impact analysis of health technologies in Ireland p.13/14.*
Compile draft BIA (wk 7) and format the BIA report (wk 8/9)
Outputs PICOs finalised; timelines and work plan mapped
Search strategy finalised, results and outputs described with audit trails for research studies, clinical guidelines and grey literature
Eligible evidence – research studies, guidelines and grey literature - identified for inclusion in the review
Completed data extraction – research studies, guidelines & spreadsheets of grey literature contacts
Completed quality assessment and critical appraisal tables for research studies & guidelines; & spreadsheets for grey literature sourced
Collective findings compiled across all data sets – research studies, clinical guidelines and grey literature
Draft report and subsequent revisions submitted. Final report submitted.

(13/10/2014 Final Version) Page 106
RESEARCH LITERATURE*
*Draw on the Centre for Reviews and Dissemination (CRD) (2008) guidance for undertaking systematic reviews in healthcare when required
Wk 16th Jun (W.1) PICO
Wk 23rd Jun (W.2,3) SEARCH
Wk 23rd Jun (W.3,4) SCREEN
Wk 30th Jun & 7th Jul (W.4,5,6) EXTRACT
Wk 14th Jul (W.5,6) ASSESS/EVALUATE
Wk 21st Jul (W.6,7) SYNTHESIS
28th Jul, 4th & 11th Aug (W.7,8,9) REPORT
Finalise PICOs with NCEC SC & EAG Draft plan and timelines Prepare for the review
Complete searches of electronic databases using PICOs as guidance for search terms and development of search strategy Work with Amanda in library on this Maintain records and write up search strategy and outputs
Complete 1st (titles and abstracts) and 2nd screening (full-texts) of evidence retrieved from databases; including second/third checker to finalise research papers for review. Maintain decision audit trails [inclusion/exclusion criteria; visually display search outputs PRISMA flow chart] Keep records of all excluded papers and reasons for exclusion etc. Note any reviews conducted; search reference lists of retrieved articles; and search relevant journals (see below) +/- search authors with known research in the field
Confirm data extraction tool and extract data from all papers relevant for inclusion in the review; study aim; study design; participant details; intervention and comparison details; outcomes measure and findings. Categorise and conduct data management across the three strands of use/validation; education/training and economic evaluations Cross-checks with DCU tender team members. Maintain decision audit trails.
Categorise studies by hierarchy of evidence Confirm quality assessment criteria/tools tools to use across various studies Conduct quality assessment across the research papers selected for inclusion in the review Cross-checks with DCU tender team members Maintain decision audit trials
Data synthesis from the research studies; & consider in light of clinical guidelines and grey literature retrieved Create evidence tables Note: strengths, limitations and gaps within literature
Draft report (end of week 7) & further work and revisions as required (week 8, 9)

(13/10/2014 Final Version) Page 107
CLINICAL GUIDELINE LITERATURE*
*Draw on the National Clinical Effectiveness Committee Guideline Development Manual (NCEC) (2013) and HIQA (2011) National Quality Assurance Criteria for Clinical Guidelines for guidance as required
Wk 16th Jun (W.1) PICO
Wk 23rd Jun (W.2,3) SEARCH
Wk 23rd Jun (W.3,4) SCREEN
Wk 30th Jun & 7th Jul (W.4,5,6) EXTRACT
Wk 14th Jul (W.5,6) ASSESS/EVALUATE
Wk 21st Jul (W.6,7) SYNTHESIS
28th Jul, 4th & 11th Aug (W.7,8,9) REPORT
Finalise PICOs with NCEC SC & EAG Draft plan and timelines Prepare for the review
Confirm search strategy/terms Search electronic guideline clearinghouses Search databases & internet to identify clinical guidelines Note: Include search terms for clinical guidance as suggested by NCEC 2013
Follow NCEC guidelines to screen retrieved clinical guidelines 2 reviewers assess question covered; publication date and rigour of development (as outlined by HIQA 2011 in the National Quality Assurance Criteria) Map screening exercise in a matrix as recommended by NCEC (2013) Resolve any discrepancies with 3rd reviewer Maintain decision audit trails and keep records of all excluded guidelines and reasons for exclusion etc.
Extract data from eligible guidelines into a matrix; scope and purpose; stakeholder involvement; development stage; and recommendations.
Critically appraise guidelines according to the National Quality Assurance Criteria (HIQA 2011) i.e. Determine guideline currency (i.e. review date of release/publication; scan bibliography for dates of original studies cited; check with developers whether still consider guideline current/plans to update it; identified new research since publication of clinical); rigour of development (see column 3) and conduct context analysis of guideline recommendations (i.e. each guideline recommendation will be mapped on a matrix against the hierarchy of evidence for that recommendation i.e. that any recommendation made is based on evidence and that evidence supports the recommendations listed; that recommendations are current and acceptable and applicable to the Irish health system). (map in matrix as recommended by NCEC 2013) Appraisal will include clinical experts from EAG
Data synthesis from the clinical guidelines; & consider in light of research studies evidence and grey literature retrieved Create guideline matrix Note: strengths, limitations and gaps within guidelines
Draft report (end of week 7) & further work and revisions as required (week 8, 9)
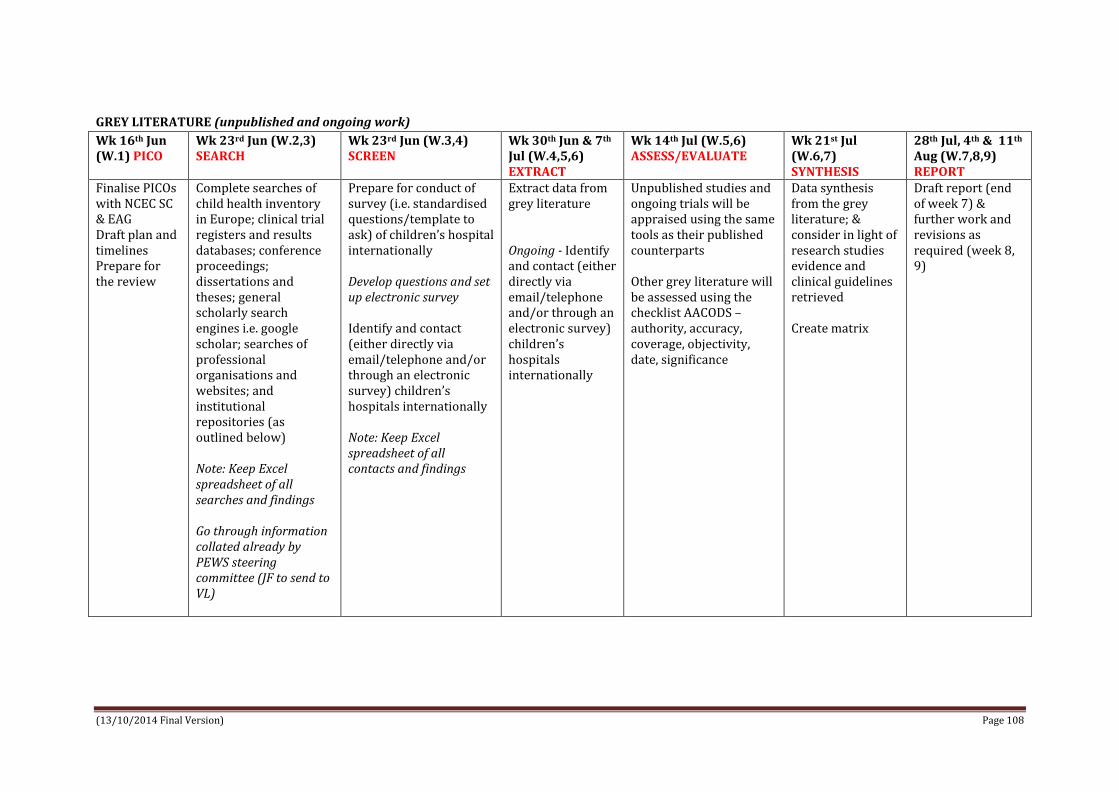
(13/10/2014 Final Version) Page 108
GREY LITERATURE (unpublished and ongoing work)
Wk 16th Jun (W.1) PICO
Wk 23rd Jun (W.2,3) SEARCH
Wk 23rd Jun (W.3,4) SCREEN
Wk 30th Jun & 7th Jul (W.4,5,6) EXTRACT
Wk 14th Jul (W.5,6) ASSESS/EVALUATE
Wk 21st Jul (W.6,7) SYNTHESIS
28th Jul, 4th & 11th Aug (W.7,8,9) REPORT
Finalise PICOs with NCEC SC & EAG Draft plan and timelines Prepare for the review
Complete searches of child health inventory in Europe; clinical trial registers and results databases; conference proceedings; dissertations and theses; general scholarly search engines i.e. google scholar; searches of professional organisations and websites; and institutional repositories (as outlined below) Note: Keep Excel spreadsheet of all searches and findings Go through information collated already by PEWS steering committee (JF to send to VL)
Prepare for conduct of survey (i.e. standardised questions/template to ask) of children’s hospital internationally Develop questions and set up electronic survey Identify and contact (either directly via email/telephone and/or through an electronic survey) children’s hospitals internationally Note: Keep Excel spreadsheet of all contacts and findings
Extract data from grey literature Ongoing - Identify and contact (either directly via email/telephone and/or through an electronic survey) children’s hospitals internationally
Unpublished studies and ongoing trials will be appraised using the same tools as their published counterparts Other grey literature will be assessed using the checklist AACODS – authority, accuracy, coverage, objectivity, date, significance
Data synthesis from the grey literature; & consider in light of research studies evidence and clinical guidelines retrieved Create matrix
Draft report (end of week 7) & further work and revisions as required (week 8, 9)

(13/10/2014 Final Version) Page 109
APPENDIX 2
Clinical Guideline Databases Search and Outputs
Clinical Guidelines Databases
Search Terms Dates searched
Hits Screen for eligibility
US National Guideline Clearinghouse www.guideline.gov
‘pediatric early warning’ ‘paediatric early warning’ ‘neonatal early warning’ ‘PEWS’ ‘pediatric rapid response’
15/7/2014 16/7/2014
82 32 34 0 117
1 (pdf review paeds) 0 0 0 1 (DUP)
National Institute for Health & Care Excellence www.nice.org.uk
"paediatric early warning" OR "pediatric early warning" "neonatal early warning" OR "newborn early warning" OR “infant early warning” “PEWS” “paediatric/pediatric rapid response”
15/7/2014 16/7/2014
2 0 0 0
0 0 0 0
Guidelines International Network http://www.g-i-n.net/gin
To search for guidelines need to be a member which costs – check with Amanda in library if she can get access to it.
15/7/2014
Scottish Intercollegiate Guidelines Network http://www.sign.ac.uk/
Searched through listing of 140 guidelines and also did a random search for paed/pediatric/neonatal early warning and rapid response
15/7/2014 0 Guideline 139 care of deteriorating patients May 2014 – adult focused
0

(13/10/2014 Final Version) Page 110
APPENDIX 3
GOOGLE AND BING Search and Outputs
Google searches Search Strategy Google Hits Screen for
eligibility (Google)
Bing Hits Screen for eligibility (Bing)
(“pediatric early warning” OR “paediatric early warning” OR “neonatal early warning” OR “infant early warning” OR “newborn early warning”) (“clinical guideline” OR “practice guideline” OR “clinical practice guideline” OR “standard” OR “consensus statement” OR “protocol” OR “consensus”)
#31,300 (approx.)
Scoping screen completed #7
#2,480 (approx.)
Scoping screen completed #0
(“pediatric early warning” OR “paediatric early warning” OR “neonatal early warning” OR “infant early warning” OR “newborn early warning”) (“clinical guideline” OR “practice guideline” OR “clinical practice guideline” OR “standard” OR “consensus statement” OR “protocol” OR “consensus”) (“paediatric hospital” OR “pediatric hospital” OR “children’s hospital”)
# 20,800 (approx.)
Scoping screen completed #0
#1,770 (approx.)
Scoping screen completed #0
(“pediatric early warning” OR “paediatric early warning” OR “neonatal early warning” OR “infant early warning” OR “newborn early warning”) (“clinical guideline” OR “practice guideline” OR “clinical practice guideline” OR “standard” OR “consensus statement” OR “protocol” OR “consensus”) (site:.org OR site:.gov)
#3,530 (approx.)
Scoping screen completed #0
#1,750 (approx.)
Scoping screen completed #0
(“pediatric early warning” OR “paediatric early warning” OR “neonatal early warning” OR “infant early warning” OR “newborn early warning”) (“clinical guideline” OR “practice guideline” OR “clinical practice guideline” OR “standard” OR “consensus statement” OR “protocol” OR “consensus”) (file type: pdf)
#83 (approx.) All screened #0
#59 (approx.)
Scoping screen completed #0
(“pediatric early warning” OR “paediatric early warning” OR “neonatal early warning” OR “infant early warning” OR “newborn early warning”) (“clinical guideline” OR “practice guideline” OR “clinical practice guideline” OR “standard” OR “consensus statement” OR “protocol” OR “consensus”) (file type: pdf OR filetype.doc)
#159 (approx.)
All screened #0
#58 (approx.)
Scoping screen completed #0
(“pediatric early warning” OR “paediatric early warning” OR “neonatal early warning” OR “infant early warning” OR “newborn early warning”) (“clinical guideline” OR “practice guideline” OR “clinical practice guideline” OR “standard” OR “consensus statement” OR “protocol” OR “consensus”) (site:.org OR site:.gov) (file type: pdf OR file type.doc)
#73 (approx.) All screened #0
#562 (approx.)
Scoping screen completed #0

(13/10/2014 Final Version) Page 111
APPENDIX 4
CINAHL SEARCH AND OUTPUTS
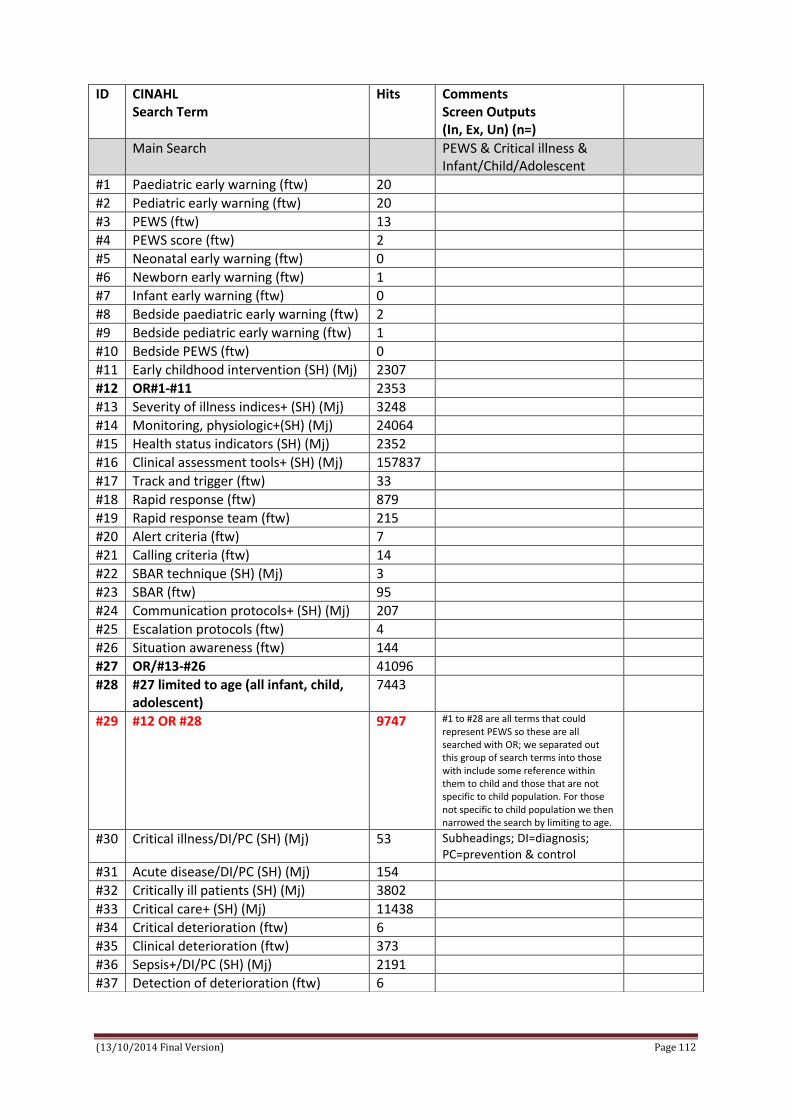
(13/10/2014 Final Version) Page 112
ID CINAHL Search Term
Hits Comments Screen Outputs (In, Ex, Un) (n=)
Main Search PEWS & Critical illness & Infant/Child/Adolescent
#1 Paediatric early warning (ftw) 20
#2 Pediatric early warning (ftw) 20
#3 PEWS (ftw) 13
#4 PEWS score (ftw) 2
#5 Neonatal early warning (ftw) 0
#6 Newborn early warning (ftw) 1
#7 Infant early warning (ftw) 0
#8 Bedside paediatric early warning (ftw) 2
#9 Bedside pediatric early warning (ftw) 1
#10 Bedside PEWS (ftw) 0
#11 Early childhood intervention (SH) (Mj) 2307
#12 OR#1-#11 2353
#13 Severity of illness indices+ (SH) (Mj) 3248
#14 Monitoring, physiologic+(SH) (Mj) 24064
#15 Health status indicators (SH) (Mj) 2352
#16 Clinical assessment tools+ (SH) (Mj) 157837
#17 Track and trigger (ftw) 33
#18 Rapid response (ftw) 879
#19 Rapid response team (ftw) 215
#20 Alert criteria (ftw) 7
#21 Calling criteria (ftw) 14
#22 SBAR technique (SH) (Mj) 3
#23 SBAR (ftw) 95
#24 Communication protocols+ (SH) (Mj) 207
#25 Escalation protocols (ftw) 4
#26 Situation awareness (ftw) 144
#27 OR/#13-#26 41096
#28 #27 limited to age (all infant, child, adolescent)
7443
#29 #12 OR #28 9747 #1 to #28 are all terms that could represent PEWS so these are all searched with OR; we separated out this group of search terms into those with include some reference within them to child and those that are not specific to child population. For those not specific to child population we then narrowed the search by limiting to age.
#30 Critical illness/DI/PC (SH) (Mj) 53 Subheadings; DI=diagnosis; PC=prevention & control
#31 Acute disease/DI/PC (SH) (Mj) 154
#32 Critically ill patients (SH) (Mj) 3802
#33 Critical care+ (SH) (Mj) 11438
#34 Critical deterioration (ftw) 6
#35 Clinical deterioration (ftw) 373
#36 Sepsis+/DI/PC (SH) (Mj) 2191
#37 Detection of deterioration (ftw) 6

(13/10/2014 Final Version) Page 113
#38 Identification of deterioration (ftw) 2
#39 OR/#30-#38 17540
#40 #39 limited to age (all infant, child, adolescent)
4276
#41 Pediatric critical care nursing+ (SH) (Mj)
2264
#42 Paediatric critical care nursing (ftw) 1
#43 Neonatal intensive care nursing (SH) (Mj)
1579
#44 Neonatal sepsis (ftw) 811
#45 Newborn sepsis (ftw) 7
#46 Infant sepsis (ftw) 4
#47 OR/#41-#46 3070
#48 #40 OR #47 6995 #30 to #47 are all terms that could represent critical illness so these are all searched with OR; we separated out this group of search terms into those with include some reference within them to child and those that are not specific to child population. For those not specific to child population we then narrowed the search by limiting to age.
#49 Child, hospitalised (SH) (Mj) 2708
#50 Adolescent, hospitalised (SH) (Mj) 190
#51 Infant, hospitalised (SH) (Mj) 161
#52 Pediatric units+ (SH) (Mj) 4158
#53 Hospitals pediatric (SH) (Mj) 1310
#54 Intensive care, neonatal+(SH) (Mj) 2656
#55 Intensive care units, neonatal (SH) (Mj)
2820
#56 Intensive care unit, pediatric+ (SH) (Mj)
4026
#57 OR/#49-#56 10753
#58 #29 AND #48 214
#59 #29 AND #48 AND #57 83
#60 #48 OR #57 15163
#61 29 AND 60 321 Screened Exclude 275 Potentially eligible 46 Of 46; 18 duplicates n=28 left; of these 6 research studies; 1 review; 9 discursive/commentary; 12 unsure as still need to source through ILL.
Data extraction completed for the research studies n=6
Some Specific Searches Emergency Department & Pews
#62 Emergency service+ (SH) (Mj) 18157
#63 Emergency department (ftw) 20531
#64 Emergency medicine (SH) (Mj) 2865
#65 Emergency nursing+ (SH) (Mj) 8183
#66 Casualty department (ftw) 63
#67 Accident and emergency* (ftw) 1805

(13/10/2014 Final Version) Page 114
#68 OR/#62-#67 40331
#69 #68 limited to all infant, child, adolescent
8081
#70 #29 AND #69 196 Screened Excluded n=183 Potential eligible n=13; 10 of which are duplicates with 3 new papers to review
Some Specific Searches Education & PEWS
#71 Education, clinical+ (SH) (Mj) 6767
#72 Education, health sciences+ (SH) (Mj) 89938
#73 Healthcare education (ftw) 213
#74 Health professional education (ftw) 172
#75 Health personnel education (ftw) 4239
#76 Health care education (ftw) 942
#77 Interdisciplinary education (ftw) 202
#78 Education interdisciplinary (SH) (Mj) 1921
#79 Medical staff training (ftw) 5
#80 Medical staff education (ftw) 62
#81 Nursing staff education (ftw) 13
#82 Education, continuing+ (SH) (Mj) 2806
#83 Nursing staff training (ftw) 10
#84 Eucation Medical Continuing (SH) (Mj) 2468
#85 COMPASS (ftw) 279
#86 ALERT (ftw) 5341
#87 OR/#71-#86 103027
#88 #29 AND #87 102 Screened Excluded n=97 Potential eligible n=5; 3 of which are duplicates with 2 new papers to review
Some Specific Searches Instrument Validation
#89 Precision (SH) (Mj) 20
#90 Sensitivity and specificity (SH) (Mj) 320
#91 Instrument validity (ftw) 40
#92 Instrument reliability (ftw) 87
#93 Instrument evaluation (ftw) 18
#94 Instrument validation (SH) (Mj) 18748
#95 Reliability and validity+ (SH) (Mj) 4612
#96 OR/89-95 22940
#97 #29 AND #96 1284
#98 #29 AND #48 AND #96 20 Screened Excluded n=14 Potential eligible n=6 all duplicates
#99 #12 AND #96 34 Screened Excluded n=26 Potential eligible n=8; 7 of which are duplicates and 1 new paper to review

(13/10/2014 Final Version) Page 115
SH=Subject Heading; ftw=free text word; Mj=Major concept; +=Explode
(Roland NEWS – discussion)
Some Specific Searches Cost-effectiveness
100 Cost benefit analysis (SH) (Mj) 3532
101 Costs and cost analysis+ (SH) (Mj) 24727
102 Health care costs+ (SH) (Mj) 14187
103 Health facility costs (SH) (Mj) 1274
104 Cost savings (SH) (Mj) 2426
105 Treatment outcomes+/EC (SH) (Mj) 21
106 Medical care costs (ftw) 141
107 Health care costs (ftw) 30770
108 Costs and cost analysis (ftw) 12345
109 Cost benefit analysis (ftw) 19701
110 Cost savings (ftw) 11647
111 Cost effectiveness (ftw) 10008
112 OR/#100-111 72058
113 #29 AND #112 129 Screened Excluded n=129

(13/10/2014 Final Version) Page 116
APPENDIX 5
MEDLINE SEARCH AND OUTPUTS

(13/10/2014 Final Version) Page 117
ID Medline Search Term
Hits Comments Screen Outputs (In, Ex, Un) (n=)
Main Search PEWS & Critical illness & Infant/Child/Adolescent
#1 Paediatric early warning (ftw) 20
#2 Pediatric early warning (ftw) 19
#3 PEWS (ftw) 27
#4 PEWS score (ftw) 7
#5 Neonatal early warning (ftw) 0
#6 Newborn early warning (ftw) 0
#7 Infant early warning (ftw) 0
#8 Bedside paediatric early warning (ftw) 2
#9 Bedside pediatric early warning (ftw) 0
#10 Bedside PEWS (ftw) 2
#11 OR/#1-10 48
#12 Early medical intervention+ (MT) (Mj) 328
#13 Severity of illness index+ (MT) (Mj) 13039
#14 Monitoring, physiologic+(MT) (Mj) 52983
#15 Health status indicators+ (MT) (Mj) 24892
#16 Early diagnosis+ (MT) (Mj) 5311
#17 Track and trigger (ftw) 138
#18 Hospital rapid response team+ (MH) (Mj)
230
#19 Rapid response (ftw) 3141
#20 Alert criteria (ftw) 12
#21 Calling criteria (ftw) 28
#22 SBAR technique (ftw) 1
#23 SBAR (ftw) 85
#24 Communication protocols (ftw) 101
#25 Escalation protocols (ftw) 21
#26 Situation awareness (ftw) 203
#27 Risk assessment+ (MH) (Mj) 19500
#28 OR/#12-27 105978
#29 #28 limited to age -18years 19478
#30 #11 OR #29 19501
#31 Acute disease+/di/pc/nur(MT) (Mj) 452
#32 Critical illness+ (MT) (Mj) 8856
#33 Critical care+ (MT) (Mj) 26642
#34 Critical care nursing+ (MT) (Mj) 135
#35 Critical deterioration (ftw) 18
#36 Clinical deterioration (ftw) 2823
#37 Sepsis+/di/pc(MT) (Mj) 8722
#38 Detection of deterioration (ftw) 24
#39 Identification of deterioration (ftw) 3
#40 OR/#31-39 46130
#41 #40 limited to age 0-18 years 10473
#42 Pediatric critical care nursing (ftw) 7
#43 Neonatal intensive care nursing (ftw) 11
#44 Pediatric nursing+ (MT) (Mj) 10361
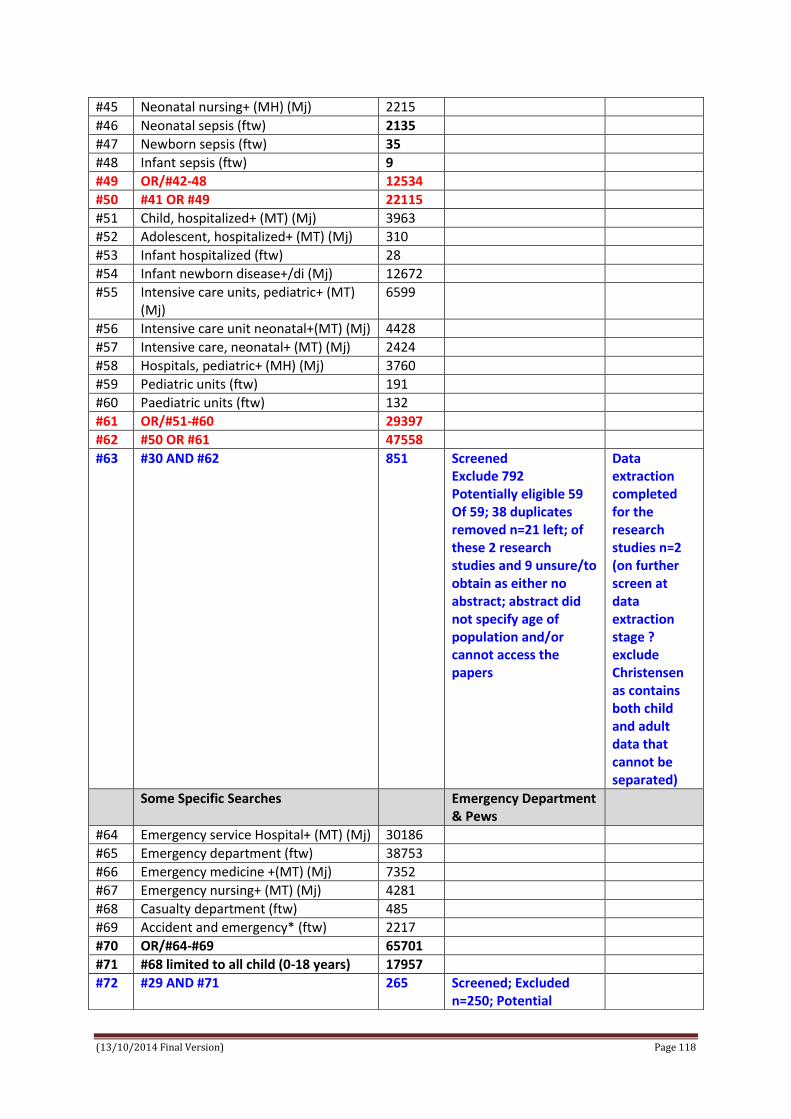
(13/10/2014 Final Version) Page 118
#45 Neonatal nursing+ (MH) (Mj) 2215
#46 Neonatal sepsis (ftw) 2135
#47 Newborn sepsis (ftw) 35
#48 Infant sepsis (ftw) 9
#49 OR/#42-48 12534
#50 #41 OR #49 22115
#51 Child, hospitalized+ (MT) (Mj) 3963
#52 Adolescent, hospitalized+ (MT) (Mj) 310
#53 Infant hospitalized (ftw) 28
#54 Infant newborn disease+/di (Mj) 12672
#55 Intensive care units, pediatric+ (MT) (Mj)
6599
#56 Intensive care unit neonatal+(MT) (Mj) 4428
#57 Intensive care, neonatal+ (MT) (Mj) 2424
#58 Hospitals, pediatric+ (MH) (Mj) 3760
#59 Pediatric units (ftw) 191
#60 Paediatric units (ftw) 132
#61 OR/#51-#60 29397
#62 #50 OR #61 47558
#63 #30 AND #62 851 Screened Exclude 792 Potentially eligible 59 Of 59; 38 duplicates removed n=21 left; of these 2 research studies and 9 unsure/to obtain as either no abstract; abstract did not specify age of population and/or cannot access the papers
Data extraction completed for the research studies n=2 (on further screen at data extraction stage ? exclude Christensen as contains both child and adult data that cannot be separated)
Some Specific Searches Emergency Department & Pews
#64 Emergency service Hospital+ (MT) (Mj) 30186
#65 Emergency department (ftw) 38753
#66 Emergency medicine +(MT) (Mj) 7352
#67 Emergency nursing+ (MT) (Mj) 4281
#68 Casualty department (ftw) 485
#69 Accident and emergency* (ftw) 2217
#70 OR/#64-#69 65701
#71 #68 limited to all child (0-18 years) 17957
#72 #29 AND #71 265 Screened; Excluded n=250; Potential

(13/10/2014 Final Version) Page 119
eligible n=15; 11 duplicates with 2 to check and 2 letters/commentaries
#73 Some Specific Searches Education & PEWS
#74 Education, Medical+/ED (MT) (Mj) 45
#75 Education, Medical Continuing+ (MT) (Mj)
12366
#76 Health sciences education (ftw) 94
#77 Clinical education (ftw) 1319
#78 Clinical competence + (MT) (Mj) 30812
#79 Healthcare education (ftw) 229
#80 Health professional education (ftw) 215
#81 Health personnel education (ftw) 8
#82 Health care education (ftw) 404
#83 Interdisciplinary education (ftw) 216
#84 Medical staff training (ftw) 17
#85 Medical staff education (ftw) 29
#86 Nursing staff education (ftw) 15
#87 Nursing staff training (ftw) 17
#88 Nursing education+/ED (MT) (Mj) 17
#89 COMPASS (ftw) 1174
#90 ALERT (ftw) 16491
#91 OR/#74-90 62175
#92 #29 AND #91 100 Screened; Excluded 95; Included 5 as potentially eligible – all were duplicates
Some Specific Searches Instrument Validation
#93 Sensitivity and specificity + (MT) (Mj)
2805
#94 Instrument validity (ftw) 69
#95 Instrument reliability (ftw) 133
#96 Instrument evaluation (ftw) 60
#97 Instrument validation (ftw) 120
#98 Reliability and validity (ftw) 27477
#99 Reproducibility of results+ (MT) (Mj) 1549
#100 OR/#93-#99 31821
#101 #29 AND #100 626 Screened; excluded 624; included 2 as potentially eligible – both duplicates
Some Specific Searches Cost-effectiveness
#102 Cost benefit analysis (MT) (Mj) OR cost benefit analysis (ftw)
61361
#103 Costs and cost analysis (ftw) 44105
#104 Health care costs+ (MT) (Mj) 19401
#105 Health facility costs (ftw) 2
#106 Cost savings+ (MT) (Mj) 1226
#107 Treatment outcomes+ (MT) (Mj) 5136

(13/10/2014 Final Version) Page 120
MT=Mesh Term; ftw=free text word
#108 Medical care costs (ftw) 610
#109 Health care costs (ftw) 32788
#110 Cost savings (ftw) 14796
#111 Cost effectiveness (ftw) 32595
#112 OR/#102-112 156,362
#113 #29 AND #112 339 Screened; 337 excluded with 2 papers identified of potential interest – not directly related to PEWS but to costs related to severity of illness in ICU

(13/10/2014 Final Version) Page 121
APPENDIX 6
PUBMED SEARCH AND OUTPUTS

(13/10/2014 Final Version) Page 122
ID Pubmed Search Term Hits Comments #1 Paediatric early warning #100 #2 Pediatric early warning #138 #3 PEWS #38 #4 PEWS Score #21 #5 Neonatal early warning #45 #6 Newborn early warning #138 #7 Infant early warning #234 #8 Bedside paediatric early warning #5 #9 Bedside pediatric early warning #6 #10 Bedside PEWS #5 #11 Track and trigger #158 #12 Alert criteria #1728 #13 Rapid response #69740 #14 Rapid response+ #221 Hospital Rapid Response Team
+ [Majr] #15 Rapid response tea* #522 #13 Calling criteria #704 #14 SBAR #139 #15 Communication protocols #4173 #16 Escalation protocols #1764 #17 Situation awareness #2169 #18 Early childhood intervention #3022 #19 Severity of illness index+ #12613 [Majr] #20 Monitoring, physiologic+ #52218 [Majr] #21 Health status indicators+ #24209 [Majr] #22 Clinical assessment tools #8823 #23 OR/#1-#22 #99108 #24 OR/#1-#22 limited to Child 0-18yrs #20359 #25 Acute disease+ #26 Diagnosis + [Majr] #26 Acute disease+ #5 Prevention and Control + [Majr] #26 Critical illness+ #8655 [Majr] #27 Critically ill patients #33720 #28 Critical care+ #26371 [Majr] #29 Pediatric critical care nursing #1092 #30 Critical deterioration #2173 #31 Clinical deterioration #21781 #32 Sepsis+ #7378 Diagnosis + [Majr] #33 Sepsis+ #6602 Prevention and Control + [Majr] #34 Neonatal sepsis #7660 #35 Newborn sepsis #13599 #36 Detection of deterioration #1617 #37 Identification of deterioration #1084 #38 OR/25-36 minus paeds #94892 Test #39 OR/25-36 minus paeds limited to Child 0-
18yrs #19723 Test
#40 OR/#25-#37 #108185 #41 Child, hospitalized+ #3941 [Majr] #42 Adolescent, hospitalized+ #308 [Majr] #43 Infant, hospitalized #11263 #44 Pediatric unit*0 #756
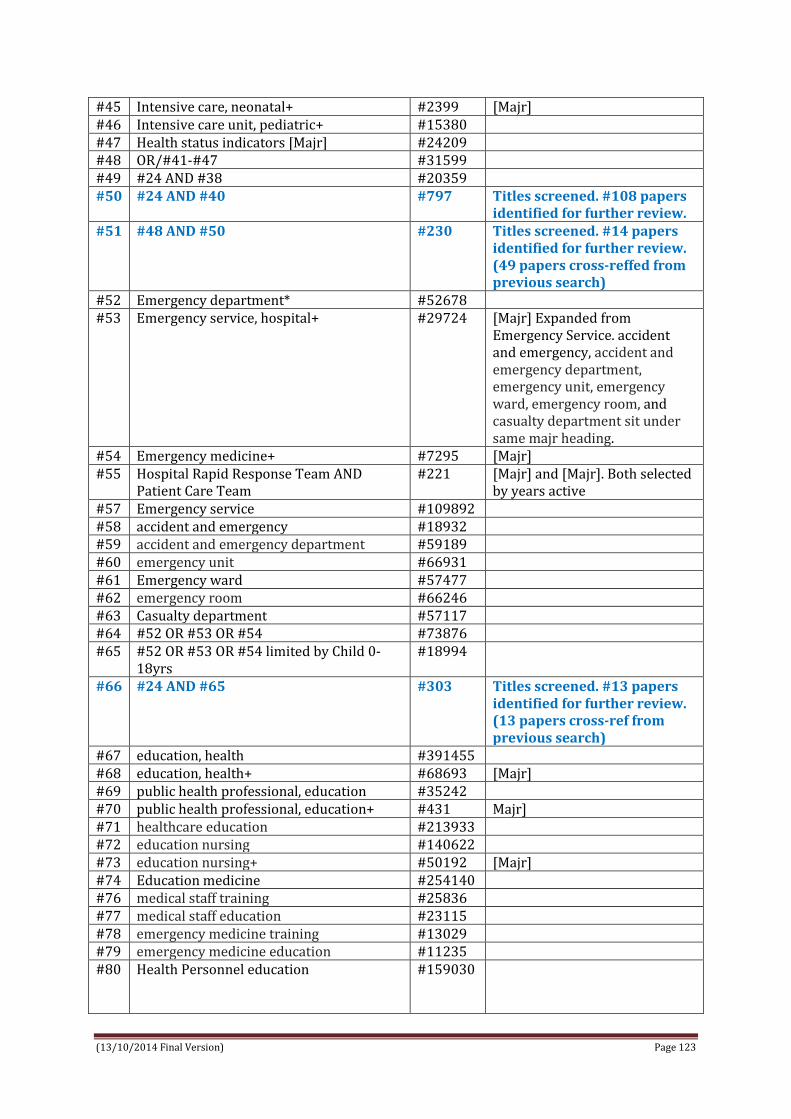
(13/10/2014 Final Version) Page 123
#45 Intensive care, neonatal+ #2399 [Majr] #46 Intensive care unit, pediatric+ #15380 #47 Health status indicators [Majr] #24209 #48 OR/#41-#47 #31599 #49 #24 AND #38 #20359 #50 #24 AND #40 #797 Titles screened. #108 papers
identified for further review. #51 #48 AND #50 #230 Titles screened. #14 papers
identified for further review. (49 papers cross-reffed from previous search)
#52 Emergency department* #52678 #53 Emergency service, hospital+ #29724 [Majr] Expanded from
Emergency Service. accident and emergency, accident and emergency department, emergency unit, emergency ward, emergency room, and casualty department sit under same majr heading.
#54 Emergency medicine+ #7295 [Majr] #55 Hospital Rapid Response Team AND
Patient Care Team #221 [Majr] and [Majr]. Both selected
by years active #57 Emergency service #109892 #58 accident and emergency #18932 #59 accident and emergency department #59189 #60 emergency unit #66931 #61 Emergency ward #57477 #62 emergency room #66246 #63 Casualty department #57117 #64 #52 OR #53 OR #54 #73876 #65 #52 OR #53 OR #54 limited by Child 0-
18yrs #18994
#66 #24 AND #65 #303 Titles screened. #13 papers identified for further review. (13 papers cross-ref from previous search)
#67 education, health #391455 #68 education, health+ #68693 [Majr] #69 public health professional, education #35242 #70 public health professional, education+ #431 Majr] #71 healthcare education #213933 #72 education nursing #140622 #73 education nursing+ #50192 [Majr] #74 Education medicine #254140 #76 medical staff training #25836 #77 medical staff education #23115 #78 emergency medicine training #13029 #79 emergency medicine education #11235 #80 Health Personnel education
#159030

(13/10/2014 Final Version) Page 124
#81 OR/#67-#80 #116788 #82 #24 AND #81 #1684 #83 Cost benefit analysis #65310 #84 Cost benefit analysis+ #4081 [Majr] #85 economic aspects of illness #29563 #86 nursing costs #16793 #87 Costs and costs analysis #185242 #88 Costs and costs analysis+ #45451 [Majr] #89 Healthcare costs #91802 #90 Healthcare costs+ #18959 #91 Treatment costs #109837 #92 Medical Care Cost #111966 #93 OR/83-#92 #245418 #94 #24 AND #93 #652 #95 #24 AND #82 AND #93 #52 Maj headings used when
relevant EXCEPT related to search #24. Titles screened. #6 papers identified for further review. All 6 papers cross-ref from previous search.

(13/10/2014 Final Version) Page 125
APPENDIX 7
EMBASE SEARCH AND OUTPUTS

(13/10/2014 Final Version) Page 126
ID Embase Search Term Hits Comments Screen Outputs (In, Ex, Un) (n=)
Main Search PEWS & Critical illness & Infant/Child/Adolescent
#1 Paediatric early warning (ftw) 51
#2 Pediatric early warning (ftw) 54
#3 PEWS (ftw) 97
#4 PEWS score (ftw) 22
#5 Neonatal early warning (ftw) 1
#6 Newborn early warning (ftw) 1
#7 Infant early warning (ftw) 0
#8 Bedside pediatric early warning (ftw) 5
#9 Bedside paediatric early warning (ftw)
4
#10 Bedside PEWS (ftw) 6
#11 Early childhood intervention+ (ET) (Mj)
782
#12 OR/#1-#11 920
#13 Severity of illness index+(ET) (Mj) 317
#14 Physiologic monitoring+ (ET) (Mj) 508
#15 Health status indicators+ (ET) (Mj) 769
#16 Clinical assessment tool+ (ET) (Mj) 4831
#17 Track and trigger (ftw) 85
#18 Rapid response team+ (ET) (Mj) 351
#19 Rapid response (ftw) 4825
#20 Alert criteria (ftw) 28
#21 Calling criteria (ftw) 50
#22 SBAR technique (ftw) 2
#23 SBAR (ftw) 202
#24 Communication protocols (ftw) 151
#25 Escalation protocols (ftw) 37
#26 Situation awareness (ftw) 340
#27 OR/#13-#26 11745
#28 #27 AND limited by age adolescent or child or infant or newborn or preschool or school
1399
#29 #12 OR #28 2304
#30 Acute disease+ (ET) (Mj) 3831
#31 Critical illness+ (ET) (Mj) 8798
#32 Critically ill patient+ (ET) (Mj) 5434
#33 Intensive care+ (ET) (Mj) 189562
#34 Sepsis+(ET) (Mj) 73971
#35 Deterioration+ (ET) (Mj) 1034
#36 Critical deterioration (ftw) 24
#37 Clinical deterioration (ftw) 4214
#38 Detection of deterioration (ftw) 31
#39 Identification of deterioration (ftw) 5
#40 OR/#30-#39 278572
#41 #40 AND limited by age adolescent 47500

(13/10/2014 Final Version) Page 127
or child or infant or newborn or preschool or school
42 Pediatric intensive care nursing+ (ET) (Mj)
30
43 Newborn intensive care nursing+ (ET) (Mj)
15
44 Paediatric critical care nursing (ftw) 1
45 Paediatric intensive care nursing (ftw)
7
46 Neonatal critical care nursing 1
47 Neonatal intensive care nursing+ OR neonatal intensive care nursing (ftw)
72
48 Neonatal sepsis+ OR neonatal sepsis (ftw)
5675
49 Newborn sepsis+ OR newborn sepsis (ftw)
4588
50 Infant sepsis (ftw) 15
51 OR/#42-#51 5817
52 #41 OR #51 50662
53 Hospitalised child+ (ET) (Mj) 333
54 Hospitalised adolescent+ (ET) (Mj) 225
55 Hospitalised infant+ (ET) (Mj) 32
56 Pediatric hospital+ (ET) (Mj) 1577
57 Newborn intensive care+ (ET) (Mj) 7529
58 Pediatric intensive care unit+ OR pediatric intensive care unit (ftw)
89039
59 OR/#53-58 97712
60 #52 OR #59 138844
61 #29 AND #60 191 Screened Excluded 112 Potentially eligible 79 Of 79; 25 duplicates removed n=54; of these 6 new studies/papers identified; 9 papers unsure/not able to access and ILL requested; 39 were grey literature based on conference papers and commentary
Data extraction completed for the research studies n=6
Some Specific Searches Emergency Department & Pews
#62 Emergency health service+ (ET) (Mj) 37853
#63 Emergency department (ftw) or emergency department+ (ET)
90063
#64 Emergency medicine+ (ET) (Mj) 19911
#65 Emergency nursing+ (ET) (Mj) 3870
#66 Casualty department (ftw) 641
#67 Accident and emergency (ftw) 8988

(13/10/2014 Final Version) Page 128
#68 Emergency ward+ (ET) (Mj) 13254
#69 OR/#62-#68 147647
#70 #69 limited to all infant, child, adolescent
24747
#71 #29 AND #70 85 Screened 85; excluded 72; potentially eligible 13 – duplicates ; new
Some Specific Searches Education & PEWS
#71 Medical education+ (ET) (Mj) 138532
#72 Clinical education+ (ET) (Mj) 4157
#73 Clinical competence + (ET) (Mj) 17088
#74 Health education+ (ET) (Mj) 91015
#75 Health professional education (ftw) 333
#76 Health personnel education (ftw) 40
#77 Health care education (ftw) 685
#78 Healthcare education (ftw) 765
#79 Interdisciplinary education+(ET) (Mj) 495
#80 Nursing education + (ET) (Mj) 54191
#81 Medical staff training (ftw) 22
#82 Medical staff education (ftw) 46
#83 Nursing staff education (ftw) 0
#84 Nursing staff training (ftw) 29
#85 COMPASS (ftw) 1954
#86 ALERT (ftw) 26060
#87 OR/#71-86 312400
#88 #29 AND #87 68 Screened 68; excluded 60; 8 potentially eligible – duplicates
Some Specific Searches Instrument Validation
#89 Sensitivity and specificity+ (ET) (Mj) 764
#90 Instrument validity (ftw) 91
#91 Instrument reliability (ftw) 174
#92 Instrument evaluation (ftw) 174
#93 Instrument validation +(ET) (Mj) 191
#94 Validity+ (ET) (Mj) 3171
#95 Reliability+ (ET) (Mj) 4545
#96 OR/89-95 8134
#97 #29 AND #96 25 Screened; 24 excluded (n=1) Rubin ? conf abstract
Some Specific Searches Cost-effectiveness
#98 Cost benefit analysis+ (ET) (Mj) 7738
#99 Costs and cost analysis (ftw) 122
#100 Health care costs+ (ET) (Mj) 47858
#101 Health facility costs (SH) (Mj) 3
#102 Cost + (ET) (Mj) 60706
#103 Medical care costs (ftw) 794
#104 Cost savings (ftw) and + 53524
#105 Cost effectiveness analysis+(ET) (Mj) 150064
#106 OR/98-105 126284

(13/10/2014 Final Version) Page 129
ET=Emtree; ftw=free text word
#107 #29 AND #106 15 Screened; exclude n=13; 2 potentially eligible for review

(13/10/2014 Final Version) Page 130
APPENDIX 8
COCHRANE DATABASE SEACH AND OUTPUTS

(13/10/2014 Final Version) Page 131
Cochrane Search Term Hits Eligible Paediatric/pediatric early warning All results n=4
Cochrane Reviews (all) (0) Other reviews (0) Trials (4) Method Studies (0) Technology Assessment (0) Economic Evaluations (0) Cochrane groups (0)
N=1 (DUP) Paper by C commentaries; Development of a score to predict clinical deterioration in hospitalized children.
Neonatal early warning All results n=2 Cochrane Reviews (all) (2) Other reviews (0) Trials (0) Method Studies (0) Technology Assessment (0) Economic Evaluations (0) Cochrane groups (0)
N=0
Pediatric/pediatric rapid response All results n=77 Cochrane Reviews (all) (2) Other reviews (0) Trials (75) Method Studies (0) Technology Assessment (0) Economic Evaluations (0) Cochrane groups (0)
N=0
Clinical deterioration children All results n=196 Cochrane Reviews (all) (7) Other reviews (0) Trials (187) Method Studies (0) Technology Assessment (0) Economic Evaluations (0) Cochrane groups (0)
N=0
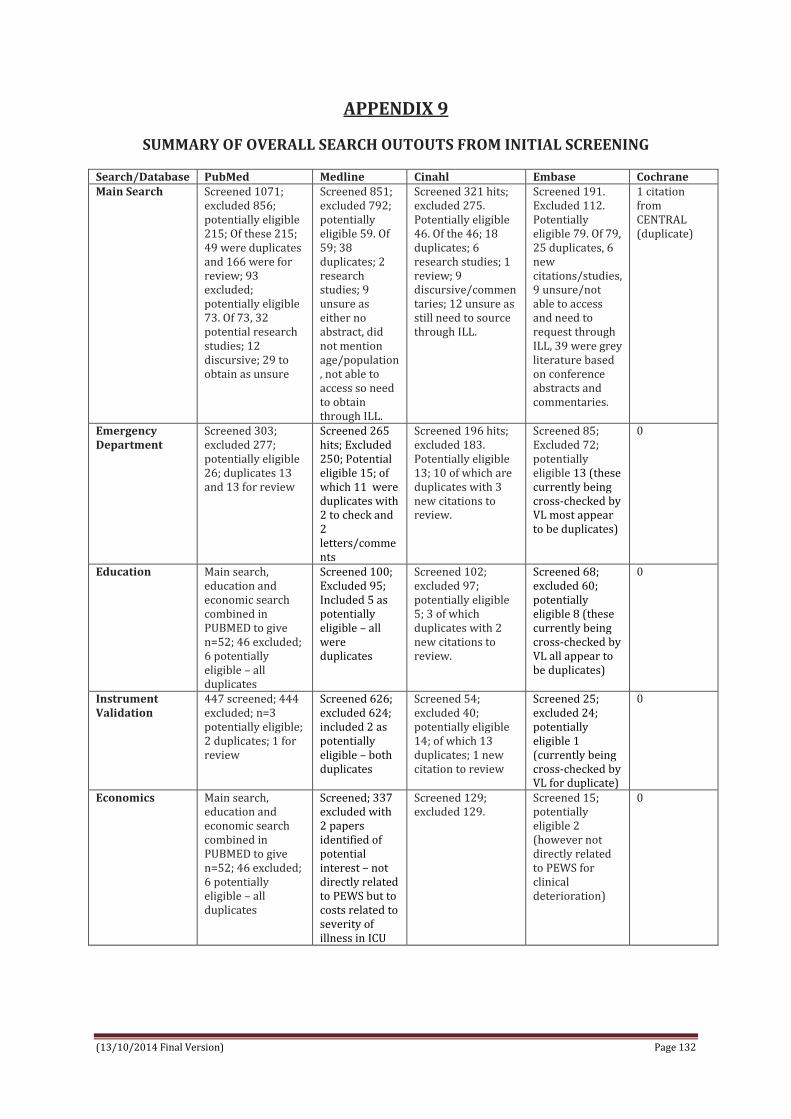
(13/10/2014 Final Version) Page 132
APPENDIX 9
SUMMARY OF OVERALL SEARCH OUTOUTS FROM INITIAL SCREENING
Search/Database PubMed Medline Cinahl Embase Cochrane Main Search Screened 1071;
excluded 856; potentially eligible 215; Of these 215; 49 were duplicates and 166 were for review; 93 excluded; potentially eligible 73. Of 73, 32 potential research studies; 12 discursive; 29 to obtain as unsure
Screened 851; excluded 792; potentially eligible 59. Of 59; 38 duplicates; 2 research studies; 9 unsure as either no abstract, did not mention age/population, not able to access so need to obtain through ILL.
Screened 321 hits; excluded 275. Potentially eligible 46. Of the 46; 18 duplicates; 6 research studies; 1 review; 9 discursive/commentaries; 12 unsure as still need to source through ILL.
Screened 191. Excluded 112. Potentially eligible 79. Of 79, 25 duplicates, 6 new citations/studies, 9 unsure/not able to access and need to request through ILL, 39 were grey literature based on conference abstracts and commentaries.
1 citation from CENTRAL (duplicate)
Emergency Department
Screened 303; excluded 277; potentially eligible 26; duplicates 13 and 13 for review
Screened 265 hits; Excluded 250; Potential eligible 15; of which 11 were duplicates with 2 to check and 2 letters/comments
Screened 196 hits; excluded 183. Potentially eligible 13; 10 of which are duplicates with 3 new citations to review.
Screened 85; Excluded 72; potentially eligible 13 (these currently being cross-checked by VL most appear to be duplicates)
0
Education Main search, education and economic search combined in PUBMED to give n=52; 46 excluded; 6 potentially eligible – all duplicates
Screened 100; Excluded 95; Included 5 as potentially eligible – all were duplicates
Screened 102; excluded 97; potentially eligible 5; 3 of which duplicates with 2 new citations to review.
Screened 68; excluded 60; potentially eligible 8 (these currently being cross-checked by VL all appear to be duplicates)
0
Instrument Validation
447 screened; 444 excluded; n=3 potentially eligible; 2 duplicates; 1 for review
Screened 626; excluded 624; included 2 as potentially eligible – both duplicates
Screened 54; excluded 40; potentially eligible 14; of which 13 duplicates; 1 new citation to review
Screened 25; excluded 24; potentially eligible 1 (currently being cross-checked by VL for duplicate)
0
Economics Main search, education and economic search combined in PUBMED to give n=52; 46 excluded; 6 potentially eligible – all duplicates
Screened; 337 excluded with 2 papers identified of potential interest – not directly related to PEWS but to costs related to severity of illness in ICU
Screened 129; excluded 129.
Screened 15; potentially eligible 2 (however not directly related to PEWS for clinical deterioration)
0

(13/10/2014 Final Version) Page 133
APPENDIX 10
Grey Literature Search and Outputs
Grey Literature Databases Search Terms Dates Hits Screen for eligibility
Research Inventory for Child Health in Europe http://www.childhealthresearch.eu/
‘paediatric early warning’ ‘pediatric early warning’ ‘neonatal early warning’ ‘PEWS’ ‘paediatric rapid response’ ‘pediatric rapid response’
15/7/2014 16/7/2014
13 (2 sci & 11 grey) 11 (2 sci & 10 grey) 6 (grey) 0 32 (2 sci; 28 grey; 2 proj) 22 (1 sci; 18 grey; 3 proj)
0 0 0 0 0 0
Agency for Healthcare Research and Quality http://www.ahrq.gov/
“pediatric early warning” “paediatric early warning” “neonatal early warning” “PEWS” “pediatric rapid response”
15/7/2014 16/7/2014
622 1 0 6 10
2* (1 DUP) 1 (1DUP) 0 0 7 (2 DUP) (2 exclude) N=4 to include
UK Clinical Research Network (UKCRN): Portfolio http://public.ukcrn.org.uk/search/
Searched category of children for ‘paediatric early warning’ http://public.ukcrn.org.uk/Search/Portfolio.aspx?Level1=4&titleAcro=paediatric+early+warning&SearchType=Any
20/7/2014 Return – EPOCH study http://public.ukcrn.org.uk/Search/StudyDetail.aspx?StudyID=11439
1 EPOCH
Open Grey http://www.opengrey.eu/
paediatric early warning OR pediatric early warning neonatal early warning OR newborn early warning OR infant early warning PEWS Paediatric/pediatric rapid response
15/7/2014 16/7/2014
0 1 4 0
0 0 0 0
Clinical Medical & Health Research:http://clinmed.netprints.org/home.dtl
Cannot seem to perform a random search check with Amanda in library
15/7/2014
PsycEXTRA http://www.apa.org/pubs/databases/psycextra/
“pediatric early warning” “paediatric early warning” “neonatal early warning”
15/7/2014
0 0 0
0 0 0

(13/10/2014 Final Version) Page 134
APPENDIX 11
Trial register searches and outputs
Ongoing Trials Search Terms Dates Hits Screening eligibility
International standard RCT number register ISRCTN http://www.controlled-trials.com/
Used a range of terms singularly including paediatric/pediatric/neonatal early warning; rapid response children; SBAR paediatrics/paediatrics and track and trigger paediatrics/paediatrics
15/7/2014 0 0
MetaRegister of Controlled Trials http://www.controlled-trials.com/mrct/ Searched all registers (includes ISRCTN register international, Action Medical research UK, NIH Clinical trials.gov register, the welcome trust UK, UK trials)
paediatric/pediatric/neonatal early warning PEWS Paediatric/pediatric rapid response
15/7/2014 16/7/2014
2 1 (DUP EPOCH) 0
1 – EPOCH study http://www.controlled-trials.com/mrct/trial/1343855/paediatric+early+warning
Clinicaltrials.gov paediatric/pediatric/neonatal early warning PEWS Paediatric/pediatric rapid response
15/7/2014 16/7/2014
10 12 0
3*** 3 (DUP) 0
UK Clinical Trials Gateway http://www.ukctg.nihr.ac.uk/default.aspx
paediatric/pediatric/neonatal early warning PEWS Paediatric/pediatric rapid response
20/07/2014 0 0
National Research Register (NRR) Archives Search http://www.nihr.ac.uk/Pages/NRRArchiveSearch.aspx
paediatric early warning (5) pediatric early warning (0) neonatal early warning (0) PEWS (3) Paediatric/pediatric rapid response (0)
20/07/2014
5
ALL DUPS
Australian New Zealand clinical trials registry ANZCTR http://www.anzctr.org.au/
paediatric/pediatric/neonatal early warning paediatric rapid response pediatric rapid response PEWS
15/7/2014 16/7/2014
1 3 8 1
1**** 0 0 1 (DUP)
WHO international clinical trials registry platform http://apps.who.int/trialsearch/
paediatric early warning pediatric early warning neonatal early warning PEWS Paediaric/pediatric rapid response
15/7/2014 16/7/2014
3 2 0 1 0
3**** 2 (1 DUP) 0 1 (DUP) 0

(13/10/2014 Final Version) Page 135
APPENDIX 12
Professional Organisations and Associations Search and Outputs
Professional Organisations/ Associations
Search Term Dates Hits Screening eligibility
Royal College of Paediatrics and Child Health http://www.rcpch.ac.uk/
‘paediatric early warning of clinical deterioration’ ‘neonatal early warning of clinical deterioration’ ‘PEWS’
16/7/2014
11 7 0
0 1 website (http://www.institute.nhs.uk/safer_care/paediatric_safer_care/the_paediatric_trigger_tool.html)
Paediatric Nursing Association of Europe http://www.rcn.org.uk/
“paediatric early warning” “neonatal early warning”
16/7/2014 12 0
3 (excel) 0
European Federation of Critical Care Nursing Associations http://www.efccna.org/
No Search Option 16/7/2014
Association of Anaesthetists of Great Britain and Ireland http://www.aagbi.org/
‘paediatric early warning’ ‘neonatal early warning’ ‘paediatric rapid response’ ‘PEWS’
16/7/2014 0 0 1 0
0 0 0 0
American Society of Anesthesiologists https://www.asahq.org/
‘pediatric early warning of clinical deterioration’ ‘neonatal early warning of clinical deterioration’
16/7/2014 67 32
0 0
American Academy of Pediatrics ‘pediatric early warning of clinical deterioration’ ‘neonatal early warning of clinical deterioration’
18/7/2014 18 8
1(same article as below) 1 (Article: Duncan et al DUP)
European Association for Children in Hospital http://www.each-for-sick-children.org/
‘paediatric early warning’ ‘neonatal early warning’ ‘paediatric rapid response’ PEWS
16/7/2014 0 0 0 0
0 0 0 0
Action for Sick Children, UK No Search Option 16/7/2014
Children’s Hospital Association US http://www.childrenshospitals.org/
‘pediatric early warning’ ‘neonatal early warning’ ‘pediatric rapid response’ ‘PEWS’
19/7/2014
0 0 0 0
0 0 0 0
Royal College of Physicians https://www.rcplondon.ac.uk/ Also National Clinical Guideline Centre (hosted by Royal College of Physician)
paediatric early warning OR pediatric early warning neonatal early warning paediatric rapid response PEWS
16/7/2014 0 0 21 0
0 0 0 0

(13/10/2014 Final Version) Page 136
APPENDIX 13
Ethics Approval Letter for Survey Consultation

(13/10/2014 Final Version) Page 137
APPENDIX 14
Plain Language Statement – Consultation Process
Plain Language Statement
Consultation Process with Paediatric Hospital Experts Internationally
Purpose of this consultation process The purpose of this consultation is to gather information from key paediatric hospitals and experts in the field on international evidence based clinical guidelines relating to the use, validation, education, evaluation, and cost effectiveness of Paediatric (including neonatal) Early Warning Scores (PEWS) in hospitals worldwide for the detection/timely identification of clinical deterioration in critically ill children. This consultation process is part of a larger Irish Department of Health tendered desk based systematic review encompassing research studies, clinical guidelines and grey literature. The goal of the systematic review is to support the development of an Irish National Clinical Guideline for Paediatric Early Warning Score (PEWS). The systematic review team This systematic review is being conducted by a team, led by Dr Veronica Lambert (Mail: [email protected]; Tel: 353 1 007161), at the School of Nursing and Human Sciences, Dublin City University (DCU), Ireland. Other members of the systematic review team include; Prof Anne Matthews (DCU), Dr Donal O’Mathuna (DCU), Dr Melissa Corbally (DCU), Prof Anthony Staines (DCU), Ms Caroline O’Connor (Temple Street Children’s Hospital) and two research assistants Marie O’Shea and Catherine Walshe. This consultation process has received ethical approval from the Research Ethics Committee at Dublin City University. Involvement in the consultation process We are inviting you to participate in this consultation process based on your expertise in paediatric early warning scoring systems and/or your association with paediatric hospital experts worldwide. We obtained your contact details from openly available resources on hospital websites internationally. Should you wish to participate in this consultation process, it will involve either completing an online consultation process (duration 10-15minutes to complete) and/or engaging in an audio-recorded (with your permission for ease of recall) telephone discussion (approx. duration of 30minutes at a date/time suitable to you). Risks of participating in this consultation process This is a low risk consultation engagement process with no anticipated risks to you. Benefits of participating in this consultation process There are no direct benefits to you if you decide to participate in this consultation process, however it would provide you with an opportunity to network and engage with colleagues internationally and share evidence and your expertise and experience of developing, using, implementing PEWS. This review will contribute to the development of an Irish National Clinical Guideline for the implementation of PEWS.

(13/10/2014 Final Version) Page 138
Confidentiality All data that we will gather through this consultation process will be used to inform our systematic review on PEWS. As part of the systematic review rigour, this consultation process is important to capture information about evidence based clinical guidelines and grey literature that is hard to reach through published sources. It is important to be aware that with your permission we will maintain a database of personnel contacted for our own tracking system and to have an audit trail for the systematic review process and for the Irish Department of Health who have tendered this review. In reporting the outcomes of the consultation process systematically, however, no personnel names will be recorded on any final reports; rather information will be generically tabulated and collectively presented. Audio-recorded material will be stored securely in a locked cabinet in the lead reviewers (Dr Lambert) office and erased following publication of the final report for the Department of Health (anticipated to be September 2014). Voluntary participation Participation in this consultation process is voluntary – you do not have to engage in any online or telephone discussions if you do not want to and you can withdraw from the consultation process at any point. For telephone discussions you will be asked to give your verbal consent (witnessed by a second reviewer) and/or provide an electronic copy of the consent form with my electronic signature at the outset of the conversation. For online discussions you will be asked to tick a box to verify your consent before proceeding with the consultation process. If participants have concerns about this consultation process and wish to contact an independent person, please contact: The Secretary, Dublin City University Research Ethics Committee, c/o Research and Innovation Support, Dublin City University, Dublin 9. Tel 01-7008000

(13/10/2014 Final Version) Page 139
APPENDIX 15
Informed consent form - Consultation Process
Informed Consent Form
Consultation Process with Paediatric Hospital Experts Internationally
Purpose of the consultation process The purpose of this consultation is to gather information relating to the use, validation, education, evaluation, and cost effectiveness of Paediatric Early Warning Scores (PEWS) in hospitals worldwide. This consultation process is part of a Department of Health tendered systematic review to support the development of an Irish National Clinical Guideline Paediatric Early Warning Score (PEWS). All data that we will gather through this consultation process will be used to inform our systematic review on PEWS. As part of the systematic review rigour, this consultation process is important to capture information about evidence based clinical guidelines and grey literature that is hard to reach through published sources. Systematic review team This systematic review is being conducted by a team, led by Dr Veronica Lambert (Mail: [email protected]; Tel: 353 1 007161), at the School of Nursing and Human Sciences, Dublin City University, Ireland. Other members of the systematic review team include; Prof Anne Matthews (DCU), Dr Donal O’Mathuna (DCU), Dr Melissa Corbally (DCU), Prof Anthony Staines (DCU), Ms Caroline O’Connor (Temple Street Children’s Hospital) and two research assistants Marie O’Shea and Catherine Walshe. This consultation process has received ethical approval from the Research Ethics Committee at Dublin City University. Involvement in the consultation process I understand that my involvement in the consultation process will involve either completing an online consultation process (duration 10-15minutes to complete) and/or engaging in an audio-recorded (with my permission for ease of recall) telephone discussion (approx. duration of 30-40minutes at a date/time suitable to me). I understand that audio-recorded material will be stored securely in a locked cabinet in the lead reviewers (Dr. Lambert) office and erased following publication of the final report for the Department of Health (anticipated to be September 2014). Consent to participate For telephone discussions I understand that I will be asked to give my verbal consent (witnessed by a second reviewer) and/or provide an electronic copy of the consent form with my electronic signature at the outset of the conversation. I will be asked to answer the following;
I have read the Plain Language Statement (or had it read to me) Yes/No I understand the information provided Yes/No I have had an opportunity to ask questions and discuss this consultation Yes/No I have received satisfactory answers to all my questions Yes/No I am aware that if I participate in a telephone discussion it will be audiotaped Yes/No

(13/10/2014 Final Version) Page 140
For online discussions I understand that I will be asked to tick a box to verify my consent before proceeding with the consultation process. Voluntary participation Participation in this consultation process is voluntary – you do not have to engage in any online or telephone discussions if you do not want to and you can withdraw from the consultation process at any point. Confidentiality I understand that with my permission a database of personnel consulted with will be maintained for tracking and audit trail purposes for the systematic review process and for the Irish Department of Health who have tendered this review. I am aware, however, that in reporting the outcomes of the consultation process systematically, no personnel names will be recorded on any final reports; rather information will be generically tabulated and collectively presented. Electronic Signature (for telephone discussions) I have read, or have and read to me, and understood the information in this form. My questions and concerns have been answered by the systematic review team, and I have an electronic copy of this consent form. Therefore, I consent to take part in this consultation process. Participants Signature: Name in Block Capitals: Witness: Date:

(13/10/2014 Final Version) Page 141
APPENDIX 16
Online Consultation Survey
Paediatric Early Warning Systems – Online Consultation Questionnaire with Experts Internationally Purpose of online consultation questionnaire: This online consultation has been designed to gather information from key paediatric hospitals and experts in the field on evidence based clinical guidelines relating to the use, validation, education, evaluation, and cost effectiveness of Neonatal and Paediatric Early Warning Scores/Systems (PEWS) in hospitals worldwide for the detection/timely identification of clinical deterioration in critically ill children. This consultation process is part of a larger Irish Department of Health tendered desk based systematic review encompassing research studies, clinical guidelines and grey literature. The review is being led by Dr Veronica Lambert at the School of Nursing and Human Sciences Dublin City University, Ireland ([email protected]; +353 1 7007161). This consultation process has received ethical approval from the Research Ethics Committee at Dublin City University. The goal of the review is to support the development of an Irish National Clinical Guideline for Paediatric Early Warning Score (PEWS). Confidentiality: All data gathered through this consultation process will be used to inform our systematic review on PEWS. As part of the systematic review rigour, this consultation process is important to capture information about evidence based clinical guidelines and grey literature that is hard to reach through published sources. For our tracking system and to have an audit trail for the systematic review process and for the Irish Department of Health who have tendered this review we ask for details of your role, the hospital you are affiliated with and your contact details (should we wish to follow up on information provided); however in reporting the overall outcomes of the consultation process systematically, no personnel names will be recorded on any final reports. Participation: Should you wish to participate in this consultation process, it will involve completing the following online consultation questionnaire of 10-15minutes duration. Before proceeding, please indicate you have understood the information above and are willing to complete the consultation questionnaire by ticking 'Yes' or 'No.'
I have understood the information provided and consent to take part in the online consultation questionnaire Yes/No Please insert the name of the hospital or academic institution to which you are affiliated Please indicate your clinical job title/role Please insert your name and contact email if you are happy for us to contact you for further information
1. Does the above named hospital use a paediatric early warning score (PEWS)? Yes No Unsure
2. If yes, what PEWS does the named hospital use? Tick as appropriate. Please insert name where possible.
A pre-existing validated PEWS A modified version of PEWS A modified version of an adult EWS (early warning score) A neonatal early warning score Other
3. For what child age range if the PEWS intended and used for in the named hospital? Please tick as many as appropriate 0-1 month old newborn 2-23 month old infant 2-5 year old child 6-12 year old child 13-16 year old young person 17-18 year old young person 4. Where in the hospital is PEWS used?
General ward areas (e.g. medical, surgical). Please give details. Intensive/critical care areas (e.g. PICU, NICU). Please give details. Specialist areas (e.g. oncology, metabolic). Please give details. Emergency care areas (e.g. emergency departments, triage). Please give details. Other (please give details)
5. Does the hospital have specific guidelines/protocols/policies for the identification of clinical deterioration in neonates/children?
Yes No Unsure

(13/10/2014 Final Version) Page 142
6. If yes, would the hospital be happy to share a copy of these guidelines/protocols/policies with the review team at Dublin City University. If so please send a copy of the named guidelines to [email protected]. Please continue the survey. 7. What do the PEWS guidelines include? Tick as appropriate
Standards for measuring and recording physiological observations Protocol for documenting a total PEWS score Process of communicating concern about the severity/deterioration of a child’s condition Graded response strategy for abnormal physiological observations Role and responsibilities of health professionals in relation to observation, detection and response of
clinical deterioration of a child Policy for addressing the education and training needs of health professionals for observing, detecting and
responding to the clinical deterioration of a child Parent role and responsibility in initiation of rapid response Other 9please give details)
8. What informed the development of the content of the guidelines/protocols/policies mentioned in question 6 above? Please tick as appropriate
Content developed on site of hospital by clinical development team based on clinical expertise. Please give details in box provided.
Content informed by conduct of literature review in field of PEWS. Please give details in box provided. Content informed by research study/studies conducted. Please give details in box provided. Content adopted from another hospital/organization. Please give details in box provided. Other
9. If possible, give details of any evidence that informed the development of the guidelines. 10. Does the named hospital have a training program for educating health professional staff on the use and implementation of PEWS?
Yes No Unsure
11. If yes, would the hospital be happy to share a copy of the named training program with the review team at Dublin City University. If so please send a copy of the named guidelines to [email protected]. Please continue the survey. 12. What type of training is provided to health professional staff on the use and implementation of PEWS?
Formal (e.g. structured in-service programme) . Please give details. Informal (e.g. in-situ experiential). Please give details. Other (Please give details)
13. How often is training provided? Once off on introduction of PEWS Yearly Every 2 years Every 3 years More than every 3 years 14. What format is training delivered in? i.e. online/face-to-face and within what timeframe is it delivered in? e.g. face-to-face for half a day. 15. What costs have been encountered with the implementation of PEWS? Material costs. If possible, provide an estimated cost of materials. Staff training costs. If possible provide an estimated cost of training. Other costs. If possible please give details and estimates. Unknown 16. Is there evidence that the introduction of PEWS had altered clinical outcomes? Yes. Please provide details. No Unsure

(13/10/2014 Final Version) Page 143
APPENDIX 17
Clinical Guideline Screening
Guideline Key
question/s covered
Publication date
Rigour of development score (HIQA 2011)
Institute for Clinical Systems Improvement, Bloomington (MH). 2009. Rapid Response Team – Health Care Protocol.
NR 2009 6
Mid Essex Hospital Service. 2009. NHS Guideline for using Children’s Early Warning Tool (CEWT)
NR 2009 4
Central Manchester University Hospital. 2011. NHS Guideline for Manchester Children’s Early Warning Score (ManChEWS2) Policy
NR 2011 4
Kettering General Hospital. 2011. PEWS (Paediatric Early Warning Score) guideline for paediatric patients
NR 2011 4
Worcestershire NHS Trust. 2011. Paediatric Early Warning Score Clinical Guideline
NR 2011 4
Royal Cornwell Hospitals NHS Trust. 2012. Policy for patient observation and monitoring in child health
NR 2012 4
University Hospital Bristol NHS Foundation Trust.2012. Clinical protocol for recording and acting upon physiological observations in paediatric in-patient areas
NR 2012 4
East Cheshire NHS Trust. 2013. Procedure for assessing and measuring vital signs on paediatric patients and using the Paediatric Early Warning Score
NR 2013 4
Worcestershire NHS. 2013. Paediatric Monitoring and Observation Guideline
NR 2013 4
Tameside Hospital –NHS Trust. 2014. Paediatric Early Warning Scoring Policy
NR 2014 4
The Hillingdon Hospital Trust – NHS. 2014. Monitoring Newborn Babies At Risk of Neonatal Illness In The Maternity Unit
NR 2014 4

(13/10/2014 Final Version) Page 144
APPENDIX 18
Clinical Guideline Rigour of Development Assessment
Institute for Clinical Systems Improvement, Bloomington (MH). 2009. Rapid Response Team –
Health Care Protocol
Domain Criteria Rating 1 2 3 4 5 6 7
Feasibility 1. National health policy and programmes and relevant existing guidelines are specifically considered.
x
Scope and purpose
2. The overall objective of the guideline is specifically described with the expected benefit or outcome of the guideline clearly outlined.
x
3. The health question covered by the guideline is specifically described.
x
4. The population (patients, public, etc.) to whom the guideline is meant to apply is specifically described.
x
Stakeholder involvement
5. The guideline development group includes individuals from all the relevant professional groups and intended users (for example healthcare professionals, hospital managers, methodological experts etc.
x
6. The views and preferences of the population to whom the guideline will apply (patients, public etc.) are sought and he guideline development group takes these into consideration.
x
7. The intended users of the guideline are clearly defined.
x
Editorial independence
8. The views of the funding body have not influenced the content of the guideline. The funding body or source of funding is clearly described or there is an explicit statement of no funding.
x
9.Competing interests of guideline development group members are recorded and addressed with a clear description of the measures taken to minimise the influence of these interests on guideline development.
x
Rigour of development
10.Competing interests of guideline development group members are recorded and addressed with a clear description of the measures taken to minimise the influence of these interests on guideline development.
x
11. The criteria for selecting the evidence are clearly described with reasons for including and excluding evidence clearly stated.
x
12. The strengths and limitations of the body of evidence are clearly described with the methods or tools for assessing the quality of the evidence documented
x
13. The methods used for formulating the recommendations are clearly described
x
14. The health benefits, side effects, risks, cost effectiveness, resource implications and health service delivery issues have been considered in formulating the recommendations.
x
15. The recommendations have been graded for quality of evidence and strength of recommendation with an explicit link between the recommendations and supporting evidence.
x
16. The guideline has been externally reviewed prior to its publication. There is a clear description of the selection process for experienced and knowledgeable external reviewers and how the information gathered was used by the guideline development group.
x

(13/10/2014 Final Version) Page 145
17. A procedure for updating the guideline is provided and includes an explicit time interval.
x
Clarity of presentation
18. The recommendations are specific, clear and easily identifiable with the intent or purpose of the recommended action clearly outlined.
x
19. The different options for management of the condition or health issue are clearly presented with a description of the population or clinical situation most appropriate to each option.
x
20. Key recommendations are easily identifiable. x Applicability 21. The guideline describes facilitators and
barriers to its application. x
22. The guideline provides advice and/or tools on how the recommendations can be put into practice.
x
23. The potential budget impact and resource implications (equipment, staff, training etc.) of applying the recommendations have been considered.
x
24. The guideline presents monitoring and/or auditing criteria to assess adherence to recommendations and the impact of implementing the recommendations.
x

(13/10/2014 Final Version) Page 146
Mid Essex Hospital Service. 2009. NHS Guideline for using Children’s Early Warning Tool (CEWT)
Domain Criteria Rating 1 2 3 4 5 6 7
Feasibility 1. National health policy and programmes and relevant existing guidelines are specifically considered.
x
Scope and purpose
2. The overall objective of the guideline is specifically described with the expected benefit or outcome of the guideline clearly outlined.
x
3. The health question covered by the guideline is specifically described.
x
4. The population (patients, public, etc.) to whom the guideline is meant to apply is specifically described.
x
Stakeholder involvement
5. The guideline development group includes individuals from all the relevant professional groups and intended users (for example healthcare professionals, hospital managers, methodological experts etc.
x
6. The views and preferences of the population to whom the guideline will apply (patients, public etc.) are sought and he guideline development group takes these into consideration.
x
7. The intended users of the guideline are clearly defined.
x
Editorial independence
8. The views of the funding body have not influenced the content of the guideline. The funding body or source of funding is clearly described or there is an explicit statement of no funding.
x
9.Competing interests of guideline development group members are recorded and addressed with a clear description of the measures taken to minimise the influence of these interests on guideline development.
x
Rigour of development
9.Competing interests of guideline development group members are recorded and addressed with a clear description of the measures taken to minimise the influence of these interests on guideline development.
x
11. The criteria for selecting the evidence are clearly described with reasons for including and excluding evidence clearly stated.
x
12. The strengths and limitations of the body of evidence are clearly described with the methods or tools for assessing the quality of the evidence documented
x
13. The methods used for formulating the recommendations are clearly described
x
14. The health benefits, side effects, risks, cost effectiveness, resource implications and health service delivery issues have been considered in formulating the recommendations.
x
15. The recommendations have been graded for quality of evidence and strength of recommendation with an explicit link between the recommendations and supporting evidence.
x
16. The guideline has been externally reviewed prior to its publication. There is a clear description of the selection process for experienced and knowledgeable external reviewers and how the information gathered was used by the guideline development group.
x
17. A procedure for updating the guideline is provided and includes an explicit time interval.
x
Clarity of presentation
18. The recommendations are specific, clear and easily identifiable with the intent or purpose of the recommended action clearly outlined.
x
19. The different options for management of the condition or health issue are clearly presented
x

(13/10/2014 Final Version) Page 147
with a description of the population or clinical situation most appropriate to each option. 20. Key recommendations are easily identifiable. x
Applicability 21. The guideline describes facilitators and barriers to its application.
x
22. The guideline provides advice and/or tools on how the recommendations can be put into practice.
x
23. The potential budget impact and resource implications (equipment, staff, training etc.) of applying the recommendations have been considered.
x
24. The guideline presents monitoring and/or auditing criteria to assess adherence to recommendations and the impact of implementing the recommendations.
x

(13/10/2014 Final Version) Page 148
Central Manchester University Hospital. 2011. NHS Guideline for Manchester Children’s Early
Warning Score (ManChEWS2) Policy
Domain Criteria Rating 1 2 3 4 5 6 7
Feasibility 1. National health policy and programmes and relevant existing guidelines are specifically considered.
x
Scope and purpose
2. The overall objective of the guideline is specifically described with the expected benefit or outcome of the guideline clearly outlined.
x
3. The health question covered by the guideline is specifically described.
x
4. The population (patients, public, etc.) to whom the guideline is meant to apply is specifically described.
x
Stakeholder involvement
5. The guideline development group includes individuals from all the relevant professional groups and intended users (for example healthcare professionals, hospital managers, methodological experts etc.
x
6. The views and preferences of the population to whom the guideline will apply (patients, public etc.) are sought and he guideline development group takes these into consideration.
x
7. The intended users of the guideline are clearly defined.
x
Editorial independence
8. The views of the funding body have not influenced the content of the guideline. The funding body or source of funding is clearly described or there is an explicit statement of no funding.
x
9.Competing interests of guideline development group members are recorded and addressed with a clear description of the measures taken to minimise the influence of these interests on guideline development.
x
Rigour of development
9.Competing interests of guideline development group members are recorded and addressed with a clear description of the measures taken to minimise the influence of these interests on guideline development.
x
11. The criteria for selecting the evidence are clearly described with reasons for including and excluding evidence clearly stated.
x
12. The strengths and limitations of the body of evidence are clearly described with the methods or tools for assessing the quality of the evidence documented
x
13. The methods used for formulating the recommendations are clearly described
x
14. The health benefits, side effects, risks, cost effectiveness, resource implications and health service delivery issues have been considered in formulating the recommendations.
x
15. The recommendations have been graded for quality of evidence and strength of recommendation with an explicit link between the recommendations and supporting evidence.
x
16. The guideline has been externally reviewed prior to its publication. There is a clear description of the selection process for experienced and knowledgeable external reviewers and how the information gathered was used by the guideline development group.
x
17. A procedure for updating the guideline is provided and includes an explicit time interval.
x
Clarity of presentation
18. The recommendations are specific, clear and easily identifiable with the intent or purpose of the recommended action clearly outlined.
x

(13/10/2014 Final Version) Page 149
19. The different options for management of the condition or health issue are clearly presented with a description of the population or clinical situation most appropriate to each option.
x
20. Key recommendations are easily identifiable. x Applicability 21. The guideline describes facilitators and
barriers to its application. x
22. The guideline provides advice and/or tools on how the recommendations can be put into practice.
x
23. The potential budget impact and resource implications (equipment, staff, training etc.) of applying the recommendations have been considered.
x
24. The guideline presents monitoring and/or auditing criteria to assess adherence to recommendations and the impact of implementing the recommendations.
x

(13/10/2014 Final Version) Page 150
Kettering General Hospital NHS. 2011. PEWS (Paediatric Early Warning Score) guideline for
paediatric patients
Domain Criteria Rating 1 2 3 4 5 6 7
Feasibility 1. National health policy and programmes and relevant existing guidelines are specifically considered.
x
Scope and purpose
2. The overall objective of the guideline is specifically described with the expected benefit or outcome of the guideline clearly outlined.
x
3. The health question covered by the guideline is specifically described.
x
4. The population (patients, public, etc.) to whom the guideline is meant to apply is specifically described.
x
Stakeholder involvement
5. The guideline development group includes individuals from all the relevant professional groups and intended users (for example healthcare professionals, hospital managers, methodological experts etc.
x
6. The views and preferences of the population to whom the guideline will apply (patients, public etc.) are sought and he guideline development group takes these into consideration.
x
7. The intended users of the guideline are clearly defined.
x
Editorial independence
8. The views of the funding body have not influenced the content of the guideline. The funding body or source of funding is clearly described or there is an explicit statement of no funding.
x
9.Competing interests of guideline development group members are recorded and addressed with a clear description of the measures taken to minimise the influence of these interests on guideline development.
x
Rigour of development
9.Competing interests of guideline development group members are recorded and addressed with a clear description of the measures taken to minimise the influence of these interests on guideline development.
x
11. The criteria for selecting the evidence are clearly described with reasons for including and excluding evidence clearly stated.
x
12. The strengths and limitations of the body of evidence are clearly described with the methods or tools for assessing the quality of the evidence documented
x
13. The methods used for formulating the recommendations are clearly described
x
14. The health benefits, side effects, risks, cost effectiveness, resource implications and health service delivery issues have been considered in formulating the recommendations.
x
15. The recommendations have been graded for quality of evidence and strength of recommendation with an explicit link between the recommendations and supporting evidence.
x
16. The guideline has been externally reviewed prior to its publication. There is a clear description of the selection process for experienced and knowledgeable external reviewers and how the information gathered was used by the guideline development group.
x
17. A procedure for updating the guideline is provided and includes an explicit time interval.
x
Clarity of 18. The recommendations are specific, clear and easily identifiable with the intent or purpose of
x

(13/10/2014 Final Version) Page 151
presentation the recommended action clearly outlined. 19. The different options for management of the condition or health issue are clearly presented with a description of the population or clinical situation most appropriate to each option.
x
20. Key recommendations are easily identifiable. x Applicability 21. The guideline describes facilitators and
barriers to its application. x
22. The guideline provides advice and/or tools on how the recommendations can be put into practice.
x
23. The potential budget impact and resource implications (equipment, staff, training etc.) of applying the recommendations have been considered.
x
24. The guideline presents monitoring and/or auditing criteria to assess adherence to recommendations and the impact of implementing the recommendations.
x

(13/10/2014 Final Version) Page 152
Worcestershire NHS Trust. 2011. Paediatric Early Warning Score Clinical Guideline
Domain Criteria Rating 1 2 3 4 5 6 7
Feasibility 1. National health policy and programmes and relevant existing guidelines are specifically considered.
x
Scope and purpose
2. The overall objective of the guideline is specifically described with the expected benefit or outcome of the guideline clearly outlined.
x
3. The health question covered by the guideline is specifically described.
x
4. The population (patients, public, etc.) to whom the guideline is meant to apply is specifically described.
x
Stakeholder involvement
5. The guideline development group includes individuals from all the relevant professional groups and intended users (for example healthcare professionals, hospital managers, methodological experts etc.
x
6. The views and preferences of the population to whom the guideline will apply (patients, public etc.) are sought and he guideline development group takes these into consideration.
x
7. The intended users of the guideline are clearly defined.
x
Editorial independence
8. The views of the funding body have not influenced the content of the guideline. The funding body or source of funding is clearly described or there is an explicit statement of no funding.
x
9.Competing interests of guideline development group members are recorded and addressed with a clear description of the measures taken to minimise the influence of these interests on guideline development.
x
Rigour of development
9.Competing interests of guideline development group members are recorded and addressed with a clear description of the measures taken to minimise the influence of these interests on guideline development.
x
11. The criteria for selecting the evidence are clearly described with reasons for including and excluding evidence clearly stated.
x
12. The strengths and limitations of the body of evidence are clearly described with the methods or tools for assessing the quality of the evidence documented
x
13. The methods used for formulating the recommendations are clearly described
x
14. The health benefits, side effects, risks, cost effectiveness, resource implications and health service delivery issues have been considered in formulating the recommendations.
x
15. The recommendations have been graded for quality of evidence and strength of recommendation with an explicit link between the recommendations and supporting evidence.
x
16. The guideline has been externally reviewed prior to its publication. There is a clear description of the selection process for experienced and knowledgeable external reviewers and how the information gathered was used by the guideline development group.
x
17. A procedure for updating the guideline is provided and includes an explicit time interval.
x
Clarity of presentation
18. The recommendations are specific, clear and easily identifiable with the intent or purpose of the recommended action clearly outlined.
x

(13/10/2014 Final Version) Page 153
19. The different options for management of the condition or health issue are clearly presented with a description of the population or clinical situation most appropriate to each option.
x
20. Key recommendations are easily identifiable. x Applicability 21. The guideline describes facilitators and
barriers to its application. x
22. The guideline provides advice and/or tools on how the recommendations can be put into practice.
x
23. The potential budget impact and resource implications (equipment, staff, training etc.) of applying the recommendations have been considered.
x
24. The guideline presents monitoring and/or auditing criteria to assess adherence to recommendations and the impact of implementing the recommendations.
x

(13/10/2014 Final Version) Page 154
Royal Cornwell Hospitals NHS. 2012. Policy for patient observation and monitoring in child
health.
Domain Criteria Rating
1 2 3 4 5 6 7
Feasibility 1. National health policy and programmes and relevant existing guidelines are specifically considered.
x
Scope and purpose
2. The overall objective of the guideline is specifically described with the expected benefit or outcome of the guideline clearly outlined.
x
3. The health question covered by the guideline is specifically described.
x
4. The population (patients, public, etc.) to whom the guideline is meant to apply is specifically described.
x
Stakeholder involvement
5. The guideline development group includes individuals from all the relevant professional groups and intended users (for example healthcare professionals, hospital managers, methodological experts etc.
x
6. The views and preferences of the population to whom the guideline will apply (patients, public etc.) are sought and he guideline development group takes these into consideration.
x
7. The intended users of the guideline are clearly defined.
x
Editorial independence
8. The views of the funding body have not influenced the content of the guideline. The funding body or source of funding is clearly described or there is an explicit statement of no funding.
x
9.Competing interests of guideline development group members are recorded and addressed with a clear description of the measures taken to minimise the influence of these interests on guideline development.
x
Rigour of development
9.Competing interests of guideline development group members are recorded and addressed with a clear description of the measures taken to minimise the influence of these interests on guideline development.
x
11. The criteria for selecting the evidence are clearly described with reasons for including and excluding evidence clearly stated.
x
12. The strengths and limitations of the body of evidence are clearly described with the methods or tools for assessing the quality of the evidence documented
x
13. The methods used for formulating the recommendations are clearly described
x
14. The health benefits, side effects, risks, cost effectiveness, resource implications and health service delivery issues have been considered in formulating the recommendations.
x
15. The recommendations have been graded for quality of evidence and strength of recommendation with an explicit link between the recommendations and supporting evidence.
x
16. The guideline has been externally reviewed prior to its publication. There is a clear description of the selection process for experienced and knowledgeable external reviewers and how the information gathered was used by the guideline development group.
x
17. A procedure for updating the guideline is provided and includes an explicit time interval.
x

(13/10/2014 Final Version) Page 155
Clarity of presentation
18. The recommendations are specific, clear and easily identifiable with the intent or purpose of the recommended action clearly outlined.
x
19. The different options for management of the condition or health issue are clearly presented with a description of the population or clinical situation most appropriate to each option.
x
20. Key recommendations are easily identifiable. x
Applicability 21. The guideline describes facilitators and barriers to its application.
x
22. The guideline provides advice and/or tools on how the recommendations can be put into practice.
x
23. The potential budget impact and resource implications (equipment, staff, training etc.) of applying the recommendations have been considered.
x
24. The guideline presents monitoring and/or auditing criteria to assess adherence to recommendations and the impact of implementing the recommendations.
x

(13/10/2014 Final Version) Page 156
University Hospital Bristol NHS Foundation Trust. 2012. Clinical protocol for recording and
acting upon physiological observations in paediatric in-patient areas.
Domain Criteria Rating 1 2 3 4 5 6 7
Feasibility 1. National health policy and programmes and relevant existing guidelines are specifically considered.
x
Scope and purpose
2. The overall objective of the guideline is specifically described with the expected benefit or outcome of the guideline clearly outlined.
x
3. The health question covered by the guideline is specifically described.
x
4. The population (patients, public, etc.) to whom the guideline is meant to apply is specifically described.
x
Stakeholder involvement
5. The guideline development group includes individuals from all the relevant professional groups and intended users (for example healthcare professionals, hospital managers, methodological experts etc.
x
6. The views and preferences of the population to whom the guideline will apply (patients, public etc.) are sought and he guideline development group takes these into consideration.
x
7. The intended users of the guideline are clearly defined.
x
Editorial independence
8. The views of the funding body have not influenced the content of the guideline. The funding body or source of funding is clearly described or there is an explicit statement of no funding.
x
9.Competing interests of guideline development group members are recorded and addressed with a clear description of the measures taken to minimise the influence of these interests on guideline development.
x
Rigour of development
9.Competing interests of guideline development group members are recorded and addressed with a clear description of the measures taken to minimise the influence of these interests on guideline development.
x
11. The criteria for selecting the evidence are clearly described with reasons for including and excluding evidence clearly stated.
x
12. The strengths and limitations of the body of evidence are clearly described with the methods or tools for assessing the quality of the evidence documented
x
13. The methods used for formulating the recommendations are clearly described
x
14. The health benefits, side effects, risks, cost effectiveness, resource implications and health service delivery issues have been considered in formulating the recommendations.
x
15. The recommendations have been graded for quality of evidence and strength of recommendation with an explicit link between the recommendations and supporting evidence.
x
16. The guideline has been externally reviewed prior to its publication. There is a clear description of the selection process for experienced and knowledgeable external reviewers and how the information gathered was used by the guideline development group.
x
17. A procedure for updating the guideline is provided and includes an explicit time interval.
x
Clarity of 18. The recommendations are specific, clear and easily identifiable with the intent or purpose of
x

(13/10/2014 Final Version) Page 157
presentation the recommended action clearly outlined. 19. The different options for management of the condition or health issue are clearly presented with a description of the population or clinical situation most appropriate to each option.
x
20. Key recommendations are easily identifiable. x Applicability 21. The guideline describes facilitators and
barriers to its application. x
22. The guideline provides advice and/or tools on how the recommendations can be put into practice.
x
23. The potential budget impact and resource implications (equipment, staff, training etc.) of applying the recommendations have been considered.
x
24. The guideline presents monitoring and/or auditing criteria to assess adherence to recommendations and the impact of implementing the recommendations.
x

(13/10/2014 Final Version) Page 158
East Cheshire NHS Trust. 2013. Procedure for assessing and measuring vital signs on paediatric
patients and using the Paediatric Early Warning Score.
Domain Criteria Rating 1 2 3 4 5 6 7
Feasibility 1. National health policy and programmes and relevant existing guidelines are specifically considered.
x
Scope and purpose
2. The overall objective of the guideline is specifically described with the expected benefit or outcome of the guideline clearly outlined.
x
3. The health question covered by the guideline is specifically described.
x
4. The population (patients, public, etc.) to whom the guideline is meant to apply is specifically described.
x
Stakeholder involvement
5. The guideline development group includes individuals from all the relevant professional groups and intended users (for example healthcare professionals, hospital managers, methodological experts etc.
x
6. The views and preferences of the population to whom the guideline will apply (patients, public etc.) are sought and he guideline development group takes these into consideration.
x
7. The intended users of the guideline are clearly defined.
x
Editorial independence
8. The views of the funding body have not influenced the content of the guideline. The funding body or source of funding is clearly described or there is an explicit statement of no funding.
x
9.Competing interests of guideline development group members are recorded and addressed with a clear description of the measures taken to minimise the influence of these interests on guideline development.
x
Rigour of development
9.Competing interests of guideline development group members are recorded and addressed with a clear description of the measures taken to minimise the influence of these interests on guideline development.
x
11. The criteria for selecting the evidence are clearly described with reasons for including and excluding evidence clearly stated.
x
12. The strengths and limitations of the body of evidence are clearly described with the methods or tools for assessing the quality of the evidence documented
x
13. The methods used for formulating the recommendations are clearly described
x
14. The health benefits, side effects, risks, cost effectiveness, resource implications and health service delivery issues have been considered in formulating the recommendations.
x
15. The recommendations have been graded for quality of evidence and strength of recommendation with an explicit link between the recommendations and supporting evidence.
x
16. The guideline has been externally reviewed prior to its publication. There is a clear description of the selection process for experienced and knowledgeable external reviewers and how the information gathered was used by the guideline development group.
x
17. A procedure for updating the guideline is provided and includes an explicit time interval.
x
Clarity of 18. The recommendations are specific, clear and easily identifiable with the intent or purpose of
x

(13/10/2014 Final Version) Page 159
presentation the recommended action clearly outlined. 19. The different options for management of the condition or health issue are clearly presented with a description of the population or clinical situation most appropriate to each option.
x
20. Key recommendations are easily identifiable. x Applicability 21. The guideline describes facilitators and
barriers to its application. x
22. The guideline provides advice and/or tools on how the recommendations can be put into practice.
x
23. The potential budget impact and resource implications (equipment, staff, training etc.) of applying the recommendations have been considered.
x
24. The guideline presents monitoring and/or auditing criteria to assess adherence to recommendations and the impact of implementing the recommendations.
x

(13/10/2014 Final Version) Page 160
Worcestershire NHS. 2013. Paediatric Monitoring and Observation Guideline
Domain Criteria Rating 1 2 3 4 5 6 7
Feasibility 1. National health policy and programmes and relevant existing guidelines are specifically considered.
x
Scope and purpose
2. The overall objective of the guideline is specifically described with the expected benefit or outcome of the guideline clearly outlined.
x
3. The health question covered by the guideline is specifically described.
x
4. The population (patients, public, etc.) to whom the guideline is meant to apply is specifically described.
x
Stakeholder involvement
5. The guideline development group includes individuals from all the relevant professional groups and intended users (for example healthcare professionals, hospital managers, methodological experts etc.
x
6. The views and preferences of the population to whom the guideline will apply (patients, public etc.) are sought and he guideline development group takes these into consideration.
x
7. The intended users of the guideline are clearly defined.
x
Editorial independence
8. The views of the funding body have not influenced the content of the guideline. The funding body or source of funding is clearly described or there is an explicit statement of no funding.
x
9.Competing interests of guideline development group members are recorded and addressed with a clear description of the measures taken to minimise the influence of these interests on guideline development.
x
Rigour of development
9.Competing interests of guideline development group members are recorded and addressed with a clear description of the measures taken to minimise the influence of these interests on guideline development.
x
11. The criteria for selecting the evidence are clearly described with reasons for including and excluding evidence clearly stated.
x
12. The strengths and limitations of the body of evidence are clearly described with the methods or tools for assessing the quality of the evidence documented
x
13. The methods used for formulating the recommendations are clearly described
x
14. The health benefits, side effects, risks, cost effectiveness, resource implications and health service delivery issues have been considered in formulating the recommendations.
x
15. The recommendations have been graded for quality of evidence and strength of recommendation with an explicit link between the recommendations and supporting evidence.
x
16. The guideline has been externally reviewed prior to its publication. There is a clear description of the selection process for experienced and knowledgeable external reviewers and how the information gathered was used by the guideline development group.
x
17. A procedure for updating the guideline is provided and includes an explicit time interval.
x
Clarity of presentation
18. The recommendations are specific, clear and easily identifiable with the intent or purpose of the recommended action clearly outlined.
x

(13/10/2014 Final Version) Page 161
19. The different options for management of the condition or health issue are clearly presented with a description of the population or clinical situation most appropriate to each option.
x
20. Key recommendations are easily identifiable. x Applicability 21. The guideline describes facilitators and
barriers to its application. x
22. The guideline provides advice and/or tools on how the recommendations can be put into practice.
x
23. The potential budget impact and resource implications (equipment, staff, training etc.) of applying the recommendations have been considered.
x
24. The guideline presents monitoring and/or auditing criteria to assess adherence to recommendations and the impact of implementing the recommendations.
x

(13/10/2014 Final Version) Page 162
Tameside Hospital NHS. 2014. Paediatric Early Warning Scoring Policy.
Domain Criteria Rating 1 2 3 4 5 6 7
Feasibility 1. National health policy and programmes and relevant existing guidelines are specifically considered.
x
Scope and purpose
2. The overall objective of the guideline is specifically described with the expected benefit or outcome of the guideline clearly outlined.
x
3. The health question covered by the guideline is specifically described.
x
4. The population (patients, public, etc.) to whom the guideline is meant to apply is specifically described.
x
Stakeholder involvement
5. The guideline development group includes individuals from all the relevant professional groups and intended users (for example healthcare professionals, hospital managers, methodological experts etc.
x
6. The views and preferences of the population to whom the guideline will apply (patients, public etc.) are sought and he guideline development group takes these into consideration.
x
7. The intended users of the guideline are clearly defined.
x
Editorial independence
8. The views of the funding body have not influenced the content of the guideline. The funding body or source of funding is clearly described or there is an explicit statement of no funding.
x
9.Competing interests of guideline development group members are recorded and addressed with a clear description of the measures taken to minimise the influence of these interests on guideline development.
x
Rigour of development
9.Competing interests of guideline development group members are recorded and addressed with a clear description of the measures taken to minimise the influence of these interests on guideline development.
x
11. The criteria for selecting the evidence are clearly described with reasons for including and excluding evidence clearly stated.
x
12. The strengths and limitations of the body of evidence are clearly described with the methods or tools for assessing the quality of the evidence documented
x
13. The methods used for formulating the recommendations are clearly described
x
14. The health benefits, side effects, risks, cost effectiveness, resource implications and health service delivery issues have been considered in formulating the recommendations.
x
15. The recommendations have been graded for quality of evidence and strength of recommendation with an explicit link between the recommendations and supporting evidence.
x
16. The guideline has been externally reviewed prior to its publication. There is a clear description of the selection process for experienced and knowledgeable external reviewers and how the information gathered was used by the guideline development group.
x
17. A procedure for updating the guideline is provided and includes an explicit time interval.
x
Clarity of presentation
18. The recommendations are specific, clear and easily identifiable with the intent or purpose of the recommended action clearly outlined.
x

(13/10/2014 Final Version) Page 163
19. The different options for management of the condition or health issue are clearly presented with a description of the population or clinical situation most appropriate to each option.
x
20. Key recommendations are easily identifiable. x Applicability 21. The guideline describes facilitators and
barriers to its application. x
22. The guideline provides advice and/or tools on how the recommendations can be put into practice.
x
23. The potential budget impact and resource implications (equipment, staff, training etc.) of applying the recommendations have been considered.
x
24. The guideline presents monitoring and/or auditing criteria to assess adherence to recommendations and the impact of implementing the recommendations.
x

(13/10/2014 Final Version) Page 164
The Hillingdon Hospitals – NHS. 2014. Monitoring Newborn Babies At Risk of Neonatal Illness In
The Maternity Unit.
Domain Criteria Rating 1 2 3 4 5 6 7
Feasibility 1. National health policy and programmes and relevant existing guidelines are specifically considered.
x
Scope and purpose
2. The overall objective of the guideline is specifically described with the expected benefit or outcome of the guideline clearly outlined.
x
3. The health question covered by the guideline is specifically described.
x
4. The population (patients, public, etc.) to whom the guideline is meant to apply is specifically described.
x
Stakeholder involvement
5. The guideline development group includes individuals from all the relevant professional groups and intended users (for example healthcare professionals, hospital managers, methodological experts etc.
x
6. The views and preferences of the population to whom the guideline will apply (patients, public etc.) are sought and he guideline development group takes these into consideration.
x
7. The intended users of the guideline are clearly defined.
x
Editorial independence
8. The views of the funding body have not influenced the content of the guideline. The funding body or source of funding is clearly described or there is an explicit statement of no funding.
x
9.Competing interests of guideline development group members are recorded and addressed with a clear description of the measures taken to minimise the influence of these interests on guideline development.
x
Rigour of development
9.Competing interests of guideline development group members are recorded and addressed with a clear description of the measures taken to minimise the influence of these interests on guideline development.
x
11. The criteria for selecting the evidence are clearly described with reasons for including and excluding evidence clearly stated.
x
12. The strengths and limitations of the body of evidence are clearly described with the methods or tools for assessing the quality of the evidence documented
x
13. The methods used for formulating the recommendations are clearly described
x
14. The health benefits, side effects, risks, cost effectiveness, resource implications and health service delivery issues have been considered in formulating the recommendations.
x
15. The recommendations have been graded for quality of evidence and strength of recommendation with an explicit link between the recommendations and supporting evidence.
x
16. The guideline has been externally reviewed prior to its publication. There is a clear description of the selection process for experienced and knowledgeable external reviewers and how the information gathered was x used by the guideline development group.
x
17. A procedure for updating the guideline is provided and includes an explicit time interval.
x
Clarity of 18. The recommendations are specific, clear and easily identifiable with the intent or purpose of
x

(13/10/2014 Final Version) Page 165
presentation the recommended action clearly outlined. 19. The different options for management of the condition or health issue are clearly presented with a description of the population or clinical situation most appropriate to each option.
x
20. Key recommendations are easily identifiable. x Applicability 21. The guideline describes facilitators and
barriers to its application. x
22. The guideline provides advice and/or tools on how the recommendations can be put into practice.
x
23. The potential budget impact and resource implications (equipment, staff, training etc.) of applying the recommendations have been considered.
x
24. The guideline presents monitoring and/or auditing criteria to assess adherence to recommendations and the impact of implementing the recommendations.
x

(13/10/2014 Final Version) Page 166
Overall Guideline Assessment
Overall Guideline Assessment 1
1 2 3 4 5 6 7
2 Y Yes, with modifications N Institute for Clinical Systems Improvement, Bloomington (MH). 2009. Rapid Response Team – Health Care Protocol
YES - Overall score = 6
x
Mid Essex Hospital Service. 2009. NHSGuideline for using Children’s Early Warning Tool (CEWT)
Overall score = 4 (not reported)
x
Central Manchester University Hospital. 2011. NHS Guideline for Manchester Children’s Early Warning Score(ManChEWS2) Policy
Overall score = 4 (not reported
x
Kettering General Hospital. 2011. PEWS (Paediatric Early Warning Score) guideline for paediatric patients
Overall score = 4 (not reported)
x
Worcestershire NHS Trust. 2011. Paediatric Early Warning Score Clinical Guideline
Overall score = 4 (not reported)
x
Royal Cornwell Hospitals NHS Trust. 2012. Policy for patient observationand monitoring in child health
Overall score = 4 (not reported)
x
University Hospital Bristol NHS Foundation Trust.2012. Clinical protocol for recording and acting upon physiological observations in paediatric in-patient areas.
Overall score = 4 (not reported)
x
East Cheshire NHS Trust. 2013.Procedure for assessing and measuring vital signs on paediatric patients and using the Paediatric Early Warning Score
Overall score = 4 (not reported)
x
Worcestershire NHS. 2013. Paediatric Monitoring and Observation Guideline
Overall score = 4 (not reported)
x
Tameside Hospital –NHS Trust. 2014. Paediatric Early Warning Scoring Policy
Overall score = 4 (not reported)
x
The Hillingdon Hospital Trust – NHS. 2014. Monitoring Newborn Babies At Risk of Neonatal Illness In The Maternity Unit
Overall score = 4 (not reported)
x

(13/10/2014 Final Version) Page 167
APPENDIX 19
Clinical Guideline Data Extraction
Guideline Scope and purpose
Stakeholder involvement
Development stage Recommendations
Institute for Clinical Systems Improvement, Bloomington (MH) Rapid Response Team – Health Care Protocol NOT SPECIFIC TO PEADIATRICS ONLY (rather a subset included)
To increase early intervention and stabilisation to prevent clinical deterioration of any individual prior to cardiopulmonary arrest or any life threatening event. Scope: Cardio-pulmonary arrest, other life threatening event, or any worrisome or acute clinical change for which a rapid response team maybe summoned.
6-12 member workgroup incl. nurses, physicians pharmacists and other unnamed healthcare professionals.
Completed Clinical highlights Special considerations RRT algorithm annotations
(process) Non-inpatients Definitions/qualifying
statements Implementation of guidelines
Mid Essex Hospital Service – NHS Trust Guideline for using Children’s Early Warning Tool (CEWT)
To provide a framework for the identification of patient deterioration at an early stage to allow proactive management and reduce the rate of emergency resuscitations and admissions to paediatric intensive care units (PICU).
NR Complete (Last review date March 2011)
Choice of System – Monaghan PEWS
Use of Children’s Early Warning Tool
Staff Training - All registered nurses, support staff, FY1 and FY2 medical staff trained
Infection Prevention - All staff to follow Trust guidelines on infection prevention using
Aseptic Non-Touch Technique (ANTT) when carrying out procedures
Audit and Monitoring - Ongoing audit of the CEWT system/ Key learning submitted to Organisational Learning
Group / follow-up staff training if required
Communication – approved guidelines emailed and in newsletter.
Central Manchester University Hospital
The aim of the Paediatric EWS is to
Consultant Paediatric Intensivist
Complete - December 2013 (ratified by Chair outside of DCEC)
Roles and Responsibilities Policy:
o Principles

(13/10/2014 Final Version) Page 168
Guideline Scope and purpose
Stakeholder involvement
Development stage Recommendations
Manchester Children’s Early Warning Score (ManChEWS2) Policy
enable nurses and medical staff to ensure appropriate care is provided in a timely manner.
Education Development Practitioner RMCH
Review Date: December 2015
o General Points o measurement of child
parameters o Frequency of
observations o Appropriate
intervention using the protocol
o Transfer of a child who is triggering amber or red on the early warning system.
Consultation, Approval and Ratification Process
Monitoring & Compliance
Standards and ‘KPI’s’ Kettering General Hospital PEWS (Paediatric Early Warning Score) guideline for paediatric patients
The purpose of this document is to ensure that the physiological ‘track and trigger’ system known as the PEWS is used within all acute paediatric wards/areas at Kettering General Hospital NHS Foundation Trust, in conjunction with other Policies that state when observations need to be recorded i.e. Blood Transfusion Policy. The PEWS is a system to identify at-risk patients, allowing rapid referral to appropriately skilled experts and appropriate medical intervention.
Director lead Consultant Paediatrician Ward Manager Ward Manager & Paediatric Assessment Unit Consultant Anaesthetist Consultant Paediatrician Lead Nurse Critical Care Outreach Team
Complete – Date ratified: April 2011 Review Date: Jan 2014
An early warning scoring system should be in place to identify patients who are critically ill and therefore at risk of cardiopulmonary arrest.
Physiological observations should be recorded and acted upon by staff that have been trained to undertake these procedures and understand their clinical relevance.
Physiological observations should be monitored at least every 12 hours, unless a decision has been made at a senior level to increase or this frequency for an individual patient.
The frequency of monitoring should increase if abnormal physiology is detected, as outlined in the recommendation on graded response strategy.
A graded response strategy for patients identified as being at risk of clinical deterioration should be agreed and delivered locally.
Worcestershire NHS Trust Paediatric
PEWS to enable health care professionals
Senior Resuscitation Officer
Complete (Review date: February 2013)
Use of Paediatric Early Warning Score
Audit of use of guideline. Dissemination of guideline and

(13/10/2014 Final Version) Page 169
Guideline Scope and purpose
Stakeholder involvement
Development stage Recommendations
Early Warning Score Clinical Guideline
to recognise “at risk” children and to trigger early referral to medical staff, so that early intervention can help to prevent deterioration
archiving of previous guideline. All healthcare professionals must exercise their own professional judgement when using guidelines. However any decision to vary from the guideline should be documented in the patient records to include the reason for variance and the subsequent action taken.
Royal Cornwell Hospitals NHS Trust Policy for patient observation and monitoring in child health
To give all staff guidance in the observation and monitoring of children in Child Health. It is the policy of Royal Cornwall Hospitals NHS Trust that all children admitted to this hospital receive an appropriate level and type of observation and monitoring
NR To be reviewed in June 2015 and discussed at the Paediatric Practice Development Group.
Ownership and Responsibilities Standards and Practice incl
Training; Clinical Practice Guideline Patient Assessment and Monitoring; Liability.
Dissemination and Implementation
Monitoring compliance and effectiveness
Equality and Diversity
University Hospital Bristol NHS Foundation Trust. Clinical protocol for recording and acting upon physiological observations in paediatric in-patient areas.
To set the standard for the recording and reporting of observations for all paediatric in-patients.
Matrons / Clinical Leads / Ward Sister / Charge Nurse / Consultants / All Staff
May 2014 (Review May 2016)
Standard for physiological observations
Specific responsibilities with regards physiological observations
Paediatric Early Warning Score (PEWS)
PEWS and Graded Response Strategy
Communication Process Exclusion to standard
physiological observations Documentation Children discharged from
PICU/PHDU Process Transferring the acutely ill child Communication/ Dissemination
of guidelines Implementation of protocol Process for Monitoring
Compliance and Effectiveness Standards / Key Performance
Indicators East Cheshire NHS Trust
To provide clear &
Clinical Lead - Children’s
February 2013. Review date: January
Implementation

(13/10/2014 Final Version) Page 170
Guideline Scope and purpose
Stakeholder involvement
Development stage Recommendations
Procedure for assessing and measuring vital signs on paediatric patients and using the Paediatric Early Warning Score
structured guidance to all staff on completing clinical observations and using the Paediatric Early Warning Score System. Aim is to enable safe & appropriate use of the system for prompt detection of a clinical deterioration of sick children on the Children’s ward, Children’s observation and assessment ward and in A&E.
Associate Director Paediatricians, Children’s Nurses, Associate Director W&CBU, Children’s service manager
2016 Temperature Measurement Blood Pressure Measurement Early Warning Score Children Receiving Oxygen Children with a Head Injury Observation and monitoring of
fluid balance Capillary Refill time Level of Consciousness Post- Operative Care Pain assessment Children in A&E Staff education and training Audit Key Performance Indicators
Worcestershire NHS Trust Paediatric Monitoring and Observation Guideline
Guideline for monitoring and observation of children and young people
(Sister- Riverbank) (Sister and HDU lead – Ward 1) (Sister and Pain Management Lead - Riverbank )
Complete (This guideline should not be used after end of: 11 June 2015) Yearly audit of observation and fluid balance records.
Monitoring and Observation PEWS Escalation of concerns – SBAR
HDU (High Dependency) Care Transfer Pain Management This guidance does not override the individual responsibility of health professionals to make appropriate decision according to the circumstances of the individual patient in consultation with the patient and /or carer. Health care professionals must be prepared to justify any deviation from this guidance.
Tameside Hospital –NHS Trust Paediatric Early Warning Scoring Policy
To describe the PEWS tool which has been developed and implemented as a result of research which indicates that the clinical risk to infants and
Paediatric Sister for Children’s Services; Paediatric Consultant; member of the Risk Management team
Complete (reviewed December 2013)
Roles/Responsibilities/Accountability
PEWS procedure Implementation Monitoring Review

(13/10/2014 Final Version) Page 171
Guideline Scope and purpose
Stakeholder involvement
Development stage Recommendations
children is reduced by early intervention, and that the PEWS system enables the early identification of signs of deterioration and initiating appropriate responses and management from the medical team. The policy applies to all infants and children who require acute medical assessment in any clinical areas within the Tameside trust.
The Hillingdon Hospital Trust – NHS Monitoring Newborn Babies At Risk of Neonatal Illness In The Maternity Unit
To raise awareness amongst clinical staff and parents of symptoms and signs that could highlight cause for concern in a newborn baby and steps that could be taken to manage these.
Consultant Paediatricians
In Progress: REVIEW DATE: May 2017
Applicable Standards of Care and Practice to be followed.
Immediate Treatment & Subsequent Management.
How guideline will be implemented
How necessary training will be provided
Associated guidelines, polices and documents
Audit Standards Monitoring

(13/10/2014 Final Version) Page 172
APPENDIX 20
Data Extraction
Detection systems for identification of child clinical deterioration

(13/10/2014 Final Version) Page 173
Data Extraction – Detection systems for identification of child clinical deterioration
Author; Date; Country; Title
Purpose Design Settings/Participants PEWS Tool Clinical Data Collection Method/Analysis
Outcomes/Results
Akre et al. (2010) USA Sensitivity of the Pediatric Early Warning Score to Identify Patient Deterioration
Primary objective To evaluate the sensitivity of PEWS for a group of patients who had a documented RRT or code blue event, as well as, the lead time for earliest and latest critical PEWS before the event. Hypothesis At least 80% of patients would have a critical PEWS, defined as a score of >=4 or a domain score of 3, before the event. Secondary objective To examine staff awareness of deterioration in patient status before the event and to determine whether use of PEWS would have
Retrospective chart review
Children’s Hospitals and Clinics of Minnesota (Children’s) – 325 bed facility located at 2 urban sites in cities Minneapolis and St Paul 170 RRT calls and 16 code blue events occurred for n=186 unique patients between Oct2006-Feb2008 All events occurred on medical surgical units excluding ICU and ICU step-down units. Age: 0 –252 months Median age 25.5 months
Adapted PEWS used by Monaghan PEWS - 3 domains of behaviour, respiratory, and cardiovascular Scores in each domain range from 0 to 3 points. 2 points added for nebulizations that are continuous or every 15 minutes & 2 points for persistent postoperative vomiting. Total score ranges from 0 to 13 Defined a critical PEWS as a score >=4 or a domain score of 3 RRT – at Children’s, employees, patients, parents, and families may unconditionally request urgent medical assistance (RRT) for a patient who is perceived to be in distress without advance consultation with house staff or patient’s attending physicians.
PEWS were calculated retrospectively for 24 hours before the event (RRT call, code blue event) at intervals of at least 4 hours for each of the identified patients. This is consistent with assessment frequencies for nurses on these units. When assessment charting was more frequent than 4 hours, additional PEWS were calculated. Behavioural scoring required the actual use of the words shown in such as playing, sleeping, and/or irritable. During waking shifts, this would not be customary documentation. When these words were not documented, the item was scored as missing. When data were not available for a specific domain, it was marked as missing. To ensure consistency, a single “expert” performed all scoring. Staff awareness measured by key indicators of (1) consultation with another nurse, physician, or respiratory therapist; (2) the addition of monitoring equipment; and/or (3) increased frequency of patient assessment. During the 24-hour pre-event period, collected data on increased frequency of nursing assessment and the addition of equipment, including pulse oximetry and cardiac monitoring. Consultations by another nurse, physician, or respiratory therapist were also collected An exhaustive review of multiple documentation
Demographics Median age of subjects was 25.5 months ranging from 0 –252 months. Gender was 60% male and 40% female. Races included 55.9% white, 17.2% Black/African American, 7.5% Asian, and 7% Hispanic/Latino. Only 23.1% of patients were surgical. Forty-six percent of patients received care from the APRDRG respiratory service line followed by infectious disease (9.6%), cancer care (4.8%), cardiac care (4.2%) and digestive disease (3.2%). The remainder of patients received their care from a variety of APRDRG service lines Sensitivity defined as percentage of patients who had a critical PEWS before the RRT or code event. Sensitivity of PEWS 85.5% Median time from first critical PEWS to RRT or code event was 696 minutes (11 hours, 36 minutes) and the latest critical score was 30 minutes for 159 (85.5%) of 186 patients in this study. 73.1% of patients had a critical PEWS just before the RRT or code event Median time from a critical PEWS just before the event was 30 minutes. Consistent with paediatric patterns of compensation, critical respiratory domain scores (score of 3) were the earliest to precede the critical event at 21 hours, 8 minutes for 51.6% of patients. Consultations and added monitoring A total of 181 (97.3%) of 186 patients received at least 1 consultation from a variety of providers, including physicians, nurses, and respiratory therapists.

(13/10/2014 Final Version) Page 174
Author; Date; Country; Title
Purpose Design Settings/Participants PEWS Tool Clinical Data Collection Method/Analysis
Outcomes/Results
provided significantly earlier recognition
elements such as nursing flow sheets, nursing narrative notes, physician progress notes, and physician orders was used to retrieve data elements.
For first consultations, 159 (87.8%) included a medical doctor. The median time from the first consultation before the event was 80 minutes. >98% of study patients had pulse oximetry monitoring initiated before the RRT or code blue event. This is used instead of cardiac monitoring for patients who are outside the ICU, and nurses can independently initiate it. A total of 81 (43.5%) patients had monitoring added during the 24-hour pre-event period. The median time of the first addition of a monitor before the event was 6 hours, 54 minutes. This additional monitoring was interpreted as evidence of some staff awareness of change in patient condition. Evidence of documented increased frequency of nursing assessment was rare at 7%. Evaluated a subgroup of 72 patients who shared 3 common findings: (1) critical PEWS; (2) clinician consultation; and (3) addition of a monitor. When all median times to the event were compared, they were significantly different (P <.001). The median time to first consultation was 73 minutes, which was significantly less than first critical PEWS at 602 minutes (10 hours, 2 minutes; P <.001). The median time for addition of a monitor was 406 minutes (6 hours, 46 minutes), similar to critical PEWS (P = .42). RRT intervention and subsequent placement in PICU Nearly 91% of patients who experienced an RRT event received a significant medical intervention: 37.1% received oxygen, 27.1% received nebulization, 21.1% received oral/nasal/ pharynx suctioning, 17.6% received cardiac monitoring, and 21.1%

(13/10/2014 Final Version) Page 175
Author; Date; Country; Title
Purpose Design Settings/Participants PEWS Tool Clinical Data Collection Method/Analysis
Outcomes/Results
received arterial blood gas/venous blood gas. A total of 40 (23.5%) patients who experienced an RRT event were moved to the PICU. Code blue 9 of 16 patients who experienced a code blue event and also had a critical PEWS, the median time from the earliest critical PEWS to the critical event was 6 hours, 45 minutes and the latest was 55 minutes. The remaining 7 patients did not have a critical PEWS. Eight patients had addition of an oximeter at a median time of 7 hours, 20 minutes, and 3 patients had no interruption of oximetry monitoring during the 24 hours before the critical event. For all patients who experienced a code blue event, significant comorbidity existed. Six of the 16 experienced prolonged seizure with hypoxia, 2 had cardiopulmonary arrests, and 2 had equipment failure related to trach-ventilator dependence. The remaining patients had sudden respiratory failure as a result of an acute event that included apnoea, aspiration, and airway occlusion with cough. Twelve of the 16 patients who experienced a code blue event were transferred to a higher level of care, 3 remained on their unit, and 1 was unresponsive to resuscitation efforts and died.
Bell et al. (2013) Texas USA The Texas Children’s Hospital
To examine the psychometric properties of the Texas Children's Hospital Pediatric Advanced Warning Score
A retrospective chart review Does not compare the psychometrics of TCH PAWS to psychometrics
Setting: Texas Children’s Hospital, Houston, TX n =150 infants & children 50 infant & child charts were randomly selected from each unit for a total
Texas Children’s Hospital Paediatric Advanced Warning Score (TCH PAWS) Modification of PEWS (Tucker at al. 2009; originally Monaghan) by multidisciplinary clinical team; primary modifications
Chart review - a specific PAWS data collection tool was designed Reliability analysis used to examine psychometric properties of TCH PAWS. Internal consistency of TCH PAWS scores measured using Cronbach’s alpha coefficient
Results: Cronbach’s alpha reliability co-efficient for TCH PAWS score at final measurement was 0.75, indicating adequate reliability of the instrument. An increasing TCH PAWS score of ≥ 5 resulted in calls to RRT 80% of the time. Total of 5 infants & children in acute care
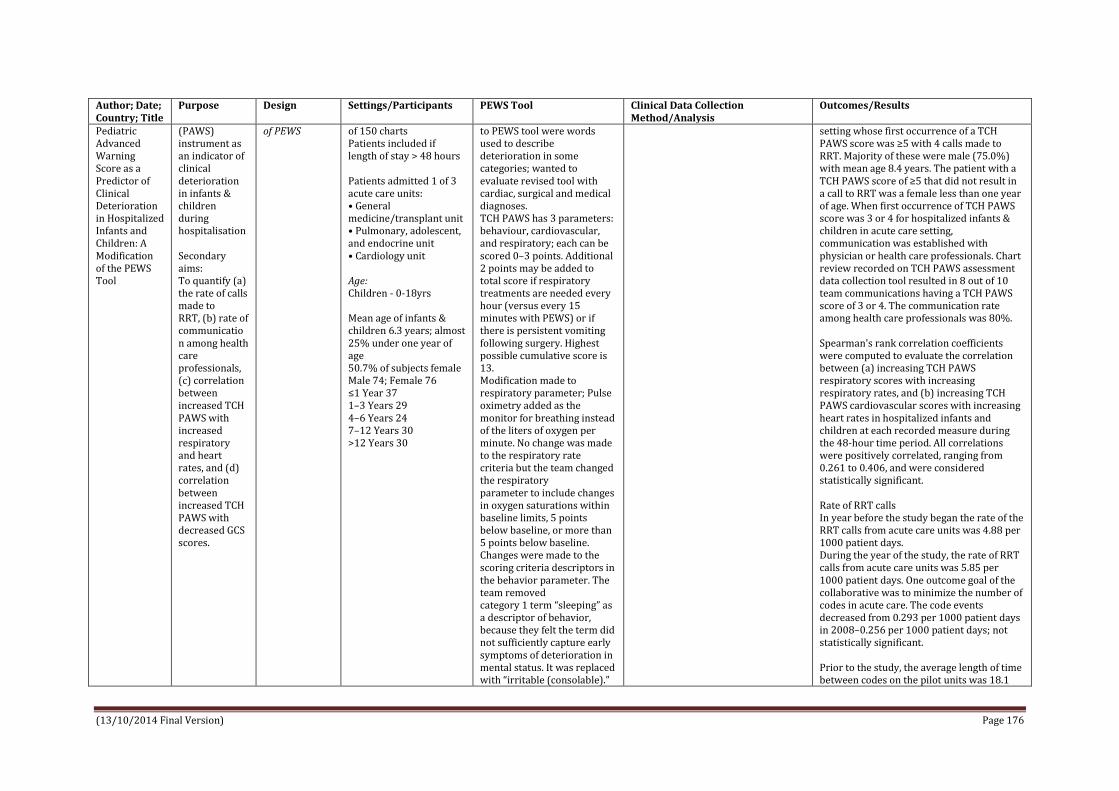
(13/10/2014 Final Version) Page 176
Author; Date; Country; Title
Purpose Design Settings/Participants PEWS Tool Clinical Data Collection Method/Analysis
Outcomes/Results
Pediatric Advanced Warning Score as a Predictor of Clinical Deterioration in Hospitalized Infants and Children: A Modification of the PEWS Tool
(PAWS) instrument as an indicator of clinical deterioration in infants & children during hospitalisation Secondary aims: To quantify (a) the rate of calls made to RRT, (b) rate of communication among health care professionals, (c) correlation between increased TCH PAWS with increased respiratory and heart rates, and (d) correlation between increased TCH PAWS with decreased GCS scores.
of PEWS of 150 charts Patients included if length of stay > 48 hours Patients admitted 1 of 3 acute care units: • General medicine/transplant unit • Pulmonary, adolescent, and endocrine unit • Cardiology unit Age: Children - 0-18yrs Mean age of infants & children 6.3 years; almost 25% under one year of age 50.7% of subjects female Male 74; Female 76 ≤1 Year 37 1–3 Years 29 4–6 Years 24 7–12 Years 30 >12 Years 30
to PEWS tool were words used to describe deterioration in some categories; wanted to evaluate revised tool with cardiac, surgical and medical diagnoses. TCH PAWS has 3 parameters: behaviour, cardiovascular, and respiratory; each can be scored 0–3 points. Additional 2 points may be added to total score if respiratory treatments are needed every hour (versus every 15 minutes with PEWS) or if there is persistent vomiting following surgery. Highest possible cumulative score is 13. Modification made to respiratory parameter; Pulse oximetry added as the monitor for breathing instead of the liters of oxygen per minute. No change was made to the respiratory rate criteria but the team changed the respiratory parameter to include changes in oxygen saturations within baseline limits, 5 points below baseline, or more than 5 points below baseline. Changes were made to the scoring criteria descriptors in the behavior parameter. The team removed category 1 term “sleeping” as a descriptor of behavior, because they felt the term did not sufficiently capture early symptoms of deterioration in mental status. It was replaced with “irritable (consolable).”
setting whose first occurrence of a TCH PAWS score was ≥5 with 4 calls made to RRT. Majority of these were male (75.0%) with mean age 8.4 years. The patient with a TCH PAWS score of ≥5 that did not result in a call to RRT was a female less than one year of age. When first occurrence of TCH PAWS score was 3 or 4 for hospitalized infants & children in acute care setting, communication was established with physician or health care professionals. Chart review recorded on TCH PAWS assessment data collection tool resulted in 8 out of 10 team communications having a TCH PAWS score of 3 or 4. The communication rate among health care professionals was 80%. Spearman's rank correlation coefficients were computed to evaluate the correlation between (a) increasing TCH PAWS respiratory scores with increasing respiratory rates, and (b) increasing TCH PAWS cardiovascular scores with increasing heart rates in hospitalized infants and children at each recorded measure during the 48-hour time period. All correlations were positively correlated, ranging from 0.261 to 0.406, and were considered statistically significant. Rate of RRT calls In year before the study began the rate of the RRT calls from acute care units was 4.88 per 1000 patient days. During the year of the study, the rate of RRT calls from acute care units was 5.85 per 1000 patient days. One outcome goal of the collaborative was to minimize the number of codes in acute care. The code events decreased from 0.293 per 1000 patient days in 2008–0.256 per 1000 patient days; not statistically significant. Prior to the study, the average length of time between codes on the pilot units was 18.1

(13/10/2014 Final Version) Page 177
Author; Date; Country; Title
Purpose Design Settings/Participants PEWS Tool Clinical Data Collection Method/Analysis
Outcomes/Results
Category 2 was changed to “irritable (inconsolable).” The consensus among the team members was that irritable (consolable) behavior usually precedes irritable (inconsolable) behavior and are better descriptors of the observed behavior seen during deterioration. Category 3 descriptors remained “lethargic/ confused.” The “reduced response to pain” descriptor in category 3 was removed because it was considered a late sign of progression toward clinical deterioration. Diaphoresis was added to the cardiovascular parameter in category 2 as an early warning symptom for deterioration (heart failure). This addition to the cardiovascular parameter was made to accommodate deterioration in large population of cardiac patients. The TCH PAWS tool considers the patients’ physiological parameters and baseline vital signs, and recommends trending at the time of scoring. Algorithm presented in paper. Healthcare team utilizes the algorithm to provide care by recommending more frequent assessments, medical interventions, or initiating a call to the RRT or
days. The target goal of the acute care units was to double the number of days between codes, making the target number 36 days. The acute units exceeded their goal by achieving 258 days between codes during the study period. Communication: The TCH PAWS tool is also used when a RRT is initiated and is part of the Situation Background Assessment Recommendation (SBAR) communication from bedside nurse to RRT nurse.

(13/10/2014 Final Version) Page 178
Author; Date; Country; Title
Purpose Design Settings/Participants PEWS Tool Clinical Data Collection Method/Analysis
Outcomes/Results
code team. If a score of 3 (in any one category) or a total score of 4 or higher is reached, the algorithm suggests considering a RRT call. The algorithm was modified to capture escalation of concern from the intern to the senior resident at a score of 5 or higher. In addition, a code can be activated at a score of 6 or higher. The team felt waiting for a score of 7 or higher would only delay getting help to the bedside. The word, ‘consider’, was used throughout the algorithm as the team felt the healthcare provider should use the tool in combination with good clinical judgment. Education: PAWS education provided to all acute care unit nurses and physicians prior to data collection. One hour presentation of content and interactive discussion of various patient scenarios. Also stressed was the concept that a RRT or code could be initiated at any time based on the healthcare teams' assessment, regardless of TCH PAWS score.
Duncan et al. (2006) Princess of Wales Children’s
To develop a simple bedside score to pre-emptively identify
Retrospective validation of the performance of PEWS score - evaluated with
Setting: Hospital for Sick Children, Toronto, Ontario Age:
Pediatric Early Warning System (PEWS) score developed using expert opinion (2 focus groups - acute care nurses) synthesized by a modified
Clinical data abstracted as directed by the focus groups – documented vital signs, clinical findings & assessment times recorded. Case patients: data collection began 25 hours prior code blue call.
Outcomes: Code blue - require resuscitation to treat actual or impending cardiopulmonary arrest Results:

(13/10/2014 Final Version) Page 179
Author; Date; Country; Title
Purpose Design Settings/Participants PEWS Tool Clinical Data Collection Method/Analysis
Outcomes/Results
Hospital, Birmingham The pediatric early warning system score: A severity of illness score to predict urgent medical need in hospitalized children
children who require resuscitation to treat actual or impending cardiopulmonary arrest
a frequency matched case-control design – in a Canadian University affiliated paediatric hospital
Children 0-18yrs old admitted to ward with no level of care restriction Case patients: (n=87) had code blue calls made as part of care – assessed to require additional or immediate assistance for treatment of impending or actual CPA. Control patients: (n=128) had no code blue event and were not admitted to the ICU within 48 hours of study period studied. Focus groups: 10 nurses
Delphi method. Originally developed score contained 20 items. Items required 75% majority to be excluded or included, or were included after 3 rounds of inconclusive voting. Measurements: Heart rate, Respiratory rate, Respiratory effort, Temperature, Systolic blood pressure, Diastolic blood pressure, O2 saturation, Level of Consciousness, Pupils, Central venous Pressure, Urine output, Perfusion, Colour, pulses, Behaviour, Laboratory Values, Therapy, Fluid bolus, oxygen therapy.
Parameters: Dynamic ( heart rate, blood pressure, respiratory rate); Static ( previous ICU admission, Postoperative); Staff (nurse/patient ratio).
Control patients: data collected for 24 hours beginning at first 1:00 am of either hospitalization or after ICU discharge. Missing data assumed as normal Maximum score determined for each child from the 24 hours ending 1 hour before code blue call in case patients and for specified 24-hour period for control patients PEWS score evaluated by 2 methods. 1: Score ability to discriminate between case and control patients tested in the entire sample & within each age category. 2: changes in score over time were evaluated. Case patients: scores from 24 to12 hours, 12 to 6 hours, 6 to 2 hours, and in 1 hour ending 60 minutes before the code blue event were compared. Control patients: scores compared, 24-12, 12-6, and 6-2 hours & in last hour, ending at the completion of the 24 hours of clinical data collected (1:00 am).
During the study period, 99 (0.31%) of the 32,233 children admitted to our hospital had code blue events. Complete clinical data were obtained from 87 (87%) of these sick children and from 128 (16%) of the 782 children that were identified as potential controls. Four of the dynamic items (urine output, perfusion, pulses, and level of consciousness) could not be reliably abstracted and were not analyzed. PEWS score area under the receiver operating characteristic curve was 0.90; sensitivity 78%; specificity 95% at a threshold score of 5. Final PEWS score included 16 items (9 static / 7 dynamic). Range from 0 to 26 The score was greater in case patients than control patients (mean maximum score, 7.9 vs 3.2; P b .0001) & within each age category. Score could discriminate between cases and controls, both overall & within each age category (area under the ROC curve, 0.83-1.0). The PEWS score identifies patients with at least a 1-hour warning before code blue event.
Edwards et al. (2009) Swansea, UK Prospective cohort study to test the predictability of the Cardiff and Vale paediatric early warning
To develop & evaluate predictability of a PEWS (C&VPEWS) to identify children at risk of developing critical illness
Prospective cohort study
Setting: All admissions to any of the paediatric wards at University Hospital of Wales University Hospital of Wales is a tertiary centre for paediatric care (50 medical, 34 surgical, 16 oncology, 7 PICU, 4 PHDU, 4 cardiac & 4 renal
Development of C&VPEWS Cardiff &Vale PEWS (C&VPEWS) Expert group (general paediatricians, regional nurse educator, paediatric intensivist) used APLS physiological parameters as starting point to develop the tool alongside reviewing other EWS to modify the age-related normal ranges and identify other parameters for
New paediatric observation chart developed to incorporate all criteria in C&VPEWS Nursing staff trained in use of new observation chart before introduction Nursing staff, while performing routine duties, recorded observations on new paediatric observation chart New charts completed for all admissions over 12 months
Outcomes: Respiratory arrest, cardiac arrest, PHDU admission, PICU admission and death. Findings: 16 children had adverse outcome, 13 were admitted from ward to PHDU (4 of these subsequently transferred from PHDU to PICU) and 3 admitted from ward to PICU. There were no deaths, cardiac arrests, or respiratory arrests. 3 of 16 children (18.8%) had no abnormal observations before the adverse outcomes.

(13/10/2014 Final Version) Page 180
Author; Date; Country; Title
Purpose Design Settings/Participants PEWS Tool Clinical Data Collection Method/Analysis
Outcomes/Results
system bed) Age: All paediatric admissions aged 0–16 years. n=1000 patients, 9075 sets of observations performed Patients admitted directly to PICU & PHDU; & those presenting in cardiac or respiratory arrest excluded. Age usage: <1; 1-2; 2-5; 5-12; >12
inclusion in the score. Expert group agreed 8 parameters and their trigger criteria; airway threat; oxygen required to keep saturations greater than 90%; respiratory rate; respiratory observation; heart rate; blood pressure; level of consciousness and nurse or doctor worried about clinical state. Some criteria were age dependent (i.e. RR, HR, BP). Each parameter scored 0 if normal and 1 if abnormal (overall score between 0-8) Triggers/calling criteria not identified
Frequency of observations determined by clinical care policy; not altered for study Data collated by research nurse & entered into a database for analysis. Missing criteria assumed as normal
810 of 984 children (82.3%) who did not have adverse outcome had at least one abnormal observation during admission If functioning as a single parameter (i.e. C&VPEWS triggered by a single abnormal criterion in a set of obs.) it had 89.0% sensitivity, 63.9% specificity, 2.2% PPV, 99.8% NPV for identifying children who subsequently had an adverse outcome. Area under ROC was 0.86 Tool is sensitive but not specific - if C&VPEWS was used as a trigger to activate a RRT to assess the child the majority of calls would be unnecessary (most activations false positives with a very low PPV) As a multiple parameter trigger score - C&VPEWS score cut-off that maximises the sum of sensitivity & specificity was derived from the ROC analysis - cut-off was 2 giving sensitivity 69.5%; specificity of 89.9% ; PPV 5.9%; NPV 99.7% The main issue revealed by our study to examine the predictability of the C&VPEWS was the low PPV of the trigger criteria and the large number of false positive triggers. Most patients (823/1000) had one or more abnormal C&VPEWS criteria at some time during their admission
Edwards et al. (2011) Swansea, UK Cohort study to test the predictability of the Melbourne criteria for activation of the medical emergency
To use data from Cardiff & Vale PEWS to test the predictability of the Melbourne criteria for activation of the medical emergency team (MET) as described by Tibballs &
Cohort study Focus on performance characteristics of the ‘activation criteria’ of PEWS
Setting: Paediatric patients admitted to all paediatric wards at the University Hospital of Wales (tertiary centre for paediatric care). Age: Paediatric (age 0–16 years) Mean age 44 months Patients admitted
Melbourne criteria for activation (MAC) of a Medical Emergency Team (MET) (adapted from Tibballs & Kinney 2009) 9 MAC Indicators – nurse or doctor worried about clinical state of patient; airway threat; hypoxaemia; severe respiratory distress, apnoea or cyanosis; tachypnoea; tachycardia or bradycardia; hypotension; acute change in
Method of data collection is described in Edward et al. (2005) (above) Data available from original study (Edwards et al. 2009) to provide a measure of all 9 Melbourne Activation Criteria (MAC) required to trigger MET. Identical measurements available for 6 of 9 MAC: pre-existing diagnosis of cyanotic heart disease not collected so hypoxaemia was positive for all patients if O2Sats less than 90% in air or any amount of oxygen; severe respiratory distress, apnoea or
Outcome measures: Paediatric high dependency unit admission, paediatric intensive care unit admission; death. Results: 16 children had adverse outcome, 13 admitted from ward to HDU (4 of these subsequently transferred from HDU to PICU) & 3 admitted from the ward to PICU. There were no deaths. 7 of the 16 children (43.8%) would not have transgressed MAC prior to adverse outcomes. 469 of 984 children (47.7%) who
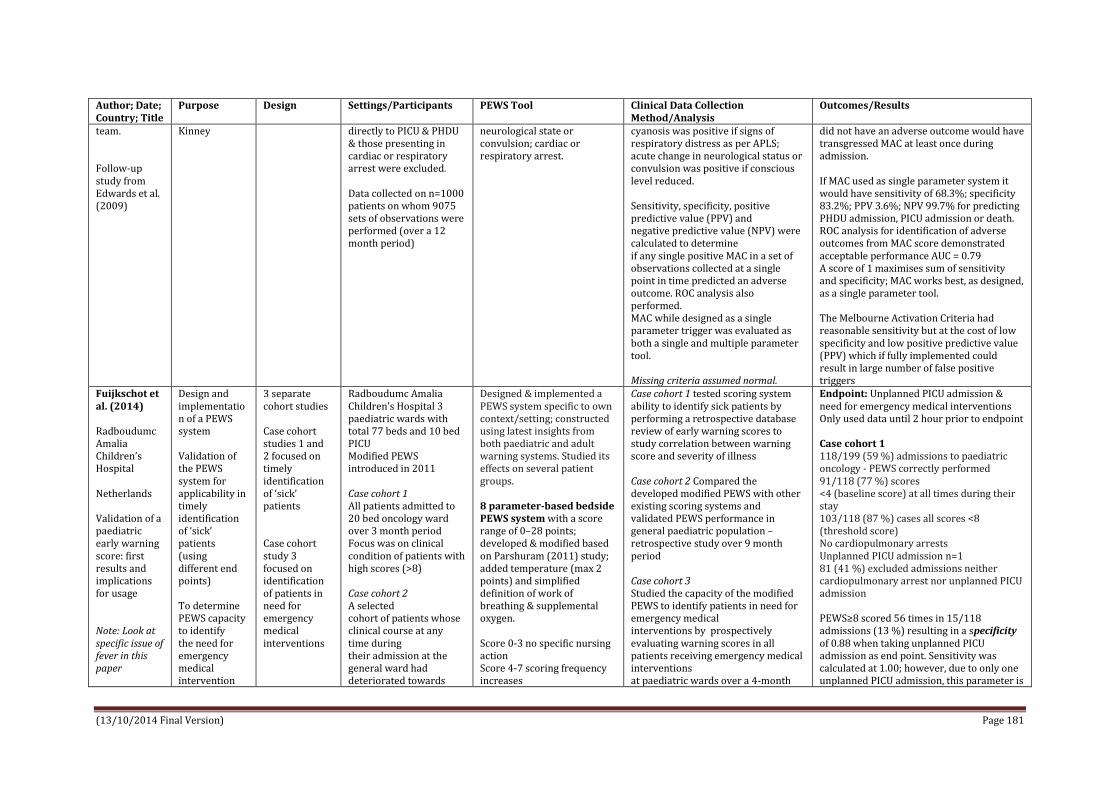
(13/10/2014 Final Version) Page 181
Author; Date; Country; Title
Purpose Design Settings/Participants PEWS Tool Clinical Data Collection Method/Analysis
Outcomes/Results
team. Follow-up study from Edwards et al. (2009)
Kinney
directly to PICU & PHDU & those presenting in cardiac or respiratory arrest were excluded. Data collected on n=1000 patients on whom 9075 sets of observations were performed (over a 12 month period)
neurological state or convulsion; cardiac or respiratory arrest.
cyanosis was positive if signs of respiratory distress as per APLS; acute change in neurological status or convulsion was positive if conscious level reduced. Sensitivity, specificity, positive predictive value (PPV) and negative predictive value (NPV) were calculated to determine if any single positive MAC in a set of observations collected at a single point in time predicted an adverse outcome. ROC analysis also performed. MAC while designed as a single parameter trigger was evaluated as both a single and multiple parameter tool. Missing criteria assumed normal.
did not have an adverse outcome would have transgressed MAC at least once during admission. If MAC used as single parameter system it would have sensitivity of 68.3%; specificity 83.2%; PPV 3.6%; NPV 99.7% for predicting PHDU admission, PICU admission or death. ROC analysis for identification of adverse outcomes from MAC score demonstrated acceptable performance AUC = 0.79 A score of 1 maximises sum of sensitivity and specificity; MAC works best, as designed, as a single parameter tool. The Melbourne Activation Criteria had reasonable sensitivity but at the cost of low specificity and low positive predictive value (PPV) which if fully implemented could result in large number of false positive triggers
Fuijkschot et al. (2014) Radboudumc Amalia Children’s Hospital Netherlands Validation of a paediatric early warning score: first results and implications for usage Note: Look at specific issue of fever in this paper
Design and implementation of a PEWS system Validation of the PEWS system for applicability in timely identification of ‘sick’ patients (using different end points) To determine PEWS capacity to identify the need for emergency medical intervention
3 separate cohort studies Case cohort studies 1 and 2 focused on timely identification of ‘sick’ patients Case cohort study 3 focused on identification of patients in need for emergency medical interventions
Radboudumc Amalia Children’s Hospital 3 paediatric wards with total 77 beds and 10 bed PICU Modified PEWS introduced in 2011 Case cohort 1 All patients admitted to 20 bed oncology ward over 3 month period Focus was on clinical condition of patients with high scores (>8) Case cohort 2 A selected cohort of patients whose clinical course at any time during their admission at the general ward had deteriorated towards
Designed & implemented a PEWS system specific to own context/setting; constructed using latest insights from both paediatric and adult warning systems. Studied its effects on several patient groups. 8 parameter-based bedside PEWS system with a score range of 0–28 points; developed & modified based on Parshuram (2011) study; added temperature (max 2 points) and simplified definition of work of breathing & supplemental oxygen. Score 0-3 no specific nursing action Score 4-7 scoring frequency increases
Case cohort 1 tested scoring system ability to identify sick patients by performing a retrospective database review of early warning scores to study correlation between warning score and severity of illness Case cohort 2 Compared the developed modified PEWS with other existing scoring systems and validated PEWS performance in general paediatric population – retrospective study over 9 month period Case cohort 3 Studied the capacity of the modified PEWS to identify patients in need for emergency medical interventions by prospectively evaluating warning scores in all patients receiving emergency medical interventions at paediatric wards over a 4-month
Endpoint: Unplanned PICU admission & need for emergency medical interventions Only used data until 2 hour prior to endpoint Case cohort 1 118/199 (59 %) admissions to paediatric oncology - PEWS correctly performed 91/118 (77 %) scores <4 (baseline score) at all times during their stay 103/118 (87 %) cases all scores <8 (threshold score) No cardiopulmonary arrests Unplanned PICU admission n=1 81 (41 %) excluded admissions neither cardiopulmonary arrest nor unplanned PICU admission PEWS≥8 scored 56 times in 15/118 admissions (13 %) resulting in a specificity of 0.88 when taking unplanned PICU admission as end point. Sensitivity was calculated at 1.00; however, due to only one unplanned PICU admission, this parameter is

(13/10/2014 Final Version) Page 182
Author; Date; Country; Title
Purpose Design Settings/Participants PEWS Tool Clinical Data Collection Method/Analysis
Outcomes/Results
the commonly used end points ‘cardiopulmonary arrest’ and ‘unplanned PICU admission’ Case cohort 3 All ‘sick’ patients defined as; clinical condition considered sick by the senior member of medical staff and documented as such; critical care-type intervention performed and any involvement of paediatric intensive care staff including cardiopulmonary arrest Patient characteristics All (n=24) < 3months (n=6) 3 months - < 1 year (n=5) 1years-< 4 years (n=5) 4 years - < 12 years (n=3) >=12 years (n=5) Male (n=11) Female (n=13)
Score > 7 contact medical team Threshold point of 7 based on Parshuram’s study - to identify children at risk of cardiopulmonary arrest; corresponding sensitivity 0.64 and specificity 0.91) and the addition of an extra parameter (body temperature) to the scoring system Separate card for each age category 0-3months 3months-1year 1-4years 4-12years >=12years
period. not reliable. 41/56 scores clinical condition of patient ‘sick’, resulted in 15 (27 %) false-positive scores (‘well’ patients with PEWS ≥8) and a positive predictive value of 0.73. The clinical condition in the false-positive patients was dominated by PEWS-influencing factors such as pain (n=6), fever (n=1) or a combination of both (n=8) Case cohort 2 No cardiopulmonary arrests occurred Out of 36 patients who had unplanned admission to PICU 24 had sufficient data to retrospectively reconstruct the course of the PEWS in the hours prior to their PICU admission. Out of 24 patients, 16 scored PEWS of ≥8 at 2–6 h prior to PICU admission. The overall median PEWS 2–6 h prior to PICU admission was 8.5 (range 2–15). The sensitivity of PEWS in identifying patients 2–6 h prior to unplanned PICU admission (threshold score ≥8) was calculated at 0.67. At time of their admission to PICU, all of included patients scored PEWS ≥8, indicating a further increase of sensitivity in remaining time prior to reaching end point. Case cohort 3 17 cases received emergency medical interventions Median PEWS of 10 (range 8–15) in these patients at the time of the intervention With a threshold score of 8, no falsely negative warning scores detected in this study, indicating a high sensitivity in identifying these patients
Haines et al. (2006) Bristol Royal
To develop and evaluate a clinical & physiologically
Prospective observational design
Setting: Bristol Royal Hospital for Children (BRHC) In-patient wards
Bristol PEWS The pilot Bristol tool based on invalidated tool developed at Derriford Hospital,
Patient documentation - observation charts & nursing/medical notes Pilot PEW tool not shown to staff.
Outcomes: escalating levels of care 1. Remained on ward without a problem 2.Required enhanced level of care (a) additional monitoring on the ward (b)

(13/10/2014 Final Version) Page 183
Author; Date; Country; Title
Purpose Design Settings/Participants PEWS Tool Clinical Data Collection Method/Analysis
Outcomes/Results
Hospital for Children UK Promoting care for acutely ill children – development and evaluation of a Paediatric Early Warning Tool
based tool for the identification of acutely ill children in hospital ward areas.
(excludes A&E) Convenient sample of children admitted to BRHC during 6-month time period of the study Case Children (n = 360) who triggered tool over a 6-month period 2/3rds under age of 5 years Baby <1year 46% Preschool 1-5years 20% School 5-12years 23% Adolescent >12years 11% Related to all medical specialities Control (n = 180) on each day of data collection 5 random bed space numbers were generated by an Excel programme as a control sample.
Plymouth, UK with modifications from criteria developed at Melbourne Children’s Hospital, Australia, and similar adult systems. Modifications made by expert opinion of investigating team incl. research nurse, two supervisors, PICU Intensivist and PICU Consultant Nurse. Rationale for deciding if criteria remained in modified PEW tool was achieved by reviewing it against patient outcome. If individual criteria showed greater than 50% of the patients requiring additional monitoring or above then this was evidence of an ‘enhanced level of care’. The patient outcomes of high dependency/specialling, PICU or death, were seen as significant outcomes. Criteria modification was required following the study to ensure a high level of specificity and sensitivity Education: Following completion of the research project, the study centre implemented a nurse-led paediatric critical care outreach team. The team has undertaken the implementation and education of this tool to all health staff within the hospital, through its integration into the newly devised in-patient paediatric
Eligible patients identified by asking nurses on wards if any patients had recently or currently received high dependency nursing care; review of admission books, daily work/patient allocation books and completed critically ill children’s audit forms. PICU was also a source for patient sampling. Wards were visited 3 days a week, during 6-month study period. Researcher looked at documented physiological observations and any relevant descriptions of child’s condition. Care received over 24h-period was noted so that the outcome of that patient was tracked. If the patient triggered any of the criteria this was documented. Data collection ceased after a maximum of 7 days or 24h following the child no longer triggering the tool.
required high dependency/specialling (c) required transfer to PICU, maximum dependency level (1—4) 3. Respiratory/cardiac arrest or emergency call 4. Death Results: The highest level of care reached by the 360 patients was; majority (43%) had additional monitoring on the ward; percentage requiring high dependency and PICU were 2 and 18%, respectively. 37% of patients remained on the ward without a problem. During 6 months of data collection - 67 admissions to PICU; all had triggered on PEW study tool. 66 (18%) were admitted to PICU from all ward areas. 1 patient had 2 PICU admissions in a 7-day episode of data collection. Majority (40%) of these admissions from cardiac ward. Half (n = 30) of patients never exceeded dependency level 1. Of case (n=360 patients) 73 (20%) required paediatric intensive or high dependency care. All fulfilled trigger criteria thus tool had 100% sensitivity for identification of patients requiring HDU/PICU. 227 (63%) of patients required at least additional monitoring on ward. Authors state that a ‘‘paediatric critical care outreach’ team could have reviewed these patients if both the tool and the team were in clinical use. If this were the case, approximately two-thirds of patients reviewed by a team would require some enhanced level of care. This piloted tool therefore would have 63% specificity and would result in a manageable workload for such a team (approximately two new patient referrals per day)” Modified Tool (post research) 326 patients from original population would

(13/10/2014 Final Version) Page 184
Author; Date; Country; Title
Purpose Design Settings/Participants PEWS Tool Clinical Data Collection Method/Analysis
Outcomes/Results
observation chart
still trigger the tool. 72 out of 73 patients requiring PICU/HDU would be identified (i.e. sensitivity = 99%). Reviewing 34 patients who would no longer trigger the modified tool, 22 remained on ward without a problem; the other 12 required enhanced level of care. Thus, 215 of remaining 326 patients required either additional monitoring, HDU/PICU. The specificity of tool is increased 66%.
McLellan et al. (2013) USA Validation of the Cardiac Children’s Hospital Early Warning Score: An Early Warning Scoring Tool to Prevent Cardiopulmonary Arrests in Children with Heart Disease
To validate the Cardiac Children’s Hospital Early Warning Score (C-CHEWS) tool and its related three-tiered algorithm in inpatient paediatric cardiac patients
Retrospective cohort study used to validate C-CHEWS tool & algorithm.
Setting: Cardiovascular unit, 41-bed medical and surgical telemetry unit within a free-standing quaternary academic hospital. The unit includes ten “higher dependency beds” for higher acuity patients. Case participants All patients on inpatient cardiac unit that experienced a CPA or unplanned ICU transfer (n = 64 with 10 arrests, 54 transfers) Excluded patients receiving palliative care or with planned ICU transfer Median age in years 0.5 (range 0.0-61.3) Male n=44 Female n=20 Comparison group Convenient sample (n=248) among group of patients admitted to inpatient cardiac unit that did not experience CPA or unplanned ICU transfer.
Tool description C-CHEWS tool is completed with nursing vital signs assessment; score is translated to a color-coded three-tiered algorithm; whole documentation process of C-CHEWS score, automated calculation, and related clinicians’ action takes less than 15 seconds to complete. C-CHEWS score ≥ 3 requires immediate action by patient’s team of clinicians Comparison Tool Paediatric Early Warning Score was used for comparison (Monaghan 2005; Tucker et al 2008)
Data extraction from patient records / chart reviews The highest documented C-CHEWS scores from patient cohort were extracted from patient’s electronic health record. Based upon the charted documentation, trained nurse data collectors calculated the PEWS score for the same time point as the patient’s highest C-CHEWS score. In addition to the highest C-CHEWS score, PEWS and C-CHEWS scores were abstracted on case patients for up to 18 hours prior to arrest or unplanned transfer to determine lead time scores to these events n= 919 documented observations used to calculate C-CHEWS and PEWS scores - included documented C-CHEWS scores, vital signs, clinicians’ observations, and clinical notes.
Outcomes: CPA Unplanned ICU transfer Results: Sensitivity For score ≥ 3, sensitivity of PEWS 54.7% compared with C-CHEWS 95.3% For score ≥ 5, which could trigger resources from CICU, sensitivity of PEWS 23.4% compared with C-CHEWS 67.2% Specificity For score ≥ 3, specificity of PEWS 86.3% compared with C-CHEWS 76.2% For score ≥ 5, specificity of PEWS 97.6% compared with C-CHEWS 93.6% Positive predictive value For score ≥ 3, PPV for PEWS 50.7% compared with C-CHEWS 50.8% PPV for score ≥ 5 for PEWS 71.4% compared with C-CHEWS 72.9% Negative predictive value For score ≥ 3, NPV for PEWS 88.1% compared with C-CHEWS 98.4% NPV for score ≥ 5 for PEWS 83.2% compared with C-CHEWS 91.7% ROC C-CHEWS higher AUROC (0.917) compared with PEWS (0.785) (P < .001) Lead-time

(13/10/2014 Final Version) Page 185
Author; Date; Country; Title
Purpose Design Settings/Participants PEWS Tool Clinical Data Collection Method/Analysis
Outcomes/Results
Comparison group intended to be representative of entire paediatric cardiovascular population on the unit and not matched to case patients. Median age in years 2.8 (range 0.0-54.9) Male n=116 Female n=132 Final study cohort n=312
For cut point ≥ 3, median for C-CHEWS was 9.25 hours (range 0–21 hours) compared with 2.25 hours (range 0–20 hours) for PEWS. For cut point ≥ 5, C-CHEWS median of approx. 2 hours (range 0–20 hours) compared with PEWS that was zero hours (range 0–16 hours). C-CHEWS achieved statistically significant higher discrimination than the PEWS in identifying cardiovascular patients who may experience an arrest or ICU transfer than those who may not.
Monaghan (2005) UK Detecting and managing deterioration in children
Summarise process of setting up a paediatric critical care outreach team at Brighton Describes development of a paediatric early warning score (PEWS) to assist in detecting children at risk of deterioration Process of implementing change & difficulties encountered when implementing new working practices are briefly considered
Descriptive pilot study / audits Staff survey
Royal Alexandra Children’s Hospital Brighton, Brighton and Sussex University Hospitals NHS Trust N=30 patients scored 4 on PEWS N=3 children unwell who staff felt should have scored higher N=33 staff survey
Brighton PEWS To develop PEWS Multidisciplinary planning group set up to represent clinical staff involved in caring for patients PEWS developed on available adult systems (not specified) Pews parameters: Behaviour, Cardiovascular, Respiratory, ¼ hourly nebulisers and persistent vomiting Actions (calling criteria) Having assessed the parameters nurse calculates child's total score, which dictates one of four actions: 1 - informing the nurse in charge 2 - increasing the frequency of observations 3 - calling for medical review and informing the outreach team 4 - calling out the full medical team and outreach team
PEWS piloted for three months and patients reviewed using an audit tool which captured the patient's observations, PEWS score, who was called, what actions were taken and the outcome. Also audited children who should have scored highly but did not (such as children who required intensive care admission with PEWS scores below four).
Some staff negative re score as felt capable of recognising patients at risk. Concerns re time consuming process with extra paperwork. Scoring patient no more than 30sec on top of standard observations; decreases with further familiarity. Score included into the standard observation chart. During the pilot 30 patients scored four, warranting a call for medical staff to review the patient's condition. 96% were seen within 15min. Same % required medical intervention. In 54 per cent of these cases, care involved the outreach co-ordinator. 83% patients improved following intervention; 17% deteriorated and required admission to the PICU. Staff identified three children who were unwell and required medical intervention during the pilot and who they thought should have scored higher. Analysis of these children's audit forms and observations showed that they had all developed a tachycardia prior to their deterioration. It was also noted that certain patients, such

(13/10/2014 Final Version) Page 186
Author; Date; Country; Title
Purpose Design Settings/Participants PEWS Tool Clinical Data Collection Method/Analysis
Outcomes/Results
Data from a pilot implementation are presented to provide evidence for use of a paediatric early warning score in children
If the child's score was in the red column, or greater than four, the protocol recommends calling out the full medical team
as children who have had a tonsillectomy, may not display classic signs during the early phases of deterioration. Prolonged vomiting was felt to be a more prominent sign of bleeding in these cases and was added as a factor to score. A subsequent audit found a direct relationship between the PEWS and the recording of respiratory rate: 80 per cent of children without a recorded PEWS also had no respiratory rate recorded. Staff experience of both the PEWS system and the outreach service was very positive; a survey of staff experience found that out of 33 staff on acute medical and surgical wards, 88% per cent felt that the outreach service increased their confidence in caring for the child at risk of deterioration. 80% reported that the PEWS system improved their confidence in recognising the child at risk of deterioration.
Parshuram at al. (2009) Hospital for Sick Children, Canada Development and initial validation of the Bedside Paediatric Early Warning System score
To develop & validate a simple bedside score to quantify severity of illness in hospitalized children Objective this study to create a simple score for routine bedside use Note: These authors previously developed 16-item severity of illness score for
Case-control design (frequency matched) Prospective data extracted from CCRT and medical records Retrospective survey interview nurse global rating of risk of clinical deterioration event
Setting: Hospital for Sick Children, Toronto Case control Patients eligible for case-control study were admitted to a hospital ward and had no limitations to their care Age: 0-18yrs Case – (n=60) patients admitted urgently to PICU from hospital inpatient ward following urgent consultation with PICU, but not following a call for immediate
Score development Development of the Bedside PEWS score involved identification & selection of items that were part of routine clinical assessment. Validation of the Bedside PEWS score involved evaluations comparing the score versus expert opinion, progression of the score over time, and the scores and outcomes of children referred to, or followed by a Paediatric Medical Emergency Team, called the Critical Care Response Team (CCRT) The development of the
Study data were obtained from three sources: patients in a case-control study, a survey of nurses caring for the patients in the case-control study, and prospectively collected data from patients seen by the CCRT Case control Clinical data abstracted directly from medical record; supplemented by interview with consenting frontline nursing staff Data collected for 12 hours in control patients, and for 24 hours ending at the time of urgent PICU admission in case patients Study nurses recorded the clinical data that was documented and that which was not documented but was known by the frontline nurses. They
Outcomes: Risk of clinical deterioration near or actual cardiopulmonary arrest Urgent transfer / admission to ICU with at least one hour notice Results: Data from 60 case and 120 control-patients was obtained. Four out of eleven candidate-items were removed 7 item score with score range of 0-26 Heart rate, systolic blood pressure, CRT, respiratory rate, respiratory effort, transcutaneous oxygen saturation and oxygen therapy. Mean maximum score in case patients 10.1 and 3.4 in controls. Difference between control and cases 6.7.

(13/10/2014 Final Version) Page 187
Author; Date; Country; Title
Purpose Design Settings/Participants PEWS Tool Clinical Data Collection Method/Analysis
Outcomes/Results
use in hospitalised children (Duncan et al. 2006); however the complexity of that score limited its application, hence purpose of this current study
medical assistance (a 'code-blue' call) Control – (n=120) patients admitted to inpatient ward (not PICU, NICU, outpatient area or emergency department) during the period of study, and in the 48 hours following inclusion did not have a 'code-blue' call & were not urgently admitted to the PICU. Case patients identified by prospective daily screening of PICU admissions; control patients frequency matched with cases on basis of age group, and type of ward. 2 controls were recruited for each case. Mean age 72 months, n=32 <3months n=35 aged 3-12 months n=22 aged 1-4 years n=54 aged 5-12 years n=37 aged > 12years Measurements of clinical data were made at 2961 individual times Frontline nurses completed 226 surveys describing severity of illness in 168 (93%) patients, with a median of 1 survey completed per
Bedside PEWS score involved the identification and selection of items that were part of routine clinical assessment and exclusion of demographic and other fixed items from our previously published score
Selected items modified using opinions of experienced respiratory therapists, nurses and physicians to define new cut-off points and additional severity categories for candidate items. Items then evaluated singly and in combination for inclusion in the Bedside PEWS score Item reduction:2 stage process (i) item selection based on ability of each item to discriminate sick & well children (ii) performance of candidate scores evaluated Score validation Following development of Bedside PEWS score, evaluated convergent validity, responsiveness and construct validity.
Hypothesis Bedside PEWS scores were (1) correlated with nurse-rated risk of near or actual cardiopulmonary arrest (2) higher in children who were urgently referred for ICU consultation versus following ICU discharge (3) higher in
did not calculate candidate scores or sub-scores. Nurses completed a survey describing the number of patients they were looking after, their years of post-graduate experience, and asking 'how surprised would you have been if your patient had a patient care emergency while you were on your break?' on a five-point scale from 'extremely surprised' to 'not at all surprised'. We used this retrospective question to measure the respondent's perception about the child's risk of near or actual cardiopulmonary arrest at the time the child was in the responding nurse's care. From the prospectively documented CCRT data, abstracted the items of the Bedside PEWS score, the nature of the consultation and the disposition of the patient following each consultation episode. New consultation episodes included the initial consultation visit and visits over the subsequent 24 hours. Post-ICU discharge review is a mandated activity of the CCRT. Post-ICU discharge episodes included all visits in the two days following ICU discharge. Data from CCRT patients was collected from 1 May to 31 December, 2007.
AUCROC 0.91; sensitivity 82%; specificity 93% at threshold score 8 The score increased over 24 hours preceding urgent PICU admission (P < 0.0001). In 436 urgent consultations, Bedside PEWS score was higher in patients admitted to ICU than patients not admitted (P < 0.0001). The Bedside PEWS Score can differentiate sick from well patients & identify more than 80% of patients with at least one hour notice before urgent ICU admission Ability of the Bedside PEWS score to prospectively distinguish critically ill from well patients was as good – if not superior to – the retrospective opinion of the bedside nurses who cared for these patients (AUCROC 0.84) ROC was 0.91, compared with 0.84 for the retrospective nurse-rating of patient risk for near or actual cardiopulmonary arrest. Inclusion of both nurse rating and the Bedside PEWS score increased the AUCROC from 0.91 to 0.94. These data suggest that the Bedside PEWS score may provide objective real-time data to compliment frontline provider knowledge, and to better inform level of care and management decision-making

(13/10/2014 Final Version) Page 188
Author; Date; Country; Title
Purpose Design Settings/Participants PEWS Tool Clinical Data Collection Method/Analysis
Outcomes/Results
case and 1 per control children admitted urgently to ICU than in other patients for whom ICU was urgently consulted and (4) Bedside PEWS scores increased over 24 hours preceding ICU admission. Bedside PEWS scores were compared in patients with new consultation and following ICU discharge by outcome of consultation (ICU admission or not). For all visit episodes not resulting in ICU admission Bedside PEWS scores compared with time to planned follow-up visit. Excluded visits where follow-up plans were not indicated. Frontline staff of CCRT were not familiar with Bedside PEWS score, the score was not calculated, and was not used to assist in management, disposition or follow-up decisions.
Parshuram et al. (2011a) Hospital for Sick Children, Toronto, Canada Multicentre validation of the bedside paediatric early warning system score: a severity of
To evaluate the performance of Bedside PEWS score in a large patient population at multiple hospitals before implementation Hypothesis Bedside PEWS (1) could identify
International, multicentre, validation of Bedside PEWS Case control design (frequency matched) Retrospective survey interview nurse global rating of risk of clinical
Setting 4 participating hospitals (Montreal, Edmonton, Toronto, Birmingham) (n=2,074 patients) (over 120 hospital months) Patients cared for in an inpatient unit other than ICU Case patients (n= 686) defined as those experienced a clinical deterioration event resulting in immediate call to resus. team or
Development of Bedside PEWS Bedside PEWS scoring system developed using expert opinion and statistical methods 7 items used to calculate score - heart rate, systolic blood pressure, capillary refill time, respiratory rate, respiratory effort, transcutaneous oxygen saturation and oxygen therapy
Clinical data including 14 risk factors for cardiopulmonary arrest, obtained by direct abstraction from medical records using standardised data collection forms Clinical data from 12 hours ending 1 hour before clinical deterioration event and for 12 hours in control patients was used to calculate the maximum Bedside PEWS score Where data was missing data the most recent recorded data was used Nurses interviewed to provide
Outcomes; Code blue Urgent ICU admission without code blue call Results: 305 code blue cases and 381 patients urgently admitted to PICU without a code blue event. There were 23,288 hours with data describing one or more Bedside PEWS score items, 7,263 hours (31.2%) when 5 or more items of Bedside PEWS score were used for score calculation, and 1,181 hours (5.1%) when all 7 items were used for score calculation. The median (IQR) of the maximum Bedside

(13/10/2014 Final Version) Page 189
Author; Date; Country; Title
Purpose Design Settings/Participants PEWS Tool Clinical Data Collection Method/Analysis
Outcomes/Results
illness score to detect evolving critical illness in hospitalised children
children at risk for CPA arrest with at least one hour’s notice (2) might increase during the time leading up to the clinical deterioration event (3) would be independent of number of static risk factors for cardiac arrest and (4) would be superior to retrospective ratings of nurses
deterioration event
urgent ICU admission without resus. team call. Control patients (n=1,388) defined as those cared for in an inpatient unit without resuscitation team call or urgent ICU admission during period studied or for following 48 hours. 1:2 frequency-matched case-control study was performed Age: 0-18yrs Age range 0-227 months Excluded; medico-legal review; care restrictions Matching process Clusters of similar types of inpatient units were identified within each hospital. For example, all the general surgical units comprised one cluster, and another cluster was composed of the units caring for bone marrow transplant recipients and oncology patients. Patients within each cluster who were in the same Bedside PEWS age category were frequency matched at a ratio of two control patients per case patient.
Score Range = 0 to 26. Bedside PEWS age category (< 3 months, 3 months to < 12 months, 1 year to < 5 years, 5 to 12 years and > 12 years) In development data set, in a single-centre study, this 7-item scale found to have AUCROC curve of 0.91 & sensitivity of 83% at score of 8
additional clinical data that was observed but not documented, and they completed a survey to describe their retrospective global rating of risk of a clinical deterioration event They were asked, ‘How surprised would you be if your patient had a patient emergency while you were on break’? Responses were recorded on a five-point Likert scale
PEWS scores was higher in case patients (8 (5 to 12)) than in the 1,387 controls (2 (1 to 4); P < 0.0001) AUCROC 0.87 (0.85 to 0.89) with scores maintained across age groups, diagnoses and hospitals Threshold score 7, sensitivity 0.64 & specificity 0.91. Threshold score 8, sensitivity 0.57& specificity 0.94
After inclusion of the data from the hour immediately before near or actual cardiopulmonary arrest events, the AUCROC (95% CI) curve increased from 0.87 (0.85 to 0.89) to 0.88 (0.87 to 0.90). Bedside PEWS reflected evolving critical illness. Scores increased over the 24 hours before near or actual cardiopulmonary arrest events. The retrospective opinion of nurses caring for the patients studied was inferior to the Bedside PEWS score (P < 0.0001) Nurse ratings 1,477 patients (71.2%) (438 cases 63.85; 1039 control 74.8%) with retrospective nurse ratings describing the 12 hours before the clinical event. Retrospective nurse ratings were able to discriminate case from control patients (P< 0.0001) and within the strata of nurse ratings the Bedside PEWS score was higher in case patients than in control patients. The AUCROC curve (95% CI) for the retrospective nurse ratings was 0.83 (0.81 to 0.86). This statistic was significantly lower (P <0.0001) than that for the maximum Bedside PEWS score alone, which was 0.89 (0.88 to 0.91), and was also significantly lower (P < 0.0001) than the combination of the maximum Bedside PEWS score and

(13/10/2014 Final Version) Page 190
Author; Date; Country; Title
Purpose Design Settings/Participants PEWS Tool Clinical Data Collection Method/Analysis
Outcomes/Results
retrospective nurse ratings combined 0.92 (0.90 to 0.94).
Parshuram et al. (2011b) Canada Implementing the Bedside Paediatric Early Warning System in a community hospital: a prospective observational study
To evaluate the effect of implementation of the Bedside PEWS in a 22-bed community paediatric hospital. Hypothesis: the implementation of Bedside PEWS would be associated with lower rates of late transfers to the local paediatric referral centre, and improved or maintained staff satisfaction without a significant change in physician workload.
Prospective before-and-after observational study Survey
Setting: Community hospital 22-bed inpatient paediatric ward n=1274 patient admissions Care provided for 3192 patient-days (842 patient-days before implementation & 2350 patient-days after implementation. Median inpatient ward census 13 before and 13 after implementation. Care is provided by 62 frontline staff comprised of 56 registered nurses and six respiratory therapists. There were also 11 paediatricians who provided 24 h/day, seven days/week in-house service to the paediatric inpatient unit, the delivery suite and the emergency department. n=8 paediatricians (took part in survey) n=114 frontline staff completed survey (response rate 61%)
Implementation of Bedside PEWS (parameters – heart rate, systolic blood pressure, capillary refill, respiratory rate, respiratory effort, oxygen saturation, oxygen therapy) Calculated with each set of vital vitals documented by frontline staff Staff education: Staff education began one month before clinical implementation. Frontline nurses & respiratory therapists received 4h of didactic & interactive education about basis and use of Bedside PEWS. Education sessions provided to groups of 6-8. Physicians received 90 min interactive tutorial.
Data extraction from patient medical records and logs of calls kept by ward clerk/charge nurses Frequency & reliability of score calculation were evaluated. Each week, two patients were randomly selected. Prospective survey to assess physician workload Survey on perceptions of frontline nurses and respiratory therapist 3mths before and at 2 and 5mths post PEWS implementation Outcomes: Primary = significant clinical deterioration events (defined as patient transfer from inpatient unit to a hospital with a PICU, following any invasive positive pressure ventilation, administration of greater than 60 mL/kg of resuscitation fluid in the 12 h before transfer, administration of inotropes or vasoactive medication, provision of cardiopulmonary resuscitation, or death before transfer in patients who do not have orders that limit resuscitation) Secondary = stat calls to paediatrician, stat calls to respiratory therapist, immediate calls to treat near or actual cardiopulmonary arrest (code-blue calls) for which resuscitation team and equipment required, hospital length of stay and inter-hospital transfer to regional paediatric referral centre. Also included - paediatrician workload and sleep, and perceptions of frontline nurses and respiratory
Results: Patient medical notes data There were 2 significant clinical deterioration events before and one after implementation, with a reduction from 2.4 to 0.43 significant clinical deterioration events per 1000 patient-days (P=0.013). Implementation of Bedside PEWS was associated with fewer stat calls to respiratory therapists per 1000 patient-days (9.5 versus 3.4; P<0.0001), fewer stat calls to paediatricians per 1000 patient-days (22.6 versus 5.1; P<0.0001) and an increase in the overall number of transfers per 1000 patient-days (5.9 versus 8.1; P=0.041). Physician survey data Described 37 duty periods lasting 24 h, for a median of five (IQR two to 6.5) duty periods per respondent. For 37 duty periods, paediatricians reported they admitted three (IQR two to four) patients, spent 15 min (10 min to 30 min) reviewing patients on paediatric ward, received four (IQR three to five) pages to paediatric ward and reported sleeping a median of 4 h (IQR 3 h to 5 h). Three (1.9%) pages from a total of 161 pages to paediatric ward could have been grouped or avoided according to paediatricians. There were no significant differences before or after implementation of Bedside PEWS. Frontline staff survey data Ratings of documentation quality increased from median of 3 (adequate) to median of 4 (very good) for both post implementation periods (P=0.007). Visual analogue scale ratings of documentation, inter-professional communication & apprehensiveness when calling paediatrician to review a patient after hours improved after implementation. At month 5 of implementation, the ratings of communication quality (70 mm) were

(13/10/2014 Final Version) Page 191
Author; Date; Country; Title
Purpose Design Settings/Participants PEWS Tool Clinical Data Collection Method/Analysis
Outcomes/Results
therapists.
similar to pre-implementation values (68 mm; P=0.32). Cost: Implementation of Bedside PEWS required administrative commitment and additional local resources including re-allocation of 4 h to 6 h per week of paediatric nurse-educator time. The resource requirement and clinical improvement seems modest compared with other interventions to improve care processes including hospitalists, nurse practitioners, physician extenders and medical emergency teams.
Robson et al (2013) California, USA
Validate and compare sensitivity and specificity of three previously validated PEW scoring systems in predicting acute care patients at risk for impending or actual CPA (i) PEW Tool (Haines et al., 2006) (ii) PEW System Score (Duncan et al., 2006) (iii) Bedside PEW System Score (Parshuram et al., 2009) To identify
Retrospective case-control Research Questions Can PEW tools be valid predictors of acute care pediatric patients developing a CPA and therefore provide an effective early warning trigger system for children at risk for respiratory or cardiopulmonary arrest in a tertiary children's hospital in the Western United States? In comparing
338 bed tertiary Children’s Hospital in western United States Cases n=96 identified by risk management department from occurrence reports; cases had triggered an EMRT call due to critical illness with impending or actual CPA Controls n=96 selected from an internal database & matched to the cases based on age, diagnosis, gender, residing patient care unit and month of occurrence. Age: 0 – 18yrs Located in one of six acute care units (medical, surgical, respiratory, oncology, medical-surgical and rehabilitation)
Differences in variables measured across tools; Bedside PEW (Parshuram et al., 2009) 7 variables; PEW Tool (Haines et al., 2006) 14 variables; PEW System Score (Duncan et al., 2006) 19 variables. Five variables common across all three tools; heart rate, blood pressure, capillary refill time, respiratory, rate and oxygen saturation Ranges of scores also varied between tools ranging from 0-32 for PEWS System Score (Duncan et al. 2006); 0-26 for Bedside PEW System Score (Parshuram et al. 2009); PEW Tool (Haines et al. 2006) was not an aggregrate score so scores ranged from 0-1.
Retrospective medical record review Abstracted data on demographic and clinical variables for a 24-hour period prior to the trigger event for cases, or a defined 24-hour time frame for control patients (chosen within the same 24-hour period as the matched case, when possible. For controls in which this was not possible, the closest 24-hour period was used) Using the three validated tools, a PEW score was calculated for each 6-hour interval (2400–0559) (0600–1159) (1200–1759) (1800–2359), during the defined 24-hour period. Highest PEW score for each tool from every 6-hour interval recorded on an investigator-designed research tool. Missing data for dynamic variables were assumed to be normal and were scored a zero.
Outcome measure (to effectively compare tools): EMRT call for impending or actual CPA Results: The study identified that children who suffered a CPA were primarily males (59%) and 77% of children were less than 4 years of age, with 57% less than 1 year of age. The primary diagnosis of children who suffered a
CPA was respiratory (42.7%). Based on ROC curve, PEW System Score (Duncan et al., 2006) was a stronger predictor of impending or actual CPA than either the PEW Tool (Haines et al., 2006) or the Bedside PEW System Score (Parshuram et al., 2009) in this population studied. Optimal trigger score for PEW System Score (Duncan et al. 2006) was 5, with balance between sensitivity (86.6%) & specificity (72.2%) when compared to other tools. Comparison of 3 ROC curves showed that PEW System Score (Duncan et al. 2006) demonstrated a significantly greater amount of accuracy (p<0.05) with an AUROC of 0.85.

(13/10/2014 Final Version) Page 192
Author; Date; Country; Title
Purpose Design Settings/Participants PEWS Tool Clinical Data Collection Method/Analysis
Outcomes/Results
most robust tool for use in US
the three PEW tools, which tool is more effective at predicting risk for developing a CPA in a tertiary children's hospital in the Western United States?
Sefton et al. (2014) Alder Hey Children’s NHS Foundation Trust, UK What impact did a Paediatric Early Warning system have on emergency admissions to the paediatric intensive care unit? An observational cohort study.
To understand how introducing PEWS at a tertiary children’s hospital affects emergency admissions to PICU. To compare ‘in-house’ cohort of emergency admissions to PICU with a comparable group; emergency admissions transferred to PICU from wards at District General Hospitals (DGH) (without PEWS in place) To explore
Before-and-after cohort observational study
Setting: Tertiary children’s hospital in Northwest England (337 in-patient beds; 22 bed PICU and two separate High Dependency Units (total beds 21)). ‘In-house’ cohort of emergency admissions to PICU ‘External cohort’ emergency admissions transferred to PICU from wards at District General Hospitals (without PEWs in place) 958 unplanned PICU admissions over two years were reviewed, for one year before PEWs introduction and one year afterwards.
Modified Bristol PEW (Haines, 2005) tool incorporated within patient observation charts. Chart format followed ‘Advanced Paediatric Life Support’ structured approach, assessing Airway, Breathing, Circulation and Disability Thresholds for concern for respiratory rate, heart rate and blood pressure were based on APLS guidelines. PEWs considered activated if one or more of thresholds for abnormal observations were breached. The hospital had a cardiac arrest team to respond to respiratory or cardiac arrests, but did not have a Medical Emergency Team or a Rapid Response Team. Education: Focused PEWs training was implemented for all frontline clinical hospital staff (standard for taking observations, documentation,
Patient-specific information and source data routinely collected prospectively for all PICU admissions for Paediatric Intensive Care Audit Network dataset (PICANet) – age, gender, diagnostic group, Paediatric Index of Mortality (PIM2) at first contact with PICU team, PICU interventions required, length of PICU stay (days) and PICU mortality. Over the same time period, the hospital Informatics team collected data about the unmet demands for PICU beds; included cancellation of major elective surgery and refusal of external PICU referrals when no PICU beds were available.
Outcomes: Emergency admissions to PICU; invasive ventilation and inotropic support used as surrogate markers for severity of illness Results: ‘In-house cohort’ PEWs did not reduce the incidence of emergency admissions to PICU. Median PIM2 score dropped to 0.44 from 0.60 (p < 0.001), indicating that the likelihood of dying during the PICU admission reduced significantly. Fewer admissions required invasive ventilation; 62% vs75% (p = 0.015) for a shorter median duration, dropping from 4 to 2 days. Proportion of admissions requiring inotropic support reduced from 31.8% to 24%; not statistically significant (p = 0.12). Median duration of inotropic support was unchanged. Median length of stay on PICU reduced from 5 to 3 days (p = 0.002). Non-significant reduction in mortality [10.8 to 8.4% (p = 0.47)], consistent with the reduction in PIM2 score. ‘External cohort’ No. of emergency admissions transferred from DGHs to tertiary PICU similar over both time periods. Median PIM2 scores at first

(13/10/2014 Final Version) Page 193
Author; Date; Country; Title
Purpose Design Settings/Participants PEWS Tool Clinical Data Collection Method/Analysis
Outcomes/Results
impact PEWS had on PICU service delivery
recognising abnormal observations and escalation of concern). The new charts were introduced in all in-patient areas in August 2006.
contact with the PICU team increased from 0.060 to 0.072, suggesting an increased likelihood of dying during the PICU admission. Requirement for intubation and ventilation, inotropic support and median length of stay were similar in before-and-after groups. There was a marginal improvement in mortality from 10.6% to 8.2%, which was not statistically significant (p = 0.30). Impact on service delivery Shorter PICU stay for ‘in-house’ emergency admissions = improved productivity. Cumulative effect of shorter length of stay meant a 39% overall reduction in total number of bed days used for emergency PICU admissions. Cancellation of major elective surgical cases was reduced by 90%. 79% reduction in number of refused regional PICU referrals. (economic implications)
Skaletzky et al. (2012) Miami Children’s Hospital USA Validation of a Modified Pediatric Early Warning System Score: A Retrospective Case-Control Study
To validate the modified version of Brighton PEWS tool for the assessment of at-risk children in less acute care areas of the hospital.
Retrospective Case–Control Study
Setting: Miami Children’s Hospital medical–surgical wards during a 30-month period Case (n=100 )– all patients admitted to medical–surgical wards during a 30-month period & transferred to PICU Controls (n=250) - patients admitted to medical–surgical wards but not transferred to the PICU during same time period 1:3 matching controls for each case
Modified version of Brighton PEWS score, based clinical parameters—behaviour, cardiovascular and respiratory system with maximum potential score of 9.
Demographic data - age, gender, diagnosis, location of admission, month and year of admission, and length of stay obtained by retrospective chart review Data were recorded for cases during the 48-hour period before transfer to the PICU and for control patients during initial 48 hours following hospital admission The maximum modified PEWS score was calculated for each case and for each control If cases were transferred to the PICU within 48 hours of hospital admission data were analyzed from time of admission to time of transfer to the PICU (scores then used for comparison analysis)
Outcomes: Patients transferred to the PICU after a physician’s request, rapid response team evaluation (RRTE), or a CBE (code blue event). Results: Cases; 3 transfers to PICU following RRTE, 4 following CBE, 1 following both RRTE & CBE; remainder by physician request. Maximum PEWS score significantly higher P < .0001 for cases compared with controls. AUCROC 81%; Sensitivity & Specificity of PEWS score 2.5 for transfer to higher level of care were 62% & 89%, respectively

(13/10/2014 Final Version) Page 194
Author; Date; Country; Title
Purpose Design Settings/Participants PEWS Tool Clinical Data Collection Method/Analysis
Outcomes/Results
Patients matched for age, location (medical ward) of admission, month of admission & admitting diagnosis. No exclusion criteria
Chart review involved obtaining the vital signs and nursing notes recorded electronically by nursing assessments Modified PEWS score included behaviour, cardiovascular, and respiratory components with maximum potential score of 9. PEWS score collected every 4hours in both groups
Solevag et al. (2013) Akershus University Hospital, Norway (AHUS) Use of a modified Pediatric Early Warning Score in a Department of Pediatric and Adolescent Medicine
To assess correlation of modified version of The Brighton Paediatric Early Warning Score (PEWS) results with other indictors of severe illness/patient characteristics (e.g. certain diagnostic groups and administration of cardio-respiratory support such as fluid resuscitation and supplemental oxygen) in a Norwegian Department of Pediatric and Adolescent Medicine. To establish
Retrospective chart review
Setting: AHUS no PICU, transfers children below 3yrs who require intensive care to Oslo University Hospital. Critically ill children between 3 -18 yrs are admitted to the intensive care unit for adults at AHUS. n=761 patients (PEWS forms collected) Age: 0-18 years of age 409 boys 352 girls Median age 3.5years 31.5% aged between 13 months and 3 years
Modified and translated version of the Brighton PEWS Order of the 3 items (behaviour, cardiovascular & respiratory) changed to match ABCD(E)-algorithm. AVPU scoring system for the assessment of disability/behaviour was incorporated. Main components; respiratory rate, retractions, need for oxygen supplementation, heart rate, capillary refill time, skin color, and alertness. Respiratory rate and heart rate assessed to normal range of values for different age categories. Behavioural, cardiovascular and respiratory signs of clinical deterioration scored on a scale from 0 to 3 for each parameter.
All children referred for acute care during study timelines (approx. 10 week period) were scored upon arrival in ED, and if admitted, 3 times
Retrospective chart review - medical records of patients referred for acute care retrospectively reviewed. PEWS forms obtained during the study months were collected from ED and wards. A resident paediatrician checked the forms for erroneous scores. Scores were assessed and corrected in accordance with clinical information recorded in the electronic patient charts. If scores were incomplete or erroneous and could not be corrected retrospectively due to missing data, the whole PEWS form was excluded from analysis. Highest PEWS for each patient used for statistical calculations. Patients with highest PEWS >=3 compared with patients with highest PEWS ranging from 0 to 2 with respect to age, gender, diagnostic group, length of hospital stay, and different interventions as follows: Transfer to a higher level of care; oxygen supplementation; fluid resuscitation defined as a bolus of 10220 mL crystalloid (sodium chloride or ringer acetate); intravenous (i.v.) antibiotics; i.v. rehydration defined as continuous
Outcome: Transfer to higher level of care Results: Of 761 forms, 123 patients (16.2%) had a highest PEWS of >=3; 638 (83.8%) had a highest PEWS between 0 and 2. Highest PEWS identified was 7. Patients with PEWS >=3 had a significantly lower median age than patients with PEWS 0-2 Six (4.9%) patients with a PEWS >=3 and 9 children (1.4%) with PEWS 0-2 were transferred to higher level of care, indicating that transfer to higher level of care was significantly more frequent among patients with PEWS >=3 (p = 0.04). Patients with PEWS >=3 had a higher proportion of admissions compared to patients with PEWS 0-2. Lower airway disease was the diagnostic group with highest fraction of patients with a PEWS >=3. Only 1.1% of the surgical patients had a PEWS >=3 compared to 20.6% of the medical patients (i.e. treated by paediatricians) (p,0.001). A PEWS >=3 should indicate that careful monitoring of the patient is required.

(13/10/2014 Final Version) Page 195
Author; Date; Country; Title
Purpose Design Settings/Participants PEWS Tool Clinical Data Collection Method/Analysis
Outcomes/Results
guidelines for escalation in patient care based on the PEWS.
every 24 hours (once every nurse shift). Education: Dept nurses instructed in the use of the PEWS during a one-day course (pre)
crystalloid (sodium chloride or ringer acetate) or glucose infusion; rehydration via orogastric or nasogastric feeding tube; treated as inpatient or outpatient; and readmission within 30 days.
Tucker et al. (2009) Cincinnati Children’s Hospital USA Prospective evaluation of a pediatric inpatient early warning scoring system
To evaluate the use of PEWS (adopted with permission from Monaghan) for detecting clinical deterioration among hospitalised children
Prospective descriptive study
Setting: 24-bed inpatient general medical unit in quaternary regional paediatric medical centre in Midwestern United States. All patients admitted to this unit over 12 month period n=2,979 Age: Newborn to 22 years Mean 2.28 years Variety of diagnoses, the most common being asthma exacerbation, bronchiolitis, and pneumonia
Adapted Monaghan PEWS tool & specifically developed algorithm to prescribe actions. Algorithm development For this study, a process using multiple rapid Plan, Do, Study, Act cycles was used in developing the algorithm. Data from several weeks of PEWS were analyzed with respect to patient outcomes (cardiopulmonary arrest, medical emergency team calls, and unexpected transfer to the paediatric intensive care unit [PICU]). Front-line nurse experts evaluated the data and made a best estimate of determining the scores for the minimally required action steps. The PEWS, patient outcomes, and feedback from unit staff were reviewed at weekly unit leadership meetings. The algorithm was adjusted based on that feedback. It was nearly 15 months before the current version of the algorithm was completed. Algorithm incorporated tiered response to scores;
Tool developed to collect data on all PEWS obtained in 1 year period Charge nurse for each shift recorded all PEWS for the patients on the unit. In addition to PEWS, patient age, diagnosis, length of stay, and any actions taken because of patient deterioration (e.g., a call to the medical emergency team or a PICU transfer) were recorded. These tools were completed for every shift during the entire year. Only highest PEWS scores used in analysis .
Outcomes: Transfer to PICU (chosen as measure of clinical deterioration) Results: Patients’ highest PEWS ranged from 0 to 9 (M = 2.22, SD = 1.38).73.2% patients scored 0–2 throughout entire hospitalizations. 8% highest PEWS = 3; 8% = 4; 7% = 5; 1.2% = 7 or above. PEWS were unrelated to age of patient (r= .029, p= .412). Of 2979 study participants, n=51 transferred to PICU for clinical care, (1.8%); higher PEWS scores increased likelihood of PICU transfer PEWS discriminated between children who required transfer to the paediatric intensive care unit and those who did not require transfer (AUCROC = 0.89, 95% CI = 0.84–0.94, p< .001) Statistically significant association between PEWS and transfer to the PICU indicated that for each 1-point increase in PEWS children were more than twice as likely to transfer to the PICU (odds ratio = 2.8, 95% CI = 2.36–3.35, p< .001). For PEWS of 3 (lowest score requiring additional intervention) sensitivity was 90.2%, specificity was 74.4%, PPV was 5.8%, and NPV was 99.8%. For PEWS of 9 (highest PEWS in the sample) sensitivity was 7.8%, specificity was 99.9%,

(13/10/2014 Final Version) Page 196
Author; Date; Country; Title
Purpose Design Settings/Participants PEWS Tool Clinical Data Collection Method/Analysis
Outcomes/Results
increased PEWS corresponded to increased allocation of resources to patient. Score of 0–2 = no additional intervention; 3 = senior RN assess patient; 4 = bedside RN notify the paediatric resident of the patient’s PEWS; 5 = senior RN /paediatric resident assess the patient; 6 = senior RN, paediatric resident, and senior resident assess the patient at the bedside; 7 or above = bedside RN activate the hospital’s MET. Education: RNs trained in use of PEWS through learning modules and case studies. PEWS became a standard component of the assessment conducted every 4 hr on all patients admitted to the unit. Bedside RNs documented PEWS in patients’ electronic patient records every 4 hr for the duration of the patient’s admission.
PPV was 80%, and NPV was 98.4%. The discrimination ability of PEWS was very good as demonstrated by the ROC curve (AUC = 0.89, 95% CI = 0.84–0.94, P < .001). Note: Having buy in of nurses and physicians involved in initial planning discussions for implementing PEWS important to consider Nurses reported an average time of 15-30 seconds to calculate the score (economic) PEWS allowed nurses to communicate with healthcare providers using one common language; reduced miscommunication among health care team about the patient’s “true” condition; staff felt empowered to make independent clinical decisions based on the actions outlined in the predetermined algorithm; allowed for earlier collaboration among experienced healthcare providers at the patient’s bedside which permitted timely and controlled interventions and/or transfer to the PICU.
Tume (2007) UK The deterioration of children in ward areas in a specialist children’s hospital
To examine the extent of inpatient deterioration and critical care unit admission during a 4-month period Audit aims were • to describe
Audit / prospective chart review of clinical observations.
Large specialist children’s hospital based in the North West of England Setting: 211 inpatient beds across 17 wards(covering all specialties) / 21-bed PICU / 15-bed HDU that takes patients requiring non-invasive ventilation (NIV) & inotropic
Bristol Children’s PEWS (Haines et al 2006) and Melbourne PEW tool (Tibballs et al 2005) Hospital adopted the Bristol Children’s PEWS
Descriptive analysis of the patient data & children’s physiological data retrospectively matched against two PEW tools (the Bristol Children’s tool and the Royal Children’s Hospital Melbourne, Australia tool) to ascertain whether they would have ‘triggered’ one of these tools. A formalized data collection tool was developed to ensure consistent data collection between the two reviewers.
Outcome: Unplanned ICH/HDU admissions Overall summary 121 in total children required unplanned HDU or ICU admission Most (55%) of these were admitted because of respiratory distress, which predominantly occurred during out of office hours or at weekends (59%). Certain wards were at higher risk for ICU (cardiac, neonatal surgical and oncology), and general medical and surgical wards

(13/10/2014 Final Version) Page 197
Author; Date; Country; Title
Purpose Design Settings/Participants PEWS Tool Clinical Data Collection Method/Analysis
Outcomes/Results
characteristics of emergency admissions from ward areas and their observations and interventions in the ward areas; • to evaluate any abnormalities in the children’s physiological data in the 24 h preceding unplanned intensive care unit (ICU) or HDU admission; • to examine whether nursing and medical documentation reflected the deterioration of these children; • to determine whether a PEW tool would have been triggered by these patients.
support. Sample: n=341 children admitted to PICU (65 children (19%) were unplanned admissions from wards); 346 children admitted to HDU, 16% (n = 52) unplanned admissions from wards
Median values calculated over 24-h period. Percentage of ‘abnormal’ observations (for age) per number of observations done in the 24-h period before ICU or HDU admission also calculated. Observations taken ranged from 1 set to 13 sets in the 24-h period before unplanned ICU or HDU admission. Large number of missing records & charts.
were at higher risk for the HDU. Nearly half of all unplanned ICU admissions were previous ICU patients. Of these children, a large percentage had documented abnormal physiology in the 24 h before emergency admission, of which a PEW trigger tool would have potentially identified 87% of these children as being at risk of deterioration. Profile of unplanned ICU/HDU admissions ICU 341 children admitted to PICU, of which 65 children (19%) were unplanned admissions from wards. Of these, largest proportion, 40% (n = 26), were aged 1–12 months. In 55% of cases (n = 36), main reason for PICU admission was respiratory distress, irrespective of primary diagnosis (although the largest main diagnosis during this time was RSV + bronchiolitis). Four wards had a greater number of unplanned admissions to PICU (HDU, cardiology/cardiac surgical, neonatal surgical and oncology). Approximately half of these children were former PICU patients, of whom only 11% rebounded within 24 h post-PICU discharge. Primary reason for unplanned intensive care unit admission: 55% respiratory distress; 5% respiratory arrest, 5% cardiopulmonary arrest, 5% airway obstruction, 5% uncontrolled seizures, 5% respiratory distress + shock; rest <2% HDU HDU by comparison had 346 HDU admissions in this period, of which 16% (n = 52) children had unplanned HDU admissions from wards (three patients were admitted twice, one patient was admitted three times). The most common reason for emergency HDU admissions was respiratory distress, 54% (n = 28) irrespective of diagnosis. The admission locations for HDU children

(13/10/2014 Final Version) Page 198
Author; Date; Country; Title
Purpose Design Settings/Participants PEWS Tool Clinical Data Collection Method/Analysis
Outcomes/Results
were different from those of the PICU group, with a more varied mix of ward areas: 17% (n = 9) from a general medical ward, 13% (n = 7) from a neurology/dermatology medical ward, 10% (n = 5) from a neurosurgical and general surgical, 8% (n = 4) from a respiratory and general medical ward, 8% (n = 4) from a general surgical ward and 6% (n = 3) from a renal medical ward. The remainder (n = 20) came from other specialities/wards across the trust. Primary reason for unplanned high-dependency unit admissions: 54% respiratory distress; 8% seizures; 6% sepsis/septic shock; 6% cardiovascular collapse/support; 4% threatened airway; 4% reduced level of consciousness and coma scale; 4% respiratory arrest; rest <2% Timing of unplanned ICU or HDU admissions and patient outcome PICU group 32% (n = 21) admitted at weekends and 62% (n = 40) during ‘out of office hours’ (between the hours of 5 pm to 8 am). Length of ICU stay (LOS) of the emergency admission group was a median of 4 days, compared with the total patient group over this period of 2 days. The 28-day mortality of these children was 15% compared with the total group, which was 11% during this period. Seventy nine per cent (n = 51) of the children who were admitted to PICU required invasive mechanical ventilation. HDU group 26% (n = 14) of emergency admissions occurred on Fridays, with 36.5% (n = 19) occurring on weekends and 56% (n = 29) during out of office hours (5 pm to 8 am). The majority of children admitted to HDU were not previous PICU or HDU patients [only 17% (n = 9) were previous HDU patients].

(13/10/2014 Final Version) Page 199
Author; Date; Country; Title
Purpose Design Settings/Participants PEWS Tool Clinical Data Collection Method/Analysis
Outcomes/Results
With regard to the interventions required on HDU, 50% (n = 26) of the children just required a greater amount of observation/monitoring, with only 11.5% (n = 6) requiring NIV. Median LOS on HDU was 3 days (range 2 h–23 days). Mortality of this group was 6%. In terms of HDU discharge, 83% (n = 43) of patients were transferred back to a ward, with only 6% (n = 3) coming to ICU and 6% (n = 3) going to theatre and then to ICU What happened in the wards before unplanned ICU or HDU admission and evidence of abnormal physiology The length of time spent on the wards before unplanned ICU admission varied, with 35% (n = 23) spending <24 h on the ward, with a median ward LOS of 4 days (range <1 h–6 months). The HDU admissions had a median ward LOS of 2 days (range 0.2–150 days), so 80% (n = 42) spent less than 3 days on the ward before deteriorating and requiring emergency HDU admission The children’s physiology on the wards before emergency HDU or ICU admission was examined and compared against normal values, as defined by the Advanced Paediatric Life Support guidelines for normal Only 50% of the children admitted to PICU (n = 33) and only 61% (n = 32) of children admitted to HDU had ward observations available for review. This was due to either lost or missing records and exclusion of children admitted from HDU to ICU Intensive care unit admissions (n = 33) RR; 43% had all (100%) of their observations taken abnormal; 61% had >50% of observations taken abnormal (usually tachypnoea) HR; 13% had all observations abnormal; 33% had >50% abnormal (usually

(13/10/2014 Final Version) Page 200
Author; Date; Country; Title
Purpose Design Settings/Participants PEWS Tool Clinical Data Collection Method/Analysis
Outcomes/Results
tachycardia) Systolic BP; 39% had no blood pressures taken and 61% recorded occasionally one to three times in 24 h; of the few blood pressures recorded, they were either normal or increased High-dependency unit admissions (n = 32) RR; 47% had all (100%) of their observations abnormal; 68% had >50% of these taken abnormal (usually tachypnoea) HR; 16% had all observations abnormal; 41% had >50% abnormal (usually tachycardia) Systolic BP; 66% had no blood pressures taken and 34% had only occasionally recorded (usually once); of the few blood pressures recorded, 64% were abnormal Would these children’s vital signs have triggered a PEW tool? The children’s data were matched retrospectively against two established PEW tools to ascertain whether this abnormal physiology would have triggered a PEW tool. ICU group When matched, 88% (n = 29) of the ICU-admitted children would have triggered the Bristol PEW tool (Haines et al. 2006). Of these, 25% (n = 8) had multiple triggers and another 25% (n = 8) would have been triggered by tachypnoea alone. When matched against the Melbourne PEW tool (Tibballs et al 2005), remarkably 88% (n = 29) again of the ICU children also triggered. Of these, 27% (n = 9) triggered on tachypnoea alone and 24% (n = 8) had multiple triggers. HDU group 83% (n =27) would have triggered the Bristol Children’s tool and of these, 33% (n = 11) on multiple triggers/trigger

(13/10/2014 Final Version) Page 201
Author; Date; Country; Title
Purpose Design Settings/Participants PEWS Tool Clinical Data Collection Method/Analysis
Outcomes/Results
combinations and 10% (n = 3) on tachycardia (no fluid bolus), seizures and ‘condition worrying’, with only 16% (n = 5) not triggering. With regard to the Melbourne tool, 89% (n = 28) of HDU-admitted children triggered this tool and of these, 28% (n = 9) on tachypnoea, 28% (n = 9) on multiple triggers/trigger combinations and 12% (n = 4) on seizures, with only 11% (n = 4) not triggering. Documented evidence of medical and nursing concern In terms of documented medical reviews in the 24 h prior to ICU admission, only 49% (n = 32) of children had a consultant review, with the majority, 78% (n =51), being seen by a specialist registrar or a senior house officer, 70% (n = 46). The number of medical reviews in this 24-h period ranged from 0 to 11. Documented concern about the child was noted, on average, by three nurses in the 24-h period, but often this was not clear. On some occasions in both the medical and nursing documentation, there was clearly no recognition of the seriousness of the situation. With regard to the HDU patients, 37% (n = 9) of children had a documented consultant review in the 24 h prior to emergency HDU admission, with 83% (n =43) having a registrar review, 73% (n = 38) having a senior house officer review and 35% (n = 18) seeing an on-call registrar. The number of medical reviews in this group ranged from one to nine. Documented concern about the child was noted on average, by one nurse (42%) in 24 hours. This varied however, up to four nurses in this period, with the same issues found as for the ICU-admitted children.

(13/10/2014 Final Version) Page 202
Author; Date; Country; Title
Purpose Design Settings/Participants PEWS Tool Clinical Data Collection Method/Analysis
Outcomes/Results
This audit had led to significant changes within the trust, with the immediate development and implementation of an observation and monitoring policy and a review of the existing observation charts in the ward areas and incorporating the Bristol PEW tool as part of the observation chart. Mandatory education days already in place (including yearly resuscitation training) have incorporated the findings of this audit and have a greater emphasis placed on the assessment and recognition of deteriorating children.
Zhai et al.
(2014)
U.S.A
Developing and
evaluating a
machine learning based
algorithm to
predict the need of pediatric
intensive care
unit transfer for newly
hospitalized
children
(1) To develop
an EHR-based
automated algorithm to
predict the need for Pediatric
Intensive Care
Unit (PICU) transfer in the
first 24 h of
admission (2) To evaluate
performance of
the new algorithm on a
held-out test
data set (3) To compare
the
effectiveness of the new
algorithm
with two published
PEWS
Case control
design
Retrospective
study
Cincinnati Children’s
Hospital
Participants were the first 24hours of inpatient
encounters First attempted to
determine which patients
might need more attention and resources at the start of
their inpatient stay.
Second, the PICU transfers that occurred in this scope
covered a large percentage
of total PICU transfers (i.e., 36.6%).
Third, the algorithm
developed in this scope could be generalized and
tested in other scopes.
526 case and 6772 control
encounters
Through a process using expert
clinician opinion,
categorization and machine learning, the authors built a
model consisting of 29 variables for predicting PICU
transfer.
Existing clinical data in the
EHR and machine learning
used to develop and validate a prediction algorithm for PICU
transfer
of hospitalized patients in the first 24 h
Monaghan PEWS tool and Bedside PEWS used as comparison.
Identification and selection procedure of clinical elements for machine learning algorithm:
1. Top 400 most frequent elements extracted from electronic records
2. 16 elements selected by expert
3. 36 measurements extracted.
4. Discretization and categorization
5. Measurement selection based on chi-square test
6. 36 measurements (155 variables) used for machine learning algorithm
The algorithm achieved a 0.912 (95% CI
0.905–0.919) AUC in the test set. This result
was statistically significantly higher than application of two existing PEWS in our test
data set (Monaghan & Bedside PEWS)
Reasons: One reason for this finding is that the authors used 29variables from 16 clinical elements as compared to 3–7 variables in PEWS with which we compared. Study variables included vital signs, which both other scores employ. Also included levels of consciousness , pain assessments, and work of breathing that each met two important criteria: (1) face validity in association with worsening patient status that might precede PICU transfer, and (2) were obtained by nurses in the course of their usual clinical assessment.
(13/10/2014 Final Version) Page 203
APPENDIX 21
Data Extraction
Detection systems for identification of neonatal clinical deterioration

(13/10/2014 Final Version) Page 204
Data Extraction – Detection systems for identifying neonatal clinical deterioration
Author; Date; Country; Title
Purpose Design Settings/Participants PEWS Tool Clinical Data Collection Method/Analysis
Outcomes/Results
Holme et al. (2013) UK Retrospective evaluation of a new neonatal trigger score
Design and validation of an objective clinical scoring system to identify unwell neonates
Case cohort study
Setting: Neonatal Unit Whittington Health, London All neonates >35 weeks’ gestation admitted to the NICU over an 18-month period (group 1); and an age-matched “well” cohort (group 2) Group 1: n=193 (classed as ‘unwell’) All neonates born in study period who required admission to NICU from labour or postnatal wards Mean gestation in weeks n=39.02 Group 2: n= 292 (classed as ‘well’) A consequent group of neonates born during same study period who remained well on post natal ward and did not require NICU admission Mean gestation in weeks 38.68 Total: n=485 neonates Exclusion - born in cardiorespiratory or respiratory arrest and/or well neonates admitted to NICU for social reasons (e.g. observation for development of neonatal abstinence syndrome or for medical management of isolated jaundice or polycythaemia)
Neonatal Trigger Score (NTS) developed by expert group consensus and guidance from Neonatal Life Support 2010 guidelines & National Institute for Clinical Excellence Postnatal care guideline; neonatal scoring chart provided by Flannigan & Hogan 5 compulsory objective measures (temperature, heart rate, respiratory rate, respiratory distress, conscious level) and additional objective measure if indicated by past history (pre-feed blood sugar level). Each parameter scored a minimum of 0, with maximum scores ranging from 1 to 3. Score from each separate parameter then combined to generate a cumulative score (min 0, max 15); higher score reflecting greater deviation from “normal.”
Retrospective scoring using newly constructed NTS Clinical data extracted from notes included (i) observations needed to complete NTS (ii) details of any intervention or treatments needed (iii) discharge diagnosis for neonates admitted to NICU Data not available recorded as missing data; excluded if more than 20% of final data set missing Sensitivity & specificity of NTS evaluated, including receiver operating (ROC) curves determining its ability to differentiate between well neonates and those requiring NICU admission and intervention for different score cut-offs.
Outcome measure/endpoint: Admission to PICU used as surrogate marker for severe illness Results Scores calculated for 485 neonates. NTS score area under ROC 0.924 with a threshold score of 2 or more predicting need for admission to NICU with 79.3% sensitivity and 93.5% specificity. Mean NTS significantly higher for neonates in group 1 (2.8 compared with mean 0.35 in group 2, p<.001)
NTS out-performed PEWS, with significantly better sensitivity, particularly in neonates who deteriorated within the first 12 hours after birth (P <.001) or in neonates with sepsis or respiratory symptoms (P <.001). Neonates with a score of 1 should be reviewed and those scoring >=2 should be considered for NICU admission for further management.
Roland et al. (2010)
To categorise observations on newborn infants
Two studies conducted
Derriford hospital is a network neonatal intensive care unit within the Peninsula Neonatal
Retrospective review Pilot NEW observation chart developed, prompts to
Retrospective review Using the NICU admission records the medical notes of
Retrospective review The initial audit identified 122 term infants, 51% of these infants fulfilled

(13/10/2014 Final Version) Page 205
Author; Date; Country; Title
Purpose Design Settings/Participants PEWS Tool Clinical Data Collection Method/Analysis
Outcomes/Results
UK The Newborn Early Warning (NEW) system: development of an at-risk infant intervention system
to formulate prompts for assessment/intervention – the ‘early warning score’. To develop a recording tool for observations to help generate such a score and prompt appropriate action – the Newborn Early Warning (NEW) chart To assess the chart’s effectiveness in clinical practice
Retrospective review of observations on neonatal unit babies to compare key observations with proposed early warning criteria & determine whether assessment would have altered management. Prospective study (over 3mth period) of at-risk babies observed using the NEW chart to determine effectiveness as clinical tool. Follow-up questionnaire for midwives to obtain qualitative data re their view of process.
network with around 4,400 deliveries a year. Babies are looked after on the postnatal wards but can be admitted to a 15 bedded transitional care ward (TCW) with their mothers (900 admissions/year) or NICU if more unwell (450 admissions/year) Retrospective review Using the NICU admission records the medical notes of term infants over 2.5kg who presented to the neonatal unit from either the postnatal wards or the transitional care ward over a two year period were identified. Prospective study 117 ARNI infants - Of 117 only 84 charts available for review (71.2%). Based on an average of 4,600 deliveries per year, approx 10% (468/4600) of deliveries at Derriford hospital result in an ARNI being born. Prospective study Babies excluded if admitted directly to NICU/TCW or fulfilled automatic admission criteria such as <37 weeks gestation or < 2.5kgs.
aid identification of ARNIs; permits recording of observed physiological variables using symbols, highlighting values of concern. Physiological observations: temperature, pulse, respiratory rate, infant’s work of breathing / conscious level Observation values classified: red (significantly abnormal), amber (abnormal), green (normal) Values used were an amalgam of those found in standard neonatal textbooks selected to ensure chart scales were not unwieldy. Prospective study Retrospective review results used to inform educational programme (presentations & written material). Aimed at maternity unit clinical staff. Designed to raise awareness of NEW programme, familiarise staff with NEW chart & structure of the proposed study.
term infants over 2.5kg presented to the neonatal unit from postnatal wards/transitional care ward over a 2-year period were identified Notes examined for - demographic data, whether infant had been correctly identified as an ARNI (at risk newborn infant) at birth & if observations were recorded. Pilot NEW observation chart developed (see column to left on intervention) Clinical observations of ARNIs plotted on NEW chart to gauge whether pre-identified trigger criteria would have prompted earlier medical review. Prospective study NEW chart patient observed & recorded every 4hrs or more frequently Intervention definition: defined as infant receiving an investigation (blood test or CXR), treatment (antibiotics) or transfer to another care environment. Questionnaire to midwives to obtain qualitative data on their thoughts on the process
ARNI criteria. Eighty-four per cent were correctly identified as such. Only 48% (25/52) of those infants recognised as being ARNIs had observations recorded, but half would have been reviewed earlier (13/25) by a neonatal doctor or nurse practitioner if their observations had been charted on the NEW chart. Of the babies admitted not classified as ARNIs, few had observations recorded (5/55 – 8%). This audit was of infants admitted to the NICU and does not contain data on those infants who were safely discharged home. Based on this data the decision to conduct a prospective study was made. Prospective study Increase in retrievable observations from 48% in the retrospective audit to 72% in the prospective audit. NEW chart threshold criteria prompted management decisions in nine (47.3%) of 19 infants who required intervention. Survey of midwives found: Chart was considered beneficial by a majority of midwives; comments incl chart increased awareness of normal parameters for a newborn. 50% responded chart overcomplicated; different style might be easier to interpret.

(13/10/2014 Final Version) Page 206
APPENDIX 22
Data Extraction
Detection systems for identification of clinical deterioration in paediatric emergency departments

(13/10/2014 Final Version) Page 207
Data Extraction - Detection systems for identifying clinical deterioration in paediatric emergency departments Author; Date; Country; Title
Purpose Design Settings/Participants PEWS Tool Clinical Data Collection Method/Analysis
Outcomes/Results
Bradman and Maconochie (2008) UK Can paediatric early warning score be used as a triage tool in paediatric accident and emergency?
To identify if PEWS score can be used in population of undifferentiated illness as a triage tool to detect patients who need hospital admission or who could be discharged home
Audit Setting: St Marys Hospital London Paediatric emergency department N=734 attended A&E; 316 sent home; 458 remained; 424 (93%) included in study Excluded = incomplete observation documentation preventing PEWS calculation Patients (n=424) who visited paediatric A&E between Oct 1-16th 2006 Age: Children 0-16 years
Brighton Pews Education: Staff taught to use PEWS prior to study
PEWS scores collated after study period. After 2 week study period all child notes audited; PEWS calculated and decision to admit or discharge home noted Sticker attached to front of patients notes during study period; prompted staff to document conscious level, heart rate, capillary refill time, respiratory rate, signs of respiratory distress.
PEWS score of >= 4;sensitivity of 24%, specificity of 96% PEWS score of >=2; sensitivity of 37%, specificity of 88% Low PEWS score with a high specificity (aka patient scoring 0-2 is unlikely to need admission) Score low sensitivity therefore limited value in predicting need for admission PEWS is of limited value in predicting admission in triage setting in a population of undifferentiated disease
Breslin et al. (2014) USA Pediatric Early Warning Score at Time if Emergency Department Disposition is Associated with Level of Care
To determine the association between the Pediatric Early Warning Score (PEWS) at time of emergency department (ED) disposition and level of care Hypothesis Higher PEWS at time of ED disposition decision is associated with need for higher levels of care (discharges, ACU, ICU) at ED disposition
Prospective observational study
Setting: Emergency department of urban tertiary care children’s hospital Convenience sample of 383 patients; 239 discharged (62%); 126 admitted to acute care (33%); 18 admitted to ICU (5%) Age: 0-21yrs
Brighton PEWS Parameters behaviour, cardiovascular and respiratory with score range 1-3 and additional scores for vomiting and clinical nebulisation requirement
PEWS score data obtained at time of ED disposition and disposition decision collated from electronic medical record Additional information collected from electronic data records. Demographic data obtained. ST obtained vital signs and physical exam findings to calculate PEWS Changes with 12-24hrs of ED checkout noted.
Outcome measure: Admission to hospital PEWS scores ranged from 0-9 with 272 (71%) scoring 0 or 1 Score 0-5 among discharged patients; 0-7 among those admitted to ACU and 0-9 for those admitted to ICU PEWS score of 1 or more = maximum discriminant ability for admission (sensitivity 63%; specificity 68%) PEWS score of 3 or more = maximum discriminant ability for ICU admission (sensitivity 56%; specificity 72%) Respiratory patients (n=97): AUC 0.80 (95% CI, 0.71-0.88) compared to AUC of 0.63 for all other sample patients (P=0.0002) PEWS of >=3 had maximum discriminant ability to distinguish

(13/10/2014 Final Version) Page 208
Author; Date; Country; Title
Purpose Design Settings/Participants PEWS Tool Clinical Data Collection Method/Analysis
Outcomes/Results
admission from discharge with sensitivity 60% specificity 83%
Egdell et al. (2008) UK The PAWS score: validation of an early warning scoring system for the initial assessment of children in the emergency department
To design and validate a physiology-based scoring system for assessment of children attending emergency department (ED) in need of urgent medical assessment and appropriate intervention
Retrospective pilot evaluation to validate PAWS
Setting: James Cook University Hospital, Middlesbrough Emergency Department Age: Children 0–16yrs Case (n=46) children who required admission directly from the ED to the paediatric intensive care unit (PICU) Male (n=26) Female (n=20) Mean age (n=5.5) Control (n=49) admitted from the ED to the general paediatric ward Male (n=24) Female (n=25) Mean age (n=5.9) Note: 50 patients in each group initially, cards were missing for one of the ward patients and four of the PICU patients, leaving 49 and 46 in the two groups.
Designed a Paediatric Advanced Warning Score (PAWS) Chart Chart uses physiological parameters (respiratory rate, work of breathing, oxygen saturation, temperature, capillary refill, heart rate and conscious level) and age-related differences between normal values. Each parameter, increasing deviation from the normal given greater score. Scores for all parameters cumulated to produce a single numerical value. More abnormal the physiological parameters recorded, the higher the PAWS score obtained. Chart normal values taken from the Advanced Paediatric Life Support (APLS) guidelines.
ED cards for both groups obtained. PAWS scores calculated, based on data recorded at presentation to the ED. Missing values assumed to be normal. PAWS scores compared between two groups to see if PAWS chart would be able to identify those children in need of admission to a critical care area.
Outcome measures/endpoint: Admission to intensive care facility (surrogate marker for severe illness) Results: PAWS score range for patients admitted to PICU 0–16 compared with 0–6 in the patients admitted to general paediatric ward. The mean and median PAWS scores in the patients admitted to PICU were higher than in group admitted to general paediatric ward. PAWS score could discriminate between cases and controls, with an area under the ROC curve of 0.86 (p,0.0001). The curve suggests using 3 or 4 as the trigger score. At threshold trigger score of 3 PAWS able to identify children requiring admission to PICU with sensitivity 70% and specificity 90%.
Seiger et al. (2013) Netherlands Validity of different pediatric early warning scores
To compare validity of different PEWS to predict ICU admission or hospitalization in a large population of children visiting
Prospective cohort study
Setting: Erasmus MC - Sophia Children’s Hospital, Rotterdam, Netherlands Participants: All children aged <16 years who presented to ED
10 different versions of PEWS were evaluated; 6 scoring (different parameters cumulated to 1 numeric value which depending on cut-off level determines patients risk of clinical deterioration) and 4 triggering (considered at risk if one parameter is positive)
Different PEWS based on patients’ age and vital sign values (heart rate, respiratory rate, oxygen saturation, blood pressure, temperature, and level of consciousness) prospectively collected during triage assessment by ED nurses specialised in paediatric and
Outcomes: ICU admission and admission to hospital chosen as proxy for acuity because a gold standard for acuity does not exist. Results: For all PEWS, the optimal cut-off levels set at 1, bar two (Duncan et al and

(13/10/2014 Final Version) Page 209
Author; Date; Country; Title
Purpose Design Settings/Participants PEWS Tool Clinical Data Collection Method/Analysis
Outcomes/Results
in the emergency department
the paediatric ED.
n= 17,943 16% (n=2828) admitted to hospital and 2% (n=373) admitted to ICU or died in ED Female n=7399 Median age 4.2
Monaghan (Original Scoring 0-9) Akre et al (Derived from Monaghan Scoring 0-9) Skaletzky et al (Derived from Monaghan Scoring 0-9) Duncan et al (Original Scoring 0-23) Parshuram et al (Derived from Duncan et al Scoring 0-26) Egdell et al (Original Scoring 0-21) Tibballs et al (Original Triggering) Edwards et al. (Derived from Tibballs Triggering) Haines et al. (Derived from Tibballs Triggering) Brilli et al. (Original Triggering)
emergency care Study used data collected for an ongoing study on the validity of the Manchester Triage System (MTS) in paediatric patients Missing data were replaced by a value drawn from an estimate of distribution of variance to create a complete database (used a multiple imputation model) A numeric score was calculated for the different scoring systems and a binary score for the triggering systems. The validity of the PEWS was expressed by areas under ROC curves, sensitivity, specificity, and positive and negative likelihood ratios for ICU admission and admission to hospital. To calculate sensitivity, specificity, and likelihood ratios, the numeric scores of scoring systems had to be dichotomized at the most optimal cut-off level of the ROC curves.
Parshuram et al) for which the cut-off levels were 3 for ICU admission and 2 for hospital admission Sensitivity and specificity of PEWS at the optimal cut off levels varied widely. ICU admission: sensitivity of varied PEWS ranged from 61.3% to 94.4% and specificity ranged from 25.2% to 86.7%. Hospitalization: sensitivity ranged from 36.4% to 85.7% and specificity ranged from 27.1% to 90.5%. None of the PEWS showed both a high sensitivity and a high specificity The discriminative ability of the PEWS (area under the ROC curve) were moderate to good for ICU admission (range: 0.60-0.82); poor to moderate for admission to the hospital (range: 0.56- 0.68). Scoring systems with parameters leading to numeric value better able to identify patients at risk than triggering systems which need 1 positive parameter. The characteristics of the different scoring systems were not statistically significant...

(13/10/2014 Final Version) Page 210
APPENDIX 23
Data Extraction
Response systems for timely response to child clinical deterioration

(13/10/2014 Final Version) Page 211
Data Extraction - Response systems for timely response to child clinical deterioration
Author; Date; Country; Title
Purpose Design Settings/Participants Intervention Clinical Data Collection Method/Analysis
Outcomes/Results
Avent et al. (2010) USA Successful use of a rapid response team in the pediatric oncology outpatient setting
To describe the successful use of the hospitals RRT in the management of a severely septic patient who came to the outpatient clinic
Case Report St Jude’s Children’s Research Hospital, Memphis Tennessee 60-bed tertiary care pediatric hospital specialising in care of pediatric haematology/oncology patients Outpatients
Pediatric Rapid Response Team RRT implemented in June 2006 Composition of team Consists of an intensive care registered nurse, a registered respiratory therapist and a clinical nursing coordinator. Availability The team available 24 hours a day 7 days a week can be activated by any staff member for changes in clinical condition or a worrisome clinical status Process of activation Team is activated by placing a call to hospital operator Calling criteria Activation criteria include (1) my patient is having haemodynamic changes (2) my patient is having respiratory changes (3) my patient is having cardiac changes (4) my patient is having perfusion changes (5) something is going on and I am not sure what it is. I want someone else to look at my patient Subjective criteria with no specific values Available to both in-patient and out-patient clinic areas
Team time to arrival RRT contacted at 12.52 for patient hypotension and haemodynamic instability arrived at 12.55 Team interventions RRT members, oxygen, bolus fluid (fluid resuscitation) and dopamine infusions (vasoactive medication) Time to transfer to ICU Team and intensivist prepared patient for transport to ICU; patient transferred at 13.38
Benefit of RRT is ability to obtain further clinical evaluation quickly – earlier intervention improve outcomes Reduced time to interventions Faster transport time to higher levels of care (case patient transferred to ICU within 40 minutes of RRT activation) Since Nov 2007 RRT managed 16 patients in outpatient clinics; 10 of these resulted in patient transfers to ICU; 5 of 16 were admitted to inpatient setting; one patient sent home. In 16 patients cardiovascular instability accounted for 63% of RRT calls. Average length of stay for 10 patients transferred to ICU was 1.5 days. None of patient required mechanical ventilation
Bonafide et al. (2014)
To evaluate the impact of pediatric rapid
Quasi-experimental study
Setting: Children’s Hospital of Philadelphia is an urban,
Hospital-wide rapid response system inclusive of a medical emergency team and an early
Electronic Healthcare Record used to identify transfers from areas which have access to the
Number of transfers During 59-month study period, 1810 unplanned transfers from wards to

(13/10/2014 Final Version) Page 212
Author; Date; Country; Title
Purpose Design Settings/Participants Intervention Clinical Data Collection Method/Analysis
Outcomes/Results
USA Impact of Rapid Response System Implementation on Critical Deterioration Events in Children
response system implementation inclusive of a medical emergency team and an early warning score on critical deterioration, a proximate outcome defined as unplanned transfer to the intensive care unit with non-invasive or invasive mechanical ventilation or vasopressor infusion in the 12 hours after transfer
Interrupted time series analysis Retrospective analysis of charts
tertiary care children’s hospital with 516 beds, including a 55-bed pediatric ICU, an 83-bed neonatal ICU, and a 24-bed cardiac ICU. Evaluation of 1810 unplanned transfers from medical and surgical wards to paediatric and neonatal intensive care units that occurred during 370,504 non intensive care patient days between July 1, 2007, and May 31, 2012. (01/07/07-28/02/07 pre implementation period 01/03/10-31/05/12 post implementation period ) Age Not stated
warning score introduced in February 2010 RRS that served all acute care wards except the cardiology, tracheostomy-ventilator, and obstetric units and the ICUs Calling criteria for activation of MET EWS based on Parshuram and colleagues’ Bedside Pediatric Early Warning System with corresponding escalation guidelines Composition of team 3 responding pediatric ICU clinicians; (1) a fellow, attending, or nurse practitioner, (2) a nurse and (3) a respiratory therapist MET service availability 30-minute response MET available 24 hours per day, 7 days per week. Who could activate? MET could be activated by any clinician for any clinical concern, regardless of the EWS
MET to PICU For the transfers categorized as unplanned (unplanned transfer to ICU), we reviewed ICU flow sheets for the 12 hours after transfer and recorded the time from ICU arrival to life-sustaining interventions, including initiation of non-invasive ventilation (continuous or bi-level positive airway pressure), invasive mechanical ventilation via endotracheal tube or tracheostomy, and vasopressor infusion (ie, dopamine, dobutamine, epinephrine, norepinephrine, phenylephrine, isoproterenol, or milrinone). We classified events requiring any of these interventions in the first 12 hours after ICU transfer as CD (critical deterioration). In addition, any patients who died during an emergency response on the ward before they could be transferred to the ICU experienced CD (critical deterioration). Clinical Deterioration (CD) metric (defined as unplanned t/f to ICU +- mechanical ventilation vasopressor infusion in the 12 hours after transfer) Frequencies of code blue calls, MET calls, respiratory arrests, cardiac arrests, and deaths occurring on general medical and surgical wards obtained from the hospital’s Resuscitation Committee database
pediatric and neonatal ICUs and 370 504 non-ICU patient-days. MET utilisation Code blue Pre-implementation period 102 code blue activations (0.53 per 1000 non-ICU patient-days); Post-implementation period 115 code blue team activations (0.65 per 1000 non-ICU patient-days) (P = .15for the pre- vs post-implementation difference) MET activations 1534 MET activations (8.61 per 1000 non-ICU patient-days), for a combined utilization rate of 9.26 per 1000 non-ICU patient days or 24.41 per 1000 all-hospital admissions. Traditional Clinical Outcomes No statistical significant reductions in unadjusted rates of ward cardiac arrests and deaths during ward emergencies after RRS implementation No significant differences in rates of respiratory arrests on the wards or mortality prior to discharge among those patients transferred to the ICU between the pre- and post-implementation periods Absolute reductions in ward cardiac arrests (from 0.03 to 0.01 per 1000 non–intensive care patient-days) and deaths during ward emergencies (from 0.01 to 0.00 per 1000 non–intensive care patient-days), but these were not statistically significant (P = .21 and P = .99, respectively). ICU Transfers In unadjusted analysis, rate of unplanned transfers to ICU was significantly higher in the post-implementation period than in the pre-implementation period

(13/10/2014 Final Version) Page 213
Author; Date; Country; Title
Purpose Design Settings/Participants Intervention Clinical Data Collection Method/Analysis
Outcomes/Results
Obtained the Pediatric Risk of Mortality III score at 12 hours from the hospital’s Critical Care Center for Evidence and Outcomes database.
In adjusted interrupted time series model, RRS implementation was not associated with a change in the transfer rate trajectory and had no net difference in the transfer rate relative to the pre-intervention trend CD Events In unadjusted analysis, RRS implementation was not associated with a significant difference in the rate of CD In the adjusted interrupted time series model, RRS implementation was associated with a significant downward change in the CD rate trajectory and a net reduction in events by 62% relative to the pre-intervention trend (IRR = 0.38; 95% CI, 0.20-0.75) Mechanical Ventilation In unadjusted analysis, RRS implementation not associated with significant differences in mechanical ventilation use following transfer to ICU In the adjusted interrupted time series model, RRS implementation was associated with a significant downward change in the trajectory of mechanical ventilation use in the 12 hours following transfer to the ICU and a net reduction in events by 83% relative to the pre-intervention trend (IRR = 0.17; 95%CI, 0.07-0.44) Vasopressors In unadjusted analysis, RRS implementation was associated with a reduction in the proportion of unplanned transfers requiring vasopressors in the first 1 hour following transfer but not in the first 12 hours Of the patients with unplanned transfers who required vasopressors in the first 12 hours following ICU transfer,

(13/10/2014 Final Version) Page 214
Author; Date; Country; Title
Purpose Design Settings/Participants Intervention Clinical Data Collection Method/Analysis
Outcomes/Results
significantly fewer required them in the first 1 hour after transfer In the adjusted interrupted time series model, RRS implementation was associated with a significant downward change in the trajectory of vasopressor use in the 12 hours following transfer to the ICU and a net reduction in events by 80% relative to the pre-intervention trend (IRR = 0.20; 95%CI, 0.06-0.62) Time to Life-Sustaining Interventions Implementation of the RRS was associated with a longer interval from ICU arrival to vasopressor administration or mechanical ventilation. This finding existed among all patients transferred to the ICU (hazard ratio = 0.79; 95% CI, 0.63-0.995; P = .046), primarily because fewer transferred patients required these life-sustaining interventions in the first 12 ICU hours. This finding persisted when the sample was restricted to patients who did require vasopressor administration or mechanical ventilation in the first 12 ICU hours. In this case, after RRS implementation, we found that fewer patients required these interventions emergently as evidenced by the more gradual initial slope of the post-implementation Kaplan-Meier failure plot over the first 4 ICU hours (hazard ratio = 0.72; 95% CI, 0.55-0.93; P = .01) Additional Validation of CD Metric Among all 1681 admissions during the pre- and post-implementation periods with unplanned transfer to the ICU, we found that CD during the admission was associated with a 4.97-fold increased risk of death (95% CI, 3.33-7.40; P < .001)

(13/10/2014 Final Version) Page 215
Author; Date; Country; Title
Purpose Design Settings/Participants Intervention Clinical Data Collection Method/Analysis
Outcomes/Results
Bonafide et al.
(2012)
USA
Development
of a Pragmatic
Measure for Evaluating and
Optimizing
Rapid Response
Systems
To develop
a valid, pragmatic measure for
evaluating and
optimizing RRSs over shorter
periods of time.
Retrospective
cohort study
.
The Children’s Hospital of
Philadelphia (CHOP); urban, tertiary care
paediatric hospital; 473
beds, of which 75 are neonatal, 55 paediatric, 26
cardiac intensive care.
Implemented RRS on all non-ICU
medical and surgical units except the cardiology step-down,
tracheostomy ventilator &
obstetric units.
RRS consisted of: (1)
identification component incl. early warning score with
corresponding care guidelines,
and (2) response component with 30-minute response MET
available 24hrs/ 7day wk.
Informal ICU “curb-side”
consultation eliminated
Immediate-response code-blue
team( CBT) remained in place
Reviewed each MET and CBT
activation in the 1-year period after implementation (724 medical
emergency team and 56 code-blue
team activations)
MET activations logged on
paper forms by the responding nurse; later entered into a database
by researcher; CBT activations
verified by reviewing CBT messages sent via the pager system
and logged directly into a database
by the paediatric ICU clinical nurse specialist.
Patient charts: Patient and event characteristics noted; the outcome
of the activation, and discharge
disposition
ICU patients: reviewed flows
sheets for 12hrs Post transfer; recorded the
time from ICU arrival to life-sustaining interventions (initiation
of continuous or bilevel positive
airway pressure, tracheal intubation, and vasopressor
infusion administration)
Outcomes measures:
Defined events resulting in ICU transfer and non-invasive ventilation, intubation,
or vasopressor infusion within 12 hours as
“critical deterioration.”
780 combined MET& CBT activations for
525 patients & 596 admissions over a total of 79 428 non-ICU patient-days and 28
015 all hospital admissions (9.8
activations per 1000 non-ICU patient-days, 27.8 activations per 1000 hospital
admissions.
Of the 724 MET activations, 272 (37.6%)
resulted in transfer to the ICU, compared
with 44 of 56 (78.6%) CBT responses (P < .001). Of the total 780 activations,
121 (15.5%) met our definition of critical
deterioration (requiring life-sustaining ICU interventions in the first 12 hours
afterward-to-ICU transfer).
Rate of critical deterioration
1.52 per 1000 non-ICU patient-days, more than eightfold more common than
CHOP’s CHCA Codes Outside the ICU
rate
Sensitivity of
CHCA measure was 20.0% (95% CI: 6.8– 40.7), the specificity was 98.8% (95%
CI:97.4–99.5), the positive predictive
value = 41.7% (95% CI: 15.2–72.3), negative predictive value = 96.5%
(95% CI: 94.7–97.9).
Criterion validity found that the
relative risk of death was 12.0 (95% CI:
5.4–26.6).
11 admissions with code blue; median
time to intervention was 0minutes (most interventions were started en route to the
ICU or immediately on arrival);
interquartile range 0 to 15 minutes.

(13/10/2014 Final Version) Page 216
Author; Date; Country; Title
Purpose Design Settings/Participants Intervention Clinical Data Collection Method/Analysis
Outcomes/Results
Of the 103 admissions not meeting CHCA code blue criteria but meeting critical
deterioration criteria, median time to
intervention 45 min (interquartile range 15-170 minutes (P < .001).)
Brilli et al. (2007) USA Implementation of a medical emergency team in a large pediatric teaching hospital prevents respiratory and cardiopulmonary arrests outside the intensive care unit
Implement MET; Evaluate effectiveness of MET; Development of a ‘trigger tool’ (like PEWS) To reduce the rate of codes (respiratory and cardiopulmonary arrests) outside the intensive care units by 50% for >6 months following MET implementation
Performance improvement project Retrospective chart review Staff performance assessment survey
Free standing children’s hospital Hospital medical chart records (n=44) Pre-MET period 15 months (Oct 2003 - Jan 2005 Implementation and education period 4 months (Feb-May 2005) Post MET period 8 months (June 2005-Jan 2006) N=44 patients who had respiratory or cardiac arrest (codes) (2001-2004) (non-ICU patients) ‘Preventable’ codes = n=25 ‘Non preventable’ codes – n=19 “codes not preventable by MET” included a) pulmonary embolus; b) new seizures; c) sudden plugged or occluded tracheotomy tube; d) code by an adult visitor; e) code occurring during general anaesthesia administered outside the operating room (i.e., radiology
Development and Implementation of the MET Multidisciplinary group convened; consisted of bedside nurses, respiratory therapists, physicians (residents, fellows, faculty), and nursing managers from the general care floors and PICU. Group charged with a) identifying clinical triggers to activate MET; b) identifying MET membership; c) implementing MET throughout hospital; and d) establishing outcome measures, including team performance. MET introduced on pilot units over 4-month time period MET defined as experienced clinicians dispatched to evaluate and triage patients who were perceived as having a declining clinical status Two-tiered hospital system response to clinical patient deterioration – first-tier response continue as code alert team & new second-tier response, MET, would be an added in-hospital response to assess clinically deteriorating patients MET functions included assessment, stabilization if
Retrospective review of medical records All MET activations were official medical consults, and the completed consult form served as both medical record documentation of MET activity and data collection tool Outcomes measured: Code rates (per 1,000 hospital non-ICU patient days and per 1,000 non-ICU hospital admissions) All code event records were reviewed; each code event was categorized as MET preventable, MET not preventable, or MET not preventable but preventable by other means. Final patient disposition (death or hospital discharge) was recorded for all outside the ICU codes for each study time period. For all MET consults, triage disposition (remain on general care unit or transfer to ICU) and final disposition (death or discharge) were recorded. Mortality rates were adjusted to 1,000 non-ICU patient days and 1,000 non-ICU admissions.
Pre-MET implementation data were examined to determine activation criteria for the MET After examination of 1,024 combinations of pre-arrest variables from prior codes, no set of variables was sensitive or specific enough for use as MET activation triggers. The planning group combined expert consensus and the retrospective chart analysis to determine the MET activation criteria Comparative data for cardiopulmonary arrests occurring outside the intensive care unit (ICU): Before and after the medical emergency team (MET) Patient days @ baseline; n=92,188 and post-MET n=52,494 Non-ICU hospital admits @ baseline n=16,255 and post-MET n=8,419 No. of non-ICU cardiopulmonary arrests @ baseline n=9 and post-MET n=2 Rate per 1,000 hospital days @ baseline 0.10 and post-MET; p =.11 Rate per 1,000 admissions @ baseline 0.56 and post-MET 0.24; p = .14 Deaths @ baseline n=7 and post-MET n=2 Mortality per 1,000 hospital days @ baseline 0.08 and post-MET 0.04; p = .19 Mortality per 1,000 non-ICU admits @ baseline 0.43 and post-MET 0.24; p = .23 Definition Cardiopulmonary arrest refers to (apnea + asystole) or (apnea + nonperfusing heart rhythm) Number of codes

(13/10/2014 Final Version) Page 217
Author; Date; Country; Title
Purpose Design Settings/Participants Intervention Clinical Data Collection Method/Analysis
Outcomes/Results
suite); f) code resulting from an acute drug overdose; and g) code in our ambulatory clinics Staff Survey Distributed to 215 staff involved in the 27 MET consults; n=88 of 215 performance assessment surveys completed (response rate 41%)
necessary, and triage of general care floor patients to the most appropriate unit in the hospital Composition of team A PICU fellow, PICU nurse, senior pediatric resident, respiratory therapist, and the manager of patient services (in-hospital nursing supervisor in charge of general floor patient placement) MET joined at bedside by general care unit staff including nurse and physicians caring for the patient and the family Activation process MET activated via pagers after calling a single phone number Service MET team would arrive within 15mins after activation Calling/activation criteria 1. Increased work of breathing and any of the following: Worsening retractions; Saturaions > 90% despite supplemental oxygen; Cyanosis 2. Agitation or decreased level of consciousness 3. Staff concern or worry about the patient 4. Parental concern about the child Education Education about the new team took place over a 4-month implementation and education period and included presentations at nursing shift changes, nursing leadership and
Survey Simple survey tool developed to assess team performance and staff satisfaction The surveys were available on the hospital intranet.
25 codes during pre-MET baseline compared with 6 post MET implementation Code rates Post-MET code rate significantly lower compared with baseline Code rate (respiratory arrests + cardiopulmonary arrests) post-MET was 0.11 per 1,000 patient days compared with baseline of 0.27 (risk ratio, 0.42; 95% confidence interval, 0–0.89; p= .03). Code rate per 1,000 admissions decreased from 1.54 (baseline) to 0.62 (post-MET) (risk ratio, 0.41; 95% confidence interval, 0–0.86; p= .02) MET-preventable codes, code rate post-MET was 0.04 per 1,000 patient days compared with a baseline of 0.14 (risk ratio, 0.27; 95% confidence interval, 0–0.94; p = .04). No difference in incidence of cardiopulmonary arrests before and after MET Code rates in the ICUs and mean hospital length of stay (LOS) did not change during the periods of this study. During the pre-MET period, the ICU code rate was 5.1 codes per 1,000 ICU days (61 codes per 12,098 days) compared with 6.6 codes per 1,000 ICU days (63 codes per 9,526 days) during the post-MET period (p = .13). Mean hospital LOS was 5.8 days during the baseline period and 5.9 days during the post-MET period (p = not significant) Mortality rate For codes outside the intensive care

(13/10/2014 Final Version) Page 218
Author; Date; Country; Title
Purpose Design Settings/Participants Intervention Clinical Data Collection Method/Analysis
Outcomes/Results
shared governance meetings, physician divisional and faculty meetings, and resident conferences. Education was supplemented with posters, phone stickers, and resource hand outs for all involved units. The posters and hand outs included the team purpose, goals, function, and team membership; information about when to call (triggers); number to call; and instructions about how to give feedback.
unit, the pre-MET mortality rate was 0.12 per 1,000 days compared with 0.06 post-MET (risk ratio, 0.48; 95% confidence interval, 0–1.4, p = .13). The overall mortality rate for outside the intensive care unit codes was 42% (15 of 36 patients) MET activations MET activated 27 times during 12 months study period. Number of MET consults nearly equal across all general care units. Most frequent trigger to activate MET was staff concern about the patient Most frequent physiologic disturbance cited for activating the MET was increased work of breathing ICU transfers After MET consult, 13 patients remained on the general care floor and 13 were transferred to the ICU. One patient developed increased respiratory depression several hours after the MET consult decision was to keep the child on the general care unit. The child was transferred to the PICU without further incident. All but two patients for whom a MET consult was obtained were discharged home. One patient with urosepsis was transferred to the PICU after MET consult and died 3 wks later in the PICU. The other patient transferred to the PICU for hemodynamic instability (probable sepsis) died 5 months later in the PICU
Survey More than 85% of general care unit staff respondents reported satisfaction with MET consult team interaction—they felt included in the decision-making process
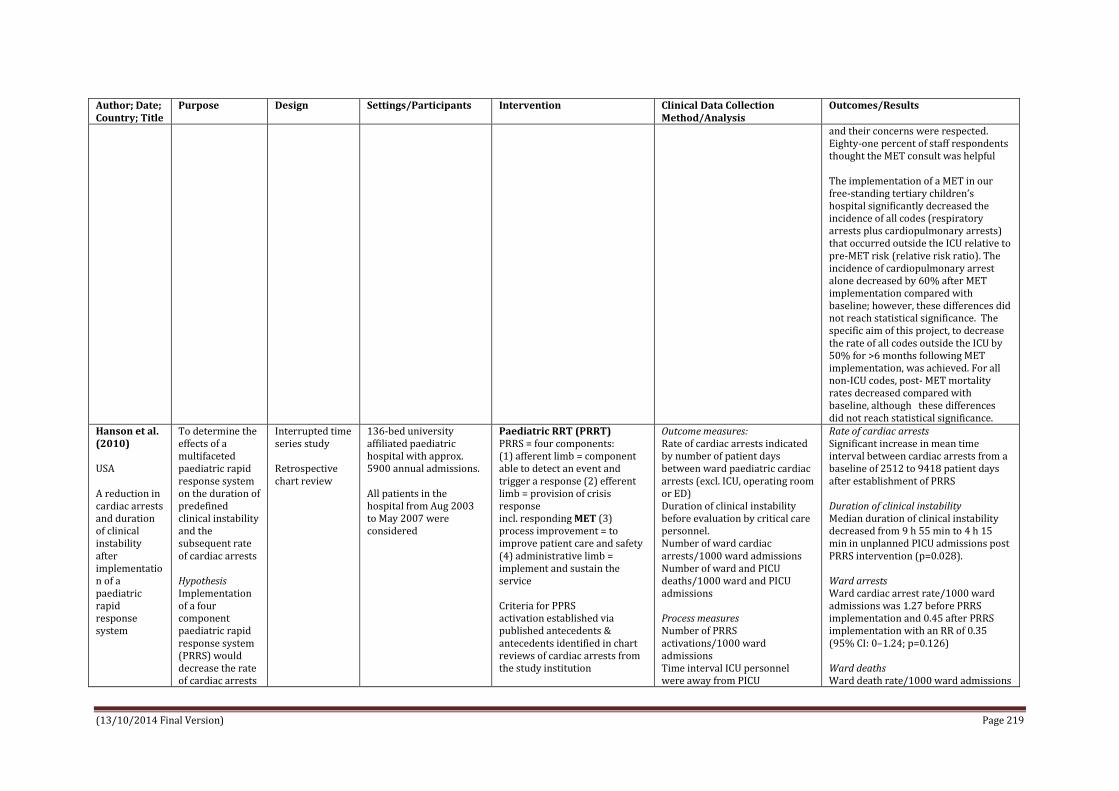
(13/10/2014 Final Version) Page 219
Author; Date; Country; Title
Purpose Design Settings/Participants Intervention Clinical Data Collection Method/Analysis
Outcomes/Results
and their concerns were respected. Eighty-one percent of staff respondents thought the MET consult was helpful The implementation of a MET in our free-standing tertiary children’s hospital significantly decreased the incidence of all codes (respiratory arrests plus cardiopulmonary arrests) that occurred outside the ICU relative to pre-MET risk (relative risk ratio). The incidence of cardiopulmonary arrest alone decreased by 60% after MET implementation compared with baseline; however, these differences did not reach statistical significance. The specific aim of this project, to decrease the rate of all codes outside the ICU by 50% for >6 months following MET implementation, was achieved. For all non-ICU codes, post- MET mortality rates decreased compared with baseline, although these differences did not reach statistical significance.
Hanson et al. (2010) USA A reduction in cardiac arrests and duration of clinical instability after implementation of a paediatric rapid response system
To determine the effects of a multifaceted paediatric rapid response system on the duration of predefined clinical instability and the subsequent rate of cardiac arrests Hypothesis Implementation of a four component paediatric rapid response system (PRRS) would decrease the rate of cardiac arrests
Interrupted time series study Retrospective chart review
136-bed university affiliated paediatric hospital with approx. 5900 annual admissions. All patients in the hospital from Aug 2003 to May 2007 were considered
Paediatric RRT (PRRT) PRRS = four components: (1) afferent limb = component able to detect an event and trigger a response (2) efferent limb = provision of crisis response incl. responding MET (3) process improvement = to improve patient care and safety (4) administrative limb = implement and sustain the service Criteria for PPRS activation established via published antecedents & antecedents identified in chart reviews of cardiac arrests from the study institution
Outcome measures: Rate of cardiac arrests indicated by number of patient days between ward paediatric cardiac arrests (excl. ICU, operating room or ED) Duration of clinical instability before evaluation by critical care personnel. Number of ward cardiac arrests/1000 ward admissions Number of ward and PICU deaths/1000 ward and PICU admissions Process measures Number of PRRS activations/1000 ward admissions Time interval ICU personnel were away from PICU
Rate of cardiac arrests Significant increase in mean time interval between cardiac arrests from a baseline of 2512 to 9418 patient days after establishment of PRRS Duration of clinical instability Median duration of clinical instability decreased from 9 h 55 min to 4 h 15 min in unplanned PICU admissions post PRRS intervention (p=0.028). Ward arrests Ward cardiac arrest rate/1000 ward admissions was 1.27 before PRRS implementation and 0.45 after PRRS implementation with an RR of 0.35 (95% CI: 0–1.24; p=0.126) Ward deaths Ward death rate/1000 ward admissions

(13/10/2014 Final Version) Page 220
Author; Date; Country; Title
Purpose Design Settings/Participants Intervention Clinical Data Collection Method/Analysis
Outcomes/Results
and the duration of clinical instability before critical care personnel evaluation
Calling criteria not reported Activation criteria were displayed in poster format throughout the hospital. MET composition Paediatric critical care fellow, resident, critical care nurse and respiratory therapist. MET competencies: (1) ability to prescribe therapy; (2) advanced airway management; (3) capability to establish central venous access; and (4) ability to begin ICU care at the bedside Upon arrival MET provided medical evaluation and treatment as required. A PRRS data collection form was completed by MET and collected by the investigators.
(ward defined as any patient area excluding any ICU, operating room or emergency department) Two independent physicians conducted retrospective review of patient charts for which the PRRS was activated during 12mths post implementation. Total of 68 PRRS activations but only 59 charts available for review. Also, 42 of 126 unplanned PICU admissions that occurred during the 12-month period before PRRS and 41 of 128 unplanned PICU admissions from the 12-month period after PRRS were randomly selected for review. The unplanned PICU admissions reviewed did not include cardiac arrests, respiratory arrests or PRRS activations. All charts were reviewed to evaluate the type of event and presence and duration of documented clinical instability during the 24 h before the event. Events were classified as unplanned PICU admissions, PRRS activations, cardiac arrests or respiratory arrests. To determine duration of clinical instability, documented antecedents were recorded if they met the predefined criteria Antecedents Acute change in vital signs outside normal range for patient age (according to reference tables in the Harriet Lane Handbook and Pediatric
was 1.5 before PRRS implementation and 0.45 after PRRS implementation with an RR of 0.30 (95% CI: 0–1.04; p=0.070) Antecedents were found by both reviewers in 38 of 59 PRRS activations, 33 of 42 unplanned PICU admissions (before implementation of the PRRS) and 31 of 41 unplanned PICU admissions (after implementation of the PRRS). There was no significant difference in the number of unplanned PICU admissions, hospital admissions or paediatric cardiac surgery cases in the study periods. Time interval from documented clinical instability to ICU assessment In the evaluation of unplanned PICU admissions the median time interval was determined by the amount of time from first documented antecedent to ICU assessment. This time interval decreased from 9 h 55 min before PRRS implementation to 4 h 15 min after PRRS implementation (p=0.028). For PRRS activations the median time interval from first documented antecedent until ICU assessment was 3 h 21 min. Time away from ICU The median duration of MET assessment, or time away from the ICU was 19 min. Number of PRRT activations The median number of PRRS activations was 14/1000 ward admissions. The duration of clinical instability significantly decreased for unplanned PICU admissions whether or not assessed

(13/10/2014 Final Version) Page 221
Author; Date; Country; Title
Purpose Design Settings/Participants Intervention Clinical Data Collection Method/Analysis
Outcomes/Results
Resuscitation Card); Change in respiratory pattern; Mental status changes; New desaturation to <90% in patients without cyanotic heart disease or <70% in patients with cyanotic heart disease; Repeated or prolonged seizures; Documented concern or worry about patient’s condition Only antecedents documented with both a time and date were recorded. Mortality and cardiac arrest rates were calculated per 1000 admissions.
by the MET, indicating that implementation of a PRRS resulted in a hospital-wide culture change favouring early critical care personnel assessment. The group with the shortest duration of documented clinical instability was the PRRS activation group It is not clear which components of the PRRS are the most important in preventing cardiac arrests
Haque et al. (2010) Pakistan Experience of Pediatric Rapid Response Team in a Tertiary Care Hospital in Pakistan
To report the before and after implementation of a pediatric rapid response team (RRT) in pediatric wards of a tertiary care hospital in Pakistan to determine effect and outcome of the intervention
Retrospective audit
Aga Khan tertiary care University Hospital with 75 beds in 2 pediatric wards (incl. 17 special care beds and 5 beds in pediatric intensive care units). More than 5000 pediatric patients admissions per annum incl. more than 450 admissions in PICU All pediatric admissions were considered participants Pre-intervention Feb to Nov 2007 (10 months) Post-implementation of intervention Dec 2007 to Aug 2008 (9 months)
Pediatric RRT (Pediatric rapid response team) Calling criteria for activation of RRT Staff is Concerned / Worried Laboured Breathing Acute change in respiratory rate (0-12 months <20 or > 60; 1-14 years < 10 or > 40) Acute drop in O2 sat. <90 % Acute change in systolic BP (0-12 months <70; 1-14 years <90) Acute change in heart rate (0-12 months <80 or > 200; 1-14 years < 60 or > 180) Acute decrease in level of consciousness Convulsion (unvalidated) Composition of team PICU physicians Primary team’s help Record of all RRT calls maintained on a standard form based on SBAR (Situation,
Recorded data included; patients’ demographics diagnoses time of RRT generated reasons for RRT calls critical events (defined as endotracheal intubation, initiation of inotropic infusions or CPR) disposition and outcomes (survival/expiry) Incidence of codes before and after RRT implementation “code” refers to the event of respiratory arrest or cardiorespiratory arrest when there is an immediate medical need in the form of resuscitation
Number of activations 83 calls generated during post-intervention study period of 9-month (21 calls/1000 admissions) Patient profiles Median age of patients 27 months; 39% calls for infants < 12 months Majority of patients under care of medical services (93% vs 7% under care of surgical services) Timing of activations Greater numbers of calls made during 0800-1600 hours (45%) Reasons for RRT activations Respiratory distress or insufficiency most common reason for activation of RRT (53% of calls), followed by neurological derangement (22%), cardiovascular debility (9%) and staff concern (16%) RRT Interventions Most common RRT interventions were basic respiratory support including

(13/10/2014 Final Version) Page 222
Author; Date; Country; Title
Purpose Design Settings/Participants Intervention Clinical Data Collection Method/Analysis
Outcomes/Results
Background, Assessment, and Response) format RRT form was completed by RRT team and was later collected by one investigator RRT service availability 24 hours per day per week to all pediatric patients admitted to the hospital Education: Pediatric clinical staff (nurses & residents) educated re RRT via lectures and case based scenarios. Several instruction sessions were conducted for nurses and physicians one month prior to implementation of RRT - stressed use of activation criteria and importance of early recognition and treatment of critically ill children. These sessions were continued on quarterly basis in ward as part of reinforcement of its mission.
suctioning, oxygen administration and aerosol medications. Critical events were only 2% of all RRT calls and both of them required endotracheal intubation. Because of early interventions, the two third of patients (61%) stayed in Special Care Units. Only fifteen patients (18%) required endotracheal intubation and ventilation support in PICU. Code rate per 1000 admissions outside the PICU decreased from 5.2 (26/4951) (pre-RRT) to 2.7(12/4389) (post-RRT) (p=0.004; odds ratio 0.52; 95% CI 0.12-2.26). Mortality rate of patients admitted in PICU from wards decreased from 50% (23/45) to 15% (5/32) p=0.001; Odd ratio 0.18; 95% CI 0.09-0.35).
Hunt et al. (2008) USA Transition from a Traditional Code Team to a Medical Emergency Team and Categorization of Cardiopulmonary Arrests in a Children’s
To study effect of an intervention on prevention of respiratory arrest & cardiopulmonary arrest (CPA) To characterize ward CPAs by preceding signs and symptoms and initial cardiac rhythm
Before-and-after intervention trial (12 months pre- & 12 months post-intervention)
Johns Hopkins Children’s Medical and Surgical Center (JHCMSC) Tertiary care, academic children’s hospital Admitted patients who subsequently had either the code team or pediatric medical emergency team (PMET) called or who had a respiratory arrest or CPA on the wards Pre-implementation Volume of patients
Pediatric medical emergency team (PMET) Transition from a traditional code team to a PMET that responds to clinically deteriorating children in noncritical care areas Note: Although the literature refers to a physician led team as a medical emergency team, for institutional reasons, our team is called a pediatric rapid response team. To be consistent with the literature, however, in this article, we will refer to our team as a PMET
Primary outcomes: Combined rate of respiratory arrests that required intubation and CPAs that required compressions and/or defibrillation at the JHCMSC (per 1000 patient days and per 1000 patient discharges) Secondary outcomes: Rate of CPAs Rate of respiratory arrests Survival Categorization of all ward CPAs into type based on the kind of CPA and whether or not there were any preceding signs or
Rate of calls to PMET Transition to PMET was associated with an increase in the rate of calls for the team: 1.1 calls per 1000 patient-days, or 6.8 calls per 1000 patient discharges pre-PMET, vs 1.8 calls per 1000 patient days, or 11.9 calls per 1000 patient discharges post- PMET (incidence rate ratio, 1.68; 95% confidence interval, 1.18-2.43). Combined rate of respiratory arrest and CPA Combined rate of respiratory arrests and CPAs on the wards decreased 51% after transition to the PMET, but not

(13/10/2014 Final Version) Page 223
Author; Date; Country; Title
Purpose Design Settings/Participants Intervention Clinical Data Collection Method/Analysis
Outcomes/Results
Center
treated = 48 393 patient-days and 7504 discharges Post-Implementation Volume of patients treated = 49 588 patient-days and 7503 discharges Mean (SD) monthly hospital case mix severity index was similar across the 2 time periods: 2.02 (0.21) vs 2.05 (0.14)
Composition of Team: A pediatric intensive care unit (PICU) fellow A PICU nurse A PICU respiratory therapist A nursing shift coordinator (senior nurse who supervises bed management and triage in JHCMSC) A senior assistant resident A junior assistant resident An intern A pediatric pharmacist A security officer Hospital chaplain Note: deliberately created broad criteria to encourage calls and described categories of illness rather than using specific vital sign parameters, because the wards had children of varying ages and no single set of vital sign parameters would be appropriate
Triggers/Calling criteria: Respiratory distress/compromise Abnormal or worsening respiratory symptoms Decrease in saturations despite first-line interventions Seizures with apnea Progressive lethargy Circulatory compromise/acute shock syndrome Supraventricular tachycardia/other dysrhythmias Acute change in neurologic/mental status Respiratory arrest Cardiac arrest Worried staff
symptoms Data Collection: For the year pre- and post-PMET, the principal investigator and another author recorded all calls to JHCMSC code team and PMET. Calls were captured through 1 of 2 mechanisms: (1) authors carried code pagers so they knew when each call was made and (2) a monthly record of all calls to the code team was maintained by telephone operators. After each call, the PICU fellow, as leader of the PMET, was contacted for a brief summary of the event, which focused on whether the case involved a respiratory arrest that required intubation or a CPA, and issued the required mediation. The time and date of all events were recorded in an electronic database CPAs and respiratory arrests on the wards were noted and confirmed through retrospective chart reviews. Survival data of patients who had a respiratory arrest or CPA was assembled through retrospective examination of electronic medical records. Patient-days and discharge data were obtained through the JHCMSC administrative database. Analysis of severity of illness
significantly: 0.33 arrests per 1000 patient-days and 2.1 arrests per 1000 patient discharges pre-PMET vs 0.16 arrests per 1000 patient-days and 1.1 arrests per 1000 patient discharges post-PMET (incidence rate ratio 0.49; 95% confidence interval, 0.18-1.20). Rate of CPA No change in the rate of CPAs Rate of respiratory arrest Incidence of respiratory arrests decreased 73% after implementation of the PMET (incidence rate ratio, 0.27; 95% confidence interval, 0.05-1.01). This was manifested as a decrease from 0.23 to 0.06 respiratory arrests per 1000 patient-days (P=.03). Survival There was a consistent decrease, but not a statistically significant difference, in survival of patients who had a respiratory arrest or CPA after the intervention CPA characteristics Our incidence of CPAs was 0.10 per 1000 patient days before and after the introduction of the PMET. During the 30-month period after implementation, there were 12 pediatric CPAs. The distribution of CPA type was as follows: 2 type I (17%), 3 type II (25%), 3 type III (25%), and 4 type IV (33%). Thus, the 2 type I CPAs may have been preventable and should have prompted calls for the PMET prior to the arrests. This was equivalent to 0.016 type I CPAs per 1000 patient-days. However, the remaining 83% of CPAs were not obviously preventable. .

(13/10/2014 Final Version) Page 224
Author; Date; Country; Title
Purpose Design Settings/Participants Intervention Clinical Data Collection Method/Analysis
Outcomes/Results
Worried family member (unvalidated) Education: Educate those caring for patients who might need to call the team, those notified that the team had been called (specifically, physician faculty), responding members of the PMET, and those facilitating the call (ward clerks and telephone operators). The key components of education were (1) to change the staff’s understanding of triggers for calling PMET, (2) to encourage the staff to listen to their instincts and call when worried, and to clarify that there is no need for a physician’s approval to call the PMET, (3) to educate PMET members not to say anything disparaging to front-line staff about appropriateness of a call, (4) to empower staff to circumvent established hierarchies to call the PMET if needed, (5) to encourage that the PMET be called if one group of staff needs assistance even if others are comfortable with the situation, and (6) to emphasize that if a parent expresses any concerns or fears about his or her child’s clinical status, then the PMET should be called. This educational effort was initiated 2 months before implementation of the PMET and continued during staff debriefings of PMET calls.
indices during those periods were conducted using the All Patient Refined Diagnosis Related Group, version 20, weighted (APDRG). Medical records of all CPAs that occurred on the pediatric wards during the 30-month period after implementation of the PMET were reviewed to determine if (1) there were any preceding signs and symptoms that if heeded may have theoretically prevented the CPA and (2) whether or not the PMET had been activated prior to onset of apnea and loss of pulse. This information was used to categorize the CPAs as type I through IV (ranging from theoretically preventable with clear signs and symptoms preceding the event to unavoidable, ie, no preceding signs or symptoms)

(13/10/2014 Final Version) Page 225
Author; Date; Country; Title
Purpose Design Settings/Participants Intervention Clinical Data Collection Method/Analysis
Outcomes/Results
Kotsakis et al. (2011) Canada Implementation of a Multicenter Rapid Response System in Pediatric Academic Hospitals is Effective
To examine effectiveness of a pediatric rapid response system (PRRS) Primary objective To determine the effect of a PRRS using a physician-led team on the rate of actual cardiopulmonary arrests (CPA) Secondary objectives To determine the effect of PRRSs on the rate of PICU readmission within 48 hours of discharge and PICU mortality after readmission and urgent PICU admission CPA defined as an event requiring chest compressions, epinephrine, or positive pressure ventilation
Multicenter, prospective, observational study design 2-year study Prospective data were compared with data collected retrospectively for the 2 years before PRRS implementation Ontario Pediatric Critical Care Response Team Collaborative
Ontario has a population of >13 million people, and all critically ill children requiring PICU admission are admitted in 1 of 5 pediatric centers 4 level 3 academic pediatric hospitals in Ontario; Level 3 hospitals defined as capable of providing highest level of care. Each hospital is university affiliated, accredited for training by the Royal College of Physicians and Surgeons of Canada, and has a pediatric critical care fellowship program. All PICUs across the 4 sites are closed; accredited pediatric intensivists are responsible for all management and care decisions with subspecialty services providing consultation only. No in-house hospitalists are present 24 hours/day, 7 days/week at any center.
Physician led MET Standardized development and implementation of PRRS occurred in 3 phases. Phase 1: preparation During the 6 months of phase 1 (May 1, 2006, to October 31, 2006), the multidisciplinary site leaders reached consensus regarding delivery of the PRRS service and developed promotion and education strategies. In addition, a data collection tool was developed. Phase 2: pilot The PRRS was piloted during phase 2 (October 31, 2006, to January 29, 2007), Monday through Friday, 8:00 PM to 4:00 PM, during which time user groups completed satisfaction surveys used to refine the team’s delivery of service. The data collection tool was also used and MET providers suggested revisions to the tool. Phase 3: implementation On January 29, 2007, phase 3 began with the PRRS available 24 hours/day, 7 days/ week. Team Composition: PRRS composed of physician-led MET; A PICU physician (PICU attending and fellow/ resident during the day and a PICU fellow/ resident overnight with attending backup), a critical care nurse, and a respiratory therapist Process of activation
Outcome measures Code blue events PICU readmission rate All-cause hospital mortality PICU mortality after urgent PICU admission & PICU readmission Data regarding hospital admissions and mortality were extracted from hospital administrative databases. PICU data were extracted from PICU administrative databases that collect PICU admissions, readmissions, mortality, and Pediatric Risk of Mortality (PRISM) III scores contemporaneously. Data were extracted from October 31, 2004, for 2 years before the PRSS implementation and from January 29, 2007, for 2 years after the PRRS implementation. Data from pilot activity during phase 2 were excluded. A standardized data collection tool and database were developed by a group of experts to track MET activity. MET activity and outcome definitions were defined in a standardized way across all 4 sites (Table 2). (Activation -A new referral to the MET; Follow-up: activation - follow-up visit of an activation triaged to remain on the floor; Follow-up: PICU discharge - follow-up visit of a patient
Demographics There were 55 469 hospital admissions and 7068 PICU admissions for the 2 years before PRRS implementation. During the 2 years after PRRS implementation, there were 55 963 hospital admissions and 7227 PICU admissions. During the era before PRRS implementation, the mean PRISM III score was 8.1 (SD: 6.6; median: 6 [interquartile range: 3–11]); after PRRS implementation, the mean PRISM III score was 7.8 (SD: 6; median: 6 [interquartile range: 3–11]). The rate of PICU admission from the wards did not change significantly before compared with after PRRS implementation 17 versus 18 per 1000 hospital admissions (RRR: 0.7 [95% CI: 0.6–0.9]); P =.19). MET activations MET received 2476 new activations and followed up with them for 6230 visits. There were 44 new activations per 1000 hospital admissions. Overall, 30% of all activations led to an unplanned PICU admission The main indications for activating the MET were respiratory (46%), cardiovascular (21%), HCP concern (18%), neurologic (11%), and other (3%) Nurses were the most common health care providers to activate the MET (57%), followed by physicians (37%), respiratory therapists (2%), family (1%), and other (3%). MET was most commonly activated between 7:00 AM and 7:00 PM (55%). MET followed up 7300 PICU discharges for 48 hours (15 031 visits). All data are reported per 1000 hospital admissions.
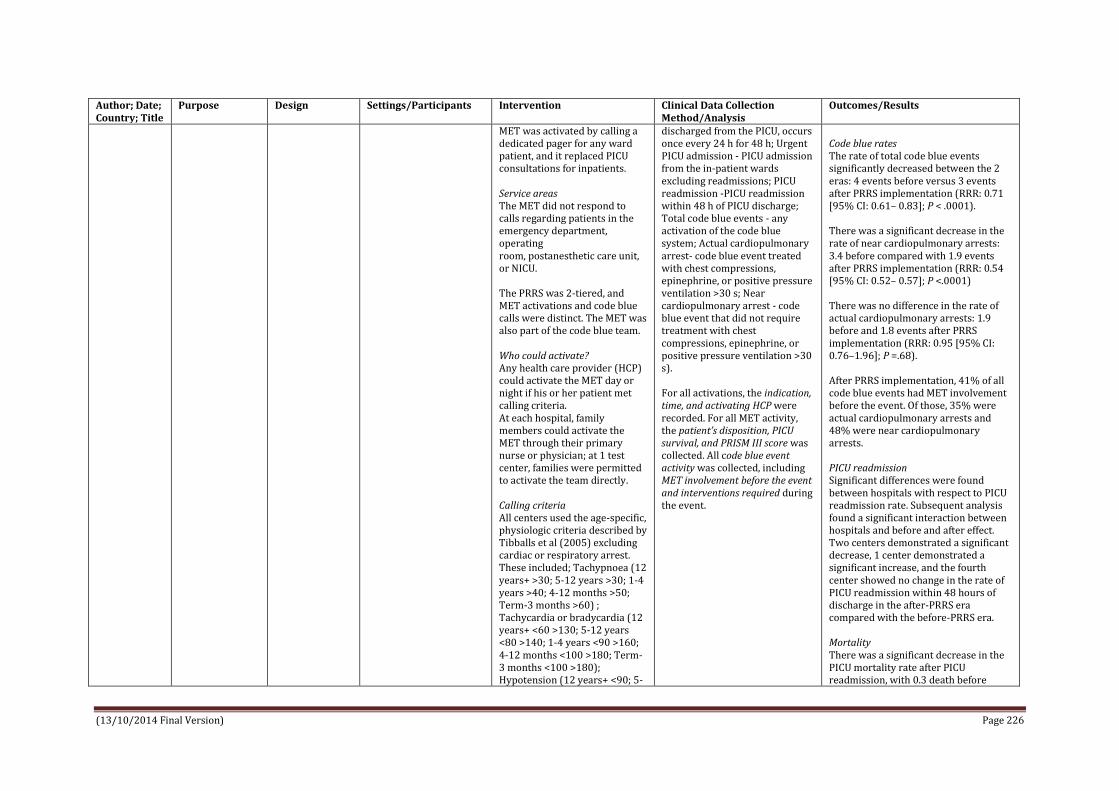
(13/10/2014 Final Version) Page 226
Author; Date; Country; Title
Purpose Design Settings/Participants Intervention Clinical Data Collection Method/Analysis
Outcomes/Results
MET was activated by calling a dedicated pager for any ward patient, and it replaced PICU consultations for inpatients. Service areas The MET did not respond to calls regarding patients in the emergency department, operating room, postanesthetic care unit, or NICU. The PRRS was 2-tiered, and MET activations and code blue calls were distinct. The MET was also part of the code blue team. Who could activate? Any health care provider (HCP) could activate the MET day or night if his or her patient met calling criteria. At each hospital, family members could activate the MET through their primary nurse or physician; at 1 test center, families were permitted to activate the team directly. Calling criteria All centers used the age-specific, physiologic criteria described by Tibballs et al (2005) excluding cardiac or respiratory arrest. These included; Tachypnoea (12 years+ >30; 5-12 years >30; 1-4 years >40; 4-12 months >50; Term-3 months >60) ; Tachycardia or bradycardia (12 years+ <60 >130; 5-12 years <80 >140; 1-4 years <90 >160; 4-12 months <100 >180; Term-3 months <100 >180); Hypotension (12 years+ <90; 5-
discharged from the PICU, occurs once every 24 h for 48 h; Urgent PICU admission - PICU admission from the in-patient wards excluding readmissions; PICU readmission -PICU readmission within 48 h of PICU discharge; Total code blue events - any activation of the code blue system; Actual cardiopulmonary arrest- code blue event treated with chest compressions, epinephrine, or positive pressure ventilation >30 s; Near cardiopulmonary arrest - code blue event that did not require treatment with chest compressions, epinephrine, or positive pressure ventilation >30 s). For all activations, the indication, time, and activating HCP were recorded. For all MET activity, the patient’s disposition, PICU survival, and PRISM III score was collected. All code blue event activity was collected, including MET involvement before the event and interventions required during the event.
Code blue rates The rate of total code blue events significantly decreased between the 2 eras: 4 events before versus 3 events after PRRS implementation (RRR: 0.71 [95% CI: 0.61– 0.83]; P < .0001). There was a significant decrease in the rate of near cardiopulmonary arrests: 3.4 before compared with 1.9 events after PRRS implementation (RRR: 0.54 [95% CI: 0.52– 0.57]; P <.0001) There was no difference in the rate of actual cardiopulmonary arrests: 1.9 before and 1.8 events after PRRS implementation (RRR: 0.95 [95% CI: 0.76–1.96]; P =.68). After PRRS implementation, 41% of all code blue events had MET involvement before the event. Of those, 35% were actual cardiopulmonary arrests and 48% were near cardiopulmonary arrests. PICU readmission Significant differences were found between hospitals with respect to PICU readmission rate. Subsequent analysis found a significant interaction between hospitals and before and after effect. Two centers demonstrated a significant decrease, 1 center demonstrated a significant increase, and the fourth center showed no change in the rate of PICU readmission within 48 hours of discharge in the after-PRRS era compared with the before-PRRS era. Mortality There was a significant decrease in the PICU mortality rate after PICU readmission, with 0.3 death before

(13/10/2014 Final Version) Page 227
Author; Date; Country; Title
Purpose Design Settings/Participants Intervention Clinical Data Collection Method/Analysis
Outcomes/Results
12 years <80; 1-4 years <70; 4-12 months <60; Term-3 months <50); Saturation <90%; saturation <60% in cyanotic heart disease (any amount of oxygen); acute drop in the Glasgow Coma Score by >2 points; seizures; HCP or family member concern. When activated, the MET arrived at the patient’s bedside within 5 minutes, and their assessment involved participation of the HCP who activated the team and the patient’s primary nurse and physician. The MET determined whether the patient required PICU admission. Patients who required PICU admission remained in the care of the MET until PICU admission. For patients who remained on the ward, the MET provided suggestions regarding diagnostic investigations, medical interventions, and scheduled follow-up visits that monitored the patient’s progress with the primary medical team. Patients were followed up by the MET until the primary medical team and the MET agreed that the patient no longer required such follow-up. The MET also followed up patients discharged from the PICU for 48 hours, with visits occurring once in 24 hours or more frequently, if requested by the HCP on the ward.
PRRS implementation compared with 0.1 death after PRRS implementation (RRR: 0.43 [95% CI: 0.17– 0.99]; P <.05) There was no change in the rate of PICU mortality after urgent PICU admission between the 2 eras: 1.3 before PRRS implementation compared with 1.1 deaths after PRRS implementation (RRR: 0.9 [95% CI: 0.7–1.0]; P =.25) There was no change in the rate of all-cause hospital mortality between the 2 eras: 10 before PRRS to 9.6 after PRRS implementation (RRR: 0.97 [95% CI: 0.83–1.12]; P =.65). Hospital was included as a variable in the regression model to guarantee that any before and after outcome differences were not because of hospital variations. No interaction between hospitals and before and after effect was found during the regression analysis.

(13/10/2014 Final Version) Page 228
Author; Date; Country; Title
Purpose Design Settings/Participants Intervention Clinical Data Collection Method/Analysis
Outcomes/Results
Lobos et al. (2014) Canada Patient characteristics and disposition after pediatric medical emergency team (MET) activation: disposition depends on who activates the team
Study focused on health care staff (HCS) responsible for activating MET – goals were to report patient characteristics, MET interventions and patient disposition by type of activating HCS at a pediatric tertiary hospital with a well-established RRS. To explore whether HCS activate MET differently and if so whether the difference is associated with patient disposition
Retrospective cohort study
Pediatric tertiary children’s hospital, Eastern Ontario Ottawa (CHEO) CHEO has 166 inpatient beds, including 10 beds in PICU and >6000admissions to the hospital each year Patients < 18 years who received MET activation during hospitalisation over a 49-month period
Rapid Response System Team composition Physician-led MET; composed of a critical care physician, critical care nurse, and critical care trained respiratory therapist. A dedicated PICU physician attends all daytime activations with overnight coverage provided by in-house PICU fellows or residents with PICU attending back-up. Who can activate? Any HCS can activate the MET day or night with patients’ parents/guardians activating the MET through their primary nurse or physician. Calling criteria The criteria for MET activation are based on the criteria by Tibballs and Kinney and include activation for parent/guardian or HCS concern. Process of activation MET is activated by using a dedicated pager with the MET arriving within 5 to 10 minutes at the patient bedside. If the patient remains on the inpatient ward, he or she may be followed until the MET and the primary medical team agree that the patient no longer requires follow-up. MET does not respond to patients in the emergency department, operating room, post–anesthetic care unit or
Data are collected on each MET assessment and recorded on a standardized data collection tool by the MET nurse and transcribed into the electronic RRT database. Detailed information on the outcome of each MET assessment is recorded and includes patient demographics, as well as presence and type of organ dysfunction, recent surgery, ward type, most responsible service, HCS type responsible for activating the RRS, interventions performed, plan for follow-up, and disposition. Multiple HCS types can be recorded when the decision appears to have occurred jointly. Patient assessments representing MET activations and follow-up visits were identified and extracted from the RRT database. Definitions A MET activation was defined as a new referral to the MET. A follow-up visit was defined as a planned assessment by the MET for a patient triaged to remain on the inpatient ward. A PICU discharge assessment was defined as a planned visit of a patient recently discharged from the PICU. An unplanned PICU discharge assessment occurred when the MET was called to see a patient before, or in addition to, the planned PICU discharge assessment. An unplanned MET follow-up assessment occurred when the MET was called to see a patient before, or in addition to,
Summary of results Most common MET activators were physicians (410, 53.3%) with nurses generating a comparable number (367, 47.7%). Significant differences in PICU admission rates were observed between activator groups, with physicians having statistically higher PICU admission rates when compared with nurses (25.2% vs 15.0%, P = .001). Compared with physicians, nursing-led activations on surgical patients had significantly lower odds of PICU admission relative to medical patients (odds ratio 0.19 vs 0.67; P = .03). No significant difference was observed in the type or number of interventions between any subgroup based on patient (surgery vs medical) or activator type. Results Number and type of activations During 49-month study period 800 MET activations on 626 separate patients identified within the database; activation rate of ∼31 activations per 1000 hospital admissions (∼26 000 admissions in 49 months) There were 672 (84.0%) new activations, 61 (7.6%) unplanned PICU discharge assessments, with the remaining 67 (8.4%) representing unplanned MET follow-up assessments of ward patients Cohort characteristics Median patient age at time of activation was 34 months (IQR 4.5–134). For the study cohort, 625 (83%) were admitted under a medical service, with the remaining 17% cared for by a

(13/10/2014 Final Version) Page 229
Author; Date; Country; Title
Purpose Design Settings/Participants Intervention Clinical Data Collection Method/Analysis
Outcomes/Results
NICU. MET activations replaced all PICU consultations for inpatients with transfer to the PICU occurring only through an activation of the MET. The CHEO RRS is a 2-tiered system, as MET activations and code blues are distinct with 2 separate teams responding Patients discharged from the PICU are followed by the MET with 2 visits in 48 hours to ensure a smooth transition to the inpatient ward.
the planned MET follow-up after an activation. MET activation and follow-up visits were linked such that a full patient encounter could be described and evaluated. Primary exposure of interest The activating HCS, grouped into 3 categories: physician (including attending physician or resident), nurse, and other (respiratory therapists, physiotherapists, social workers, administrative staff, and parents/ guardians). Outcome of primary interest PICU admission Secondary outcomes Number and type of interventions performed. For each patient assessment, the database recorded the specific interventions and investigations performed by the MET, including airway repositioning or suctioning, artificial airway placement, intubation, non-invasive ventilation, nebulized medications, chest physiotherapy, insertion of pleural drain, vascular access, fluid or blood product administration, inotropes or vasopressors, antiarrhythmics, mannitol/ 3% saline, or request for chest radiography. Patient charts were also reviewed and the following interventions or investigations
surgical specialty. In total, 86 (10.8%) were recorded as having had surgery in the past 7 days. More than half (59.4%) of the patients were identified as having 2 or more diseased organs at time of the MET activation. Timing of activations There were 458 activations (57.3%) daytime (07:00–19:00) activations with 74 (10.9%) occurring on a weekend day. Activations during the winter months were most common (279, 34.9%) with activations during summer and spring months having the lowest frequency (144, 18%). Reasons for activations Broad categories were used to identify the reason for activation, and included respiratory (388, 48.5%), circulatory (145, 18.1%), neurologic (130, 16.3%), and other (273, 34.1%) concerns. Activation outcomes A total of 174 activations (21.8%) resulted in a PICU admission at the time of first assessment. Twenty-three patients (2.9%) were admitted to the PICU on a planned follow-up visit after the new activation. At the initial MET activation, the MET performed at least 1 intervention in 595 (74.4%) cases, with 614 (76.7%) of the cases receiving at least 1 MET intervention over the course of the patient encounter (activation and follow-up visits) Activator Characteristics At least 1 HCS activator could be defined from the electronic database for 753 activations, and after review of the patient chart this number was increased to 769. As the database allowed >1 activator to be recognized, 47 (5.9%) of

(13/10/2014 Final Version) Page 230
Author; Date; Country; Title
Purpose Design Settings/Participants Intervention Clinical Data Collection Method/Analysis
Outcomes/Results
were recorded: antiepileptics, steroids, analgesics and sedatives, antihypertensives, magnesium sulfate for asthma, diuretics, antibiotics, oxygen, laboratory testing, imaging, and modification to intravenous fluid. When data elements were missing in the RRS database, MET activation forms were reviewed.
the MET activations had 2 or more HCS activators. The most common activators were physicians (410, 53.3%). Nursing staff generated a comparable number of activations (367, 47.7%), whereas other HCS were involved in 40 activations (5.2%). Comparison of patient disposition and characteristics by activator type There were significant differences between activator groups and PICU admission rates (P < .004). For the direct comparison of physicians and nurses groups, nurse requested activations had statistically lower PICU admission rates after both the initial MET activation (25.2% vs 15.0%, P = .001) and over the entire encounter (29.0% vs 17.8%, P = .0006). Nursing-requested activations were 3 times more likely to occur on children already being followed by the MET after PICU discharge (a planned follow-up visit) and to involve surgical patients. Physician-requested activations were more likely to occur during the daytime and on the weekend. No difference, between physicians and nurses, was observed for the 3 major indications (respiratory, circulation, neurologic), and the groups received a similar number and type of interventions. After adjustment for numerous potentially confounding variables including recent surgery and most responsible service, nurse activation remained significantly associated with reduced odds of PICU admission (OR

(13/10/2014 Final Version) Page 231
Author; Date; Country; Title
Purpose Design Settings/Participants Intervention Clinical Data Collection Method/Analysis
Outcomes/Results
0.58; CI 0.40–0.84). In relation to interventions, only sedative use was determined to be statistically different, with the higher rate occurring among nurse-requested MET activations (5.9% vs 2.7%, P = .04). Further explored the observation that surgical patients were overrepresented within the nursing subgroup through an evaluation of variable interactions – for both medical and surgical patients, nurse-initiated activations were statistically less likely to be admitted to the PICU. Further, the odds of PICU admission were much lower when nurses activated on patients admitted under a surgical service compared with a medical service (OR 0.19 vs 0.67; P =.03). Despite this difference, surgical patients with nursing-led activations were just as likely to receive a MET intervention (78% vs 78%), and had an identical median number of interventions and IQR (median 2; IQR 1–4) when compared with medical patients. Patient disposition and characteristics by activator number PICU admission rates were higher for patients identified as having multiple HCS activate the team. Despite the small sample size, the difference in proportion who were admitted to the PICU after MET activation achieved statistical significance (34.0% vs 20.6%; P = .03). Patients who had multiple HCS agree to activate the MET were statistically more likely to have a respiratory indication (66.0% vs 48.8%; P = .02) and to have the activation occur in the context of a recent MET activation (19.2% vs 7.5%; P = .01). Although

(13/10/2014 Final Version) Page 232
Author; Date; Country; Title
Purpose Design Settings/Participants Intervention Clinical Data Collection Method/Analysis
Outcomes/Results
differences in age and rates of daytime activations were suggested, neither quite achieved statistical significance.
Panesar et al. (2014) USA Characteristics and outcomes of pediatric rapid response teams before and after mandatory triggering by an elevated pediatric early warning system (PEWS) score
To examine changes in characteristics of RRT calls before and after implementation of a mandatory hospital policy requiring RRT activation due to elevated PEWS score Examined changes in location and timing of RRT calls, reasons RRTs were activated, interventions undertaken during RRT calls and subsequent outcomes.
Retrospective review of RRT database
Stony Brook Long Island Children’s Hospital n=44 RRT recorded before mandatory triggering and n=69 RRTs afterward in the study period n=40 patients in pre-mandatory triggering group n=63 patients in mandatory triggering group
Pediatric RRT Mandatory reporting and activation of RRTs with modified Brighton PEWS score (>=5) with mandatory hospital-wide policy Calling criteria The red PEWS score (>=5) mandated that an RRT call be made, independent of other patient factors or caregivers’ concerns. Process of calling The RRT was called on the overhead paging system, and it was made regardless of previous RRT calls a patient may have had, even if the previous set of vital signs indicated a red PEWS score and launched a previous RRT call. Who could activate? As with RRT activations before the mandatory triggering period, pediatric RRTs could be activated by patients, caregivers, or any member of the hospital staff, based on any concerns, including abnormal vital signs, a significant change in the physical examination, acute respiratory compromise, or an acute change in mental status (eg, seizures). The initial PEWS score was recorded by the nurse caring for the patient in the emergency
Retrospective review of RRT database before and after mandatory reporting and activation of RRTs with modified Brighton PEWS score Data collected retrospectively based on information entered on pediatric RRT documentation/data collection form in each patient’s paper chart when RRT was called. These forms completed by a pediatric resident who participated in RRT. A check box on collection form indicated whether a primary reason for RRT activation was due to a red PEWS score, but the numerical score was not reported consistently. These data were collected and placed in a database maintained by the Rapid Response Committee, Division of Quality and Safety For patients who had repeated RRTs, each RRT was counted as a separate event. The Division of Quality and Safety concurrently attempted to collect all PEWS scores for all RRT calls as well; however, not all scores were known for all calls. In addition, for the RRTs with red PEWS scores, it was unknown whether the primary reason for RRT was due to a red PEWS score alone. Therefore, individual PEWS scores were not used for analysis.
Number of RRT events/activations The proportion of RRT events relative to the total number of patient-days in the pre-mandatory and post-mandatory triggering periods were 3.14 RRTs per 1000 patient-days and 4.23 RRTs per 1000 patient-days, respectively. Although this finding represents a 26% increase in the total number of RRTs triggered, the change was not significant (P = .11) Time of RRT event activations The time of events showed that the number of daytime events was almost unchanged in the total number of events (from 23 to 24 [before and after the mandatory periods, respectively]). However, the number of night time events increased from 21 to 45, a 17.5% increase (P = .07). Reasons for activations The most significant changes as to reasons RRTs were called were for tachycardia, which became the most common trigger for an RRT call in the post-automation group, with a net increase of 26.1% (P = .004). In addition, there was a significant reduction of 22.9% (P = .009) in RRTs called due to an acute change in mental status or agitation in the post-automation group. Interventions performed Comparison of RRTs that received interventions between the 2 groups showed that in the pre-automation group, 2.3% of RRT calls (n = 1) had no interventions conducted. However, in

(13/10/2014 Final Version) Page 233
Author; Date; Country; Title
Purpose Design Settings/Participants Intervention Clinical Data Collection Method/Analysis
Outcomes/Results
department. After admission, the PEWS score was tabulated by the nurse assigned to the patient every time vital signs were taken, which was every 4 hours on the general paediatrics ward and hematology/oncology ward. If the patient’s PEWS score totalled ≥5, a rapid response was called overhead regardless of any other circumstances. Composition of Team: A senior pediatric resident, critical care nurse, respiratory therapist, and the patient’s bedside nurse. In addition, a dedicated RRT nurse practitioner covered all hospital-wide rapid responses during the daytime hours (7:00 AM to 7:00 PM). The pediatric RRTs did not respond to events in the emergency department or the NICU. Code blue calls were considered separate entities from rapid responses, but the RRT could have become a component of the code team.
Additional data reviewed from the database included reason for RRT activation, interventions performed, and whether the attending was notified by telephone or pager or was present at bedside. Patient outcomes of the RRT activations recorded; whether a subsequent code blue was called, the number of transfers to PICU, and overall hospital mortality.
the post-automation group, a larger number of patients received no interventions, up to 15.1% of RRTs (n = 12). Specifically, the RRT calls in the post-automation group required fewer respiratory interventions, with the most significant decrease in the use of supplemental oxygen via nasal cannula or face mask by 24.5% (P = .011) as well as bag-mask ventilation by 11.6% (P = .035). Number of PICU transfers There was a trend toward decreased frequency of PICU transfers in the post-automation group by 17.5% (P = .06) with no change in the number of code blue calls or mortality.
Sharek et al. (2007) USA Effect of a Rapid Response Team on Hospital-wide Mortality
To evaluate the effect of RRT implementation on hospital-wide mortality rates and code (respiratory & cardiopulmonary arrests) rates outside of the ICU
A cohort study design with historical controls
Setting: Lucile Packard Children’s Hospital (LPCH) - a 264-bed quaternary care children’s hospital of which 218 beds are located on the main campus. Distribution of hospital beds at main campus includes 76 medical-
Pediatric RRT Composition of RRT A physician (pediatric ICU attending physician or fellow) An experienced pediatric ICU or cardiovascular ICU nurse An ICU-trained respiratory therapist A nursing supervisor.
Outcomes: Hospital-wide mortality rates (all deaths, irrespective of where they occurred in the hospital) Code rates outside of the ICU (per 1000 eligible patient days and per 1000 eligible admissions). Process outcomes: Reasons for RRT activation Actions taken by the RRT
Implementation of an RRT was associated with a statistically significant reduction in hospital-wide mortality rate and code rate outside of the pediatric ICU setting Mortality rates After RRT implementation, mean monthly mortality rate decreased by 18% (1.01 to 0.83 deaths per 100 discharges; 95% confidence interval

(13/10/2014 Final Version) Page 234
Author; Date; Country; Title
Purpose Design Settings/Participants Intervention Clinical Data Collection Method/Analysis
Outcomes/Results
and Code Rates Outside the ICU in a Children’s Hospital
in pediatric inpatients at an academic children’s hospital
surgical beds, 64 critical-care beds (12 pediatric ICU, 12 cardiovascular ICU, and 40 neonatal ICU), 52 obstetric beds, and 26 non–neonatal ICU nursery beds. Participants were included if they were admitted to LPCH between January 1, 2001, and March 31, 2007, and spent at least 1 day on the non-obstetric, non–nursery-based, non-ICU medical or surgical wards. Pre-intervention period Between January 1, 2001, and August 30, 2005 Post-intervention period Between September 1, 2005, and March 31, 2007 (patients not excluded during roll-out period; patients admitted in first 3months after implementation included in post-intervention group) Pre-intervention N=22 037 patient admissions and N=102 537 patient-days were evaluated pre-intervention (before September 1, 2005), Post -intervention N=7257 patient admissions and n=34 420
Calling criteria The criteria recommended to activate the RRT at LPCH, similar to those used in the experiences reported by the studies of Tibballs et al and Brilli et al were (1) any staff member worried about a patient, (2) acute change in respiratory rate, (3) acute change in oxygen saturation, (4) acute change in heart rate, (5) acute change in blood pressure, and (6) acute change in level of consciousness. Availability Team available at all times to assess, treat, and triage decompensating pediatric inpatients When activated, RRT was expected to initiate an evaluation of a patient within 5minutes of the call, write orders necessary for any diagnostic studies and therapeutic interventions, discuss management with the primary physician, and determine the optimal location for the patient’s care. All RRT calls were activated via the hospital operator using an emergency paging system. Consideration given to allowing parent activation of RRT; however, at the time of RRT program implementation, the LPCH Family Advisory Council recommended against doing so.
Patient disposition after RRT Definitions A code outside of the ICU was defined as any patient requiring tracheal intubation, chest compressions, or both (respiratory arrest or cardiopulmonary arrest) who was an inpatient on any of the non-obstetric, non– nursery-based, non-ICU medical or surgical units at LPCH. An eligible patient-day was defined as a day during which a patient was an inpatient on 1 of the non-obstetric, non–nursery based, non-ICU medical or surgical units at LPCH. An eligible patient admission was defined as any admission during which a patient spent at least 1 day on 1 of the non-obstetric, non–nursery-based, non-ICU medical or surgical units at LPCH. Demographic data, including age, sex, and race pre-intervention and post-intervention were assessed as surrogate markers that could reflect important population differences. Race/ethnicity classification was self-reported by the patient or a family member post-intervention to determine if significant differences in patient diagnoses existed.
[CI], 5%-30%; P=.007) Code rates Mean monthly code rate per 1000 admissions decreased by 71.7% (2.45 to 0.69 codes per 1000 admissions), and the mean monthly code rate per 1000 patient-days decreased by 71.2% (0.52 to 0.15 codes per 1000 patient-days) The estimated code rate per 1000 admissions for the post-intervention group was 0.29 times that for the pre-intervention group (95% likelihood ratio CI, 0.10-0.65; P=.008), and the estimated code rate per 1000 patient-days for the post-intervention group was 0.28 times that for the pre-intervention group (95% likelihood ratio CI, 0.10-0.64; P=.007).

(13/10/2014 Final Version) Page 235
Author; Date; Country; Title
Purpose Design Settings/Participants Intervention Clinical Data Collection Method/Analysis
Outcomes/Results
patient-days were evaluated (on or after September 1, 2005).
Education: Education regarding the program and literature were provided to staff on all non-obstetric, non–nursery-based, non-ICU medical or surgical patient care units at LPCH during the 2 months (July 2005 to August 2005) before implementation. A wallet-sized index card with RRT information, including circumstances appropriate to activate the RRT, was provided to all appropriate LPCH staff.
Theilen et al. (2013) Edinburgh, UK Regular in situ simulation training of paediatric Medical Emergency Team improves hospital response to deteriorating patients
To evaluate the impact of regular team training on hospital response to deteriorating in-patients with evolving critical illness and subsequent patient outcome
Prospective (audit) cohort study
Setting/participants All deteriorating in-patients of a tertiary stand-alone paediatric hospital requiring admission to paediatric intensive care (PICU) the year before, and after, the introduction of pMET and concurrent team training
Introduction of paediatric Medical Emergency Team (pMET) concurrent with weekly in situ simulation team training in routine clinical practice On a rotational basis, all key ward staff (registrars and senior ward nurses) participated in team training, which focused on recognition of the deteriorating child, teamwork and early consultant review of patients with evolving critical illness
Patient deterioration was defined as a breach of physiological criteria or documented staff concerns (local adaptation of previously published criteria) The new multi-disciplinary pMET, replacing the traditional resuscitation team, had an extended remit to respond to physiological deterioration and staff concerns as well as to resuscitation calls.
All unplanned admissions to PICU evaluated for a one year period. Time from point of deterioration to first response Time from first response to point of PICU admission recorded. Process measures prospectively identified; Increased frequency of nursing observations Seniority of medical review Patient transfer to high dependency care prior to PICU admission Outcome objectives in intensive care; Level of sickness on PICU admission (PIM2 score) Length of PICU stay PICU mortality.
Deteriorating patients were recognised more promptly (before/after pMET: median time 4/1.5 h, p < 0.001) Deteriorating patients were more often reviewed by consultants (45%/76%, p = 0.004) Deteriorating patients were more often transferred to high dependency care (18%/37%, p = 0.021) Deteriorating patients were more rapidly escalated to intensive care (median time 10.5/5 h, p = 0.024) These improved responses by ward staff extended beyond direct involvement of pMET. There was a trend towards fewer PICU admissions, reduced level of sickness at the time of PICU admission, reduced length of PICU stay and reduced PICU mortality. Introduction of pMET coincided with significantly reduced hospital mortality (p < 0.001). These results indicate that lessons learnt by ward staff during regular in situ team training led to significantly improved recognition and management of deteriorating in-patients with evolving critical illness. Ward management of deteriorating in-

(13/10/2014 Final Version) Page 236
Author; Date; Country; Title
Purpose Design Settings/Participants Intervention Clinical Data Collection Method/Analysis
Outcomes/Results
Team availability Around the clock Composition 6 members of pMET were recruited from medical and nursing staff from Emergency Medicine (1), PICU (2), and paediatric wards (3) Training/Education; Weekly training for pMET; all team members staffing pMET on a rotational basis were required to attend training. Depending on the numbers of staff contributing to different rotations, team members attended between 4 and 10 training sessions per year. During training, team members assumed the roles they perform during clinical pMET calls (defined role allocation). Teaching was provided in the form of simulation training, initially in a clinical skills setting, later in the real clinical environment, in particular paediatric wards. Medium fidelity paediatric (Laerdal MegaCode Kid Vital Sim Advanced) and infant (Laerdal ALS Baby) manikins were used. Two trainers, one consultant and one senior nurse, facilitated each training session. All team trainers were senior staff from our institution, with a variety of backgrounds from PICU; Emergency Medicine; Medical Paediatrics; Anaesthesia and Resuscitation Training. This enabled trainers to incorporate
patients with evolving critical illness Pre-implementation of pMET Delays in both the recognition of deteriorating patients and in the time from first response to PICU admission were most marked in the out-of-hours period (overnight, weekend). All deteriorating patients were reviewed by a doctor, but only 25/56 patients were seen by a consultant from point of deterioration to point of PICU admission. The resuscitation team was called in 3 cases. Post-implementation of pMET The proportion of patients who received a first response to deterioration after more than 12 h reduced from 23% to 2%. Improvements were most marked in the out-of-hours period. Consultants were involved at an earlier stage and significantly more often reviewed deteriorating patients prior to PICU admission. Involvement of senior staff led to faster decision making. The reduction in time for escalation to intensive care support was most marked out-of-hours No significant change was observed when deterioration occurred within normal working hours, but in the 56 patients who deteriorated in the out-of-hours period (31 prep- MET vs. 25 post-pMET), a significant reduction in escalation time could be demonstrated (median time 11 h vs. 7 h, p = 0.038, Mann Whitney U) The changed response to deteriorating patients was not only demonstrable

(13/10/2014 Final Version) Page 237
Author; Date; Country; Title
Purpose Design Settings/Participants Intervention Clinical Data Collection Method/Analysis
Outcomes/Results
issues identified in clinical practice into the simulation training. Scenarios included deteriorating patients with medical conditions in paediatric wards and in the Emergency Department, paediatric trauma, surgical conditions, in particular post-operative complications, and adult visitors. The duration of a training session was 2 h, which usually included 2 scenarios and subsequent debriefing. Debriefing focused on: a supportive attitude towards ward staff; recognition of the deteriorating child; teamwork and communication within the multi-disciplinary team; early involvement of consultant staff; early liaison with paediatric intensive care. In the clinical skills setting, video-recording of scenarios was used on some occasions to reinforce specific learning points relating to communication with ward staff (response to call, supportive attitude), communication within the team (introduction of team members, role allocation, communication with team leader) and communication with consultant staff (early involvement, clear definition of requested support). Video-recording was not available for simulation training in the real clinical environment. Every effort was made to ensure time-realistic crisis resource management: if team members were tasked with specific jobs
when comparing the year pre- and post-implementation. Over the course of the second year, continuing improvements across the outcome measures were noticed: the year average of consultant review for deteriorating patients (76%) was achieved only during 2 months of the first half of the year, but surpassed in 4 months of the second half of the year. The median time for recognition of deterioration was 1.5 h over the whole second year, with ≤1.5 h being achieved in 2/6 months in the first half and 4/6 months in the second half of the year Although paediatric MET was called significantly more often than the earlier resuscitation team (11/51 vs. 3/56 of deteriorating patients; p = 0.023, Fischer’s Exact test (2-tailed)), the vast majority of unplanned PICU admissions continued to be admitted without involvement of the team. Interestingly, the response to deteriorating ward patients improved in all domains, with significant differences being observed in most areas, even if pMET was not involved at any stage. These improvements could therefore not be explained by the introduction of a paediatric MET alone. Outcome of deteriorating ward patients in paediatric intensive care – before and after implementation of pMET PICU outcome measures also indicated improvements, although this did not reach statistical significance. In the second year, overall hospital activity increased by 12%, but 4% fewer ward patients required PICU admission. Although a more select group was admitted to intensive care, level of sickness on PICU admission was lower (Paediatric Index of Mortality (PIM2)

(13/10/2014 Final Version) Page 238
Author; Date; Country; Title
Purpose Design Settings/Participants Intervention Clinical Data Collection Method/Analysis
Outcomes/Results
(e.g. obtaining and sending blood samples, contacting consultant staff), they were not available to work within the team for the duration required to perform these tasks in real clinical practice. Senior hospital management supported the project, allowing protected time for training (no other concurrent clinical duties), resulting in attendance rates of >95%.
score; median 4.7 pre-pMET vs. 3.7 post-pMET). Total PICU bed days relating to unplanned ward admissions reduced from 527 to 336. There was a trend towards reduced PICU mortality (7/56 vs. 2/54). Over the same time, overall hospital mortality reduced significantly from 31/7854 to 11/8652 (p < 0 001; Fischer’s Exact test). Numbers of hospital admissions and hospital deaths, using the same methodology for data collection, were available from 2003
Tibballs et al. (2005) Reduction of paediatric in-patient cardiac arrest and death with a medical emergency team: preliminary results
To determine impact of a paediatric medical emergency team (MET) on cardiac arrest, mortality, and unplanned admission to intensive care in a paediatric tertiary care hospital.
Quality assurance exercise
RCH is a specialised paediatric hospital serving a population of approximately 6 million inhabitants, of whom approximately 1.5 million are children, in southern Australia. Excluded non-inpatients, infants in the neonatal and paediatric intensive care units, patients for whom a decision not to resuscitate had been established, those receiving palliative care, and those who had arrests under anaesthesia.
MET service commenced in September 2002 Pre-MET (Code Blue) Prior to our MET service, a ‘‘Code Blue’’ service operated in ward areas for management of cardiorespiratory arrest by a team of doctors and nurses from the intensive care unit (ICU). During the period April 1999 to August 2002, contemporaneous records of cardiac arrest had been maintained. These served as retrospective controls. Records of patients for whom ‘‘Code Blue’’ had been initiated for cardiac arrest were analysed to determine if MET call criteria had been transgressed within the previous six hours. The call criterion ‘‘doctor or nurse worried by patient’s condition’’ was interpreted as fulfilled when there had been increased frequency of nursing observations, transfer to a high dependency area where pulse
Comparison of the retrospective incidence of cardiac arrest and death during 41 months before introduction of a MET service with the prospective incidence of these events during 12 months after its introduction. Comparison of transgression of MET call criteria in patients who arrested and died before and after introduction of MET.
Pre-MET cardiac arrest and death In the 41 month pre-MET era, of 166 ‘‘Code Blue’’ calls, 28 were for in-hospital cardiac arrest. Five were for children who arrested outside hospital and arrived in ED receiving resuscitation, and one was for an adult visitor. All of these six died. Of the remaining 22 in-patients, two arrests occurred in the operating theatre and were excluded from analysis because under conditions of surgery and anaesthesia we could not fairly compare their status against our MET call criteria. Thus, in the pre-MET era there were 20 children who had an in-hospital cardiac arrest. Their mean age was 3.6 (SD 5.1) years (range 2 weeks to 17 years). The conditions predisposing to cardiac arrest were: nine post-cardiac surgery, four septic shock, three lung diseases, two upper airway obstruction, one metabolic disorder, and one hypovolaemic shock. Arrest occurred in 17 patients who had transgressed MET call criteria and in three patients who had not transgressed call criteria within six hours prior to arrest. A total of 13
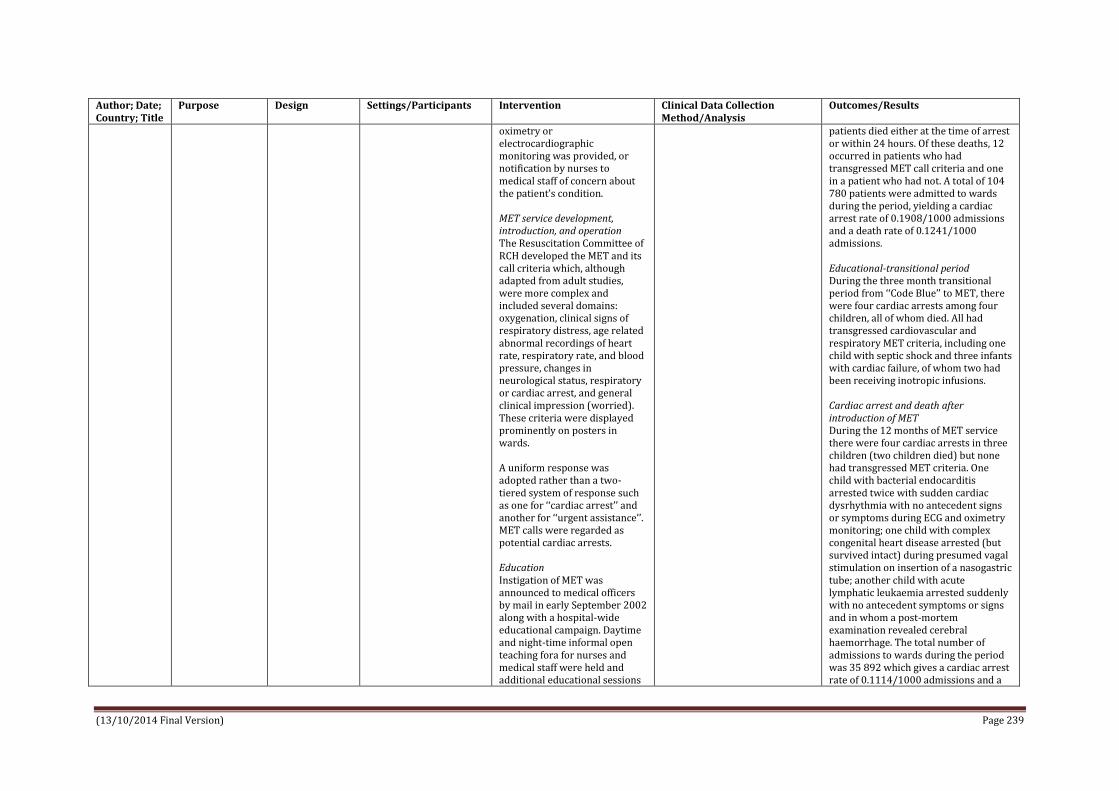
(13/10/2014 Final Version) Page 239
Author; Date; Country; Title
Purpose Design Settings/Participants Intervention Clinical Data Collection Method/Analysis
Outcomes/Results
oximetry or electrocardiographic monitoring was provided, or notification by nurses to medical staff of concern about the patient’s condition. MET service development, introduction, and operation The Resuscitation Committee of RCH developed the MET and its call criteria which, although adapted from adult studies, were more complex and included several domains: oxygenation, clinical signs of respiratory distress, age related abnormal recordings of heart rate, respiratory rate, and blood pressure, changes in neurological status, respiratory or cardiac arrest, and general clinical impression (worried). These criteria were displayed prominently on posters in wards. A uniform response was adopted rather than a two-tiered system of response such as one for ‘‘cardiac arrest’’ and another for ‘‘urgent assistance’’. MET calls were regarded as potential cardiac arrests. Education Instigation of MET was announced to medical officers by mail in early September 2002 along with a hospital-wide educational campaign. Daytime and night-time informal open teaching fora for nurses and medical staff were held and additional educational sessions
patients died either at the time of arrest or within 24 hours. Of these deaths, 12 occurred in patients who had transgressed MET call criteria and one in a patient who had not. A total of 104 780 patients were admitted to wards during the period, yielding a cardiac arrest rate of 0.1908/1000 admissions and a death rate of 0.1241/1000 admissions. Educational-transitional period During the three month transitional period from ‘‘Code Blue’’ to MET, there were four cardiac arrests among four children, all of whom died. All had transgressed cardiovascular and respiratory MET criteria, including one child with septic shock and three infants with cardiac failure, of whom two had been receiving inotropic infusions. Cardiac arrest and death after introduction of MET During the 12 months of MET service there were four cardiac arrests in three children (two children died) but none had transgressed MET criteria. One child with bacterial endocarditis arrested twice with sudden cardiac dysrhythmia with no antecedent signs or symptoms during ECG and oximetry monitoring; one child with complex congenital heart disease arrested (but survived intact) during presumed vagal stimulation on insertion of a nasogastric tube; another child with acute lymphatic leukaemia arrested suddenly with no antecedent symptoms or signs and in whom a post-mortem examination revealed cerebral haemorrhage. The total number of admissions to wards during the period was 35 892 which gives a cardiac arrest rate of 0.1114/1000 admissions and a

(13/10/2014 Final Version) Page 240
Author; Date; Country; Title
Purpose Design Settings/Participants Intervention Clinical Data Collection Method/Analysis
Outcomes/Results
offered. Sick Child Workshops were introduced to reinforce the clinical features of serious illness and the MET call criteria. The number of places for doctors and nurses in Advanced Paediatric Life Support courses was increased. A series of Clinical Practice Reviews for medical, nursing, and allied health staff were held in early September, November, and early December (2002) when the rationale and criteria for MET were presented and illustrative cases were reviewed. This educational period was regarded as preliminary to MET operation and as a transition period from the era of ‘‘Code Blue’’. Its duration in advance was not specified, but by early December 2002 the need for intensive training had abated, representing an educational transition period of three months. The composition of MET was initially five members comprising an ICU doctor (consultant/registrar), ICU nurse, emergency department (ED) senior doctor and nurse, and a medical registrar. However, after six months, the emergency nurses withdrew on realisation that four personnel were sufficient. Process of activation MET was initiated by calling the hospital switchboard on an emergency number.
death rate of 0.0557/1000 admissions. Changes in risks of cardiac arrest and death The risk of cardiac arrest was 0.1908/1000 admissions before MET, reducing to 0.1114/1000 admissions with MET: a risk ratio of 1.71 (95% CI 0.59 to 5.01, p=0.32). The risk of death before MET was 0.1241/1000 admissions, reducing to 0.0557/ 1000 admissions with MET: a risk ratio of 2.22 (95% CI 0.50 to 9.87, p=0.28). The risk of transgression of MET call criteria among those who arrested before introduction of MET was 0.1622/1000 admissions, reducing to 0/1000 admissions after introduction of MET, yielding a risk difference of 0.1622 (95% CI 0.0851 to 0.2394, p=0.0158). The risk of transgression of MET call criteria among those who died was 0.1145/1000 admissions before MET, reducing to 0/1000 admissions after introduction of MET, with a risk difference of 0.1145 (95% CI 0.0497 to 0.1793, p=0.0426). MET activity In 12 months of MET operation, 184 calls were made compared with 49 per 12 months in the pre-MET period (ratio 3.9:1). Of these, 20 involved visitors or staff in the hospital. The staff making calls, the reasons for calls, and the destination of patients is given in table 2. Interventions by MET are provided in table 3. Changes in clinical practice One MET call lead to specification of individual MET criteria for selected patients discharged from the recovery room of the operating theatre. Another patient who died in the transition

(13/10/2014 Final Version) Page 241
Author; Date; Country; Title
Purpose Design Settings/Participants Intervention Clinical Data Collection Method/Analysis
Outcomes/Results
Telephonists were instructed to regard calls for any type of medical assistance as a MET call. Telephonists then: (1) issued a loud-speaker MET call (for example, ‘‘MET ward X’’); (2) paged MET team members via beepers and personal data screens in ICU; and (3) telephoned ICU directly advising staff of a call and location. At the scene, the MET provided immediate medical treatment as required, then communicated with the admitting bed-card unit members to formulate further treatment, and completed a standard MET data sheet which was collected by the investigators. To prevent discouragement of junior staff, particularly nurses, to make calls, MET members were instructed not to make adverse comments on the appropriateness or otherwise of calls and to adopt a supportive attitude.
period had been a recent ICU patient and had been discharged at a time when transgressing MET criteria. Subsequently, all patients leaving ICU have specified MET criteria and are reviewed on the ward by ICU staff in the evening of the day of discharge. Admissions to and mortality in intensive care Unplanned admissions to ICU from wards increased from a mean of 20 (SD 6) per month to 24 (SD 9) (p=0.074), representing an increase from 17.3% to 21.3% of total ICU admissions. Seventy seven patients were admitted to ICU after MET calls. Of these, four died in ICU and eight died after discharge during palliation. Deaths among ICU patients admitted unplanned from the wards decreased from 66/809 (8.2%) pre-MET to 15/287 (5.2%) post-MET. The incidence of death among all admissions to ICU was 5.7% (266/4666) pre-MET and 4.8% (65/1344) after MET was introduced.
Tibballs & Kinney (2009) Australia Reduction of hospital mortality and of preventable cardiac arrest and death on introduction of a pediatric medical emergency
To determine the effect of a MET service on the incidence of unexpected cardiac arrest and death in a pediatric hospital after 4 years of operation. Hypothesis – intervention on attainment of any call criteria would prevent
Comparison of retrospective data (pre-MET) before introduction of MET with prospective data after introduction of MET system (post-MET)
215 bed inpatient tertiary care pediatric hospital, Royal Children’s Hospital Melbourne N=104780 admissions during a 41 month period pre-MET N=138424 admissions during a 48 month period post-MET
Paediatric MET Calling criteria The pediatric MET calling criteria were adapted from adult MET calling criteria with the addition of age-related abnormal recordings of heart rate, respiratory rate, and blood pressure. The full MET calling criteria are ‘any one or more of’ the following (1) Staff member or parent worried about clinical state (2) Airway threat (3) Hypoxaemia: SpO2 <90% in any
Activity of a “code blue” (cardiorespiratory arrest) team, patient management, and outcomes (cardiac arrest and death) recorded over the period from April 1999 to August 2002 (41 months). After a 3-month period of staff education and introduction, recorded activity of a MET service and patient outcomes over a similar period of time (48 months) from December 2002 until November 2006.
Pre-MET (code-blue era) Total hospital deaths 459 (4.38/1000 admissions) among 104,780 admissions including 266 deaths among 4666 admissions to ICU (5.7%) 166 ward calls for emergency assistance of which 28 were for unexpected cardiac arrest 8 excluded from analysis (pre-arrest status was either unknown or not relevant to the issue of prevention) N=158 calls for inpatients Code rates 20 children, mean age 3.6 years (range, 2 weeks–17 years), had unexpected

(13/10/2014 Final Version) Page 242
Author; Date; Country; Title
Purpose Design Settings/Participants Intervention Clinical Data Collection Method/Analysis
Outcomes/Results
team Follow up report
subsequent cardiac arrest.
amount of oxygen; SpO2 <60% in any amount of oxygen (cyanotic heart disease) (4) Severe respiratory distress, apnoea or cyanosis (5) Tachypnoea (12 years+ >30; 5-12 years >30; 1-4 years >40; 4-12 months >50; Term-3 months >60) (6) Tachycardia or bradycardia (12 years+ <60 >130; 5-12 years <80 >140; 1-4 years <90 >160; 4-12 months <100 >180; Term-3 months <100 >180) (7) Hypotension (12 years+ <90; 5-12 years <80; 1-4 years <70; 4-12 months <60; Term-3 months <50) (8) Acute change in neurological status or convulsion (9) Cardiac or respiratory arrest Who can activate? Any staff member, irrespective of rank, may summon the MET without having to inform senior colleagues, and nurses may initiate a call without having to discuss the patient with physicians. Process of activation To summon MET, a staff member calls switchboard on a dedicated internal phone number. The MET team members are immediately notified of the location of the call by personal pagers, via an announcement on the public address system and by a telephone call from switchboard to the PICU. The response system is single
Compared the occurrence of hospital death and the outcomes of cardiac arrest during eras of similar duration: 1999–2002 (41 months) when a code blue system (pre-MET) operated, with that during 2002–2006 (48 months) when MET operated (post-MET) Cardiac arrest defined as any need to give external cardiac compression Retrospectively examined the symptoms and signs of patients in the 6 hours before cardiac arrest to determine whether they had fulfilled the MET calling criteria Regarded cardiac arrest in children who had attained the calling criteria as “preventable” Arrests which had occurred in children without attaining calling criteria were regarded as “non-preventable”
cardiac arrests in this era (0.19/1000 admissions) Among these, preventable cardiac arrest occurred in 17 patients whose clinical condition fulfilled MET calling criteria and non-preventable cardiac arrest in 3 whose condition did not fulfill MET calling criteria in the 6 hours before arrest Deaths Of the 13 patients (0.12/1000 admissions) who died (0.12/1000 admissions), 12 had fulfilled MET calling criteria and 1 had not. Seven patients (35%) survived. The initial cardiac rhythms at the time of arrest in these 20 patients were hypotensive– bradycardia 8 (40%), asystole 7 (35%), pulseless electrical activity 3 (15%), ventricular fibrillation 2 (10%). Post-MET Era Admissions to hospital 138,424 with 398 deaths (2.87/1000 admissions) (average 100 per annum) including 228 deaths among 5753 ICU admissions (3.96%). Code rates 24 unexpected cardiac arrests occurred in a total of 23 ward children with a mean age 3.5 years (range, 2 weeks–16 years). This yields an unexpected cardiac arrest rate of 0.17/1000 admissions. Preventable cardiac arrest occurred in 10 children whose condition had triggered a MET call, whereas non-preventable cardiac arrest occurred in 14 children whose conditions had not

(13/10/2014 Final Version) Page 243
Author; Date; Country; Title
Purpose Design Settings/Participants Intervention Clinical Data Collection Method/Analysis
Outcomes/Results
tier, that is, it is not differentiated according to severity of the patient’s condition, for example to regard cardiorespiratory arrest as a more urgent condition than respiratory distress alone. The MET members do not know the condition of the patient until their arrival at the scene. The MET members give immediate emergency treatment as required and then communicate with physicians otherwise responsible for the patient to formulate further management. Availability The MET system operates 24hrs/day every day with no reduction of capability at any time. Education The MET system was introduced to all junior and senior hospital medical officers by mail in early September 2002. Then followed an extensive day and night time educational program for nurses and doctors over a period of 3 months. Informal open teaching for nurses and medical staff were held and additional educational sessions offered. “Sick child” workshops were introduced to reinforce the clinical features of serious illness and the MET calling criteria. The number of places in Advanced Pediatric Life Support courses was increased. A series of clinical practice reviews, open to all staff, were conducted in
been preceded by attainment of MET calling criteria Deaths 6 children subsequently died (0.04/1000 admissions) of whom 2 had fulfilled MET calling criteria, whereas 4 did not. 17 patients (74%) survived. The initial cardiac rhythms were hypotensive–bradycardia 15 (63%), asystole 6 (25%), ventricular fibrillation 2 (8%), and pulseless electrical activity 1 (4%). MET calls 956 calls made for emergency medical assistance; of these, 809 were for inpatients and 147 were for visitors, staff, or outpatients. There were more MET calls during the day hours (0700 –1900hours) compared with the “out of hours” period (64% vs. 36%, p < 0.001) The ratio of calls for inpatients in the post-MET era compared with the pre-MET code blue era is 4.4:1. The children’s ages were: <4 months, 161 (20%); >=4 to <12 months, 124 (15%); >=1 to <5 years, 206 (26%); >=5 to <12 years, 132 (16%); >=12 years, 184 (23%). The ages of two children are unknown. Reasons for calls/triggers Over this period, the principal triggers (nonexclusive) to call MET were low SpO2 (46%); respiratory distress, apnea, or cyanosis (40%); “staff/parent worried (concerned) about patient” (26%); airway threat (23%); change in neurologic status (14%); tachycardia

(13/10/2014 Final Version) Page 244
Author; Date; Country; Title
Purpose Design Settings/Participants Intervention Clinical Data Collection Method/Analysis
Outcomes/Results
which the rationale and criteria for calling MET were presented with illustrative cases. This period was a transition from the previous pre-MET (code blue) era in which medical assistance was summoned urgently only when a patient was in cardiac or respiratory arrest. Cost / staffing levels Two additional nurses but no additional medical officers were appointed to the fulltime staff of the ICU. The service was directed by the hospital’s resuscitation officer (already appointed) and a nurse MET coordinating part-time position was created. The composition of the MET was initially five members comprising an ICU physician (consultant/registrar) and nurse, emergency department doctor, and nurse and medical registrar. After operation of the system for 6 months, the emergency department nurses withdrew from the service with the realization that four personnel were sufficient.
(14%); tachypnea (12%); seizures (12%); bradycardia (8%); hypotension (5%); cardiac arrest (2%); and respiratory arrest (1%). Who made the calls 64% percent of calls for assistance were made by a nurse alone, 16% by a nurse and a doctor together, 10% by a doctor alone, and 10% by other personnel, including one call by a parent. Interventions required The principal therapies (nonexclusive) provided by the MET were oxygen (30%), resuscitative fluids (23%), bag-mask ventilation (19%), peripheral venous cannulation (17%), basic airway support (9%), endotracheal intubation (8%), continuous positive airway pressure or bilevel positive airway pressure (7%), and resuscitative drugs (4%). Infrequently needed therapies were external cardiac compression (2%), intraosseous cannula insertion (1%), and direct current shock (0.5%). In 16% of calls, only advice was required. Transfer to ICU 47% of patients subject to a MET call were transferred directly to the ICU after stabilization on the ward. A further 26% were later reviewed on the ward by a MET member, 23% remained on the ward without further review, and 4% were transferred elsewhere, for example to the operating theatre, to another ward, emergency department (for example from the day surgery unit), or who died at the time of the MET call on a ward (five patients) Changes in Risk of Hospital Death and Ward Unexpected Cardiac Arrest and

(13/10/2014 Final Version) Page 245
Author; Date; Country; Title
Purpose Design Settings/Participants Intervention Clinical Data Collection Method/Analysis
Outcomes/Results
Death The incidence of hospital death decreased from 4.38/1000 admissions to 2.87/1000 admissions with an average reduction of 34 deaths per annum. The incidence of unexpected in-hospital ward deaths decreased from 0.12/1000 in the pre-MET era to 0.04/1000 in the post-MET era whereas the incidence of total unexpected ward cardiac arrest did not change from 0.19/1000 to 0.17/1000. One unexpected death was prevented for approximately every 12,400 admissions, which equates to three deaths per annum or one death every 72 MET calls. Among patients whose condition fulfilled MET calling criteria (preventable cardiac arrest), the incidence of arrest decreased from 0.16/1000 in the pre-MET era to 0.07/1000 in the post-MET era whereas the incidence of subsequent death decreased from 0.11/1000 to 0.01/ 1000 admissions. Among patients whose condition did not fulfill MET calling criteria (non-preventable cardiac arrest), the incidence of arrest increased from 0.03/1000 in the pre-MET era to 0.10/1000 in the post-MET era but the incidence of subsequent death did not change from 0.01/1000 to 0.03/1000. Survival from cardiac arrest increased from 7 of 20 patients to 17 of 23.
VanVoorhis & Willis (2009)
Presentation of two case examples to
Two case examples
Case example 1 North Carolina Children’s Hospital, University of
Case example 1 Institution-wide pediatric rapid response system (PRRS) active
Case example 1 Since implementation, RRS evaluated by prospectively
Case example 1 Changes made to the RRS based on evaluations to further decrease

(13/10/2014 Final Version) Page 246
Author; Date; Country; Title
Purpose Design Settings/Participants Intervention Clinical Data Collection Method/Analysis
Outcomes/Results
USA Implementing a pediatric rapid response system to improve quality and patient safety
highlight the process of developing a pediatric rapid response system and measuring its effects on patient safety at North Carolina Children’s Hospital and Levine Children’s Hospital
North Carolina-Chapel Hill Case example 2 Levine Children’s Hospital (LCH), Charlotte, North Carolina
at North Carolina Children’s Hospital since August 2005 Calling criteria for activation of RRT were designed without numeric vital sign parameters to be highly sensitive for pre–cardiac arrest states Criteria for activation are displayed in poster format throughout the hospital The afferent limb (component of emergency response system that is able to detect an event and trigger a response) relies on human assessment and interpretation of monitoring to detect an event and activate the RRT. The primary system change is the empowerment of any member of the hospital staff or family member to activate the RRT. Process of activation The RRT is activated though both a pager call to team members and a public announcement. A public announcement is used not only to notify the RRT members but also the primary team to assist in the decision-making process and foster acceptance of the team to other hospital staff. The efferent limb (provides a crisis response including resources such as a medical emergency team or rapid response team and equipment), or RRT, includes a pediatric critical care fellow or attending, a senior resident, a critical care charge nurse, and a pediatric
collected data recorded on RRT activation forms and existing performance improvement database information. The administrative committee meets monthly to review the data collected and discuss individual cases that prompted additional safety concerns. Further root cause analyses are performed as needed to address these safety concerns. Case example 2 After the patient has been stabilized, a brief record is completed to document which staff member initiated the call, reason for the call, assessment and intervention measures, and outcomes. In addition, the patient’s bedside nurse completes a feedback tool to record response time; quality of communication between the PERT members, primary inpatient team, nursing staff, and patient/family; and suggestions for improvement.
variation in response and improve safety
A new policy preventing the cancellation of a ‘‘code blue’’ or RRT call was implemented to reinforce the concept that there are no false alarms.
The pediatric ICU staff began activating the RRT for urgent consults when it was identified that the team was not being used fully.
Individual cases are discussed formally at a monthly resident conference to reinforce management and resuscitation of the critically ill pediatric patient.
As a result of the RRS, the mean time interval between cardiac arrests increased significantly from a baseline of 2512 to 9418 days, indicating a significant decrease in non-ICU cardiac arrests. Median duration of predefined clinical instability before assessment by ICU personnel decreased from 9 hours 55 minutes to 4 hours 15 minutes post intervention (P = .028). The duration of clinical instability significantly decreased for unplanned ICU admissions whether assessed by the RRT or not, indicating that implementation of a RRS resulted in a hospital-wide culture change favouring early assessment by critical care personnel. Culture change - avoidance of delayed MET activation should be a priority for hospitals operating rapid response systems Case example 2 PERT calls at LCH increased
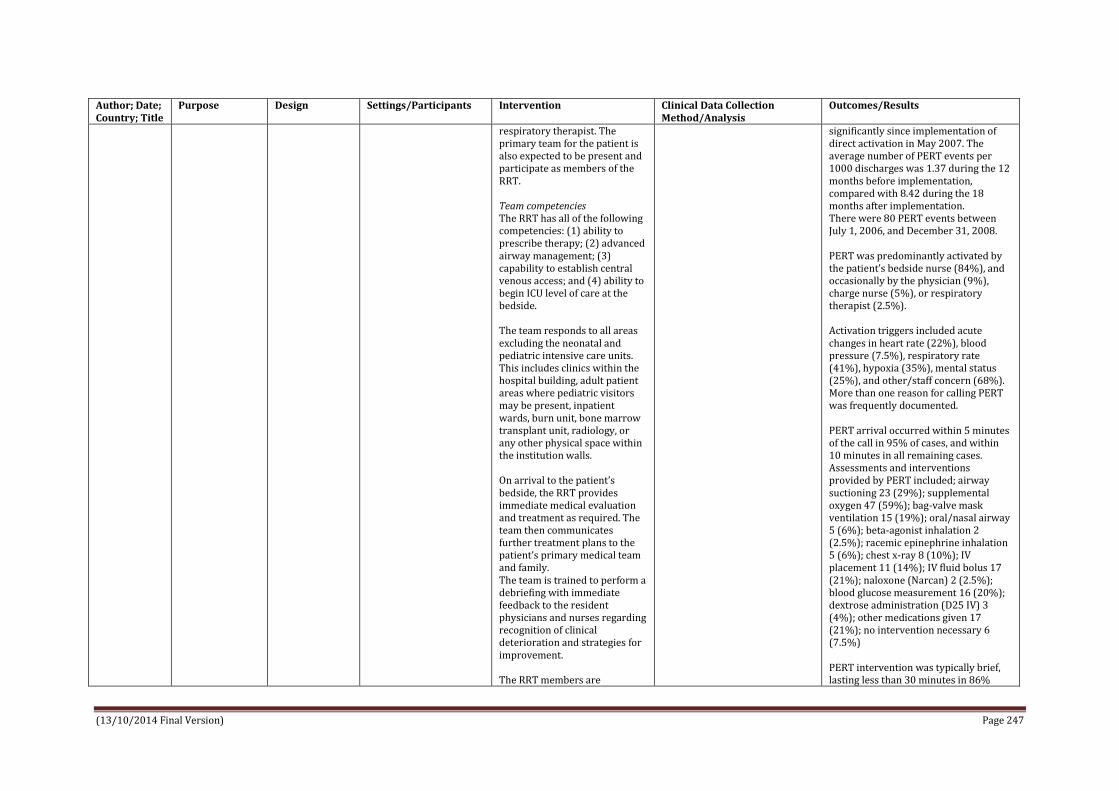
(13/10/2014 Final Version) Page 247
Author; Date; Country; Title
Purpose Design Settings/Participants Intervention Clinical Data Collection Method/Analysis
Outcomes/Results
respiratory therapist. The primary team for the patient is also expected to be present and participate as members of the RRT. Team competencies The RRT has all of the following competencies: (1) ability to prescribe therapy; (2) advanced airway management; (3) capability to establish central venous access; and (4) ability to begin ICU level of care at the bedside. The team responds to all areas excluding the neonatal and pediatric intensive care units. This includes clinics within the hospital building, adult patient areas where pediatric visitors may be present, inpatient wards, burn unit, bone marrow transplant unit, radiology, or any other physical space within the institution walls. On arrival to the patient’s bedside, the RRT provides immediate medical evaluation and treatment as required. The team then communicates further treatment plans to the patient’s primary medical team and family. The team is trained to perform a debriefing with immediate feedback to the resident physicians and nurses regarding recognition of clinical deterioration and strategies for improvement. The RRT members are
significantly since implementation of direct activation in May 2007. The average number of PERT events per 1000 discharges was 1.37 during the 12 months before implementation, compared with 8.42 during the 18 months after implementation. There were 80 PERT events between July 1, 2006, and December 31, 2008. PERT was predominantly activated by the patient’s bedside nurse (84%), and occasionally by the physician (9%), charge nurse (5%), or respiratory therapist (2.5%). Activation triggers included acute changes in heart rate (22%), blood pressure (7.5%), respiratory rate (41%), hypoxia (35%), mental status (25%), and other/staff concern (68%). More than one reason for calling PERT was frequently documented. PERT arrival occurred within 5 minutes of the call in 95% of cases, and within 10 minutes in all remaining cases. Assessments and interventions provided by PERT included; airway suctioning 23 (29%); supplemental oxygen 47 (59%); bag-valve mask ventilation 15 (19%); oral/nasal airway 5 (6%); beta-agonist inhalation 2 (2.5%); racemic epinephrine inhalation 5 (6%); chest x-ray 8 (10%); IV placement 11 (14%); IV fluid bolus 17 (21%); naloxone (Narcan) 2 (2.5%); blood glucose measurement 16 (20%); dextrose administration (D25 IV) 3 (4%); other medications given 17 (21%); no intervention necessary 6 (7.5%) PERT intervention was typically brief, lasting less than 30 minutes in 86%

(13/10/2014 Final Version) Page 248
Author; Date; Country; Title
Purpose Design Settings/Participants Intervention Clinical Data Collection Method/Analysis
Outcomes/Results
instructed to adopt a supportive attitude and not to make negative comments. An RRT activation form is completed by the pediatric critical care physician and then collected for performance improvement. The administrative (exists to implement and sustain the service) and process (exists to improve patient care and safety) improvement limbs are necessary for implementing and sustaining the system. Education Before implementation, a 4-month period of educational sessions for all medical staff including physicians, nurses, respiratory therapists, chaplains, security, and communications staff was completed. During these sessions, criteria for activation of the RRT were reviewed, illustrative cases discussed, and concerns and questions addressed. Once education was complete, the system changes were initiated without a run-in period. Case example 2 Institution-wide Pediatric Early Response Team (PERT) initiated at LCH in 2004 having evolved since then. The initial afferent system for identifying a deteriorating patient used evidence-based criteria for
(69/80) of cases. Nine cases lasted 30 to 60 minutes, and two cases lasted 60 to 90 minutes. Education to initiate ICU transfer for interventions lasting more than 30 minutes was provided. Following PERT intervention, 56% (45/80) of patients remained on the general or progressive floor, whereas 39% (31/80) were transferred to the ICU, including three cases where the patient required resuscitation for cardiac arrest on the general ward. Four patients requiring PERT intervention were admitted to the hospital from an outpatient area such as radiology or dialysis following the event. LCH opened in Dec. 2007, 6 months after implementation of the revised PERT system. Despite a 10% increase in inpatient volume in 2008 compared with 2007, the mean rate of non-ICU codes (defined at LCH as either cardiac or respiratory arrest) decreased to 1.5 per 1000 discharges. The rate of codes outside the ICU had previously been approximately four cases per 1000 discharges. Interestingly, there were zero non-ICU codes during the period of intense education about upcoming changes to PERT. Since the PERT revision, the rate of non-ICU codes has remained below 2.25 per 1000 discharges, even during periods when total pediatric codes (ICU 1 non-ICU) exceeded 10 per 1000 discharges. Post-implementation of family activation Since the introduction of family activation, the mean number of RRT calls has increased significantly from 16

(13/10/2014 Final Version) Page 249
Author; Date; Country; Title
Purpose Design Settings/Participants Intervention Clinical Data Collection Method/Analysis
Outcomes/Results
airway, breathing, circulatory, and neurologic concerns, but activating the efferent response was inefficient and cumbersome. The nurse typically paged the inpatient physician and charge nurse and waited for recommendations or ‘‘permission’’ to have the ICU team evaluate the patient. In 2007, a multidisciplinary task force including representatives from critical care, inpatient general paediatrics, nursing, respiratory care, and risk management began a collaboration to enhance the system by adopting the latest evidence-based strategies. LCH adopted the simple age neutral activation criteria - acute change in HR, BP, RR, O2 Sat; acute change in mental status; pain or agitation that is difficult to control; new or prolonged seizure; staff member is worried about a patient The revised system empowers concerned staff members to activate PERT by calling the hospital paging operator. A group text page immediately informs PERT members, including a pediatric hospitalist, supervising resident physician, critical care charge nurse, and pediatric respiratory therapist. Each PERT member has authority to implement a wide range of standing orders, including transfer to a higher level of care.
to 24 calls per 1000 discharges. The number of rapid response calls made directly by a family member is very low—only two calls during the first year of implementation. Many staff members have indicated that families prefer to have a medical professional call on their behalf. Despite this fact, family concern continues to be recorded as a reason for activation in 6% of all calls. Efforts to provide education to patients and families about rapid response systems serve not only to help them summon care in a time of need, but also to move toward a hospital-wide culture of recognizing families as critical members of the medical team. USE OF RAPID RESPONSE SYSTEM FOR QUALITY IMPROVEMENT - There are many reported benefits of rapid response systems beyond a reduction in cardiac arrest and mortality rates. These include;
improved staff satisfaction and safety culture
improved nursing documentation
earlier palliative care improved education for
physician trainees In addition, rapid response and medical emergency team activations can be used for detection of medical errors and system safety issues

(13/10/2014 Final Version) Page 250
Author; Date; Country; Title
Purpose Design Settings/Participants Intervention Clinical Data Collection Method/Analysis
Outcomes/Results
Staff members initiate PERT are acknowledged for their commitment to patient safety by a personalized letter from the chief nursing officer and chief medical officer. There are no ‘‘false alarms.’’ Implementation of family activation At LCH family members are encouraged to immediately notify a staff member when they are concerned about their child. The NC Children’s Hospital used a similar approach initially. During the first year after implementation of the PRRS at NC Children’s Hospital, ‘‘family concern’’ was one of the reasons for activation in 8% of the calls. More than half of those patients required transfer to the ICU, demonstrating that the calls were appropriate and necessary. In the spring of 2007, after piloting the system in two units, family activation was introduced throughout the institution, allowing families to directly activate the RRT using the same system as the hospital staff without a triage step. At NC Children’s Hospital, members of the medical staff feared that family activation would result in numerous calls for non-emergent situations as well as calls that would be better routed to patient relations representatives. Focus groups, open communication, and finally a pilot of family

(13/10/2014 Final Version) Page 251
Author; Date; Country; Title
Purpose Design Settings/Participants Intervention Clinical Data Collection Method/Analysis
Outcomes/Results
activation on two units of the institution reassured the medical staff and families that the introduction of family activation would not disrupt or overwhelm the existing rapid response system. The rule of ‘‘no false alarms’’ helps all staff understand that any serious concern of a family member or a member of the child’s medical team is valid cause for activating the system. At the time of admission, all patients and families are educated about the RRT by their nurse. If families are not educated at the time of admission, several educational tools are available to ensure that families are fully equipped to activate the RRT. The key elements of the family activation and education include staff education and mock scripts, bilingual flyers in visitor areas and waiting rooms, electronic chart education reminders for nurses, and large colorful bilingual posters in each patient room. The posters serve as a both a reminder of the number to call and a prompt for nurses to provide education at the time of admission. A tear-off card mechanism for activation by non–English-speaking families is available next to the poster in every room. Audits and interviews with families to assess their understanding of the RRT in their own words are conducted routinely, with feedback provided to the unit staff.

(13/10/2014 Final Version) Page 252
Author; Date; Country; Title
Purpose Design Settings/Participants Intervention Clinical Data Collection Method/Analysis
Outcomes/Results
Through audits, it has been discovered that the poster alone is not sufficient education for families. In fact, many families have never read the information unless their nurse mentioned it at the time of admission. Without the poster, however, it may be difficult to remember the phone number to call to activate the team. In addition to the other tools, information about the RRT is included in the hospital guide that is provided to families at the time of admission.
Wang et al. (2010) USA Retrospective review of emergency response activations during 13-month period at a tertiary care children’s hospital
To describe demographic and clinical variables including outcomes of emergency response team (ERT) activations at a free-standing tertiary care children’s hospital
Retrospective database review
The Children’s hospital (TCH), Denvor 270 inpatient bed tertiary care free standing children’s hospital N=1334 ERT activations Median age was 1.8 years, with a range of 0 to 29 years.
COR – cardiac or respiratory event team in place since 1992 Evolved into ERT – emergency response team ERT - a single number activated by any medical staff is used to call the operator who activates the ERT via overhead paging and via code pager system. Team Composition 14 member ERT PICU/CICU/anaesthesia/surgical fellows, ED attending, in-house residents, PICU/CICU/ED charge nurse, nursing supervisor, resource RN, pharmacist, respiratory therapist, and a messenger Calling criteria An ERT activation could have been triggered by any event that was felt to be emergent, life threatening, and/or needing immediate medical attention. Debriefing After the event, a debriefing
Retrospective review of database of ERT activations Database maintained since inception of COR/ERT at TCH 16 years ago.
Data collected included date, time, medical record number, location, primary care service, age, sex, primary and secondary diagnoses, and disposition. Medical records of documented ERT activations were reviewed for missing information and/or clarification of the events. Categories entered in SPSS were; age, sex, admission diagnosis, precipitating event, percentage of admissions, acute vs. chronic diagnosis, winter vs. non-winter months (October-March/April-September), day (6 am-6pm) and night (6 pm-6 am) shifts, survival of ERT activation, survival to discharge, and primary attending service.
1334 ERT activations analysed A total of 39% (511) of all ERT activations occurred in patients under the age of 1 year with the highest incidence between 1 month and 1 year. Overall, the children at highest risk were males less than 1 year of age with a chronic diagnosis. There was no statistical difference between non-winter (April-September) and winter (October-March) months. Statistically, there were significantly more ERT activations during day shifts (6 am-6 pm) as compared to night shifts (P < 0.001). The most common admission diagnosis and underlying chronic condition was cardiac disease; other common admission diagnoses were infectious disease, trauma, and pulmonary disease. The medical categories of admission diagnosis included congenital/metabolic (39%), gastrointestinal (29%), renal (18%), rheumatology (4%), toxicology (4%), psychiatry (3%), endocrine (2%), and allergy (1%). The surgery category of

(13/10/2014 Final Version) Page 253
Author; Date; Country; Title
Purpose Design Settings/Participants Intervention Clinical Data Collection Method/Analysis
Outcomes/Results
form was filled out about the event.
admission diagnosis included otolaryngology (63%), orthopedics (28%), urology (4%), dental (4%), and ophthalmology (1%). Patients’ survival rate after an ERT itself was 90%, with an overall survival rate to discharge of 78%. Survival rate to discharge of those patients who survived the ERT event was 87%. Two patients were missing survival event data and 137 patients were missing survival to discharge data.
Zenker et al. (2007) USA Implementation and Impact of a Rapid Response Team in a Children’s Hospital
To evaluate the effectiveness and impact of implementing the RRT concept
Pre and post design Staff satisfaction survey
Children’s Hospitals and Clinics of Minnesota Pre RRT implementation (23-month period) Post RRT implementation (12-month period)
Paediatric Rapid Response Team First responder team Team Composition (nurse led team) Respiratory therapist An experienced paediatric ICU/PICU nurse Who can activate? Anyone, including nurses, staff and patients who have a concern about a worrisome patient RRT distinct from code team Availability Can be called anytime there is a concerns about a child’s condition but before child arrests Available to all patient care areas, excluding emergency department and ICU Change in Culture of Organisation Implementation steps (many proceeded simultaneously) Define goals of RRT process
Arrests, either respiratory or cardiac, defined as those code calls requiring at a minimum assistance with ventilation Arrest data from pre-implementation phase analysed retrospectively whereas code and RRT activations tracked prospectively Source for RRT information – RRT consultation record completed by the team and kept in patient’s chart; records abstracted by data record services during chart review following discharge 2nd method of tracking RRT activations = RRT log kept in PICU These two sources were cross-checked regularly The following data was captured age, diagnosis, medications, past medical history, date and time of RRT request and arrival, person who activated the RRT and reason why, patient vital signs, interventions performed or recommended by RRT, contact
RRT activation rates During year following RRT implementation 11682 discharges and 49085 patient-days 150 activations (2 requested by parents) called resulting in rates of 12.84 RRT activations per 1000 discharges and 3.06 per 1000 patient-days Sources and timing of calls More than 39% (n=59) of RTT calls occurred with 24hrs of admittance. More calls 39% over weekends, during evening 3pm-11pm (39%) & night 11pm-7am (35%) – whilst attending staff are not in-house RRT median response time 5 min (range 1-32min); median time at bedside 20min (range from 5-135 min) More calls in winter and early spring months with peak of 12 calls per 100 discharges; additional calls from Dec through April fully attributable to bronchiolitis Concerns Respiratory concerns were most

(13/10/2014 Final Version) Page 254
Author; Date; Country; Title
Purpose Design Settings/Participants Intervention Clinical Data Collection Method/Analysis
Outcomes/Results
Decide who part of RRT Change medical policy – expectation that notification of worried patient condition change needed a time-limited response and urgent concern warranted RRT call Gain admitting physician acceptance Specify logistics for activating RRT and its response Establish roles Develop documentation and evaluation forms Create protocol for PICU nurses and respiratory therapists on RRT Educate and train all personnel on RTT process Educate medical-surgical staff nurses on signs of clinical deterioration that should lead to RRT response Plan and define parent involvement in the process Gain trust of staff nurses to ask for help Clarify the difference between calling the code team and calling RRT Plan for ongoing education and reminders Develop data abstraction procedures and plans for studying the RRT process Education: All clinical staff educated on RRT process. Medical-surgical unit staff nurses educated on signs of deterioration that should lead to RTT call. Deterioration = review of abnormal vital signs, shock,
with the attending and possibly PICU physicians and disposition Also notable deterioration in time preceding RRT call abstracted from medical records Survey Staff satisfaction measured with 3-point Likert scale and open-ended questions about improving the process Comparison of mortality and arrests between the pre and post RRT implementation phases based on all hospitalised patients with exclusion of those in neonatal ICU and emergency room
common RRT call concern with 56% (84/150) listing a change in respiratory rate or effort and 26% (39/150) noting oxygen desaturation. More than one reason was possible for each call Although nurses had defined criteria for abnormal vital signs that would warrant concern and could trigger an RRT call these often were not documented in nurses’ notes – it appeared calls were made more often on subjective assessment that the child had deteriorated from previous baseline Actions PICU transfers occurred for 54 (36%) of the 150 cases and for 2 of these the RRT initiated a code blue. The transferred patients received a variety of significant interventions primarily respiratory N=11/54 intubated N=9/54 high flow nasal oxygen N=6/54 CPAP or BIPAP N=4 increased (usually continuous) nebulize therapy N=3 on hellox Another 3 placed on vasopressors to support BP; 1 was cardioverted Other category = frequent airway suctioning; prompt stimulation for apnoeic spells For 96 patients not transferred to PICU, 73 (76%) received some medical intervention. Respiratory interventions predominated with 24 patients needing supplemental oxygen, 20 suctioning, 12 nebulized therapy, 6 CPAP or BIPAP. Others received fluids (10), medications (9), other medical interventions (9) 127/150 (84.7%) children received some medical intervention

(13/10/2014 Final Version) Page 255
Author; Date; Country; Title
Purpose Design Settings/Participants Intervention Clinical Data Collection Method/Analysis
Outcomes/Results
respiratory distress, mental status changes, subjective concern that patient was deteriorating.
Outcomes Mortality rate was unchanged from the 22561 discharges during the longer pre-implementation to the 11682 discharges during RRT implementation phase (4.3 versus 4.5 per 1000 discharges p=.57) Incidence of arrests both cardiac and respiratory decreased from 8 to 5.1 per 1000 discharges a decrease of 36% (p=.19) Staff satisfaction Satisfaction surveys completed during 12-month following implementation by 65% of 98 RRT requestors showed that 87% reported that they were very satisfied rather than somewhat satisfied or not satisfied

(13/10/2014 Final Version) Page 256
APPENDIX 24
Data extraction
Family activated response systems

(13/10/2014 Final Version) Page 257
Data Extraction: Family activated response systems for timely identification of child clinical deterioration
Author; Date; Country; Title
Purpose Design Settings/Participants Intervention Clinical Data Collection Method/Analysis
Outcomes/Results
Dean et al. (2008) USA Condition HELP: A Pediatric Rapid Response Team Triggered by Patients and Parents
To develop a paediatric patient safety program that gives families an immediate voice in their child’s medical care
Quality Improvement Initiative - 2 year analysis of pediatric patient safety outcomes following implementation of specialised rapid response program for patients/parents
Children’s Hospital of Pittsburgh of the University of Pittsburgh Medical Center (UPMC)
Condition Help Call A process through which patients and families can alert a specialised team to come to bedside immediately in order to access and find solutions for concerns. Paediatric patient and family based program modelled on the concept of RRT Families first asked to voice concerns to bedside nurse before calling a Condition HELP. Families call a specific telephone number at any time of day 24 hours a day 7 days a week if they feel their child’s immediate health is endangered Call can be made internal or external to the hospital Call criteria - a noticeable medical change in patient that not addressed by healthcare team - breakdown in how care is being delivered or uncertainty in patients treatment - patient receives medication that patient or family feels will have adverse effects or that not explained to patient / family by medical team - patient receives treatment or medication that he/she/family feels is intended for another patient or believes is different from what doctor ordered Condition Help receives same attention as life-threatening
Condition HELP program explained to families at time of admittance by nurse assigned to patient. Information brochure (helpline number provided) and video. Outcomes Number of calls to Condition Help Reasons for calls to Condition Help
42 calls from patients and parents to Condition HELP team over the 24 month study period Main reason for each call - communication breakdown between patient/parents and the clinical staff (physician/nurse) 42 calls related to: management, coordination or plan of care (15 calls); medication or pain control (9 calls); discharge (6 calls); dietary status (6 calls); delays (6 calls) Quality improvement changes following implementation of family activated response systems Improved communication/verbalisation between radiology staff, unit staff, patient and families of realistic expectations – time delays now rare and family satisfaction rated higher. Verbal discussions of pain management plans between physicians, patient and families at three intervals: immediately post-op; when changes to plan occur and at transfer/discharge. Creation of discharge plan from time of admittance that evolves throughout stay with active involvement by patient and family Daily ‘patient rounds’ with patient and family involvement to enhance family focused care.

(13/10/2014 Final Version) Page 258
Author; Date; Country; Title
Purpose Design Settings/Participants Intervention Clinical Data Collection Method/Analysis
Outcomes/Results
emergency Deployment of a specialised multidisciplinary rapid response team to child’s bedside Condition Help Team includes; Physician, A nursing supervisor and Patient advocate If team identify physiological changes the call is escalated to Condition A (CPA) or Condition C (crisis that may result in immediate arrest) with RRT summoned SBAR used in documentation of Condition HELP Condition Help incidents reviewed for safety lessons by team within 5 days. Steering committee coordinates and governs Condition HELP: Chief medical officer, chief nursing office, chief quality officer; patient representative, physician chair of residency program; 1 chief resident;2 nursing patient-service managers; nursing director; 2 parents
Hueckel et al. (2012) USA Implementation of Condition Help Family Teaching and Evaluation
To increase nursing and family awareness about Condition H on 2 inpatient pediatric units using scripted family teaching at the time of patient
Quality improvement initiative – family education about Condition Help and follow up Survey (12 week pilot) Education
Duke University Hospital - Children’s Health Center ; 186-bed children’s hospital, incl. PICUs (74 beds), pediatric bone marrow transplant unit (PBMTU), ambulatory specialty clinics . Pilot on 2 inpatient
PRRT @ hospital with team members including acute care pediatric nurse practitioner, PICU charge nurse and pediatric critical care respiratory therapist PRRT responds to acute patient care needs throughout the 186-bed children’s hospital, including PICUs (74 beds), the
Survey on families understanding of Condition H - 3 questions (if received information about Condition H, describe in own words why might call Condition H, to show surveyor that they understand how to call a Condition H or where to locate number)
Nurse education - attendance at RR/Condition H education events and completion of self-learning modules PBMTU – all nurses attended at least one education activity Intermediate ward – 70% nurses attended an education opportunity
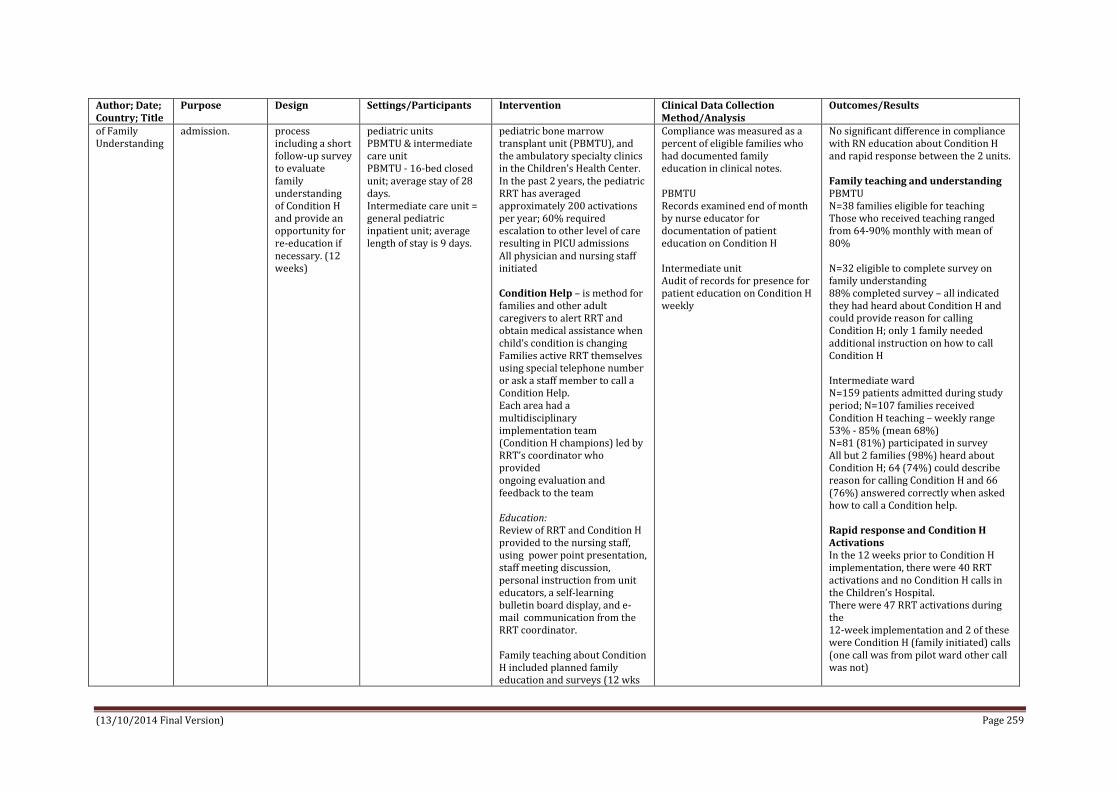
(13/10/2014 Final Version) Page 259
Author; Date; Country; Title
Purpose Design Settings/Participants Intervention Clinical Data Collection Method/Analysis
Outcomes/Results
of Family Understanding
admission.
process including a short follow-up survey to evaluate family understanding of Condition H and provide an opportunity for re-education if necessary. (12 weeks)
pediatric units PBMTU & intermediate care unit PBMTU - 16-bed closed unit; average stay of 28 days. Intermediate care unit = general pediatric inpatient unit; average length of stay is 9 days.
pediatric bone marrow transplant unit (PBMTU), and the ambulatory specialty clinics in the Children’s Health Center. In the past 2 years, the pediatric RRT has averaged approximately 200 activations per year; 60% required escalation to other level of care resulting in PICU admissions All physician and nursing staff initiated Condition Help – is method for families and other adult caregivers to alert RRT and obtain medical assistance when child’s condition is changing Families active RRT themselves using special telephone number or ask a staff member to call a Condition Help. Each area had a multidisciplinary implementation team (Condition H champions) led by RRT’s coordinator who provided ongoing evaluation and feedback to the team Education: Review of RRT and Condition H provided to the nursing staff, using power point presentation, staff meeting discussion, personal instruction from unit educators, a self-learning bulletin board display, and e-mail communication from the RRT coordinator. Family teaching about Condition H included planned family education and surveys (12 wks
Compliance was measured as a percent of eligible families who had documented family education in clinical notes. PBMTU Records examined end of month by nurse educator for documentation of patient education on Condition H Intermediate unit Audit of records for presence for patient education on Condition H weekly
No significant difference in compliance with RN education about Condition H and rapid response between the 2 units. Family teaching and understanding PBMTU N=38 families eligible for teaching Those who received teaching ranged from 64-90% monthly with mean of 80% N=32 eligible to complete survey on family understanding 88% completed survey – all indicated they had heard about Condition H and could provide reason for calling Condition H; only 1 family needed additional instruction on how to call Condition H Intermediate ward N=159 patients admitted during study period; N=107 families received Condition H teaching – weekly range 53% - 85% (mean 68%) N=81 (81%) participated in survey All but 2 families (98%) heard about Condition H; 64 (74%) could describe reason for calling Condition H and 66 (76%) answered correctly when asked how to call a Condition help. Rapid response and Condition H Activations In the 12 weeks prior to Condition H implementation, there were 40 RRT activations and no Condition H calls in the Children’s Hospital. There were 47 RRT activations during the 12-week implementation and 2 of these were Condition H (family initiated) calls (one call was from pilot ward other call was not)

(13/10/2014 Final Version) Page 260
Author; Date; Country; Title
Purpose Design Settings/Participants Intervention Clinical Data Collection Method/Analysis
Outcomes/Results
during Jan- Mar 2011) PBMTU Nurses initiated discussion about Condition H using scripted information tool and documented family teaching on patient education record. Timing of education was during week following patient bone marrow transplant Intermediate Unit Timing of education was at time of admission where narrative scripts and fliers were included as part of admission packet and admitting nurse was responsible for teaching identified family member. Documented received education in patient education record.
2 calls in both cases parents were following up on signs and symptoms they had been told by medical staff to watch for; both appropriate and did not need higher level of care
Paciotti et al. (2014) USA Physician Attitudes Toward Family-Activated Medical Emergency Teams for Hospitalised Children
To explore physician viewpoints on (i) the value that families provide in facilitating the identification of children with deteriorating conditions (ii) possible options of enabling families to independently activate an MET Part of a larger study to evaluate the relationship between RRSs and patient safetly and
Qualitative study Used principles of grounded theory in analysis (constant comparative method)
Children’s Hospital of Philadelphia (CHOP) – urban, tertiary care pediatric hospital; 535 beds, 166 dedicated to ICU Physicians treating children from 0-18yrs old on medical or surgical non-ICU wards with either false negative or false positive EWs. Physicians (n=30); 21 medical, 9 surgical
Hospital at initial phase of implementing FAMET (family activated medical emergency team). CHOP has RSS implemented on all non-intensive care medical and surgical units which includes afferent component of EWS with corresponding care guidelines and an efferent component with a 30-minute response physical led MET (named Critical Assessment Team or CAT) available to activate by any clinician 24/7. Team comprised of 3 responding pediatric ICU clinicians – a fellow, attending, or nurse practitioner, a nurse and a respiratory therapist
Semi-structured interviews Interview guide developed through review of relevant literature and in consultation with experts
Physicians valued family input but had strong negative attitudes towards enabling families to directly access MET. 2 primary themes 1. Physicians depend on families to explain child’s baseline condition and identify changes; 63% (n=19) 2. Physician’s should not be able to directly activate an MET; 93% (n=28) Reasons why not; 2a. Family activation would lead to misuse of resources (64%, n=18) 2b. Families lack training and clinical knowledge to determine when MET call is indicated (43%, n=12) 2c. Family activation would undermine therapeutic relationship between clinicians and families (25%, n=7) 2d. Availability of Family Activation burdens families/increases anxiety (18%, n=5) 2e. Evidence demonstrating a

(13/10/2014 Final Version) Page 261
Author; Date; Country; Title
Purpose Design Settings/Participants Intervention Clinical Data Collection Method/Analysis
Outcomes/Results
specifically to assess physicians and nurses use of EWEs to support decision making regarding patients deterioration
relationship between FAMET implementation and improved patient outcome is needed (18% n=5) CHOP implemented FAMET in Dec 2012 with results of this study informing the development of education materials for clinicians and families which focused on enhanced collaborations between clinicians and families before escalation of care. One FAMET call activated by family member – primary reason for call was communication breakdown between family and staff; outcome was lab testing and consult with specialist services with child remaining on unit and did not require transfer to higher level of care
Ray et al. (2009) North Carolina US Family Alert: implementing direct family activation of a pediatric rapid response team
Implementation of family-activated paediatric RRS; issues that arise during process and strategies for overcoming challenges
Quality improvement initiative – family awareness surveys
North Carolina Children’s Hospital (NCCH) 140 bed hospital
NCCH uses a medical emergency team (MET), led by a pediatric ICU (PICU) fellow or attending physician and includes a PICU charge nurse, a PICU respiratory therapist, a senior pediatric resident, and patient’s primary team. Activation criteria include; staff or family member concerned about the patient; acute change in heart rate; acute change in respiratory rate; acute change in oxygen saturation; acute change in systolic blood pressure; change in mental status; new or prolonged seizure; patient with difficult to control pain or agitation The team is a MET but the hospital use the broader term RRS Developed family activation to empower family members to seek help when serious concerns
Random in-person surveys of families at NCCH to determine how well patients’ families understand family activation and to provide further education when needed. Using a series of questions a staff member asks the family whether they have been told about family activation. If the family members are familiar with the system, they are asked to explain, in their own words, how the system works and when it should be activated. In instances where the family is not aware of the system, the surveyor provides education through a verbal explanation as well as reference to the poster hanging in the patient’s room. Found that surveys must be conducted on an ongoing basis, generally once a month. Without regular feedback to the staff, education efforts and family awareness begin to decline.
Electronic chart reminder of family activation education added to checklist of items that needed to be completed on admission. In a query of electronic charts one year after implementation of family activation, nurses documented 100% of families present at time of admission were orientated to family role in RRS. Data from family surveys indicate much lower percentages of awareness, highlighting that need to learn more about how to educate families and to train staff to deliver information about family activation. Random in-person surveys of 276 families show on average only 27% of families understand when and how to activate RRT. Family awareness which to date has been as high as 58% and as low as 6%, varies greatly between paediatric services and on the same service each month.

(13/10/2014 Final Version) Page 262
Author; Date; Country; Title
Purpose Design Settings/Participants Intervention Clinical Data Collection Method/Analysis
Outcomes/Results
arise – this based on fact that after one year of MET data revealed that “family concern” was one of the reasons for activation in 8% of MET calls at NCCH with more than half of patients requiring transfer to ICU Family activation RRT; families directly activate the RRT by calling an easy-to-remember number from phone in patient’s room or from any other phone in the hospital. Same number used by medical team when it activates the RRT. For all RRT calls, the operator asks the caller for the patient’s name and location & activates the RRT by making an overhead call and a group page. The team arrives to patient’s location within minutes & works with primary medical team to provide assistance to the patient. After the call, RRT members complete a form that includes information about the patient, who made the call, reasons for the call, actions taken during the call, and outcomes of the call. This information is later reviewed to identify areas for improvement as well as outcomes of activations. Staff educated on how to inform/educate families on admission about activating the RRT (mock script developed). Poster in each patient room,
Confidential paper surveys asking family members about their confidence in knowing how to find needed help in an emergency situation and the likelihood that the needed help would respond immediately. Family members were asked to complete the anonymous survey when no staff members were around. Completed surveys were placed in an envelope and returned to a research assistant. We found wide variation in the responses and saw no difference between the surveys conducted before and after the implementation of family activation. Although some of the answers to open-ended questions were helpful, these surveys were not an effective way for us to evaluate family awareness. In particular, if the family member indicated on his or her survey that he or she did not know how to seek help, there was no mechanism for education at that time.
Since introduction of family activation, mean number of RRT calls has increased significantly, from 16 to 24 calls per 1,000 discharges. Family concern was noted as a reason for activation in 5% of all calls, and two calls were directly activated by families in the past year. Insufficient data to evaluate the impact of family activation on cardiac arrests The median number of calendar days between cardiac arrests has increased from 34 days to 104 days since initial implementation of the RRS in 2005 Note: We found that early resistance to the RRS came primarily from physicians who were concerned that their oversight of patient care would be undermined, whereas the nursing staff was generally supportive. In contrast, nurses were more apprehensive about implementing the family activation component because of their own perceived loss of control. Over time, however, the physicians and nurses have come to understand that activation—by staff or families—of the RRT provides a means of improving care for patients.

(13/10/2014 Final Version) Page 263
Author; Date; Country; Title
Purpose Design Settings/Participants Intervention Clinical Data Collection Method/Analysis
Outcomes/Results
information in hospital guide and flyers in family lounges about RRT activation.

(13/10/2014 Final Version) Page 264
APPENDIX 25
Data extraction
Implementation of PEW detection and response systems

(13/10/2014 Final Version) Page 265
Data Extraction – Implementation of PEW detection and response systems
Author; Date; Country; Title
Purpose Design Settings/Participants Intervention Clinical Data Collection Method/Analysis
Outcomes/Results
Demmel et al. (2010) USA Implementation of the Paediatric Early Warning Scoring System on a Paediatric Haematology/Oncology
To implement Paediatric Early Warning Scoring System on a Pediatric Haematology/Oncology
Implementation of PEWS and Development of an algorithm Pilot study
Cincinnati Children’s Hospital Medical Center (CCHMC) general medical unit.
Pilot study trialled on general medical unit. Post-test demonstrated improved patient outcomes following PEWS implementation. Algorithm evaluated and refined, the initiative moved to other units. Haematology/oncology/ bone marrow transplant nursing and medical leadership implemented PEWS post pilot. PEWS team included staff nurses, educators, charge nurses, residents, oncologists, a hematologist, unit nursing leadership, performance improvement facilitators, an ICU staff member and leadership staff from the unit where PEWS was initially implemented at CCHMC Education: Focus on history and development of PEWs; rationale for and the goals of the initiative; scoring process; integration into routine nursing assessments; normal vital sign parameters reviewed. On-going educational training on scoring system; case studies; education presented at staff meetings; education available electronically Interactive case scenario scoring practice; reviewing case histories involving patients staff had previously cared for.
Nursing staff began to score patients every 4hrs based on the PEWS scoring tool to establish baseline scores of our unit’s stable and acutely ill population. Scoring data captured electronically from the documentation of nursing’s patient assessments. Baseline data to compare with post implementation data Historical data collected pertaining to unplanned ICU transfers from oncology unit, changes in patients’ clinical status, frequency of calls to RRT & preventable code rates. Nursing staff scored patients at intervals of every 4hrs for 1mth. PEWS implementation team analysed data and reviewed for any patients transferred to the ICU for clinical deterioration Scores of patients transferred to the ICU retrospectively examined for 5 -24hrs prior to transfer, to assure scoring process appropriately reflected patients’ increasing acuity prior to ICU transfer. Nursing staff posted each patient’s score on unit’s PEWS Score Board, a laminated grid incl. room number & each hour within 24-hour period. Each child’s PEWS score was indicated by drawing a coloured circle on the board at the
Prevention of unit cardiopulmonary arrests Multidisciplinary algorithm developed; defined specific care responses to be implemented by all members of the multidisciplinary team according to the child’s PEWS score. PEWS scoring process improved communication among multidisciplinary team members and defined clear actions for new, less experienced staff members to address patient clinical deterioration. High level of charge nurse involvement helped keep the initiative going shift-to-shift and on weekends. Algorithm defined the threshold for caregiver time to response and the seniority and expertise of personnel to be contacted. Immediately prior to implementation of PEWS, no. of days between cardiopulmonary arrests on unit = 299. Post-implementation, the days between cardiopulmonary arrests on the unit increased to 1,053; sustained at that level for nearly 2 years. Nursing staff reported that scoring a minimum of every 4 hours could be mundane and monotonous for patients that had lower PEWS scores.

(13/10/2014 Final Version) Page 266
Author; Date; Country; Title
Purpose Design Settings/Participants Intervention Clinical Data Collection Method/Analysis
Outcomes/Results
Large white board posted in highly visible location.
corresponding room number and hour of day the score was obtained. The colour corresponds with the colour associated with the patient’s score on the algorithm. PEWS white board provides multidisciplinary team with dynamic snapshot of the unit’s acuity level and view of the sickest patients at any given time.
Hayes et al. (2012) USA A Multicenter Collaborative Approach to Reducing Pediatric Codes Outside the ICU
To describe CHCA’s (Child Health Corporation of America) multidisciplinary improvement collaborative of 20 children’s hospitals which implemented a suite of prevention, detection and correction strategies on targeted inpatient units with aim of reducing number of inpatient paediatric cardiopulmonary arrests (referred to as codes) by 50% and improving the culture of patient safety scores by 5 percentage points in 3 key domains (Non-punitive Response to Error, Handoffs and Transitions, and Communication Openness).
Quality improvement initiative/project Multidisciplinary improvement collaborative Purpose of collaborative To establish reliable systems that rescue the deteriorating patient, focusing on 3 key change areas: prevention, detection, and correction. Collaborative process based on Model for Improvement
20 CHCA hospitals; 12-month period “to eliminate codes and associated mortality on inpatient units” (Group A)
Collaborative Team/s The collaborative was designed by a multidisciplinary pediatric advisory panel, including participating hospital staff and external subject matter experts. Each hospital assembled a multidisciplinary team with designated administrative and/or physician sponsors. Ward areas Each team identified “target” units (typically 1–3 units per hospital) from among noncritical care inpatient units, emergency department/emergency departments, operating rooms, and ICUs. Four hospitals focused on all noncritical care units during the project. Change package developed A comprehensive, pediatric specific change package of practices with evidence supporting their efficacy, low risk of harm, and feasibility of implementation and measurement was developed. Interventions
On a monthly basis, participants reported their project measures to CHCA through a secure Web-based data repository hosted by Institute for Healthcare Improvement. Primary outcome measure Reduction in codes per 1000 patient days Secondary outcomes Days between codes Change in patient safety culture scores Process measures RRT response time compliance RRT activations per 1000 patient days RRT activation before a code A goal of 95% compliance with RRT response time compliance was established. Each hospital set its own expected response time, typically 15 minutes. Hospitals collected and submitted monthly data during the 12-month study period
Before joining the project, hospitals’ efforts related to patient deterioration focused primarily on various preventive practices, review of hospital cases, staff training, RRT, and improvement in the chain of command process (Table 1). Some of the most widely implemented change areas during the collaborative were in the use of staff training and competency in recognition of deterioration and response algorithms. The most dramatic change implemented was the use of pediatric early warning system, starting out in no hospitals and implemented in 92% of hospitals within 12 months of the end of the collaborative period. Reduction in codes Change in median code rate did not reach statistical significance for Group A (difference in rate 0.01, 95% confidence interval [CI]: –0.05, 0.16, P = .284). For Group B, the decrease in median code rate was

(13/10/2014 Final Version) Page 267
Author; Date; Country; Title
Purpose Design Settings/Participants Intervention Clinical Data Collection Method/Analysis
Outcomes/Results
Interventions focused on change in practice to improve prevention, detection, and intervention of the deteriorating patient 3 categories of changes with increasing complexity were identified. Foundational changes were relatively simple to implement and recommended to be put into practice early in the collaborative (eg, implementing “SBAR,” or Situation, Background, Assessment, Recommendation). Midlevel changes, such as developing a RRT, were implemented as the foundational changes were accomplished. Advanced changes (eg, family activation of the RRT) were considered more complex and were generally implemented once several other change types had been achieved. Teams were instructed to select a broad range of change package elements for implementation. The change process included well-defined aims statement; 3 face-to- face learning sessions, communication strategies (eg, monthly conference calls, collaborative listserv, and project Web page), and monthly data submission.
Additionally, baseline data from the preceding 12months regarding codes and unplanned transfers to a higher level of care and from the preceding 3 months for the process measures were collected from each hospital as baseline. Approximately 18 months after the collaborative action period concluded, a post-collaborative survey was conducted to collect an additional 12 months of code data. Twelve of the original 20 hospitals submitted post-collaborative data (Group B) Definitions of a “code” and an “unplanned transfer” were not standardized across institutions; each institution used their existing definitions throughout the data collection period. Patient safety culture was measured via the AHRQ HSOPS (Agency for Healthcare Research and Quality’s Hospital Survey on Patient Safety Culture) focused on 3 domains: (1) communication openness, (2) handoffs and transitions, and (3) non-punitive response to error. The survey was conducted 3 times during the project: at the beginning of the project, mid-project, and at the conclusion of the action period.
statistically significant from baseline performance to action period performance (difference in rate 0.10, 95%CI: 0.00–0.31, P = .039). Group B had a higher pooled baseline median code rate than the 8 teams not reporting post-collaborative data, although this did not reach statistical significance (P = .066); Group B also had a lower pooled median code rate during the action period, although this again did not reach statistical significance (P = .399). Although 75% of the hospitals in each of these groups began the collaborative with an existing RRT, there were differences noted between Groups A and B in RRT implementation during the project. In Group B, 100% had a RRT in place by the end of the action period. At the conclusion of the action period in the group of 8 hospitals not reporting post-collaborative data, no additional hospitals had implemented a RRT. Patient safety culture scores improved in all 3 targeted domains of the AHRQ HSOPS for the 14 hospitals (70%) that conducted the survey. When comparing the baseline and final surveys, the domains improved between 4.5 and 8.5 percentage points compared with the collaborative goal of 5 percentage points. The only statistically significant improvement was seen in “non-

(13/10/2014 Final Version) Page 268
Author; Date; Country; Title
Purpose Design Settings/Participants Intervention Clinical Data Collection Method/Analysis
Outcomes/Results
punitive response to error” (39% positive response baseline, 47% positive response post-collaborative, P = .02). The remainder of the survey improvements were not statistically significant. Overall mixed results Failed to achieve priori goal of a 50% reduction in codes after 1 year Across all 20 hospital study sites a modest 3% decrease in the median code rate was realized during the 1-year implementation period Explanations for variability of results Each hospital starting from a different place along a continuum of existing systems, and each then implemented different elements of the change package to varying degrees Each hospital used their own internal definition of a “code”; depending on the definition, some may have been more preventable than others Interventions employed were process improvement/systems changes and were likely implemented with varying levels of zeal and acceptance at different institutions
Kukreti et al. (2014) Canada Implementation of a Paediatric Rapid Response Team: Experience of the
An overview of the implementation and evolution of a paediatric rapid response team; the process, barriers, and ongoing challenges.
Pre and post implementation surveys
Hospital for Sick Children in Toronto
Paediatric MET program was introduced in 3 phases Phase 1: (May - Oct 2006): Planning and development of core team requirements Phase 2: (Nov 2006 - Jan 2007): MET service introduced on a limited
Pre-implementation: surveys 3 months in advance – collect data re existing culture. Post implementation: Ontario Critical Care Secretariat in Jan2011. Questions reflected core functions of the teams.
Code blue >95% satisfied with quality and timeliness of MET service. >90% believed MET had positive impact on patient care. 3perceived benefits of MET were: (1) the education provided on the hospital floors and clinics

(13/10/2014 Final Version) Page 269
Author; Date; Country; Title
Purpose Design Settings/Participants Intervention Clinical Data Collection Method/Analysis
Outcomes/Results
Hospital for Sick Children in Toronto
basis Mon to Fri,08:00 to16:00 (to begin the integration of the MET into the hospital environment) Phase 3: (Feb 2007-ongoing at time of report): Full 24/7 service rolled out to all areas of the hospital. MET Calling Criteria Healthcare Provider worried Airway threat Saturation <90% in any amount of O2 (Saturation <60% in any amount of O2 in children with cyanotic heart disease) Respiratory distress Tachycardia, Bradycardia Hypotension, Poor peripheral pulses, prolonged capillary refill time, mottled extremities. Acute change in neurological status, decreased activity or responsiveness in small infants, acute drop in GCS by more than 2, seizures Education: All team members attended simulation-based courses re identification, assessment & management of deteriorating paediatric patient. Education curriculum developed that met the educational needs of ward/clinic staff. Forums for delivery incl. lunch & learn sessions, monthly rounds/ meetings, hour-long in-services, & twice yearly full day simulation based education session.
(2) the satisfaction of service users (patients, nurses, and physicians) (3) empowerment of the bedside staff No significant reduction in Code Blue rate or readmission rate to the CCU with implementation of the MET
McLellan & Connors (2013)
To describe the implementation and subsequent
Series of 3 pilot studies to modify PEWS
Setting: Children's Hospital Boston
Tool Modification Pilot 1: CHEWS pilot Monaghan’s (2005) PEWS was
Tool Modification Pilot 1: CHEWS pilot Review of current electronic
Tool Modification Pilot 1: CHEWS pilot Consistent agreement about

(13/10/2014 Final Version) Page 270
Author; Date; Country; Title
Purpose Design Settings/Participants Intervention Clinical Data Collection Method/Analysis
Outcomes/Results
Boston Children’s Hospital USA The Cardiac Children's Hospital Early Warning Score (C-CHEWS)
modifications of the CHEWS tool and its companion Escalation of Care Algorithm for paediatric cardiovascular patients and early detection of deterioration and prevention of cardiopulmonary arrests or unplanned transfers to a cardiac ICU (CICU)
for cardiovascular patients and implementation of the tool and its companion escalation care algorithm on inpatient paediatric cardiovascular unit
42-bed cardiac medical and surgical telemetry unit with patients ranging in age from newborn to adult (more than half the patient population is less than 1yr). 10 beds are considered “higher dependency” beds where the nurse to patient ratio is 1:2. Pilot 1:CHEWS pilot Patients n=27; observations n=157 Pilot 2: First CCHEWS Patients n=53; observations n=312 Pilot 3:Final CCHEWS Patients n=20; observation n=119
modified to develop a Children's Hospital Early Warning Score (CHEWS). The CHEWS incorporated the PEWS' domains and scoring, plus the addition of two subjective domains of “family concern” and “staff concern”. Pilot 2: First CCHEWS Tool modified to take account of variables identified from analysis of pilot 1 findings and named; Cardiac Children's Hospital Early Warning Score (C-CHEWS) tool. Pilot 3: Final CCHEWS Tool modified to take account of analysis from pilot 2 - so should a patient have any of these pre-existing abnormalities at baseline they would not score high, whereas if a patient had a new onset of any of those clinical findings, or it was unknown, the findings would generate a higher C-CHEWS score. Outcome of Tool Modification CCHEWS is an early warning scoring tool specific for paediatric cardiovascular high-risk, vulnerable population Escalation of Care Algorithm - escalation of resources to a patient's bedside to assess and treat deterioration based upon the C-CHEWS score. CCHEWS score of 0–2 (colour code: green) clinicians to continue routine care, monitoring and assessments; score of 3–4 (colour code: yellow) patient's nurse to notify the charge nurse and patient's resident or nurse practitioner of the elevated score; score 5 or greater (colour code: red), the same steps are followed as
health record documentation & clinician interviews (charge nurse, patients' nurses, nurse practitioners or fellows). Staff nurse, qualified in use of CHEWS tool, scored all patients on the unit during two consecutive 12-hour shifts, and conducted concurrent interviews with clinicians to identify their most acute patients and/or those they had concerns about; including asking nurses to indicate if patients' families had concerns or were absent from the bedside (to score “family concern” of CHEWS). Patients' clinical events & bed assignment (higher dependency bed or not) also recorded. Clinicians' assessments, patients' clinical events, bed assignment and calculated CHEWS scores all compared. Pilot 2: First CCHEWS Conducted with new C-CHEWS tool using same methods as pilot 1. Pilot 3: Final CCHEWS Same methods Implementation of C-CHEWS C-CHEWS incorporated into electronic health record - software calculates score. Nurse follows C-CHEWS Escalation of Care Algorithm and documents actions. Time/Cost Documentation of C-CHEWS score takes nurse less than 10 seconds.
patients' acuity among clinicians' assessments, bed assignments, & clinical events; these used to describe patients' clinical presentations. 29.6% n=8 of patients had lower CHEWS scores than the acuity severity of their clinical presentation should have warranted; of patients that scored too low, 3 were urgently transferred to the CICU during the pilot, with 1 intubated on arrival to CICU. None of 3 patients' CHEWS scores were above a normal range and would not have triggered escalation of care response using CHEWS. An expert multidisciplinary panel from CICU, ICU & cardiac unit reviewed patients' clinical presentations & CHEWS scores; with the following identified as sources for score discrepancies; behaviour (absence of sleeping appropriately); cardiovascular (absence of presence of arrhythmia & heart rate range limits not accounting for wide age range of patients, esp. newborns & infants); and Respiratory (absence of presence of apnea or cyanosis; oxygen flow rates too high for younger patients; respiratory rate range limits not accommodate wide age range of patients, esp. newborns & infants). Pilot 2: First CCHEWS 7.5% (n=4) of patients' C-CHEWS scores did not correlate with acuity of their clinical picture; this time it was equal mix of patients either scoring too high

(13/10/2014 Final Version) Page 271
Author; Date; Country; Title
Purpose Design Settings/Participants Intervention Clinical Data Collection Method/Analysis
Outcomes/Results
described for colour code yellow (score 3–4) with the addition of notifying the patient's attending physician of their patient's elevated CCHEWS score. Implementation of C-CHEWS Staff Education All cardiovascular staff required to complete short, computer-based learning module using 3 case Studies; this educational material reinforced during staff meetings and unit's monthly newsletter. C-CHEWS tool & companion Escalation of Care Algorithm posted throughout the unit for reference before & during implementation. Education initiative occurred over 2-month period and all clinical staff knew the date designated for tool to “go-live” and become standard of care.
Audits done 1-month following implementation of C-CHEWS Audits performed 2-3 times/week on 10 randomized patients' charts for 16 weeks to assess compliance with C-CHEWS/utilization of companion algorithm. Staff given feedback on documentation and processes needing improvement. Staff asked if any system issues could be improved. Entire process from initial pilot to complete implementation was 6 months
or too low. Presence of patients' baseline abnormalities accounted for discrepancies: behaviour (baseline seizures); cardiovascular (baseline arrhythmias); respiratory (baseline use of supplemental oxygen flow rate & baseline cyanosis). Pilot 3: Final CCHEWS Pilot with updated C-CHEWS tool demonstrated 100% of C-CHEWS scores matched the acuity of patients' clinical presentations. Final version of C-CHEWS tool approved for use on the cardiac unit and Escalation of Care Algorithm conformed with existing critical response structures within the Cardiovascular Program. Unplanned CICU transfers after CCHEWS implementation Chart review of patients who have had an unplanned transfer to the CICU or experienced an arrest on the cardiac unit typically had elevated C-CHEWS scores with exception to sudden onset of compromising arrhythmia. In comparing the rate (transfers per 1000 patient days) of these events 1 year pre- and 1 year post- C-CHEWS implementation, there has been a reduction in unplanned transfers Formal validation of the CCHEWS tool including sensitivity and specificity are required.
Randhawa et al. To describe the process Plan–Do– Children’s National First cycle of change Monitoring and auditing First cycle of change outcomes

(13/10/2014 Final Version) Page 272
Author; Date; Country; Title
Purpose Design Settings/Participants Intervention Clinical Data Collection Method/Analysis
Outcomes/Results
(2011) USA Implementing and Sustaining Evidence- Based Nursing Practice to Reduce Pediatric Cardiopulmonary Arrest
and outcomes of implementing and sustaining the use of PEWS at the unit and organizational level to reduce paediatric cardiopulmonary arrest
Check–Act (PDCA) methodology for performance Improvement (implementing an evidence based change) 3 cycles
Medical Center, Division of Nursing, Washington
Introduction of PEWS on a 15-bed cardiology/nephrology unit. Escalation algorithm developed at Cincinnati Children’s Hospital (Tucker et al. 2009) adapted by team to be used by the bedside nurse to escalate care based on the patient’s PEWS score Also adopted original colour-coding system for increased situational awareness; score 0-2 green; 3-4 red; > 5 blue (code blue). Multidisciplinary team includes nursing unit manager, 3 staff nurses, and medical unit director. First cycle of change education Education and training sessions were provided to registered nurses, medical & ancillary staff in small teams prior to implementation using a variety of formats such as classroom lecture & electronic educational materials. All nurses underwent a validation process to determine ability to score 3 patients with the PEWS. Implementation team used train the trainer model to educate staff. First step of train the trainer model involved training individuals as experts in using PEWS tools. Trainers educated on how to use PEWS and how to score patients correctly. These trainers then trained and confirmed knowledge gained by nurses on cardiology/nephrology unit. Nursing and medical staff also educated on the process for documentation of the PEWS score and the expected interventions as outlined in the Escalation Algorithm.
With initial implementation of PEWS, compliance and accuracy of scoring was difficult to track and was not done with any structured process, and thus data collected during this period was sporadic and not reliable for reporting purposes; however, it was used for just-in-time training with staff. To ensure systematic monitoring of compliance and score accuracy, the PEWS score was added to the electronic medical record in May 2009. Shortly thereafter, all of the acute care units were audited on three separate occasions. The medical record of every other patient on each unit was reviewed during a specified 12-hr period. The auditor evaluated a minimum of 3 PEWS scores every 12hr, correct colour assignment to correlate with the score, appropriate reassessment and documentation of reassessment, as well as appropriate notification documentation and response. A total of 213 medical records were evaluated during the three separate sessions. Only 152 patients had a documented PEWS score at a minimum of every 4 hr (71.4%). The colour assignment was accurate in 193 charts (91%) of the audits cases. Reassessment compliance of patients was evident in 141 charts (66.2%); this correlated with the number of RRT
1 year post implementation of the PEWS, the cardiology/nephrology unit achieved 213 days without a CPA and further reduced the frequency of codes of CPA’s from 0.98 codes/1,000 patient-days to 0.62 codes/1,000 patient-days. Second cycle of change outcomes 9 months post-implementation general medical unit further reduced frequency of codes/1,000 patient-days from 0.65 codes/1,000 patient-days to 0.49 codes/1,000 patient-days. More than 365 days without a CPA. Third cycle of change outcomes Achieved a 23.4% reduction in cardiopulmonary arrests organizationally. Reduction in cardiopulmonary arrests from 0.15 codes/1,000 patient-days to 0.12 codes/1,000 patient-days. 19.4% reduction in CAT Team activations. SUMMARY OUTCOMES CPA rates After introduction of PEWS in 2 pilot units cardiopulmonary arrests reduced by 37% in cardiology/nephrology unit and 25% in general medical unit with an aggregate in two pilot units of 31% At organisational level after implementation of PEWS across all acute care units there was 23.4% reduction in CPA (0.21 codes/1000 patient days). CAT team calls

(13/10/2014 Final Version) Page 273
Author; Date; Country; Title
Purpose Design Settings/Participants Intervention Clinical Data Collection Method/Analysis
Outcomes/Results
Second cycle of change Implement PEWS in different in-patient acute care unit to determine the applicability of the tool within different patient populations. (39-bed general medical unit) Second cycle of change education Same educational process used for PEWS implementation on general medical unit Third cycle of change PEWS implemented in all acute care areas (additional 136 beds, including haematology/oncology, surgical, respiratory, short stay & neurosciences units) Third cycle of change education Plan developed for hospital wide education using train-the-trainer methodology and demonstration of inter-rater reliability for all nurses All nurses previously not educated and trained in PEWS completed a training packet and a validation process to determine their ability to correctly score 3 patients with PEWS. All medical staff were educated regarding the PEWS process, the use of Escalation Algorithm and the expected interventions.
activations with a noted electronic PEWS score (20 of 32, 62.5%). Of the patients with a PEWS score ≥3 (requiring more frequent assessments and/or notification of a licensed independent practitioner), 189 charts (88.7%) had complete notification documentation and response. PEWS is the standard of care within our institution; therefore, 100% compliance hospital-wide for each indicator is expected. These data will be used to inform our planned fourth cycle of change, which will specifically address the need for documenting the PEWS scores and interventions within the electronic medical record as an additional strategy for monitoring compliance.
Number of CAT team calls across all acute care units also reduced by 19.4% (103 activations pre PEWS to 83 activations post PEWS); suggesting bedside nurses had improved their early detection skills with use of PEWS and had escalated patient care needs without activating CAT team in certain situations.
Lobos et al (2010) Canada An implementation strategy for a multi-centre
To describe the standardised implementation of an RRS using a medical emergency team (MET) across 4 paediatric hospitals This paper describes a
3 phase implementation design Paediatric RRS using a MET
Toronto & Children’s Hospital of Eastern Ontario (CHEO) (both free-standing paediatric hospitals) Hospital for Sick Children (HSC)
RRS implemented in 3 phases Phase 1 Site champions recruited and outcomes measures defined. RRS concept promoted using social marking principles MET providers recruited and trained according to pre-agreed
Standardising the performance indicators and quality improvement components The site leaders and a database expert created a standardised data collection tool and database that tracked RRS project adoption through MET activity across the 4 sites
44 activations per 1000 admissions during first 2 years. Resulted in significant reductions in total code blue events and PICU mortality following unplanned PICU admissions and PICU readmissions from the ward.

(13/10/2014 Final Version) Page 274
Author; Date; Country; Title
Purpose Design Settings/Participants Intervention Clinical Data Collection Method/Analysis
Outcomes/Results
paediatric rapid response system (RRS) in Ontario
multicentre standardised approach to implementation and promotion that used social marking principles This paper highlights the four important elements of RRS, discusses the standardised training of MET providers, describes the use of social marking principles to promote RRS and barriers to its implementation The overall goal of the project was to determine the effect of a physician-led MET on rates of hospital code blue event, unplanned PICU re-admission, and PICU mortality following unplanned admissions.
McMaster Children’s Hospital, Hamilton (MCH) & Children’s Hospital London (CHL) (both paediatric hospitals in adult hospitals) MET was not designed to respond to patients in emergency departments, operating room, post-anaesthesia care unit, or NICU.
standardised educational program Phase 2 Paediatric RRS, which used a physician-led MET piloted from Mon-Fri 8am-4pm for 3-month period. Phase 3 MET available 24 hours a day 7 days a week Multi-center RRS administration To emphasise inter-professional collaboration physicians, registered nurses and respiratory therapists were recruited as site leaders. Site leaders met every 2 months in person and by monthly teleconference during first 3 months and every two weeks during last 3 months of phase 1 During meetings site leaders discussed their roles, the development of efferent and afferent components and promotional strategies, data collection and quality improvement strategies Standardising the RRS efferent component A standardised education program for MET providers Phase 2 Standardised delivery of service: Team composition: No evidence to support ‘right’ RRT composition; Site leaders agreed to implement RRS with MET team of a PICU physician, critical care nurse, and respiratory therapist. CHEO, CHL, MCH – MET was composed of an in-house PICU attending and resident
Terminology: Site leaders agreed on common RRS terminology of MET activity and used the term activation to describe the MET call Code blue events were defined as ‘as any activation of the code blue system’ Cardiorespiratory arrests defined as ‘any event that required chest compressions or positive pressure ventilation > 30 seconds or intubation or intravenous epinephrine’ A central database: Data from hospital and code blue events databases extracted for 2 years before and during implementation of RRS For all activations – the indications, time, place, and activating profession was recorded For activations and follow up visits – patient vital signs, clinical examination findings, interventions performed by MET and patient’s disposition were recorded PRISM (Pediatric Risk of Mortality) score obtained from clinical findings and laboratory assessment was collected for all patients admitted to PICU from the ward Data was also collected on all-cause hospital mortality, the total number of re-admissions and unplanned admissions to the PICU and the mortality of any unplanned admissions to PICU from each ward The outcome and activity data
See Kotsakis

(13/10/2014 Final Version) Page 275
Author; Date; Country; Title
Purpose Design Settings/Participants Intervention Clinical Data Collection Method/Analysis
Outcomes/Results
during day and in-house PICU resident or fellow overnight with a PICU attending back-up At HSC, an in-house fellow and resident with PICU attending back-up was available 24 hours a day The MOHLTCs funding of the RRS enabled the RN and MD providers to be dedicated to MET. When not involved in MET RN and MD MET providers were involved in RRS data collection and research activities and offered educational support in PICU and on wards – involved presenting interesting case rounds on basis of their actual MET patient encounters Calling criteria: Used Tibballs et al (2005) calling criteria which included age-specific physiologic criteria and concern expressed by HCP or family member How activated? MET activated through a dedicated pager when patient met calling criteria; Patients primary physician also called by hospital operator at time of MET activation Who activated? At all four sites primary HCP activated MET through hospital operator if family member asked For MET At MCH families could also activate MET directly through hospital operator MET arrived within 5mins of activation METs role: Assisted primary medical team in stabilisation and transfer of patients who required PICU admission
from each hospital were detailed in a report that site leaders submitted biannually to MOHLTC Program evaluation: Continuous evaluation through focus groups, activity data, and inter-professional surveys used to track performance on indicators

(13/10/2014 Final Version) Page 276
Author; Date; Country; Title
Purpose Design Settings/Participants Intervention Clinical Data Collection Method/Analysis
Outcomes/Results
For patients triaged to stay on ward MET provided suggestions regarding diagnostic investigations and medical interventions and scheduled follow up visits to monitor the patients progress with the primary medical team until primary medical team and MET providers agreed patient’s condition had improved. Across all sites, each activation and follow up visit was recorded/ documented in patient’s chart. SBAR was used to guide MET documentation of patient encounter. Each activation seen as intra- and inter- professional on-the-spot learning All patients discharged from PICU were followed by MET for 48-hours When patients seen by MET on ward following a PICU were later readmitted to PICU during same hospitalisation the MET followed them after they were discharged from PICU (seen once in 24 hours for two days or more frequent as needed) All sites replaced inpatient PICU consultations with MET activations All MET providers – physician, RN, RT – were added to each hospital’s code blue team as an extra resource Difference between calling code blue team and MET was reinforced with all HCPs on posters, local intranet, and through presentations Standardising the RRS afferent component – social marking in healthcare Phase 1

(13/10/2014 Final Version) Page 277
Author; Date; Country; Title
Purpose Design Settings/Participants Intervention Clinical Data Collection Method/Analysis
Outcomes/Results
Given significant cultural change required for an effective RRS site leaders employed principles of social marking to introduce and sustain the RRS concept – with the central focus being ‘social good’, social responsibility and the benefits of adopting change. Adopting RRS was socially responsible because it improved efficiency and safety in the management of sick children. Social marketing principles provided the conceptual framework to link system level goals and process level performance i) market research and contextualisation ii) definition of measurable objectives iii) marketing strategy i) market research and contextualisation Divided promotion strategies into ‘user components’ (i.e. what personal barriers exist that prevent HCP from activating RRS?) and ‘system components’ (i.e. what institutional barriers prevent activation of RRS?). Both these components were addressed using a pre-implementation survey mailed/emailed to 1066 HCPs including nurses, physicians, residents, allied health professionals. Low Response Rate 28% but did provide some insight into user group beliefs, needs and culture. Most significant perceived barriers to implementation were - historical

(13/10/2014 Final Version) Page 278
Author; Date; Country; Title
Purpose Design Settings/Participants Intervention Clinical Data Collection Method/Analysis
Outcomes/Results
doctor-patient relationship; concerns about communication between the physician-led MET and the primary medical; and hierarchies within the current hospital system Almost 1/3rd of respondents did not feel supported by their superiors to activate MET and a similar proportion worried about the communication between MET and primary medical team In light of the survey findings – site leaders decided to strengthen case for adopting RRS through activation of physician-led MET by engaging both clinical and nonclinical stakeholders in planning RRS implementation through RRS partnerships System factors not identified during preliminary process were subsequently identified as the project developed and included; Culture and professional norms Hierarchies within current system Doctor-nurse disengagement Inter-professional resistance Resource constraints Nurse multi-tasking Work-load pressures Data collection/maintenance resource Professional infrastructures Reluctance to cross professional boundaries Unwillingness to engage Role modelling Lack of ‘RRS-familiar’ staff/need for
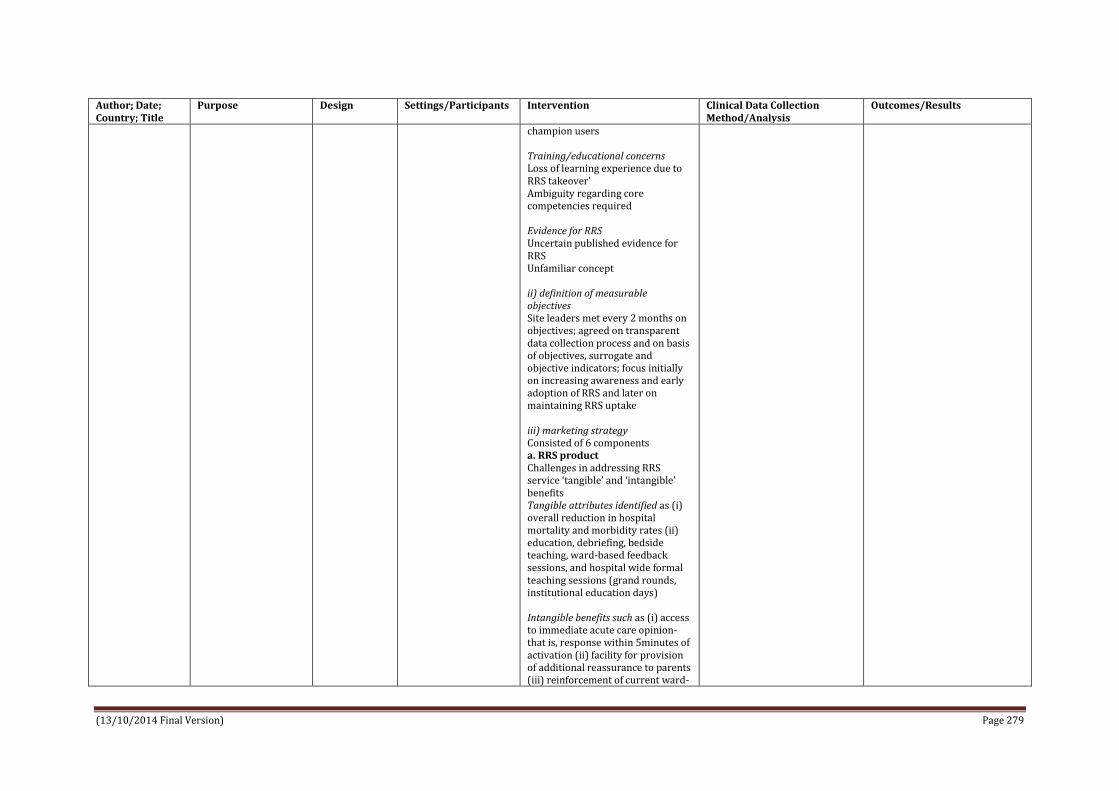
(13/10/2014 Final Version) Page 279
Author; Date; Country; Title
Purpose Design Settings/Participants Intervention Clinical Data Collection Method/Analysis
Outcomes/Results
champion users Training/educational concerns Loss of learning experience due to RRS takeover’ Ambiguity regarding core competencies required Evidence for RRS Uncertain published evidence for RRS Unfamiliar concept ii) definition of measurable objectives Site leaders met every 2 months on objectives; agreed on transparent data collection process and on basis of objectives, surrogate and objective indicators; focus initially on increasing awareness and early adoption of RRS and later on maintaining RRS uptake iii) marketing strategy Consisted of 6 components a. RRS product Challenges in addressing RRS service ‘tangible’ and ‘intangible’ benefits Tangible attributes identified as (i) overall reduction in hospital mortality and morbidity rates (ii) education, debriefing, bedside teaching, ward-based feedback sessions, and hospital wide formal teaching sessions (grand rounds, institutional education days) Intangible benefits such as (i) access to immediate acute care opinion-that is, response within 5minutes of activation (ii) facility for provision of additional reassurance to parents (iii) reinforcement of current ward-

(13/10/2014 Final Version) Page 280
Author; Date; Country; Title
Purpose Design Settings/Participants Intervention Clinical Data Collection Method/Analysis
Outcomes/Results
based management plans b. RSS price Site leaders viewed the ‘price’ of adopting the RRS by activating the physician led MET as the consequence the health care provider may face by activating the service. If perceived benefits outweighed perceived consequences increased MET utilization was more likely. Actively addressed benefits through educational platforms e.g. bedside teaching. Adopting the RRS by activating the physician led MET would not only improve patient safety etc but would also provide access to skilled acute care providers who would provide inter-professional support and on the spot education. Potential consequences of MET activation addressed through the engagement of multidisciplinary health care providers via ward based feedback sessions, the introduction of simultaneous paging of the MET and the physician responsible for the patient and the introduction of activation process ‘one number to call’ c. RSS place Refers to how contact is made with the user; to market the RRS concept site leaders used ‘active’ communication channels (inter-professional education days, institutional research days and ward visits) to engage ward HCPs. ‘Passive’ communication channels consisted of multifaceted media campaigns including institutional intranet, the internet, posters in all areas (clinical/nonclinical) and in-

(13/10/2014 Final Version) Page 281
Author; Date; Country; Title
Purpose Design Settings/Participants Intervention Clinical Data Collection Method/Analysis
Outcomes/Results
house publications. d. RRS promotion Promotion policy consists of integrated use of advertising, public relations, media advocacy, in-house promotion, intranet and personal selling. Site leaders developed patient and family brochures which were visible around hospital, in patient rooms, clinics, wards. Clothing designed with site specific designation for easy recognition of MET providers. RRS website on hospitals intranet which detailed activation criteria, communication and educational resources. RRS promoted at each site through local hospital publications and telethons. e. RSS publics Marketing strategy focussed on external (stakeholders, secondary audiences) and internal (MET providers) ‘publics.’ To the external publics RRS promoted by formal/informal presentations to every stakeholder and user group incl. ward health care providers, residency and fellowship programs, patient safety committees, hospital mgmt., medical and nursing executives. Site leaders also organized informal lectures and interactive sessions, question-answer sessions, ward ‘lunch and learns’ and ‘education coffee carts. ‘Celebrating our Success’ campaigns to provide feedback on MET activity and overall RRS performance to ward health care providers. Simulation based programs intended to enhance health care providers ability to anticipate and recognise the acutely ill child,

(13/10/2014 Final Version) Page 282
Author; Date; Country; Title
Purpose Design Settings/Participants Intervention Clinical Data Collection Method/Analysis
Outcomes/Results
activate MET and communicate using SBAR. Participants asked to submit feedback on educational programs. f. RSS partnerships To embrace cultivation of RRS partnerships site leaders created local advisory committees with representations from nursing groups – clinical (ward, specialist, educational) and nonclinical (management), allied health care providers (respiratory therapists) and medical groups (staff physicians and residents). Including all user groups in partnership plan was to help buy-in early on and to establish ownership through contribution to operational and strategic RRS decisions. Advisory committee communicated with site leaders monthly.

(13/10/2014 Final Version) Page 283
APPENDIX 26
Data extraction
Education interventions related to PEW detection and response systems

(13/10/2014 Final Version) Page 284
Data Extraction – Education interventions related to PEW detection and response systems
Author; Date; Country; Title
Purpose Design Settings/Participants Intervention Clinical Data Collection Method/Analysis
Outcomes/Results
McCrory et al. (2012) USA “ABC-SBAR” Training improves simulated critical patient hand-off by pediatric interns
To evaluate the educational intervention of teaching ABC-SBAR to pediatric interns. To evaluate (1) content & (2) time factors of patient hand-off by pediatric interns in a simulated near-arrest scenario before and after learning ABC-SBAR Hypothesised: a hand-off tool based on SBAR would help a first responder concisely and quickly communicate critical information in an emergency situation
Prospective pre- and post- intervention study
John Hopkins University Hospital Simulation Center N=27 pediatric interns participated in educational session entitled ‘Rapid Response: Why, when and how” as part of orientation 26 (96%) of 27 interns agreed to have their pre-and post-intervention video-recorded hand-off data included
Pediatric ‘‘rapid response’’ team at John Hopkins may be called to inpatient or outpatient settings for emergencies and consists of a multidisciplinary team including intensive care physician and nurse, intern, second-year resident, third-year resident, respiratory therapist, pharmacist, security guard, and chaplain Each intern participated in a video-recorded mock patient hand-off (i.e. entered a simulated patient room; read (1 of 2) scenario (warranting a rapid response) from a computer screen; picked up the phone, after which a mock ‘‘rapid responder’’ entered, and the intern gave a video-recorded verbal patient hand-off) Mock responders included staff members, senior residents, and critical care fellows who were instructed to only come in and introduce themselves as the rapid response team After the first simulated hand-off, interns attended a 45-minute didactic session discussing the rapid response team at our institution as well as learning the mnemonic: ABC-SBAR. Each intern then participated in a second video-recorded simulated patient handoff using
Self-formulated evaluation tool to assign a score to each patient hand-off using 10 items, with 1 point given for each item Essential hand-off content identified a priori by the authors included the reason for the call, ABC assessment, patient background (e.g., reason for admission), and assessment or recommendation regarding overall course of action. Evaluation tool also incorporated the order in which information was given, with points assigned for prioritizing information needed for immediate stabilization (ABCs, reason for call) before patient background and assessment or recommendation. Follow-up survey distributed approx. 2.5 years after the initial intervention, when the interns involved were in the last half of their final (third) year of pediatrics residency.
Primary outcome: total score on evaluation tool Secondary outcomes: inclusion of content items, order of content items with appropriate prioritization of key factors earlier, and time factors (time to situation, airway or breathing, circulation, and total hand-off time) 52 total hand-offs included for analysis Mean total score of hand-offs on the evaluation tool improved significantly after ABC-SBAR training (pre-intervention: 3.1 of a possible 10 vs post-intervention: 7.8 of 10, P<0.001). Each component of the ABC assessment was included in a higher percentage of hand-offs after training. Hand-offs including either airway or breathing assessment improved after training from pre-intervention (9/26 [35%]) to post-intervention (22/26 [85%]) (P = 0.001). Hand-offs including an assessment or recommendation by the intern also significantly increased after training (pre-intervention: 1/26 [4%] vs post-intervention: 22/26 [85%], P<0.001). Proportion of hand-offs with ABCs or situation prioritized before background increased for each component after training (pre-intervention: <=5% vs post-intervention: >=77%). Elapsed time from the start of hand-off until the intern stated essential content items significantly decreased after ABC-SBAR training (mean elapsed time to situation pre-intervention: 19.4 +/- 4.3 seconds vs post-intervention: 7.1 +/- 2.6 seconds, P < 0.001; to airway or breathing pre-intervention: 25.3 +/- 7.1 seconds vs post-intervention: 5.4 +/- 1.7 seconds, P < 0.001)

(13/10/2014 Final Version) Page 285
Author; Date; Country; Title
Purpose Design Settings/Participants Intervention Clinical Data Collection Method/Analysis
Outcomes/Results
the other scenario that intern had not already encountered (approx. 1 hour after first simulated hand-off)
Based on clinical experience, the authors had a priori identified less than 10 seconds as an optimal time period in which the essential elements of reason for call and ABCs should be stated in a critical handoff. Proportion of hand-offs meeting this goal increased after ABC-SBAR training for both situation (pre-intervention: 4/23 [17%] vs post-intervention: 22/26 [85%], P < 0.001) and airway or breathing (pre-intervention: 0/9 [0%] vs post-intervention: 18/22 [82%], P < 0.001). Total elapsed time of hand-off increased after ABC-SBAR training by 7 seconds (pre-intervention: 29 +/- 3.9 seconds vs post-intervention: 36.2 +/- 4.3 seconds, P =0.004). Hand-offs given a score of a perfect ‘‘10’’ on our evaluation tool increased after ABC-SBAR training (pre-intervention: 0/26 [0%] vs post-intervention: 10/26 [38%], P < 0.001). Of the 10 hand-offs that received a perfect score, 6 also included both situation and airway or breathing in the optimal time period of less than 10 seconds (23% of total post-training hand-offs). Follow-up survey was returned by 25 (100%) of 25 participants. Majority of participants (19/25, 76%) reported attending more than 10 rapid response events during their residency; the average estimate was 18 attended. Twenty (80%) of 25 reported familiarity with SBAR, whereas only 11 (44%) of 25 reported familiarity with ABC-SBAR. Of those familiar with ABC-SBAR, 69% agreed that it is easy to use in a clinical situation, 90% agreed that it improves care, and 100% would recommend it be taught to all incoming interns

(13/10/2014 Final Version) Page 286
Author; Date; Country; Title
Purpose Design Settings/Participants Intervention Clinical Data Collection Method/Analysis
Outcomes/Results
McKay et al. (2013) Australia Effect of a multifaceted intervention on documentation of vital signs and staff communication regarding deteriorating paediatric patients
To evaluate the impact of newly designed PEWS and an accompanying education package, CMPASS, on the frequency of documentation of vital signs and communication between health professionals and associated medical review in deteriorating paediatric patients Hypothesis The application of a multifaceted intervention, namely a newly designed age-specific ward observation charts, a paediatric track and trigger system and an associated education programme (COMPASS), would increase the frequency of documentation of vital signs and the frequency of communication between health professionals and associated
Prospective controlled before and after intervention trial Staff survey
Setting Two inpatient paediatric wards within a tertiary hospital providing regional paediatric care Pre-intervention period 2 paediatric wards studied under normal operating conditions for 5 month period Pre-intervention phrase n=1059 Post-intervention period 5 month period which commenced after 95% (103/108) of staff completed the COMPASS education package Post-intervention phase n=899 Random subgroup Pre-intervention n=262 n=151 males age 4.5 (1.4-11.1) Post-intervention n=221 n=107 males age 4.9 (1.5-11.3) Patients excluded were those admitted for chronic and palliative care Staff Survey (n=67; 41 pre- and 26 post-intervention) Response rate from health-care workers was 63.1% (41/65; seven medical officers and 58
Multifaceted programme aimed to assist health professionals detect changes in vital signs and recognise child clinical deterioration. It included; Newly designed ward observation chart 5 age specific PEWS scoring charts adopted from GOSH and underpinned by principles of Morgan et al. (1997) Medical review and management A formalised 2-tier medical response for child with clinical instability established. One medical response was triggered by a specific PEWS value being reached and prompting the bedside nurse to contact the child’s primary admitting team to undertake a medical review of the child. Failure to respond necessitated the nursing staff to escalate the seniority of medical officer contacted. The MET system continued to be the other formal medical response. Education package- COMPASS The education package, COMPASS, consisted of both an e-learning package and a 3-h face-to-face low-fidelity simulation package
Data collected upon admission to ward included demographic data, admission diagnosis, whether they were medical or surgical patients or whether the child was admitted for chronic disease or for palliation. In the randomly selected subgroup of patients, data collection included all the vital sign measurements documented, the PEWS recorded during the intervention period and any communication documented between nursing and medical staff following clinical instability, defined as a PEWS of four or more and subsequent medical review. Primary outcomes Daily frequency of vital signs measured Documented incidences of health professional communication Documented incidences of medical reviews Secondary outcomes Unexpected admissions to PHDU, ICU Number of calls to MET Unexpected deaths Increase in confidence in health professionals managing a deteriorating child Pre-and post-intervention staff survey aimed to (pre) determine what vital signs health-care workers perceived to be the signs of a deteriorating child prior to and (post) to compare how
A multifaceted intervention for the early recognition and response to clinical deterioration in children significantly improved documentation of vital signs, communication and time to medical review There were no significant differences in hospital mortality, medical emergency team reviews or unplanned admissions to critical care areas between the pre-intervention and post-intervention groups. Patient outcomes During the intervention period, there was reduction in the number of patients requiring an unplanned admission to the paediatric high dependency unit (3.8% vs. 2.7%, P = 0.22), but this did not reach statistical significance. There was no significant change in any of the other patient outcomes. Vital sign documentation There was a significant improvement in the daily documentation of many vital signs during the intervention period including: level of consciousness (0 (0–0) vs. 7.8 (5.8–12.0), P < 0.001), respiratory effort (0.0 (0–0) vs. 7.8 (5.8–12.6) P < 0.001), capillary refill (0 (0–0) to 1.1 (0–3.1) P < 0.001) and blood pressure (0.0 (0.0–1.1) vs. 0.0 (0.0–1.6), P = 0.007). All the other vital sign measurement frequency remained the same during the two periods. There were fewer children breaching MET criteria in the intervention period (38.9% (n =102) vs. 20.4% (n = 45)) Communication and medical review There was a significant improvement in the number of documented communication episodes from nursing staff to the patient’s medical team

(13/10/2014 Final Version) Page 287
Author; Date; Country; Title
Purpose Design Settings/Participants Intervention Clinical Data Collection Method/Analysis
Outcomes/Results
medical review of a deteriorating patient.
nurses) and 53.1% (26/49; two medical officers and 24 nurses) for pre- and post-implementation, respectively.
confident health-care workers felt in assessing paediatric patients prior to and post-implementation of the intervention; and to provide a forum for staff feedback.
following clinical instability during the intervention period (8.5% vs. 40.9%, P < 0.001). Of the patients reviewed following clinical instability, the time to review was reduced from 30.0 (10.0–60.0) to 0 (0–30.0) mins (P < 0.001). Staff survey Following the implementation of the intervention, improvements were seen in many areas (e.g. improved confidence/knowledge from training); however, improvements did not reach significance.
Tume et al. (2013) UK Teaching paediatric ward teams to recognise and manage the deteriorating child
To describe the development of the RESPOND course and present a preliminary evaluation of the first four courses.
Survey Large children’s hospital in the North West of England. n=65 participants undertook the RESPOND course over 4 separate days Each of the four courses consisted of between 9 and 21 participants. We attempted to have a maximum of 20 participants per course with 4 medical staff and 16 nursing staff, to enable effective multi-professional group work, however this varied because of clinical demands on the wards. Course participants Ward nurses n=44 (68%) Health care assistants n=2 (3%) Foundation year 1 doctors n=2 (3%) Foundation year 2 doctors n=2 (3%)
New 1-day course called RESPOND (Recognising Signs of Paediatric hOspital iNpatients Deterioration) developed Multi-professional course aimed at ward nurses and junior doctors (foundation years 1 and 2; to improve children’s ward based teams’ ability to recognize and act on patient deterioration earlier, thus preventing CPA and potentially intensive care unit admissions A programme and educational material (course book) for RESPOND course was devised by a multi-professional team comprising senior nurses, a nurse specialist in resuscitation, consultant medical staff and a senior physiotherapist. The course mirrors the philosophy and ethos of the adult Acute Life-threatening Events – Recognition and Treatment (ALERT) course for adults (Smith et al., 2002).
After the each of the four course study days participants completed an anonymous evaluation form and provided their e-mail address for a further electronic survey to be sent to them 12weeks after the course to assess its impact on their practice. We also asked for feedback from all faculty members on how the courses ran so that further courses could be modified to run more effectively. The post-course paper evaluation form consisted of 12 open ended questions. The 3-month post-course survey was electronic (using Survey Monkey™). This 13 item questionnaire was different and consisted of both open-ended and multiple choice questions relating to the perceived impact that the course had had on the participants practice. Data were analysed descriptively
Paper survey post-course Two most useful aspects of RESPOND cited were: the discussion and review of real life cases and learning to use the SBAR communication process. 87% (55/63) respondents stated they had learnt ‘new’ material from attending the RESPOND course. 89% (56/63) respondents stated that the RESPOND course will improve their communication with colleagues at work, by using the SBAR method. All the respondents rated the scenarios used as helpful to learn from and there were a number of suggestions provided for other cases, to capture a broad range of different specialities. One common theme in the free text responses was that many participants felt there was a huge benefit of using a multi-professional approach to the course delivery, as this improved the understanding among each professional group when dealing with cases of possible deterioration. Some nurses said that they still felt that

(13/10/2014 Final Version) Page 288
Author; Date; Country; Title
Purpose Design Settings/Participants Intervention Clinical Data Collection Method/Analysis
Outcomes/Results
Senior house officers n=2 (3%) Medical students (year 5) n=13 (20%) 63 of 65 (97% response rate) paper evaluations of the four RESPOND courses completed at the end of the course.
The learning objectives for the day are to be able to: 1. Identify ‘at risk’ children in hospital 2. Consider what specific observations/assessments to chart and frequency based on initial presentation 3. Recognize clinical cues that may indicate deterioration 4. Consider causes of abnormal vital signs, and further monitoring and actions to be taken when vital signs fall outside the ‘accepted’ range 5. Recognize abnormality in a child with existing complex health needs and/or neurodisability 6. Escalate and communicate concern to others in the clinical team about a deteriorating patient using the SBAR (Situation, Background, Assessment, Recommendations, RESPONSE) approach 7. Discuss individual professional accountability for nursing and medical decisions (for both actions taken but also inaction) in relation to direct patient clinical care. Course designed and delivered by a multi-professional faculty consisting of senior nurses (including the nurse specialist in resuscitation, senior nursing research fellow and advanced nurse practitioner in critical care) and senior medical staff (including consultant
and by simple thematic analysis of free text responses.
it was not their place to be directing doctors on how to do their job, however junior medical staff in that session said that they wanted nurses to continue to articulate clinical concerns and advise them of the usual process for dealing with such situations. The junior medical staff acknowledged that they had a lot of theoretical knowledge at university, but felt that they had limited paediatric experience and required guidance on the normal working processes within the hospital. Medical participants highlighted to nursing participants the challenges they faced when on call, being contacted by various staff about patients who were of concern. They sometimes found it difficult to prioritize response as the information they were given was too vague, and described how they are thinking constantly during the interaction around mentally triaging the response required. They often told the nurses that they needed to be clearer in articulating that they were concerned that a child is deteriorating using specific information succinctly, to quickly grab their attention. Electronic survey at 12 weeks Only 18% (12/65) respondents completed the online survey and of these, five were staff nurses, three were charge nurses, one foundation year 1 doctor and three medical students; 75% (9/12) had encountered a situation of a patient deteriorating on the ward since they had attended this course and the scenarios described were predominantly respiratory difficulties and increasing respiratory

(13/10/2014 Final Version) Page 289
Author; Date; Country; Title
Purpose Design Settings/Participants Intervention Clinical Data Collection Method/Analysis
Outcomes/Results
paediatricians, intensive care consultants and anaesthetists). Course programme -Initial introduction and background of evidence of paediatric deterioration on ward areas and use of EWT -Brief key note lecture on assessing the deteriorating child on the ward -Group split into smaller multi-professional groups (of 4–6) to examine real (anonymized) patient case scenarios in more depth (critical analysis of case, and practice escalation of concern – SBAR) -Short interactive ‘management of the condition’ lectures highlighting specific ‘red flags’ of clinical signs that should provoke concern amongst health professionals reviewing a patient -Clips from an in-house DVD produced specifically to improve the knowledge and skill of junior staff in undertaking careful clinical observations were used to illustrate key points
distress and one patient with increasing sepsis and shock. When asked to consider whether the RESPOND course had helped them to manage this situation, 50% (6/12) said the course helped a lot, with 42% (5/12) saying it had helped a little, only one person said the course had not helped them managing this situation. (83%, 10/12) stated that the course had made them think different in their daily clinical work with 16% (2/12) saying it had partially made them think differently. The most useful things participants felt they had learned on the RESPOND course were: improved communication between the doctors and nurses and working more as a team, with using the SBAR communication technique identified as really helpful by 50% participants. Working through the real life cases was also valued very positively. Mentioned in discussion - our in-hospital cardiac arrests have reduced from a mean of 21.3 (2009–2011) to 13 (in 2012) since the introduction of the RESPOND course

(13/10/2014 Final Version) Page 290
APPENDIX 27
Data extraction
Culture, socio-technical and organisational issues impacting on detection and response systems for identifying and timely intervention to child clinical deterioration

(13/10/2014 Final Version) Page 291
Data Extraction - Culture, socio-technical and organisational issues impacting on detection and response systems for identifying and timely intervention
to child clinical deterioration
Author; Date; Country; Title
Purpose Design Settings/Participants Intervention Clinical Data Collection Method/Analysis
Outcomes/Results
Azzopardi et al. (2011) Australia Attitudes and barriers to a Medical Emergency Team system at a tertiary paediatric hospital
To assess the value/attitudes placed on MET by clinical staff in a tertiary paediatric hospital To identify barriers to activation of MET
Survey (electronic)
Royal Children’s Hospital (RCH) Melbourne - 250-bed tertiary paediatric hospital serving a population of approx. 1.5 million children. It has 16 PICU beds and 22 NICU beds. All clinical nursing and medical staff employed at RCH during the sampling period n=456 (n=9 excluded from analysis) n=447; n=311 nursing & n=136 medical staff n=407 completed the survey; 280 nurses & 127 doctors n=305 (74.9%) “MET callers” & n =102 “MET responders”.
RCH MET system is single-tier with no differentiation according to severity of child’s condition, and is operational at all times. MET team comprises PICU doctor and nurse, an Emergency Department (ED) doctor and the covering medical registrar. Criteria for activating MET and functional characteristics of system described elsewhere.
41-item branched electronic survey Survey modified version of a previously validated questionnaire. Piloted on 10 medical and 10 nursing staff Respondents asked to choose one of two statements best describing their role in hospital- “MET callers” or “MET responders” Both “MET callers” and “MET responders” completed the first section on attitudes to MET (i.e. benefits of MET, usefulness in managing unwell ward patients, inappropriate MET calls, and if they felt adequately trained in the MET system) Respondents identifying as “MET callers” completed additional items focusing on barriers to activating the MET. These items measured patient and system factors warranting a MET call, what circumstances initiate or did not initiate a call and obstacles restricting the use of MET.
Doctors & nurses valued MET highly. Most clinical staff disagreed MET reduced their skills in managing unwell patients; large number were unsure if MET taught them better management of severely ill patients. Few respondents felt MET was overused in patient management; few indicated MET required because management had been inadequate by doctors or nurses. While most staff felt adequately trained regarding MET, 3 (12.5%) doctors who were “MET responders” (1 PICU Fellow, 1 ED Fellow, 1 medical registrar) disagreed that they felt adequately trained in their role. There were subtle differences in the attitudes to MET between nurses and doctors. Amongst “MET callers”, more nurses than doctors (p = 0.01) disagreed that MET reduces their skills in managing sick patients and agreed that MET teaches them how to better manage severely ill patients (p = 0.09). There was also difference in attitude between MET callers and MET responders within a clinical role. Doctors who were MET responders agreed that MET increases their workload when caring for sick patients compared to MET callers (p < 0.01). Amongst nurses, MET responders were more likely to agree that MET was overused compared to MET callers (p < 0.01). Although, amongst the MET caller group, medical staff were more likely to agree that MET was overused compared to nurses (p < 0.01). N=239 (58.7%) commented on what liked about

(13/10/2014 Final Version) Page 292
Author; Date; Country; Title
Purpose Design Settings/Participants Intervention Clinical Data Collection Method/Analysis
Outcomes/Results
MET; immediate support from experienced staff and early intervention; MET initiated by anyone at anytime N=191 (46.9%) indicated what did not like about MET; too many people attending MET, lack of clear leadership and defined roles Amongst nurses, almost a quarter (24.2%) of “MET callers” and 10% of “MET Responders” disliked negative comments or attitudes of MET staff. Of 326 (229 nurses, 97 doctors) who had been involved in a MET call, 106 (46.3%) nurses compared to 19 (19.6%) doctors received feedback (p < 0.01). More doctors as “MET responders” (31.6%) compared to “MET callers” (16.7%) reported feedback (p = 0.2) Barriers to initiating MET calls Majority nurses (80%) & 45% doctors who were MET callers would call the attending doctor or other medical staff for a severely ill or deteriorating patient before calling MET. Approximately half of clinical staff would call MET for a patient they were worried about even if patient’s vital signs were normal. 32% nurses & 47% of doctors would not activate MET for a patient whose condition fulfilled the MET calling criteria but looked well. Criticism from MET attendees if their patient was not deemed unwell was an identified barrier. Compared to doctors, nurses disagreed they were deterred from activating MET when PICU was busy (p < 0.05) or because too many staff attended (p < 0.01). Of the 305 “METcallers”, 289 (190 nurses, 99 doctors) answered the question asking if they had been in a situation where in retrospect they should have activated MET or activated MET earlier but had not. 128 (44.3%) staff reported a situation where MET activation was delayed. Nurses were more involved than doctors in
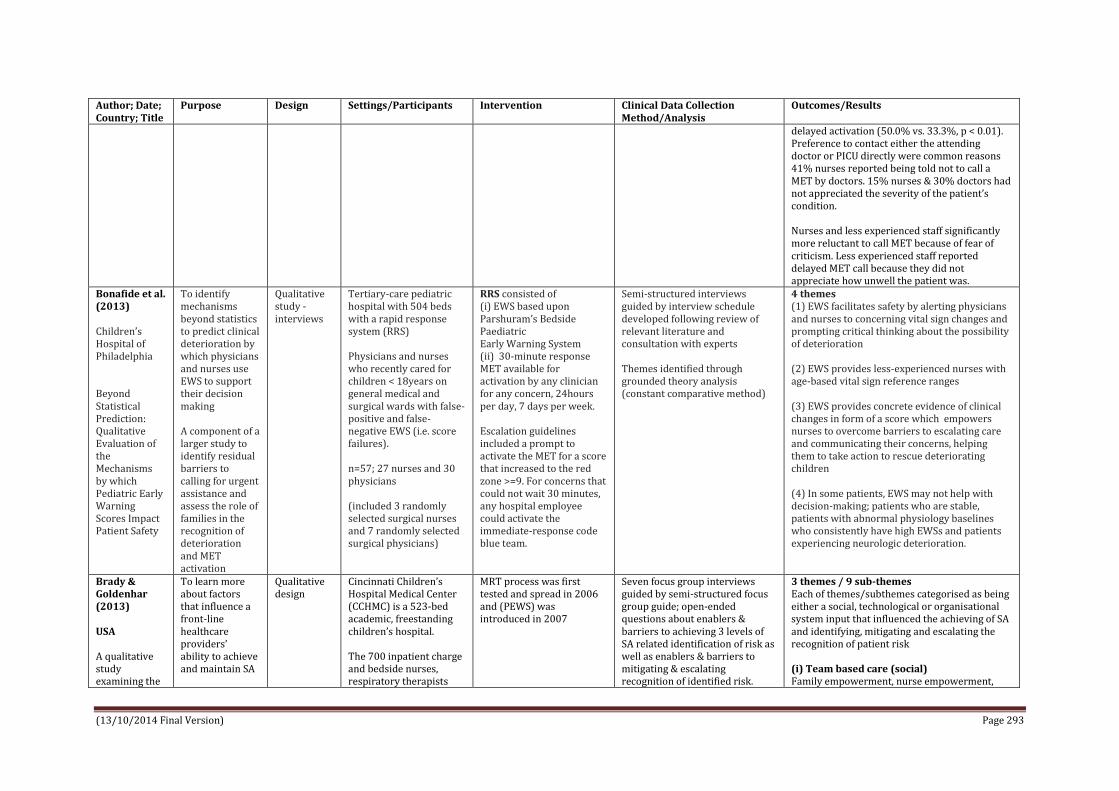
(13/10/2014 Final Version) Page 293
Author; Date; Country; Title
Purpose Design Settings/Participants Intervention Clinical Data Collection Method/Analysis
Outcomes/Results
delayed activation (50.0% vs. 33.3%, p < 0.01). Preference to contact either the attending doctor or PICU directly were common reasons 41% nurses reported being told not to call a MET by doctors. 15% nurses & 30% doctors had not appreciated the severity of the patient’s condition. Nurses and less experienced staff significantly more reluctant to call MET because of fear of criticism. Less experienced staff reported delayed MET call because they did not appreciate how unwell the patient was.
Bonafide et al. (2013) Children’s Hospital of Philadelphia Beyond Statistical Prediction: Qualitative Evaluation of the Mechanisms by which Pediatric Early Warning Scores Impact Patient Safety
To identify mechanisms beyond statistics to predict clinical deterioration by which physicians and nurses use EWS to support their decision making A component of a larger study to identify residual barriers to calling for urgent assistance and assess the role of families in the recognition of deterioration and MET activation
Qualitative study - interviews
Tertiary-care pediatric hospital with 504 beds with a rapid response system (RRS) Physicians and nurses who recently cared for children < 18years on general medical and surgical wards with false-positive and false-negative EWS (i.e. score failures). n=57; 27 nurses and 30 physicians (included 3 randomly selected surgical nurses and 7 randomly selected surgical physicians)
RRS consisted of (i) EWS based upon Parshuram’s Bedside Paediatric Early Warning System (ii) 30-minute response MET available for activation by any clinician for any concern, 24hours per day, 7 days per week. Escalation guidelines included a prompt to activate the MET for a score that increased to the red zone >=9. For concerns that could not wait 30 minutes, any hospital employee could activate the immediate-response code blue team.
Semi-structured interviews guided by interview schedule developed following review of relevant literature and consultation with experts Themes identified through grounded theory analysis (constant comparative method)
4 themes (1) EWS facilitates safety by alerting physicians and nurses to concerning vital sign changes and prompting critical thinking about the possibility of deterioration (2) EWS provides less-experienced nurses with age-based vital sign reference ranges (3) EWS provides concrete evidence of clinical changes in form of a score which empowers nurses to overcome barriers to escalating care and communicating their concerns, helping them to take action to rescue deteriorating children (4) In some patients, EWS may not help with decision-making; patients who are stable, patients with abnormal physiology baselines who consistently have high EWSs and patients experiencing neurologic deterioration.
Brady & Goldenhar (2013) USA A qualitative study examining the
To learn more about factors that influence a front-line healthcare providers’ ability to achieve and maintain SA
Qualitative design
Cincinnati Children’s Hospital Medical Center (CCHMC) is a 523-bed academic, freestanding children’s hospital. The 700 inpatient charge and bedside nurses, respiratory therapists
MRT process was first tested and spread in 2006 and (PEWS) was introduced in 2007
Seven focus group interviews guided by semi-structured focus group guide; open-ended questions about enablers & barriers to achieving 3 levels of SA related identification of risk as well as enablers & barriers to mitigating & escalating recognition of identified risk.
3 themes / 9 sub-themes Each of themes/subthemes categorised as being either a social, technological or organisational system input that influenced the achieving of SA and identifying, mitigating and escalating the recognition of patient risk (i) Team based care (social) Family empowerment, nurse empowerment,

(13/10/2014 Final Version) Page 294
Author; Date; Country; Title
Purpose Design Settings/Participants Intervention Clinical Data Collection Method/Analysis
Outcomes/Results
influences on situation awareness and the identification, mitigation and escalation of recognised patient risk Note: SA is (1) perception of data elements, (2) comprehension of their meaning in context & (3) projection of their status in near future
To identify, address and escalate the recognition of risk for patients in inpatient setting
(RTs) & senior paediatric residents invited to participate n=31; 10 charge nurses; 8 bedside nurses; 3 RTs; 10 2nd year or 3rd year residents Over ½ of nurse/RT participants had 10 or more years of experience and 33% had worked at CCHMC for over 20 years
Guides pretested & revised with a small sample of representative participants Participant demographic & experience data also collected A trained facilitator led the 1-h sessions Participants assigned to group based on their role e.g. charge nurse, resident etc. N=3 focus groups with charge nurses (n=3,3,4) N=3 focus groups bedside nurse/RT groups (n=3,3,5) N=1 resident focus group (n=10)
unit culture that supports teamwork, accountability and safety Family empowerment: healthcare providers listening to and engaging family members in their child’s care and also giving families power to escalate their concerns to a higher level if they felt those expectations were not being met Nurse empowerment: having a powerful, equal and welcomed voice in huddles and within patient care team. This voice supported their reporting of patient-related observations, questioning of proposed plans and suggesting of alternate plans. Also expectation that any provider can go up the chain of command and escalate a situation (i.e. call an MRT) if they felt their voice was not being heard or if they disagreed with the plan Most often mentioned negative influence on nurse empowerment was fear of speaking up and/or being wrong in front of peers, supervisors and physicians. Unit culture that supports teamwork, accountability and safety: would support trusting relationships, encourage communicating with all team members (including the ICU team) and encourage a willingness to ask for second opinions. This culture would require all providers to be accountable for their role in carrying out mitigation plans and escalating patient care if necessary. Negative influences on successful mitigation included disagreements about plans among team members and lack of collegiality/teamwork—specifically, physicians not listening to/taking nurse input seriously. Lack of familiarity with and trust of team members on the MRT can result in limited input, condescension/intimidation, potential stigma and lack of agreement (ii) Availability of standardised data

(13/10/2014 Final Version) Page 295
Author; Date; Country; Title
Purpose Design Settings/Participants Intervention Clinical Data Collection Method/Analysis
Outcomes/Results
(technological) Standardised data elements/scores, tools for entering, displaying and monitoring data and data trends Influences associated with standardised data elements/scores relate to benefit of objective algorithms, such as PEWS, and other standardised tools for conducting patient assessment. In addition to the ‘gut feeling’ participants described having when they see a patient deteriorating, these methods and tools provided a comprehensive patient picture that they could more easily share with the other providers. It was also noted by many participants that the objective algorithms were not used in a standardised manner across units or providers, thereby limiting their effectiveness. The other negative influence mentioned was that the algorithms were not applicable for use with certain patient populations because, for example, a high PEW score could actually be a baseline score for certain patients. The influences associated with the tools for entering, displaying and monitoring data and data trends pertained to how the task of identifying and monitoring a deteriorating patient had been made easier with the implementation of the electronic health record system and its ability to display data over time. A limitation often mentioned, though, was that nurses, RTs and doctors chart their information differently and in different places, making it more difficult to share patient information. (iii) Standardised processes and procedures (organisational) Shared training and language regarding patient risk, structure to proactively identify and plan for risk, structure to support handoffs and continuity of care and structure that supports adequate workload/staffing

(13/10/2014 Final Version) Page 296
Author; Date; Country; Title
Purpose Design Settings/Participants Intervention Clinical Data Collection Method/Analysis
Outcomes/Results
Shared training and language regarding patient risk pertained to training providers in a common language and terminology that helped to create a collective understanding of patient status, resulting in improved communication, improved mitigation planning and enhanced and coordinated efforts for carrying out the escalation strategy. One frequently mentioned term was ‘watcher’, defined as having a ‘gut feeling’ about a patient that is at risk for deterioration or ‘close to the edge’. Additional influences included experienced providers who have better assessment skills, critical thinking and clinical judgement. Also important were these experienced providers’ knowledge of and effective use of available resources and their ability to train others through peer coaching and debriefs. In contrast, inexperienced providers (eg, new nurses and residents) who are unfamiliar with standardised processes may have task fixation, as opposed to seeing the whole picture. Additionally, new or even seasoned nurses’ reluctance to ask for a second opinion could influence SA negatively, as could providers being asked to care for complex patients with diseases with which they are unfamiliar. Additional influences included variation in understanding and application of standardised SA terms such as ‘watcher’ and high-risk therapy. Influences related to the structure to proactively identify and plan for risk pertained to developing and implementing standardised organisational processes and procedures, including huddles, frequent scheduled assessments and ‘check-ins’ by charge nurses and physicians, MRT calling criteria, planning tools and explicit contingency planning. These practices worked to create a collective understanding of unit and hospital-wide patient status, plus expectations, plans and predicted patient care progression. A limitation to these positive influences included that while it would be ideal to standardise

(13/10/2014 Final Version) Page 297
Author; Date; Country; Title
Purpose Design Settings/Participants Intervention Clinical Data Collection Method/Analysis
Outcomes/Results
practices and procedures, it is often not done, leading to lack of role clarity, missed communication opportunities and misunderstandings, particularly between the nurses and physicians. The influences of structure to support handoffs and continuity of care included clear and standardised handoff practices and knowledge of the patient’s initial and current status and the patient’s family. Resident and nurse respondents frequently noted that shift work, more common after the 2011 residency work-hour restrictions, has decreased continuity. Influences that emerged for a structure that supports adequate workload/staffing included: (1) an improved staff-to-patient ratio to ensure that patient monitoring is appropriate and timely, (2) an experienced and diverse team of providers available on all shifts and (3) extra resources available if needed. Negative influences on SA were the demands of caring for very sick patients or those with whom providers have less personal and clinical familiarity (ie, disease type). Additional negative influences included having fewer resources (specifically on night shifts) and competing demands due to heavy workload.
Brady et al. (2013) USA Improving situation awareness to reduce unrecognised clinical deterioration and serious safety events.
To design designed a system to identify, mitigate, and escalate patient risk by using principles of high-reliability organizations Hypothesis A novel care system would decrease transfers determined to be
Observation time series study
Cincinnati Children’s Hospital Centre is a 523-bed academic, quaternary- care, free- standing children’s hospital RRT (called a medical response team [MRT]) has been in place since 2006 A modified version of the Monaghan paediatric early warning score (PEWS) was tested and
SA intervention included: (1) a formalized process where bedside nurses proactively identified 5 factors (2) unit-based huddles where charge nurses and physicians discussed identified factors and developed mitigation plans (3) initiation of 3-times daily inpatient huddle where individual patient risk was discussed
Two investigators reviewed 20 consecutive SSEs and 80 consecutive ICU transfers to identify potential predictors of deterioration. The presence of at least 1 of the following 5 risk factors was found in each case: (1) family concern about patient safety, (2) high-risk therapies including unfamiliar therapies on the unit, 3) elevated PEWS of <=5, (4) watcher or a patient where a clinician had a “gut feeling” that the patient was at risk for deterioration or “close to the
The rate of UNSAFE transfers per 10 000 non-ICU inpatient days was significantly reduced from 4.4 to 2.4 over the study period. The days between inpatient SSEs also increased significantly The number of units by week where >=90% of weekly nursing shifts fully identified and mitigated or escalated patient risk were tracked on run charts and revealed both improved and sustained performance for 11 months of tracking On each participating unit, 90% to 95% of identified risk was mitigated by the primary team with no

(13/10/2014 Final Version) Page 298
Author; Date; Country; Title
Purpose Design Settings/Participants Intervention Clinical Data Collection Method/Analysis
Outcomes/Results
unrecognized situation awareness failures events (UNSAFE)
spread across the hospital in 2007
and specific predictions made (4) development of a continuous learning system to evaluate SA and UNSAFE transfers, and 1 year later (5) development of a “robust” and explicit plan for patients identified as having 1 of the risk factors
edge,” and (5) communication concern that may impact patient safety Data collected on process measures of systematic identification, mitigation, and escalation of risk that authors believed would improve SA and decrease UNSAFE transfers and SSEs. Data initially collected from each unit on each nursing shift to measure the reliability that each shift identified all patients at risk and mitigated or escalated that risk. This was captured through a checklist-based form completed by each charge nurse. The tool was tested and evaluated with charge nurses from several units during early phases. Before spread throughout the hospital, 116 charge nurses received training on the process and tool through a 1.5-hour learning session. Validity of process data were evaluated through discussion during inpatient huddles by investigators, SOD, and MPS. UNSAFE transfers were identified from the ACA process and validated against review of the EHR for each ICU transfer. SSEs were captured through a safety reporting process For the primary outcome of UNSAFE transfers, results were tracked by using both a days-between t-chart and
escalation needed. Each inpatient huddle took less than 30 minutes. Initially there was substantial variation in the number of patient risks that were escalated, a median of 2 risks for each huddle were escalated the first year. This increased over the study period with a median of 7.5 concerns escalated in May 2012. An initial decrease in UNSAFE transfers occurred, though it did not meet rules for special cause and was not sustained. Analysis of UNSAFE transfers through an ongoing ACA process revealed that in the vast majority of UNSAFE transfers, patient risk had been identified but not fully mitigated on unit or escalated to the MRT or safety team the rate of UNSAFE transfers improved from a baseline of 4.4 to 2.4 transfers per 10 000 non-ICU inpatient days, meeting criteria for special cause variation with 8 points below the median line. A significant change in the days-between inpatient SSEs from 100 days to .400 twice was observed in association with the intervention

(13/10/2014 Final Version) Page 299
Author; Date; Country; Title
Purpose Design Settings/Participants Intervention Clinical Data Collection Method/Analysis
Outcomes/Results
rate chart. Roberts et al. (2014) Children’s Hospital of Philadelphia (CHOP) Barriers to calling for urgent assistance despite a comprehensive pediatric rapid response system
To identify and understand barriers to calling for urgent assistance in a children’s hospital where an rapid response system (RRS) was implemented One component of a larger study which also (i) evaluated the mechanisms by which early warning scores affect safety (ii) identified specific factors that contributed to false-negative and false-positive EWS (iii) assessed role of patients’ families in recognition of deteriorating condition & MET activation
Qualitative study
n=57; 27 nurses and 30 physicians caring for patients in general medical and surgical care areas.
RRS consisted of (i) identification component including criteria for calling a MET (ii) an EWS with corresponding care guidelines (iii) response component with a 30-minute response MET available for activation by any clinician for any clinical concern (independent of the EWS), 24 hours per day, 7 days per week. For concerns that could not wait 30 minutes, any hospital employee could activate the immediate-response code blue team.
Semi-structured interviews Interview schedule developed through a detailed review of relevant literature and consultation with experts included open-ended questions that elicited nurses’ and physicians’ viewpoints regarding barriers and facilitators to activating the MET. Modified ground theory approach used to analyse data
Both nurses and physicians valued RRS; believed it enhanced patient safety and improved relationships between clinicians in general care areas and in ICUs There were however a number of barriers that at times shaped their decisions about whether or not to activate the MET (i) Self-efficacy They doubted their ability to recognise deterioration in patient’s condition; along with concerns that their clinical decision making would be evaluated; some regretted that they had not been more assertive in situations involving delays in escalation of care (these issues emerged for nurses with poor limited and extensive experience and also medical residents; however attending physicians did not express any lack of self-efficacy regarding recognition of deterioration or activation of MET) Facilitator: presence of self-efficacy to overcoming hierarchical norms and resistance. (ii) Perceptions of hierarchy Importance of preserving relationships within own care teams was discussed and these relationships may become problematic when they prevent clinicians from seeking assistance from the MET. Hierarchical barriers sometimes challenging to navigate and led to delays in care of patients whose condition was deteriorating. Mechanisms to overcome such barriers e.g. teaming up with charge nurse (iii) Expectations of MET call outcomes Expectations of clinical outcomes from MET activations and intensive care unit transfers could strongly shape escalation-of-care behaviour due to previous experience. Reluctance among subspecialty attending physicians to transfer patients to intensive care unit for fear of inappropriate management. Feared resistance and criticism from MET. Previous positive experiences more likely to

(13/10/2014 Final Version) Page 300
Author; Date; Country; Title
Purpose Design Settings/Participants Intervention Clinical Data Collection Method/Analysis
Outcomes/Results
activate MET quickly.

(13/10/2014 Final Version) Page 301
APPENDIX 28
Data extraction
Cross-sectional surveys on the use, implementation and prevalence of PEW detection and response systems

(13/10/2014 Final Version) Page 302
Data Extraction –Cross-sectional surveys on the use, implementation and prevalence of paediatric early warning detection and response systems
Author; Date; Country; Title
Purpose Design Settings/Participants Clinical Data Collection Method/Analysis
Outcomes/Results
Chen et al. (2014) USA Prevalence, Characteristics, and Opinions of Paediatric Rapid Response Teams in the United States
To determine the prevalence, characteristics, and opinions of RRTs in hospitals with PICUs in United States.
Cross sectional survey of PICU physicians
Adult and Children’s Hospitals that care for children. Participants were medical directors of PICU’s
The survey instrument was designed by the primary investigator (Dr Chen) with input from a survey methodology expert (Dr Kemper) and pediatric critical care content experts (Drs Odetola and Turner). Surveys were pilot tested among critical care physicians at the primary investigator’s institution and edited for clarity. Surveys were distributed online and by mail, with the option of responding via either route. Three waves of contact were pursued from April 2010 through June 2010.
Prevalence rates: Survey was sent to 210 hospitals across the US, 130 being included in sample. 103 completed by PICU medical director. Of 130 respondents, 103 (79%) had an RRT. Ninety-five (92%) of these RRTs were implemented between 2005 and 2009, with 49 (48%) being implemented in 2008 and 2009. Characteristics: All available 7 days a week, 24 hours a day. 80% of institutions had RRT that was separate from cardiopulmonary resuscitation team. Typical patient events that would trigger RRT activation included respiratory distress (95%), circulatory issues such as shock or arrhythmia (90%), neurologic issues such as seizure or mental status changes (92%), and general concern from the ward staff regarding clinical status (85%). RRTs could be activated by families in 69% of the responding hospitals. Automatic triggers, defined as activation of the RRT via predetermined changes in the patient’s vital signs or overall clinical status, were present in 34% of hospitals RRT Composition: RRTs included a median of 3 individual members (range: 2–8). RRTs were composed of physicians (critical care attending physicians, critical care fellows hospitalists, and/or residents) in 77% of responding institutions. Of these teams, 47% included attending physicians 37% included fellows, and 55% included residents. Nurses (PICU, transport and/or ward) were present in 100% of teams and respiratory therapists in 89% . The leader of the RRT was either a physician (63%), a nurse

(13/10/2014 Final Version) Page 303
Author; Date; Country; Title
Purpose Design Settings/Participants Clinical Data Collection Method/Analysis
Outcomes/Results
(29%), a nurse practitioner (3%), or a combination of these individuals (5%). Tracked the number of activations (96%) and outcomes associated with RRT’s (84%). Opinions: Respondents from institutions with RRTs were more likely to agree that RRTs improve patient safety than respondents from institutions without. They are more likely to disagree that RRTs are not worth the money invested and more likely to disagree that RRTs are not worth the staff invested. Early adopters of RRTs were more likely than late adopters to believe that RRTs reduce the number of codes on the wards. Among hospitals with RRTs, 81% answered that their ward teams felt comfortable activating an RRT, and 21% of respondents thought that their institutional RRT was underutilized.
Roland et al. (2014) UK Use of paediatric early warning systems in Great Britain: has there been a change of practice in the last 7 years?
To determine the use of paediatric early warning systems (PEWS) and rapid response teams (RRTs) in paediatric units in Great Britain.
Cross sectional survey
Setting: All hospitals with inpatient paediatric services in GB (n=157) 126 hospitals classified as district general hospital (DGH) 31 tertiary children’s hospitals n= 1274 patient admissions, care provided by 62 frontline staff (56 registered nurses & 6 respiratory therapists).
Electronic survey: questions from 2005 PEWS survey & additional questions on the number of beds, composition of an RRT if used and derivation, auditing and validation of a PEWS tool if present, a question on the parameters used in PEWS. Survey piloted on a small number of consultants known to use PEWS in their departments Short telephone survey was completed with hospitals that had not completed the electronic survey
Outcomes: Proportion of units using PEWS, origin of PEWS used, criterion included in PEWS, proportion of units with an RRT and membership of RRT. Results: 85% of units using PEWS 18% had an RRT in place Tertiary units were more likely than district to have implemented PEWS, 90% versus 83%, and an RRT, 52% versus 10%. Large no. of PEWS were in use, majority of which were unpublished and invalidated systems Respiratory and heart rates were the two most common criterion used in the PEWS systems with over 50% of respondents using these and oxygen saturations, abnormal consciousness and effort of breathing. Implementation of PEWS inconsistent with large variation in the PEWS used, the activation criteria used, availability of an RRT and the membership of the RRT.
Sen et al. (2013) USA
Examination of standard paediatric RRT practice, focusing
Telephone survey
34 academic US paediatric hospitals, selected and identified using top US News and
62 item telephone survey One researcher
All 30 responding hospitals reported maintaining 24 hour/day–7 day/week arrest teams and RRTs Roughly one-quarter (23%) provide additional support for

(13/10/2014 Final Version) Page 304
Author; Date; Country; Title
Purpose Design Settings/Participants Clinical Data Collection Method/Analysis
Outcomes/Results
Variability in the implementation of Rapid Response Teams at Academic American Paediatric Hospitals
on large US academic institutions Hypothesis Hospitals approach team composition, financial support, and outcome assessment differently
World Report rankings 30 hospitals participated (RR 88%) Respondents were typically Arrest Committee chairpersons or paediatric ICU (PICU) medical directors. All participating institutions provided extra-corporeal membrane oxygenation, a PICU fellowship program, and a minimum of 1 PICU physician in the hospital overnight, with 43% providing 24-hour in-house PICU attending coverage
RRTs, including salary support for fellows, nurses, or respiratory therapists More than one-half (60%) of the hospitals reported receiving family-activated calls in 2011 (range 3-12 calls) Although 33% of the responding hospitals have a dedicated emergency team nurse, none have a dedicated physician Almost one-half (47%) perform routine follow-up after RRT calls, most commonly within the first 6 hours (range 1-48 hours). Institutional floor arrest definitions varied with the largest group (13 hospitals) defining a floor arrest as emergent intubation, chest compressions/emergency medicines, and/or defibrillation Nineteen of the 30 participating hospitals belong to the Children’s Hospital Association (CHA), which defines a code occurring outside the ICU as chest compressions, electric shock, or acute respiratory compromise (ie, emergency invasive ventilation or emergency non-invasive ventilation, followed by transfer to a higher level of care for ongoing support). Two of these 19 respondents gave the official CHA definition as their institutional floor arrest definition. The hospitals reported a median of 130 RRT calls in 2011 (range 11-664; n = 27), with a median rate of 4.3 RRT calls/1000 patient-days (range, 0.76-6; n = 9) More than one-half (57%) of the participating hospitals standardize their arrest rates to patient-days; 30% standardize the RRT calls similarly A median of 52% of RRT calls led to PICU transfer (range 25%-80%, n = 24) Almost three-quarters (73%) of the hospitals track RRT call times, with 82% reporting that the majority of calls occur in the daytime. Six respondents volunteered that floor teams do not call early enough, and suggested the following solutions;
Two hospitals extended the expected arrival time

(13/10/2014 Final Version) Page 305
Author; Date; Country; Title
Purpose Design Settings/Participants Clinical Data Collection Method/Analysis
Outcomes/Results
for the RRT to 30 minutes, to encourage earlier calls, before clinical decline.
Several hospitals analyzed their floor arrests and near-arrests to determine floor-specific Pediatric Early Warning Score cut-offs; that is, floors with higher arrest rates were assigned more stringent cut-offs than less-sick floors, to catch clinical decline while avoiding an increase in unnecessary RRT calls.
One institution enacted proactive rounds in which a PICU provider talks with the floor teams daily to discuss fragile patients before significant decline
Only 73% RRT had physician member Wide variability in RRT follow up with 53% of programs no follow up RRTs vary in terms of triggers, composition, response time and follow-up. The best outcome measure for determining the effectiveness of paediatric RRTs is unclear RRT organised heterogeneity – usefulness of RRTs remains questionable of the heterogeneity of RRTs in children’s hospitals To compare RRT efficacy paediatric hospitals should agree on standard outcome measures- whether it be a standard definition of floor arrest or clinical deterioration If elect to use arrest as primary measure then the terms needs standardisation
VanDenBerg et
al. (2007)
Canada
A Cross-
sectional Survey of
Levels of Care and Response
Mechanisms for
Evolving Critical Illness
To describe levels of care, frequency
of near or actual
cardiopulmonary arrest (code-blue
events),
identification mechanisms, and
responses to evolving critical
illness in
hospitalized children
Cross-sectional telephone survey
Canadian and American hospitals with >=50
paediatric acute care beds
or >=2 paediatric wards
Respondents included
resuscitation committee chairs, paediatric intensive
care directors, and acute care clinical nurse
specialists.
A total of 464 eligible
The questionnaire was developed by 2 investigators (VandenBerg and
Parshuram) and consisted of 42
questions.
Regression analysis identified factors
associated with the frequency of code-blue events after adjustment for hospital
volume. 8 week period
Responses were received after 1091 contact episodes with 964 health care professionals from 388 hospitals, for a response rate of
84%.
Of the responding hospitals 181 (47%) hospitals met inclusion criteria; 16 (8%) were Canadian hospitals; 165 (92%) were
American
85 (47%) were freestanding pediatric acute care hospital
These hospitals represented 24 874 acute care pediatric beds, composed of 6861 NICU, 2811 PICU, 715 HDU, and 14 487
general beds.
Primary respondents from these hospitals were PICU staff
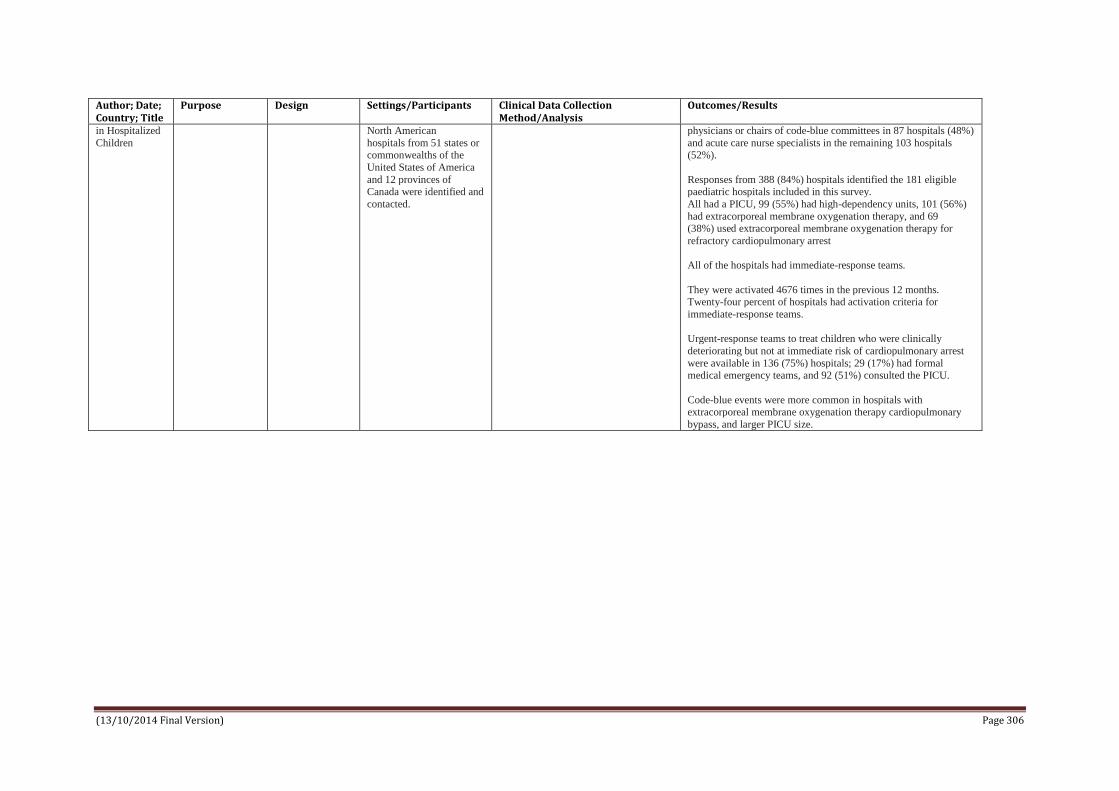
(13/10/2014 Final Version) Page 306
Author; Date; Country; Title
Purpose Design Settings/Participants Clinical Data Collection Method/Analysis
Outcomes/Results
in Hospitalized
Children
North American
hospitals from 51 states or commonwealths of the
United States of America
and 12 provinces of Canada were identified and
contacted.
physicians or chairs of code-blue committees in 87 hospitals (48%)
and acute care nurse specialists in the remaining 103 hospitals (52%).
Responses from 388 (84%) hospitals identified the 181 eligible paediatric hospitals included in this survey.
All had a PICU, 99 (55%) had high-dependency units, 101 (56%)
had extracorporeal membrane oxygenation therapy, and 69 (38%) used extracorporeal membrane oxygenation therapy for
refractory cardiopulmonary arrest
All of the hospitals had immediate-response teams.
They were activated 4676 times in the previous 12 months. Twenty-four percent of hospitals had activation criteria for
immediate-response teams.
Urgent-response teams to treat children who were clinically
deteriorating but not at immediate risk of cardiopulmonary arrest
were available in 136 (75%) hospitals; 29 (17%) had formal medical emergency teams, and 92 (51%) consulted the PICU.
Code-blue events were more common in hospitals with extracorporeal membrane oxygenation therapy cardiopulmonary
bypass, and larger PICU size.

(13/10/2014 Final Version) Page 307
APPENDIX 29
Data extraction
Economic Studies

(13/10/2014 Final Version) Page 308
Data Extraction – Economic Studies
Author; Date; Country; Title
Purpose Design Settings/ Participants
Intervention Economic Data Collection Method/Analysis
Outcomes/Results
Bonafide et al 2014 US Cost-benefit analysis of a medical Emergency Team in a children’s hospital
To model the financial costs and benefits of operating a MET and determine the annual reduction in critical deterioration (CD) events required to off-set MET costs.
Single-centre retrospective cohort study between 1/7/2007 to 31/3/2012 (to determine the costs of CD events) compared to transfers to the ICU without CD); cost-benefit analysis evaluating various MET compositions and staffing models(freestanding or concurrent responsibilities) on the annual reduction in CD events needed to offset MET costs.
Children’s Hospital of Philadelphia an urban tertiary care children’s hospital with 535 beds, 55-bedded PICU and 85-bedded neonatal ICU
MET team: 8 models: freestanding versus teams with concurrent responsibilities in ICU, with varying team composition of: Registered Nurse (RN) + Respiratory Therapist (RT); RN, RT + critical care fellow/ a nurse practitioner/ a critical care attending physician.
Hospital charge data for ICU unplanned transfers without and without CD event; to address the question: among unplanned transfers to the ICU do patients with CD cost more to care for that patients without CD?: post-event ICU stay and post-event hospital stay costs. MET staffing and administration was costed using salary scales from various US sources. Cost year = 2012 A cost-benefit analysis was conducted to model the balance between the costs of staffing and administering the MET with the potential cost savings achievable if the MET leads to a reduction in the incidence of CD.
A child who underwent an unplanned transfer was classified as having CD if any life-sustaining interventions (ventilation or vasopressor infusion) were required within 12 hours of ICU transfer. 1,759 unplanned transfers occurred during the study period; 1,396 patients met the inclusion criteria; 378 (27.1%) of those met CD criteria. There was a statistically significant difference favouring non-CD in length of stay and in mortality rates for those with/without CD in ICU and in hospital overall post-transfer, with patients with CD. In unadjusted and multivariate models patients who had CD cost more to care for overall while they are in ICU (a difference of $89,260 per patient) and their full stay after event ($114,018 less per patient) (inflated to 2014 costs and converted to Euro, this amounts to €73,748 and €94,200 respectively. After adjustment for potential confounders, patients with CD cost $81,167 more than those without while in ICU and $99,773 (inflated to 2014 and converted to Euro this amounts to €67,059 and €82431 respectively) more across their full stay post-event. There was a significant cost difference in costs when the cohort was stratified by age group, referring ward, destination (NICU/PICU), and time during the day of the transfer. The breakeven points for the MET scenarios show that savings associated with a reduction of 3 CD events is needed to offset the lowest-cost team (concurrent responsibilities, RN/RT), while a reduction of 24 events is needed to offset the costs of the highest-cost team (freestanding RN/RT/attending). Conclusion: CD events are costly as well as adverse events for patients. MET costs can be recouped with a modest reduction to CD events.
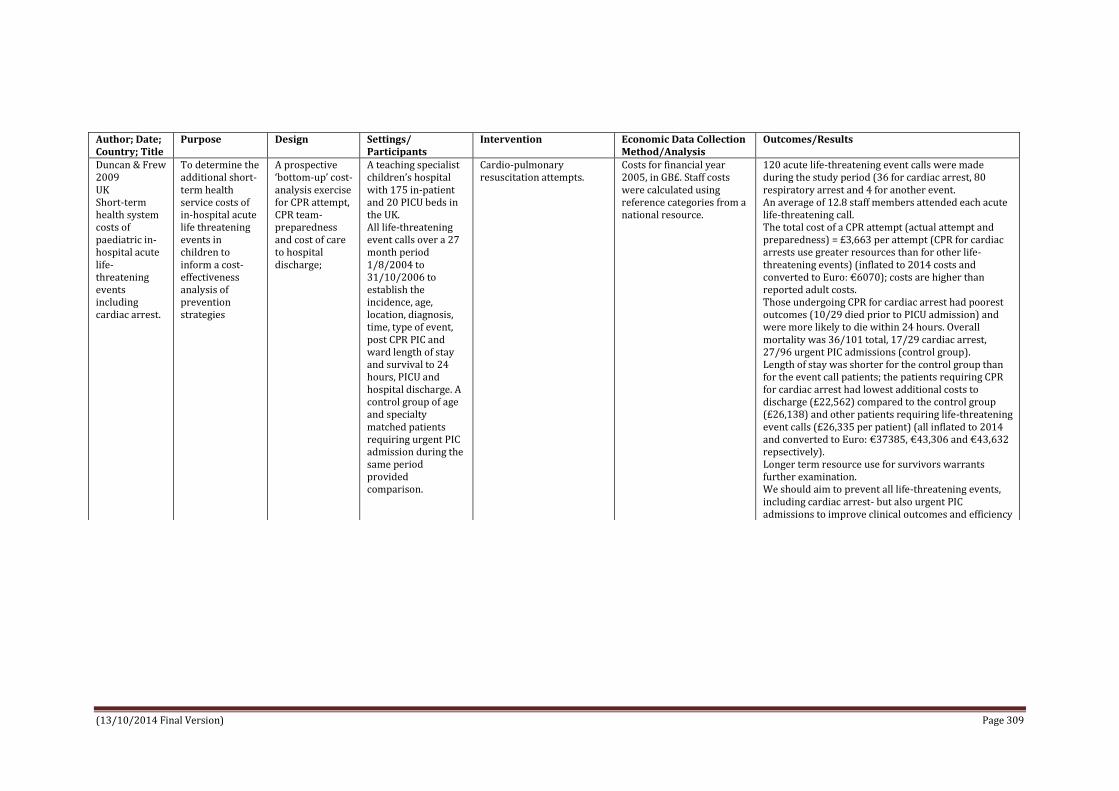
(13/10/2014 Final Version) Page 309
Author; Date; Country; Title
Purpose Design Settings/ Participants
Intervention Economic Data Collection Method/Analysis
Outcomes/Results
Duncan & Frew 2009 UK Short-term health system costs of paediatric in-hospital acute life-threatening events including cardiac arrest.
To determine the additional short-term health service costs of in-hospital acute life threatening events in children to inform a cost-effectiveness analysis of prevention strategies
A prospective ‘bottom-up’ cost-analysis exercise for CPR attempt, CPR team-preparedness and cost of care to hospital discharge;
A teaching specialist children’s hospital with 175 in-patient and 20 PICU beds in the UK. All life-threatening event calls over a 27 month period 1/8/2004 to 31/10/2006 to establish the incidence, age, location, diagnosis, time, type of event, post CPR PIC and ward length of stay and survival to 24 hours, PICU and hospital discharge. A control group of age and specialty matched patients requiring urgent PIC admission during the same period provided comparison.
Cardio-pulmonary resuscitation attempts.
Costs for financial year 2005, in GB£. Staff costs were calculated using reference categories from a national resource.
120 acute life-threatening event calls were made during the study period (36 for cardiac arrest, 80 respiratory arrest and 4 for another event. An average of 12.8 staff members attended each acute life-threatening call. The total cost of a CPR attempt (actual attempt and preparedness) = £3,663 per attempt (CPR for cardiac arrests use greater resources than for other life-threatening events) (inflated to 2014 costs and converted to Euro: €6070); costs are higher than reported adult costs. Those undergoing CPR for cardiac arrest had poorest outcomes (10/29 died prior to PICU admission) and were more likely to die within 24 hours. Overall mortality was 36/101 total, 17/29 cardiac arrest, 27/96 urgent PIC admissions (control group). Length of stay was shorter for the control group than for the event call patients; the patients requiring CPR for cardiac arrest had lowest additional costs to discharge (£22,562) compared to the control group (£26,138) and other patients requiring life-threatening event calls (£26,335 per patient) (all inflated to 2014 and converted to Euro: €37385, €43,306 and €43,632 repsectively). Longer term resource use for survivors warrants further examination. We should aim to prevent all life-threatening events, including cardiac arrest- but also urgent PIC admissions to improve clinical outcomes and efficiency

(13/10/2014 Final Version) Page 310
APPENDIX 30
AACODS: authority, accuracy, coverage, objectivity, date, significance
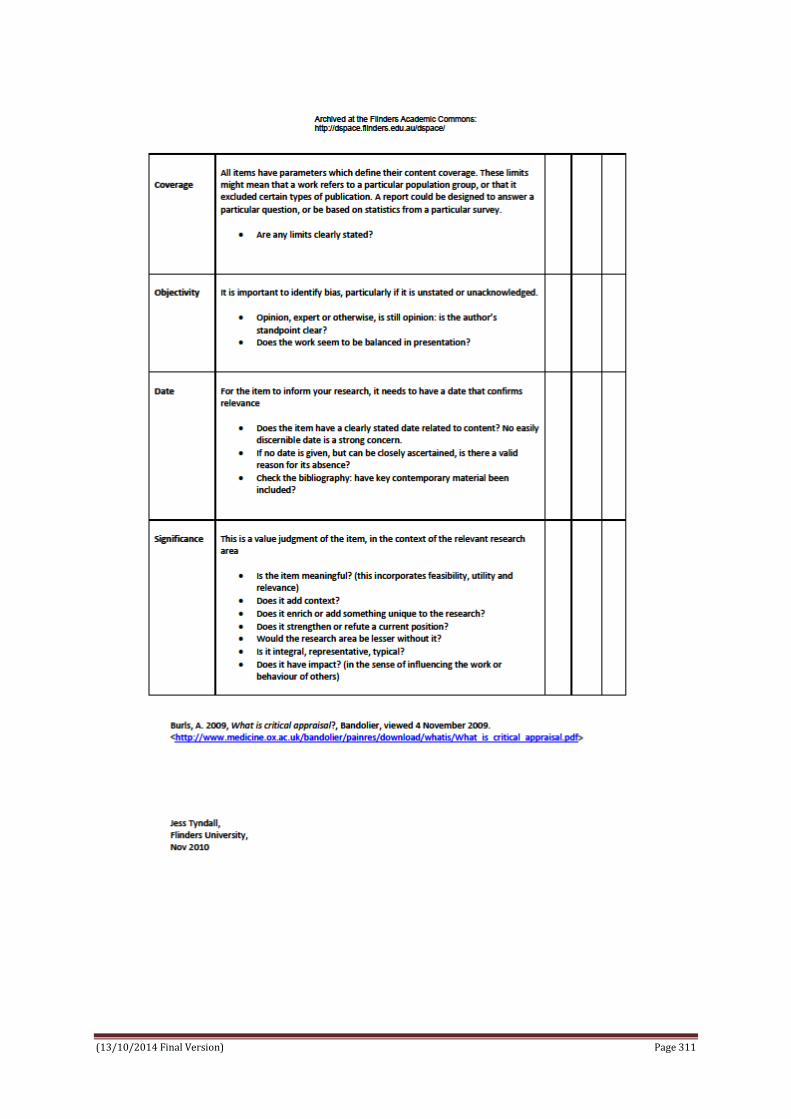
(13/10/2014 Final Version) Page 311

(13/10/2014 Final Version) Page 312
APPENDIX 31
SCREENING/EVALUATION OF GREY LITERATURE (AACODS - Flinders 2010)
Grey Literature Authority Y, N, ?
Accuracy Y, N, ?
Coverage Y, N, ?
Objectivity Y, N, ?
Date Y, N, ?
Significance Y, N, ?
No Author cited Appendix 4: N.C. Children’s Hospital and Pediatric Rapid Response Team. Retrieved from Agency for Healthcare Research and Quality. http://innovations.ahrq.gov/guide/appendix4.aspx [22/08/2014] North Carolina, USA
Y N N ? N Y
Hueckel RM, Turi JL, Cheoifetz IM, Mericle J, Meliones JN, Mistry KP. Beyond Rapid Response Teams: Instituting a “Rover Team” Improves the Management of At-Risk Patients, Facilitates Proactive Interventions, and Improves Outcomes. Retrieved from http://www.ahrq.gov/professionals/quality-patient-safety/patient-safety-resources/resources/advances-in-patient-safety-2/vol3/advances-hueckel_27.pdf [22/08/2014] North Carolina, USA
Y Y Y ? N Y
Willis TS & Hanson CC (Innovators) Family-Activated Pediatric Rapid Response Team Increases Calls From Both Families and Staff, Supports Improvements in Outcomes. Retrieved from Agency for Healthcare Research and Quality. http://innovations.ahrq.gov/content.aspx?id=2435 [22/08/2014] North Carolina, USA
Y Y N ? Y Y
Vossmeyer MT & Tucker K (Innovators) Simple Scoring System and Action Algorithm Identifies Children at Risk of Deterioration, Leading to Fewer Codes and More Timely Transfer to Intensive Care Unit. Retrieved from Agency for Healthcare Research and Quality http://innovations.ahrq.gov/content.aspx?id=2285 [22/08/2014] Cincinnati, USA
Y N N ? Y Y

Page 313
APPENDIX 32
DATA EXTRACTED FROM GREY LITERATURE
Author/Source/Title Data Extracted Appendix 4: N.C. Children’s Hospital and Pediatric Rapid Response Team. Retrieved from Agency for Healthcare Research and Quality. http://innovations.ahrq.gov/guide/appendix4.aspx [22/08/2014] North Carolina, USA
Pediatric rapid response team introduced at NC Children’s Hospital, University of North Caroline, Chapel Hill (UNC). PRRT available 24 hours a day, 7 days a week Any member of the team or the hospital's staff can call a team into action. The PRRT can be called when staff or a family member is worried about the patient; if acute changes in the patient's heart rate, blood pressure, respiratory rate, oxygen saturation, or mental status; a new or prolonged seizure occurs; or the patient has difficult-to-control pain or agitation. PRRT composed of - Pediatric Intensive Care Unit (PICU) physician team leader, PICU charge nurse and respiratory therapist, senior pediatric resident, and the patient's primary team of physicians and nurses. Physician champion / patient safety officer to drive initiative - Signed to be part of Lives Campaign of which one of six intervention recommendations was RRT development Physician champion presented a concept proposal to senior administrators (i.e. chief of staff, executive associate dean of clinical affairs, paediatric chairman); physician champion conducted chart review to gather historical information on cardiac and respiratory arrests in the institution and told powerful stories of patients from own hospital to illustrate how such cases could have benefited from the use of RRTs. National examples also used. Various benefits were expected; reduce cardiac and respiratory arrests; increased nursing staff satisfaction because they would be empowered by having the option of calling a team 24 hours a day without ramifications for false alarms; improved communication and cooperation between caregivers and breakdown in the hierarchy of caregivers and this innovation would be visible to the families of paediatric patients. After management buy-in was a multidisciplinary task force led by the physician champion was formed to plan for and guide implementation. Ground work was conducted to obtain Staff Buy-In and Address Resistance; this included presentations to local groups/teams; loss of control was a main concern. Positive feedback about the innovation was reinforced through patient safety rounds, weekly updates sent to staff, and posters in every unit. To encourage staff to activate the teams, the organization president sent a thank you e-mail to staff members who activated a team, with a copy to their supervisor. Stated: The importance of having a champion was clearly paramount in the adoption process for this innovation; another thing that contributed to N.C. Children's Hospital's success was setting parameters from the outset and settling such details as what the team's services would cover and the logistics of responding in atypical locations.
Hueckel RM, Turi JL, Cheoifetz IM, Mericle J, Meliones JN, Mistry KP. Beyond Rapid Response Teams: Instituting a “Rover Team” Improves the Management of At-Risk Patients, Facilitates Proactive Interventions, and Improves Outcomes http://www.ahrq.gov/professionals/quality-patient-
Duke Children’s Hospital, Duke University Health System, Durham, North Carolina Introduced concept of proactive “Rover Team” who make scheduled visits (Roves) to non-ICU inpatient pediatric ward to provide a critical care resource to medical and nursing staff and to systematically review patients at risk for clinical deterioration Hypothesized that implementing a “Rover Team” as part of a pediatric RRS would add a proactive component that would result in patients receiving necessary treatments prior to meeting RRT criteria, improve clinical outcomes, such as increasing patient throughput and decreasing number of readmissions to the ICU, and decrease the number of emergency responses from the pediatric ICU (PICU) to non-ICU areas (Code Blue responses).

Page 314
Author/Source/Title Data Extracted
safety/patient-safety-resources/resources/advances-in-patient-safety-2/vol3/advances-hueckel_27.pdf [22/08/2014] North Carolina, USA
PRRT comprised a pediatric critical care nurse practitioner or fellow, the PICU charge nurse, and a PICU respiratory therapist. Prior to implementation of the PRRT, the pediatric house staff and nursing staff participated in a 45-minute educational session. The PRRT was implemented on a trial basis in the progressive care unit (PCU) in January 2006. The PRRT was put into place to respond to patients whose clinical status had deteriorated based on an objective set of activation criteria. In April 2006, the RRS incorporated a proactive Rover Team component to complement the reactive PRRT. This care-delivery model was then made available for all inpatient pediatric patients and providers outside of the PICU. The Rover Team expands the PRRT responsibilities to include a proactive assessment of patients at risk for clinical deterioration, such as acutely ill children admitted to non-ICU inpatient areas or those recently transferred from the PICU. A member of the Rover Team meets with the on-call senior resident and the charge nurses of inpatient intermediate care units at scheduled intervals). During these scheduled evaluations (“Rover Rounds”), the Rover reviews the clinical data, evaluates the patient, provides a critical care perspective, and coordinates transfer to a higher level of care if needed. If necessary, these patients are then targeted for further evaluation by the Rover Team and scheduled for follow up by the primary team. In addition to these scheduled patient identification rounds, the Rover Team evaluates two other patient populations identified as potentially high-risk: all children who have been discharged from the PICU within the prior 12 hours and all patients admitted to the PCU within 1 hour of admission. This process allows for continuity of care as the patient transitions out of the PICU and ensures that these high-risk patients are assessed on a timely basis. Data were collected on all PRRT activations (time, day, and location of the call; who initiated the call; primary and secondary reasons for team activation; and a list of interventions performed, response outcome) and Rover Team interventions to any pediatric patient in the Children’s Health Center outpatient clinics and all children admitted to either of the inpatient pediatric intermediate care units, PCU, or PBMTU between April 2006 and June 2007. Concurrent with the initiation of PRRT and Rover teams, the number of in-hospital cardiopulmonary arrests on pediatric wards decreased and the number of days between codes increased. Proactive Rover Team was able to identify and assist in the care of at-risk patients early, avoiding transfer to a higher level of care 90 percent of the time. Examples of these proactive interventions by the Rover Team include assisting with venous access, clarification of orders, and educating staff about equipment Also survey nursing staff - 12-question survey sent by e-mail to 132 staff RNs. The survey measured responses on a 6-point scale and elicited general comments to questions regarding the staff’s use of the PRRT/Rover Team and the Team’s contribution to an environment of patient safety N= 36 responded (27 % response rate); 80% percent of responding nurses had activated the PRRT or interacted with the Rover Team. Nurses who had not activated the RPRT indicated that this was due to a lack of necessity rather than a hesitancy to activate the system. Overall, the vast majority of the nursing staff polled felt that the presence of the RRS made them feel more comfortable and confident in caring for their patients and that it greatly strengthened the environment of safety within the Children’s Hospital; 100% said they would recommend using the PRRT/Rover Team to a colleague and would encourage or assist others in activating the team Concluded; Pediatric Rapid Response System with the proactive Rover Team and rapidly-reactive PRRT helped reduce patient cardiac arrests outside the ICU setting, improved patient continuity between the critical care and non-ICU inpatient areas, and strengthened multidisciplinary team culture and communication.
Willis TS & Hanson CC (Innovators) Family-Activated Pediatric Rapid Response Team Increases Calls From Both Families and Staff, Supports Improvements in Outcomes. Retrieved from Agency
Describes Family Alert Initiative (FAI) at North Carolina Children's Hospital; FAI empowers and encourages families who suspect that their child may need immediate resuscitative or medical attention to activate the hospital's rapid response team by dialling an easy-to-remember number from any hospital telephone. Key elements of the program include; Family education about appropriate activation: admitting nurse educates

Page 315
Author/Source/Title Data Extracted for Healthcare Research and Quality. http://innovations.ahrq.gov/content.aspx?id=2435 [22/08/2014] North Carolina, USA Original publication: September 30, 2009; Last updated: November 06, 2013; Date verified by innovator: September 25, 2013.
family members about the rapid response team and how to activate it, using both verbal instructions and written materials. (Staff receive separate education on when and how to activate the team, including the specific clinical criteria for doing so.*) The core message is to encourage family members to call the team if they fear their child’s condition is acutely worsening; families do not have to provide any specific criteria to justify the call. Key aspects of the family education process are:
Verbal instruction: Prompted by an electronic admission form checklist, the admitting nurse provides families with the telephone number for team activation along with a description of the circumstances in which a call is warranted (i.e. acute emergencies or situations of significant concern). The nurse also instructs families on how to contact staff for non-urgent needs and to register complaints to the patient relations department. The nurse uses a mock script to ensure complete discussion of the topic and documents the provision of this education in the patient chart.
Special education for non–English-speaking families: Translators facilitating the admission process instruct non–English-speaking families on the rapid response team and how to activate it. These families can activate the team by handing a tear-off card located in all patient rooms to an English-speaking staff member. The card instructs the staff member to contact the team immediately on behalf of the family.
Written materials promoting phone number: A variety of written materials prominently promote the phone number for the team and encourage families to call if needed, including bilingual brochures (written in both English and Spanish) distributed to families at admission, flyers posted in family lounges, and posters hanging in every patient room and waiting area. The previously mentioned tear-off cards for non–English-speaking families are located adjacent to the posters. Family activation of the team: Families can directly dial “64111” from any hospital telephone to activate the team. When they do so, an operator asks the family if it wants to activate the rapid response team and confirms the patient’s location/room number. (The operator asks no clinical questions.) Families can also ask a nurse to dial the emergency number if they do not feel comfortable activating the team themselves. Rapid response team care: Whenever the team is activated, the operator makes an announcement on the overhead system and sends a group page to all team members, which include a critical care physician (a pediatric ICU fellow or attending physician), critical care charge nurse for the pediatric ICU, a pediatric ICU respiratory therapist, a senior pediatric resident, and the patient’s primary medical team. The team, per hospital records, typically arrives in less than 5 minutes to provide onsite care and expedite transfer to a higher level of care as necessary. *Staff criteria for activation includes staff or family member concern; acute change in heart rate, systolic blood pressure, respiratory rate, or oxygen saturation level; mental status changes; a new or prolonged seizure; and difficult-to-control pain or agitation. RESULTS Pre- and post-implementation data show that the Family Alert Initiative increased calls to rapid response team by approximately 50%, with most of the additional calls coming from staff rather than family members. More calls to rapid response team, mostly from staff: number of calls to RRT increased from 16 per 1,000 discharges before the Family Alert Initiative implementation (roughly 8 calls per month) to 24 per 1,000 discharges afterward (roughly 12 per month). Although calls increased significantly, only 1-2 calls per year are made directly by family members. The vast majority of additional calls came from staff, likely due to the increased visibility of the RRT and a reduction in perceived barriers to activating the team. Appropriate calls from families: Calls made by family members after implementation of the Family Alert Initiative were found to be necessary and medically appropriate, with all patients requiring transfer to the ICU. Better outcomes resulting from rapid response team

Page 316
Author/Source/Title Data Extracted implementation: Implementation of the rapid response team itself has had a beneficial impact, as follows:
Fewer cardiac arrests: The number of cardiac arrests occurring outside the ICU fell from roughly 10 to 12 per year before implementation of the RRT to 1 to 3 per year afterward. Measured another way, the median number of days between cardiac arrests rose from 34 to 104 after implementation. The cardiac arrest rate per 1,000 ward admissions decreased from 1.25 to 0.45. No change occurred in the frequency of non-ICU cardiac arrests after the addition of the Family Alert Initiative.
Fewer deaths: The hospital experienced a decline in mortality after implementation of the rapid response team; mortality rates fell from 1.5 per 1,000 admissions before initiation of the program to 0.45 per 1,000 admissions afterward.
Quicker ICU assessment: The time from the first documented antecedent to ICU assessment decreased from 9 hours, 55 minutes before implementation to 4 hours, 15 minutes post-implementation.
Key elements of the planning and development process included the following: Planning team: A Family Alert Initiative team formed, consisting of a critical care physician champion, assistant nurse managers from the floors working with the rapid response team, ICU physicians, respiratory therapists, and ICU nurse managers. Leadership buy-in: The team obtained approval from the hospital’s senior administrators to add a family activation component to the rapid response team process. Discussions with other pediatric institutions: Team members called colleagues at pediatric institutions across the nation, learning that most existing rapid response team programs did not allow family activation. Interviewees reported difficulty in convincing faculty and staff of the merits of such an approach, given concerns that families might activate the rapid response team inappropriately. Decision to test concept first: Due to the controversy surrounding family activation, team members decided to test the concept on a few units first; they obtained Institutional Review Board approval for a pilot study. Notification of rapid response team and critical care clinicians: The Family Alert Initiative team informed members of the rapid response team and other critical care physicians about the pilot study. As part of this process, critical care team members head presentations during grand rounds that incorporated real patient stories (including testimonials by parents). Nurse focus groups: The Family Alert Initiative team conducted focus groups with nurses to obtain guidance on best practices for educating families about activating the rapid response team. During these sessions, nurses also received data on the clinical validity of “family concern” as a prompt for staff to activate the rapid response team. Development of standardized education materials: The nurses, in collaboration with communications department staff, developed brochures, flyers, posters, and scripts for educational communications. The team and the nurses also developed an assessment tool to evaluate the family education process tested as part of the pilot. Staff education: Nurses received an educational briefing on the standardized assessment tool, family education process, and educational materials. Operators received training on how to handle calls from families to the rapid response team line. Initial pilot study and program expansion: The program was pilot tested on two nursing units for 2 months (April to May 2007). Based on the success of this study, leaders decided to expand the Family Alert Initiative throughout the hospital.
Resources Used and Skills Needed Staffing: Despite the increase in calls to the rapid response team, the program required no new staff (due primarily to the low total volume of calls, even after implementation). Costs: Data on program development costs are unavailable; the bulk of

Page 317
Author/Source/Title Data Extracted expenses related to the production of brochures and posters Getting Started with This Innovation Secure senior leadership support: Program success depends on support of senior leaders, particularly managing staff resistance. Use data and stories to win staff buy-in: Use data and real-life stories to demonstrate the merits of the program to staff. Address different sources of resistance: Typically, physicians will resist the initial development of a RRT (due to concerns that their oversight of patient care will be undermined), whereas nurses generally like the idea. By contrast, nurses may be apprehensive about the family activation component because of their own perceived loss of control. Holding separate focus groups with each key stakeholder can help address these different sources of resistance. Conduct a pilot study: A pilot study can help acclimatise staff to the idea of family activation, because such studies need not be presented as a permanent change and offer the opportunity for staff feedback. In addition, data from the pilot study can assuage staff concern that families will activate the rapid response team in circumstances that are not clinically appropriate. Sustaining this Innovation Emphasize verbal education: The aforementioned family education assessment tool found that verbal explanations from caregivers are more effective than written brochures in teaching patients when and how to activate the rapid response team.
Vossmeyer MT & Tucker K (Innovators) Simple Scoring System and Action Algorithm Identifies Children at Risk of Deterioration, Leading to Fewer Codes and More Timely Transfer to Intensive Care Unit. Retrieved from Agency for Healthcare Research and Quality http://innovations.ahrq.gov/content.aspx?id=2285 [22/08/2014] Cincinnati, USA
Original publication: February 16, 2009; Last updated: January 29, 2014; Date verified by
innovator: December 21, 2011.
Cincinnati Children's Hospital Medical Center; Inpatient general medical units Program introduced to identify and promptly attend to patients at risk for clinical deterioration Program uses a simple scoring system based on three aspects of patient health (behaviour, cardiovascular status, and breathing) to identify at-risk patients, and an "action algorithm" based on that score to guide the need for additional assessment and/or immediate treatment. The program has effectively identified patients at risk of deterioration, reduced codes on the unit, reduced mortality and length of stay in the pediatric intensive care unit, and led to anecdotal reports of improved teamwork and communication among staff. Evidence rating – Moderate; Retrospective assessment of the reliability of Pediatric Early Warning Scores; pre- and post-implementation comparisons of the number of codes outside the pediatric ICU, ICU mortality rates, and ICU LOS; and anecdotal reports from nurses. Program included; Regular review to identify early signs of deterioration: Every 4 hours, nurses spend an additional 30 seconds assessing the condition of each patient in the unit using the Pediatric Early Warning Scoring (also known as PEWS) system. Scores range from 0 to 13, with a higher number representing a higher risk of clinical deterioration. Scores were based on three criteria: Behaviour: playing/behaving appropriately (0 points); sleeping (1 point); irritable (2 points); or lethargic/confused or reduced response to pain (3 points). Cardiovascular status: capillary nail refill test: 1 to 2 seconds (0 points); 3 seconds or pale refill regardless of time (1 point); 4 seconds, gray refill regardless of time, or rapid heartbeat (tachycardia) that is 20 or more beats per second above normal (2 points); 5 seconds or longer, gray and mottled refill regardless of time, tachycardia that is 30 or more beats per second above normal, or bradycardia (slow heartbeat) (3 points). Respiratory status: normal parameters, with no retractions (0 points); more than 10 breaths per minute above normal, using accessory muscles, 30 percent or higher fractional inspired oxygen (FiO2, the amount of oxygen in the air, in percentage form, a person is breathing), or 3 or more liters of air per minute (1 point); 20 or more breaths above normal, experiencing retractions, 40 percent or higher FiO2, or 6 or more liters per minute (2 points); 5 breaths below normal with retractions and/or grunting, 50 percent or higher FiO2, or 8 or more liters per minute (3 points).

Page 318
Author/Source/Title Data Extracted Extra points: Nurses add 2 points to the score if the patient requires a nebulizer every 15 minutes, or if the patient is vomiting persistently after surgery. "Action algorithm": After nurses calculate the score they use the "action algorithm" to determine the need for further assessment and/or immediate intervention. The algorithm specifies minimum required actions. Based on their clinical judgment, bedside registered nurses (RNs) can contact senior clinicians and call for a rapid response team at any time regardless of the score. A simplified version of the minimum actions specified by the algorithm follows: Score of 0 to 2: No additional intervention required. Score of 3: A senior RN assesses the patient. Score of 4: A bedside RN notifies the pediatric resident of the patient's score. Score of 5: Pediatric resident is notified and must come to the bedside with senior nurse for assessment of the patient. Score of 6: Pediatric resident and senior resident are notified and must come to the bedside with the senior nurse and bedside nurse for assessment of the patient. Score of 7 or higher: The bedside RN activates the hospital's medical emergency team. Treatment and transfer decisions: Decisions about treatments or other interventions, including whether to transfer the patient to the pediatric ICU, are made by the appropriate clinicians based on the score/action algorithm and any further assessments conducted. Prominent display of data to unit clinicians: A highly visible board shows the last 24 hours of PEWS data, giving clinicians the ability to rapidly assess the status of patients on the unit. Public posting of days since last code: A sign that reads "Today is day __ since the last code" is prominently displayed at the entrance to the unit, where staff and families can easily see it. The sign serves as a reminder and motivator to staff to always record the score and apply the algorithm. RESULTS PEWS as an effective predictor of risk: A 1-year analysis of PEWS data found that the tool effectively predicted which patients were likely to deteriorate, with a low rate of false positives and false negatives. Evaluating 40,000 scores for 3,000 patients, the hospital found that only 0.23 percent of children who scored between 0 and 2 required transfer to the pediatric ICU, compared with 80% of children scoring 9 or above. Each 1-point increase in score resulted in a doubling of the likelihood of transfer. Fewer codes: The number of codes occurring on the unit decreased from five in the second half of 2005 to one in 2006, one in 2007, and zero in 2008 (as of October). At one point, the unit went 504 consecutive days without a code. Lower mortality and LOS in pediatric ICU: The mortality of patients transferred to the pediatric ICU decreased from 11% in the year before implementation to 0 percent in the year after implementation. LOS in the pediatric ICU decreased by 1 day over the same time period. Better staff communication and teamwork: Staff report that the scoring system and action algorithm are easy to use, and that using them has improved communication and teamwork and created a sense of empowerment among nurses. Nurses report that using this type of universal measure reduces miscommunication about patients' conditions and encourages earlier collaboration by the care team, permitting more timely interventions. Nurses also feel empowered to make independent clinical decisions based on the actions outlined in the algorithm. Key steps in the planning and development process included the following: Initial research: In late 2005, the hospital's clinical systems improvement team
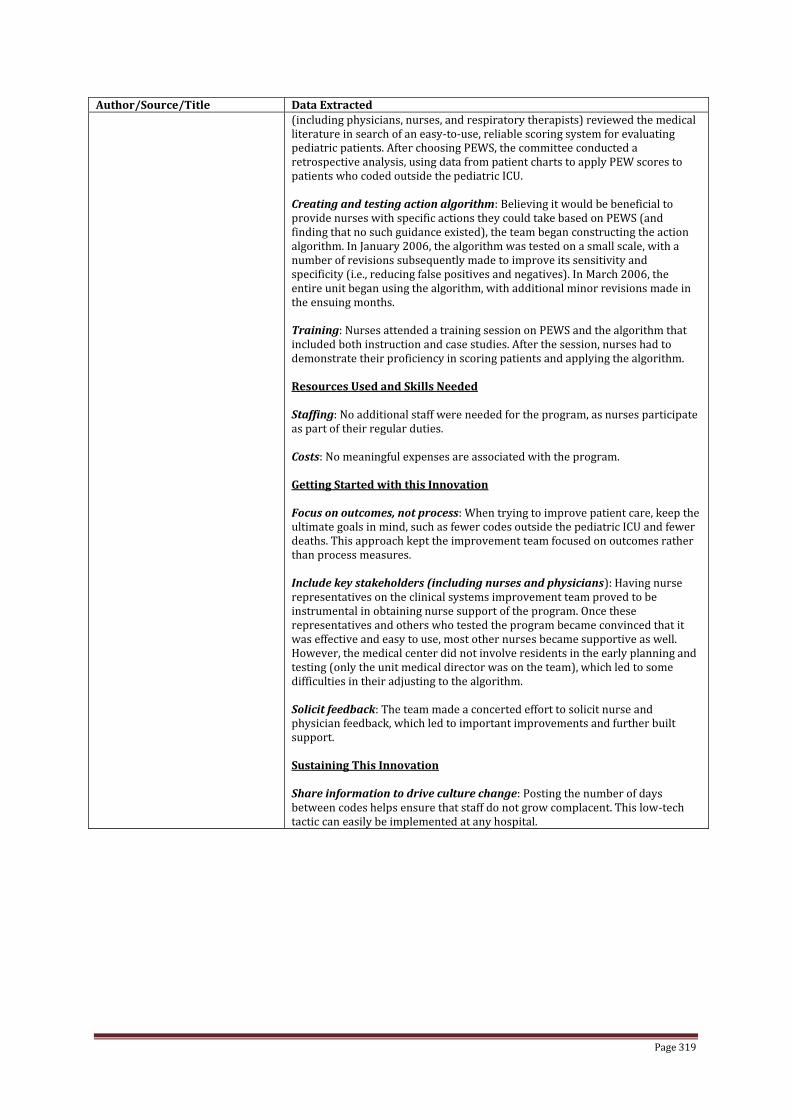
Page 319
Author/Source/Title Data Extracted (including physicians, nurses, and respiratory therapists) reviewed the medical literature in search of an easy-to-use, reliable scoring system for evaluating pediatric patients. After choosing PEWS, the committee conducted a retrospective analysis, using data from patient charts to apply PEW scores to patients who coded outside the pediatric ICU. Creating and testing action algorithm: Believing it would be beneficial to provide nurses with specific actions they could take based on PEWS (and finding that no such guidance existed), the team began constructing the action algorithm. In January 2006, the algorithm was tested on a small scale, with a number of revisions subsequently made to improve its sensitivity and specificity (i.e., reducing false positives and negatives). In March 2006, the entire unit began using the algorithm, with additional minor revisions made in the ensuing months. Training: Nurses attended a training session on PEWS and the algorithm that included both instruction and case studies. After the session, nurses had to demonstrate their proficiency in scoring patients and applying the algorithm. Resources Used and Skills Needed Staffing: No additional staff were needed for the program, as nurses participate as part of their regular duties. Costs: No meaningful expenses are associated with the program. Getting Started with this Innovation Focus on outcomes, not process: When trying to improve patient care, keep the ultimate goals in mind, such as fewer codes outside the pediatric ICU and fewer deaths. This approach kept the improvement team focused on outcomes rather than process measures. Include key stakeholders (including nurses and physicians): Having nurse representatives on the clinical systems improvement team proved to be instrumental in obtaining nurse support of the program. Once these representatives and others who tested the program became convinced that it was effective and easy to use, most other nurses became supportive as well. However, the medical center did not involve residents in the early planning and testing (only the unit medical director was on the team), which led to some difficulties in their adjusting to the algorithm. Solicit feedback: The team made a concerted effort to solicit nurse and physician feedback, which led to important improvements and further built support. Sustaining This Innovation Share information to drive culture change: Posting the number of days between codes helps ensure that staff do not grow complacent. This low-tech tactic can easily be implemented at any hospital.

Page 320
APPENDIX 33
Table on screening and key comments extracted from discussion papers, commentaries and conference papers retrieved through electronic databases
CINAHL (n=10)
Author/Title Content Comment Chapman, S (2009) Detecting and treating clinical deterioration in hospitalised children at an early stage
1 page summary of Parshuram CS et al (2009) Development and initial validation of the Bedside Paediatric Early Warning System score. Critical Care. 13, 4, R135.
Comden, L .,Sorenson, J.,Murchie, W (2012) Hot Topics: A Pediatric Rapid Response Team Gives Support to Acute Care Nurses and Decreases the Number ICU Admissions [sic]
Half page commentary mentioning identification of educational needs amongst staff nurses working on surgical floor following RRT implementation.
Mention of module developed regarding recognition of septic/febrile child with cardiac condition
Dryden-Palmer, K, Singh, S, Kalman, L, Caiazzo, K. Parshuram, C. (2010) The Power of International Partnership: The Successful Introduction of the Bedside Pediatric Early Warning System
Conference abstract about implementing a PEWS and the importance of support and education
Mention of staff education workshops and case studies
Greenhouse, PK, Kuzminsky, B, Martin, SM, Merryman, T. (2006) Calling a Condition H(elp)
Short paper describing a case study and subsequent implementation of a family initiated EWS
Condition A = arrest Condition C = critical patient Same core team arrives to both. Condition H = family initiated concern (different team)
Haines, C. (2006) Reply to letter to the Editor
Intensive and Critical Care Nursing (2006) 22, 317
Joudrie, K, Gallant, J Bales, E, and Donnelly, C. (2014) Rapid Response Team: Initial Phases and Implementation within a Small Urban Pediatric Health Centre
Abstract: The CACCN Dynamics of Critical Care Conference 2014
Presentation about how an RRT was implemented (used a Getting Started Kit: Rapid Response Teams How-to Guide)
McCabe, A, Duncan, H. (2008) National Survey of Observation and Monitoring Practices of Children in Hospital
An interview study of representatives of hospitals in the UK which had greater than 500 PIC admissions regarding observation and monitoring
Diversity of protocols regarding the observation and monitoring of sick children
Rushforth (2006) Using a Paediatric Early Warning (PEW) Tool
1 page summary of Haines C, Perrott M, Weir P (2006) Promoting care for acutely ill children- development and evaluation of a Paediatric Early Warning Tool. Intensive and CriticalCare Nursing. 22, 2, 73-81.
Tibballs, J, K, Kinney S. (2006) Letter to the Editor
Intensive and Critical Care Nursing (2006) 22, 315—316 Disputing the claim by Haines et al. (2006) regarding ‘specificity’ and ‘sensitivity’ of a PEWS
Waller, D. (2008) Could Pediatric Early Warning
Abstract: The CACCN Dynamics of Critical Care
Presentation about how PEWS could aid nurse assessment of patients

Page 321
Scores (PEWS) Help Nurses' Assessment Acuity? An Evaluation of Assessment Practice for Children who become Critically Ill
Conference 2008
EMBASE (n=28) Ahmed, M, Sobithadevi,D, Lall, R, Ghose, A, Boswell, S, Reynolds, T. (2005) Burton Paediatric Early Warning Score
Conference Abstract number 1483 (Archives of Disease in Childhood)
Retrospective analysis of charts relating to children transferred to PICU. BPEWS found to be effective.
Aramburo, A, Reel, B, Halverson-Steele, B, Ramnarayan, P. (2011) Validation of a Paediatric Early Warning Score at Referral of Children to Paediatric Intensive Care From District General Hospitals
Abstract of Oral Presentation: 22nd Annual Congress of the European Society of Paediatric and Neonatal Intensive Care
Data from referrals to Children’s Acute Transport Service (CATS). The Toronto Bedside PEWS retrospectively calculated on the 153 cases study. The PEWS performed poorly – perhaps due to nature of children referred to CATS for transfer.
Banque, MN, Obra, DL. (2011) Correlation of the Pediatric Early Warning Score (PEWS) and Clinical Deterioration Among Children Admitted in a Private Teritary Hospital From May 1 2009-August 31 2009: A Prospective Study
Poster presentation abstract. Prospective descriptive study design. The study was done in a private tertiary hospital in Cebu City. A total of 2,036 patients were included in the study. Upon admission at the emergency department (ED), patients were given a PEW score by the admitting pediatric resident. Clinical deterioration used the following outcome measures: PICU (Pediatric Intensive care Unit)/ ICU (Intensive Care Unit) set-up admission and mortality. For qualitative data, proportions/percentages were computed. For quantitative data, means and standard deviation were used. To determine the correlation between the PEW scores and clinical deterioration, Chi-square test of association was done at α = 0.05 (5%). An interrater reliability analysis using the intraclass correlation coefficient was performed to determine consistency among PEWS raters.
There is a statistically significant correlation between PEWS and clinical deterioration. PEWS of >4 is correlated with PICU/ICU set-up admission and mortality.
Ceely, B. (2013) Keeping Your Head Above Water: Swimming Between the Flags
Powerpoint presentation Patient Safety Congress
Overview of the implementation of a track and trigger system. Copies of EWS and escalation protocol included. Also parent/caregiver initiated. Possibly useful link to ‘standard 9’ Australian guidelines
Duncan, H. (2007) The Paediatric Early Warning Score
British Journal of Paediatric Nursing article.
This paper provides an overview of the development of PEWS and track and trigger systems. Historical information about the history of the PEWS and also a table about the age profiling of some PEWS parameters. Some mention of cost (i.e. very little data about figures made)
Flannigan, C, Hogan, M. Abstract of Poster Overview of quality improvement initiative

Page 322
Neonatal Early Warning Score Presentation: 22nd Annual Congress of the European Society of Paediatric and Neonatal Intensive Care
in Craigavon hospital where a Neonatal Early Warning Score (NEWS) was implemented. Copy of NEWS available with abstract.
Frost, P, Wise, M. Cardiorespiratory Arrests and Rapid Response Teams in Pediatrics.
Letter to the Editor of JAMA commenting on Sharek PJ, Parast LM, Leong K, et al. Effect of a rapid response team on hospital- wide mortality and code rates outside the ICU in a children’s hospital. JAMA. 2007; 298(19):2267-2274.
Mentioning problem with ward staff being unable to provide basic respiratory support. Highlighting “an inverse relationship between the success of an RRT and the resuscitation capabilities of the wards in that hospital” (p 1424).
Fuijkschot, J, Vernhout, B, Lemson, J, Draaisma, JM, Loeffen, JL. (2013) Introduction and Validation of the Radboud Paediatric Early Warning Score: First Results and Implications of Usage in the Netherlands.
Poster presentation :24th Annual Meeting of the European Society of Paediatric and Neonatal Intensive Care
Radboud PEWS was constructed from international Literature. Brief overview of how it is received in practice by staff.
Gawronski, O, Bertaina, A, Broccati, F, Cecchetti, C, Ciaralli, I, Ciscato, C, Cuttini, M, Dall’Oglio, I, Di Ciommo, V, Tiozzo, E. (2013) Bedside PEWS in an Italian Pediatric Bone Marrow Transplant Unit: Preliminary Results of a Longitudinal Retrospective Chart Review
Poster presentation :24th Annual Meeting of the European Society of Paediatric and Neonatal Intensive Care
Case control study (11 cases and 10 controls). Further research needed.
Holme, H, Bhatt, R, Koumettou, M, Griffin, M, Winkworth, LC. (2013) Retrospective Evaluation of a New Neonatal Trigger Score
Conference Abstract number P08 (Archives of Disease in Childhood)
Neonatal Trigger Score (NTS) designed using consensus. NTS compared with PEWS scores. Scores calculated for 485 neonates. The NTS score area under the receiver operating characteristic (ROC) curve was 0.924 with a score of 2 or more predicting need for admission to NICU with 77% sensitivity and 97% specificity. Neonates scoring 2 or more had increased odds of needing intensive care (odds ratio [OR] 48.7, 95% confidence interval [CI] 27.5–86.3), intravenous flu-ids (OR 48.1, 95% CI 23.9–96.9) and continuous positive airway pressure (OR 29.5, 95% CI 6.9–125.8). NTS out-performed PEWS, with significantly better sensitivity, particularly in neonates who deteriorated within the first 12 hours after birth (p < 0.001) or in neonates with sepsis or respiratory symptoms (p < 0.001).
Joshi, V, Barber, R, Yates, R. (2011) ManChEWS: Royal Manchester Children's Hospital early warning score
Abstract: Report on Audit Crit Care. 2011; 15(Suppl 1): P507.
ManChEWS not being used correctly by staff on wards. For pts with underlying disease ManChEWS over triggers.
Kolovos, N, Hartman, ME, Doerhoff, R, Reese, C, Ghosh, S, Doctor, A. (2013) Reduction in Morbidity and Mortality After Implementation of a Rapid Response Team At a Children's Hospital
Abstract of Oral Presentation Pre-Post RRT implementation team study using mortality
Implementation of a Rapid Response Team at St. Louis Children’s Hospital resulted in statistically significant reductions in hospital-wide mortality, ICU length of stay, and lower severity of illness at the time of ICU admission.
Lloyd-Hughes, R, McCabe, A, Duncan, H. (2011) Paediatric early warning system chart and response audit Pediatric Critical Care Medicine, Vol.
Abstract of study where 58 inpatient charts were examined regarding completion of PEWS
Abstract stated that findings demonstrated good practice in the use of age appropriate charts and documentation overall. PEWS threshold of 9 not always triggering a response.

Page 323
12, No. 3 SUPPL. 1. (2011), A112 McLellan, MC, Gauvreau, K. Connor, JA. (2011) Validation of an Early Warning Scoring Tool for the Identification of Pediatric Cardiac Patients at risk for Cardiopulmonary Arrest.
Conference abstract E481 American College of Cardiology Volume 57, Issue 14
Comparison of CHEWS with Brighton PEWs in cardiac unit. Study found higher discrimination with CHEWS than PEWS.
McLellan, MC, Gauvreau, K, Connor, J.A. (2014) Validation of the Children’s Hospital Early Warning Scoring System for Identifying Hospitalised Children at Risk for Arrest or ICU transfer
Conference Abstract: 7th World Congress on Pediatric Critical Care
Validation of Children’s Hospital Early Warning Score (CHEWS). Retrospective chart review and comparison of CHEWS with Brighton PEWS. Study found higher discrimination with CHEWS than PEWS
Monaghan, A. (2009) The Brighton Paediatric Early Warning Score
Powerpoint presentation Brighton and Sussex University Hospitals
Presentation illustrating the origin of the Brighton PEWS (BPEWS)
Norville, R, Kennedy-Nasser, A, Wills-Bagnato, P, Staton, S. Improvement in Early Recognition of Deteriorating Pediatric Bone Marrow Transplant Patients
Conference abstract 116 Biol. Bone Marrow Transplant (BMT)
Quality improvement initiative – implementation of the Paediatric Advance Warning Scoring System. Quality improvement initiative included: developing a BMT specific PAWS algo-rithm was developed; and an educational offering piloted. The educational offering consisted of six case scenarios reflective of the BMT patient population. The second PDSA cycle included finalizing and initiating training of BMT staff, launching the program and monthly monitoring of compliance with the scoring tool and algorithm.
Raymond, TT, Bonafide, CP, Praestgaard, A, Nadkarni, VM, Berg, RA, Parshuram, CS, Hunt, EA. (2013) Pediatric Medical Emergency Team Response and Outcomes: A Report of 4,181 Events From the AHA Get With the Guidelines®-Resuscitation Registry
Conference Abstract 188 Circulation
Descriptive study of patient events requiring MET intervention (n-4181) MET events occurred in general inpatient wards for objective indications, included assisted ventilation or CPR in 6.4%, and were associated with 8% hospital mortality. After treatment in 87% of events, 39% remained on inpatient wards, suggesting MET associated treatments may have stabilized or improved the condition of children judged to be clinically deteriorating by ward staff.
Roueché, A, Runnacles, J. (2014) Improving Care for the Deteriorating Child.
Discussion paper Arch Dis Child Educ Pract Ed 2014; 99: 61–66.
Highlighting importance of quality improvement regarding deteriorating children.
Schroeder, J, Madsen, J, Bjerke, AT, Solevåg, AL, Nakstad, B. (2012) Systematic Method to Improve Management of Critically Ill Children
Conference Abstract number 1881 (Archives of Disease in Childhood)
ALERT/ABCDE/ISBAR tools used to develop interactive educational platform. Brighton PEWS implemented Half an hour alternate weeks training implemented.
Sellers C, Sefton G, Tume L, Horan M, Wright D. (2011) Paediatric Ward Nurses Views of Using a Paediatric Early Warning Tool.
Powerpoint presentation Alder Hey Children’s NHS
Survey of nursing staff (n=121) Nurses happy with PEW but felt medical team didn’t take it seriously PEW more useful for inexperienced/untrained staff
Sefton, G, Tume, L, Arrowsmith, P, Bunn, J, Horan, M. (2013) Repsond Course: Development and Evaluation of a Multi-Professional Course Training Hospital Staff of Recognise and Respond to Deteriorating Children
Invited Speaker Abstract 24th Annual Meeting of the European Society of Paediatric and Neonatal Intensive Care
Overview of developing a 1 day RESPOND multiprofessional course (Recognising Signs of Paedi-atric hOspital iNpatients Deterioration) was developed. RESPOND uses case based scenarios and video footage to develop critical thinking around potential for deterioration, communication strategies and targeting response to the patient.
Sefton, G, McEnaney, G, Tume, L, Abstract of Poster Positive point prevalence study of

Page 324
Horan, M. (2011) Is Respiratory Rate a Good Predictor of Deterioration in Paediatric Patients?
Presentation: 22nd Annual Congress of the European Society of Paediatric and Neonatal Intensive Care
inpatients (n=340) over a 9 day period in 2011 Findings: tachypnoea combined with tachycardia, desaturation or increased effort of breathing most useful predictors.
Sefton, G, Tume, L, Horan, M. (2011) Point Prevalence Study of Patients Triggering a Modified Bristol Paediatric Early Warning Tool & The Incidence of Significant Adverse Events
Abstract of Oral Presentation: 22nd Annual Congress of the European Society of Paediatric and Neonatal Intensive Care
Comparative study of summer (179) and winter (340) patient data. There are seasonal variations in patient populations triggering the PEW tool. A single parameter trigger mechanism for PEW is too sensitive.
Sefton G, Tume L, Horan M, Holt P, Ritson P, L McArthur, Sellers C, Scally A , Marsh D, Rathi S. (2011) How effectively does a modified Bristol Paediatric Early Warning tool identify children at risk of deterioration?
Powerpoint presentation Alder Hey Children’s NHS
Review of observations (1513 sets of observations were reviewed in 179 patients. Data from 167 ward patients and 12 HDU patients were analysed separately). PEW parameter range too sensitive. Recognistion and activation of the PEW system by ward nurses was poor.
Sharek, P, Roth, SJ. (2007) Reply to Frost, P, Wise, M. Cardiorespiratory Arrests and Rapid Response Teams in Pediatrics letter to editor about Sharek PJ, Parast LM, Leong K, et al. Effect of a rapid response team on hospital- wide mortality and code rates outside the ICU in a children’s hospital.JAMA. 2007; 298(19):2267-2274.
Due to rare nature of cardiorespiratory events. Even with training – there is a rare opportunity to practice and training everyone equally is “challenging, costly, and likely to be unsuccessful given standard educational approaches”. Ref to this statement: Hunt EA, Walker AR, Shaffner DH, Miller MR, Pronovost PJ. Simulation of in- hospital pediatric emergencies and cardiopulmonary arrests: highlighting portance of the first five minutes. Pediatrics. 2008;121(1):e34-e43.
Szadkowski, A, Mahmood, N, Marinello, M, Munoz, J. (2013) Early Identification of Critically Ill Pediatric Patients At An Academic Medical Center
Conference Abstract: American Academy of Paediatrics Conference
Every PEWS score from every pediatric patient admitted from November 1, 2012 - January 31, 2013 was obtained. 50,000 PEWS were recorded at VCU between November 1, 2012 and January 31, 2013. There were 166 events of which 50% of the time an MD, RT, or PICU nurse was called to the bedside. 16% of cases required a transfer to a higher level of care, while an additional 52% required respiratory support. 14% required a critical intervention. Implementation of PEWS improved situational awareness of higher risk pediatric patients.
Zuckerman, SL, Sedillo, DJ, Tamayo, J, Koenig, J. (2011) Implementation and Benefit of the Pediatric Emergency Warning Score in a Community Hospital System
Conference Abstract 108 Circulation.2011; 124: A108
PEWS implementation across one community hospital in all areas. Found to be useful. Nursing staff felt PEWS improved communication between nurse and medical team
MEDLINE (1) Guise, JM, Lowe, NK. (2006) Do you Speak SBAR?
Editorial Journal of Obstetric, Gynecologic, & Neonatal Nursing
Explanation of SBAR mnemonic
PUBMED (11) Adshead, N, Thomson, R. (2009) Use of a paediatric early warning system in emergency departments
Short paper describing how PEWS was piloted
Fraser, DD, Singh, RN, Frewen, T. (unavailable)
Commentary on Duncan et al paper: The PEWS score: Potential calling criteria for critical care response teams in

Page 325
children’s hospitals (Duncan et al unavailable in document)
Henderson, S. (2012) A paediatric early warning scoring system for a remote rural area
Overview of implementing EWS for Scottish Rural Area
Developed PEWS and escalation protocol for 4 Age Groups: 0-11 months, 1-4 years, 5-11 years, and 12-16 years. Inclusion of Wong Baker Faces pain scale, Sedation and Nausea score, Height, Weight & Modified GCS. PEWS sample included in article
McCabe, A, Duncan, H, Heward, Y. (2009) Paediatric early warning systems: where do we go from here?
Position paper regarding EWS development
Note ‘MERIT’ Trial (adults)– RCT of the use of METs? Hillman KM et al for the MERIT Study Investigators (2005) Introduction of the medical emergency team (MET) system: a cluster-randomised trial. The Lancet. 365, 2091–2097.
McKay, H. (2011) One page commentary about the development and use of the COMPASS training package
Note that COMPASS is also being used in facilities in New Zealand, England, Ireland, Papua New Guinea and the Middle East.
Naddy, C. (2012) The impact of paediatric early warning systems
Discussion paper about the impact of EWS systems
Nowak, JE, Brilli, RJ. (2007) Pediatric Rapid Response Teams: Is It Time?
Editorial JAMA, November 21, 2007—Vol 298, No. 19
Discusses the evidence regarding RRT/METs in pediatric hospitals Reviews 3 key studies Tibballs et al Sharek et al Brilli et al According to authors, Sharek et al have provided the most persuasive findings to date regarding the efficacy of pediatric RRTs—a mortality benefit.
Oldroyd, C, Day, A. (2011) The Use of Pediatric Early Warning Scores in the Emergency Department
Overview of what a PEWS is and its potential application in the ED
Brighton PEWS table and escalation protocol included
Oliver, A. (2010) Observations and monitoring: routine practices on the ward
Retrospective review of nursing observation recording in advance of developing an early warning score.
1,000 patients on whom 9,075 sets of observations were performed. A complete set of observations needed for the Cardiff and Vale Paediatric Early Warning System to trigger effectively were only recorded in 52.7% (95% CI 52.4-53.1) of patients. Conclusion There were variations in the frequency, type and recording of observations. This issue needs to be addressed if scoring systems are to be implemented.
Roland, D. (2012) Paediatric early warning scores: Holy Grail and Achilles’ heel
Critical analysis of EWS systems
Van den Bruel A, Haj-Hassan T, Thompson M, et al. Diagnostic value of clinical features at presentation to identify serious infection in children in developed countries: a systematic review. Lancet 2010;375:834–45. Joffe AR, Anton NR, Burkholder SC. Reduction in hospital mortality over time in a hospital without a pediatric medical emergency team: limitations of before-and-after study designs. Arch Pediatr Adolesc Med 2011;165:419–23.
Tume, L, Bullock, I. (2004) Early warning tools to identify children at risk of deterioration: a
Discussion paper reiterating the importance of EWS

Page 326
discussion
OTHER SOURCES (n=2) Pearson, G, Duncan, H (2011) Early warning systems for identifying sick children Paediatrics and Child Health 21:5, 232-233
Discussion paper /position paper providing a useful overview of the development EWS and variations in their trigger responses along with recommending multilevel approach to implementation and national standardisation
Ryan, N (2011) The Psychometric Properties of the Pediatric Early Warning Score System in the Pediatric Medical Surgical Units Society of Pediatric Nurses doi:10.1016/j.pedn.2011.01.236
Abstract of poster presentation

Page 327
APPENDIX 34
Overview of studies included in the review
Author Detect Respond Implement Educate Culture Survey Review Economic Akre x Avent x Azzopardi x Bell x Bonafide 2012 x Bonafide 2013
x
Bonafide 2014
x
Bonafide 2014 x Bradman x Brady & Goldenhar
x
Brady et al. x Breslin x Brilli x Chapman x Chan x Chen x Dean x Demmel x Duncan x Duncan & Frew x Edwards 2009 x
Edwards 2011 x Egdell x Fuijkschot x Haines x Hayes x Hanson x Haque x Hueckel x Hunt x Holme x Kotsakis x Kukreti x Lobos 2010 x Lobos 2014 x McCrory x McKay x McLellan & Connors
x
McLellan et al x Monaghan x Paciotti x Panesar x Parshuram2009 x Parshuram et al. 2011a
x
Parshuram et al. 2011b
x
Randhawa x Ray x Roberts x x
Robson x Roland 2010 x Roland et al. 2014 x

Page 328
Author Detect Respond Implement Educate Culture Survey Review Economic Sefton x Seiger x Sen x Sharek x Skaletzky x Solevag x Theilen x Tibballs et al x Tibballs & Kinney x Tucker x Tume et al. 2007 x Tume et al 2013 x Vandenberg x VanderJagt x VanVoorhis & Willis
x
Wang x Winberg x Zenker x Zhai x

Page 329
APPENDIX 35
Online survey consultation results
Demographics PEWS Guidelines Training Costs Outcomes
Royal Alexandra Children’s Hospital Brighton Senior Lecturer/ Clinical Nurse Specialist 16/07/14
A pre-existing validated PEWS 0-18 years Used in general ward areas, intensive/critical care areas, specialist areas, emergency care areas
Guidelines include standards for measuring and recording physiological observations, protocol for documenting total PEWS score, process of communicating concern about the severity/deterioration of a child’s condition, graded response strategy for abnormal physiological observations, role and responsibilities of health professionals in relation to observation, detection and response to clinical deterioration of a child. Content developed on site by clinical development team based on clinical expertise. Internal audit is an example of evidence that informed guideline development
Unsure of training available/ implemented. Yearly, Informal types of training provided. Mandatory training lecture.
unknown unsure
GOSH Nurse Consultant 17/07/14
PEWS developed by the trust based on APLS guidelines. 0-18 years. Used in general ward areas, all specialist areas (n=55).
GOSH has guidelines which include standards for measuring and recording physiological observations, protocol for documenting total PEWS score, process of communicating concern about the severity/deterioration of a child’s condition, graded response strategy for abnormal physiological observations, role and responsibilities of health professionals in relation to observation, detection and response to clinical deterioration of a child. Education and training is addressed in a separate policy on resuscitation and e-learning package. Systematic review of literature was conducted by nurse consultant and
Trained both formally (PEWS session on induction. Standardised formal teaching sessions are available for practice educators to adapt and use in their own areas) and informally (Practice educators and senior staff support teaching on PEWS at bedside). Also trained with E-learning package which has to be completely yearly as update. Trained yearly. Face to face as part of yearly update on resus/management of deteriorating child, simulation sessions incorporate PEWS scoring and
Formatting of charts by medical illustration approach £400. PEWS charts replaced old vital sign charts so no extra cost. E-learning was developed in house but approx.. 5 days of development time by band 6.No extra staff costs as staff had year update on resuscitation which now includes PEWS.
Rate of arrest has shown some improvement when assessed with SPC charts. Would likely not achieve statistical significance, but has been classed as improvement using rules of SPC charting

Page 330
Demographics PEWS Guidelines Training Costs Outcomes
has been published in ICM. Clinical expertise of nurse consultant, clinical site practitioners and ICU team. Audits conducted, but not research, although this is currently underway. Other large centres such Bristol and Nottingham and kindly shared their protocols which helped shape our own document. Evidence that informed development: Systematic review of paediatric alert criteria (Chapman, 2010). Evidence on vital sign monitoring and RCN guidelines. Evidence from NICE. Policy on acutely ill adults.
escalation, e-learning available on line and acts as top up training. Bedside teaching by practice educators.
Children’s Hospital Wales Senior Lecturer Child Health.
Does not use PEWS.
Pennine Acute Hospital. Consultant in paediatric medicine.
Uses a modified version of PEWS called POPS. 0-16 years. Used in emergency dept.
Guidelines include standards for measuring and recording physiological observations, protocol for documenting total PEWS score, process of communicating concern about the severity/deterioration of a child’s condition, graded response strategy for abnormal physiological observations, role and responsibilities of health professionals in relation to observation, detection and response to clinical deterioration of a child. Content developed on site of hospital by clinical development team based on clinical expertise. Content adopted from other hospital/ organization
Unsure if training program available. Use both formal and informal training. Every 3 years. Delivered face to face during regular training.
Unknown Unsure
Cincinnati Children’s Hospital Paediatrician,
Yes, a modified Brighton Score with some validation at
Guidelines include standards for measuring and recording physiological
Training program for PEWS. Informally delivered as part of nursing orientation.
unknown publication by Karen Tucker and colleagues; increased time

Page 331
Demographics PEWS Guidelines Training Costs Outcomes
Assistant Professor
CCHMC. 0-18 years. Used everywhere except hem-onc and cardiology (which uses a cardiac warning score). Also used on specialist is used on neurology and GI ward.
observations, protocol for documenting total PEWS score, process of communicating concern about the severity/deterioration of a child's condition, graded response strategy for abnormal physiological observations, role and responsibilities of health professionals in relation to observation, detection and response to clinical deterioration of a child. Parents can activate rapid response but this is not part of PEWS guideline. Content developed on site of hospital by clinical development team based on clinical expertise. Content informed by conduct of literature review in field of PEWS. Used Brighton score but used some evidence from CCHMC.
Taught once, face to face with preceptor.
between codes on the unit that first adopted PEWS.
Paediatric Consultant Hillingdon Hospital
Modified from Poole Hospital NHS Trust PEWS. Has a neonatal early warning score also. 0-16 years. Used in general ward areas and ED.
No guidelines Unsure. Informal and Paediatric study day for nurses/doctor's induction/student nurse induction. Yearly.
Material costs average time to see doctor improved/more observations being done
Aarhus University Hospital Denmark Clinical Nurse Specialist
A PhD project is ongoing where children are randomized to two different PEWS tools. 0-16 years. Used in general ward areas. When transferred from the PICU to the general ward the child is PEWS scored. Used in specialist paediatric oncology ward. PEWS is used in the emergency department when
Guidelines include protocol for documenting total PEWS score, process of communicating concern about the severity/deterioration of a child’s condition, graded response strategy for abnormal physiological observations, role and responsibilities of health professionals in relation to observation, detection and response to clinical deterioration of a child. Content developed on site of hospital by clinical
Training program. Formal 2 hour training with theoretical and practical training received once off. Face2face for 2 hours
unknown We don’t have the results from the PhD project at the present time.

Page 332
Demographics PEWS Guidelines Training Costs Outcomes
a child has been triaged.
development team based on clinical expertise. Content informed by conduct of literature review in field of PEWS. Also informed by ongoing research project. CHAPMAN, S., 2010. Systematic review of paediatric alert criteria for identifying hospitalised children at risk of critical deterioration. Intensive care medicine, 36(4), pp. 600-611.; DUNCAN, H., 2007. The paediatric early warning score. British Journal of Intensive Care, (Winther), pp. 133-139.; DUNCAN, H., 2006. The pediatric early warning system score: A severity of illness score to predict urgent medical need in hospitalized children. Journal of critical care, 21(3), pp. 271-278.; PARSHURAM, C., 2011. Multicentre validation of the bedside paediatric early warning system score: a severity of illness score to detect evolving critical illness in hospitalised children. Critical Care (London, England), 15(4), pp. R184.
Hillingdon Hospital Lead Neonatal Services
Used a neonatal early warning score 0-1 month old Used in ‘other’
Guidelines uploaded. Guidelines include standards for measuring and recording physiological observations, protocol for documenting total PEWS score, process of communicating concern about the severity/deterioration of a childs condition, graded response strategy for abnormal physiological observations, role and responsibilities of health professionals in relation to observation, detection
Training program available Informal Once off introduction. face to face within a half day period during in service training for midwives and neonatal teams
Material costs £100.00 to print pilot charts Staff costs
It has raised awareness a lot of babies in difficulty and has helped escalate care appropriately

Page 333
Demographics PEWS Guidelines Training Costs Outcomes
and response to clinical deterioration of a child. Content developed on site of hospital by clinical development team based on clinical expertise (An iterative programme for developing a relevant score for the newborn babies on Post Natal Ward). Content informed by research studies conducted (reviewed relevant literature). Content adopted from other hospital/ organization (Plymouth hospitals had done lots of work on NEWS).
Alder Hey Senior Nursing Research Fellow
After extensive data collection we reconfigured our previous modified PEWS and adjusted the trigger thresholds based on the Fleming SR paper 0-18 years Used on all general inpatient wards, upon discharge from PICU or HDU, on ED if a child gets admitted, all specialist areas
Guidelines include standards for measuring and recording physiological observations, protocol for documenting total PEWS score, process of communicating concern about the severity/deterioration of a child’s condition, graded response strategy for abnormal physiological observations. Content developed on site of hospital by clinical development team based on clinical expertise (Tume and Sefton). Also informed by conduct of literature review in field of PEWS (See Tume (2009) and Sefton et al (2011). Content informed by research studies and adopted from another hospital (The former NHS Innovation group which was looking at PEWS) Previous research and many audits done in our NHS trust, communication with a national interest group
Training program RESPOND a one day multi professional course based on the format of the adult ALERT course More than every three years
Material - minimal - printing Staff costs- large - large to release staff and Resus officer and others (faculty) time
Sefton et al paper shows we have
VUMC and AMC Amsterdam
no PEWS

Page 334
Demographics PEWS Guidelines Training Costs Outcomes
Manchester Matron
MANCHEWS V2 0-16 Used in all general ward areas except PICU, used in PHDU, used in intensive care areas, specialist areas, ED
Guidelines include standards for measuring and recording physiological observations, protocol for documenting total PEWS score, process of communicating concern about the severity/deterioration of a child’s condition, graded response strategy for abnormal physiological observations, role and responsibilities of health professionals in relation to observation, detection and response to clinical deterioration of a child. Policy for addressing the education and training of health professionals for observing detecting and responding to clinical deterioration of child. Content developed on site of hospital by clinical development team based on clinical expertise, literature review, research studies
training program formal – e-learning and some taught sessions yearly On-line (yearly) and some face to face sessions (induction) particularly following any amendments. All areas have link nurses to provide additional support to staff
unknown unsure
Modified PEWS manchews 2 0-16 years General ward areas, all specialist wards, emergency care areas
Guidelines include standards for measuring and recording physiological observations, protocol for documenting total PEWS score, process of communicating concern about the severity/deterioration of a childs condition, graded response strategy for abnormal physiological observations, role and responsibilities of health professionals in relation to observation, detection and response to clinical deterioration of a child. Content developed on site by clinical development team, research studies
training program available formal by induction and education team yearly Face to face and online
Material costs – Patient track Staff costs- education and implementation team
reduced admission to ICU
Pre-existing validated pews
Guidelines include standards for measuring
training program formal
material costs - 2000
No systematic data, however.

Page 335
Demographics PEWS Guidelines Training Costs Outcomes
(Parshuram CS. Crit Care. 2009) 2 months - 16 years. Used in general wards for non neonates and ED’s (Before hand-over from PER to other units)
and recording physiological observations, protocol for documenting total PEWS score, process of communicating concern about the severity/deterioration of a child’s condition, graded response strategy for abnormal physiological observations, role and responsibilities of health professionals in relation to observation, detection and response to clinical deterioration of a child. Developed on site by clinical development team (Multi-professional team from all 4 institutions in Capital Region met and developed PEWS based on Parshuram CS. Crit Care. 2009.) and literature reviews in field of PEWS (Parshuram CS. Crit Care. 2009).
Key person were trained sim. based for one day. All nurses were trained for 1 hour by two educators. The docs were given a presentation yearly face to face
staff training costs - 5000
Early warning signs in several cases were likely to be spotted earlier than before PEWS.
no PEWS
Pre-existing validated PEWS - Bedside Pews 0-16 years General ward areas, intensive and critical, paediatric specialist areas, ED children’s
Guidelines include standards for measuring and recording physiological observations, protocol for documenting total PEWS score, process of communicating concern about the severity/deterioration of a child’s condition, graded response strategy for abnormal physiological observations, role and responsibilities of health professionals in relation to observation, detection and response to clinical deterioration of a child. Parent role and responsibility in initiation of rapid response. Content informed by conduct of literature review, adopted from other hospital (Pædiatric
No No No

Page 336
Demographics PEWS Guidelines Training Costs Outcomes
area, Region Hovedstaden (Hospitals in the Copenhagen region) Parshuram,CS. et al. 2011: Bedside Pews, Paediatric Early Warning System. Multicentre validation of the bedside paediatric early warning system score: a severity of illness in score to detect evolving critical illness in hospitalised children. Critical Care, 15,R184.
Modified version of PEWS 0-16 general ward and ED’s
Guidelines include standards for measuring and recording physiological observations, protocol for documenting total PEWS score, process of communicating concern about the severity/deterioration of a child’s condition, graded response strategy for abnormal physiological observations, role and responsibilities of health professionals in relation to observation, detection and response to clinical deterioration of a child. Content developed on site by team of clinical experts, literature review, research studies
Yes Informal once off during introduction to PEWS Face to Face
Material costs No

Page 337
APPENDIX 36
Key points of note from telephone / face-to-face consultations
Expert Comments to note Paediatrician Children’s Hospital of Philadelphia USA Telephone
Main PEWS used throughout USA is the Bedside PEWS (as reported in the published literature by Duncan and Parshuram’s work). This tool has been used and validated multiple times across different settings and is currently being used in a large cluster RCT which is ongoing across Canada, US and UK (i.e. EPOCH trial). No data is available as yet. The Brighton PEWS is also used at some sites and while it is less vigorously studied it is liked for its simplicity. Another tool gaining momentum in USA is the Rottman Index (Pera health commercial product); an automatic early warning score which extracts data from individual patient records and calculates a score on an algorithm of patient physiological data; the score is presented in a graph which shows trends over time – an added advantage over the current PEWS systems. While there are no published papers in the paediatric field as yet on this many hospitals in the US are beginning to consider replacing their current PEWS systems with the Rottman Index. There may be a paediatric collaboration forming around this in the USA. In relation to staff education and PEWS implementation, some discussion took place in relation to ‘buy in’ and cultural issues. A useful strategy to consider is ward based education using real-life clinical scenarios of when the PEWS score would have helped a negative patient outcome. Alongside this ward based scenario education, a structured process to education was undertaken with online learning modules. Champion of PEWS is a concept that has also being used at local areas to promote and educate its use. One of the core challenges in PEWS systems implementation is cultural change of anyone, not just physicians, being able to activate a rapid response at any time for any reason. This initially resulted in some ‘push back’ and tension between physicians and nurses however the concept of having a ‘second set of eyes’ and empowering people to take action was reiterated. In the absence of high PEW score the rapid response call can still be activated. In relation to local clinical guidelines all PEW scores are recorded in electronic medical record (EMR) and there is a nursing standard that the score is calculated for instance every four hours and audits of EMR are conducted. In relation to cost a paper has just been published (in press in Pediatrics) on cost-benefit analysis of MET team implementation. This paper was sourced and is referred to in the economic review section. Reference was also made to situation awareness and the work of Patrick Brady at Cincinnati Children’s Hospital – look at concept of ‘huddles’ – patient maybe about to deteriorate, what resources are needed to be put in place (something has changed – let us look at this afresh). In relation to Family Activation – it is seen as a popular thing to do and CHOPS do it but families call the rapid response team rarely. A discussion took place about whether this was the best way to capture family concerns and whether systems where parents can rate their child’s illness severity over time would be more beneficial in helping to detect changes about when a child might be at risk of clinical deterioration.
Specialist Advisor at Care Quality Commission Telephone
Discussed previous systematic review and diverse variance in PEWS and their implementation etc. What PEWS has done is perhaps mapped out/made more explicit the expectations for monitoring and escalation. Multi-faceted nature of PEWS emphasised i.e. communication, escalation, culture, parent involvement etc. Education – policy on expectations and what to do; induction/orientation for new staff medics and nurses introduced to PEWS; e-learning (refresher);

Page 338
Expert Comments to note practice educators on wards for ongoing education; students in college covered in University so all new staff should be educated – simulation training Overriding of score highlighted – tool not replacement for clinical judgement COST – main costs medical component of RT; new/separate service or integrated service incorporated into current roles (dual function roles and time costs) Chart design important to consider – simple and clear Consensus on vital sign parameters/values – APLS, centile based etc. Common language is important / terminology etc. KPIs/Outcomes – Clinical; rates of CPA – measure together and separately and plot trends; also unplanned transfers to ICU Process; ward sisters audit 20 charts a month to see whether all sets of observations have PEWS (simple yes/no tick) and whether scores accurate
Paediatrician Children's Hospital for Wales Telephone
Research Study just commencing - has secured funding to conduct a large 4-year mixed method project on PEWS. Work stream one is just commencing which involves the conduct of a systematic review of which the outcome will be to propose an implementation package for PEWS systems, including the quality control and infrastructure that should be around it. This proposed package will then be implemented and evaluated in four centres in the UK (2 children’s hospitals (one with PEWS in place) and 2 district general hospitals (one with PEWS in place)). For the quantitative aspects outcomes such as cardiac arrest, unplanned admission to PICU and mortality will be evaluated. This project is examining PEWS implementation and evaluation as a ‘complex intervention’ across a number of sites; something which has been missing from the published literature to date.
Consultant in Paediatric Emergency Medicine Department of Cardiovascular Sciences, University of Leicester Telephone
A challenge is trying to implement same tool in lots of different settings; thought needs to be given to different contexts and setting and a ‘one size fits all’ approach might not be most useful to capture diverse child populations/illnesses etc. Every institution is different with different cohorts of patients. On this basis, spoke specifically about use of PEWS in paediatric emergency departments and education issues. Education on deteriorating child is important as opposed to just the ‘tool/score’. Implementation process might also be more important than the actual ‘system’; including the resources behind the implementation as it is not just about the chart but the ‘culture’. Complexity of PEWS systems emphasised. Things not to do – do not just present chart/tool to staff for them to just ‘get on with it’ Discussed having agreed interventional ‘metrics’ for measuring and defining outcomes; thereby enhancing the evidence base.
Expert Advanced Nurse Practitioner in PICU Critical Care at Alder Hey Children’s NHS Foundation Trust, UK Telephone
Spoke about electronic portable device iPOD touch being piloted (Vital Pac) at AlderHey. Spoke about RESPOND training 1 day course; free course; uses real case patient medical / nursing scenarios; ISAR Not mandatory attendance Run every 6 weeks initially; last year ran 4-times a year Need good mix of doctors and nurses PEWS mandatory – everyone gets trained on PEWS scoring and escalation – one hour session on orientation / students gets signed off competencies AlderHey used modified Bristol tool See Sefton recent published paper No RRT hospital size 200+beds; for amount time use not justifiable / not cost effective rather about escalation protocols – medical review; existing care teams and then out of hour arrangements Spoke about EPOCH study limitations – missing data; exclusion of high risk

Page 339
Expert Comments to note patients such as cardiac and oncology; not hospital wide inclusion but proportion of wards within hospitals etc. Might be a paper worth looking at published– economic impact CPA in paediatric hospitals 2-3years Birmingham Children’s Hospital
Program Manager, Early Recognition of the Deteriorating Patient Program, Canberra Hospital, ACT, Australia Telephone
Spoke about education related to COMPASS – just in process of updating the manual COMPASS training – adult, paediatric & maternity (3rd Edition May 2014); inter-professional education program designed to enhance understanding of patients deteriorating and the significance of altered observations. It also seeks to improve communication between health care professionals and enhance timely management of patients. Pre-learning – online package (teaches about PEWS and escalation) Face-to-face lecture (summarised version of online pack) Case study role plays focus on recognition of deteriorating patient and communication – ISBAR Train the trainer concept Training was multi-disciplinary at the beginning but as the programme continues it is harder to get everyone together As new staff arrive they get trained; every 12 months a 1 hour refresher – new case study (real case from staff areas of work) Before implementation of PEWS in a unit stipulated that 50% of staff had to be trained before it was used / ‘go live’ with chart Trainers – one person with specific role as trainer across 2 hospitals assisted with local staff from paediatric and maternity emergency departments; doctors usually initially trained in adult score first as not specific child hospitals Audits done monthly on charts (obs, pews and escalation); constantly getting feedback Found difficulty implementing in emergency departments in terms of using the chart but they at least have to calculate it pre admission i.e. PEWS criteria for transfer to ward (have own escalation protocol for ED) Costs– project officer for 6-month period; medical clinical lead time costs; materials - manuals
Nationwide Children’s Hospital, Columbus, Ohio, USA Clinical Associate Professor of Paediatrics & Associate Professor of Clinical Medicine and Director of the Global Health Certificate Program Face-to-face
Use modified PEWS obtained from Cincinnati Children’s Hospital based on Monaghan et al; used with all aged children and in all regular floors, but not the NICU or ICU. When patients are about to be moved to another floor, the PEWS is carried out to ensure the patients are ready and as a base-line for the floor. In the ED, if patients are admitted to a floor, PEWS is done; if they admitted to ICU, PEWS is not done. PEWS mandated along with vital signs. In 2004/5, introduced a rapid response team (RRT, or ACT in their literature). Developed and implemented PEWS in 2009. Took about 2 months to develop and it was fully implemented within 6 months. The Monaghan et al version was the main reference used. A lot of US hospitals were implementing these at the same time. Education Initially, the two doctors went to every unit and met with every nurse, either individually or in small groups (2-10 nurses). Training is now carried out by the education department. It is part of orientation for every new nurse. It is part of the training that all new residents (i.e. junior doctors) receive. Attending physicians (i.e. consultants) vary in their awareness of PEWS. The hospital has ‘roaming educators’ who check the scores and follow up on any PEWS scores that have been done incorrectly. They provide input on the spot to correct problems with the scoring. All codes are reviewed to see if RRT and PEWS were carried out appropriately. They also have a “cues of deterioration” course. This would be helpful to consider implementing with PEWS since it teaches the skills of identification of the sick child. Cost implications - Not that directly aware of. There were some resources

Page 340
Expert Comments to note required to give staff time to learn PEWS. Now, it takes only seconds to implement. Any challenges - The biggest issue is staff not scoring patients correctly. Despite all education provided this is still a problem. Also find that some vital signs are not being recorded; think this might be because some staff place too much confidence in the fact that an RRT can be called and will catch problems, so then they are less careful in how they do the PEWS score. Another challenge is that when staff know that a patient ‘always’ scores high on something, they tend to want to give a lower score because ‘they know this patient is okay.’ Have to push people to still score according to the criteria. An audit is being planned to address proper scoring issues. Determining the cut-off score on PEWS is important, and varies with different hospitals. Their cut-off is 7, which is relatively high. Most other institutions choose a score of 5, and some even a 4 to enact an RRT. A score of 7 at Children’s leads to automatic activation of RRT. One reason for this cut-off is that have ventilator and non-ventilator patients on all regular units. But it is not just ventilated patients on the floor that prompted the 7 cut off, but having other high acuity units as well. In addition, the data from studies indicated about 80% of patients with score of 9 went to ICU and they extrapolated that a score of 7 would be ~50%. If they had a lower cut-off score, many of these patients would never get out of ICU. They think the cut-off should change with hospital resources, especially staff-patient ratio. This ratio can vary by the time of the day, so this needs to be considered. Each hospital will need to decide based on available resources what is their best cut-off score. They think the PEWS system is more useful in a setting which is more hierarchical as it gives nurses a more objective reason to call for attention or action. Their PEWS score is displayed on the electronic patient record. An electronic chart of all patients in a unit displays those with PEWS scores and what they are. This is a separate column and gives a quick visual for staff handover. New staff will see right away which patients need to be checked on first. They use a colour-coded symbol, which they find in more useful than a number: green check-mark; yellow bell; orange; red stop sign. ACT is a rapid response team (RRT). This is a more sensitive way to call for action. This made a bigger impact in patient outcomes than PEWS. Anyone can call an RRT, including family members and cleaning staff. Clinicians usually call this based on more of a gut feeling and an intuitive sense that the patient is deteriorating. Parents call RRT about once per month. Many of these are because parents are unhappy about some part of their child’s care. The RRT team consists of PICU attending, cardiac ICU attending, respiratory therapist, supervisor nurse, PICU charge nurse. It is important to ensure the team will be staffed 24/7. A Code team has a lot of other professionals in it, like pharmacy, security, etc. The “watch-stander” (see article Brady et al.) is a new initiative that is being examined. It is unclear whether it brings additional benefits.